current developments and future prospects of ... -...
TRANSCRIPT
1
Current Developments and Future Prospects of Offshore Wind and Ocean
Energy
Miguel Esteban1
and David Leary2
1 Assistant Professor
Department of Civil and Environmental Engineering, Waseda University,
3-4-1 Ookubo, 4-kai, 7-shitsu, T169-8555, Tokyo, Japan
1 EMAIL: [email protected], TEL: +81 (0)3-5286-2358
2 Senior Research Fellow,
Faculty of Law, University of New South Wales
UNSW Sydney NSW 2052, Australia
2 EMAIL: [email protected], TEL: +61 (2)9385-9552 FAX: +61 (2)9385-1175
Abstract
The year 2008 saw the emergence of the first generation of commercial ocean energy devices,
with the first units being installed in the UK and Portugal. This means that there are currently
four ways of obtaining energy from sea areas, namely from wind, tides, waves and thermal
differences between deep and shallow sea water. This paper focuses on current developments in
offshore wind and ocean energy, highlighting the efforts currently underway in a variety of
countries, principally some of the projects typically less talked about such as those in the Asian-
Pacific countries. Finally, the growth potential of these industries will be assessed, using as a
basis the historical trends in the offshore wind industry and extrapolating it to compute future
growth potentials. Using this as a basis, the percentage of the world’s electricity could be
produced from ocean based devices is estimated to be around 7% by 2050, and this would
employ a significant amount of people by this time, possibly around 1 million , mostly in the
maintenance of existing installations. The paper will also evaluate the likely cost of production
per kW of ocean energy technologies using a variety of learning factors.
Keywords: ocean energy, offshore wind, growth scenarios, cost, current developments
2
1. Introduction
Much of the debate on and investment in technological solutions to climate change has so far
centred on a range of technologies such as carbon capture and storage (CCS) or geo-
sequestration, ocean fertilization, the so called new generation of nuclear technologies, and
biofuels. Most of these technologies, however, have been associated with some type of
environmental problems. It is still not completely clear if CCS is viable, or whether it can
represent a long-term solution. The environmental impacts of large-scale biofuels have also been
called into question by a number of authors (see Gasparatos et al. [1] for a critical assessment of
the tradeoffs). With regards to nuclear power, independent of its potential and any benefits that it
may have, the long-term contamination, suffering and world-wide emotional response the
Fukushima Nuclear reactor has caused makes it unlikely that democratic countries will have an
easy time building new installations of this type.
However, it is imperative that new ways of producing energy are found to satisfy the world’s
growing appetite for energy. The year 2008 saw the introduction of the first generation of
commercial ocean energy devices, with the first units being installed in the UK and Portugal
(SeaGen and the Pelamis respectively). With them there are currently three types of energy
mechanisms in sea areas from which energy can be generated in a commercial way (i.e. wind,
tides and waves). These sets of technologies are not only clean (in terms that they produce no
greenhouse gas emissions) but they also have an almost negligible visual impact, especially
compared to other renewable sources such as hydropower or onshore wind (provided of course,
that offshore turbines are located at a sufficiently long distance from the coastline, according to
Landenburg [2]).
The Ocean Energy sector has the potential to make an important contribution to the supply of
energy to countries and communities located close to the sea, though this considerable source of
renewable energy that have so far not been utilised on a significant scale [3]. The 1992 United
Nations Framework Convention on Climate Change (UNFCCC) recognises the important role
the development, application and diffusion of new technologies will play in reducing greenhouse
gas emissions. More recently the United Nations Intergovernmental Panel on Climate Change
(IPCC) in its Fourth Assessment Report has highlighted the important role that technology will
play in addressing climate change. In fact, large penetrations of various combinations of
renewable power could theoretically power entire countries, such as Portugal [4] or even Japan
[5].
The objective of the current work is to assess what could be expected from ocean-based
renewable energy technologies in the middle to long term. Generally offshore wind and ocean
energy systems are not included in the same analysis, and in the present papers the authors argue

3
that as they share the same environment and a number of common characteristics, energy
scenario projections should include both sectors together. To develop these scenarios the authors
have carried out a review of the history and potential of ocean energy installations, and have
built a database of all cutting-edge research and applications of ocean and offshore wind energy.
A general outline of the state of this sector will be presented in parts 2 and 3 of this paper. In
part 4, this information was then fed into a model based on the development of the offshore wind
industry to attempt to predict the future development of ocean energy for a variety of scenarios.
A prediction was then made of around which date ocean energy is likely to become competitive
with other forms of electricity production and the approximate size of the sector in terms of jobs.
Part 5 will then comparing the results obtained to those of other studies, and this will then be
followed by a discussion on the obstacles facing such a large development in ocean-based
renewable energy.
2. Description and Potential of Ocean Energy
Ocean Energy defines a wide range of engineering technologies that are able to obtain energy
from the ocean using a variety of conversion mechanisms. It is an emerging industry, with the
first commercial units coming online in 2008 and 2009. It is important to remember that there
are technical limits to its application, since although it has been reported that the theoretical
global potential for the various types of ocean energy is between 20,000 and 92,000 TWh/year,
compared to the world consumption of electricity of around 16,000 TWh/year, it is unlikely that
this technology by itself will be able to solve the energy needs of the planet [6]. For instance,
although there is estimated to be around 3000 GW worldwide of tidal energy, less than 3% is
located in areas suitable for power generation (World Offshore Renewable Energy Report [7]).
Wave Energy on the other hand has an estimated potential of around 1000-10,000 GW, which is
in the same order of magnitude as world electrical energy consumption. However, one advantage
of tidal currents over waves (or wind) is its predictability, as tides can be accurately predicted
weeks or even years in advance.
Some researchers such as Scruggs and Jacob [8] and Cornett [9]recently noted how the potential
for ocean energy is promising, and across Europe, the technically achievable resource has been
estimated to be at least 280 TWh per year [8]. In 2003, the U.S. Electric Power Research
Institute (EPRI) estimated the viable resource in the United States at 255 TWh per year (6% of
demand), comparable to the energy currently generated in the United States by conventional
hydropower [8]. Ocean energy can be converted into electricity in four main ways, namely the
energy present in the waves, currents, thermal or osmotic energy [6].
4
3. Current Developments in Ocean Energy
3.1.Tidal Barrages
Tidal barrages were built as early as 1966, when the plant at La Rance (France) came into
operation, and is still in operation today. China also started to build a number of barrages around
this time, as part of policies from 1958 that emphasised energy independence as a key route to
poverty alleviation [10]. One of the 4 stations built, at Shashan, stopped operating in 1984 when
the local area was connected to the national grid, due to the high cost of operating the plant [11].
Elsewhere, Canada also built a barrage at Annapolis, which began service in 1984.
More recently, there has been some renewed interest in these schemes, and in late 2004 the
Chinese Government planned once more to build a tidal power station near the mouth of the
Yalu River [10]. Also, Russia is in the process of constructing its first plant. In the UK, tidal
barrages, such as the one proposed for the River Severn, are currently being re-appraised. The
Severn Barrage is currently around half way through a Feasibility Study Consultation process,
although Owen [12] notes how opposition from the Environment Agency and other groups
appear to make it unlikely that the project will ever reach construction. The environmental
impacts of these structures have generally hindered their wide-scale application, and they have
been known to have some impacts on marine biodiversity [13]. At present the only country
which is seriously undertaking efforts to construct tidal barrages is South Korea, which is
scheduled to complete a 254MW tidal barrage at Sihwa-ho Lake. Another plant almost three
times the size is under planning for Ganghwa. The South Korean government claims that the
project will make a profit, as it puts the cost of the project at 355bn won (USD 382 million) [11].
In other countries it is not clear that these plants are economically viable, due to the massive
infrastructure investments they require and the fact that often the environmental damage
outweighs the benefits of the structure. These traditional, or “old” types of ocean energy are thus
not without their problems, though modern ocean energy technology is far more environmentally
benign [13].
3.2.Modern Ocean Energy Developments
The modern ocean energy industry is currently moving from the prototype stage to installation of
the first showcase commercial farms. The first of these have just recently come into operation,
with the Pelamis project (in Portugal) and SeaGen (in Northern Ireland) having completed
installation at the end of the summer of 2008 [14]. Many devices that use hydrokinetic
conversion systems that take advantage of the flow in tidal or river streams are currently under
5
development (over 60 different schemes are reported by Khan et al., [15]), and a number of
devices using other technologies have already completed prototype testing, such as the
WaveDragon. Also, there are currently a number of other projects and prototypes undergoing
full scale testing (for example at the European Marine Energy Centre (EMEC), which has 4 grid
connected births for wave and 5 for tidal devices, all of which are either in use or booked [16] or
awaiting for support installations to be constructed (such as the WaveHub).
However although a great deal of research and investment has been carried out in Europe, there
have also been a number of significant developments in other continents. For example in
Australia there are at least three companies involved in the research, development and pre-
commercial testing of wave energy devices. These include the Western Australian based
company Carnegie Corporation, developers of the CETO [17] wave power converter which has a
commercial scale demonstration at Freemantle. Construction of a commercial scale plant is due
to commence by 2010 with completion and connection to the grid due by 2013 [17]. Also in
Australia, Oceanlinx re-deployed in February 2009 its pilot plant device at Port Kembla on the
New South Wales coast south of Sydney [18]. This oscillating power column technology had
been under development since it was first deployed in Port Kembla in 2005, and though one of
the prototype units sank in 2010 research into the unit continues [18].
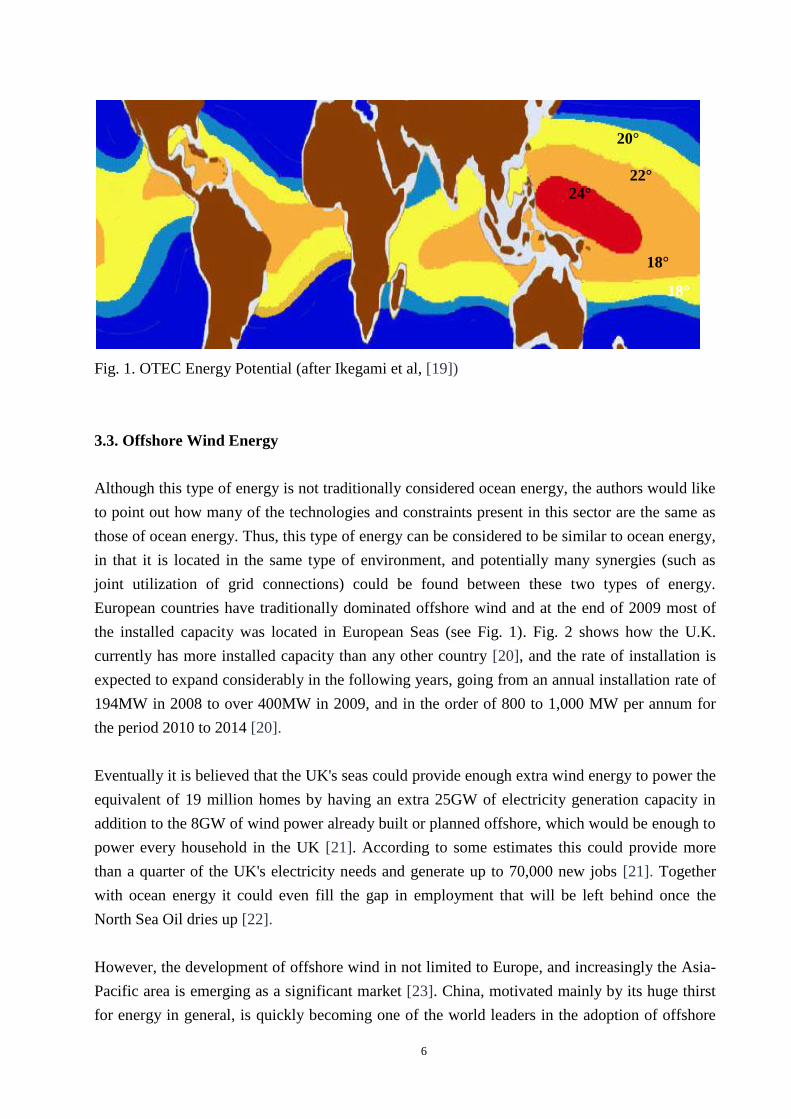
Another type of ocean energy technology that is reaching maturity is that referred to as Ocean
Thermal Energy Conversion (OTEC), which has significant potential for countries located in
tropical regions. These plants must be located in an environment where the warm surface
seawater must differ about 20°C from the cold deep water that is no more than about 1,000
meters below the surface, and the shore must be located within 25km of the ocean region where
the temperature difference occurs. This is normally found in areas between latitudes 20° North
and South of the Equator, as shown in Fig. 1 [19]. India, for example has considerable potential
for the development of OTEC energy, and some trial plants have already built in this country,
such as a 1MW OTEC and a 100t/d of fresh water desalination plant [19]. The potential resource
for another developing country, Indonesia, has been estimated to be able to produce enough
electricity for the whole of the country [19].
6
Fig. 1. OTEC Energy Potential (after Ikegami et al, [19])
3.3. Offshore Wind Energy
Although this type of energy is not traditionally considered ocean energy, the authors would like
to point out how many of the technologies and constraints present in this sector are the same as
those of ocean energy. Thus, this type of energy can be considered to be similar to ocean energy,
in that it is located in the same type of environment, and potentially many synergies (such as
joint utilization of grid connections) could be found between these two types of energy.
European countries have traditionally dominated offshore wind and at the end of 2009 most of
the installed capacity was located in European Seas (see Fig. 1). Fig. 2 shows how the U.K.
currently has more installed capacity than any other country [20], and the rate of installation is
expected to expand considerably in the following years, going from an annual installation rate of
194MW in 2008 to over 400MW in 2009, and in the order of 800 to 1,000 MW per annum for
the period 2010 to 2014 [20].
Eventually it is believed that the UK's seas could provide enough extra wind energy to power the
equivalent of 19 million homes by having an extra 25GW of electricity generation capacity in
addition to the 8GW of wind power already built or planned offshore, which would be enough to
power every household in the UK [21]. According to some estimates this could provide more
than a quarter of the UK's electricity needs and generate up to 70,000 new jobs [21]. Together
with ocean energy it could even fill the gap in employment that will be left behind once the
North Sea Oil dries up [22].
However, the development of offshore wind in not limited to Europe, and increasingly the Asia-
Pacific area is emerging as a significant market [23]. China, motivated mainly by its huge thirst
for energy in general, is quickly becoming one of the world leaders in the adoption of offshore
24°
C
18°
C
22°
C
20°
C
18°
C
7
wind energy. Offshore energy, in the case of China, has the advantage of being located close to
the population centres, in contrast with onshore energy, which is often located far from the main
cities. The offshore wind power resource has been estimated at 200GW, almost 10 times the total
(onshore) installed wind capacity at present, indicating the huge capacity that this sector would
have for generating jobs [24].
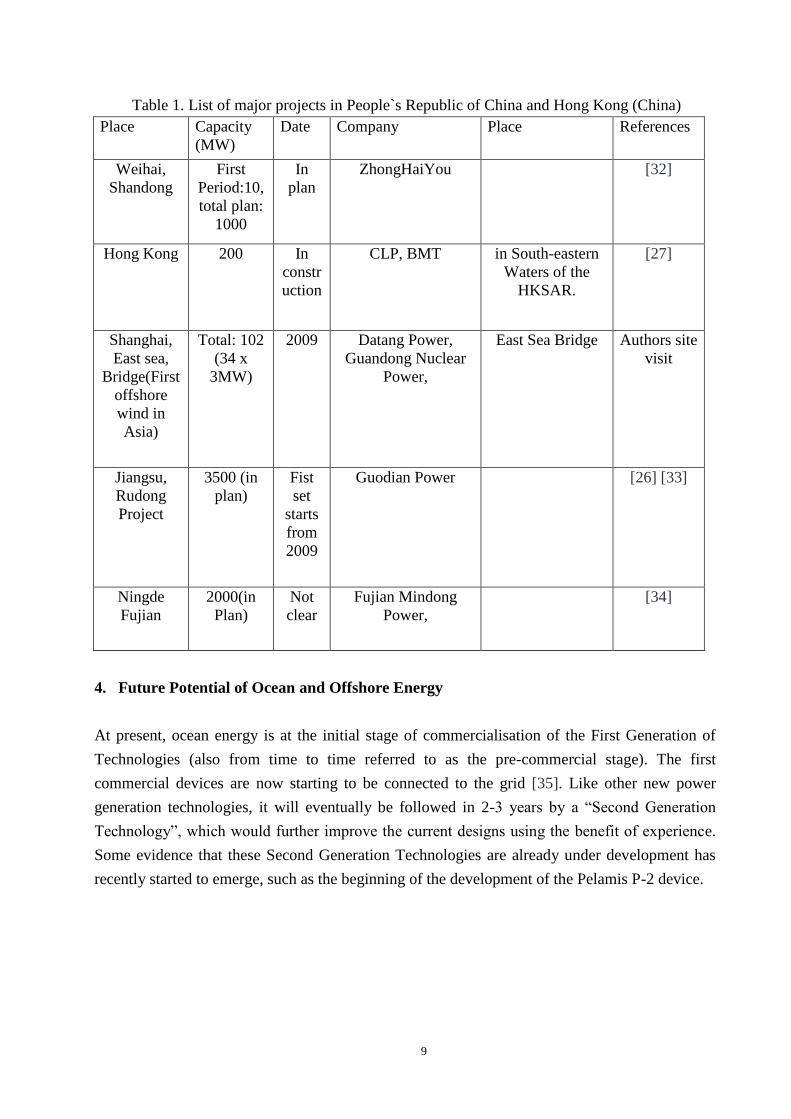
The first off-shore wind farm in the Asia-Pacific is currently located in Shanghai, composed of
34 wind-driven generators with a total installed capacity of 102 MW. A further four large scale
wind farms are also planned for the Fengxian, Nannhui and Hengsha districts of Shanghai with a
planned 1 GW of installed capacity planned for Shanghai by 2020 [25]. Plans for 1000 MW of
off-shore wind farms in Zheijiang Province and Jiangsu Province are also underway [26].
Likewise in Hong Kong CLP Power Hong Kong Limited and Wind Prospect are in the early
stages of development of a proposed 200 MW wind farm in the south eastern waters off Hong
Kong that will provide approximately 1 % of Hong Kong’s energy needs [27] and take two years
to build. A list of some major offshore wind projects in China can be found in Table 1.
Japan’s only off-shore wind farm was built in the Setana Port area on Japan’s Northern Island,
Hokkaido in 2003. This wind farm consists of two 600 KW wind turbines [28]. Close-by in
South Korea there are plans to develop 500 MW of land and off-shore wind farms in Baekun
Mountain near Wonju City [29].
In North America while both the USA and Canada have experienced rapid growth in the wind
power sector, that growth has largely been confined to developments on land. Most of the
attention on off-shore wind energy and ocean energy has been on the east coast of the United
States and Canada. The only significant plan for construction of an off-shore wind farm on the
Pacific coast of North America is the 110 turbine NaiKun off-shore wind farm, off the northwest
coast of British Columbia in Canada [30]. The project received an Environmental Approval in
late 2009 and is currently expecting a federal environmental decision, with construction expected
to begin in 2010/2011.
Particularly interesting recent developments in offshore wind power include research into
floating wind turbines. In this respect the first full scale floating turbine is currently under testing
off the coast of Norway [31]. However, research into these units is also popular in other
countries with a deep seabed, such as Japan, which tested a 1/10th
scale prototype that might be
followed eventually by a full scale one.

8
Fig. 2. Installed offshore wind in 2009 in Europe (in MW) [23]
30
639
24 25
246.8
42 2
163
882
0
100
200
300
400
500
600
700
800
900
1,000
9
Table 1. List of major projects in People`s Republic of China and Hong Kong (China)
Place Capacity (MW)
Date Company Place References
Weihai,
Shandong
First
Period:10,
total plan:
1000
In
plan
ZhongHaiYou [32]
Hong Kong 200 In
constr
uction
CLP, BMT in South-eastern
Waters of the
HKSAR.
[27]
Shanghai,
East sea,
Bridge(First
offshore
wind in
Asia)
Total: 102
(34 x
3MW)
2009 Datang Power,
Guandong Nuclear
Power,
East Sea Bridge Authors site
visit
Jiangsu,
Rudong
Project
3500 (in
plan)
Fist
set
starts
from
2009
Guodian Power [26] [33]
Ningde
Fujian
2000(in
Plan)
Not
clear
Fujian Mindong
Power,
[34]
4. Future Potential of Ocean and Offshore Energy
At present, ocean energy is at the initial stage of commercialisation of the First Generation of
Technologies (also from time to time referred to as the pre-commercial stage). The first
commercial devices are now starting to be connected to the grid [35]. Like other new power
generation technologies, it will eventually be followed in 2-3 years by a “Second Generation
Technology”, which would further improve the current designs using the benefit of experience.
Some evidence that these Second Generation Technologies are already under development has
recently started to emerge, such as the beginning of the development of the Pelamis P-2 device.
10
4.1. Assumptions
Any methodology that attempts to forecast trends in future development essentially builds on a
number of assumptions outside which the model is not really valid. These assumptions should be
clearly stated from the onset, and for the present paper it is assumed that:
The state of technological development (and the level of technological challenges) faced
by early offshore wind are similar to those faced by wave/tide today. On the one hand it
could be considered that drawing such a comparison is difficult, as offshore wind relied
on proven onshore wind technology, where there was never any reason to suspect that the
fundamental technology would fail. In the case of wave and tide it is not clear which
technologies will ultimately be viable. However, many technologies have now reached
the full sized prototype stage (pre-commercial) and are connected to the grid, and the
sector has recently started to be referred as an “industry” for the first time [16]. Hence it
appears to be possible to draw a comparison with the early offshore wind turbines, where
although the principle of energy conversion was well understood, the challenges of
working in the sea made it difficult to foresee the future of the industry.
Ocean Energy and Offshore Wind will have similar development constraints. Once a
renewable energy technology is developed the major constraint on expansion then
becomes the availability of suitable locations. In the case of wind the availability of
relatively shallow sea areas close to grid connections, which are easily identified. In the
case of wave and tide (particularly tide) the actual extent of sea area with practicably
exploitable resource is not well understood, and a clear distinction needs to be made
between the theoretical, technical and practical resources. This technical resource in the
UK is likely to exceed 50 TWh/annum for wave power and around 20 TWh/annum for
tidal power [16]. Clearly a lot more research needs to be done in this area [16] but to date
there is little argument that locations do exist were Ocean Energy will be able to be
exploited.
the financial incentives and policy landscapes will be similar. There is little doubt that
the key driver for wind in the past and wave tide in the future is the existence of a policy
landscape (particularly financial incentives) that encourage development. The present
paper argues that given the current high level of interest in renewables the policy
landscape for Ocean Energy will be at least as good as for the offshore wind sector
during the past 15 years. It is possible that Ocean Energy could benefit from a more
positive environment, but this would be more difficult to analyse and would not lead to
conservative answers.
11
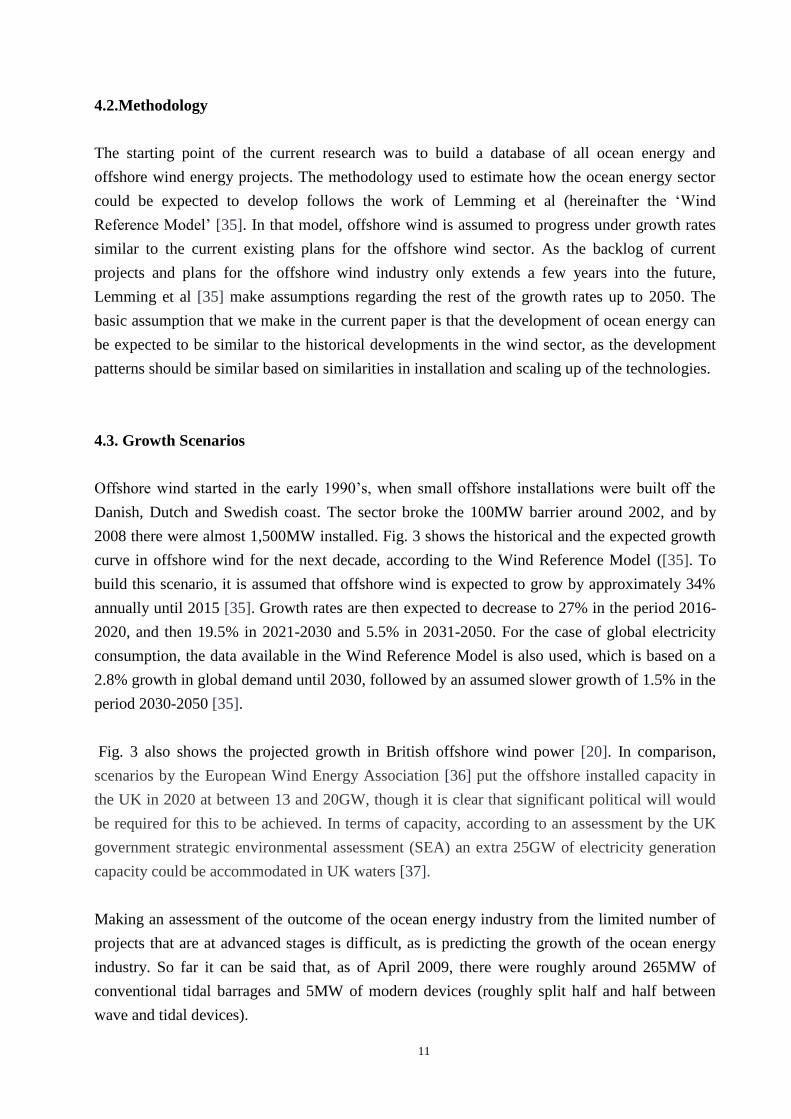
4.2.Methodology
The starting point of the current research was to build a database of all ocean energy and
offshore wind energy projects. The methodology used to estimate how the ocean energy sector
could be expected to develop follows the work of Lemming et al (hereinafter the ‘Wind
Reference Model’ [35]. In that model, offshore wind is assumed to progress under growth rates
similar to the current existing plans for the offshore wind sector. As the backlog of current
projects and plans for the offshore wind industry only extends a few years into the future,
Lemming et al [35] make assumptions regarding the rest of the growth rates up to 2050. The
basic assumption that we make in the current paper is that the development of ocean energy can
be expected to be similar to the historical developments in the wind sector, as the development
patterns should be similar based on similarities in installation and scaling up of the technologies.
4.3. Growth Scenarios
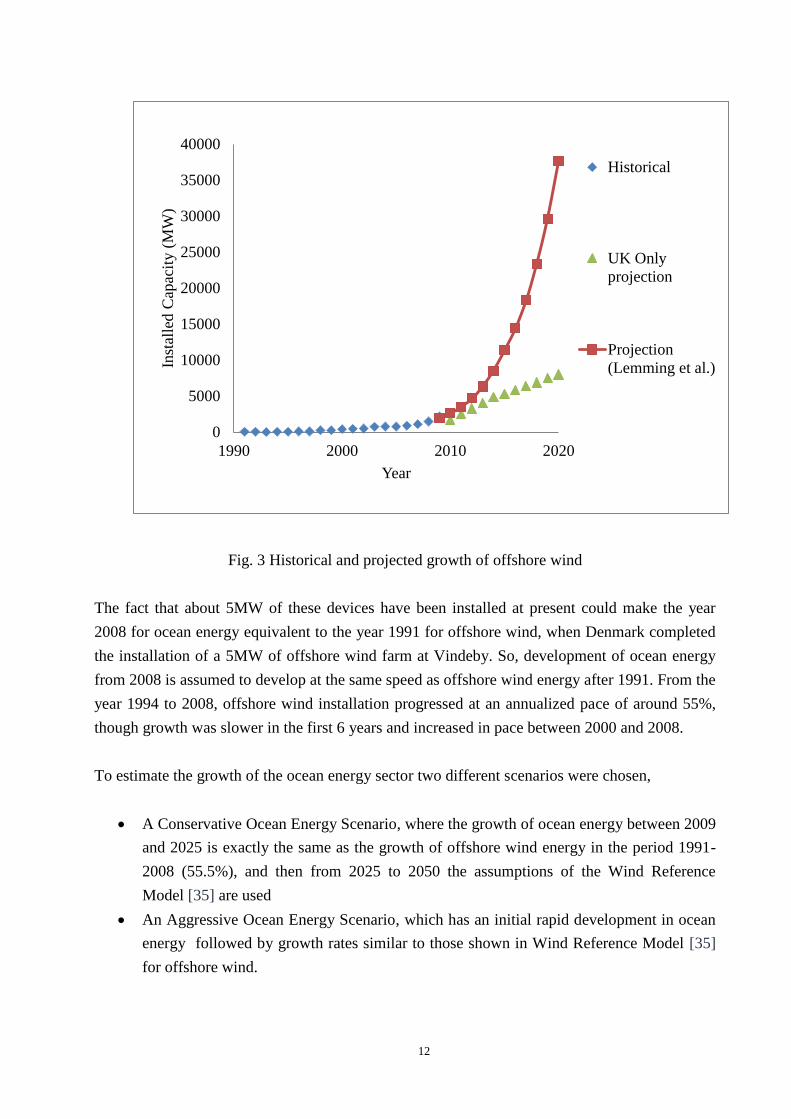
Offshore wind started in the early 1990’s, when small offshore installations were built off the
Danish, Dutch and Swedish coast. The sector broke the 100MW barrier around 2002, and by
2008 there were almost 1,500MW installed. Fig. 3 shows the historical and the expected growth
curve in offshore wind for the next decade, according to the Wind Reference Model ([35]. To
build this scenario, it is assumed that offshore wind is expected to grow by approximately 34%
annually until 2015 [35]. Growth rates are then expected to decrease to 27% in the period 2016-
2020, and then 19.5% in 2021-2030 and 5.5% in 2031-2050. For the case of global electricity
consumption, the data available in the Wind Reference Model is also used, which is based on a
2.8% growth in global demand until 2030, followed by an assumed slower growth of 1.5% in the
period 2030-2050 [35].
Fig. 3 also shows the projected growth in British offshore wind power [20]. In comparison,
scenarios by the European Wind Energy Association [36] put the offshore installed capacity in
the UK in 2020 at between 13 and 20GW, though it is clear that significant political will would
be required for this to be achieved. In terms of capacity, according to an assessment by the UK
government strategic environmental assessment (SEA) an extra 25GW of electricity generation
capacity could be accommodated in UK waters [37].
Making an assessment of the outcome of the ocean energy industry from the limited number of
projects that are at advanced stages is difficult, as is predicting the growth of the ocean energy
industry. So far it can be said that, as of April 2009, there were roughly around 265MW of
conventional tidal barrages and 5MW of modern devices (roughly split half and half between
wave and tidal devices).
12
Fig. 3 Historical and projected growth of offshore wind
The fact that about 5MW of these devices have been installed at present could make the year
2008 for ocean energy equivalent to the year 1991 for offshore wind, when Denmark completed
the installation of a 5MW of offshore wind farm at Vindeby. So, development of ocean energy
from 2008 is assumed to develop at the same speed as offshore wind energy after 1991. From the
year 1994 to 2008, offshore wind installation progressed at an annualized pace of around 55%,
though growth was slower in the first 6 years and increased in pace between 2000 and 2008.
To estimate the growth of the ocean energy sector two different scenarios were chosen,
A Conservative Ocean Energy Scenario, where the growth of ocean energy between 2009
and 2025 is exactly the same as the growth of offshore wind energy in the period 1991-
2008 (55.5%), and then from 2025 to 2050 the assumptions of the Wind Reference
Model [35] are used
An Aggressive Ocean Energy Scenario, which has an initial rapid development in ocean
energy followed by growth rates similar to those shown in Wind Reference Model [35]
for offshore wind.
0
5000
10000
15000
20000
25000
30000
35000
40000
1990 2000 2010 2020
Inst
alle
d C
apac
ity (
MW
)
Year
Historical
UK Only
projection
Projection
(Lemming et al.)
13
The various growth rates used in each of these scenarios are summarised in Table 2. To estimate
future electricity production an assumption also needs to be made about the level of the average
capacity factor of each renewable. The capacity factor is defined as the ratio of the actual output
over the maximum theoretical output during a certain period of time. The Wind Reference
Model [35] assumes a capacity factor for offshore wind of 37.5% for the whole period until
2050, as they expect the higher production of new turbines to moderate the lower availability of
good wind sites. However, for the case of tidal barrages the load factor is much lower, typically
around 23% [38]. It is claimed, however, that modern ocean energy devices are able to achieve
much higher capacity factors than tidal barrages, in the range of 40-50% for tidal flows, and also
around the figure of 40% for wave [39]. These figures however should be treated with caution,
as there is yet no definitive evidence for them. Hence the authors have used a capacity factor of
27% for ocean energy in the scenarios proposed.
4.4.Scenario Projections of Ocean Energy Growth
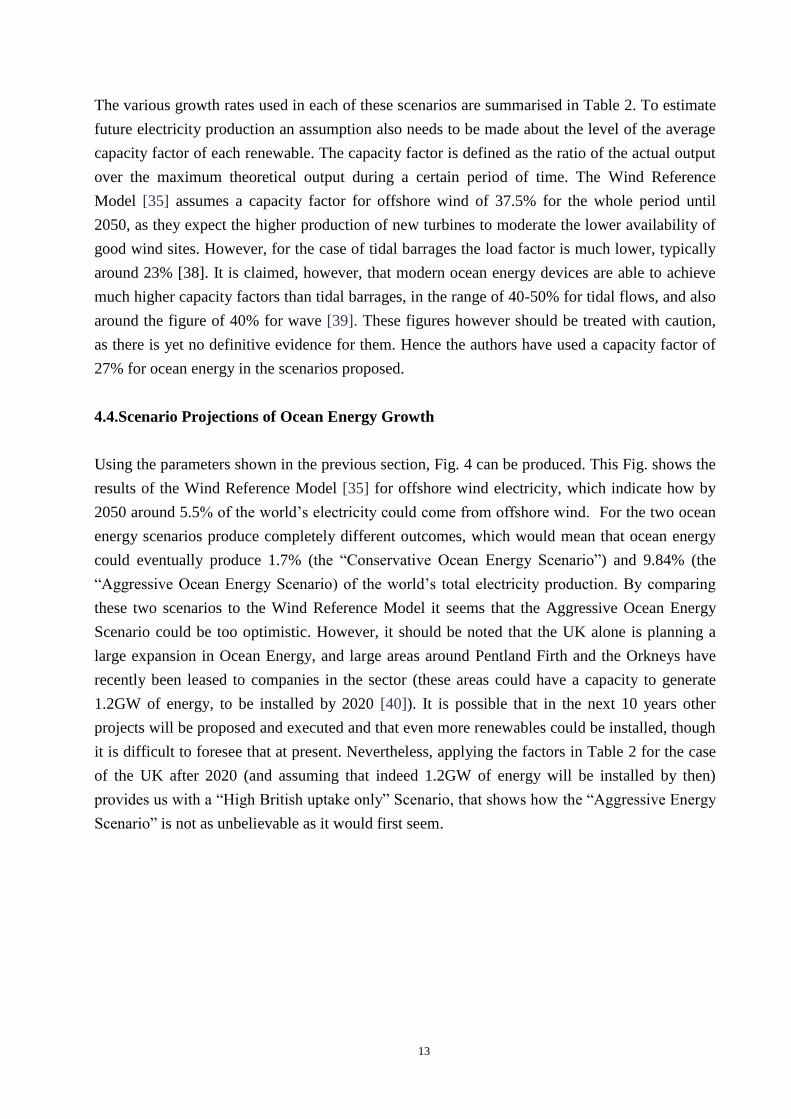
Using the parameters shown in the previous section, Fig. 4 can be produced. This Fig. shows the
results of the Wind Reference Model [35] for offshore wind electricity, which indicate how by
2050 around 5.5% of the world’s electricity could come from offshore wind. For the two ocean
energy scenarios produce completely different outcomes, which would mean that ocean energy
could eventually produce 1.7% (the “Conservative Ocean Energy Scenario”) and 9.84% (the
“Aggressive Ocean Energy Scenario) of the world’s total electricity production. By comparing
these two scenarios to the Wind Reference Model it seems that the Aggressive Ocean Energy
Scenario could be too optimistic. However, it should be noted that the UK alone is planning a
large expansion in Ocean Energy, and large areas around Pentland Firth and the Orkneys have
recently been leased to companies in the sector (these areas could have a capacity to generate
1.2GW of energy, to be installed by 2020 [40]). It is possible that in the next 10 years other
projects will be proposed and executed and that even more renewables could be installed, though
it is difficult to foresee that at present. Nevertheless, applying the factors in Table 2 for the case
of the UK after 2020 (and assuming that indeed 1.2GW of energy will be installed by then)
provides us with a “High British uptake only” Scenario, that shows how the “Aggressive Energy
Scenario” is not as unbelievable as it would first seem.
14
Fig. 4. Estimation of future ocean energy (OE) and offshore wind electricity production
Table 2. Modern Ocean Energy Growth Scenarios
Year
Expected World
electricity consumption
TWh
Yearly growth in Modern ocean energy %
Period Scenario A Scenario B
2015 21,300 2009-2024 55.5% 410MW by 2015, then
55.5%
2020 23,800 2025-2031 34.0% 34.0%
2030 29,750 2032-2041 19.5% 19.5%
2050 40,100 2042-2050 5.5% 5.5%
4.5. Projected Cost of Ocean Energy
The cost of energy from initial tidal stream farms has been estimated in the range of US$0.15-
0.55 per kWh for tidal and wave energy farms and US$0.11-0.22 per kWh for tidal streams [41].
These are expected to decrease to US$0.10-0.25 per kWh by 2020. Estimated learning factors
are believed to be 10-15% for offshore wave and 5-10% for tidal stream [41]. One of the most
concrete examples of the perceived cost of first generation of modern ocean energy units can be
found in Portugal, where the government has put in place a feed-in tariff, (a legislative price
incentive which encourages the adoption of renewable energy) currently equivalent to
approximately €0.23/kWh [42].
0
500
1000
1500
2000
2500
3000
3500
4000
2010 2020 2030 2040 2050
TW
h
Year
Offshore wind electricityproduction (Lemming etal. 2008)
Conservative OceanEnergy Scenario
Tidal Barrage electricityproduction
"High British Uptake only"Scenario
Agressive Ocean EnergyScenario
15
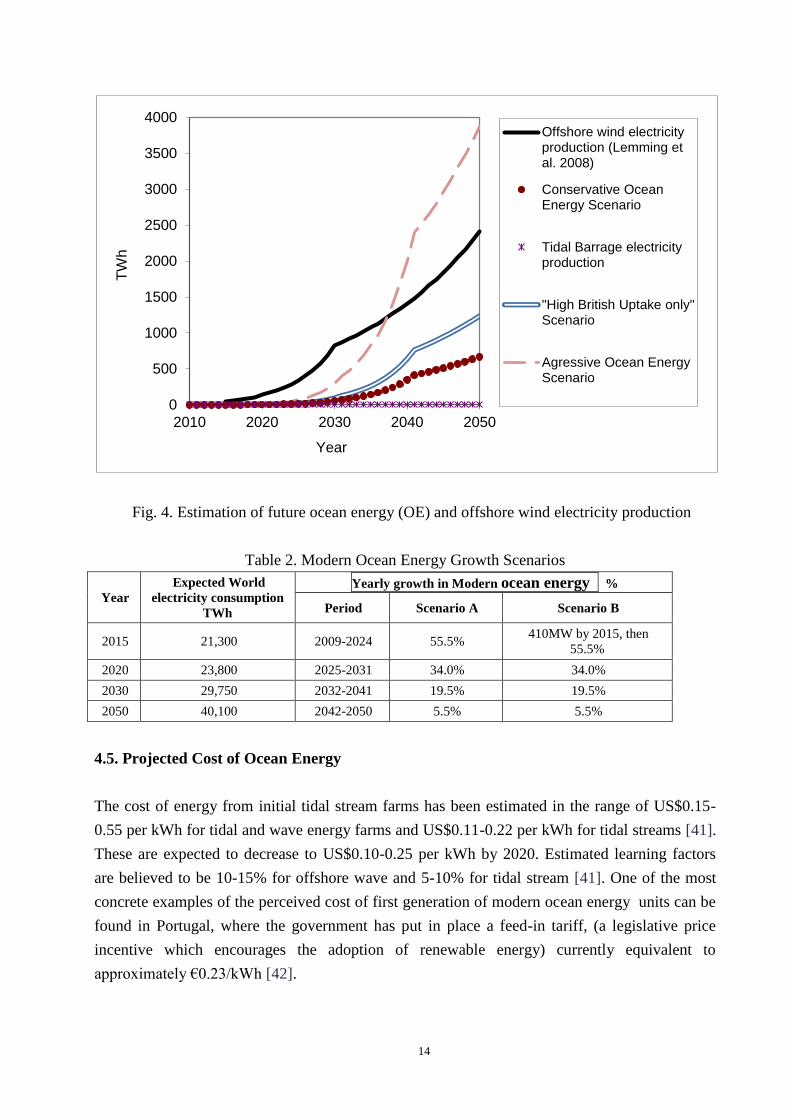
To identify long-term cost developments, learning curves have been derived for different
technologies, which identity the correlation between cumulative production volumes of a given
technology and a reduction in costs. For many technologies, the learning factor (or progress
ratio) falls in the range of between 0.75 for less mature systems to 0.95 for well-established
technologies [43]. A learning factor (L.F.) of 0.9 would signify that costs are expected to fall by
10% each time that the cumulative output for that technology doubles.
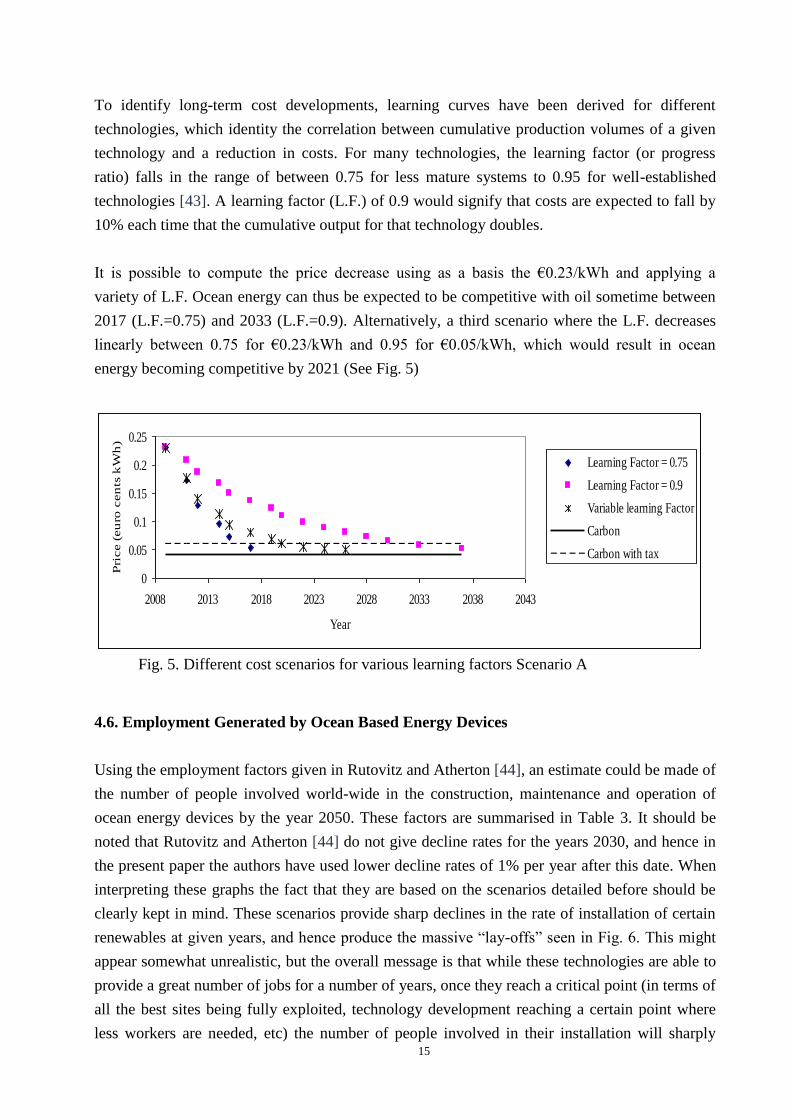
It is possible to compute the price decrease using as a basis the €0.23/kWh and applying a
variety of L.F. Ocean energy can thus be expected to be competitive with oil sometime between
2017 (L.F.=0.75) and 2033 (L.F.=0.9). Alternatively, a third scenario where the L.F. decreases
linearly between 0.75 for €0.23/kWh and 0.95 for €0.05/kWh, which would result in ocean
energy becoming competitive by 2021 (See Fig. 5)
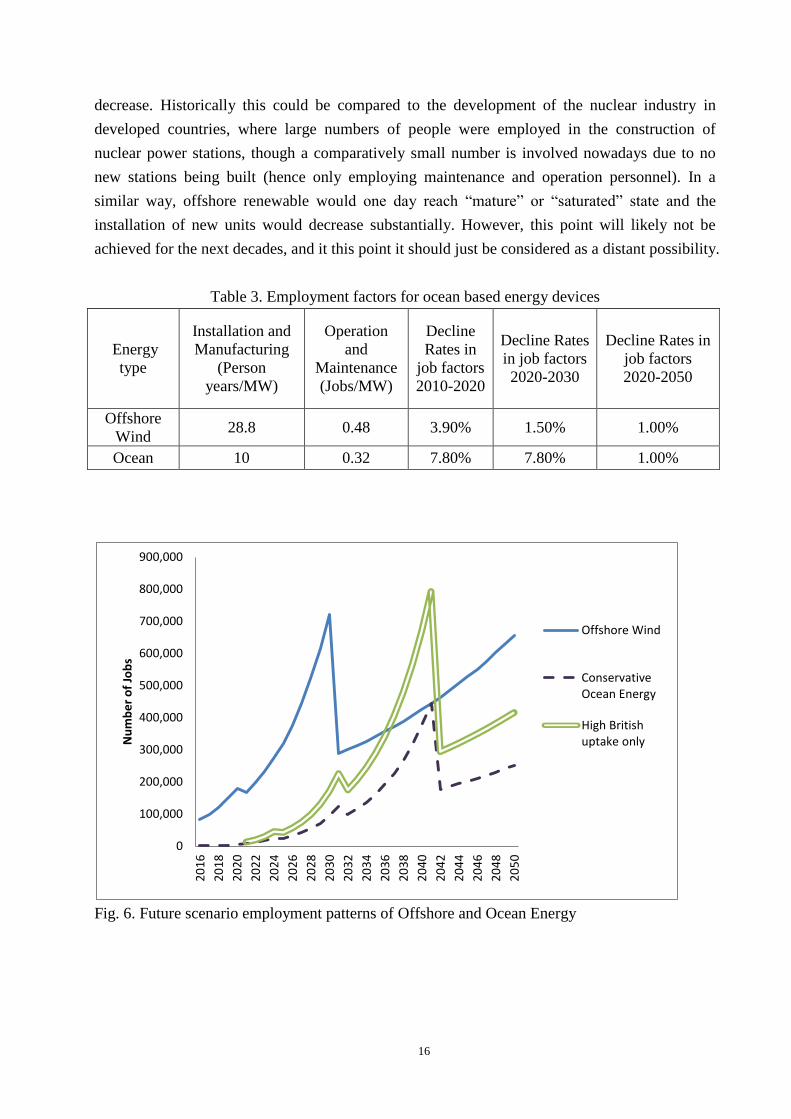
4.6. Employment Generated by Ocean Based Energy Devices
Using the employment factors given in Rutovitz and Atherton [44], an estimate could be made of
the number of people involved world-wide in the construction, maintenance and operation of
ocean energy devices by the year 2050. These factors are summarised in Table 3. It should be
noted that Rutovitz and Atherton [44] do not give decline rates for the years 2030, and hence in
the present paper the authors have used lower decline rates of 1% per year after this date. When
interpreting these graphs the fact that they are based on the scenarios detailed before should be
clearly kept in mind. These scenarios provide sharp declines in the rate of installation of certain
renewables at given years, and hence produce the massive “lay-offs” seen in Fig. 6. This might
appear somewhat unrealistic, but the overall message is that while these technologies are able to
provide a great number of jobs for a number of years, once they reach a critical point (in terms of
all the best sites being fully exploited, technology development reaching a certain point where
less workers are needed, etc) the number of people involved in their installation will sharply
0
0.05
0.1
0.15
0.2
0.25
2008 2013 2018 2023 2028 2033 2038 2043
Year
Pri
ce (
eu
ro c
en
ts k
Wh
)
Learning Factor = 0.75
Learning Factor = 0.9
Variable learning Factor
Carbon
Carbon with tax
Fig. 5. Different cost scenarios for various learning factors Scenario A
16
decrease. Historically this could be compared to the development of the nuclear industry in
developed countries, where large numbers of people were employed in the construction of
nuclear power stations, though a comparatively small number is involved nowadays due to no
new stations being built (hence only employing maintenance and operation personnel). In a
similar way, offshore renewable would one day reach “mature” or “saturated” state and the
installation of new units would decrease substantially. However, this point will likely not be
achieved for the next decades, and it this point it should just be considered as a distant possibility.
Table 3. Employment factors for ocean based energy devices
Energy
type
Installation and
Manufacturing
(Person
years/MW)
Operation
and
Maintenance
(Jobs/MW)
Decline
Rates in
job factors
2010-2020
Decline Rates
in job factors
2020-2030
Decline Rates in
job factors
2020-2050
Offshore
Wind 28.8 0.48 3.90% 1.50% 1.00%
Ocean 10 0.32 7.80% 7.80% 1.00%
Fig. 6. Future scenario employment patterns of Offshore and Ocean Energy
0
100,000
200,000
300,000
400,000
500,000
600,000
700,000
800,000
900,000
20
16
20
18
20
20
20
22
20
24
20
26
20
28
20
30
20
32
20
34
20
36
20
38
20
40
20
42
20
44
20
46
20
48
20
50
Nu
mb
er
of
Job
s
Offshore Wind
ConservativeOcean Energy
High Britishuptake only

17
5. Discussion
The results derived in the previous sections are based on the assumption that general electricity
consumption will not decouple from GDP, and that electricity needs will continue to grow in the
future. In the past “each 1% increase in global GDP has been accompanied by a 0.6% increase in
primary energy production” [43]. Thus, in the simulation carried out by the Energy [r]evolution
report [43] world GDP is assumed to grow on average by 3.6% over the period 2005-2030, but
energy intensity is reduced by 1.25% on average per year, leading to a reduction in final energy
demand per unit of GDP of about 56%. In their model three scenarios are assumed:
The Reference scenario, as published by the International Energy Agency [41], which
assumes an annual growth of world GDP of 3.6%. This scenario would have the primary
energy demand of the world at 867,700 PJ/a by 2050.
The proposed (Revolution) scenario, which would increase efficiency throughout the
economy and only increase primary energy demand from 474,900 PJ/a (2005) to 480,860
PJ/a (2050). The electricity generating sector is targeted to be the pioneer in renewable
utilization, and by 2050 they would like 77% of it to be produced from renewables. A
global installed capacity of 9,100 GW would thus produce 28,600 TWh per year by 2050
[43].
An advanced scenario would have a much bigger drive for renewables, with all coal fired
stations phased out by 2050, and 86% of electricity coming from renewables. The writers
of the report believe that this scenario is too optimistic as it calls for coal power stations
to be decommissioned 20 years before the end of their commercial life (mainly the ones
currently being built in China and India) [43].
In their proposed scenario, the percentage of electricity demand that will be met by ocean energy
is similar to that of the Conservative Ocean Energy Scenario in the current paper (around 2%).
However, the Energy [r]evolution report [43] proposes that very little growth in global electricity
demand should occur, which means that this is achieved by a comparatively smaller installed
capacity, 194GW compared to 280GW in the current paper. They do state, however, that “[t]he
use of ocean energy might be significantly higher, but with the current state of development, the
technical and economical potential remains unclear” [43]. The surge in interest in ocean energy
in the last year and the array of new projects under proposal adds to the impression that the
figures given by that study could prove to be an underestimate.
Sorensen and Naef [42] also suggest an estimate of what could be expected from ocean energy
by the year 2050, though these authors give three different scenarios:
A “very optimistic” scenario, which would have 309GW installed by 2050, giving 1,281
TWh (or 4.2% of total electricity demand, estimated by EREC at 27,524 TWh)
18
An “optimistic-realistic” scenario, with 194GW producing 773 TWh (2.5% of demand)
A “pessimistic” scenario, with 40GW producing 152 TWh (0.5% of demand)
Their scenarios, however, are based on the estimated development of only one type of
technology, the WaveDragon, and rely on the load factor increasing from 34% in 2007 to 47% in
2050 (for the very optimistic scenario). The final figure they come up with for their “optimistic-
realistic” scenario is close to the 2% found by the present study, but it should be noted that these
authors use a figure of 27,524 TWh for the total global electricity demand, which is lower than
that given by the Wind Reference Model [35]. Also to note is how both these values are higher
than the more conservative values of 27% used in the current study.
It is worth pointing out that these scenarios were all built on fairly linear assumptions that
generally neglect the effect of the current economic crisis. The final effect that it could have on
renewable energy development is significant, as some countries might opt to postpone
investment and others might use their stimulus packages to heavily invest in renewable
technology. In its 2009 budget report, for example, the UK government injected GBP £525m
into renewable energies, such as offshore wind, and announced that up to £4 billion of new
capital from the European Investment Bank through direct lending to energy projects and
intermediated lending to banks. These types of “green industrial recovery” schemes could
greatly enhance the chances that the optimistic scenarios outlines above could become a reality.
6. Problems With Large Scale Implementation of Ocean Energy Projects
There are a number of problems which are perceived to hinder the large scale penetration of
ocean based renewable energy sources. Some of these problems are legal or regulatory in nature
[45] [46], while others relate to the financial [13] considerations of the projects, as generally
these type of energy are more expensive than traditional forms of energy, as explained
previously.
However, the main criticism often voiced about intermittent renewable sources regards their
reliability. It is generally believed that renewable power poses a problem to traditional grid
systems due to fluctuations in the electricity produced by these systems, which generally
depends on the time of day and season. In particular, the production of energy from sea areas
would depend on the wind and waves at a given location, as during times of low wind or waves
little electricity would be produced, a problem often referred to as intermittency. Traditional
grids were not originally designed to cope with significant peaks and falls in the electricity
supply and therefore load leveling and the absorption of fluctuations are believed to represent a
problem for the widespread use of renewable power. However, Esteban et al. [22] showed that
this problem of intermittency is party attenuated in large countries such as Japan, as
unfavourable weather conditions in one part of the country for one renewable source might be
19
compensated by better conditions for a different renewable in the same area or elsewhere. This
effect is often referred to as “smoothening”, and thus it is very important that the study of a
comprehensive smart-grid renewable electricity system should include geo-physical variables
and thus be analysed on an hourly basis. It is also worth noting that tidal energy is far more
predictable in this sense, and follows daily fluctuations that can be predicted years in advance,
and would thus contribute to smoothening the system [13].
The use of electricity storage techniques, together with other sources of renewable energy (such
as hydropower and biomass) can also be used so that a country such as Portugal could rely 100%
on renewable power, according to Krajacic et al. [4]. The problem, however, is not only how to
effectively store excess energy during periods of high production for it to then be used at other
times, but the fluctuations in the level of demand. These can broadly be classified into two types:
short-term fluctuations between day and night, and long-term variations associated with the
different seasons of the year [5]. For a 100% renewable electricity system, the short-term
fluctuations could be absorbed using batteries in electric vehicles (EV) or specially built storage
units. Batteries in electric vehicles would, thus, serve the dual purpose of eliminating CO2
emissions from transportation and providing storage during fluctuations in renewable power
production. Some future scenarios propose that a large number of electric vehicles (EV) will
progressively substitute conventional oil-powered ones [47]. If such a high penetration of electric
vehicles does come to be they would store the wind and wave power produced during the night,
and this would be more economically feasible than using batteries dedicated exclusively to
electricity storage. The storage potential of electric cars could also be complemented by batteries
dedicated exclusively to electricity storage, and there is already a battery unit in the north of
Japan that stores part of the electric load of a 50-MW wind farm. A total of 17 batteries (2 MW-
NAS) are employed, using a total area of just over 4,000 m2 of floor space. For the case of long-
term storage, hydrogen, in particular, could be a good storage medium [48] [49], where
electrolytically produced hydrogen could be stored in conventional tanks under pressure and then
re-electrified in peak power demand seasons through various custom-made fuel cells.
7. Conclusions
The current research shows that it does not appear unrealistic that around 7% of the total global
electricity production by 2050 could come from ocean areas. Employment in the sector is likely
to increase rapidly throughout the world, and could reach almost 1 million people by 2030. The
scenarios used in the present work show sharp fluctuations after that time, which would
represent each of the two sectors (offshore and wind) maturing around different times, with
maturity representing a sharp slowdown in the number of people involved in the installation of
20
new devices. Although it is not clear that such an effect will indeed happen, what is clear is the
potential for the sectors to provide substantial amount of jobs in the next 20 years.
Although it appears unlikely that ocean based energy devices will be able to satisfy the
electricity needs of the entire planet, it can form one of a suite of measures necessary to find a
sustainable solution to future energy needs. According to the cost scenarios developed in this
paper, ocean energy could become competitive with other forms of electricity production such as
coal by the late 2010’s or early 2020’s. The cost of wind energy depends on the area where it is
located, though in some places around the world it has started already started to reach grid parity.
However, for future developments to happen in the fields of offshore renewable, governments
will have to create favourable policies for the development of the industry in the coming years
(such as the feed-in-tariffs given by the Portuguese government to ocean energy) so that the
required innovations and economies of scale can be produced.
Acknowledgments
Funding for David Leary’s research has been provided by the Faculty of Law at the University of
New South Wales and from funding generously provided to the Faculties Climate Change Law
and Policy Initiative by UNSW Law Alumni Madelein Tan.
References
[1]Gasparatos A, Stromberg P, Takeuchi K, Biofuels,
ecosystem services and human wellbeing: putting biofuels in the
ecosystem services narrative. Agriculture, Ecosystems and Environment (in press,
obtained through private communication)
[2]Ladenburg J. Visual impact assessment of offshore wind farms and prior experience, Applied
Energy 2009, 86, 380-387,
[3]Pelc R, Fujita RM. Renewable energy from the ocean Marine Policy 2002, 26, 471.
[4]Krajacic G, Duic N, Carvalho MG. How to achieve a 100% RES electricity supply for
Portugal?, Applied Energy, Volume 88, Issue 2, The 5th Dubrovnik Conference on
Sustainable Development of Energy, Water and Environment Systems, held in Dubrovnik
September/October 2009. Pages 508-517,
[5]Esteban M., Zhang Q, Utama A., Tezuka T, Ishihara KN Methodology to Estimate the Output
of a Dual Solar-Wind Renewable Energy System in Japan, Journal of Energy Policy 2010,
38, 7793-7802
[6]Soerensen HC, Weinstein A. Ocean Energy: Position paper for IPCC Proc. of IPCC Scoping
Meeting on Ren. En. Sources, 2008, Lubeck, Germany.
[7]World Offshore Renewable Energy Report 2002-2007, published by Renewables UK, UK
Department of Trade & Industry. Authors: Douglas-Westwood Ltd.
21
[8]Scruggs J, Jacob P. Harvesting Ocean Wave Energy, Science 2009, 323, 1176.
[9]Cornett AMA Global Wave Energy Resource Assessment, Proceedings of the Eighteenth
International Offshore and Polar Eng. Conference, 2008, Vancouver, Canada, July 6-11
[10]Tan M. China’s Potential on the Renewable Energy Development, Final Thesis at the United
Nations University Institute of Advanced Studies, 2009.
[11]Watts J. South Korea lights the way on carbon emissions with its 23bn pounds green deal,
The Guardian, Retrieved 21st April 2009. http://www.guardian.co.uk/environment/2009/
apr/21/south-korea-enviroment-carbon-emissions
[12]Owen E. Environment Agency boss opposes Severn Barrage, New Civil Engineering
Journal, 2008, 1, pp5.
[13]Rourke FO, Boyle F, Reynolds A. (2010). Tidal energy update 2009, Applied Energy, 2010,
87, Pages 398-409
[14]Westwood, A. SeaGen installation moves forward, Renewable Energy Focus, 2008, Vol. 9,
Issue 3, pp 26-27
[15]Khan MJ, Bhuyan G, Iqbal MT, Quaicoe JE. Hydrokinetic energy conversion systems and
assessment of horizontal and vertical axis turbines for river and tidal applications: A
technology status review, Applied Energy, 2009, 86, 1823-1835
[16]Bryden I. Progress towards a Viable UK Marine Renewable Energy. Coasts, Marine
Structures and Breakwaters 2009, Edinburgh, Scotland, 16th
-18th
September 2009.
[17]Carnegie Corporation, ‘Development timeline’
www.carnegiecorp.com.au/index.php?url=/ceto/development-timeline Acces. 8 Apr. 2009.
[18]Oceanlinxs, ‘Clean power and fresh water from waves’ http://www.oceanlinx.com/
Accessed 1st June 2011.
[19]Ikegami Y, Achiruddin D, Abdullah K. Possibility Study of OTEC & DOWA in Indonesia,
Proc. of International Symposium on Sustainable Energy and Environmental Protection
(ISSEEP) 2009 Yogyakarta, Indonesia, 23-26 September 2009
[20]British Wind Energy Agency (BWEA). UK Offshore Wind: Staying on Track. Forecasting
offshore wind build for the next five years, 2007.
[21]The Guardian Newspaper. Offshore wind farms could meet a quarter of the UK's electricity
needs, published 25th
June 2009,
http://www.guardian.co.uk/environment/2009/jun/25/offshore-wind-uk-homes
[22]Esteban M, Leary D, Zhang Q, Utama A, Tezuka T, Ishihara KN (2010) Job Retention in the
British Offshore Sector Through Greening of the North Sea Energy Industry Journal of
Energy Policy, 2010, 39, 1543-1551
[23]Global Wind Energy Council (GWEC) (2009) www.gwec.net, accessed 22 June 2009.
[24]Zhau X. The Development of Modern Power System and Power System Technology.
APPEEC 2010 Conference, China, 28 to 31
st of May, 2010 (plenary speech)
[25]China-Britain Business Council, Report: China’s Offshore Wind Energy Sector
www.ukrenewables.com/documentation/Offshore-Wind-Power.pdf. Accessed15 June 2009
22
[26]Zhixin W, Chuanwen J, Qian A, Chengmin W. The key technology of offshore wind farm
and its new development in China. Ren.e & Sust. Energy Reviews 2009, 13, 216222.
[27]Hong Kong Offshore Wind Farm ‘Stakeholder Consultation Web site’
www.hongkongoffshorewind.com/TheProject.html 19. Accessed June 2009.
[28]Yagi K, Tarutani T, Dohata S, Shiobara Y. Construction of the first offhsore wind turbines
in Setana Port in Japan, www./ieeexplore.ieee.org/stamp/stamp.jsp?tp=&arnumber=1406421
Accessed 22 June 2009.
[29]TWA Network, South Korea Seeking Renewable Energy from Wind and Tide,
www.twanetwerk.nl/upl_documents/Renewable_Energy.pdf. Accessed 22 June 2009.
[30]Naikun Wind Energy Group www.naikun.ca/the_project/index.php. Accessed 15 June 2009.
[31]BBC, 2009, Floating Wind Turbine Launched, http://news.bbc.co.uk/2/hi/8085551.stm.
Accessed 22 June 2009
[32]Wind power in China(only Chinese) http://www.fenglifadian.com/fengchang. Accessed 22
June 2009
[33]Rudong, 2010
http://www.51wind.cn/article/Rudong_14_billion_to_build_wind_power_generation_sea_T
hree_Gorges.html, Accessed 25th
Feb 2010 (in Chinese). Accessed 22 June 2009
[34]Fujian, 2010,
http://www.51wind.cn/article/Fujian_Ningde_will_build_large_offshore_wind_power_gene
ration_base.html, Accessed 25th
Feb 2010 (in Chinese). Accessed 22 June 2009
[35]Lemming J, Morthorst, PE, Clausen NE, Jensen PH Contribution to the Chapter on Wind
Power in: Energy Perspectives 2008, Int. Energy Ag., 2008,
[36]European Wind Energy Association (EWEA). 2009. Pure Power, Wind Energy Targets for
2020 and 2030.
http://www.ewea.org/fileadmin/ewea_documents/documents/publications/reports/Pure_P
ower_Full_Report.pdf Accessed 29th October 2010.
[37]British Wind Energy Agency (BWEA), 2008, Wind Energy in the UK; A BWEA State of
the Industry Report, http://www.renewable-
manifesto.com/pdf/publications/Industry_Report_08.pdf, Accessed 27th
October 2010.
[38] Breeze PA. Power Generation Technologies, 2005, ISBN 0750663138, 9780750663137.
[39]New Zealand Electricity Commission. An Appraisal of New and Renewable Generation
Technologies as Transmission Upgrade Alternatives, 2005
[40]BBC, 2010, Milestone for wave energy plans. http://news.bbc.co.uk/2/hi/8564662.stm,
Accessed 15th
April 2010
[41]International Energy Agency (IAE). World Energy Outlook 2007. 2007
[42]Soerensen HC, Naef S. Report on Technical Specification of Reference Technologies (wave
and tidal power plant), NEEDS Project Report 2008
[43]Teske S. Energy [r]evolution, European Renewable Energy Council (EREC) and
Greenpeace International, 2008, ISBN 978907336189
23
[44]Rutovitz J, Atherton A. Energy sector jobs to 2030: a global analysis. Prepared for
Greenpeace Intl. by the Institute forSustainable Futures, 2009, University of Technology,
Sydney.
[45]Leary D, Esteban M. Climate change and renewable energy from the ocean and tides:
calming the sea of regulatory uncertainty. International Journal of Marine and Coastal law
2009, 24, 617-651
[46] Leary D, Esteban M. Renewable energy from the ocean and tides: a viable renewable
energy resource in search of a suitable regulatory framework. Carbon & Climate Law
Review, 2010, 4, 417-425.
[47]Guille C, Gross GA. Conceptual framework for the vehicle-to-grid (V2G) Implementation,
Energy Policy, 2009, 37[11],4379-4390.
[48]Sherif SA, Barbir F, Veziroglu TN. Wind energy and the hydrogen economy—review of the
technology, Solar Energy, 2005, 78 , 647–660.
[49]Levene JI, Mann MK, Margolis RM, Milbrandt A. An analysis of hydrogen production from
renewable electricity sources, Solar Energy, 2007, 81, 773–780.