analyse de sensibilité et réduction ... - thèses en ligne
TRANSCRIPT

HAL Id: tel-00757101https://tel.archives-ouvertes.fr/tel-00757101v2
Submitted on 30 Jul 2013
HAL is a multi-disciplinary open accessarchive for the deposit and dissemination of sci-entific research documents, whether they are pub-lished or not. The documents may come fromteaching and research institutions in France orabroad, or from public or private research centers.
L’archive ouverte pluridisciplinaire HAL, estdestinée au dépôt et à la diffusion de documentsscientifiques de niveau recherche, publiés ou non,émanant des établissements d’enseignement et derecherche français ou étrangers, des laboratoirespublics ou privés.
Analyse de sensibilité et réduction de dimension.Application à l’océanographie
Alexandre Janon
To cite this version:Alexandre Janon. Analyse de sensibilité et réduction de dimension. Application à l’océanographie.Mathématiques générales [math.GM]. Université de Grenoble, 2012. Français. NNT :2012GRENM066. tel-00757101v2

THÈSE
Pour obtenir le grade de
DOCTEUR DE L’UNIVERSITÉ DE GRENOBLESpécialité : Mathématiques Appliquées
Arrêté ministériel : 7 août 2006
Présentée par
Alexandre JANON
Thèse dirigée par Clémentine PRIEUR
et codirigée par Maëlle NODET
préparée au sein du Laboratoire Jean Kuntzmann
et de l’École Doctorale Mathématiques, Sciences et Technologies de
l’Information, Informatique
Analyse de sensibilité et réductionde dimensionApplication à l’océanographie
Thèse soutenue publiquement le 15 novembre 2012,
devant le jury composé de :
M. Josselin GARNIERProfesseur, Université Paris 7, Président
Mme Béatrice LAURENTProfesseur, INSA Toulouse, Rapporteur
M. Yvon MADAYProfesseur, Université Paris 6, Rapporteur
M. Christophe PRUDHOMMEProfesseur, Université de Strasbourg, Examinateur
M. Anthony NOUYProfesseur, École Centrale de Nantes, Examinateur
Mme Florence FORBESDirecteur de Recherche, INRIA Rhône Alpes, Examinatrice
Mme Clémentine PRIEURProfesseur, Université Grenoble 1, Directrice de thèse
Mme Maëlle NODETMaître de Conférences, Université Grenoble 1, Co-Directrice de thèse


Remerciements
Je souhaite commencer en remerciant mes deux directrices de thèse, Clé-
mentine Prieur et Maëlle Nodet, d’abord pour m’avoir proposé de travailler
sur ce sujet intéressant et à l’intersection de deux thèmes qui m’intéressent,
et ensuite et surtout pour leur encadrement stimulant, rigoureux et sans
faille durant ces trois années de collaboration.
Je remercie également les membres du jury, qui ont accepté de s’intéresser
à mon travail, et qui ont tous apporté des remarques pertinentes, aussi bien
lors des pré-rapports que de la soutenance.
Mes pensées vont à ma famille : ma mère (sans qui rien de tout cela n’aurait
été possible !), mon oncle et ma tante, mon cousin (qui sait faire péter les
bouchons de champagne sans blesser personne !) et ma cousine, première
docteur de la famille !
Je remercie évidemment les membres du LJK que j’ai côtoyé : Anne, pour
sa maîtrise des rouages administratifs, et bien sûr les autres doctorants (en
espérant n’oublier personne !) : les cobureaux de la salle 3 (Jean-Yves, Chloé,
Jean-Matthieu, Amin, Kole), ou d’ailleurs (Gaëlle, Bertrand, Vincent, Fede-
rico, Madison, Lukas, Roland, Meryam, θt,τ – facteur essentiel de la réussite
de ma semaine belge –, Jonathan, Gildas, Christine). J’ai grandement ap-
précié les relations amicales que nous avons eu ensemble et je vous souhaite
beaucoup de réussite pour la suite.
3


Résumé
Les modèles mathématiques ont pour but de décrire le comportement d’un
système. Bien souvent, cette description est imparfaite, notamment en raison
des incertitudes sur les paramètres qui définissent le modèle. Dans le contexte
de la modélisation des fluides géophysiques, ces paramètres peuvent être par
exemple la géométrie du domaine, l’état initial, le forçage par le vent, ou les
coefficients de frottement ou de viscosité.
L’objet de l’analyse de sensibilité est de mesurer l’impact de l’incertitude
attachée à chaque paramètre d’entrée sur la solution du modèle, et, plus
particulièrement, identifier les paramètres (ou groupes de paramètres) « sen-
sibles ». Parmi les différentes méthodes d’analyse de sensibilité, nous privilé-
gierons la méthode reposant sur le calcul des indices de sensibilité de Sobol.
Le calcul numérique de ces indices de Sobol nécessite l’obtention des so-
lutions numériques du modèle pour un grand nombre d’instances des para-
mètres d’entrée. Cependant, dans de nombreux contextes, dont celui des mo-
dèles géophysiques, chaque lancement du modèle peut nécessiter un temps
de calcul important, ce qui rend inenvisageable, ou tout au moins peu pra-
tique, d’effectuer le nombre de lancements suffisant pour estimer les indices
de Sobol avec la précision désirée.
Ceci amène à remplacer le modèle initial par un métamodèle (aussi appelé
surface de réponse ou modèle de substitution). Il s’agit d’un modèle appro-
chant le modèle numérique de départ, qui nécessite un temps de calcul par
lancement nettement diminué par rapport au modèle original.
Cette thèse se centre sur l’utilisation d’un métamodèle dans le cadre du
calcul des indices de Sobol, plus particulièrement sur la quantification de
l’impact du remplacement du modèle par un métamodèle en terme d’erreur
d’estimation des indices de Sobol. Nous nous intéressons également à une
méthode de construction d’un métamodèle efficace et rigoureux pouvant être
5

utilisé dans le contexte géophysique.

Summary
Mathematical models seldom represent perfectly the reality of studied sys-
tems, due to, for instance, uncertainties on the parameters that define the
system. In the context of geophysical fluids modelling, these parameters can
be, e.g., the domain geometry, the initial state, the wind stress, the friction
or viscosity coefficients.
Sensitivity analysis aims at measuring the impact of each input parameter
uncertainty on the model solution and, more specifically, to identify the
“sensitive” parameters (or groups of parameters). Amongst the sensitivity
analysis methods, we will focus on the Sobol indices method.
The numerical computation of these indices require numerical solutions of
the model for a large number of parameters’ instances. However, many mo-
dels (such as typical geophysical fluid models) require a large amount of
computational time just to perform one run. In these cases, it is impossible
(or at least not practical) to perform the number of runs required to estimate
Sobol indices with the required precision.
This leads to the replacement of the initial model by a metamodel (also called
response surface or surrogate model), which is a model that approximates the
original model, while having a significantly smaller time per run, compared
to the original model.
This thesis focuses on the use of metamodel to compute Sobol indices. More
specifically, our main topic is the quantification of the metamodeling impact,
in terms of Sobol indices estimation error. We also consider a method of
metamodeling which leads to an efficient and rigorous metamodel, which
can be used in the geophysical context.
7


Table des matières
Liste des travaux 13
1 Introduction 15
1.1 Objet de la thèse . . . . . . . . . . . . . . . . . . . . . . . . . 15
1.2 Introduction à l’analyse de sensibilité globale . . . . . . . . . 19
1.2.1 Cadre stochastique . . . . . . . . . . . . . . . . . . . . 19
1.2.2 Indices de sensibilité . . . . . . . . . . . . . . . . . . . 21
1.2.3 Calcul des indices de Sobol . . . . . . . . . . . . . . . 24
1.2.4 Évaluation de l’erreur d’estimation par Monte-Carlo . 32
1.3 Introduction à la métamodélisation . . . . . . . . . . . . . . . 35
1.3.1 Métamodélisation par krigeage . . . . . . . . . . . . . 36
1.3.2 Métamodélisation par interpolation à noyau . . . . . . 38
1.3.3 Métamodélisation par base réduite . . . . . . . . . . . 43
1.4 Introduction au Chapitre 2 . . . . . . . . . . . . . . . . . . . 49
1.4.1 Problématique . . . . . . . . . . . . . . . . . . . . . . 49
1.4.2 Approche existante 1 : utilisation du krigeage . . . . . 50
1.4.3 Approche existante 2 : bootstrap de métamodèle . . . 51
1.4.4 Notre approche . . . . . . . . . . . . . . . . . . . . . . 53
1.5 Introduction au Chapitre 3 . . . . . . . . . . . . . . . . . . . 57
1.5.1 Problématique . . . . . . . . . . . . . . . . . . . . . . 58
1.5.2 δ-méthode et TCL triangulaire . . . . . . . . . . . . . 60
1.5.3 Théorie de l’efficacité asymptotique . . . . . . . . . . 61
1.5.4 Résultats obtenus . . . . . . . . . . . . . . . . . . . . 66
1.6 Introduction au Chapitre 4 . . . . . . . . . . . . . . . . . . . 67
1.6.1 Problématique . . . . . . . . . . . . . . . . . . . . . . 67
1.6.2 Approches existantes . . . . . . . . . . . . . . . . . . . 69
1.6.3 Notre approche . . . . . . . . . . . . . . . . . . . . . . 70
9

1.7 Introduction au Chapitre 5 . . . . . . . . . . . . . . . . . . . 72
1.7.1 Problématique . . . . . . . . . . . . . . . . . . . . . . 72
1.7.2 Approches existantes . . . . . . . . . . . . . . . . . . . 73
1.7.3 Notre approche . . . . . . . . . . . . . . . . . . . . . . 75
2 Sensitivity estimation from metamodels 77
2.1 Introduction . . . . . . . . . . . . . . . . . . . . . . . . . . . . 79
2.2 Review of sensitivity indices . . . . . . . . . . . . . . . . . . . 82
2.2.1 Definition . . . . . . . . . . . . . . . . . . . . . . . . . 82
2.2.2 Monte-Carlo estimator . . . . . . . . . . . . . . . . . . 82
2.3 Quantification of the two types of error in index estimation . 83
2.3.1 Metamodel error in index estimation . . . . . . . . . . 84
2.3.2 A smoothed alternative . . . . . . . . . . . . . . . . . 87
2.3.3 Sampling error : bootstrap confidence intervals . . . . 89
2.3.4 Combined confidence intervals . . . . . . . . . . . . . 90
2.4 Applications . . . . . . . . . . . . . . . . . . . . . . . . . . . . 91
2.4.1 Application to a reduced basis metamodel . . . . . . . 91
2.4.2 Application to a RKHS interpolation metamodel . . . 97
2.5 Appendix – RKHS interpolation and error bound . . . . . . . 100
3 Normality and efficiency in Sobol index estimation 103
3.1 Definition and estimation of Sobol indices . . . . . . . . . . . 107
3.1.1 Exact model . . . . . . . . . . . . . . . . . . . . . . . 107
3.1.2 Estimation of SX . . . . . . . . . . . . . . . . . . . . . 108
3.2 Asymptotic properties: exact model . . . . . . . . . . . . . . 109
3.2.1 Consistency and asymptotic normality . . . . . . . . . 109
3.2.2 Asymptotic efficiency . . . . . . . . . . . . . . . . . . 113
3.3 Asymptotic properties: metamodel . . . . . . . . . . . . . . . 116
3.3.1 Metamodel-based estimation . . . . . . . . . . . . . . 116
3.3.2 Consistency and asymptotic normality . . . . . . . . . 117
3.3.3 Asymptotic efficiency . . . . . . . . . . . . . . . . . . 122
3.4 Numerical illustrations . . . . . . . . . . . . . . . . . . . . . . 123
3.4.1 Exact model . . . . . . . . . . . . . . . . . . . . . . . 125
3.4.2 Gaussian-perturbated model . . . . . . . . . . . . . . 125
3.4.3 Weibull-perturbated model . . . . . . . . . . . . . . . 125
3.4.4 RKHS metamodel . . . . . . . . . . . . . . . . . . . . 130
3.4.5 Nonparametric regression . . . . . . . . . . . . . . . . 133

4 Reduced-basis solutions of Burgers equation 139
4.1 Model . . . . . . . . . . . . . . . . . . . . . . . . . . . . . . . 142
4.1.1 Equation . . . . . . . . . . . . . . . . . . . . . . . . . 142
4.1.2 Numerical resolution . . . . . . . . . . . . . . . . . . . 143
4.2 Reduction procedure . . . . . . . . . . . . . . . . . . . . . . . 148
4.2.1 Parameters . . . . . . . . . . . . . . . . . . . . . . . . 148
4.2.2 Offline/online procedure . . . . . . . . . . . . . . . . . 149
4.2.3 Choice of the reduced basis . . . . . . . . . . . . . . . 153
4.3 Error bound . . . . . . . . . . . . . . . . . . . . . . . . . . . . 157
4.3.1 Error bound . . . . . . . . . . . . . . . . . . . . . . . . 158
4.3.2 Initial error . . . . . . . . . . . . . . . . . . . . . . . . 161
4.3.3 Norm of the residual . . . . . . . . . . . . . . . . . . . 162
4.3.4 Lower and upper bounds on stability constant . . . . 164
4.4 Numerical results . . . . . . . . . . . . . . . . . . . . . . . . . 168
4.4.1 Reference solutions . . . . . . . . . . . . . . . . . . . . 169
4.4.2 Reduced solutions . . . . . . . . . . . . . . . . . . . . 169
4.4.3 Convergence benchmarks . . . . . . . . . . . . . . . . 174
4.4.4 Effect of mesh refinement and penalization constant . 175
4.4.5 Comparison with existing bound . . . . . . . . . . . . 175
4.5 Appendix – Proof of Theorem 4 . . . . . . . . . . . . . . . . . 180
5 Goal-oriented error estimation 187
5.1 Methodology . . . . . . . . . . . . . . . . . . . . . . . . . . . 190
5.1.1 Preliminaries . . . . . . . . . . . . . . . . . . . . . . . 190
5.1.2 Theoretical error bound . . . . . . . . . . . . . . . . . 193
5.1.3 Computable error bound . . . . . . . . . . . . . . . . . 195
5.2 Application to sensitivity analysis . . . . . . . . . . . . . . . . 197
5.2.1 Definition of the Sobol indices . . . . . . . . . . . . . . 198
5.2.2 Estimation of the Sobol indices . . . . . . . . . . . . . 198
5.3 Numerical results I: Diffusion equation . . . . . . . . . . . . . 199
5.3.1 Benchmark problem . . . . . . . . . . . . . . . . . . . 199
5.3.2 Results . . . . . . . . . . . . . . . . . . . . . . . . . . 201
5.3.3 Application to sensitivity analysis . . . . . . . . . . . 203
5.4 Numerical results II: transport equation . . . . . . . . . . . . 203
5.4.1 Benchmark problem . . . . . . . . . . . . . . . . . . . 204
5.4.2 Results . . . . . . . . . . . . . . . . . . . . . . . . . . 205

12 Chapitre 0.
Conclusion et perspectives 207

Liste des travaux
Les chapitres 2, 3, 4 et 5 de cette thèse sont constitués des publications, ou
prépublications, suivantes :
Janon1 Janon, A., Nodet M., Prieur C. Uncertainties assessment in global
sensitivity indices estimation from metamodels, 2011. Accepté dans
International Journal for Uncertainty Quantification.
Janon2 Janon, A., Klein T., Lagnoux A., Nodet M., Prieur C. Asymptotic
normality and efficiency of two Sobol index estimators, 2012, soumis.
Janon3 Janon, A., Nodet M., Prieur C. Certified reduced basis solutions of
viscous Burgers equation parametrized by initial and boundary values,
2010. Accepté dans Mathematical Modelling and Numerical Analysis.
Janon4 Janon A., Nodet M., Prieur C. Goal-oriented error estimation for
reduced basis method, with application to certified sensitivity analysis,
2012, soumis.
[Janon1] constitue le chapitre 2, [Janon2] le chapitre 3, [Janon3] le chapitre
4 et [Janon4] le chapitre 5.
Deux rapports techniques, disponibles sur la page Web de l’auteur 1 ont
également été rédigés et sont des synthèses bibliographiques sur des thèmes
en rapport avec l’objet de cette thèse :
Janon5 Janon, A. Reduced-basis solutions of affinely-parametrized linear
partial differential equations, 2010.
Janon6 Janon, A. Méthodes de quadrature multi-dimensionnelles et dé-
composition en polynômes de chaos. Application à la quantification
d’incertitude et aux méthodes stochastiques d’analyse de sensibilité.
2010.
1. http://ljk.imag.fr/membres/Alexandre.Janon/
13

14 Chapitre 0.
Enfin, les algorithmes présentés dans les chapitres 2 et 3 ont été implé-
mentés informatiquement par l’auteur, et sont distribués au public sous
forme de contributions (sous licence libre) aux packages CompModSA [116]
et sensitivity [77] du logiciel R [81].
Nous donnons ci-dessous une courte description de ces packages ainsi que
de notre contribution.
Package CompModSA : Ce package implémente de nombreuses méthodes de
métamodélisation « boîte noire » (utilisant seulement un échantillon
fini d’évaluations du modèle à approcher). Ces méthodes de métamo-
délisation sont ensuites utilisées par les estimateurs d’indices de sensi-
bilité, inclus dans le package. La précision de l’estimation est donnée
sous forme d’intervalles de confiance obtenus par bootstrap, en suivant
la méthode décrite dans [100].
Notre contribution : Nous avons corrigé plusieurs bugs et incompa-
tibilités avec les versions récentes des packages utilisés. Nous avons
également rajouté une option afin de permettre l’estimation des in-
dices de Sobol du premier ordre (auparavant, seuls les indices totaux
étaient proposés). Enfin, nous avons rendu le package propre à être
diffusé sur le CRAN (collection en ligne de packages R).
URL : http://cran.r-project.org/web/packages/sensitivity/
Package sensitivity : Ce package contient plusieurs méthodes d’estima-
tion de mesures de sensibilité, dont les indices de sensibilité de Sobol.
L’estimation ponctuelle est complétée par un intervalle de confiance
bootstrap.
Notre contribution : Nous avons ajouté à ce package l’estimateur
asymptotiquement efficace que nous considérons dans le chapitre 3
de ce manuscrit, ainsi que l’estimation des intervalles de confiance
asymptotiques pour les deux estimateurs considérés dans ce chapitre.
Par ailleurs, nous avons implémenté – en utilisant le langage C++
interfacé avec R – les deux méthodes d’analyse de sensibilité certifiées
présentées au chapitre 2.
URL : http://cran.r-project.org/web/packages/CompModSA/

Chapitre 1
Introduction
1.1 Objet de la thèse
Cette thèse se place dans le contexte de la modélisation numérique du com-
portement des fluides géophysiques. Cette modélisation joue un rôle fon-
damental dans les systèmes de prévision environnementaux, que ce soit en
météorologie, en océanographie, dans l’étude des fleuves et des crues, ou en
climatologie.
Issus de considérations physiques, les modèles utilisés prennent la forme
d’équations, ou de systèmes d’équations aux dérivées partielles (EDP) qui
ne peuvent représenter la réalité qu’imparfaitement, à cause des sources
d’incertitudes suivantes :
– les équations obtenues par la physique sont souvent établies en faisant
des hypothèses simplificatrices (des considérations d’échelle spatiale ou
d’échelle temporelle amènent à négliger l’effet de certaines forces devant
d’autres), ainsi le modèle mathématique lui-même ne traduit pas l’inté-
gralité du phénomène physique étudié ;
– les solutions du modèle ne sont bien souvent accessibles qu’au travers
d’une solution calculée numériquement, qui est une approximation de la
« vraie » solution des équations issues de la physique ;
– les équations du modèle – et donc les solutions du modèle – dépendent
des paramètres physiques du système étudié (géométrie du domaine, état
initial, état au bord du domaine, forçage par le vent, coefficients de frot-
tement, de viscosité...) qui sont souvent mal connus.
15

16 Chapitre 1.
Notre travail se centre sur cette troisième source d’incertitude. Nous souhai-
tons mesurer l’impact de l’incertitude attachée aux paramètres d’entrée sur
la solution, et, plus particulièrement, identifier les paramètres (ou groupes
de paramètres) « sensibles ». Cette identification, qui peut se faire à l’aide
de plusieurs méthodes, est l’objet de l’analyse de sensibilité. Les méthodes
d’analyse de sensibilité peuvent se classer en deux types :
– Dans les méthodes locales, l’influence d’un paramètre est mesurée par
l’importance de la variation de la solution autour d’une valeur nominale
de ce paramètre, c’est-à-dire par une dérivée partielle évaluée en cette
valeur nominale.
– Dans les méthodes globales (aussi appelées méthodes stochastiques), l’in-
certitude sur les paramètres est modélisée par une loi de probabilité,
connue a priori. Cette loi sur les entrées ainsi que le modèle déterminent
entièrement la distribution de la solution du modèle, et celle-ci contient
toute l’information sur l’incertitude de la sortie. Des résumés statistiques
bien choisis de cette distribution permettent alors de classer les paramètres
par ordre d’importance.
Parmi les différentes méthodes d’analyse de sensibilité, nous privilégierons
la méthode, globale, reposant sur le calcul des indices de sensibilité de Sobol.
L’indice de Sobol d’un paramètre (ou d’un groupe de paramètres) est un in-
dicateur statistique, d’interprétation aisée, de l’importance de ce paramètre
(ou de ce groupe de paramètres) sur la variabilité d’une quantité scalaire
d’intérêt, fonction de la solution du modèle. Le calcul effectif des indices
de sensibilité permet de hiérarchiser les paramètres d’entrée en fonction de
leur influence sur la sortie. Un utilisateur du modèle peut alors identifier
les paramètres les plus influents comme ceux sur lesquels l’incertitude doit
être réduite – dans la mesure du possible – en priorité afin d’apporter une
réduction de l’incertitude sur la sortie la plus importante. À l’inverse, les pa-
ramètres les moins influents peuvent être fixés à une valeur nominale, ce qui
permet de simplifier le modèle. Par ailleurs, les experts utilisateurs du mo-
dèle ont bien souvent une idée qualitative, a priori, basée sur leur intuition,
des paramètres les plus influents d’un système physique. La confrontation
de cette préconception avec les indices calculés numériquement permet de
valider, ou au contraire d’invalider, le modèle ou son implémentation infor-
matique.
Les indices de Sobol peuvent se calculer de diverses façons, et nous ferons le

INTRODUCTION 17
choix de nous centrer sur les méthodes dites de Monte-Carlo. Ces méthodes,
d’origine stochastique, fournissent une approximation numérique des indices
de Sobol entâchée d’une erreur d’estimation, ou erreur Monte-Carlo. L’uti-
lisation d’une telle méthode d’approximation pose deux questions :
Question 1 : Dans le but de certifier cette approximation, comment éva-
luer l’erreur Monte-Carlo ?
Question 2 : Plusieurs formules d’approximation Monte-Carlo étant uti-
lisables, peut-on identifier une méthode qui soit « la plus précise », en
un sens à formaliser ?
Une autre problématique associée au calcul des indices de Sobol est que celui-
ci nécessite l’obtention des solutions numériques du modèle pour un grand
nombre d’instances des paramètres d’entrée. Cependant, dans de nombreux
contextes, dont celui des modèles géophysiques, chaque lancement du modèle
peut nécessiter un temps de calcul important, ce qui rend inenvisageable, ou
tout au moins peu pratique, d’effectuer le nombre de lancements suffisant
pour estimer les indices de Sobol avec la précision désirée.
C’est ici qu’intervient l’utilisation d’un métamodèle (aussi appelé surface
de réponse ou modèle de substitution). Il s’agit d’un modèle, construit al-
gorithmiquement, approchant le modèle numérique de départ, qui nécessite
un temps de calcul par lancement nettement diminué par rapport au mo-
dèle original. L’utilisation d’un métamodèle sépare le calcul des solutions du
modèle en deux phases :
– une phase de préparation, ou phase offline, durant laquelle le métamodèle
est construit ;
– une phase d’utilisation, ou phase online, pendant laquelle le métamodèle
est appelé pour chaque valeur des paramètres d’entrée sur laquelle on
souhaite évaluer le modèle.
La phase de préparation pouvant être coûteuse en temps de calcul, il est
bien sûr judicieux d’utiliser un métamodèle seulement si le nombre de lan-
cements à effectuer dépasse un certain seuil. Remarquons que l’utilisation de
métamodèles n’est pas cantonnée à l’analyse de sensibilité, elle trouve éga-
lement sa place dans d’autres domaines où un même modèle doit être résolu
pour un grand nombre de paramètres différents, tel que l’optimisation, ou
dans des applications (telles que la météo ou la simulation haptique) où la
réponse du modèle doit être connue en temps réel par l’utilisateur.

18 Chapitre 1.
Parmi les méthodes de construction d’un métamodèle, les méthodes de ré-
duction de dimension visent à identifier, durant la phase de préparation, les
degrés de liberté pertinents pour décrire, de manière suffisamment précise,
la dépendance de la solution du modèle en fonction des paramètres d’en-
trée. Le but est de remplacer le système d’équations issu de la discrétisation
numérique de l’EDP originale, qui est coûteux à résoudre car faisant interve-
nir plusieurs milliers (voire quelques millions) d’inconnues, par un système
d’équations donnant les coordonnées de la solution approchée du modèle
dans le nouveau système de degrés de libertés. Dans de nombreux cas, on
peut remplacer le système à plusieurs milliers d’inconnues par un système
avec un nombre d’inconnues de l’ordre de la dizaine, ce qui procure des gains
substantiels en temps de calcul.
L’utilisation d’un métamodèle amène trois nouvelles questions :
Question 3 : Le remplacement du modèle original par le métamodèle est
une source d’erreur lors de l’estimation des indices. Comment quanti-
fier l’impact de cette erreur sur les indices de Sobol calculés ?
Question 4 : Une façon de quantifier cette erreur est de disposer d’une
méthode de métamodélisation fournissant une majoration de l’erreur
entre le modèle et le métamodèle. Comment développer de telles mé-
thodes certifiées, utilisables dans les modèles géophysiques qui nous
intéressent ?
Question 5 : L’analyse de sensibilité s’intéresse souvent à un aspect par-
ticulier du modèle (par exemple un résumé statistique de celui-ci). On
peut vouloir construire le métamodèle en cherchant à ce qu’il repro-
duise le plus fidèlement possible cet aspect d’intérêt. La borne d’erreur
fournie par le métamodèle, évoquée à la question précédente, peut-elle
également être optimisée en fonction de l’aspect retenu du modèle ?
La suite de ce manuscrit est consacrée d’une part à la présentation détaillée
de plusieurs méthodes d’analyse de sensibilité globale, et d’autre part à la
réponse que nous proposons aux cinq questions soulevées plus haut.
Plus spécifiquement, la section 1.2 présente quelques méthodes d’analyse de
sensibilité, en se centrant sur les indices de Sobol et sur leur estimation,
la section 1.3 détaille trois méthodes de métamodélisation, et les sections
suivantes sont des introductions aux chapitres 2, 3, 4 et 5 de la thèse :
– la section 1.4 introduit le chapitre 2, qui traite des questions 1 et 3 ;
– la section 1.5 introduit le chapitre 3, qui traite des questions 1, 2 et 3 ;
INTRODUCTION 19
– la section 1.6 introduit le chapitre 4, qui traite de la question 4 ;
– la section 1.7 introduit le chapitre 5, qui traite de la question 5.
Ces chapitres sont constitués de publications soumises ou acceptées, dont
on trouvera les références page 13.
1.2 Introduction à l’analyse de sensibilité globale
L’objet de cette section est de présenter différentes méthodes d’analyse de
sensibilité globale. La première partie introduit le cadre d’étude et les nota-
tions. La partie 1.2.2 définit plusieurs mesures de sensibilité, dont les indices
de Sobol. Des méthodes de calcul numérique approché de ces indices sont
décrites en partie 1.2.3. Nous terminons par la partie 1.2.4, où nous donnons
des méthodes d’estimation de l’erreur d’approximation dans l’évaluation des
indices de Sobol par Monte-Carlo. Les références classiques en analyse de
sensibilité globale sont [88], [87], [91], [89], [28], [93], [35, chapitre 6], [60] et
[15].
1.2.1 Cadre stochastique
On désigne par Y la sortie d’un modèle (appelée aussi quantité d’inté-
rêt), fonction (à valeurs réelles) f de p variables (réelles) d’entrée notées
X1, . . . ,Xp :
Y = f(X1, . . . ,Xp).
Dans le contexte des modèles de fluides géophysiques, considérons l’état
du fluide constitué par exemple, en océanographie ou en hydrographie, du
champ de vitesses ~u et la hauteur d’eau h : u = (~u, h)) à un instant t ∈ [0;T ].
Supposons que cet état soit donné par une fonction u = u(x, t,X1, . . . ,Xp)
où x désigne la variable d’espace (x appartient à un domaine Ω, sous-
ensemble compact connexe de R2 ou de R3) et X1, . . . ,Xp sont les paramètres
d’entrée (coefficients de frottement, de viscosité, de viscosité numérique,
ainsi que les paramètres régissant la force exercée par le vent en surface,
l’état initial, l’état au bord, ou la géométrie du domaine Ω). Cette fonction
u est donnée comme solution d’une équation aux dérivées partielles, dé-
pendant des paramètres d’entrée, et traduisant la physique du phénomène
étudié (par exemple, Navier-Stokes ou Saint-Venant). La quantité d’intérêt

20 Chapitre 1.
en sortie du modèle est alors fonction de la variable d’état :
Y = f(X1, . . . ,Xp) = f(u(·, ·,X1, . . . ,Xp)).
Par exemple, Y peut être la hauteur d’eau moyenne (|Ω| désigne l’aire ou le
volume de Ω) :
Y =1
T |Ω|
∫ T
0
∫
Ωh(x, t,X1, . . . ,Xp)dxdt,
ou une quantité plus complexe (car non linéaire en fonction de u), telle que
le premier instant où la hauteur d’eau dépasse un seuil s fixé :
Y = arginft∈[0;T ]
∃x ∈ Ω tel que u(t, x,X1, . . . ,Xp) ≥ s.
Comme précisé en introduction, les paramètres d’entrée du modèle sont im-
parfaitement connus. Pour modéliser cette incertitude sur les entrées, on af-
fecte une loi de probabilité (connue) au p-uplet de paramètres (X1, . . . ,Xp).
Cette loi est déterminée par l’utilisateur, en fonction de sa connaissance
sur l’incertitude associée à chaque paramètre. Par exemple, un paramètre
continu peut suivre une loi uniforme sur un intervalle connu, ou une loi
normale de moyenne et d’écart-type connus. En termes probabilistes, ceci
revient à considérer que (X1, . . . ,Xp) est un vecteur aléatoire. L’incertitude
sur ces entrées se « propage » alors sur la sortie par le biais de la fonc-
tion f , et Y est également vue comme une variable aléatoire, dont la loi (a
priori inconnue) concentre toute l’information sur l’impact de l’incertitude
des paramètres d’entrée.
Par exemple, les deux premiers moments de cette loi (s’ils existent) s’in-
terprètent très facilement : l’espérance de Y est la moyenne pondérée sur
l’ensemble des valeurs possibles du p-uplet de paramètres, tandis que la va-
riance de Y quantifie la dispersion de la sortie autour de cette moyenne,
lorsque tous les paramètres varient suivant la loi qui leur est assignée. Cette
variance est donc une mesure quantitative de l’impact de l’incertitude atta-
chée aux paramètres d’entrée sur la sortie.
Il est alors naturel de chercher à séparer l’impact de l’incertitude sur chacun
des paramètres d’entrée, et de définir, pour chaque paramètre Xi d’entrée
du modèle, un indice quantifiant la dispersion de la sortie qui est seulement
due à la variabilité de Xi. La définition et l’interprétation de ces indices,
qui fait l’objet du paragraphe suivant, constituent l’analyse de sensibilité du
modèle.

INTRODUCTION 21
1.2.2 Indices de sensibilité
Dans cette section, nous supposons que Y est une variable L2(P ), pour une
mesure de probabilité P . Nous supposons que Y est de variance non nulle.
Indices basés sur la corrélation et la régression linéaire.
Les principales mesures d’importance rangées dans cette catégorie sont :
– le coefficient de corrélation linéaire (Pearson) entre Y et Xi :
ρi =Cov(Y,Xi)√
VarY ×VarXi;
– le coefficient de régression standard : on considère l’approximation par
moindres carrés de Y comme une fonction affine des paramètres :
Y = β0 +p∑
j=1
βjXj + ε
où
(β0, . . . , βp) = argmin(α0,...,αp)∈Rp+1
E
Y − α0 −
p∑
j=1
αjXj
2
et
ε = Y − β0 −p∑
j=1
βjXj.
On définit comme indice le coefficient de régression standard de Y sur
Xi :
SRCi = βi
√VarXi
VarY.
Remarquons que ces deux indices coïncident lorsque les Xi sont indépen-
dants.
Ces deux indices ne sont pas interprétables si Y est trop « éloigné » d’une
fonction affine des Xj ([54], p. 11). Dans ce cas, on peut utiliser des régres-
sions sur les rangs (loc. cit.), qui donne lieu à des indices pertinents si (et
seulement si) la relation entre Y et ses paramètres est monotone, ou, tout
au moins, « proche de la monotonicité ». Les indices de Sobol, que nous dé-
crivons ci-après, constituent des mesures de sensibilité qui restent adaptées
dans des cas où Y est une fonction qui n’est ni linéaire, ni monotone des
paramètres.

22 Chapitre 1.
Indices basés sur la variance (indices de Sobol)
Faisons comme hypothèse que les paramètres d’entrée X1, . . . ,Xp sont in-
dépendants. Rappelons également que nous supposons E(Y 2) +∞.
Fixons un paramètre d’entrée Xi, pour i = 1, . . . , p. Rappelons que l’espé-
rance conditionnelle E(Y |Xi) est une variable aléatoire, ne dépendant que
de Xi, qui est la meilleure approximation (au sens L2) de Y parmi toutes les
fonctions de Xi. Sa variance est donc un réel quantifiant la dispersion de (la
meilleure approximation de) Y lorsque seul Xi varie. Plus cette variance est
élevée, plus Xi est « influent » sur la sortie Y , c’est-à-dire que la variation
de Y due à la variation de Xi est grande.
En ramenant cette variance d’espérance conditionnelle sur la variance totale
de Y , on obtient l’indice de Sobol associé à Xi :
Si =Var(E(Y |Xi))
VarY. (1.2.1)
Ces indices ont été proposés et étudiés dans [97]. On peut démontrer que
ces indices sont normalisés, au sens où 0 ≤ Si ≤ 1. Remarquons également
que ces indices étendent les indices basés sur la corrélation, au sens où, si Y
est une fonction affine des paramètres, on a Si = SRC2i .
Il est également possible, étant donné un sous-ensemble de paramètres d’en-
trée u ⊆ 1, . . . , p, de considérer l’indice de Sobol « closed » défini ainsi :
SClu =
Var(E(Y |Xi, i ∈ u))VarY
,
qui quantifie l’influence de la variation des paramètres indexés par u pris
ensemble.
Signalons aussi l’indice total associé à i, défini par :
STi = 1− SCl
1,...,p\i,
qui est une autre mesure de l’influence du paramètre Xi, en incluant l’effet
de ses interactions avec les autres paramètres d’entrée.
Á titre d’exemple, on vérifiera que, pour p = 3, (X1,X2,X3) uniformes sur
[0; 1]3,
Y = X1X2X3
et i = 1, on a :
S1 =937
et ST1 =1637.
INTRODUCTION 23
Au cours de ce travail de thèse, nous nous sommes principalement intéressés
aux indices Si (aussi appelés indices du premier ordre). Néanmoins, certains
de nos résultats peuvent s’étendre directement aux indices d’ordre supérieur
SCl et ST.
Par ailleurs, les indices de Sobol peuvent être définis et estimés dans le cas
où les variables d’entrées sont des processus stochastiques à valeurs dans un
espace de Hilbert séparable [36].
Autres indices de sensibilité
Nous présentons ici quelques autres familles d’indices de sensibilité ; ils se
basent sur d’autres formalisations de la notion de paramètre influent que
celle présentée plus haut.
Indices basés sur la distribution conditionnelle. Les indices de Sobol
définis plus haut n’utilisent que les deux premiers moments des distributions
de Y conditionnées par les paramètres d’entrée. Borgonovo et coauteurs [8, 9]
ont proposé et étudié une mesure de sensibilité faisant intervenir l’intégralité
de ces distributions. Notons fY la densité de Y , et, pour i = 1, . . . , p, fY |Xi
la densité conditionnelle de Y sachant Xi. Si ces deux densités sont « très
éloignées », cela signifie que fixer Xi modifie grandement la distribution de
Y , donc que le paramètre Xi est influent. Quantifions la distance entre ces
densités par une distance L1 en définissant la variable aléatoire s, fonction
de Xi, par :
s(Xi) =∫
R
∣∣∣fY (y)− fY |Xi(y)∣∣∣ dy.
On intègre alors cette distance suivant la loi de Xi pour obtenir l’indice δi :
δi =12E(s(Xi)).
L’indice δi jouit de la même propriété de normalisation que les indices de
Sobol : 0 ≤ δi ≤ 1 ([8], Propriété 1), et se généralise naturellement aux
groupes de variables.
Indices basés sur les dérivées. Indépendamment du cadre stochastique
(ie., la loi de probabilité donnée aux paramètres d’entrées), la dérivée par-
tielle∂f
∂Xi(X1, . . . ,Xp) est un indicateur (signé) de la sensibilité de f à sa
24 Chapitre 1.
ième variable, localement autour de (X1, . . . ,Xp). Sobol et Kucherenko ([99])
intègrent cet indicateur afin d’obtenir une mesure globale de sensibilité :
νi = E
((∂f
∂Xi(X1, . . . ,Xp)
)2).
Il est facile de vérifier que, dans le cas où f est affine, et si les entrées sont in-
dépendantes, on a νi = Si. Dans le cas général, on peut obtenir une inégalité
reliant νi et Si, au prix d’une hypothèse sur la loi des paramètres d’entrée
(qui exclut par exemple les lois uniformes sur des intervalles compacts) (op.
cit. et [63]).
1.2.3 Calcul des indices de Sobol
Nous nous centrons maintenant sur l’aspect pratique du calcul des indices
de Sobol du premier ordre définis en (1.2.1), toujours sous hypothèse d’in-
dépendance des paramètres d’entrée.
Nécessité de l’approximation numérique
Le calcul exact des indices de sensibilité, en particulier celui des indices de
Sobol, n’est pas toujours possible. En effet, les lois des paramètres d’en-
trée, ainsi que l’expression de la sortie du modèle f peuvent être extrême-
ment complexes, et les intégrales exprimant les variances et les variances
d’espérances conditionnelles qui interviennent dans la définition des indices
peuvent s’avérer incalculables analytiquement. Il faut donc avoir recours à
des méthodes d’approximation numérique, qui sont au demeurant suffisantes
pour les applications pratiques décrites au paragraphe précédent.
Présentons maintenant quelques méthodes d’approximation numérique des
indices de Sobol, regroupées en fonction du type de plan d’expériences
qu’elles utilisent. Nous commençons par présenter les estimateurs basés sur
un plan Monte-Carlo pick-freeze, qui sont les estimateurs sur lesquels nous
nous sommes centrés durant cette thèse.
Utilisation d’un plan Monte-Carlo pick-freeze
Nous pouvons réécrire la définition de Si de la manière suivante :
Si =Cov(Y, Y ′)
VarY(1.2.2)

INTRODUCTION 25
pour :
Y ′ = f(X ′1,X
′2, . . . ,X
′i−1,Xi,X
′i+1, . . . ,X
′p),
et où, pour j 6= i, X ′j désigne une variable aléatoire indépendante et de
même loi que Xj .
Cette propriété est démontrée au chapitre 3 (Lemme 1).
Le nom du plan provient de la façon de générer les paramètres d’entrée
utilisés pour calculer Y ′ à partir de ceux utilisés pour calculer Y : la variable
i, qui est la variable choisie (picked), est gelée (frozen) et toutes les autres
sont remplacées par des copies indépendantes et de même loi.
Fixons maintenant N ∈ N∗ et considérons deux échantillons indépendants
identiquement distribués (iid) :(Xk
1 , . . . ,Xkp
)k=1,...,N
et(Xk
1′, . . . ,Xk
p′)k=1,...,N
de la loi de (X1, . . . ,Xp).
Notons maintenant, pour k = 1, . . . , N :
Yk = f(Xk1 , . . . ,X
kp ) et Y ′
k = f(Xk1
′, . . . ,Xki−1
′,Xki ,X
ki+1
′, . . . ,Xkp
′).
En remplaçant dans (1.2.2) les covariances et variances par leurs estimateurs
empiriques, on obtient un premier estimateur naturel de Si :
Si =1N
∑Nk=1 YkY
′k −
(1N
∑Nk=1 Yk
)(1N
∑Nk=1 Y
′k
)
1N
∑Nk=1 Y
2k −
(1N
∑Nk=1 Yk
)2 .
En remarquant que E(Y ) = E(Y ′), on peut aussi remplacer l’estimation
empirique de E(Y ′) par celle de E(Y ) et ainsi obtenir l’estimateur originel-
lement proposé par Sobol dans [98] :
SSobi =
1N
∑Nk=1 YkY
′k −
(1N
∑Nk=1 Yk
)2
1N
∑Nk=1 Y
2k −
(1N
∑Nk=1 Yk
)2 .
Enfin, comme Y et Y ′ ont même loi, on peut estimer E(Y ) et E(Y 2) par :
E =1N
N∑
k=1
Yk + Y ′k
2et E2 =
1N
N∑
k=1
Y 2k + Y ′2
k
2,
ce qui donne lieu à un troisième estimateur, proposé dans [68] :
Ti =1N
∑Nk=1 YkY
′k − E2
E2 − E2.

26 Chapitre 1.
Ces trois estimateurs peuvent donner une valeur approchée de l’indice de
Sobol Si à partir de 2N évaluations de la fonction donnant la sortie du
modèle f , et l’on peut estimer les p indices du premier ordre S1, . . . , Sp à
l’aide de N(p+ 1) évaluations de f .
Remarquons que tous ces estimateurs peuvent être utilisés en utilisant un
échantillonnage déterministe de la loi de X (suites à discrépance faible) ou
un échantillonnage aléatoire mais non iid (par exemple, un échantillonnage
par hypercubes latins étudié dans [104]). Cependant, l’étude théorique des
propriétés de Si et de Ti que nous ferons au Chapitre 3 repose sur le fait
que le plan d’expérience soit aléatoire et iid.
L’écriture (1.2.2) permet également d’exprimer Si à l’aide d’intégrales dans
l’espace des paramètres d’entrée, qui peuvent être estimées à l’aide d’une
méthode usuelle de quadrature multidimensionnelle, telle la méthode de
Smolyak (grille creuse, sparse grid), voir [37] pour des généralités sur cette
méthode et [14] pour l’application au calcul des indices de Sobol.
Enfin, notons que la propriété (1.2.2) se généralise aux indices closed :
SClu =
Cov(Y, Y u)VarY
où Y u = f(Xu), où la jème composante de Xu ∈ Rp est donnée par :
Xuj =
X ′j si j /∈ u
Xj si j ∈ u.
Cette égalité permet d’utiliser les estimateurs présentés plus haut pour es-
timer SClu , il suffit de remplacer l’échantillon
Y ′k
par un échantillon iid. de
la loi de Y u. Par complément à 1, les indices totaux STi peuvent également
être estimés.
Dans ce travail, nous nous sommes centrés sur l’étude des estimateurs basés
sur un plan Monte-Carlo pick-freeze. Donnons cependant quelques autres
estimateurs.
Utilisation d’un plan Monte-Carlo pick-freeze répliqué
En reprenant les notations du paragraphe précédent, notons :
Y ′′ = f(X ′1, . . . ,X
′p) et Y ′′
k = f(Xk1
′, . . . ,Xkp
′).
On rajoute donc au plan d’expérience pick-freeze utilisé plus haut les « répli-
cations » indépendantes issues de l’échantillon primé(Xk
1′, . . . ,Xk
p′)
k=1,...,N.

INTRODUCTION 27
Comme Y et Y ′′ sont indépendants, le numérateur de Si peut se réécrire :
Cov(Y, Y ′) = E(Y Y ′)− E(Y )2 = E(Y (Y ′ − Y ′′)),
comme noté dans [99], §4.
Cela donne lieu à un nouvel estimateur empirique de Si :
SRi =
1N
∑Nk=1 Yk(Y
′k − Y ′′
k )
1N
∑Nk=1 Y
2k −
(1N
∑Nk=1 Yk
)2 .
Comparé à l’estimateur de Sobol original SSob, cet estimateur nécessite un
plan d’expérience de plus grande taille (3N au lieu de 2N) mais il s’est avéré
plus précis sur certains cas tests (voir loc. cit.), lorsque l’indice à estimer est
de « faible » valeur.
Utilisation d’un plan basé sur l’analyse harmonique (FAST et variantes)
Décrivons maintenant la méthode FAST (Fourier Amplitude Sensitivity Test),
telle que proposée dans [22, 24, 23] et présentée dans une plus grande géné-
ralité dans [106].
Commençons par supposer que X = (X1, . . . ,Xp) suit une loi uniforme sur
[0; 1]p. Lorsque les paramètres d’entrée sont indépendants, il est toujours
possible (au moins en théorie) de se ramener à ce cas, par composition avec
la fonction de répartition vectorielle F : Rp → [0; 1]p donnée par :
F (x1, . . . , xp) = (P (X1 ≤ x1), . . . , P (Xp ≤ xp)).
Pour tout p-uplet k ∈ Zp, notons ck(f) le kème coefficient de Fourier de f ,
donné par :
ck(f) =∫
[0;1]pf(X) exp(−2iπX · k)dX.
Pour tout i = 1, . . . , p, le ième indice de Sobol s’exprime en fonction des
coefficients de Fourier :
Si =∑l∈Z∗ |clδi
(f)|2∑k∈Zd,k 6=0 |ck(f)|2
, (1.2.3)
où δi est le vecteur de Zp dont la jème composante vaut :
(δi)j =
1 si i = j,
0 sinon.

28 Chapitre 1.
Choisissons un vecteur de fréquences ω = (ω1, . . . , ωp) ∈ Np, et notons x(t)
le vecteur de Rp dont la jème composante est donnée par :
(x(t))j =1π
arcsin(sin(ωjt)) +12.
Notons, pour l ∈ Z :
cErgl (f) =
∫ 1
0f x(t) exp(−2iπlt)dt.
Les auteurs de FAST proposent l’approximation suivante des coefficients de
Fourier de f :
ck(f) ≈ cErgk·ω (f),
où k · ω est le produit scalaire Euclidien de k avec ω.
Cette approximation, qui permet de remplacer une intégrale p-dimensionnelle
par une intégrale unidimensionnelle, est basée sur le théorème ergodique de
Weyl [114], et n’est pertinente que si le vecteur ω est bien choisi, par exemple
à l’aide du critère d’absence d’interférences donné dans [22].
L’étape suivante est d’approcher l’intégrale apparaissant dans cErgl (f) par la
méthode des rectangles à N > 0 points, ce qui donne lieu à l’approximation
de cErgl (f) :
cFASTl (f) =
1n
N−1∑
j=0
f x(j
N
)exp
(−2iπl
j
N
).
Enfin, les sommes apparaissant dans (1.2.3) sont tronquées, ce qui donne
l’approximation SFASTi suivante :
SFASTi =
∑n−1k=1
∣∣∣cFASTkωi
(f)∣∣∣2
∑n−1l=1
∣∣cFASTl (f)
∣∣2 .
La méthode FAST a été ensuite étendue en méthode EFAST, afin de per-
mettre l’estimation des indices totaux ([90]), puis hybridée avec la méthode
RBD (random balanced design), ce qui a donné la méthode RBD-FAST
[103]. Ces méthodes ont récemment fait l’objet de diverses généralisations
avec analyse d’erreur dans [106]. Une autre analyse d’erreur de la méthode
FAST est proposée dans [117].

INTRODUCTION 29
Utilisation d’une décomposition en polynômes de chaos
Notre référence dans cette section est [38].
Nous supposons cette fois-ci que le vecteur d’entrées X = (X1, . . . ,Xp)
suit une loi normale multivariée Np(0, Ip), où Ip désigne la matrice identité
d’ordre p.
Polynômes de chaos. Nous introduisons la famille de polynômes ortho-
gonaux de Hermite (ψn)n∈N, tels que degψn = n, et
∫
R
ψn(x)ψm(x)w(x)dx =
1 si n = m
0 sinon
pour tous n et m entiers, où la fonction de poids w(x) =1√2π
exp
(−x
2
2
)
est la densité d’une variable aléatoire normale centrée réduite.
Etant donné un multi-indice i = (i1, . . . , ip) ∈ Np, on note :
ψi(X) = ψi1(x1) · · ·ψid(xp) (1.2.4)
le polynôme de Hermite à p variables d’ordre i.
Comme Y ∈ L2(Ω) est X-mesurable, le théorème de Cameron-Martin [16]
affirme que Y peut s’écrire sous la forme d’une décomposition en polynômes
de chaos (de Hermite) :
Y =∑
i∈Np
yiψi (X) (1.2.5)
pour une collection infinie de réels (yi)i∈Np appelés coefficients de Y dans
sa décomposition en polynômes de chaos, la sommation sur le multi-indice
i étant convergente dans L2.
Lien avec les indices de Sobol [21, 102]. L’intérêt de la décomposition en
polynômes de chaos est que les indices de Sobol peuvent s’exprimer en fonc-
tion des coefficients de Y dans cette décomposition, à l’aide d’une formule
très similaire à celle utilisée pour la méthode FAST :
Si =
∑∞j=1 y
2I(j,i)∑
j∈Np,j 6=0 y2j
, (1.2.6)
où :
I(j, i) = (0, . . . , 0︸ ︷︷ ︸i−1
, j, 0, . . . , 0︸ ︷︷ ︸p−i
)

30 Chapitre 1.
est le multi-indice de Np contenant j à la ième place, et 0 aux autres places.
Le lien entre cette formule et la méthode FAST est précisé dans [106], l’idée
sous-jacente étant l’utilisation de la tensorisation d’une base orthonormée
de L2(PXi).
Pour être évaluées numériquement, les sommes de (1.2.6) doivent être tron-
quées à un ordre P ∈ N∗ :
Si ≈∑Pj=1 y
2I(j,i)∑
j∈Np,0<|j|≤P y2j
, (1.2.7)
où, pour un multi-indice j = (j1, . . . , jp) ∈ Np,
|j| = j1 + . . .+ jp.
Tout revient donc à approcher les(p+ P )!p!P !
− 1 coefficients yj (pour 0 <
|j| < P ) par yj, ce qui donne lieu à l’approximation de Si par SPCi définie
par :
SPCi =
∑Pj=1 y
2I(j,i)∑
j∈Np,0<|j|≤P y2j
.
Les paragraphes suivants sont consacrés à trois méthodes de calcul des yj.
Calcul par projection. Les propriétés d’orthogonalité des polynômes de
Hermite permettent d’écrire :
∀j ∈ Np, yj =∫
RpY ψjwd,
et cette intégrale multi-dimensionnelle peut ensuite être approchée par di-
verses méthodes de quadrature, tant déterministes que stochastiques (Monte-
Carlo).
Calcul par régression. Dans l’approche par régression, présentée dans
[102], on se donne un plan d’expérience Ξ =X(1), . . . ,X(N)
⊂ Rd, on
calcule les sorties du modèle sur ce plan : Y (X(1)), . . . , Y (X(N)), puis on
estime les coefficients de la décomposition en polynômes de chaos tronquée
par moindres carrés :
(yi)i∈Nd,|i|≤P = argmin(zi)
i∈Nd,|i|≤P
N∑
n=1
Y
(X(n)
)−∑
|i|≤Pziψi
(X(n)
)
2
(1.2.8)

INTRODUCTION 31
Pour que ce problème soit bien posé, la taille du plan d’expérience (N) doit
être supérieure ou égale au nombre de coefficients à estimer. Lorsque ces
deux quantités sont égales, la régression est une interpolation et la méthode
porte alors le nom de collocation.
Pour le choix du plan d’expérience, [102] contient des stratégies basées sur
les racines de polynômes de Hermite.
Le problème (1.2.8) peut également être rendu bien posé lorsque le plan
d’expérience contient moins de points que de coefficients à estimer par une
méthode de régularisation L1. Ceci est intéressant car le nombre de coeffi-
cients à estimer croît rapidement avec le nombre d’entrées p et l’ordre de
troncature P . On peut ainsi être amené à résoudre (1.2.8) avec la contrainte
supplémentaire : ∑
i∈Nd,|i|≤P|zi| ≤ s (1.2.9)
où s est un paramètre de régularisation à choisir. Plus s est petit, et plus
les solutions sont « creuses » (c’est à dire que beaucoup des yi estimés sont
nuls). Ce problème de moindres carrés contraints peut être résolu à l’aide
d’un algorithme Least Angle Regression [7].
Calcul par une méthode intrusive. Par rapport aux autres méthodes
présentées, qui traitaient le modèle comme une boîte noire à laquelle on peut
faire appel pour obtenir les sorties évaluées sur différents jeux de paramètres
d’entrée, les méthodes intrusives type Galerkin font des hypothèses fortes
sur le « type » de sortie considérée.
Nous esquissons seulement le principe de la méthode, et renvoyons à [38] et
[29] pour plus de détails.
Dans cette approche, on suppose que Y est une fonctionnelle φ d’une fonction
u = u(·,X) satisfaisant une équation aux dérivées partielles possédant de
“bonnes propriétés” (par exemple, l’ellipticité et la linéarité). L’idée consiste
à injecter la décomposition de u en polynômes de chaos :
u(·,X) =∑
j∈Np
uj(·)ψj(X)
dans l’équation aux dérivées partielles afin d’écrire un système (infini) d’EDP
portant sur les fonctions uj. Ce système est alors tronqué afin de ne conserver
qu’un nombre fini de uj(·) à calculer ; puis le système d’EDP obtenu est dis-
crétisé afin d’obtenir un système fini d’équations portant sur des inconnues
réelles.

32 Chapitre 1.
La résolution de ce système permet dans certains cas (le cas le plus simple
étant le cas où φ est linéaire) d’estimer les coefficients de la décomposition
en polynômes de chaos de Y .
Signalons que le système fini d’équations à résoudre se révèle être souvent
de grande taille, et que des méthodes spécifiques de réduction de dimension,
telle que la décomposition spectrale généralisée (GSD) [74] peuvent être
utilisées afin d’accélérer sa résolution numérique.
Terminons cette section en citant une autre méthode d’estimation des indices
de Sobol, qui est présentée et étudiée dans [25] ; l’étude de ces estimateurs
faisant appel à des outils développés dans [64] pour l’estimation d’intégrales
de fonctionnelles d’une densité.
1.2.4 Évaluation de l’erreur d’estimation par Monte-Carlo
L’utilisation d’une approximation numérique pose naturellement la question
de la précision de cette approximation. Lorsqu’un plan d’expérience aléatoire
est utilisé (plan Monte-Carlo), il est traditionnel en statistique de chercher
un intervalle de confiance pour la quantité à estimer.
Un tel intervalle de confiance peut être obtenu de deux façons : par bootstrap
ou en utilisant un résultat de normalité asymptotique.
Intervalles de confiance par bootstrap
Rappelons le principe du bootstrap expliqué dans [33].
Soit un estimateur U d’une quantité U inconnue, fonction de la distribution
d’une population P. Cet estimateur est fonction d’un échantillon de taille
N noté (Z1, . . . , ZN ) :
U = U(Z1, . . . , ZN ).
Dans notre contexte, on a U ∈ Si, Ti, SSobi , SR
i , et Zi = (Yi, Y ′i , Y
′′i ) lorsque
U = SRi (cas d’un plan pick-freeze répliqué), ou Zi = (Yi, Y ′
i ) sinon (cas
d’un plan pick-freeze). L’utilisation du bootstrap dans le cadre du calcul des
indices de Sobol a été considérée, sous un angle pratique, dans [1].
Une estimation ponctuelle de U est obtenue en tirant aléatoirement un
échantillon (z1, . . . , zN ) par N tirages indépendants dans P, et en calcu-
lant u = U(z1, . . . , zN ).
Le principe du bootstrap est de fixer un nombreR de réplications, et de tirer,
pour r = 1, . . . , R, de manière équiprobable et avec remise dans (z1, . . . , zN )

INTRODUCTION 33
un N -échantillon (zi∗1 , zi∗2 , . . . , z
i∗N ). On obtient alors la rème réplication de
U , notée ur∗ :
ur∗ = U(zi∗1 , zi∗2 , . . . , z
i∗N ).
Il existe alors plusieurs variantes du bootstrap, qui diffèrent dans la façon
de passer de l’ensemble :
R = u1∗, . . . , uR∗
de réplications de U à un intervalle de confiance de risque α ∈]0; 1[ pour U .
Les deux premières variantes que nous décrivons sont données dans [33].
Bootstrap classique (vanilla). On prend comme intervalle de confiance
approché au niveau 1− α l’intervalle dont les extrémités sont les quantiles
α/2 et 1− α/2 de R.
Bootstrap avec approximation gaussienne. On approxime les quantiles
α/2 et 1 − α/2 de R respectivement par m − qασ et m + qασ, où m et σ
désignent resp. la moyenne et l’écart-type de R, et qα est le quantile 1−α/2d’une loi normale centrée réduite.
Le bootstrap classique ou avec approximation gaussienne peuvent mal fonc-
tionner dans le cas où l’estimateur U est biaisé. Pour pallier ce défaut, il a
été proposé [31, 32] la méthode suivante de bootstrap, appelée bias-corrected
bootstrap (BC bootstrap).
Bootstrap avec correction de biais. Notons Φ la fonction de répartition
de la loi normale centrée réduite :
Φ(z) =1√2π
∫ z
−∞exp
(− t
2
2
)dt,
et Φ−1 son inverse.
En utilisant R et l’estimée ponctuelle u = U(z1, . . . , zN ), on estime une
« constante de correction de biais » z0 :
z0 = Φ−1(
#u∗ ∈ R tels que u∗ ≤ uR
).
Puis, pour β ∈]0; 1[, on définit l’« estimateur de quantile corrigé » par :
q(β) = Φ(2z0 + zβ)

34 Chapitre 1.
où zβ = Φ−1(β).
L’intervalle de confiance fourni par cette méthode est alors l’intervalle dont
les extrémités sont les quantiles q(α/2) et q(1− α/2) de R.
Les intervalles de confiance construits par cette méthode sont robustes au
biais et à la non-normalité de U . Plus précisément, cette construction est
justifiée dans [31] dans le cas où il existe une fonction croissante g, z0 ∈ R
et σ > 0 tels que :
g(U ) L= N (U − z0σ, σ2) et g(U∗) L= N (u− z0σ, σ
2),
oùN (m,σ2) désigne la loi normale de moyenne m et de variance σ2, et U∗ est
l’estimateur U bootstrappé, à échantillon z1, . . . , zn et estimée ponctuelle
u fixée, c’est-à-dire que :
U∗ = U(Z∗1 , . . . , Z
∗N ),
pour (Z∗1 , . . . , Z
∗N ) un échantillon iid. de la loi équirépartie sur (z1, . . . , zN )
(en d’autres termes, les réplications u1∗, u2∗, . . . , uR∗ sont R réalisations iid.
de U∗).
Dans la pratique, la fonction g nous semble difficile à expliciter ; par contre,
l’observation du diagramme quantile-quantile (QQ plot) de l’échantillon de
réplications R permet de valider empiriquement l’existence d’une telle fonc-
tion g.
L’avantage d’une méthode de bootstrap provient de sa nature algorithmique
et de sa mise en oeuvre possible pour tout estimateur, même ayant une
expression complexe en fonction de l’échantillon. Cependant, même si son
utilisation en pratique donne de bons résultats, la justification théorique de
son utilisation est délicate. De plus, le bootstrap ne donne pas d’expression
analytique de la largeur des intervalles de confiance obtenus (indicateur de
la précision de l’estimation ponctuelle), qui soit exploitable dans le but de
comparer en général (indépendemment d’exemples numériques) la précision
de plusieurs estimateurs de la même quantité. Ces deux points justifient
l’utilisation d’intervalles de confiance obtenus par normalité asymptotique,
que nous décrivons maintenant.
Intervalles de confiance par normalité asymptotique
On dit qu’une suite d’estimateurs (UN )N convergeant presque sûrement vers
une valeur U , possède la propriété de normalité asymptotique s’il existe des

INTRODUCTION 35
réels strictement positifs γ et σ2, appelés respectivement vitesse de conver-
gence et variance asymptotique, tels qu’on ait la convergence suivante en
loi :
Nγ(UN − U) L−→N→∞
N (0, σ2)
où N (0, σ2) désigne la loi normale centrée de variance σ2.
Dans notre contexte d’estimation des indices de Sobol, on a U = Si et la
suite d’estimateurs est la suite, indexée par la taille de l’échantillon, donnée
par l’expression de Si, Ti, SSobi ou SR
i .
Étant donné un niveau de risque α ∈]0; 1[, un intervalle de confiance asymp-
totique au niveau 1− α est donné par :
IN,α =]UN − qα
σ
Nγ; UN + qα
σ
Nγ
[,
où qα est, comme précédemment, le quantile 1−α/2 d’une loi normale centrée
réduite.
Cet intervalle est justifié asymptotiquement par le fait que, par définition
de la convergence en loi :
P (IN,α ∋ U) −→N→∞
1− α. (1.2.10)
En pratique, σ n’est pas calculable analytiquement, mais peut s’estimer, à
partir du même plan d’expérience et de manière consistante, par une suite
σ2N , ce qui donne l’intervalle de confiance asymptotique suivant :
IN,α =]UN − qα
σNNγ
; UN + qασNNγ
[,
qui satisfait également la propriété (1.2.10).
Les propriétés de normalité asymptotique pour Si et Ti sont établies dans
le Chapitre 3, Proposition 6.
1.3 Introduction à la métamodélisation
Dans cette section, nous décrivons en détails les principes de trois méthodes
de métamodélisation. Rappelons que le but de ces méthodes est de four-
nir des algorithmes de construction d’une fonction f approchant le modèle
numérique à étudier f tout en étant plus rapide à évaluer numériquement
que celui-ci. Nous faisons également, en lien avec l’objet de cette thèse, une
présentation de l’analyse de l’erreur entre f et f .
Nous présentons les méthodes suivantes :

36 Chapitre 1.
– le krigeage (1.3.1) ;
– l’interpolation à noyau (1.3.2) ;
– la méthode base réduite (1.3.3).
Signalons qu’il existe d’autres méthodes de métamodélisation que celles pré-
sentées ici. On en trouvera un aperçu dans le chapitre 5 de [35].
1.3.1 Métamodélisation par krigeage
Le krigeage, aussi appelé métamodélisation par processus gaussiens est une
méthode de construction d’un métamodèle apparue dans [67]. Nous allons
maintenant présenter cette méthode, en renvoyant à [93], [75] §3.1, [60] pour
les détails.
L’hypothèse centrale du krigeage est de supposer que f est une réalisation
d’un processus gaussien défini sur un espace probabilisé (Ω, PΩ) :
∃ω∗ ∈ Ω, f(·) = Z(·, ω∗), (1.3.1)
où Z est un processus gaussien, i.e. pour tous k ∈ N et pour tous(x1, . . . , xk
)∈ (Rp)k ,
le vecteur :
(Z(x1), . . . , Z(xk))
suit, sous PΩ, une loi gaussienne en dimension k.
On choisit souvent comme espérance de Z une fonction affine :
∀x = (x1, . . . , xp), EΩ(Z(x)) = m(x) = β0 + β1x1 + . . .+ βpxp,
et comme fonction de covariance de Z un produit de puissances d’exponen-
tielles :
∀x = (x1, . . . , xp),∀x′ = (x′1, . . . , x
′p)
CovΩ(Z(x), Z(x′)) = R(x, x′) = σ2p∏
j=1
exp(−θj
∣∣∣xj − x′j
∣∣∣αj),
dépendants de Θ = (β0, . . . , βp, θ1, . . . , θp, σ) ∈ Rp+1 × (R∗+)p+1 et de α =
(α1, . . . , αp).
On suppose qu’on connaît un n-échantillon de sorties du (vrai) modèle,
constituant notre échantillon d’apprentissage :
D = (x1, f(x1)), . . . , (xn, f(xn)),

INTRODUCTION 37
et on prend comme métamodèle :
f(x) = EΩ
(Z(x)
∣∣Z(x1) = f(x1), . . . , Z(xn) = f(xn)). (1.3.2)
Compte tenu de l’hypothèse de processus gaussien, cette espérance condi-
tionnelle admet une expression analytique :
f(x) = m(x) + kD(x)tΣ−1D yD, (1.3.3)
où :
kD(x) =(R(x, x1), . . . , R(x, xn)
)t ∈ Rn,
yD(x) =(f(x1)−m(x1), . . . , f(xn)−m(xn)
)t ∈ Rn,
et ΣD est une matrice symétrique n × n dont le coefficient (k, l) est donné
par :
(ΣD)k,l = R(xk, xl).
En pratique, on ne connaît ni le vecteur α d’exposants, ni le vecteur Θ.
Généralement, le choix de α est fait a priori (par exemple α = (1, . . . , 1)
ou α = (2, . . . , 2)), puis on estime Θ à partir de D, par exemple à l’aide du
principe de maximum de vraisemblance :
Θ = argmaxΘ∈Rp+1×R
p+1
+
pΘ(f(x1), . . . , f(xn)),
où pΘ désigne la densité, sous PΩ, du vecteur gaussien (Z(x1), . . . , Z(xn)).
La métamodélisation par krigeage admet une interprétation élégante dans
un cadre bayésien : l’hypothèse (1.3.1) s’interprète comme une loi a priori
sur la fonction f (inconnue) qui impose à f d’être lisse (les propriétés de
dérivabilité d’un champ gaussien dépendant de sa fonction de covariance, cf.
Theorème 2.2.1 de [56]). Les observations sont les éléments de l’échantillon
d’apprentissage, et la loi a posteriori, loi du processus Z conditionnée par
les observations, peut être identifiée explicitement [113] comme la loi d’un
processus gaussien ayant comme espérance f et fonction de covariance :
CovΩ
(Z(x), Z(x′)
∣∣Z(x1) = f(x1), . . . , Z(xn) = f(xn))
= R(x, x′)− kD(x)tΣ−1D kD(x′).
Dans ce contexte, le métamodèle f est l’estimateur bayésien du maximum
a posteriori, et Θ forme le vecteur des hyperparamètres. L’utilisation des

38 Chapitre 1.
hyperparamètres par maximum de vraisemblance qualifie donc la méthode
décrite plus haut de méthode bayésienne empirique (empirical Bayes).
Remarquons enfin que l’on peut prendre comme métamodèle l’espérance de
Z conditionnée non seulement par l’échantillon d’apprentissage, mais aussi
par des informations connues a priori sur le modèle, par exemple la posi-
tivité, la monotonie, la convexité, les extrema [26]. Un tel conditionnement
augmenté permet souvent d’améliorer les performances du krigeage, à taille
d’échantillon d’apprentissage égale.
1.3.2 Métamodélisation par interpolation à noyau
La motivation et l’étude des métamodèles par interpolation à noyau se fait
dans le contexte des espaces de Hilbert à noyau reproduisant (appelés RKHS,
pour reproducing kernel Hilbert space). Commençons par présenter ces es-
paces.
Espaces de Hilbert à noyau reproduisant
Soit (H, 〈·, ·〉H , ‖·‖H) un espace de Hilbert contenu dans l’ensemble des fonc-
tions définies sur X ⊂ Rp à valeurs réelles. On dit que H est un RKHS si,
quel que soit x ∈ X , la forme linéaire d’évaluation en x :
δx : H → R, f 7→ f(x)
est continue pour ‖·‖H.
L’application du théorème de représentation de Riesz donne l’existence d’un
noyau reproduisant K : X × X → R tel que :
∀f ∈ H, ∀x ∈ X , f(x) = 〈f,K(x, ·)〉H ,
qui satisfait de plus la propriété de symétrie :
∀(x, y) ∈ X × X , K(x, y) = K(y, x)
et de définie positivité :
∀k ∈ N, (α1, . . . , αk) ∈ Rk,∀x1, . . . , xk ∈ X ,k∑
i=1
k∑
j=1
αiαjK(xi, xj) ≥ 0,
avec égalité si et seulement si αi = 0∀i = 1, . . . , k.

INTRODUCTION 39
La réciproque de ce résultat constitue le théorème de Moore-Aronszajn [2] :
pour tout noyau symétrique défini positif K, il existe un unique RKHS
H dont K est le noyau reproduisant. Cet espace est construit comme la
complétion de :
H =⋃
n∈N
f : X → R ; ∃x1, . . . , xn ∈ X , α1, . . . , αn ∈ R
tel que f =n∑
i=1
αiK(xi, ·),
pour la norme induite par le produit scalaire :⟨
n∑
i=1
αiK(xi, ·),n∑
i=1
α′iK(x′
i, ·)⟩
H=
n∑
i=1
n∑
j=1
αiα′jK(xi, x′
j).
Interpolation à noyau
Soit f appartenant à un RKHS H, dont le noyau reproduisant est noté K
et x1, . . . , xn ∈ X . On définit f comme le projeté orthogonal de f sur le
sous-espace :
Hx1,...,xn = VectK(x1, ·), . . . ,K(xn, ·)
.
On a alors ([5], Proposition 2.7) que f est l’interpolateur de f de norme
minimale, c’est-à-dire que f est solution de :
argming∈Hx1,...,xn
‖g‖H
sous les contraintes :
g(xi) = f(xi) ∀i = 1, . . . , n.
De plus, on a l’expression suivante pour f :
∀x ∈ Rp, f(x) = ytΣ−1u(x)
où :
y =(f(x1), . . . , f(xn)
)t,
u(x) =(K(x1, x), . . . ,K(xn, x)
)t,
et Σ est la matrice symétrique d’ordre n dont le coefficient (i, j) vaut :
Σi,j = K(xi, xj).

40 Chapitre 1.
La comparaison avec (1.3.3) fait apparaître que, au niveau de la définition
du métamodèle, l’interpolation par un noyau K est équivalente à un krigeage
dont la fonction de covariance est K. L’étude approfondie du lien entre ces
deux méthodes est faite dans [95]. Cependant, les interprétations du méta-
modèle f (comme espérance conditionnelle ou comme projeté orthogonal)
diffèrent, tout comme les hypothèses de validité du métamodèle : réalisation
d’un processus gaussien (1.3.1) dans un cas, et appartenance à un RKHS
dans l’autre). À ce titre, signalons que cette dernière hypothèse est aisée
à vérifier dans certains cas, grâce au Théorème 1 de [95], qui donne des
conditions suffisantes sur K pour que le RKHS associé à K soit un espace
de Sobolev. Dans de tels cas, l’hypothèse d’appartenance au RKHS peut se
vérifier en testant simplement l’intégrabilité des carrés des dérivées partielles
de f .
Dans la pratique, l’espace H sous-jacent à l’interpolateur est donné à partir
du noyau K, choisi en fonction de la régularité de la fonction à estimer ;
ainsi le noyau peut être par exemple de type exponentiel :
K(x, x′) =p∏
j=1
exp(−θj
∣∣∣xj − x′j
∣∣∣αj),
pour des paramètres θ1, . . . , θp, α1, . . . , αp fixés.
Certains choix de noyaux permettent également de traduire des proprié-
tés du modèle, et ainsi d’améliorer les performances de l’interpolation :
par exemple, utilisation d’une propriété de moyenne nulle [30], ou du faible
nombre d’interactions entre les variables d’entrée [70].
Toujours sur un plan pratique, le calcul de f(x) pour un x ∈ X nécessite
seulement d’avoir à disposition un échantillon d’apprentissage :
(x1, f(x1)), . . . , (xn, f(xn)),
qui peut être construit à l’aide de n évaluations de f .
Analyse d’erreur
Soit x ∈ X , on a :
∣∣∣f(x)− f(x)∣∣∣ =
∣∣∣∣∣〈f,K(x, ·)〉H −n∑
i=1
⟨f,K(xi, ·)
(Σ−1u(x)
)i
⟩H
∣∣∣∣∣
≤ ‖f‖H
∥∥∥∥∥K(x, ·)−n∑
i=1
K(xi, ·)(
Σ−1u(x))i
∥∥∥∥∥H

INTRODUCTION 41
par l’inégalité de Cauchy-Schwarz.
De plus,
∥∥∥∥∥K(x, ·)−n∑
i=1
K(xi, ·)(
Σ−1u(x))i
∥∥∥∥∥
2
H=
∥∥∥K(x, ·)− u(·)tΣ−1u(x)∥∥∥
2
H
= 〈K(x, ·),K(x, ·)〉H−2⟨K(x, ·), u(·)tΣ−1u(x)
⟩H
+⟨u(·)tΣ−1u(x), u(·)tΣ−1u(x)
⟩H
= K(x, x)− 2u(x)tΣ−1u(x)
+∑
1≤i,j≤nK(xi, xj)
(Σ−1u(x)
)i
(Σ−1u(x)
)j
= K(x, x)− 2u(x)tΣ−1u(x)
+(Σ−1u(x))tΣ(Σ−1u(x))
= K(x, x)− 2u(x)tΣ−1u(x)
+u(x)tΣ−1u(x)
= K(x, x)− u(x)tΣ−1u(x).
On a donc la majoration d’erreur suivante :
∀x ∈ X ,∣∣∣f(x)− f(x)
∣∣∣ ≤ ‖f‖H√K(x, x)− u(x)tΣ−1u(x)
Faisons plusieurs remarques :
– La borne d’erreur est proportionnelle à la norme de f dans H.
Signalons que, pour les noyaux invariants par translation, c’est-à-dire les
noyaux K tels qu’il existe une fonction k : Rp → R telle que :
∀x, x′ ∈ X , K(x, x′) = k(x− x′),
la norme ‖·‖H peut être reliée aux coefficients de Fourier de f (plus ces co-
efficients décroissent lentement, plus ‖f‖H est grande [5, Théorème 2.6]),
cette norme est donc d’autant plus élevée que f est « oscillante ». Toutes
choses égales par ailleurs, l’interpolation (en tous cas la borne d’erreur) est
donc moins bonne pour une fonction très oscillante, ce qui est conforme à
l’intuition.
– L’autre terme de la borne :
πx1,...,xn(x) =√K(x, x)− u(x)tΣ−1u(x)

42 Chapitre 1.
s’appelle fonction puissance et ne dépend pas de la fonction à évaluer.
Il est calculable numériquement. Ceci fait qu’il suffit de connaître ‖f‖Hpour pouvoir calculer cette borne.
Lorsque cette norme n’est pas connue, nous avons proposé (chapitre 2,
section 2.5) de l’évaluer à partir d’un second échantillon d’apprentissage
de taille nτ : (x1τ , f(x1
τ )), . . . , (xnτ
τ , f(xnττ ))
en utilisant :
‖f‖H = maxi=1,...,nτ
f(xiτ )− f(xiτ )πx1,...,xn(xiτ )
.
On obtient ainsi un indicateur ponctuel explicitement calculable de l’er-
reur métamodèle.
– Par ailleurs, [65] donne, sous des conditions de régularité de f , de K, de
X et du plan d’expérience utilisé pour x1, . . . , xn, une majoration de la
vitesse de décroissance de πx1,...,xn(x) en fonction de n. Cette majoration
est de la forme :
πx1,...,xn(x) ≤ Ce−K/h
où C et K sont des constantes, et :
h = supz∈X
[min
i=1,...,n
∥∥∥xi − z∥∥∥]
pour une norme ‖·‖ sur X .
Le nombre h est relié au nombre de points n∗(ε) d’un ε-recouvrement de
X :
n∗(ε) = minm ∈ N∗ | ∃(z1, . . . , zk) ∈ X t.q.
∀z ∈ X ,∃i ∈ 1, . . . , k t.q. ‖z − zi‖ ≤ ε.
En d’autres termes, n∗(ε), connu sous le nombre de recouvrement de X ,
est le nombre minimal d’éléments d’un ensemble E tel que tout point de
X soit à distance inférieure à ε d’un point de E.
On peut démontrer que lorsque X est un compact de Rp, il existe deux
constantes A et B telles que :
Aε−p ≤ n∗(ε) ≤ Bε−p.
Ainsi, en supposant que le plan d’expérience x1, . . . , xn soit choisi opti-
malement, nous avons, pour une constante B′ :
h ≤ B′n−1/p.

INTRODUCTION 43
Cette majoration a priori de l’erreur sera utilisée en section 3.4.4 afin
d’illustrer les résultats du chapitre 3.
1.3.3 Métamodélisation par base réduite
Contexte et hypothèses
Contrairement aux deux autres méthodes de métamodélisation présentées
plus haut, la méthode base réduite, que nous décrivons dans cette section,
est une méthode intrusive, ce qui signifie qu’elle fait des hypothèses fortes sur
la structure de la sortie et du modèle à réduire. Les hypothèses nécessaires
à cette méthode, telle que nous allons la présenter, sont les suivantes :
1. On suppose que la sortie f est une fonction d’une variable d’état dé-
pendante des paramètres d’entrée u = u(X) ; en d’autres termes on
a :
f(X) = f(u(X)).
2. On suppose que :
∀X, u(X) ∈ H,
où H est un espace de Hilbert de dimension finie ; typiquement, H est
la discrétisation d’un espace fonctionnel (par exemple, H est un espace
éléments finis P1).
3. On suppose que la variable d’état u = u(X) est solution d’un problème
variationnel linéaire sur H :
∀X, a(u(X), v;X) = ψ(v), ∀v ∈ H (1.3.4)
où a(·, ·;X) et ψ sont, respectivement, une forme bilinéaire symétrique
et une forme linéaire sur H.
Ce problème variationnel est, de manière typique, la discrétisation de
la forme faible d’une équation aux dérivées partielles.
4. On suppose que la forme bilinéaire a(·, ·,X) est coercive :
∀X, ∃α(X) tel que a(u, v,X) ≥ α(X) ‖u‖ ‖v‖ ∀u, v ∈ H. (1.3.5)
5. On suppose que la dépendance en X de a peut se paramétriser sous
forme dite affine, c’est à dire qu’il existe Q ∈ N, des fonctions Θ1, . . . ,ΘQ,

44 Chapitre 1.
à valeurs réelles, et des formes bilinéaires a1, . . . , aQ indépendantes de
X, telles que :
∀X, a(·, ·;X) =Q∑
q=1
Θq(X)aq(·, ·).
Certaines de ces hypothèses peuvent être relaxées. Par exemple, la méthode
base réduite a été étendue à des problèmes variationnels non linéaires et/ou
comportant une dimension temporelle (tels que les équations linéaires para-
boliques [45, 108], l’équation de Boussinesq [61], ou le système de Navier-
Stokes incompressible [110], ainsi qu’au chapitre 4 pour l’équation de Bur-
gers). La méthode d’interpolation empirique (aussi appelée méthode magic
points), décrite dans [44], permet de se ramener au cas où l’hypothèse 4
(existence d’une décomposition affine de a) est vérifiée, moyennant certaines
approximations.
La résolution du problème variationnel (1.3.4) se fait généralement en consi-
dérant une base Φ = φ1, . . . , φN de H, en introduisant les composantes
de u(X) dans cette base :
u(X) =N∑
i=1
ui(X)φi,
et en cherchant les coefficients comme solution du système linéaire à Néquations et autant d’inconnues :
N∑
i=1
ui(X)a(φi, φ1;X) = ψ(φ1)
...N∑
i=1
ui(X)a(φi, φN ;X) = ψ(φN )
Généralement, la base Φ est choisie en fonction de la régularité du pro-
blème variationnel considéré, et non en fonction de la variété paramétrique
u(X)X sur laquelle évolue la variable d’état lorsque le paramètre d’entrée
varie. Ceci entraîne que, généralement, le nombre d’inconnues à trouver (N )
est grand, ce qui cause une résolution numérique coûteuse.
Principe de la méthode base réduite
L’idée-clé de la méthode base réduite est d’abord de trouver une famille libre
dans H notée ζ1, . . . , ζn, et engendrant un sous-espace de H noté H, puis

INTRODUCTION 45
de chercher une approximation u(X) ∈ H sous la forme :
u(X) =n∑
i=1
ui(X)ζi,
satisfaisant une version affaiblie de (1.3.4) :
a(u(X), v;X) = ψ(v), ∀v ∈ H.
Ce dernier problème variationnel peut s’écrire comme un système à n équa-
tions et autant d’inconnues :
n∑
i=1
ui(X)Q∑
q=1
aq(ζi, ζ1)Θq(X) = ψ(ζ1)
...n∑
i=1
ui(X)Q∑
q=1
aq(ζi, ζn)Θq(X) = ψ(ζn)
(1.3.6)
La méthode base réduite fonctionne lorsque l’on peut choisir n ≪ N et
conserver une approximation u(X) ≈ u(X) satisfaisante. Le gain en temps
de calcul est réalisé en remplaçant la résolution du système complet à Ninconnues par un système à n inconnues, ce qui fait que la méthode base
réduite se place parmi les méthodes de réduction de dimension.
Remarquons enfin que la sortie réduite f peut être calculée à partir de u
par la formule :
f(X) := f(u(X)) =n∑
i=1
ui(X)f(ζi). (1.3.7)
La décomposition offline/online est donc la suivante :
– durant la phase offline (faite une seule fois), la base réduite est choisie
(nous verrons en section 1.3.3 comment faire cela), et les éléments indé-
pendants du paramètre X apparaissant dans le système (1.3.6) et dans la
formule (1.3.7) sont précalculés et stockés ;
– durant la phase online (qui a lieu pour chaque valeur du paramètre d’en-
trée X sur lequel évaluer f), le système (1.3.6) est assemblé, à partir
des éléments stockés durant la phase offline, ainsi que de l’évaluation des
fonctions Θq sur le paramètre voulu. Ce système est ensuite résolu afin de
trouver les coefficients ui(X), puis, enfin, f(X) est calculée au moyen
de (1.3.7).
46 Chapitre 1.
Remarquons que la complexité algorithmique de la phase online, bien que
dépendante de n et de Q, est totalement indépendante de la dimension du
problème d’origine N .
Signalons enfin qu’il existe une autre façon de définir la sortie réduite f ;
cette autre façon sera motivée et étudiée en partie 1.7.2.
Borne d’erreur
Discutons maintenant de l’obtention de la borne d’erreur entre la sortie du
modèle et la sortie du métamodèle, c’est-à-dire du réel ε(X) tel que :∣∣∣f(X)− f(X)
∣∣∣ ≤ ε(X) ∀X.
Cette borne d’erreur doit être calculable explicitement à l’aide d’une pro-
cédure offline/online efficace, c’est à dire que la complexité de la procédure
online ne doit pas dépendre de la dimension du problème à réduire, tout
comme les calculs de u et de f décrits à la section précédente.
Commençons d’abord par établir une borne d’erreur entre les variables d’état
non réduites et réduites, ie. cherchons εu(X) telle que :
‖u(X)− u(X)‖ ≤ εu(X) ∀X,
où ‖·‖ désigne la norme dont H est muni.
On démontre que :
‖u(X)− u(X)‖ ≤ ‖r(X)‖∗α(X)
,
où r(X) est la forme linéaire sur H donnant le résidu :
r(X) = a(u(µ), ·;X) − f(·),
‖·‖∗ désigne la norme duale (norme triple) sur H :
‖r‖∗ = supv∈H,‖v‖=1
|r(v)| ,
et α(X) est la constante de coercivité de a(·, ·;X), qui satisfait (1.3.5).
Il est possible de développer ([Janon5, §3.2 et §3.3], ainsi que [72],[51] et
[19]) une procédure offline/online efficace pour calculer :
– la valeur exacte de la norme duale du résidu ‖r(X)‖∗ ;
– une borne inférieure de la constante de coercivité, ie. αinf (X) tel que :
α(X) ≥ αinf (X) ∀X.

INTRODUCTION 47
Les détails de ces calculs ne sont pas nécessaires à la compréhension des
chapitres suivants de ce manuscrit, car les méthodes de calcul que nous
proposons sont différentes et seront précisées à l’intérieur des chapitres.
On obtient ainsi une borne d’erreur calculable sur u :
εu(X) =‖r(X)‖∗αinf (X)
.
De cette borne sur u peut facilement se déduire une borne sur la sortie du
métamodèle : ∣∣∣f(X)− f(X)∣∣∣ ≤ ‖f‖∗ εu(X),
où ‖f‖∗, indépendante de X, peut être calculée et mémorisée durant la phase
offline.
Nous développerons au chapitre 5 une alternative plus efficace à cette der-
nière borne d’erreur.
Choix de la base réduite
Nous présentons maintenant deux algorithmes de choix d’une base réduite
B = ζ1, . . . , ζn.
Algorithme glouton (greedy). Cet algorithme est présenté dans [72] et
étudié d’un point de vue théorique dans [12]. L’idée est de construire itéra-
tivement B en rajoutant, à chaque étape, la solution du modèle non réduit,
pour la valeur du paramètre maximisant la borne d’erreur εu calculée sur
un échantillon de jeux de paramètres Ξ ⊂ Rp tiré aléatoirement.
L’algorithme est le suivant :
1. Initialiser B = u(X1), pour X1 paramètre tiré aléatoirement.
2. Tirer aléatoirement nΞ > 0 paramètres X1, . . . ,XnΞ , formant ainsi
l’ensemble Ξ.
3. Répéter, pour i = 2, . . . , n :
(a) Calculer :
X∗i = argmaxX∈Ξ
εu(X),
où εu(X) est la borne de l’erreur entre u et u obtenue par la
méthode base réduite projetant sur la base B courante.
(b) Poser : B ← B ∪ Xi∗ et réorthonormaliser B.

48 Chapitre 1.
Signalons, en lien avec la question 5 de la section 1.1, que la borne d’erreur
εu utilisée dans cet algorithme peut être remplacée par une borne d’erreur
optimisée sur la sortie, telle la borne utilisant le dual εDual, décrite en section
1.7 ou la borne décrite au chapitre 5.
Algorithme basé sur la POD. Cet algorithme, inspiré par la procédure
de POD (Proper Orthogonal Decomposition [18], [96]) considère la recherche
d’une base orthonormée B∗ minimisant l’erreur quadratique, en moyenne
sur X, de projection orthogonale de u(X) :
B∗ = argminB famille orthonormée
E(‖u(X) −ΠBu(X)‖2
),
où ΠB désigne la projection orthogonale sur B.
L’espérance ci-dessus ne pouvant pas, en général, être calculée analytique-
ment, elle est remplacée par une de ses estimations Monte-Carlo :
B = argminB famille orthonormée
∑
X∈Ξ
(‖u(X)−ΠBu(X)‖2
),
où Ξ est un échantillon iid. de la loi de X.
Le calcul de B peut alors se faire ([112], [Janon5] §4.2) algorithmiquement en
calculant d’abord #Ξ solutions du modèle numérique, puis en trouvant les
n vecteurs propres associés aux plus grandes valeurs propres d’une matrice
d’ordre #Ξ.
Choix guidé par la sortie (goal-oriented). Également en lien avec la
question 5 énoncée en section 1.1, on peut vouloir choisir une base B telle
que :
B = argminζ1,...,ζn
∑
X∈Ξ
‖f(u(X))− f(u(X))‖2 (1.3.8)
sous les contraintes suivantes :
u(X) =n∑
i=1
ui(X)ζi ∀X ∈ Ξ
n∑
i=1
Q∑
q=1
Θq(X)aq(ζi, ζp)
ui(X) = ψ(ζp) ∀µ ∈ Ξ,∀p = 1, . . . , N
< ζi, ζp >=
1 si i = p
0 sinon,∀n,m = 1, . . . , N
où, comme précédemment, Ξ est un échantillon de la loi de X.

INTRODUCTION 49
Cette approche est proposée dans [13], dans le contexte des systèmes dyna-
miques linéaires, où les auteurs décrivent des affaiblissements de ce problème
d’optimisation qui permettent son implémentation numérique afin de choisir
la base B en lien avec la fonctionnelle de sortie f . Cependant, le problème
d’optimisation obtenu est a priori difficile (non convexe, avec des minima
non globaux), ce qui fait que cette méthode nécessite une charge de calcul
supérieure à celle de la POD classique.
1.4 Introduction au Chapitre 2
Prise en compte de l’erreur métamodèle
Dans cette section, nous introduisons le chapitre 2, qui est constitué de l’ar-
ticle accepté [Janon1] ; c’est à l’occasion de l’écriture de cet article qu’ont
été diffusées les contributions aux packages R sensitivity et CompModSA
présentées dans la liste des travaux en page 13. Le but de ce chapitre est
d’apporter une réponse aux questions 1 et 3 soulevées dans l’introduction
en section 1.1. Nous rappelons que ces deux questions visent à quantifier
l’erreur d’estimation par Monte-Carlo (question 1) et l’impact du remplace-
ment d’un modèle, lorsque celui-ci est coûteux à évaluer, par un métamodèle
approchant (question 3).
Nous commençons par développer notre problématique, puis nous présentons
deux approches déjà proposées dans la littérature. Nous terminons par un
résumé de l’approche que nous proposons et des résultats obtenus.
1.4.1 Problématique
Dans ce chapitre, nous revenons à l’estimation des indices de Sobol par
méthode de Monte-Carlo, en utilisant l’estimateur Si :
Si =1N
∑Nk=1 YkY
′k −
(1N
∑Nk=1 Yk
) (1N
∑Nk=1 Y
′k
)
1N
∑Nk=1 Y
2k −
(1N
∑Nk=1 Yk
)2 . (1.4.1)
où Ykk=1,...,N et Y ′kk=1,...,N sont deux échantillons iid. des variables Y
et Y ′ définies respectivement par :
Y = f(X1, . . . ,Xp) et Y ′ = f(X ′1, . . . ,X
′i−1,Xi,X
′i+1, . . . ,X
′p), (1.4.2)
où f est le modèle à étudier, et X = (X1, . . . ,Xp) et X ′ = (X ′1, . . . ,X
′p) sont
deux copies indépendantes de la loi des paramètres d’entrée.

50 Chapitre 1.
Comme précisé en introduction de ce chapitre, le nombre d’évaluations de
la fonction f à faire pour calculer une réalisation de Si peut être grand et
on peut être amené, lorsque le temps de calcul nécessaire à ces évaluations
est trop important, à remplacer f par un métamodèle, que nous noterons f ,
qui approche f tout en étant plus rapide à calculer. On définit alors Y et
Y ′ par :
Y = f(X1, . . . ,Xp) et Y ′ = f(X ′1, . . . ,X
′i−1,Xi,X
′i+1, . . . ,X
′p).
Si l’on utilise Si en remplaçant directement Y et Y ′ par, respectivement,
Y et Y ′, on estime l’indice de sensibilité du métamodèle f et non celui du
vrai modèle. Notre objectif est de proposer des approches et de la littérature
pour répondre à la Question 3 formulée dans la Section 1.1, à savoir rendre
compte de l’erreur induite sur l’estimation des indices de sensbilité lorsque le
vrai modèle f est remplacé par le métamodèle f . L’évaluation de l’erreur de
métamodèle doit être combinée à celle de l’erreur d’estimation Monte-Carlo,
faisant ainsi le lien avec la Question 1 de cette même section.
Avant de résumer l’approche que nous proposons dans le Chapitre 2, nous
décrivons deux approches existant dans la littérature.
1.4.2 Approche existante 1 : utilisation du krigeage
L’approche que nous allons présenter maintenant est apparue dans [66].
Cette approche nécessite que le métamodèle utilisé soit un métamodèle de
krigeage, décrit en section 1.3.1. Les auteurs proposent alors, au §2.3, d’op.
cit., de considérer les deux indices suivants :
S1i =
VarXiEX
(f(X)|Xi
)
VarX(f(X)
) ,
noté Si dans l’article original, et est égal à l’indice de Sobol du premier ordre
si le vrai modèle était f .
Le deuxième indice considéré est le suivant :
S2i (ω) =
VarXiEX(Z(X,ω)|Xi)Eω′∈Ω(VarXZ(X,ω′))
,
noté Si, et dont la loi, conditionnellement à Z(x1) = f(x1), . . . , Z(xn) =
f(xn), permet de définir un indice ponctuel de sensibilité et une indication
de sa précision (par, respectivement, l’espérance et la variance de cette loi

INTRODUCTION 51
conditionnelle). Grâce à S2i , des intervalles de confiance peuvent être éga-
lement produits, à l’aide des quantiles empiriques de cette distribution, qui
peut être simulée numériquement par une méthode décrite dans l’article cité.
Les auteurs ont comparé, sur des exemples où les vrais indices de sensibilité
du modèle sont connus, l’estimation de Si par S1i d’une part, et par l’es-
pérance, conditionnellement à l’échantillon d’apprentissage, de S2i d’autre
part, et montrent que ce deuxième choix commet une erreur quadratique
moyenne d’estimation plus faible. Par ailleurs, il est observé que les inter-
valles de confiance pour Si ont un niveau de risque se rapprochant du niveau
voulu lorsque la taille (n) de l’échantillon d’apprentissage augmente (pour
de petites valeurs de n, donc un métamodèle peu fidèle, le niveau de risque
est bien souvent supérieur à ce qui est demandé), sauf dans certains cas, où
le niveau réel de risque reste à 100%, pour un risque cible de 10%, ce qui
indique que la méthode manque de robustesse dans ces cas là.
En guise de discussion, nous faisons les deux remarques suivantes sur cette
approche :
– elle se limite aux métamodèles de krigeage, alors que d’autres méthodes
de métamodélisation sont disponibles et pourraient, suivant le cas traité,
s’avérer plus efficaces ;
– l’erreur commise en estimant les hyperparamètres du modèle n’est pas
prise en compte.
1.4.3 Approche existante 2 : bootstrap de métamodèle
L’autre approche que nous considérons maintenant est présentée dans [100].
Elle consiste à « bootstrapper » le métamodèle afin de mesurer sa variabilité
et son impact sur l’estimation des indices de Sobol.
Plus préciser, nous considérons un métamodèle f = fD, fonction d’un échan-
tillon d’apprentissage D :
D = (x1, f(x1)), . . . , (xn, f(xn)).
Pour R ∈ N, on génère un échantillon de R réplications de Si en répétant,
pour r = 1, . . . , R, les étapes suivantes :
1. on tire un n-échantillon x1∗, . . . , x
n∗ depuis la loi du paramètre d’en-
trée X ;
2. on calcule une version « bruitée » de l’échantillon d’apprentissage :
D∗ = (x1∗, f∗(x1)), . . . , (xn∗ , f∗(xn)).
52 Chapitre 1.
où, pour k = 1, . . . , n :
f∗(xk∗) = fD(xk∗) + erk,
où erk est échantillonné suivant la loi équirépartie sur l’ensemble des
résidus du métamodèle :
fD(xl)− f(xl), l = 1, . . . , n
;
3. on calcule une réplication Sr∗i de Si en utilisant (1.4.1) (ou toute autre
formule estimant Si par Monte-Carlo) et (1.4.2) où f est remplacée
par fD∗ .
L’ensemble
R = S1∗i , . . . , S
R∗i
de réplications est alors utilisé pour produire un intervalle de confiance, en
suivant par exemple une des méthodes décrite en Section 1.2.4. Cette mé-
thode est bien entendu intéressante si le nombre n de points dans l’échan-
tillon d’apprentissage peut être choisi nettement inférieur à la taille (N) de
l’échantillon Monte-Carlo utilisé pour calculer Si.
Par rapport à l’approche décrite précédemment, cette méthode laisse plus
de liberté au niveau de la construction du métamodèle (les auteurs la testent
d’ailleurs pour plusieurs types de métamodèles), mais présente selon nous
deux inconvénients :
– la prise en charge de l’erreur de métamodèle nécessite une hypothèse sur
la loi de l’erreur ;
– le temps de calcul pour construire chaque métamodèle répliqué fD∗ à
partir de D∗ peut être important, et peut, étant répété R fois, rendre
prohibitif le temps nécessaire au calcul de l’intervalle de confiance.
Par ailleurs, dans les tests numériques que nous avons effectués et que nous
présentons au Chapitre 2, Table 2.3, nous avons observé que les intervalles
de confiance produits avec cette méthode peuvent avoir un niveau de risque
supérieur à celui demandé (98% au lieu de 5%, pour l’exemple le plus ex-
trême).
Remarquons enfin que l’approche décrite ci-dessus n’est évidemment pas
pertinente pour les métamodèles interpolants, qui sont ceux satisfaisant la
propriété :
∀k = 1, . . . , n, fD(xk) = f(xk),

INTRODUCTION 53
puisqu’alors tous les résidus sont nuls. Ainsi, pour le krigeage, qui produit
des métamodèles interpolants, les auteurs proposent au §3.5 d’utiliser une
méthode différente : il s’agit, pour obtenir R réplications de Si, de répéter
les étapes suivantes pour r = 1, . . . , R :
1. Générer aléatoirement deux échantillons Xkk=1,...,N et Xk ′k=1,...,N
suivant la loi de X.
2. Pour k = 1, . . . , N , tirer Yk suivant la loi a posteriori de f(Xk), à
savoir (en reprenant les notations de la section 1.3.1 :
N(m(Xk), R(Xk,Xk)− kD(Xk)tΣ−1
D kD(Xk)),
et Y ′k suivant la loi a posteriori de f(Xk
1′, . . . ,Xk
i−1′,Xk
i ,Xki+1
′, . . . ,Xkp
′) :
N(m(Xk
pf ), R(Xkpf ,X
kpf )− kD(Xk
pf )tΣ−1D kD(Xk
pf )),
où
Xkpf =
(Xk
1′, . . . ,Xk
i−1′,Xk
i ,Xki+1
′, . . . ,Xkp
′).
3. Calculer la rème réplication de Si en utilisant (1.4.1).
On termine en fournissant un intervalle de crédibilité bayésien de risque α
constitué par les quantiles α/2 et 1 − α/2 de l’ensemble des R réplications
de Si venant d’être calculées.
1.4.4 Notre approche
Hypothèse d’existence d’une borne ponctuelle. Nous décidons de quan-
tifier l’erreur de métamodèle au moyen d’une borne d’erreur ponctuelle ε,
satisfaisant :
∀x,∣∣∣f(x)− f(x)
∣∣∣ ≤ ε(x).
Cette borne ponctuelle doit être calculable explicitement (numériquement),
pour un paramètre d’entrée x donné, en un temps comparable à celui néces-
saire au calcul d’une évaluation du métamodèle f (en tous cas, il doit être
sensiblement inférieur au temps de calcul de f), faute de quoi la méthode
n’aura aucun intérêt pratique.
La méthode base réduite, décrite en section 1.3.3, est une méthode de méta-
modélisation fournissant une telle borne d’erreur. L’interpolation par noyau
reproduisant (RKHS), est une autre méthode de métamodélisation, décrite à
la section 1.3.2, disposant également d’une borne d’erreur ; cependant cette
borne d’erreur n’est pas explicitement calculable en totalité, et l’on doit se
contenter d’une borne approchée (un indicateur d’erreur).

54 Chapitre 1.
Principe de la méthode (Section 2.3.1). On commence par tirer deux
échantillons iid. Xkk=1,...,N et Xk ′k=1,...,N , puis on calcule unN -échantillon
de sorties métamodèles et de bornes d’erreur suivant un plan pick-freeze :
Yk = f(Xk), Y ′k = f(Xk
1′, . . . ,Xk
i−1′,Xk
i ,Xki+1
′, . . . ,Xkp
′),
εk = ε(Xk), ε′k = ε(Xk
1′, . . . ,Xk
i−1′,Xk
i ,Xki+1
′, . . . ,Xkp
′).
Aucune évaluation de f n’étant disponible, ces quatre N -échantillons ne
permettent pas d’évaluer l’estimateur Si sur le vrai modèle. L’idée centrale
est d’encadrer Si par deux estimateurs Smi et SMi qui sont fonctions des
échantillons de sorties du métamodèle et des bornes d’erreur :
Smi
((Yk)k=1,...,N
,(Y ′k
)k=1,...,N
, (εk)k=1,...,N ,(ε′k
)k=1,...,N
)
≤ Si((Yk) ,
(Y ′k
)) ≤
SMi
((Yk)k=1,...,N
,(Y ′k
)k=1,...,N
, (εk)k=1,...,N ,(ε′k
)k=1,...,N
).
Supposons que nous puissions calculer numériquement ces deux estimateurs.
On peut alors calculer R réplications bootstrap de chacun de ces estima-
teurs :
Rm =Smi
((Yk)k∈Lr
,(Y ′k
)k∈Lr
, (εk)k∈Lr,(ε′k
)k∈Lr
), r = 1, . . . , R
et :
RM =SMi
((Yk)k∈Lr
,(Y ′k
)k∈Lr
, (εk)k∈Lr,(ε′k
)k∈Lr
), r = 1, . . . , R
où L1, . . . , LR sont R listes de longueur N , indépendantes et tirées aléatoi-
rement avec remise dans 1, . . . , N.On peut alors fixer un niveau de risque et utiliser une technique de boots-
trap (cf. 1.2.4) pour produire un intervalle de confiance [Im1 ; Im2 ] à partir de
l’ensemble Rm, et un intervalle de confiance [IM1 ; IM2 ]. On combine alors ces
deux intervalles en un intervalle de confiance I = [Im1 ; IM2 ].
On peut facilement démontrer que, si on utilise la technique du boostrap
classique, on a :
P(Si ∋ I
)≥ P (Si ∋ I) , (1.4.3)
où I désigne l’intervalle bootstrap construit (hypothétiquement) à partir de
l’estimateur Si.

INTRODUCTION 55
Autrement dit, si la technique de bootstrap utilisée fonctionne correctement
(ie., donne un intervalle ayant le niveau de risque fixé) pour estimer Si à
partir du vrai modèle, alors notre technique donnera un intervalle conserva-
tif.
Remarquons que l’utilisation du bootstrap avec correction de biais ne permet
de démontrer (1.4.3) dans tous les cas. Cependant, nos essais numériques
montrent qu’en pratique, les résultats donnés par le bootstrap classique et
celui avec correction de biais ne diffèrent pas significativement. Ceci est à
rapprocher de la propriété de normalité asymptotique (introduite section 1.5
et démontrée au chapitre 3) qui montre que le biais est asymptotiquement
négligeable devant l’écart-type de l’estimateur.
Nous terminons le résumé de notre approche en donnant deux choix possibles
pour les estimateurs encadrants Smi et SMi , ainsi qu’une brève description
des résultats obtenus avec chacun d’entre eux.
Encadrement analytique (loc. cit.). On remarque que Si est l’argmin.
d’un trinôme (noté R dans l’article), qui peut être encadré par deux trinômes
(notées Rinf et Rsup) dont les coefficients sont des fonctions des sorties mé-
tamodèles et des bornes d’erreur. On peut alors en déduire un encadrement
de Si qui est calculable explicitement par un algorithme rapide.
Nous avons testé l’estimation d’intervalles de confiance en utilisant cet en-
cadrement à l’aide du métamodèle certifié décrit dans le Chapitre 4. Les
vraies valeurs analytiques des indices n’étant pas connues pour ce modèle,
nous avons vérifié la justesse de notre méthode en calculant des « vérités ter-
rain » à l’aide d’un estimateur Monte-Carlo construit sur un large échantillon
et utilisant le vrai modèle numérique. Nous avons constaté que les intervalles
de confiance avaient bien le niveau requis, même lorsque le métamodèle est
peu fidèle. De plus, nous montrons sur cet exemple que l’utilisation d’un mé-
tamodèle base réduite pour estimer permet des gains significatifs en temps
de calcul par rapport à l’utilisation du vrai modèle, tout en ayant une cer-
tification sur la perte de précision. Nous avons, enfin, testé l’utilisation de
la méthode existante basée sur le bootstrap métamodèle décrite plus haut,
à l’aide de l’implémentation de référence faite par Storlie dans le package
CompModSA [116] et en utilisant un échantillon d’apprentissage de la même
taille que celui nécessaire à la construction du métamodèle base réduite
utilisé ; notre méthode apporte un résultat plus précis (des intervalles de
56 Chapitre 1.
confiance moins larges, à niveau fixé) tout en nécessitant un temps de cal-
cul nettement plus court. Ce test valide donc le choix du métamodèle base
réduite et de notre méthode de calcul d’intervalles de confiance.
Nous avons ensuite voulu effectuer la même comparaison sur un métamodèle
obtenu par interpolation à noyau (voir section 1.3.2). Notre méthode s’est
alors avérée décevante car, les bornes d’erreur métamodèle ayant une plus
grande magnitude dans ce cas, l’encadrement de Si s’est avéré trivial (c’est-
à-dire plus large que [0; 1]). Ceci nous a amenés à développer, pour de tels
cas, une autre méthode de calcul de bornes pour Si.
Encadrement avec lissage (Section 2.3.2). Commençons par indiquer
pourquoi l’encadrement présenté plus haut est souvent trop pessimiste. Dé-
finissons le pavé de R2N suivant :
Z =N∏
k=1
[Yk − εk; Yk + εk
]×
N∏
k=1
[Y ′k − ε′
k; Y′k + ε′
k
],
et la fonction (les sommes portent sur k entre 1 et N) :
ψi(z) =1N
∑zkz
′k − ( 1
N
∑zk)( 1
N
∑z′k)
1N
∑(zk)2 − ( 1
N
∑zk)2
,
pour z = (z1, . . . , zN , z′1, . . . , z
′N ).
Comme :
Si = ψi(Y1, . . . , YN , Y′
1 , . . . , Y′N ),
il est clair que l’encadrement optimal de Si est réalisé par le choix :
Smi = minz∈Z
ψi(z) et SMi = maxz∈Z
ψi(z).
En calculant, dans l’exemple RKHS évoqué plus haut, la solution z∗ de
ces problèmes d’optimisation, nous nous sommes aperçu que le « pire cas »
correspondait à celui d’une fonction f très peu régulière (la fonction f se
retrouvant à partir de ses valeurs échantillonnées z∗). En général, les sorties
considérées bénéficient d’un minimum de régularité en fonction des para-
mètres de sortie. Ce pire cas est donc peu vraisemblable et doit être évité.
Ceci suggère d’utiliser un « encadrement » pénalisant les z correspondant à
des fonctions peu lisses :
zm = argminz∈Z
ψi(z) + λΠ(z) et zM = argmaxz∈Z
ψi(z)− λΠ(z),

INTRODUCTION 57
où Π est une fonction de pénalisation et λ > 0 un coefficient de pénalisation.
On utilise ensuite :
Smi = ψi(zm) et SMi = ψi(zM ).
En pratique, on utilise un algorithme de minimisation numérique (du type
quasi Newton, L-BFGS-B) pour calculer zm et zM . Le problème d’optimisa-
tion résolu est de dimension importante (2N) ; malgré cela, cet algorithme
donne des résultats corrects en des temps raisonnables. Nous utilisons une
pénalité particulière, définie en (2.3.17), qui permet d’avoir un gradient de
la fonction objectif rapide à évaluer.
Par rapport à l’encadrement analytique, cet encadrement est moins rigou-
reux et fait intervenir un paramètre de pénalisation à choisir correctement.
Cependant, il nous a permis de traiter de manière correcte l’exemple de
l’interpolation RKHS, tout en produisant des intervalles de confiance non
triviaux ayant le niveau de risque assez proche de celui requis, ce qui n’a pas
été le cas lorsque nous avons testé le package CompModSA avec krigeage.
1.5 Introduction au Chapitre 3
Propriétés asymptotiques d’estimateurs de l’in-
dice de Sobol
Cette section introduit le chapitre 3, constitué de l’article soumis [Janon2].
Ce chapitre traite des propriétés asymptotiques de deux estimateurs Monte-
Carlo construits sur un plan pick-freeze, et vise à répondre aux questions
1 (quantification de l’erreur d’estimation), 2 (recherche d’un estimateur
Monte-Carlo optimal) et 3 (impact du remplacement du modèle par un
métamodèle dans l’estimation des indices de Sobol) de la section 1.1. Ces
propriétés sont d’abord étudiées dans un contexte où le vrai modèle à étu-
dier est disponible, puis étendues dans le cas où celui-ci est remplacé par
un métamodèle. Après avoir exposé la problématique de l’article, nous don-
nons, en sections 1.5.2 et 1.5.3, les outils que nous avons utilisés. Enfin,
nous résumons, en section 1.5.4, les résultats que nous avons obtenus dans
ce travail.

58 Chapitre 1.
1.5.1 Problématique
Nous nous plaçons à nouveau dans le cadre de l’estimation des indices de
Sobol par une méthode de Monte-Carlo pick-freeze, plus précisément en uti-
lisant les estimateurs suivants, que nous avons déjà introduits auparavant :
SN,i =1N
∑Nk=1 YkY
′k −
(1N
∑Nk=1 Yk
)(1N
∑Nk=1 Y
′k
)
1N
∑Nk=1 Y
2k −
(1N
∑Nk=1 Yk
)2 ,
TN,i =1N
∑Nk=1 YkY
′k − E2
E2 − E2,
où
E =1N
N∑
k=1
Yk + Y ′k
2et E2 =
1N
N∑
k=1
Y 2k + Y ′2
k
2.
Notre premier objectif est d’établir, pour ces estimateurs, les résultats de
normalité asymptotique que nous avons évoqué en Section 1.2.4. Ainsi, nous
voulons démontrer que :√N(SN,i − Si) L−→
N→∞N (0, σ2
S)
et : √N(TN,i − Si) L−→
N→∞N (0, σ2
T ),
pour σ2S et σ2
T deux réels positifs.
Ces résultats peuvent être utilisés afin de fournir des intervalles de confiance
justifiés asymptotiquement pour Si, ce qui constitue un aspect de notre
réponse à la question 1 (estimation de l’erreur Monte-Carlo) de notre intro-
duction. L’outil principal utilisé pour établir ce résultat sera la δ-méthode
que nous rappelons en section 1.5.2.
Nous souhaitons également comparer, en termes de variance asymptotique,
ces deux estimateurs ; un estimateur ayant une variance asymptotique in-
férieure est à préférer, puisque celui-ci donnera des intervalles de confiance
asymptotiques moins larges. Nous nous posons également la question de la
variance asymptotique minimale que peut posséder un estimateur « raison-
nable » construit sur un plan d’échantillonnage Monte-Carlo pick-freeze, et,
si possible, identifier un estimateur ayant cette variance minimale. La forma-
lisation de cette notion d’estimateur « raisonnable » et l’explicitation d’un
estimateur de variance minimale constitue la réponse à la question 2 (iden-
tification d’un estimateur Monte-Carlo optimal) de l’introduction. L’outil

INTRODUCTION 59
utilisé est ici la théorie de l’efficacité asymptotique, que nous présentons
section 1.5.3.
Enfin, notre troisième objectif est d’étudier les propriétés asymptotiques
(normalité et efficacité) des estimateurs SN,i et TN,i donnés par :
SN,i =1N
∑Nk=1 YkY
′k −
(1N
∑Nk=1 Yk
) (1N
∑Nk=1 Y
′k
)
1N
∑Nk=1 Y
2k −
(1N
∑Nk=1 Yk
)2 ,
TN,i =1N
∑Nk=1 YkY
′k − E2
E2 − E2,
où
E =1N
N∑
k=1
Yk + Y ′k
2et E2 =
1N
N∑
k=1
Y 2k + Y ′2
k
2.
et où Ykk=1,...,N et Y ′kk=1,...,N sont des échantillons iid. de, respective-
ment :
Y = f(X1, . . . ,Xp) Y ′ = f(X ′1, . . . ,X
′i−1,Xi,X
′i+1, . . . ,X
′p).
Les estimateurs SN,i et TN,i sont donc simplement les estimateurs SN,i et
TN,i utilisant les évaluations du métamodèle f comme données.
Il est aisé de vérifier que la normalité asymptotique de SN,i et TN,i relative-
ment à Si ne peut pas avoir lieu si f 6= f . En fait, dans ce cas, on a même que
ces deux estimateurs ne sont pas consistants pour estimer Si (Proposition 9
du chapitre 3).
La solution que nous proposons est de faire dépendre le métamodèle utilisé
de la taille d’échantillon N :
f = fN . (1.5.1)
Intuitivement, tout résultat de consistance ou de normalité asymptotique de
SN,i et TN,i repose sur la convergence, en un certain sens restant à préciser,
du métamodèle fN vers le vrai modèle f . Notre but est de préciser en quel
sens, et à quelle vitesse, doit avoir lieu cette convergence.
Ceci constitue une réponse à la question 3 de l’introduction, qui portait sur
l’estimation de l’impact de l’erreur métamodèle sur l’estimation des indices.
Cette réponse est complémentaire de celle apportée au chapitre 2, et en
diffère sur les points suivants :
– nous n’utilisons pas d’évaluations de la borne d’erreur ponctuelle ε ;

60 Chapitre 1.
– l’erreur métamodèle sur l’estimation des indices de Sobol n’est pas quanti-
fiée numériquement, mais des conditions sont données sur la précision du
métamodèle pour que l’erreur métamodèle puisse être considérée comme
négligeable, asymptotiquement.
Le résultat que nous utiliserons dans cette étude est le théorème central
limite triangulaire (aussi appelé théorème de Lindeberg-Feller), que nous
rappelons en section 1.5.2.
1.5.2 δ-méthode et TCL triangulaire
δ-méthode
Le théorème suivant, énoncé dans [109, 3.1], porte le nom de théorème de la
δ-méthode.
Theorem 1. Soit (UN )N une suite d’estimant de manière consistante un
vecteur U ∈ Rk, où k ∈ N∗.
On suppose que (UN )N est asymptotiquement normale, c’est-à-dire que :
√N(UN − U) L−→
N→∞N (0,Σ) (1.5.2)
où Σ est une matrice symétrique positive d’ordre k.
Soit Φ : Rk → R une fonction de classe C1 sur un ouvert de Rk contenant
U ∪ UNN≥N0, pour N0 ∈ N∗.
Alors (Φ(UN ))N≥N0estime Φ(U) de manière consistante et est asymptoti-
quement normale :
√N (Φ(UN )− Φ(U)) L−→
N→∞N(0,∇Φ(U)tΣ∇Φ(U)
),
où ∇Φ(U) désigne le vecteur gradient de Φ, évalué en U .
Ce résultat permet de déduire la normalité asymptotique de (Φ(UN ))N à
partir de la normalité asymptotique de (UN ), et de calculer la variance limite
connaissant celle de (UN ) et le vecteur gradient de Φ. Nous en faisons usage
pour démontrer les propositions 6 et 11.
Dans nos cas d’utilisation de ce théorème, la suite (UN ) est formée de
moyennes empiriques, et la normalité asymptotique de (UN ) est obtenue
par application du théorème central limite vectoriel ([109, 2.18]), ou (pour
la proposition 11) du théorème central limite triangulaire, que nous rappe-
lons ci-après.

INTRODUCTION 61
Théorème central limite triangulaire
Énonçons le théorème ainsi :
Theorem 2. Soit, pour tout n ∈ N∗, une collection Yn,1, . . . , Yn,n de vecteurs
aléatoires de Rk iid. et de variance finie, telle que :
∀ε > 0,n∑
i=1
E(‖Yn,i‖2 1‖Yn,i‖≥ε
)→ 0 quand n→ +∞, (1.5.3)
où ‖·‖ désigne la norme euclidienne sur Rk.
Supposons également qu’il existe une matrice carrée Σ d’ordre k telle que :
n∑
i=1
E((Yni − E(Yni))(Yni − E(Yni))t
)→ Σ quand n→ +∞.
Alors :n∑
i=1
(Yni − E(Yni))L−→
N→∞N (0,Σ).
où N (0,Σ) désigne la loi normale en dimension k centrée, de matrice de
covariance Σ.
Ce théorème, portant le nom de théorème central limite triangulaire (ou
théorème de Lindeberg-Feller) est donné et démontré dans [109, 2.27]. Il gé-
néralise le théorème central limite « classique » dans le cas où l’on considère
la suite, indexée par N ∈ N∗, des moyennes de N variables iid. mais dont la
loi dépend de N . Remarquons que cette généralisation requiert l’hypothèse
supplémentaire d’uniforme intégrabilité (1.5.3).
L’utilisation de ce théorème est nécessaire pour démontrer la proposition 11
à cause de la dépendance en N du métamodèle, qui a été motivée en section
1.5.1.
1.5.3 Théorie de l’efficacité asymptotique
Notre référence dans cette section est l’ouvrage [109]. Le but de ce chapitre
est de présenter la notion d’efficacité asymptotique utilisée au chapitre 3,
et de donner les définitions et propriétés nécessaires à la compréhension des
parties 3.2.2 et 3.3.3.

62 Chapitre 1.
Introduction et notations
On considère le modèle statistique non paramétrique P formé des fonctions
de répartition de vecteurs aléatoires de Rp.
On observe des réalisations iid. X1, . . . ,XN d’une loi P ∈ P (inconnue)
et on cherche à estimer Ψ(P ) – où Ψ est une fonctionnelle statistique :
Ψ : P → Rk – en fonction de ces réalisations. Pour cela on dispose d’une suite
(UN )N∈N∗ d’estimateurs de Ψ(P ). Chaque UN est fonction des observations :
UN = UN (X1, . . . ,XN ).
On s’intéresse au cas où (UN ) est asymptotiquement normale, c’est-à-dire
qu’elle est telle que :
√N(UN −Ψ(P )) → N (0,Σ) en loi quand N → +∞
où Σ est la matrice (symétrique, positive) de variance-covariance asympto-
tique de (UN ).
Lorsque k = 1 (ie. la quantité à estimer est un scalaire), la normalité asymp-
totique s’exprime ainsi :
√N(UN −Ψ(P )) → N (0, σ2) en loi quand N → +∞
où σ2 est la variance asymptotique de (UN ). La normalité asymptotique
permet d’utiliser (UN ) pour construire des intervalles de confiance asympto-
tiques pour Ψ(P ), dont la largeur est proportionnelle à σ. Une suite d’esti-
mateurs asymptotiquement normale sera donc (asymptotiquement) d’autant
plus "précise" que sa variance asymptotique sera petite. Si cette variance
asymptotique est la plus faible possible, parmi toutes les variances asymp-
totiques des suites « régulières » d’estimateurs de Ψ(P ), on dira que la suite
(UN ) est efficace.
Pour k 6= 1, cette notion d’efficacité se généralise en utilisant l’ordre sur
les matrices de covariance donné par : Σ ≤ Σ′ si Σ′ − Σ est une matrice
(symétrique) positive.
Un certain nombre de questions sont à régler :
– Comment est définie la classe des suites « régulières » ?
– Comment, étant données Ψ et P , calculer la variance minimale d’une suite
régulière d’estimateurs de Ψ(P ) ?
– Comment démontrer qu’une suite (UN ) donnée est asymptotiquement ef-
ficace ?

INTRODUCTION 63
Les deux premières questions sont traitées dans la section 1.5.3. La section
1.5.3 donne des critères et des propriétés permettant de montrer l’efficacité
asymptotique.
Efficacité asymptotique
Définition 1. On dit que Ψ : P → Rk est différentiable en P suivant P s’il
existe Ψ′P : L2(P ) → Rk telle que :
∀g mesurable bornée telle que
∫gdP = 0,
Ψ(Pt,g)−Ψ(P )t
→ Ψ′P (g)
quand t→ 0, où Pt,g = P + tgP ∈ P.
Dans ce cas, il existe une unique fonction ψP ∈ L2(P ) à valeurs dans Rk
telle que :
∀g mesurable bornée telle que
∫gdP = 0, Ψ′
P (g) =∫ψP gdP
ψP est appelée fonction d’influence efficace de Ψ en P , relativement à P.
Remarques :
1. La condition∫gdP = 0 assure que dPt est une mesure de probabilité
(a une masse totale égale à 1).
2. Dans notre référence [op.cit., 25.3] on considère des modèles statis-
tiques P plus généraux. Une telle généralité sera d’ailleurs nécessaire
au chapitre 3, car le modèle P utilisé sera un sous-ensemble strict du
modèle non-paramétrique.
Dans ce cas, la définition ci-dessus doit être modifiée en prenant g dans
un "espace tangent" P ′P . Dans le modèle non-paramétrique, dans lequel
nous nous plaçons dans cette introduction, il est démontré [op.cit.,
25.16] que cet espace tangent est :
P ′P = g ∈ L2(P ) tq.
∫gdP = 0.
L’« espace tangent » que nous avons choisi :
P ′P = g mesurable bornée tq.
∫gdP = 0
est un sous-ensemble strict de P ′P ; cependant la définition obtenue est
équivalente puisque P ′P est dense dans P ′
P ([op.cit., 25.24]).

64 Chapitre 1.
Définition 2. Une suite d’estimateurs (UN ) est dite régulière pour Ψ(P )
s’il existe une loi L telle que ∀g ∈ L2(P ) telle que
∫gdP = 0 :
√N(UN −Ψ(P1/
√N,g)) → L en loi, sous la loi P1/
√N,g, quand N → +∞
où dPt,g = dP + tgdP . La loi L est appelée loi limite de (UN ).
Le point important dans la définition ci-dessus est que L ne dépend pas
de la « direction de perturbation » g ; plus précisément, le comportement
asymptotique de (UN ) à l’ordre 1/√N n’est pas modifié lorsque la loi des
observations subit une perturbation en g/√N .
Le théorème [op.cit., théorème de convolution 25.20] ci-dessous donne l’ex-
pression de la matrice de variance-covariance asymptotique minimale pour
une suite d’estimateurs régulière :
Theorem 3. Supposons que Ψ est différentiable en P , et que (UN ) est une
suite d’estimateurs régulière pour Ψ(P ), ayant pour loi limite L, de matrice
de variance-covariance Σ. Alors
Σ−∫ψP ψ
TPdP
est une matrice positive.
Ce résultat justifie la définition suivante :
Définition 3. On dit qu’une suite d’estimateurs (UN ) est asymptotique-
ment efficace pour Ψ(P ) si elle est régulière en Ψ(P ), avec pour loi limite
N (0,∫ψP ψ
TPdP ).
Remarques :
1. En prenant g = 0, on obtient qu’une suite asymptotiquement efficace
est asymptotiquement normale, avec∫ψP ψ
TPdP comme matrice de
variance-covariance asymptotique.
2. Le théorème LAM [ 25.21] donne une autre « interprétation » de l’op-
timalité de la variance∫ψP ψ
TPdP , qui se passe de l’hypothèse de
régularité de (UN ).
Propriétés
Toutes les propriétés ci-dessous seront utilisées au chapitre 3 afin de démon-
trer l’efficacité asymptotique de l’estimateur de l’indice de Sobol considéré.
INTRODUCTION 65
Critère d’efficacité. Ce critère est souvent utilisé en pratique pour mon-
trer l’efficacité asymptotique ([op.cit., Lemme 25.23]) :
Proposition 1. Supposons Ψ différentiable en P , ayant comme fonction
d’influence efficace ψP . Une suite d’estimateurs (UN ) est asmptotiquement
efficace pour Ψ(P ) si et seulement si :
√N(UN −Ψ(P ))− 1√
N
N∑
i=1
ψP (Xi) → 0
en probabilité, quand N → +∞.
Efficacité de l’estimation empirique. Le résultat suivant [op. cit., 25.24]
nous donne un exemple important d’estimateur asymptotiquement efficace :
Proposition 2. Soit f ∈ L2(P ) à valeurs réelles. Les estimateurs empi-
riques :
UN =1N
N∑
i=1
f(Xi)
forment une suite asymptotiquement efficace pour ψ(P ) =∫fdP .
Efficacité jointe et efficacité marginale. La proposition ci-dessous est une
simplification de [op. cit., 25.50]. Elle réduit l’efficacité de l’estimation d’un
vecteur (efficacité jointe) à l’efficacité de l’estimation de ses composantes
(efficacité marginale).
Proposition 3. Soit Ψ : P → Rk différentiable en P , et (UN ) une suite
d’estimateurs de Ψ(P ). Si, pour tout l = 1, . . . , k, la suite des lèmes com-
posantes (UN,l)N est asymptotiquement efficace pour Ψ(P )l, alors (UN ) est
asymptotiquement efficace pour Ψ(P ).
Démonstration. Désignons par ψP la fonction d’influence efficace de Ψ(P ),
et par ψP l (pour l = 1, . . . , k) celle de Ψ(P )l. Il est clair que :
ψP =(ψP 1, . . . , ψP k
)T
l’efficacité asymptotique de (UN ) provient alors du critère de la Proposition
1 et du fait que la convergence en probabilité des marginales entraîne la
convergence jointe [op. cit., 2.7, (vi)].

66 Chapitre 1.
δ-méthode et efficacité. Le résultat suivant [op. cit., Partie 25.7, pp. 386–
387] est à l’efficacité asymptotique ce que la δ-méthode est à la normalité
asymptotique :
Proposition 4. Soit Ψ : P → Rk différentiable en P , Φ : Rk → Rn différen-
tiable en Ψ(P ), (UN ) asymptotiquement efficace pour Ψ(P ). Alors (Φ(UN ))
est asymptotiquement efficace pour Φ(Ψ(P )).
1.5.4 Résultats obtenus
Estimateurs SN,i et TN,i. Nous obtenons (proposition 6 du chapitre 3)
les résultats de normalité asymptotique annoncés en introduction, avec :
σ2S =
Var ((Y − E(Y )) [(Y ′ − E(Y ))− Si(Y − E(Y ))])
(VarY )2 ,
σ2T =
Var((Y − E(Y ))(Y ′ − E(Y ))− Si/2
((Y − E(Y ))2 + (Y ′ − E(Y ))2
))
(VarY )2.
Nous montrons, en figures 3.1 et 3.2, sur un exemple où les vrais indices
sont connus analytiquement, que les intervalles de confiance asymptotiques
obtenus sont consistants (c’est-à-dire qu’ils possèdent le niveau de risque
désiré).
Au sujet de la comparaison des deux estimateurs considérés, nous démon-
trons que σ2T ≤ σ2
S avec égalité si et seulement si Si ∈ 0; 1 (Proposition
7). Cette propriété est confirmée numériquement (Figure 3.3).
Cette comparaison est étendue en identifiant TN,i comme estimateur asymp-
totiquement efficace (Proposition 8). Cela signifie que cet estimateur possède
la variance asymptotique minimale parmi les estimateurs réguliers sur plan
Monte-Carlo pick-freeze.
Estimateurs SN,i et TN,i. Nous démontrons que, sous des hypothèses
techniques de domination (très souvent vérifiées dans les cas pratiques), les
estimateurs SN,i et TN,i sont asymptotiquement normaux (avec variances
asymptotiques respectives σ2S et σ2
T , identiques à celles de SN,i et TN,i) si
et seulement si Var(f − fN) = o(1/N). Sur de nombreux exemples (voir les
résultats numériques des sections 3.4.2, 3.4.3, 3.4.4 et 3.4.5), il semble que
cette condition soit également nécessaire.
Sous d’autres hypothèses techniques, ainsi que sous l’hypothèse E(f− fN ) =
o(1/√N), nous démontrons également que Ti,N est asymptotiquement effi-
cace pour Si.

INTRODUCTION 67
1.6 Introduction au Chapitre 4
Solutions réduites pour l’équation de Burgers
Cette section présente le chapitre 4. L’objectif de ce chapitre est de présen-
ter un métamodèle certifié pour l’équation de Burgers, contribuant ainsi à
notre réponse à la question 4 (développement de métamodèles certifiés en
géophysique). Ce chapitre est une publication acceptée [Janon3]. Nous com-
mençons par décrire la problématique du chapitre, puis nous présentons les
approches existantes dans la littérature avant de finir sur une présentation
de notre approche et des résultats que nous avons obtenus.
1.6.1 Problématique
Le but du chapitre 4 est d’appliquer la méthode de la base réduite sur
l’équation de Burgers avec viscosité : on cherche u = u(t, x) définie sur
[0;T ]× [0; 1] telle que
∂u
∂t+
12∂
∂x(u2)− ν ∂
2u
∂x2= f,
où ν > 0 est la viscosité, f le terme de forçage, et où on a la condition
initiale :
u(t = 0, x) = u0(x) ∀x ∈ [0; 1]
et la condition aux limites (ou condition de bord) de Dirichlet :u(t, x = 0) = b0(t)
u(t, x = 1) = b1(t)∀t ∈ [0;T ].
Si cette équation, en elle-même, ne modélise pas le comportement d’un fluide
géophysique, elle présente, par rapport à la méthode base réduite « simple »
présentée dans la section 1.3.3, deux spécificités :
– la non-stationarité (c’est-à-dire la mise en jeu de la variable temporelle t),
– et la non-linéarité, de type quadratique (présence de la dérivée du carré
de l’inconnue),
qui se retrouvent dans le modèle utilisé en océanographie des équations de
Saint-Venant (Shallow-Water) que nous souhaitons étudier par la suite. La
seule différence entre les deux est le nombre de fonctions inconnues (trois
dans le cas de Saint-Venant, une seule pour Burgers), qui se traduit seule-
ment par une augmentation de la dimension des problèmes considérés, ce qui

68 Chapitre 1.
n’est pas de nature à créer des difficultés supplémentaires, au moins dans le
cadre de l’analyse théorique.
Ce chapitre s’inscrit donc dans le contexte de la question 4 de la section 1.1
(développement de métamodèles certifiés pour les modèles géophysiques).
Nous souhaitons pouvoir considérer comme paramètres d’entrée la viscosité
ν, le terme de forçage f , la condition initiale u0 et les conditions aux limites
b0 et b1.
Pour ces trois derniers paramètres, de nature fonctionnelle, il y a nécessité,
pour se ramener à un espace d’entrées de dimension finie, d’utiliser une pa-
ramétrisation, telle qu’une troncature en série de Fourier, où les paramètres
d’entrée sont les coefficients de Fourier, et dont les fréquences respectives
sont fixées. L’étude de la sensibilité par rapport à ces paramètres fait sens
physiquement : on étudie le comportement de la solution face à des modi-
fications des données fonctionnelles à des échelles spatiales ou temporelles
différentes.
Mathématiquement on va donc considérer des paramétrisations de la forme :
b0(t) = b0m +n(b0)∑
l=1
Ab0
l Φb0
l (t) b1(t) = b1m +n(b1)∑
l=1
Ab1
l Φb1
l (t)
(1.6.1)
f(t, x) = fm +nT (f)∑
l=1
nS(f)∑
p=1
AflpΦfTl (t)ΦfS
p (x) u0(x) = u0m +n(u0)∑
l=1
Au0
l Φu0
l (x)
(1.6.2)
où le vecteur des paramètres
µ =(ν, b0m, A
b0
1 , . . . , Ab0
n(b0), b1m, Ab1
1 , . . . , Ab0
n(b1), fm, Af11, A
f12, . . . , A
f1,nS(f),
Af2,1, . . . , Af2,nS(f), . . . , A
fnT (f),nS(f), u0m, A
u0
1 , . . . , Au0
n(u0)
)
satisfait une condition technique de compatibilité (4.1.4) destinée à assurer
la régularité de la solution u.
Les fonctions Φb0 ,Φb1 ,ΦfS ,ΦfT et Φu0 sont des fonctions, de l’espace ou du
temps, quelconques suffisamment régulières (des sinus, ou des cosinus dans
le cas de la paramétrisation par des séries de Fourier tronquées).
Signalons à ce stade que, conformément à l’usage dans les publications trai-
tant de la méthode base réduite, le vecteur des paramètres d’entrée est noté
µ = (µ1, . . . , µp) dans les chapitres 4 et 5, et non X = (X1, . . . ,Xp), comme
dans le reste du manuscrit.

INTRODUCTION 69
L’un des intérêts de la méthode base réduite est la disponibilité d’une borne
d’erreur rigoureuse calculable explicitement via une procédure offline/online
efficace. Nous souhaitons également disposer d’une borne d’erreur dans le
contexte présenté ci-dessus.
1.6.2 Approches existantes
Nous présentons maintenant les deux approches existant dans la littérature.
Paramétrisation de la viscosité
L’approche décrite ici est celle de [71]. Dans cette approche, la condition
initiale et la condition aux limites sont fixées (à zéro), et le terme de forçage
est fixé (à 1). Le seul paramètre est donc la viscosité ν. Nous résumons
rapidement les caractéristiques de cette approche ; en effet, ces dernières sont
reprises dans notre approche, les détails peuvent donc être trouvés dans la
section suivante ou dans le chapitre 4.
Gestion de la dépendance en temps et de la non-linéarité. L’équation
de Burgers est d’abord discrétisée en temps suivant un schéma implicite,
c’est-à-dire que l’on se donne un pas de temps ∆t > 0 et que l’on cherche
u1, . . . , uT/∆t satisfaisant la relation de récurrence :
ut+1 −∆tF (t, ut+1) = ut, ∀t,
où F (t, ·) est un opérateur différentiel en espace.
Chacune de ces relations est une EDP (non-linéaire) faisant intervenir seule-
ment les variables d’espace. L’étape suivante est de discrétiser en espace, par
une méthode d’éléments finis P1, ce qui transforme l’EDP non-linéaire en
système d’équations algébriques non-linéaires.
La résolution de ce système non-linéaire est alors effectuée à l’aide de la
méthode de Newton, qui ramène le problème non-linéaire à une succession
de problèmes linéaires. Chacun de ces problèmes linéaires peut être alors
traité par la méthode base réduite, ce qui donne une procédure offline/online
de calcul de u.
Choix de base. Les auteurs proposent d’utiliser une variante de la mé-
thode greedy, adaptée afin de tenir compte de la dépendance temporelle.

70 Chapitre 1.
Borne d’erreur. Pour chaque pas de temps tk, une borne d’erreur sur
‖u(tk)− u(tk)‖ est établie, où ‖·‖ est la norme L2(0, 1). Les auteurs dé-
plorent la croissance exponentielle de cette borne d’erreur en fonction du
temps et constatent que cette croissance est encore plus importante dans le
cas des faibles viscosités.
Paramétrisation complète
L’autre référence existante est [59]. L’approche est très similaire à celle dé-
crite plus haut, à ceci près qu’elle permet la paramétrisation de la condition
initiale, de la condition aux limites de Dirichlet et du forçage sous la forme
(1.6.1).
La paramétrisation de la condition de Dirichlet se fait en se ramenant
d’abord, par translation, au cas où cette condition est nulle.
Signalons que les résultats numériques ayant trait à la borne d’erreur ne sont
pas présentés dans cette publication (c’est la vraie erreur qui est représentée,
et le calcul de cette vraie erreur nécessite de calculer la « vraie » solution
numérique, et c’est précisément ce que l’on souhaite éviter en utilisant une
réduction de modèle). Par ailleurs, les tests numériques sont faits avec des
conditions aux limites très proches (numériquement indiscernables) d’une
condition nulle.
1.6.3 Notre approche
Phase offline/online. Nous choisissons, c’est là une des différences entre
notre approche et celles présentées plus haut, d’intégrer la condition aux
limites de Dirichlet sous forme faible, c’est-à-dire que nous modifions la
forme faible de l’équation de Burgers (4.1.6) en une forme faible pénalisée
(4.1.9) imposant une valeur au bord proche de celle souhaitée. L’intérêt de
cette technique, comparée à l’approche décrite ci-dessus, est qu’elle introduit
moins de termes dans la décomposition affine des problèmes variationnels (le
nombre Q dans 1.3.3), ce qui diminue les temps de calcul offline et online,
ainsi que le besoin en espace de stockage des éléments calculés lors de la
phase offline.
Le reste de la réduction est similaire aux approches existantes : la forme
faible pénalisée (4.1.9) est discrétisée en espace pour obtenir (4.1.11), puis
en temps (section 4.1.2). Enfin, la méthode de Newton est appliquée pour

INTRODUCTION 71
obtenir l’équation linéarisée (4.1.14), qui est ensuite réduite dans la section
4.2, en suivant le principe donné en section 1.3.3.
Choix de base. Nous considérons trois méthodes de choix de base réduite :
1. le choix basé sur la POD, qui est une adaptation de la méthode POD
présentée en section 1.3.3 ; ce choix est décrit en section 4.2.3 ;
2. le choix basé sur un algorithme glouton (greedy), qui est utilisé dans
[71] ; l’algorithme est rebaptisé « local greedy » et est détaillé section
4.2.3 ;
3. le choix hybride « POD-Greedy », qui prend sa source dans [46] et que
nous décrivons section 4.2.3.
Borne d’erreur. Un aspect important de cette contribution est la borne
d’erreur a posteriori, qui est obtenue par une méthode différente de celle
existant dans la littérature, et qui permet d’effectuer une majoration plus
fine. Cette borne d’erreur, ainsi que sa méthode de calcul, est décrite en
détail dans la section 4.3.
Résultats obtenus. Les résultats numériques, présentés dans la section
4.4, montrent notamment que la réduction de l’équation de Burgers permet
un gain en temps de calcul significatif, tel qu’un gain de 85% en temps de
calcul, au prix d’une erreur relative certifiée de un pour mille (section 4.4.2).
Par ailleurs, notre borne d’erreur est comparée avec la borne existante (sec-
tion 4.4.5), et la comparaison est clairement à l’avantage de notre approche.
Enfin, les trois procédures de choix de base sont comparées en termes de
borne d’erreur relative moyenne et de borne d’erreur maximale (Figure 4.7).
Nous voyons que le choix POD donne le meilleur résultat en termes de borne
moyenne, alors que le greedy local permet de minimiser la borne maximale.
Ce résultat, peu surprenant au regard de la construction de ces méthodes,
est confirmé par la Figure 4.6 (même si pour n = 10 la méthode POD semble
en-dessous de la méthode greedy, il faut remarquer qu’à ce stade, l’erreur
relative, de l’ordre de 10−6 est inférieure à la précision numérique).

72 Chapitre 1.
1.7 Introduction au Chapitre 5
Estimation d’erreur sortie-dépendante pour la mé-
thode base réduite
Le chapitre 5 fait l’objet d’une publication soumise [Janon4]. Il a pour but
d’apporter une réponse à la question 5, à savoir le développement d’une
borne d’erreur métamodèle dépendant de la sortie (quantité d’intérêt) consi-
dérée.
Cette section d’introduction au chapitre 5 procède dans le même ordre que
la section précédente : description de la problématique, présentation des
approches existantes, résumé de notre approche et résultats obtenus.
1.7.1 Problématique
Avant de décrire la problématique de ce chapitre, commençons par introduire
son contexte et ses notations.
Dans le chapitre 5, nous considérons un espace de dimension finie X, nous
notons µ le paramètre d’entrée et nous considérons la solution u(µ) ∈ X du
système d’équations linéaires :
A(µ)u(µ) = f(µ),
pour une matrice A(µ) et un vecteur f(µ) pouvant s’écrire :
A(µ) =Q∑
q=1
Θq(µ)Aq, f(µ) =Q′∑
q′=1
γq′(µ)fq′ .
Typiquement, ce système d’équations est obtenu en discrétisant la forme
faible d’une équation aux dérivées partielles, dans l’espace de grande di-
mension X. L’application de la méthode base réduite (voir 1.3.3) à cette
équation mène au système d’équations réduit :
A(µ)u(µ) = f(µ),
d’inconnue u(µ) appartenant à un espace réduit X ⊂ X fixé (X est l’espace
engendré par la base réduite, choisie par exemple par l’une des méthodes
présentée en section 1.3.3).

INTRODUCTION 73
Remarquons que, comme dans le chapitre précédent, le vecteur d’entrée est
noté µ et non X, et que la sortie du modèle n’est pas notée f mais s :
s(µ) = σ(u(µ)).
Cette sortie est supposée linéaire en u(µ). Autrement dit, σ est une forme
linéaire de X.
On définit s par :
s(µ) = σ(u(µ)).
Une fois qu’ont été calculés, grâce à une procédure offline/online dont la
procédure online est de complexité indépendante de dimX, les coefficients
de u(µ) dans la base réduite engendrant X, le scalaire s(µ) est rapide à
calculer. Il est donc naturel de le considérer comme « sortie réduite » du
modèle, et d’utiliser s comme métamodèle en lieu et place de s.
La problématique principale du chapitre est celle de la question 5 de la
section 1.1, à savoir de donner une borne explicitement calculable, via une
procédure offline/online avec phase online de complexité indépendante de
dimX, pour l’erreur de métamodèle |s(µ)− s(µ)|. Dans notre contexte, une
telle borne d’erreur sortie-dépendante est motivée par le fait qu’en analyse
de sensibilité, on considère le modèle uniquement au travers de cette quantité
d’intérêt.
Nous souhaitons également pouvoir utiliser cette borne pour certifier le cal-
cul des indices de Sobol à partir du métamodèle, rejoignant en cela notre
question 3.
1.7.2 Approches existantes
Approche « borne Lipschitz »
La première possibilité est d’utiliser la norme duale de s :
L = supv∈X,v 6=0
s(v)‖v‖
et d’utiliser la linéarité de s pour écrire la borne suivante :
|s(µ)− s(µ)| ≤ L ‖u(µ)− u(µ)‖ ≤ Lεu(µ),
où εu(µ) désigne la borne supérieure sur ‖u(µ)− u(µ)‖ donnée par la mé-
thode base réduite (voir section 1.3.3).

74 Chapitre 1.
Nous avons donné le nom de « borne Lipschitz » à cette borne, puisque L
coïncide avec la constante de Lipschitz de s dans le cas où s est linéaire.
Dans le cas où s n’est pas linéaire, cette borne est toujours valable si s est
L-lipschitzienne.
Approche basée sur l’adjoint
Dans cette section nous supposons, pour simplifier, que la matrice A(µ) est
symétrique pour tout µ. Nous supposons également que A(µ) est définie
positive.
L’autre approche disponible dans la littérature, décrite dans [72] et prenant
sa source dans [76], est de considérer la solution ua(µ) du problème adjoint :
A(µ)ua(µ) = −l, (1.7.1)
où l est le vecteur de X représentant la forme linéaire s :
s = 〈l, ·〉 .
Le problème 1.7.1 peut se voir appliquer la méthode base réduite, ce qui
permet de calculer une solution réduite adjointe ua(µ).
L’approche basée sur l’adjoint consiste à considérer comme sortie réduite la
sortie réduite « corrigée » :
sa(µ) = σ(u(µ)) + 〈A(µ)u(µ)− f(µ), ua(µ)〉 .
Cette sortie corrigée admet la borne d’erreur suivante :
|s(µ)− sa(µ)| ≤ ‖r(µ)‖∗ ‖ra(µ)‖∗α(µ)
, (1.7.2)
où r(µ) et ra(µ) désignent les formes linéaires sur X suivantes :
r(µ)(v) = vtA(µ)u(µ)− vtf(µ) ra(µ)(v) = vtA(µ)ua(µ) + vtl,
où, pour toute forme linéaire φ sur X,
‖φ‖∗ = supv∈X,v 6=0
φ(v)‖v‖ ,
et où α(µ) est la constante de coercivité de A(µ) :
α(µ) = infv,w∈X,v 6=0,w 6=0
vtA(µ)w‖v‖ ‖w‖ .
Remarquons que α(µ) > 0 par définie-positivité de A(µ).
En pratique, la borne (1.7.2) est calculable, grâce à une procédure offline/online
de calcul des normes des résidus ‖r(µ)‖ et ‖ra(µ)‖ (voir [Janon5] §3.2 et
[72]), et d’une borne inférieure sur α(µ) (voir [Janon5] §3.3 et [72]).

INTRODUCTION 75
1.7.3 Notre approche
Borne d’erreur
Nous pouvons faire les remarques suivantes sur les deux approches proposées
plus haut :
– d’une part, la borne Lipschitz est une borne optimale, parmi les bornes
qui ne dépendent que de la borne εu sur ‖u− u‖ ;
– d’autre part, la borne basée sur l’adjoint donne de meilleurs résultats
que la borne Lipschitz mais elle nécessite l’application de la méthode base
réduite sur le problème adjoint, ce qui double le temps de calcul nécessaire
aux phases offline et online.
La borne d’erreur que nous proposons au chapitre 5 est intermédiaire entre
ces deux approches, c’est-à-dire qu’elle fait entrer en jeu d’autres quantités
que εu, afin d’obtenir une borne d’erreur plus performante que la borne
Lipschitz, tout en ne nécessitant pas la considération du problème adjoint,
afin de ne pas augmenter le temps de calcul outre mesure.
L’idée principale est de remarquer que les deux bornes précédentes se basent
toutes sur un calcul offline/online de la norme du résidu ‖r(µ)‖∗, alors qu’il
est également possible de donner une procédure offline/online efficace pour
calculer le produit scalaire de r(µ) avec un vecteur déterminé durant la phase
offline.
Nous proposons donc de choisir une base orthonormée Φ = φ1, . . . , φdimXde X, de tronquer cette base en ne gardant que N < dimX vecteurs, et de
borner |s− s| en fonction des N produits scalaires :
〈r(µ), φ1〉 , . . . , 〈r(µ), φN 〉 .
Plus spécifiquement, nous obtenons une borne en probabilité (relativement
à µ), c’est-à-dire que nous explicitons une quantité ε(µ, α,N,Φ) telle que :
P (|s− s| ≥ ε(µ, α)) ≤ α, (1.7.3)
pour un niveau de risque α ∈]0; 1[ fixé.
L’expression de ε(µ, α,N,Φ) est la suivante :
ε(µ, α,N,Φ) = T1(µ,N,Φ) +T2(N,Φ)
α,
où T1(µ,N,Φ) et T2(N,Φ) sont définies section 5.1.2. La justification de
(1.7.3) fait l’objet du théorème 5 du chapitre 5.

76 Chapter 1.
Dans la suite du chapitre, nous donnons une heuristique pour le choix de Φ,
basée sur le théorème 6 chapitre 5, et, dans la section 5.1.3, nous décrivons
la procédure offline/online de calcul et d’estimation de T1 et T2.
Application à l’analyse de sensibilité
La borne d’erreur que nous obtenons est de nature probabiliste. La méthode
développée au chapitre 2 nécessitant une borne déterministe, il convient de
l’adapter afin de tenir compte du risque probabiliste de la borne métamodèle.
C’est ce qui est fait dans la section 5.2, où, dans le théorème 7, nous corri-
geons le risque de l’intervalle de confiance combiné décrit au chapitre 2 en
fonction du risque de la borne d’erreur.
Résultats obtenus
L’évaluation de notre méthode s’est faite sur deux cas test (sections 5.3 et
5.4).
Dans les deux cas test, nous constatons (figures 5.1 et 5.2) que la borne que
nous proposons donne de meilleurs résultats (en termes de borne d’erreur
moyennée sur un échantillon de paramètres de tests) que la borne Lipschitz
et que la borne basée sur le dual. Cette dernière nécessitant plus de calculs
que les autres bornes, nous avons dû corriger la taille de base réduite utilisée
(en abscisse sur les figures) afin de tenir compte de cette différence de com-
plexité entre les méthodes. Par ailleurs, nous prenons des niveaux de risques
petits (α = 10−2 ou α = 10−4) afin de ne pas trop biaiser la comparaison de
notre borne avec risque α avec les autres, qui sont déterministes.
Enfin, nous montrons (table 5.1) que, comme le niveau de risque peut être
choisi très petit sans déteriorer significativement notre borne, la correction
du niveau de l’intervalle de confiance proposée dans le théorème 7 permet
d’utiliser la borne que nous proposons pour faire de l’analyse de sensibilité
certifiée.

Chapter 2
Uncertainties assessment in
global sensitivity indices
estimation from metamodels
Résumé: L’analyse de sensibilité globale nécessite de nombreuses exécu-
tions du modèle considéré et, de ce fait, elle est souvent impraticable pour
les modèles complexes et/ou nécessitant beaucoup de ressources de calcul
afin d’être évalués. L’approche métamodèle consiste à remplacer le modèle
original par un modèle approchant qui est beaucoup plus rapide à exécuter.
Cet article traite de la perte d’information lors de l’estimation des indices
de sensibilité due à l’approximation par le métamodèle. Nous présentons
une méthode permettant une analyse robuste de l’erreur, ouvrant ainsi la
voie à des gains significatifs en temps de calcul, sans contrepartie en termes
de précision et de rigueur. La méthodologie proposée est illustré sur deux
types de métamodèles différents: les métamodèles obtenus par base réduite
et ceux obtenus par interpolation à noyau (interpolation RKHS).
Abstract: Global sensitivity analysis is often impracticable for complex and
resource intensive numerical models, as it requires a large number of runs.
The metamodel approach replaces the original model by an approximated
code that is much faster to run. This paper deals with the information loss
in the estimation of sensitivity indices due to the metamodel approxima-
tion. A method for providing a robust error assessment is presented, hence
enabling significant time savings without sacrificing on precision and rigor.
77

78 Chapter 2.
The methodology is illustrated on two different types of metamodels: one
based on reduced basis, the other one on RKHS interpolation.

SENSITIVITY ESTIMATION FROM METAMODELS 79
2.1 Introduction
Many mathematical models use a large number of poorly-known parame-
ters as inputs. The impact of parameter uncertainty on the model output
is important for the user of these models. This problem can be tackled
by considering the uncertain input parameters as random variables, whose
probability distribution reflects the practitioner’s belief in the precision of
the parameter values. Model output, as function of the model inputs, is
then a random variable. Its probability distribution, uniquely determined
by the model and the distribution of the inputs, can give detailed and valu-
able information about the behavior of the output when input parameters
vary: range of attained values, mean value and dispersion about the mean,
most probable values (modes), etc.
Sensitivity analysis aims to identify the sensitive parameters, that is, pa-
rameters for which a small variation implies a large variation of the model
output. In global sensitivity analysis, one makes use of the probability
distribution of the outputs to define (amongst other sensitivity measures)
sensitivity indices (also known as Sobol indices). The sensitivity index of an
output with respect to an input variable is the fraction of output variance
which can be “explained” by the variation of the input variable, either alone
(one then speaks about main effect), or in conjunction with other input vari-
ables (total effect). This way, input variables can be sorted by the order of
importance they have on the output. One can also consider the proportion
of variance due to the variation of groups of two or more inputs, although
main effects and total effects are generally sufficient to produce a satisfying
sensitivity analysis; see, e.g., [48, 88] for more information about uncertainty
and sensitivity analysis.
Once these indices have been defined, the question of their effective calcula-
tion remains open. For most models, an exact, analytic computation is not
attainable (even expressing an output as an analytic function of the inputs
is infeasible) and one has to use numerical approximations.
A robust, popular way to obtain such approximations is Monte Carlo esti-
mation. This method simulates randomness in inputs by sampling a large
number of parameter values (from the selected input distribution). The
model output is then computed for each sampled value of the parameters.
This way, one obtains a sample of outputs, under the conjugate action of the

80 Chapter 2.
model and the input distribution. A suitable statistical estimator can then
be applied to form a numerical estimate of the sensitivity index based on the
sample of outputs. The Monte Carlo approach to Sobol indices computation
is described in [98], together with improvements in [49, 86].
A major drawback of the Monte Carlo estimation is that a large number of
model outputs have to be evaluated for the resulting approximation of the
sensitivity index to be accurate enough to be useful. In complex models, in
which a simulation for one single value of the parameters may take several
minutes, using these methods “as-is” is impracticable. In those cases, one
generally makes use of a surrogate model (also known as reduced model,
emulator, metamodel or response surface). The surrogate model has to
approximate the original model (called the full model) well, while being
many times faster to evaluate. The sensitivity index is then calculated via
a sample of outputs, each generated by a call to the surrogate model, thus
accelerating the overall computation. The aim of this paper is to quantify
accuracy loss due to the use of a metamodel combined to a Monte-Carlo
method to compute sensitivity indices.
The sensitivity index produced by Monte Carlo estimation with a surrogate
model is tainted by a twofold error. Firstly, our Monte-Carlo sampling
procedure assimilates the whole (generally infinite) population of possible
inputs with the finite, randomly chosen, sample; this produces sampling, or
Monte-Carlo error. Secondly, using a surrogate model biases the estimation
of the Sobol index, as what is actually estimated is sensitivity of surrogate
output, and not the full one; we call this bias the metamodel error.
A variation on the bootstrap, which addresses sampling error as well as
metamodel error, has been proposed in [100]; in this work, the authors
propose to use a bootstrap strategy on the metamodel residuals to estimate
metamodel error and Monte-Carlo error simultaneously. In [66], confidence
intervals for the Sobol index are estimated using the conditional distribution
of the Kriging predictor given the learning sample. This approach is limited
to Kriging metamodels. Finally, the paper by [11] makes use of the reduced-
basis output error bound to certify computation of the expectation and the
variance of a model output (and not, as in this paper, the Sobol indices)
with neglected sampling error.
In this paper, we want to make a rigorous sensitivity analysis, so it is impor-
tant to assess the magnitude of these two combined errors on the estimated
SENSITIVITY ESTIMATION FROM METAMODELS 81
sensitivity indices. We will also use such assessment to help with the choice
of correct approximation parameters (Monte-Carlo sample size and meta-
model fidelity) to achieve a desired precision in estimated indices.
We estimate sampling error by using a classical method, which comes at a
moderate numerical cost: bootstrap resampling ([33, 1]). Based on statisti-
cal estimation theory, the bootstrap technique involves the generation of a
sample of sensitivity index estimator replications, whose empirical distribu-
tion serves as approximation of the true (unknown) estimator distribution,
in order to produce asymptotic confidence intervals that give good results
in many practical cases.
To estimate metamodel error, we will use the surrogate models coming with
error bounds, that is, computable (or at least estimable) upper bounds on
the error between the original and the surrogate outputs. The reduced
basis (RB) method ([72, 45, 110, 44]) is a method leading, in some cases,
to such rigorously certified metamodels; it is applicable when the original
model is a discretization of a partial differential equation (PDE) depending
on the input parameters. Kriging ([92]) – also known as Gaussian process
metamodelling, which is equivalent to RKHS (reproducing kernel Hilbert
space) interpolation ([94]) – also provides error indicators. In contrast to the
RB method, Kriging/RKHS interpolation only requires “blackbox” training
data, i.e. a (finite) set of input-output pairs from the original model. This
makes it more versatile and easier to use, at the expense of rigor in the error
bounds and quality in the approximation.
Our new approach is based on the separation of the estimation of the meta-
model and the sampling error. The advantages brought by our approach
are: its rigorousness (the impact of the use of a surrogate model is prov-
ably bounded); its efficiency (our bounds are rather sharp, and go to zero
when metamodel errors decrease); its moderate computational requirements
(time is better spent on making a precise computation than at measuring
precision) and its versatility with respect to metamodel choice (the user can
choose any metamodel that comes with computable error bound or error in-
dicator). In other words, our method allows us to estimate sensitivity indices
by using a metamodel which greatly speeds up computation times, while rig-
orously keeping track of the precision of the estimation. The model has to
exhibit some regularity which can be captured by a metamodel. Moreover,
the metamodel error bound should not be too pessimistic.

82 Chapter 2.
This paper is organized as follows: in the first part, we describe the pre-
requisites for our approach: we give the definition of the standard Monte
Carlo estimator of the sensitivity indices of interest; in the second part, we
present our confidence interval estimation technique for the sensitivity index,
which accounts for the two sources of error described earlier (sampling and
metamodel). In the third part, we present applications of our method for
reduced-basis and RKHS/Kriging interpolation metamodels, and compare
our method with the method described in [100].
2.2 Review of sensitivity indices
2.2.1 Definition
In order to define sensitivity indices, we choose a probability distribution for
the input variables, considering each input variableXi (i = 1, . . . , p) as a ran-
dom variable with known distribution; the model output Y = f(X1, . . . ,Xp)
(assumed to be square-integrable, non a.s. constant and scalar: multiple
outputs can be treated separately) is thus for X = (X1, . . . ,Xp) a σ(X)-
measurable random variable (assuming that f is a σ(X)-measurable func-
tion). We further assume that the Xi’s are mutually independent. We also
fix throughout all this paper an input variable of interest 1 ≤ i ≤ p. We
define the first-order main effect of Xi on Y by:
Si =VarE(Y |Xi)
VarY(2.2.1)
Si is the sensitivity index in which we are interested in this paper but other
indices (total effect, high-order effects) exist and our methodology can read-
ily be extended to these indices.
2.2.2 Monte-Carlo estimator
We are interested in the following Monte-Carlo estimator for Si ([49, 86]): a
sample size N ∈ N being given, let
Xkk=1,...,N
and
X′kk=1,...,N
be two
random i.i.d. samples of size N each, drawn from the distribution of the
input vector X.
For k = 1, . . . , N , we note:
yk = f(Xk) (2.2.2)

SENSITIVITY ESTIMATION FROM METAMODELS 83
and:
y′k = f(X ′k
1 , . . . ,X′ki−1,X
ki ,X
′ki+1, . . . ,X
′kp ) (2.2.3)
The Monte-Carlo estimator of Si is then given by:
Si =yy′ − y × y′
y2 − y2(2.2.4)
where, for any vector v = (v1, . . . , vN ),
v =1N
N∑
k=1
vi
It can be shown that Si is a strongly consistent estimator of Si.
Remark: our methodology can be extended to higher order Sobol indices by
choosing primed output sample y′k appropriately. More specifically, for a
subset of variables I ⊂ 1, . . . , p, the closed index with respect to I, defined
by:
SI =VarE(Y |(Xi)i∈I)
VarY
is estimated by using:
y′k = f(X′k
I ), where X ′kI,i =
Xki if i ∈ I
X ′ki else
.
and standard high-order indices can be treated by subtracting the effects of
the proper subsets of I.
2.3 Quantification of the two types of error in index
estimation
We now present our method for estimating the two types of error that occur
in Monte-Carlo sensitivity index estimation on a reduced-basis metamodel.
In Sections 2.3.1 and 2.3.2, we show two approaches for taking metamodel
error in account. In Section 2.3.3, we review the bootstrap, which we will
use for the treatment of sampling error. Section 2.3.4 shows how to combine
metamodel error and Monte-Carlo estimation in order to provide the final
index interval estimation.

84 Chapter 2.
2.3.1 Metamodel error in index estimation
We now denote by f : P ⊆ Rp → R the metamodel output approximating
f : P → R, and by ε the pointwise error bound that certifies the metamodel
approximation, i.e. we have:∣∣∣f(x)− f(x)
∣∣∣ ≤ ε(x) ∀x ∈ P
For a pair of samples(Xkk=1,...,N , X′kk=1,...,N
)of inputs, we can use
our metamodel output f and our metamodel error bound ε to compute, for
k = 1, . . . , N :
yk = f(Xk), y′k = f(X ′k
1 , . . . ,X′ki−1,X
ki ,X
′ki+1, . . . ,X
′kp ) (2.3.1)
and:
εk = ε(Xk), ε′k = ε(X ′k
1 , . . . ,X′ki−1,X
ki ,X
′ki+1, . . . ,X
′kp ) (2.3.2)
In this section, we find accurate, explicitly and efficiently computable bounds
Smi and SMi , depending only on yk, y′k, εk and ε′
k so that:
Smi ≤ Si ≤ SMi (2.3.3)
In other words, we want lower and upper bounds on the full model based
sensitivity index estimator Si computable from surrogate model calls.
We now define, for any z = (z1, . . . , zN , z′1, . . . , z
′N ) ∈ R2N and any a, t, t′ ∈ R
the R function by:
R(a; z, t, t′) =N∑
k=1
(z′k − (a(zk − t) + t′)
)2.
Let y = (y1, . . . , yN , y′1, . . . , y
′N ). By setting first derivative of R with respect
to a to zero, making use of the convexity of R(·; y, y, y′) and using the
definition (2.2.4) of Si, one easily shows that:
Si = argmina∈R
R(a; y, y, y′). (2.3.4)
In other words, Si is the slope of the linear least squares regression of the
y′kk on the ykk. The key of our approach is to bound R(a; y, y, y′)
between two quantities which are computable without knowing y, nor y and
y′ and by using (2.3.4) to deduce bounds for any realization (ie., evaluation

SENSITIVITY ESTIMATION FROM METAMODELS 85
on a sample) of Si which depend only on metamodel outputs and error
bounds, that is yk, εk, y′k, ε
′k, k = 1, . . . , N .
Recall that:
yk = f(Xk), y′k = f(X ′k
1 , . . . ,X′ki−1,X
ki ,X
′ki+1, . . . ,X
′kp )
and:
εk = ε(Xk), ε′k = ε(X ′k
1 , . . . ,X′ki−1,X
ki ,X
′ki+1, . . . ,X
′kp ).
Define:
Rinf (a; y, ε, t, t′) =N∑
k=1
inf
zk∈[yk−εk;yk+εk],z′k∈[y′
k−ε′
k;y′
k+ε′
k]
(z′k − (a(zk − t) + t′)
)2
(2.3.5)
and:
Rsup(a; y, ε, t, t′) =N∑
k=1
supzk∈[yk−εk;yk+εk],z′
k∈[y′
k−ε′
k;y′
k+ε′
k]
(z′k − (a(z − t) + t′)
)2
(2.3.6)
where y = (y1, . . . , yN , y′1, . . . , y
′N), ε = (ε1, . . . , εN , ε
′1, . . . , ε
′N ).
It is clear that:
Rinf (a; y, ε, t, t′) ≤ R(a; y, t, t′) ≤ Rsup(a; y, ε, t, t′) ∀a, t, t′ ∈ R (2.3.7)
Note that R, Rinf and Rsup are quadratic polynomials in a. We name
α, β, γ, αinf , βinf , γinf , αsup, βsup and γsup their respective coefficients. In
other words, we have:
R(a; y, t, t′) = αa2 + βa+ γ
Rinf (a; y, ε, t, t′) = αinfa2 + βinfa+ γinf (2.3.8)
Rsup(a; y, ε, t, t′) = αsupa2 + βsupa+ γsup (2.3.9)
These coefficients are computable by evaluating
Rinf (a; y, ε, t, t′) and Rsup(a; y, ε, t, t′)
for three different values of a and solve for the interpolating quadratic func-
tions. These coefficients depend on t and t′, as well on y (for α, β, γ) and y
and ε (for the other coefficients). We do not explicitly write this dependence
until the last part of our discussion.

86 Chapter 2.
Using (2.3.7) we see that the quadratic function of a:
(αinf − α)a2 + (βinf − β)a+ γinf − γ
is negative or zero; hence it takes a non-positive value for a = 0, and has a
non-positive discriminant:
γinf − γ ≤ 0 (2.3.10)
(βinf − β)2 ≤ 4(αinf − α)(γinf − γ) (2.3.11)
As (βinf − β)2 ≥ 0, Equations (2.3.10) and (2.3.11) above imply that αinf −α ≤ 0, and that:
βinf − δinf ≤ β ≤ βinf + δinf
for δinf = 2√
(αinf − α)(γinf − γ).
We now suppose that αinf > 0. As αinf is computable from yk, y′k, εk and
ε′k, one can practically check if this condition is met. If it is not the case,
our bound can not be used. We expect that if the metamodel error is not
too large, we will have αinf ≈ α and, as α > 0, the hypothesis αinf > 0 is
realistic.
So, under this supplementary assumption, we have:
argmina
R(a; y, t, t′) = − β
2α≥ −βinf + δinf
2αinf
Now using the second part of (2.3.7) and the same reasoning on the non-
positive quadratic function of a: R(a; y, t, t′) − Rsup(a; y, ε, t, t′), we find
that: α ≤ αsup, and: βsup − δsup ≤ β ≤ βsup + δsup. Hence,
argmina
R(a; y, t, t′) ≤ −βsup − δsup2αsup
where δsup = 2√
(α− αsup)(γ − γsup). This comes without supplementary
assumptions, because αsup ≥ α and α > 0, or else R(·; y, t, t′) would have
no minimum (even if the case α = 0 can seldom occur due to sampling
fluctuations, the hypothesis Y not constant a.s. ensures that increasing N
and/or changing the sample will lead to a case where α > 0).
As we clearly have δinf and δsup smaller than (or equal to)
δ := 2√
(αinf − αsup)(γinf − γsup),

SENSITIVITY ESTIMATION FROM METAMODELS 87
we deduce that:
−βinf (t, t′) + δ(t, t′)2αinf (t, t′)
≤ argmina
R(a; y, t, t′) ≤ −βsup(t, t′)− δ(t, t′)
2αsup(t, t′)
where we have made explicit the dependencies in t and t′.
To finish, it is easy to see that we have:
P := [y − ε; y + ε] ∋ y (2.3.12)
and:
P ′:= [y′ − ε′; y′ + ε′] ∋ y′ (2.3.13)
(where y, y′, ε and ε′ denote, respectively, the empirical means of (yk)k ,(y′k
)k , (εk)k
and(ε′k
)k) so that:
mint∈P ,t′∈P ′
(−βinf (t, t′) + δ(t, t′)
2αinf (t, t′)
)≤ Si = argmin
aR(a; y, t, t′)
and:
Si = argmina
R(a; y, t, t′) ≤ maxt∈P,t′∈P ′
(−βsup(t, t
′)− δ(t, t′)2αsup(t, t′)
)
Hence, (2.3.3) is verified with:
Smi = mint∈P ,t′∈P ′
(−βinf (t, t′) + δ(t, t′)
2αinf (t, t′)
), SMi = max
t∈P ,t′∈P ′
(−βsup(t, t
′)− δ(t, t′)2αsup(t, t′)
)
(2.3.14)
It is clear that Smi and SMi are computable without knowing the yks and
y′ks.
In practice, we compute approximate values of Smi and SMi by replacing
the min and max over P × P ′ by the min and max over a finite sample
Ξ ⊂ P × P ′.
2.3.2 Metamodel error in index estimation: a smoothed alterna-tive
The bounds we presented in the last section are sometimes uninteresting,
as, when ε is large enough with respect to f , the bounds Smi and SMi are not
tight enough to be useful: it happens for example that [0; 1] ⊂ [Smi ; SMi ].
Such a case is the RKHS interpolation metamodel example we present in
Section 2.4.2.

88 Chapter 2.
In this section, we present an alternative to the bound described in the
previous section. This alternative is interesting when ε is only moderately
small with respect to f .
We begin by defining ψi(z) as the Monte-Carlo sensitivity index estimator for
variable i using z = (z1, . . . , zN , z′1, . . . , z
′N ) as function evaluations sample:
ψi(z) =zz′ − zz′
z2 − z2.
It is clear that:
ψi(y1, . . . , yN , y′1, . . . , y
′N ) = Si,
where yk and y′k are defined in (2.2.2) and (2.2.3).
Also let:
Z =N∏
k=1
[yk − εk; yk + εk]×N∏
k=1
[y′k − ε′
k; y′k + ε′
k
].
Now, since:
∀k = 1, . . . , N yk ∈ [yk − εk; yk + εk] and y′k ∈ [y′
k − ε′k; y
′k + ε′
k],
we certainly have (y1, . . . , yN , y′1, . . . , y
′N ) ∈ Z and hence:
minz∈Z
ψi(z) ≤ Si ≤ maxz∈Z
ψi(z). (2.3.15)
Minimizers and maximizers of optimization problems in (2.3.15) often dis-
play a very irregular (nonsmooth) behavior (as a function of the sampled
inputs x1, . . . ,xN ,x′1, . . . ,x
′N), even for a smooth output f . This leads to
overly pessimistic bounds in (2.3.15). To overcome this difficulty, we pro-
pose to ensure smoothness of the solution by introducing a penalty factor
λ ≥ 0 and to take:
Sm,λi = ψi(zm,λ) SM,λi = ψi(zM,λ)
where:
zm,λ = argminz∈Z
(ψi(z) + λΠ(z)
)zM,λ = argmax
z∈Z
(ψi(z)− λΠ(z)
)(2.3.16)
for Π(z) a (non-negative) indicator of the smoothness of the function which
take z as values when evaluated on the input sample x1, . . . ,xN ,x′1, . . . ,x
′N.
For instance, one may take:
Π(z) =1
2N
2N∑
k=1
(zk − zSk
)2(2.3.17)
SENSITIVITY ESTIMATION FROM METAMODELS 89
with zSk a kernel-smoothed version of zk:
zSk =
∑2Nk′=1K
(‖xk′−xk‖h
)zk′
∑2Nk′=1K
(‖xk′−xk‖h
) (2.3.18)
for K an appropriate kernel (preferably with compact support, for reasons
of efficiency of the implementation), h a suitable bandwidth (in the sum we
have set xk+N = x′k for k = 1, . . . , N), and ‖·‖ the Euclidean norm on Rp.
The main difficulty is that these optimization problems are in potentially
large dimension 2N . However, the gradient of the objective functions are
analytically available – under (2.3.17) and (2.3.18) – and can be cheaply
evaluated, so we choose to use a L-BFGS quasi-Newton algorithm, as im-
plemented in L-BFGS-B ([118]), to solve problems (2.3.16).
Concerning the choice of λ and h, we opt for the following: h should be cho-
sen so as to have a reasonable proportion (say, 1 to 5 percent) of “neighbor”
points (that is to say, couples of points in xkk=1,...,N having a significantly
nonzero value on the kernel K). For the choice of λ: we plot, for a chosen h
held fixed, the length∣∣∣SM,λi − Sm,λi
∣∣∣ as function of λ, and then choose λ to
be the abscissa of the bottom-left corner of the “L-shaped” curve obtained.
2.3.3 Sampling error : bootstrap confidence intervals
Sampling error, due to the Monte-Carlo evaluation of the variances in (2.2.1),
can be quantified through an approximate confidence interval calculated
using bootstrap ([1]).
We use the bias-corrected (BC) percentile method presented in [31, 32].
The principle of this method can be summed up the following way: let
θ(X1, . . . ,Xn) be an estimator for an unknown parameter θ in a reference
population P. We generate a random i.i.d. n-sample x1, . . . , xn from
P, then we repeatedly, for b = 1, . . . , B, randomly draw x1[b], . . . , xn[b]with replacement from this sample and get a replication of θ by computing
θ[b] = θ(x1[b], . . . , xn[b]). This way we obtain a set R = θ[1], . . . , θ[B] of
replications of θ.
We now show how this sample can be used to estimate a confidence interval
for θ. We denote by Φ the standard normal cdf:
Φ(z) =1√2π
∫ z
−∞exp
(− t
2
2
)dt

90 Chapter 2.
and by Φ−1 its inverse.
Using R and the point estimate θ = θ(x1, . . . , xn), a “bias correction con-
stant” z0 can be estimated:
z0 = Φ−1
(#θ[b] ∈ R s.t. θ[b] ≤ θ
B
)
where #A denotes the number of elements in the set A.
Then, for β ∈]0; 1[, we define the “corrected quantile estimate” q(β):
q(β) = Φ(2z0 + zβ)
where zβ satisfies Φ(zβ) = β.
The central BC bootstrap confidence interval of level 1−α is then estimated
by the interval whose endpoints are the q(α/2) and q(1− α/2) quantiles of
R.
The BC bootstrap procedure is known to be robust to non-normality of θ.
The key advantage of bootstrapping our sensitivity estimators is that we
do not require supplementary model evaluations to estimate a confidence
interval; hence the computational overhead for getting a confidence interval
(versus pointwise estimation only) remains quite modest.
2.3.4 Combined confidence intervals
From Section 3.1 to 3.3, we have seen how to separately assess sampling error
and metamodel error. To take both sources of error into account simultane-
ously, we propose using bootstrap confidence intervals (see Section 2.3.3) by
calculating B bootstrap replications of Smi and SMi , where, for b = 1, . . . , B
each bootstrap pair(Smi [b]; SMi [b]
)is computed using (yk)k∈Lb
,(y′k
)k∈Lb
as
surrogate output samples, and associated error bounds (εk)k∈Lb,(ε′k
)k∈Lb
,
where Lb is a list of N integers sampled with replacement from 1, . . . , N.Here the bounds Smi and SMi can be computed using either the method
described in Section 2.3.1, or the one described in Section 2.3.2.
The BC bootstrap confidence interval procedure (see Section 2.3.3) can then
be used to produce (1−α)-level confidence intervals [Smi,α/2; Smi,1−α/2] for Smi ,
and [SMi,α/2; SMi,1−α/2] for SMi . We then take as combined confidence interval
of level 1 − α for Si the range [Smi,α/2; SMi,1−α/2]. This interval accounts for
sampling and metamodels error simultaneously: let, for b = 1, . . . , B, Si[b]

SENSITIVITY ESTIMATION FROM METAMODELS 91
be the bth bootstrap replication, computed using the true outputs (yk)k∈Lb.
As, for each b, we have:
Smi [b] ≤ Si[b] ≤ SMi [b],
it follows that
Smi,α/2 ≤ Si,α/2, and Si,1−α/2 ≤ SMi,1−α/2,
where Si,α/2 and Si,1−α/2 are the endpoints of the (1−α) BC-confidence in-
terval computed using (Si[b])b as replications. It follows that [Si,α/2; Si,1−α/2]
is contained in [Smi,α/2; SMi,1−α/2] and, hence, the level of the latter interval is
greater than the level of the former. As the level of the [Si,α/2; Si,1−α/2] is
(asymptotically) equal to 1 − α, the asymptotic level of the combined con-
fidence interval [Smi,α/2; SMi,1−α/2] should theoretically be, by design, greater
than 1− α.
2.4 Applications
2.4.1 Application to a reduced basis metamodel
The reduced basis method ([72, 78]) can be applied when the output is a
functional of the discretized solution of a partial differential equation (PDE).
In particular cases (for instance [72] for elliptic equations, [57] for viscous
Burgers equation, [108] for parabolic equations), it has been shown that the
reduced basis output error bounds are accurate and useful. In these cases,
due to the intrusive nature of the reduced basis approach and “problem-
dependent” considerations made during the construction of the metamodel,
one can expect fastly-convergent, tight and fully justified error bounds for
the sensitivity indices.
In this section, we test our combined confidence interval procedure described
in Sections 2.3.1 and 2.3.4, and compare it with Monte-Carlo estimation on
the full model (with bias-corrected bootstrap to assess sampling error). Our
criteria for comparison are the CPU times needed to compute the intervals
and the lengths of these intervals (the smaller the better). Note that the
error bounds given by the reduced basis method are sufficiently small so
that the “smoothness” bounds described in Section 2.3.2 give similar results
to the method of Section 2.3.1.

92 Chapter 2.
In all our tests we take α = .05 and B = 2000 bootstrap replications. We
checked that this value of B is large enough by increasing B (ie., setting
B = 4000), and notice that our results remain significantly unchanged.
Model set-up
Let u, a function of space x ∈ [0; 1] (note that space variable x is unrelated
to input parameter vector x) and time t ∈ [0, T ] (T > 0 is a fixed (i.e.,
known) parameter) satisfying the viscous Burgers’ equation:
∂u
∂t+
12∂
∂x(u2)− ν ∂
2u
∂x2= ψ (2.4.1)
where ν ∈ R+∗ is the viscosity, and ψ ∈ C0
([0, T ], L2(]0, 1[)
)is the source
term.
For u to be well-defined, we also prescribe initial value u0 ∈ H1(]0, 1[) (ie. u0
is in the Sobolev space of square-integrable functions whose first derivative
is square-integrable), and continuous boundary values b0, b1 ∈ C0([0, T ]).
The initial u0 and boundary values b0 and b1 are parametrized the following
way:
b0(t) = (u0m)2 +n(b0)∑
l=1
Ab0
l sin(ωb0
l t)
b1(t) = u0(1) +n(b1)∑
l=1
Ab1
l sin(ωb1
l t)
ψ(t, x) = ψm +nT (ψ)∑
l=1
nS(ψ)∑
p=1
Aψlp sin(ωψTl t) sin(ωψSp x)
u0(x) = (u0m)2 +n(u0)∑
l=1
Au0
l sin(ωu0
l x)
The values of the angular frequencies ωb0
l , ωb1
l , ωψTl , ωψSp and ωu0
l , as well as
their cardinalities n(b0), n(b1), nT (ψ), nS(ψ) and n(u0) are fixed (known),
while our uncertain parameters, namely: viscosity ν, coefficients ψm and
u0m, and amplitudes(Ab0
l
)l=1,...,n(b0)
,(Ab1
l
)l=1,...,n(b1)
,(Aψlp
)l=1,...,nT (ψ);p=1,...,nS(ψ)
and(Au0
l
)l=1,...,n(u0) live in some Cartesian product of intervals P defined
by:

SENSITIVITY ESTIMATION FROM METAMODELS 93
P =
x =(ν,Ab0
1 , . . . , Ab0
n(b0), Ab1
1 , . . . , Ab0
n(b1), ψm, Aψ11, A
ψ12, . . . , A
ψ1,nS(ψ),
Aψ2,1, . . . , Aψ2,nS(ψ), . . . , A
ψnT (ψ),nS(ψ), u0m, A
u0
1 , . . . , Au0
n(u0)
)(2.4.2)
The solution u = u(x) depends on the parameter vector x above.
The “full” model is obtained by discretizing the initial-boundary value prob-
lem, using a discrete time grid tk = k∆tk=0,...,T/∆t, where ∆t > 0 is the
time step, and, space-wise, using P1 Lagrange finite elements built upon an
uniform subdivision of [0; 1]: xi = i/N, for i = 0, . . . ,N . Our full output
is:
f(x) = f(u(x)) =1N
N∑
i=0
u(t = T, x = xi)
The reduced basis method is then applied to yield a surrogate solution u of
(2.4.1), as well as an error bound εu on u. The reader can refer to [57] for full
details on discretization, reduction and derivation of the RB error bound for
this model. The main idea of the reduced basis method is to project u onto
a well-chosen subspace of X whose dimension n (the reduced basis size) is
smaller than the dimension of the finite element space that can be used to
solve (2.4.1) numerically.
In our numerical experiments, we take N = 60, ∆t = .01, T = .05, nS(ψ) =
nT (ψ) = n(b0) = n(b1) = 0, n(u0) = 1, ωu0
1 = 0.5, Au0
1 = 5 and ψm = 1.
The two input parameters are independent and uniformly sampled. The
table below contains the ranges for them, and also the “true” values of the
sensitivity indices, which have been calculated (in more than 14h CPU time)
using a Monte-Carlo simulation with large sample size N = 4 × 10⁶ (so as
to BC bootstrap confidence intervals of length < 10−2) on the full model:
Parameter Range Confidence interval for sensitivity index
ν [1 ; 20] [0.0815;0.0832]
u0m [0 ; 0.3] [0.9175;0.9182]
For benchmarking purposes, as they were computed using the true model
with a large Monte-Carlo sample size, we can take the following values:
Sν = 0.082 and Su0m = 0.918 (2.4.3)
as “true” sensitivity indices.

94 Chapter 2.
Empirical coverage of combined confidence intervals
We test the performance of our combined confidence intervals by assessing
their empirical coverage. This empirical coverage is measured by computing,
for each input variable, 100 combined confidence intervals (each time with
different input sample), and counting the proportion of intervals containing
the true values in (2.4.3). The reduced basis size is n = 9; Monte-Carlo
sample size is N = 300. Results are gathered in the table below:
Parameter Mean confidence interval Empirical coverage
ν [ 0.0139;0.2083 ] 0.91
u0m [0.8421;0.9491] 0.87
Convergence benchmark
Figure 2.1 shows the lower Sm and upper SM bounds (defined in Section
2.3.1) for different reduced basis sizes (hence different metamodel precisions)
but fixed sample of size N = 2000, as well as the bootstrap confidence
intervals computed using the procedure presented in Section 2.3.4. This
figure exhibits the fast convergence of our bounds to the true value of the
sensitivity index as the reduced basis size increases. We also see that the
part of the error due to sampling remains constant, as sample size stays the
same. We also notice that the true values lie between Smi,.025 and SMi,1−.025,
and not always between Smi and SMi ; this is due to the Monte-Carlo part of
the error, which is not taken into account by the [Smi ; SMi ] bounds.
Choice of n and N
In practice, one wants to estimate sensitivity indices with a given precision
(ie. to produce (1−α)-level confidence intervals with prescribed length), and
has no a priori indication on how to choose N and n to do so. Moreover, for
one given precision, there may be multiple choices of suitable couples (N,n),
balancing between sampling and metamodel error. Increasing N and/or n
will increase the overall time for computation and improve the precision of
the calculation (thanks to reduction in sampling error for increased N , or
reduction in metamodel error for increased n).
We wish to choose the best compromise, that is, the one that gives the small-
est computation time; for the reduced basis method, this time is roughly
proportional to N ×n3 (as a number proportional to N of linear systems of

SENSITIVITY ESTIMATION FROM METAMODELS 95
0
0.02
0.04
0.06
0.08
0.1
0.12
0.14
0.16
0.18
0.2
0.22
7 8 9 10 11 12 13
sensi
0
reduced basis size
lower bound Smi
upper bound SMilower bound, 95% CI Sm
i,.05/2upper bound, 95% CI SM
i,1−.05/2
0.8
0.82
0.84
0.86
0.88
0.9
0.92
0.94
0.96
0.98
7 8 9 10 11 12 13
sensi
2
reduced basis size
lower bound Smi
upper bound SMilower bound, 95% CI Sm
i,.05/2upper bound, 95% CI SM
i,1−.05/2
Figure 2.1: Convergence benchmark for sensitivity indices estimation in the
Burgers’ model, left: variable ν, right: variable u0m. We plotted, for a fixed
sample size N = 2000, estimator bounds Smi and SMi defined in (2.3.1), and
endpoints Smi,.025 and SMi,1−.025 of the 95% confidence interval, for different
reduced basis sizes.

96 Chapter 2.
size n have to be solved). On the other hand, the length of the combined
confidence interval can be modelled as the sum of two terms:
Zα√N
+C
an(2.4.4)
where Zα, C are positive constants and a > 1 is a constant. The first term
accounts for sampling error; its form is heuristically deduced from central
limit theorem. The second accounts for metamodel error; its exponential
decay is backed up by numerical experiments as well as theoretical works
(e.g. [12]). The parameters Zα, C and a can be found by doing “calibration
runs” with a fixed small sample size N and different reduced basis sizes
n1, . . . , nK , and by regressing the obtained confidence interval lengths using
(2.4.4).
Minimizing the computation time under the constraint that error is equal to
a given “target precision” leads to a straightforward constrained optimiza-
tion problem (P ), which can be solved, after estimation of Zα, C and n, to
find (after rounding to the closest integer) the optimal n and N for a desired
precision.
The results of the optimization procedure, for two different target precisions,
can be found in the table below. We also present the mean confidence
interval length:1p
p∑
i=1
(SMi,1−α/2 − Smi,α/2
),
to check that the obtained confidence intervals (CI) have the desired length.
Target precision= 0.04 Target precision= 0.02
N 8600 22000
n 11 11
CI for Sν [0.0691614 ; 0.119096] [ 0.0659997 ; 0.0937285 ]
CI for Su0m [0.890985 ; 0.919504] [ 0.914266 ; 0.926452 ]
Mean CI length 0.0389 0.0199
To check for the optimality of the choices of n and N , we ran the estimation
procedure for different n and N but (approximately) fixed time budget N ×n3. Results are in Table 2.1. Only the choice in the middle column, in italics,
is the result of the optimization procedure described in this paragraph. We
show that it leads to better (smaller) confidence intervals than the other
choices.

SENSITIVITY ESTIMATION FROM METAMODELS 97
N 5210 8600 23000
n 13 11 8
N × n3 11446370 11446600 11776000
Mean CI length 0.0416 0.0389 0.165
Table 2.1: Mean confidence interval lengths for different choices of n and N .
Full-scale example
We now present an example with more parameters. We take N = 300,
∆t = .01, T = .05, n(ψ) = 0, n(u0) = 5, n(b0) = n(b1) = 2, ψm = 1,
ωu0
1 = .5, ωu0
2 = 1, ωu0
3 = 1.5, ωu0
4 = 2, ωu0
5 = 2.5, ωb0
1 = ωb1
1 = .3 and
ωb0
2 = ωb1
2 = .6. Input parameters are assumed independent and uniformly
distributed in the ranges below:
Parameter(s) Range
ν [1 ; 20]
u0m,Au0
i (i = 1, . . . , 5) [0; 0.2]
Ab0
1 [1;1.3]
Ab0
2 [0;0.2]
Ab1
i (i = 1, 2) [0;0.2]
fm [0;0.2]
We used a reduced basis of size n = 13. The combined confidence intervals
obtained, for N = 7000, have mean length ≈ 0.08. Their computation
required N × (p + 1) = 91000 calls to the metamodel; these calls took 85
s of CPU time. By extrapolating the time necessary to generate the 200
(full) model evaluations for the choice of the reduced basis, we found that
creating bootstrap confidence intervals of length 0.08 using the full model
would require approximately 514 s. The use of a metamodel hence enabled
a 6x speedup.
2.4.2 Application to a RKHS interpolation metamodel
We test our method using a RKHS interpolation metamodel based on the
Ishigami function:
f(X1,X2,X3) = sinX1 + 7 sin2X2 + 0.1X43 sinX1
for (Xj)j=1,2,3 i.i.d. uniform in [−π;π].

98 Chapter 2.
Learning sample size n Variable (true index) Mean 95% combined conf. int. Mean length Coverage
110 X1 (0.3139) [0.207;0.759] 0.552 0.94
110 X2 (0.4424) [0.0169;0.561] 0.545 0.98
110 X3 (0) [0;0.356] 0.357 1
130 X1 (0.3139) [0.262;0.626] 0.364 0.83
130 X2 (0.4424) [0.083;0.491] 0.408 0.93
130 X3 (0) [0;0.256] 0.257 1
160 X1 (0.3139) [0.274;0.509] 0.235 0.92
160 X2 (0.4424) [0.216;0.486] 0.27 0.92
160 X3 (0) [0;0.180] 0.18 1
Table 2.2: Obtained confidence intervals for the RKHS interpolation meta-
model.
The analytical values of sensitivities are known:
S1 = 0.3139, S2 = 0.4424, S3 = 0.
We refer to 2.5 for details on the RKHS methodology and on the method of
computation of the error indicator.
The experimental design D, of size denoted by n, have been generated us-
ing maximin latin hypercube samples (using maximinLHS of R lhs pack-
age ([17]). The R package mlegp ([27]) is used as our RKHS interpola-
tion/Kriging toolbox.
Smoothing parameters are set to: λ = .6, h = .2. We computed, for different
learning sample sizes n, the empirical coverages and mean lengths of the
combined confidence intervals (with the “smoothed” alternative described
in Section 2.3.2). Monte-Carlo sample size is N = 1000, and B = 300
bootstrap replicates are computed. Finally, as Sobol indices are always
bounded by 0 and 1, the reported confidence interval is the intersection of
the computed interval with [0; 1] (note that one can instead shift the interval
to be a subset of [0; 1] while maintaining its original length as done in [100]).
Results are given in Table 2.2.
The bound described in Section 2.3.1 has been tested on this example but did
not give interesting results (ie. the produced intervals satisfied [Smi ; SMi ] ⊃[0; 1]). The reason is that the RKHS error indicator remains large, even for
the larger n values for which the metamodel construction is practicable.
We compared these results with the ones obtained with CompModSA, a soft-
ware package implementing the methodology described in [100]. We used

SENSITIVITY ESTIMATION FROM METAMODELS 99
Variable (true index) Mean 95% Combined conf. int. Mean length Coverage
X1 (0.3139) [0.0164222;0.218084] 0.202 0.02
X2 (0.4424) [0.0877679;0.351651] 0.264 0.11
X3 (0) [0.00750793;0.173349] 0.166 0.82
Table 2.3: Confidence intervals for the RKHS interpolation metamodel ob-
tained with CompModSA.
as parameters: surface=’mlegp’ (Kriging metamodel), n.mc.T=0 (we do not
want any total index computation), n.mc.S=1000 (sample size), n.samples=1
(one run), and n.CI=300 (generate confidence intervals using 300 bootstrap
replications). We contributed a patch for CompModSA, available at
http://ljk.imag.fr/membres/Alexandre.Janon/compmodsa.php, which adds
to sensitivity the option CI.S, set to TRUE to compute bootstrap confi-
dence intervals for the main effect index. The results, for a learning sample
of size n = 160, are shown in Table 2.3.
This comparison clearly shows that our method is able to account for meta-
model error, so as to keep the actual coverage of the produced confidence
interval close to the expected one. We have been unable to fully compare
our approach with the one of [66], as the lengths of the confidence interval
obtained with this approach were not available; however we can state that,
in this example, our method produces intervals of correct coverages for every
variable and every training set size we have tested.
Conclusion and perspectives
We presented a methodology to quantify the impact of the sampling er-
ror and the metamodel error on the sensitivity indices computation, when
the metamodel provides a pointwise error bound (or, at least, an error in-
dicator) on the output of interest. Sampling error is handled by a classic
bootstrap procedure, while metamodel error is managed using bounds on
the sensitivity index estimator. Quantification of those two types of errors
permits a certification on the performed estimation We applied our method
on two types of metamodels: intrusive (reduced basis) and non-intrusive
(RKHS interpolation). On the applications we see that our approach per-
forms well both for reduced-basis and RKHS interpolation. Our method
can also be applied with other metamodels, as soon as an assessment for
100 Chapter 2.
pointwise metamodel error exists.
2.5 Appendix – RKHS interpolation and error bound
We now briefly recall the RKHS (reproducing kernel Hilbert space) interpo-
lation method, and refer to [94] for the details. RKHS interpolation is known
to be (see [95]) equivalent to interpolation by Kriging, also known as Gaus-
sian process metamodelling. Using n evaluations of f , one can build a train-
ing sample consisting of n input-output pairs D = (x1, y1), . . . , (xn, yn),where x1, . . . ,xn is the experimental design and yi = f(xi) for i = 1, . . . , n.
Let R(·, ·) be a positive definite kernel; the RKHS interpolator of D with
respect to R is:
f(x) = k(x)TΣ−1S yS
where:
ΣS =
R(x1,x1) R(x1,x2) . . . R(x1,xn)
R(x2,x1) R(x2,x2) . . . R(x2,xn)...
.... . .
...
R(xn,x1) R(xn,x2) . . . R(xn,xn)
k(x) = (R(x1,x), . . . , R(xn,x))T , yS = (y1, . . . , yn)T
In practice, R is assumed to belong to a parametrized family; for instance,
R is a gaussian kernel:
R(x,y) = exp
−
p∑
j=1
θj (xj − yj)2
(2.5.1)
whose parameters θ1, . . . , θp are estimated from D by minimizing some con-
trast function.
If f belongs to the RKHS associated with the R kernel, there exist a constant
C, depending only on f and R, so that:∣∣∣f(x)− f(x)
∣∣∣ ≤ C√σ2Z(x) (2.5.2)
where:
σ2Z(x) = R(x,x)− k(x)TΣ−1
S k(x)
We propose to estimate the constant C, which is, up to a multiplicative
constant, the norm of f in the RKHS associated with R, by:
C = maxi=1,...,nτ
∣∣∣f(xτi )− f(xτi )∣∣∣
√σ2Z(xτi )

SENSITIVITY ESTIMATION FROM METAMODELS 101
where xτi i=1,...,nτ is a “test sample” that does not contain any point of the
experimental design (so as to ensure that σ2Z(xτi ) 6= 0 for all i = 1, . . . , nτ ).
For a continuous f , one easily sees that C converges, as xτi fills the pa-
rameter set P, to the smallest C so that (2.5.2) holds.
Acknowledgements: We wish to thank Jean-Claude Fort for a sugges-
tion which we exploited to perform our computation of the least square
metamodel-induced error bound. We also thank Anestis Antoniadis and In-
grid Van Keilegom for advice on bootstrap methodology, and Robert Miller
for language remarks. We finally thank anonymous referees for helpful com-
ments about the overall presentation of the paper. – This work has been
partially supported by the French National Research Agency (ANR) through
COSINUS program (project COSTA-BRAVA n°ANR-09-COSI-015).

102 Chapter 2.

Chapter 3
Asymptotic normality and
efficiency of two Sobol index
estimators
Résumé: De nombreux modèles mathématiques font intervenir plusieurs
paramètres qui ne sont pas tous connus précisément. L’analyse de sensibilité
globale se propose de sélectionner les paramètres d’entrée dont l’incertitude a
le plus d’impact sur la variabilité d’une quantité d’intérêt, sortie du modèle.
Un des outils statistiques pour quantifier l’influence de chacune des entrées
sur la sortie est l’indice de sensibilité de Sobol. Nous considérons l’estimation
statistique de cet indice à l’aide d’un nombre fini d’échantillons de sorties
du modèle: nous présentons deux estimateurs de cet indice et énonçons un
théorème central limite pour chacun d’eux. Nous démontrons que l’un de
ces deux estimateurs est optimal en terme de variance asymptotique. Nous
généralisons également nos résultats au cas où la vraie sortie du modèle n’est
pas observée, mais où seule une version dégradée (bruitée) de la sortie est
disponible.
Abstract: Many mathematical models involve input parameters, which
are not precisely known. Global sensitivity analysis aims to identify the
parameters whose uncertainty has the largest impact on the variability of
a quantity of interest (output of the model). One of the statistical tools
used to quantify the influence of each input variable on the output is the
Sobol sensitivity index. We consider the statistical estimation of this index
103

104 Chapter 3.
from a finite sample of model outputs: we present two estimators and state
a central limit theorem for each. We show that one of these estimators has
an optimal asymptotic variance. We also generalize our results to the case
where the true output is not observable, and is replaced by a noisy version.
NORMALITY AND EFFICIENCY IN SOBOL INDEX ESTIMATION 105
Introduction
Many mathematical models encountered in applied sciences involve a large
number of poorly-known parameters as inputs. It is important for the prac-
titioner to assess the impact of this uncertainty on the model output. An
aspect of this assessment is sensitivity analysis, which aims to identify the
most sensitive parameters, that is, parameters having the largest influence
on the output. In global stochastic sensitivity analysis (see for example [88]
and references therein) the input variables are assumed to be independent
random variables. Their probability distributions account for the practi-
tioner’s belief about the input uncertainty. This turns the model output
into a random variable, whose total variance can be split down into different
partial variances (this is the so-called Hoeffding decomposition see [109]).
Each of these partial variances measures the uncertainty on the output in-
duced by each input variable uncertainty. By considering the ratio of each
partial variance to the total variance, we obtain a measure of importance
for each input variable that is called the Sobol index or sensitivity index of
the variable [97]; the most sensitive parameters can then be identified and
ranked as the parameters with the largest Sobol indices.
Once the Sobol indices have been defined, the question of their effective com-
putation or estimation remains open. In practice, one has to estimate (in a
statistical sense) those indices using a finite sample (of size typically in the
order of hundreds of thousands) of evaluations of model outputs [48]. Indeed,
many Monte Carlo or quasi Monte Carlo approaches have been developed
by the experimental sciences and engineering communities. This includes
the FAST methods (see for example [23], [105] and references therein) and
the Sobol pick-freeze (SPF) scheme (see [97, 98]). In SPF a Sobol index is
viewed as the regression coefficient between the output of the model and its
pick-freezed replication. This replication is obtained by holding the value of
the variable of interest (frozen variable) and by sampling the other variables
(picked variables). The sampled replications are then combined to produce
an estimator of the Sobol index. In this paper we study very deeply this
Monte Carlo method in the general framework where one or more variables
can be frozen. This allows to define sensitivity indices with respect to a
general random input living in a probability space (groups of variables, ran-
dom vectors, random processes...). In this work, we study and compare two

106 Chapter 3.
Sobol index estimators based on the SPF scheme; the first estimator, de-
noted by SXN , is well-known, the second, denoted by TXN has not, to our best
knowledge, been considered in the literature so far. For both estimators, we
show convergence and give the rate of convergence; we also show that TXN is
optimal (in terms of asymptotic variance) amongst regular estimators which
are functions of the pick-freezed replications – this feature is called asymp-
totic efficiency and is a generalization of the notion of minimum variance
unbiased estimator (see [109] chapters 8 and 25 or [52] for more details).
The SPF method requires many (typically, around one thousand times the
number of input variables) evaluations of the model output. In many in-
teresting cases, an evaluation of the model output is made by a complex
computer code (for instance, a numerical partial differential equation solv-
ing algorithm) whose running time is not negligible (typically in the order
of the second or the minute) for one single evaluation. When thousands
of such evaluations have to be made, one generally replaces the original
exact model by a faster-to-run metamodel (also known in the literature as
surrogate model or response surface [10]) which is an approximation of the
true model. Well-known metamodels include Kriging [92], polynomial chaos
expansion [102] and reduced bases [72, 57], to name a few. When a meta-
model is used, the estimated Sobol indices are tainted by a twofold error:
sampling error, due to the replacement of the original, infinite population of
all the possible inputs by a finite sample, and metamodel error, due to the
replacement of the original model by an approximative metamodel.
The goal of this paper is to study the asymptotic behavior of these two
errors on Sobol index estimation in the double limit where the sample size
goes to infinity and the metamodel converges to the true model. Some work
has been done on the non-asymptotic error quantification in Sobol index
estimation in earlier papers [100, 66, 58] by means of confidence intervals
which account for both sampling and metamodel errors. In this paper, we
give necessary and sufficient conditions on the rate of convergence of the
metamodel to the exact model for asymptotic normality of a natural Sobol
index estimator to hold. The asymptotic normality allows us to produce
asymptotic confidence intervals in order to assess the quality of our estima-
tion. We also give sufficient conditions for a metamodel-based estimator to
be asymptotically efficient. Asymptotic efficiency of an other Sobol index
estimator has already been considered in [25]. In this work, the authors
NORMALITY AND EFFICIENCY IN SOBOL INDEX ESTIMATION 107
were interested in the asymptotic efficiency for local polynomial estimates
of Sobol indices. Our approach proposes an estimator which has a simpler
form, is less computationally intensive and is more precise in practice. More-
over, we derive results also in the case where the full model is replaced by a
metamodel.
This paper is organized as follows: in the first section, we set up the notation,
review the definition of Sobol indices and give two estimators of interest. In
the second section, we prove asymptotic normality and asymptotic efficiency
when the sample of outputs comes from the true model. These two prop-
erties are generalized in the third section where metamodel error is taken
into account. The fourth section gives numerical illustrations on benchmark
models and metamodels.
3.1 Definition and estimation of Sobol indices
3.1.1 Exact model
The output Y ∈ R is a function of independent random input variables
X ∈ Rp1 and Z ∈ Rp2. In other words, Y and (X,Z) are linked by the
relation
Y = f(X,Z) (3.1.1)
where f is a deterministic function defined on P ⊂ Rp1+p2 . We denote by
p = p1 + p2 the total number of inputs of f .
In the paper X ′ will denote an independent copy of X. We also write
Y X = f(X,Z ′).
We assume that Y is square integrable and non deterministic (VarY 6= 0).
We are interested in the following Sobol index:
SX =Var (E(Y |X))
Var(Y )∈ [0; 1]. (3.1.2)
This index quantifies the influence on the X input on the output Y : a value
of SX that is close to 1 indicates that X is highly influent on Y .
Remark 1. All the results in this paper readily apply when X is multidi-
mensional. In this case, SX is usually called the closed sensitivity index of
X (see [91]).

108 Chapter 3.
3.1.2 Estimation of SX
The next lemma shows how to express SX using covariances. This will lead
to a natural estimator which has already been considered in [49].
Lemma 1. Assume that the random variables X and Z are square inte-
grable. Then
Var(E(Y |X)) = Cov(Y, Y X).
In particular
SX =Cov
(Y, Y X
)
Var(Y ). (3.1.3)
Proof. On one hand, since YL= Y X (that is, Y and Y X have the same
distribution), we have
Cov(Y, Y X) = E(Y Y X)− E(Y )E(Y X) = E(Y Y X)− E(Y )2.
On the other hand, Y and Y X are independent conditionally on X, so that
E(Y Y X) = E(E(Y Y X |X)) = E(E(Y |X)E(Y X |X)) = E(E(Y |X)2).
Remark 2. Using a classical regression result, we see that
SX = argmina∈R
E((Y X − E(Y X))− a(Y − E(Y ))
)2. (3.1.4)
A first estimator. In view of Lemma 1, we are now able to define a first
natural estimator of SX (all sums are taken for i from 1 to N):
SXN =1N
∑YiY
Xi −
(1N
∑Yi)(
1N
∑Y Xi
)
1N
∑Y 2i −
(1N
∑Yi)2 ,
where, for i = 1, . . . , N :
Yi = f(Xi, Zi), Y Xi = f(Xi, Z
′i),
and (Xi, Zi)i=1,...,N and (Xi, Z′i)i=1,...,N are two independent and iden-
tically distributed (i.i.d.) samples of the distribution of (X,Z), with Ziiindependent of Z ′
ii.

NORMALITY AND EFFICIENCY IN SOBOL INDEX ESTIMATION 109
This estimator has been considered in [49], where it has been showed to be
a practically efficient estimator.
A second estimator. We can take into account the observation of
Y Xi 1≤i≤N to make an estimation of E(Y ) and Var(Y ) which is expected
to perform better than any other based on Yi1≤i≤N only. We propose the
following estimator:
TXN =
1N
∑YiY
Xi −
(1N
∑[Yi+Y X
i2
])2
1N
∑[Y 2
i +(Y Xi )2
2
]−(
1N
∑[Yi+Y X
i2
])2 . (3.1.5)
To our best knowledge, this estimator has not been considered in the liter-
ature. We will clarify what we mean when saying that TXN performs better
than SXN in Proposition 7, Section 3.2.2 and Subsection 3.4.1.
3.2 Asymptotic properties: exact model
3.2.1 Consistency and asymptotic normality
Throughout all the paper, we denote by Nk(µ,Σ) the k-dimensional Gaus-
sian distribution with mean µ and covariance matrix Σ, and, given any
sequence of random variables Rnn∈N, we note
RN =1N
N∑
n=1
Rn.
Proposition 5 (Consistency). We have:
SXNa.s.−→
N→∞SX (3.2.1)
TXNa.s.−→
N→∞SX . (3.2.2)
Proof. The result is a straightforward application of the strong law of large
numbers and that E(Y ) = E(Y X) and Var(Y ) = Var(Y X).
Proposition 6 (Asymptotic normality). Assume that E(Y 4) <∞. Then
√N(SXN − SX
) L→N→∞
N1
0,
Var((Y − E(Y ))
[(Y X − E(Y ))− SX(Y − E(Y ))
])
(VarY )2
(3.2.3)

110 Chapter 3.
and √N(TXN − SX
) L→N→∞
N1
(0, σ2
T
)(3.2.4)
where
σ2T =
Var((Y − E(Y ))(Y X − E(Y ))− SX/2
((Y − E(Y ))2 + (Y X − E(Y ))2
))
(VarY )2.
Proof of (3.2.3). We begin by noticing that SXN is invariant by any centering
(translation) of the Yi and Y Xi . To simplify the next calculations, we suppose
that they have been recentred by −E(Y ). By setting:
Ui =((Yi − E(Y ))(Y X
i − E(Y )), Yi − E(Y ), Y Xi − E(Y ), (Yi − E(Y ))2
)T,
(3.2.5)
this implies that:
SXN = Φ(UN )
with:
Φ(x, y, z, t) =x− yzt− y2
The central limit theorem gives that:
√N(UN − µ
) L−→N→∞
N4 (0,Γ)
where Γ is the covariance matrix of U1 and:
µ =
Cov(Y, Y X)
0
0
Var(Y )
.
The so-called Delta method [109] (Theorem 3.1) gives:
√N(SXN − SX
) L−→N→∞
N1(0, gTΓg)
where:
g = ∇Φ(µ).
Note that since by assumption VarY 6= 0, Φ is differentiable at µ, so that
the application of the Delta method is justified. By differentiation, we get
that, for any x, y, z, t so that t 6= y2:
∇Φ(x, y, z, t) =
(1
t− y2,
−z(t− y2) + (x− yz) · 2y(t− y2)2
, − y
t− y2, − x− yz
(t− y2)2
)T

NORMALITY AND EFFICIENCY IN SOBOL INDEX ESTIMATION 111
so that, by using (3.1.3):
g =
(1
VarY, 0, 0, − SX
VarY
)T.
Hence
gTΓg =Var
((Y − E(Y ))(Y X − E(Y ))
)
(VarY )2+
(SX)2
(VarY )2Var
((Y − E(Y ))2
)
−2SX
(VarY )2Cov
((Y − E(Y ))(Y X − E(Y )), (Y − E(Y ))2
)
=1
(VarY )2
(Var
((Y − E(Y ))(Y X − E(Y ))
)+ Var
(SX
((Y − E(Y ))2
))
−2Cov((Y − E(Y ))(Y X − E(Y )), SX(Y − E(Y ))2
))
=Var
((Y − E(Y ))
[(Y X − E(Y ))− SX(Y − E(Y ))
])
(VarY )2,
which is the announced result.
Proof of (3.2.4). As in the previous point, it is easy to check that TXNis invariant with respect to translations of Yi and Y X
i by −E(Y ). Thus,
TXN = Ψ(WN
)with:
Ψ(x, y, z) =x− (y/2)2
z/2 − (y/2)2
and:
Wi =((Yi − E(Y ))(Y X
i − E(Y )), (Yi − E(Y )) + (Y Xi − E(Y )),
(Yi − E(Y ))2 + (Y Xi − E(Y ))2
)T. (3.2.6)
By the central limit theorem,
√N
WN −
Cov(Y, Y X)
0
2VarY
L−→N→∞
N3(0,Σ)
where Σ is the covariance matrix of W1.
The Delta method for Ψ gives:
√N(TXN − SX
) L−→N→∞
N1(0, gTΣg)

112 Chapter 3.
where g is now:
g = ∇Ψ(Cov(Y, Y X), 0, 2VarY ).
We have, for any x, y, z so that z 6= y2/2:
∇Ψ(x, y, z) =( 1z/2− (y/2)2
,−y (z/2 − (y/2)2 − x− (y/2)2
)
(z/2 − (y/2)2)2 ,
− 12
x− (y/2)2
(z/2 − (y/2)2)2
)T.
Hence
g =
(1
VarY, 0, −1
2SX
VarY
)T
and we have
gTΣg =1
(VarY )2Var
((Y − E(Y ))(Y X − E(Y ))
)
+14
(SX)2
(VarY )2Var
((Y − E(Y ))2 + (Y X − E(Y ))2
)
−21
(VarY )2
12SX
×Cov((Y − E(Y ))(Y X − E(Y )), (Y − E(Y ))2 + (Y X − E(Y ))2
)
=1
(VarY )2
×Var
((Y − E(Y ))(Y X − E(Y ))− SX
2
((Y − E(Y ))2 + (Y X − E(Y ))2
)).
Proposition 7. The asymptotic variance of TXN is always less than or equal
to the asymptotic variance of SXN , with equality if and only if SX = 0 or
SX = 1.
To prove this Proposition, we need the following immediate Lemma:
Lemma 2. Y and Y X are exchangeable random variables, ie.
(Y, Y X) L= (Y X , Y ).
Proof of Proposition 7. The difference between the asymptotic variances is

NORMALITY AND EFFICIENCY IN SOBOL INDEX ESTIMATION 113
equal to:
− 2SX[Cov
((Y − E(Y ))(Y X − E(Y )), (Y − E(Y ))2
)
− Cov(
(Y − E(Y ))(Y X − E(Y )),12
((Y − E(Y ))2 + (Y X − E(Y ))2
))]
+ (SX)2
[Var
((Y − E(Y ))2
)− 1
4
(2Var
((Y − E(Y ))2
)
+ 2Cov((Y − E(Y ))2, (Y X − E(Y ))2
)]+ o(1). (3.2.7)
Thanks to exchangeability of Y and Y X , we have that:
Cov((Y − E(Y ))(Y X − E(Y )), (Y − E(Y ))2
)
= Cov((Y − E(Y ))(Y X − E(Y )), (Y X − E(Y ))2
)
hence the first term of the right-hand side of (3.2.7) is zero.
For the second term, we use Cauchy-Schwarz inequality to see that:
Cov((Y − E(Y ))2, (Y X − E(Y ))2
)≤
√Var ((Y − E(Y ))2) Var ((Y X − E(Y ))2)
= Var((Y − E(Y ))2
)
so the second term is always non-negative. This proves that the asymptotic
variance of SXN is greater than the asymptotic variance of TXN .
For the equality case, we notice that SX = 0 implies the equality of the
asymptotic variances. If SX 6= 0, equality holds if and only if there is
equality in Cauchy-Schwarz, ie. there exists k ∈ R so that:
(Y − E(Y ))2 = k(Y X − E(Y ))2
by taking expectations and using VarY = VarY X we see that k = 1 neces-
sarily, hence Y = Y X almost surely, and SX = 1 thanks to (3.1.3).
3.2.2 Asymptotic efficiency
In this section we study the asymptotic efficiency of SXN and TXN . This
notion (see [109], Section 25 for its definition) extends the notion of Cramér-
Rao bound to the semiparametric setting and enables to define a criteria of
optimality for estimators, called asymptotic efficiency.

114 Chapter 3.
Let P be the set of all cumulative distribution functions (cdf) of exchange-
able random vectors in L2(R2). It is clear that the cdf Q of a random vector
of L2(R2) is in P if and only if Q is symmetric:
Q(a, b) = Q(b, a) ∀(a, b) ∈ R2.
Let P be the cdf of (Y, Y X). We have P ∈ P thanks to Lemma 2.
Proposition 8 (Asymptotic efficiency). TXN N is asymptotically efficient
for estimating SX in P.
We will use the following Lemma, which is also of interest in its own right:
Lemma 3 (Asymptotic efficiency in P). 1. Let Φ1 : R → R be a func-
tion in L2(P ). The sequence of estimators
Φ1N
N
given by:
Φ1N =
1N
∑ Φ1(Yi) + Φ1(Y Xi )
2is asymptotically efficient for estimating E(Φ1(Y )) in P.
2. Let Φ2 : R2 → R be a symmetric function in L2(P ). The sequenceΦ2N
N
given by:
Φ2N =
1N
∑Φ2
(Yi, Y
Xi
)
is asymptotically efficient for estimating E(Φ2(Y, Y X)) in P.
Proof of Lemma 3. Let, for g ∈ L2(P ) and t ∈ R, P gt be the cdf satisfying:
dP gt = (1 + tg)dP.
It is clear that P gt t∈R ⊂ P if and only if g ∈ PP , where:
PP = g ∈ L2(P ) s.t. E(g(Y, Y X)) = 0 and g(a, b) = g(b, a)∀(a, b) ∈ R2
is the tangent set of P at P .
Let, for Q ∈ P:
Ψ1(Q) = EQ (Φ1(Y )) and Ψ2(Q) = EQ
(Φ2(Y, Y X)
).
We recall that EQ denotes the expectation obtained by assuming that the
random vector (Y, Y X) follows the Q distribution.
Following [109] Section 25.3, we compute the efficient influence functions of
Ψ1 and Ψ2 with respect to P and the tangent set PP . These empirical influ-
ence functions are related to the minimal asymptotic variance of a regular
estimator sequence whose observations lie in P (op.cit., Theorems 25.20 and
25.21). Let g ∈ PP .

NORMALITY AND EFFICIENCY IN SOBOL INDEX ESTIMATION 115
1. We have
Ψ1(P gt )−Ψ1(P )t
= EP
(Φ1(Y )g(Y, Y X)
)
= EP
[(Φ1(Y ) + Φ1(Y X)
2− E(Φ1(Y ))
)g(Y, Y X).
]
As:
Ψ1,P =Φ1(Y ) + Φ1(Y X)
2− E(Φ1(Y )) ∈ PP ,
it is the efficient influence function of Ψ1 at P . Hence the efficient
asymptotic variance is:
EP
((Ψ1,P
)2)
=Var
(Φ1(Y ) + Φ1(Y X)
)
4.
As, by the central limit theorem,
Φ1N
clearly achieves this effi-
cient asymptotic variance, it is an asymptotically efficient estimator of
Ψ1(P ).
2. We have:
Ψ2(P gt )−Ψ2(P )t
= EP
(Φ2(Y, Y X)g(Y, Y X)
)
= EP
[(Φ2(Y, Y X)− E(Φ2(Y, Y X))
)g(Y, Y X)
].
Thanks to the symmetry of Φ2, we have that
Ψ2,P = Φ2(Y, Y X)− E(Φ2(Y, Y X))
belongs to PP , hence it is the efficient influence function of Ψ2. So the
efficient asymptotic variance is:
EP
((Ψ2,P
)2)
= Var(Φ2(Y, Y X)
),
and this variance is achieved by
Φ2N
.
Proof of Proposition 8. By Lemma 3, we get that:
UN =
(1N
N∑
i=1
YiYXi ,
1N
N∑
i=1
Yi + Y Xi
2,
1N
N∑
i=1
Y 2i + (Y X
i )2
2
)(3.2.8)
is asymptotically efficient, componentwise, for estimating
U =(E(Y Y X), E(Y ), E(Y 2)
)(3.2.9)

116 Chapter 3.
in P.
Using Theorem 25.50 (efficiency in product space) of [109], we can deduce
joint efficiency from this componentwise efficiency.
Now, let Ψ be the function defined by:
Ψ(x, y, z) =x− y2
z − y2
and Ψ is differentiable on:
R3 \
(x, y, z)/z 6= y2,
Theorem 25.47 (efficiency and Delta method) of [109] implies that Ψ (UN )is asymptotically efficient for estimating Ψ(U) in P. The conclusion follows,
as Ψ(UN ) = TXN and Ψ(U) = SX .
3.3 Asymptotic properties: metamodel
3.3.1 Metamodel-based estimation
As said in the introduction, we often are in a situation where the exact
output f is too costly to be evaluated numerically (thus, Y and Y X are not
observable variables in our estimation problem) and has to be replaced by
a metamodel f , which is a faster to evaluate approximation of f . We view
this approximation as a perturbation of the exact model by some function
δ:
Y = f(X,Z) = f(X,Z) + δ,
where the perturbation δ = δ(X,Z, ξ) is also a function of a random variable
ξ independent from X and Z.
We also define, as before
Y X = f(X,Z ′).
Assuming again that Y is non deterministic and in L2, we can consider the
following vector of Sobol indices with respect to the metamodel:
SX =Var(E(Y |Z))
Var(Y )(3.3.1)
and its estimators:
SXN =1N
∑YiY
Xi −
(1N
∑Yi) (
1N
∑Y Xi
)
1N
∑Y 2i −
(1N
∑Yi)2 (3.3.2)

NORMALITY AND EFFICIENCY IN SOBOL INDEX ESTIMATION 117
TXN =
1N
∑YiY
Xi −
(1N
∑[Yi+Y
Xi
2
])2
1N
∑[Y 2
i +(Y Xi )2
2
]−(
1N
∑[Yi+Y X
i2
])2 . (3.3.3)
The goal of this section is to give sufficient conditions on the perturbation δ
for SXN and TXN to satisfy asymptotic normality (Subsection 3.3.2), and TXNto be asymptotically efficient (Subsection 3.3.3), with respect to the Sobol
index of the true model SX .
3.3.2 Consistency and asymptotic normality
In the first Subsection (3.3.2) we suppose that the error term δ does not
depend on N . In this case, if the Sobol index of the exact model is differ-
ent from the Sobol index of the metamodel, then neither consistency nor
asymptotic normality are possible. In the second subsection (3.3.2), we let
δ depend on N and we give conditions for consistency and asymptotic nor-
mality to hold.
First case : δ does not depend on N
Proposition 9. If SX −SX 6= 0 then neither SXN nor TXN are consistent for
estimating SX .
Proof. We have
SXN − SX = (SXN − SX) + (SX − SX).
The first term converges to 0 almost surely by Proposition 5 applied to SXN .
However, the second is nonzero by assumption.
The proof for the TXN estimator is exactly the same.
This Proposition shows that it is impossible to have asymptotic normality
for SXN and TXN in any nontrivial case if δ does not vanish (in some sense)
asymptotically. This justifies the consideration of cases where δ depends on
N , and this is the object of the next subsection.
Second case : Var δN converges to 0 as N →∞
We now assume that the perturbation δ is a function of the sample size N .
This entails that f , as well as Y , Y X and SX depend on N . We emphasize

118 Chapter 3.
this dependence by using the notations δN , fN , YN , Y XN . We keep, however,
using the notations SXN and TXN for the estimators of SX defined at (3.3.2)
and (3.3.3).
We further assume (until the end of the chapter) that δNL2
−→N→+∞
c for some
constant c.
Proposition 10. We have SX −→N→+∞
SX .
Proof. We clearly have that YNL2
−→N→+∞
Y + c.
We deduce that:
Var(YN)−→
N→+∞Var(Y + c) = Var(Y )
and
E(YN |Z) −→N→+∞
E(Y |Z) + c in L2.
From this last convergence we get
Var(E(YN |Z)
)−→
N→+∞Var (E(Y |Z)) .
This proves that SX = Var(E(YN |Z)
)/Var
(YN)
converges to
SX = Var (E(Y |Z)) /Var(Y )
when N goes to +∞.
Proposition 11. Assume there exist s > 0 and C > 0 such that
∀N, E
(∣∣∣YN∣∣∣4+s)< C. (3.3.4)
Then √N(SXN − SX
) L−→N→∞
N1
(0, σ2
S
)(3.3.5)
√N(TXN − SX
) L−→N→∞
N1
(0, σ2
T
)(3.3.6)
where σ2S and σ2
T are the asymptotic variances of SXN and TXN given, respec-
tively, in (3.2.3) and (3.2.4).
Proof. Proof of (3.3.5). Let
UN,i =(
(YN,i − E(Y ))(Y XN,i − E(Y )), YN,i − E(Y ), Y X
N,i − E(Y ),(YN,i − E(Y )
)2)

NORMALITY AND EFFICIENCY IN SOBOL INDEX ESTIMATION 119
and
UN :=1N
N∑
i=1
UN,i.
Using the Lindeberg-Feller central limit theorem (see e.g. [109] 2.27, with
YN,i = UN,i/√N), we get:
√N(UN − E
(U1,1
)) L−→N→∞
N4(0,Γ)
where Γ is the covariance matrix of the U1 vector defined in (3.2.5).
The use of this central limit theorem is justified by the fact that, under
assumption (3.3.4) of uniform boundedness of moments of YN , there are
s′ > 0 and C ′ such that:
∀N, E(||UN,i||2+s′) < C ′
where ‖·‖ is the standard Euclidean norm.
This ensures
∀ε > 0, E(||UN,i||21||UN,i||>ε√N ) → 0.
Then
E(||UN,i||21||UN,i||>ε√N ) = E
(||UN,i||2+s′
||UN,i||s′ 1||UN,i||>ε√N
)≤ C ′
εs′N s′/2.
This shows that for each i,∥∥∥UN,i
∥∥∥2
Nis uniformly integrable, hence, the
variance-covariance matrix of UN,i converges to Γ when N → +∞. As
UN,iP−→
N→+∞Ui, the same convergence holds in L2 and the covariance matri-
ces of UN,i converge (as N → +∞) to Γ, the covariance matrix of Ui.
We conclude the proof by applying the Delta method as for the exact model
(cf. the proof of Proposition 6).
Proof of (3.3.6). We set:
WN,i =((YN,i − E(Y ))(Y X
N,i − E(Y )), (YN,i − E(Y )) + (Y XN,i − E(Y )),
(YN,i − E(Y ))2 + (Y XN,i − E(Y ))2T .
As in the previous point, the Lindeberg-Feller theorem can be applied toWN,i
to yield the convergence:
√N(WN − E
(W1,1
)) L−→N→∞
N3(0,Σ)

120 Chapter 3.
where Σ is the covariance matrix of W1 defined in (3.2.6). The conclu-
sion follows again by an application of the Delta method as in the proof of
Proposition 6.
We are actually interested in the asymptotic distribution of√N(SXN − SX
).
In the remaining of the subsection, we will show that this convergence de-
pends on the rate of convergence to 0 of Var(δN ).
Theorem 1. Let:
Cδ,N = 2Var(Y )1/2[Corr(Y, δXN )− Corr(Y, Y X)Corr(Y, δN )
]
+ Var(δN )1/2[Corr(δN , δXN )− Corr(Y, Y X)
],
for δXN = δN (X,Z ′, ξ′), and, given any L2 random variables A and B of
nonzero variance:
Corr(A,B) =Cov(A,B)√VarAVarB
.
Assume that Cδ,N does not converge to 0.
1. If Var(δN ) = o
(1N
), then asymptotic normalities of SXN and TXN for
SX hold, i.e. √N(SXN − SX) −→
N→+∞N (0, σ2
S) (3.3.7)
and: √N(TXN − SX) −→
N→+∞N (0, σ2
T ). (3.3.8)
2. If NVar(δN ) → ∞, then SXN and TXN are not asymptotically normal
for SX .
3. If Cδ,N converges to a positive constant C and Var(δN ) =γ
CN+
o
(1N
), then:
√N(SXN − SX) −→
N→+∞N (γ, σ2
S),
and: √N(TXN − SX) −→
N→+∞N (γ, σ2
T ).
Remark 3. Obviously, if Cδ,N converges to 0, then asymptotic normalities
of SXN and TXN hold under weaker assumptions on Var(δN ).

NORMALITY AND EFFICIENCY IN SOBOL INDEX ESTIMATION 121
Proof of Theorem 1. The following decompositions:
√N(SXN − SX) =
√N(SXN − SX) +
√N(SX − SX) (3.3.9)
√N(TXN − SX) =
√N(TXN − SX) +
√N(SX − SX) (3.3.10)
make obvious that if√N(SX − SX) goes to some constant κ then
√N(SN − S) L−→
N→+∞N (κ, σ2
S)
and: √N(TN − S) L−→
N→+∞N (κ, σ2
T ).
The second point of the theorem is now clear from the proof of Proposition
9.
The remaining of the theorem is an immediate consequence of Lemma 4
below.
Lemma 4. We have:
√N(SX − SX
)= O
((NVar(δN ))1/2
).
Proof. We have:
SX − SX =Cov(YN , Y X
N )
VarYN− Cov(Y, Y X)
Var(Y )
=Cov(Y, Y X) + 2Cov(Y, δXN ) + Cov(δN , δXN )
Var(Y ) + 2Cov(Y, δN ) + Var(δN )− Cov(Y, Y X)
Var(Y )
=Var(Y )
(2Cov(Y, δXN ) + Cov(δN , δXN )
)
Var(Y ) (Var(Y ) + 2Cov(Y, δN ) + Var(δN ))
− Cov(Y, Y X) (2Cov(Y, δN ) + Var(δN ))Var(Y ) (Var(Y ) + 2Cov(Y, δN ) + Var(δN ))
=Var(δN )1/2Cδ
Var(Y ) + 2Cov(Y, δN ) + Var(δN )
and:
Var(Y ) + 2Cov(Y, δN ) + Var(δN ) = Var(Y ) + o(1).
Finally, Cδ,N is uniformly bounded because Var(δN ) goes to 0 and Var(Y )
is a constant.

122 Chapter 3.
3.3.3 Asymptotic efficiency
Proposition 12 (Asymptotic efficiency for the metamodel). Assume
1. ∃s > 0, C > 0 s.t. ∀N, E(∣∣Y
∣∣4+s)< C and E
(∣∣Y∣∣4+s
)< C ;
2. NVar(δN ) → 0 ;
3.√NE(δN ) → 0.
ThenTXN
is asymptotically efficient for estimating SX .
Remark 4. By Minkowski inequality, the first hypothesis implies E(δ4+sN ) <
2C1
4+s and the asymptotic normality by Lemma 4 and Theorem 1.
The proposition above will be proved using the following lemma.
Lemma 5. For all N ∈ N∗, let (ZN,i)i=1,...,N be a sequence of i.i.d variables
such that
1.√NE(ZN,i) −→
N→+∞0;
2. Var(ZN,i) −→N→+∞
0.
Then1√N
N∑
i=1
ZN,iP−→
N→+∞0.
Proof. The result follows after the following decomposition:
1√N
N∑
i=1
ZN,i =√N
(1N
N∑
i=1
ZN,i − E(ZN,1)
)+√NE(ZN,1).
Proof of Proposition 12. Let UN and U be the vectors defined in the proof
of Proposition 8, in (3.2.8) and (3.2.9), respectively, and:
UN =
(1N
N∑
i=1
YN,iYXN,i,
1N
N∑
i=1
YN,i + Y XN,i
2,
1N
N∑
i=1
Y 2N,i + (Y X
N,i)2
2
).
We will show that: √N(UN − UN
)P→
N→∞0. (3.3.11)
By Theorem 25.23 of [109] and the fact that (UN ) is asymptotically effi-
cient for U (shown in the proof of Proposition 8), this implies that(UN)
is asymptotically efficient for U , and the end of the proof of Proposition 8
shows the announced result.

NORMALITY AND EFFICIENCY IN SOBOL INDEX ESTIMATION 123
To prove (3.3.11), it is sufficient to prove componentwise convergence. We
will treat the second and the third components, as the result holds in the
same way for the other.
For the second component, we have
1√N
N∑
i=1
(YN,i − Yi) =1√N
N∑
i=1
δN,i
goes to 0 (in probability) by the previous lemma. The same holds for1√N
N∑
i=1
(Y XN,i − Y X
i ).
For the third component, we have
1√N
N∑
i=1
(Y 2N,i − Y 2
i ) = 21√N
N∑
i=1
δN,iYi +1√N
N∑
i=1
δ2N,i.
Now by assumption,
√NE(δN,iYi) ≤
√NE(δ2
N,i)E(Y 2i ) =
√N(Var(δN,i) + E(δN,i)2)E(Y 2
i ) → 0,
and by Cauchy-Schwarz inequality,
Var(δN,iYi) = E(δ2N,iY
2i )−(E(δN,iYi))2 ≤
√E(δ4
N,i)E(Y 4i )+E(δ2
N,i)E(Y 2i ) ≤ CE(δ4
N )1/2.
By assumption, for all i, δN,iP−→
N→+∞0. Hence, the same convergence holds
about δ4N,i. Since δN is in L4+s, then
δ4N
N
is uniformly integrable and we
get the convergence of E(δ4N ) to 0 when N → +∞.
We conclude by the lemma above. Again, the same convergence occurs for1√N
N∑
i=1
((Y XN,i)
2 − (Y Xi )2).
3.4 Numerical illustrations
In this section, we illustrate the asymptotic results of Sections 3.2.1 and
3.3.2 when the exact model is the Ishigami function [55]:
f(X1,X2,X3) = sinX1 + 7 sin2 X2 + 0.1X43 sinX1 (3.4.1)
for (Xj)j=1,2,3 are i.i.d. uniform random variables in [−π;π]. In this case,
all the integrability conditions are satisfied (we even have Y ∈ L∞).

124 Chapter 3.
The Sobol index of f with respect to input variable X1 is SX defined in
(3.1.2) for X = X1 and Z = (X2,X3); we denote it by S1. Similarly, S2
(resp. S3) is SX obtained taking X = X2 and Z = (X1,X3) (resp. X = X3
and Z = (X1,X2)).
Exact values of these indices are analytically known:
S1 = 0.3139, S2 = 0.4424, S3 = 0.
For a sample size N , a risk level α ∈]0; 1[ and for each input variable, a con-
fidence interval for SX (SX being one of S1, S2 or S3) of confidence level
1−α can be estimated – using evaluations of the true model f – by approx-
imating the distribution of SXN (or TXN ) by its Gaussian distribution given
in Proposition 3.2.3, using empirical estimators of the asymptotic variances
stated in this Proposition.
In the case where only a perturbated model (metamodel) fN = f + δN is
available, a confidence interval can still be estimated by using the SXN (or
TXN ) estimator.
Thanks to Proposition 11, the level of the resulting confidence interval should
be close to 1 − α for sufficiently large values of N if (and only if) VarδNdecreases sufficiently quickly with N .
The levels of the obtained confidence interval can be estimated by computing
a large number R of confidence interval replicates, and by considering the
empirical coverage, that is, the proportion of intervals containing the true
index value; it is well known that this empirical coverage strongly converges
to the level of the interval as R goes to infinity.
In the next subsections, we present the estimations of the levels of the con-
fidence interval for the Ishigami model (3.4.1) using the true model (Sub-
section 3.4.1), and, with various synthetic model perturbations (Subsections
3.4.2 and 3.4.3), as well as RKHS (Kriging) metamodels (Subsection 3.4.4)
and nonparametric regression metamodels (Subsection 3.4.5). We begin by
comparing SN and TN on the exact model (Subsection 3.4.1), then we illus-
trate the generalization to the metamodel case on the widespread estimator
SN ; the condition to ensure asymptotic normality in the metamodel is the
same for SN and TN . All simulations have been made with R = 1000 and
α = 0.05.

NORMALITY AND EFFICIENCY IN SOBOL INDEX ESTIMATION 125
3.4.1 Exact model
Figure 3.1 shows the empirical coverage of the asymptotic confidence interval
built using the SXN estimator, plotted as a function of the sample size N .
The theoretical level 0.95 is represented with a dotted line. Figure 3.2 does
the same using the TXN estimator.
We see that the coverages get closer to the target level 0.95 as N increases,
thereby assessing the reliability of the asymptotic confidence interval.
Figure 3.3 compares the efficiency of SXN and TXN by plotting the confidence
interval lengths for the two estimators, as functions of the sample size. As
the lengths for both estimators are O(1/√N), we plot the lengths multiplied
by√N . We see that TXN always produce smaller confidence intervals, except
for X3 where the lengths are sensibly the same; this conclusion fully agrees
with Proposition 7.
3.4.2 Gaussian-perturbated model
We consider a perturbation fN of the original output f :
fN = f +5ξNβ/2
where β > 0 and ξ is a standard Gaussian.
The perturbation δN = 5ξ
Nβ/2leads to VarδN ∝ N−β. Since:
Cδ = O(Var(δN )1/2
)= O
(N−β/2
),
the proof of Theorem 1 shows that SN is asymptotically normal for S if
β > 1/2. For indices relative to X1 and X2, this sufficient condition is also
necessary, as Cδ is actually equivalent to N−β/2. For X3, we have Cδ = 0
so that SN is asymptotically normal for S for any positive β.
This is illustrated for N = 50000 in Figure 3.4. We see that the empirical
coverages of the confidence interval for S1 and S2 jump to 0.95 near β = 1/2,
while, for S3, this coverage is always close to 0.95.
3.4.3 Weibull-perturbated model
We now take a different perturbation of the output:
fN = f +5WX2
3
Nβ/2

126 Chapter 3.
0.7
0.75
0.8
0.85
0.9
0.95
1
10 100 1000 10000 100000
Em
piric
al c
ove
rage
Sample size (N)
Variable X1
0.7
0.75
0.8
0.85
0.9
0.95
1
10 100 1000 10000 100000
Em
piric
al c
ove
rage
Sample size (N)
Variable X2
0.7
0.75
0.8
0.85
0.9
0.95
1
10 100 1000 10000 100000
Em
piric
al c
ove
rage
Sample size (N)
Variable X3
Figure 3.1: Empirical coverages of asymptotic confidence intervals for S1
(left), S2 (center) and S3 (right), as a function of the sample size. The SNestimator is used.

NORMALITY AND EFFICIENCY IN SOBOL INDEX ESTIMATION 127
0.7
0.75
0.8
0.85
0.9
0.95
1
10 100 1000 10000 100000
Em
piric
al c
ove
rage
Sample size (N)
Variable X1
0.7
0.75
0.8
0.85
0.9
0.95
1
10 100 1000 10000 100000
Em
piric
al c
ove
rage
Sample size (N)
Variable X2
0.7
0.75
0.8
0.85
0.9
0.95
1
10 100 1000 10000 100000
Em
piric
al c
ove
rage
Sample size (N)
Variable X3
Figure 3.2: Empirical coverages of asymptotic confidence intervals for S1
(left), S2 (center) and S3 (right), as a function of the sample size (for the
exact model). The TN estimator is used.

128 Chapter 3.
3.2
3.25
3.3
3.35
3.4
3.45
3.5
3.55
3.6
3.65
3.7
10 100 1000 10000 100000
95%
Confid
ence
Inte
rval l
ength
x s
qrt
(N)
Sample size (N)
Variable X1
T-Based Confidence interval length x sqrt(N)S-Based Confidence interval length x sqrt(N)
2.7
2.8
2.9
3
3.1
3.2
3.3
3.4
3.5
3.6
3.7
3.8
10 100 1000 10000 100000
95%
Confid
ence
Inte
rval l
ength
x s
qrt
(N)
Sample size (N)
Variable X2
T-Based Confidence interval length x sqrt(N)S-Based Confidence interval length x sqrt(N)
3.4
3.6
3.8
4
4.2
4.4
4.6
4.8
5
5.2
5.4
5.6
10 100 1000 10000 100000
95%
Confid
ence
Inte
rval l
ength
x s
qrt
(N)
Sample size (N)
Variable X3
T-Based Confidence interval length x sqrt(N)S-Based Confidence interval length x sqrt(N)
Figure 3.3: Lengths (rescaled by√N) of the estimated 95% confidence
intervals for S1 (left), S2 (center) and S3 (right), as functions of the sample
size (for the exact model). In solid line: length of the interval built from TN
estimator; in dotted line: length of the interval built from SN estimator.

NORMALITY AND EFFICIENCY IN SOBOL INDEX ESTIMATION 129
0
0.2
0.4
0.6
0.8
1
0.1 0.2 0.3 0.4 0.5 0.6 0.7 0.8
Em
piric
al c
ove
rage
Noise exponent (beta)
Variable X1
0
0.2
0.4
0.6
0.8
1
0.1 0.2 0.3 0.4 0.5 0.6 0.7 0.8
Em
piric
al c
ove
rage
Noise exponent (beta)
Variable X2
0
0.2
0.4
0.6
0.8
1
0.1 0.2 0.3 0.4 0.5 0.6 0.7 0.8
Em
piric
al c
ove
rage
Noise exponent (beta)
Variable X3
Figure 3.4: Empirical coverages of the asymptotic confidence intervals for
S1, S2 and S3, as a function of β (for the Gaussian-perturbated model).

130 Chapter 3.
where W is Weibull-distributed with scale parameter λ = 1 and shape pa-
rameter k = 1/2. Here, the perturbation depends on the inputs and, as for
every input variable, Cδ,N does not converge to zero, Theorem 1 states in
particular that SN is asymptotically normal for S for β > 1. Again, this
property is suggested for N = 50000 by the plot in Figure 3.5.
3.4.4 RKHS metamodel
In this part, we discuss the use of a reproducing kernel Hilbert space (RKHS)
interpolator [92, 94, 95] as metamodel f . Such metamodels (also known as
Kriging, or Gaussian process metamodels) are widely used when performing
sensitivity analysis of time-expensive computer codes [66]. The interpolator
depends on a learning sample (d1, f(d1)), . . . , (dn, f(dn)), where the design
points D = dii=1,...,n ⊂ P are generally chosen according to a space-filling
design, for instance the so-called maximin LHS (latin hypercube sampling)
designs. Increasing the learning sample size n will increase the necessary
number of evaluations of the true model f (each evaluation being potentially
very computationally demanding) to build the learning sample, but will also
enhance the quality of the interpolation (i.e. reduce metamodel error).
The error analysis of the RKHS method [94, 65] shows that there exist
positive constants C and K, depending on f , so that:
∀u ∈ P,∣∣∣f(u)− f(u)
∣∣∣ ≤ Ce−K/hD,P
where:
hD,P = supu∈P
mind∈D
‖d− u‖
for a given norm ‖·‖ on P.
The quantity hD,P can be linked to the number of points n∗(ε) in an optimal
covering of D:
n∗(ε) = minp ∈ N∗ | ∃(d1, . . . , dp) ∈ P s.t.
∀u ∈ P,∃i ∈ 1, . . . , p satisfying ‖u− di‖ ≤ ε.
In other words, n∗(ε), known as the covering number of P, is the smallest
size of a design D satisfying hD,P ≤ ε.
It is known that, when P is a compact subset of Rp (in our context, p =
p1 + p2 is the number of input parameters), there exist constants A and B

NORMALITY AND EFFICIENCY IN SOBOL INDEX ESTIMATION 131
0
0.2
0.4
0.6
0.8
1
0.6 0.7 0.8 0.9 1 1.1 1.2 1.3
Em
piric
al c
ove
rage
Noise exponent (beta)
Variable X1
0
0.2
0.4
0.6
0.8
1
0.6 0.7 0.8 0.9 1 1.1 1.2 1.3
Em
piric
al c
ove
rage
Noise exponent (beta)
Variable X2
0
0.2
0.4
0.6
0.8
1
0.6 0.7 0.8 0.9 1 1.1 1.2 1.3
Em
piric
al c
ove
rage
Noise exponent (beta)
Variable X3
Figure 3.5: Empirical coverages of the asymptotic confidence intervals for
S1, S2 and S3, as a function of β (for the Weibull-perturbated model).
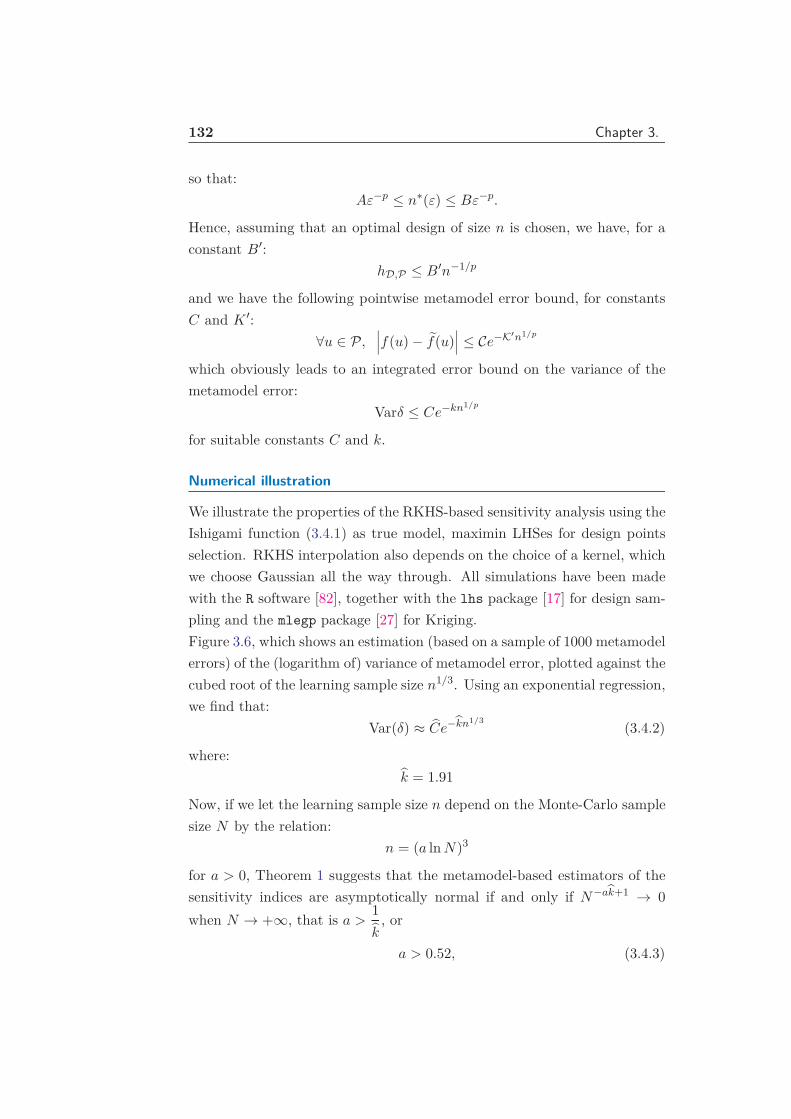
132 Chapter 3.
so that:
Aε−p ≤ n∗(ε) ≤ Bε−p.
Hence, assuming that an optimal design of size n is chosen, we have, for a
constant B′:
hD,P ≤ B′n−1/p
and we have the following pointwise metamodel error bound, for constants
C and K ′:
∀u ∈ P,∣∣∣f(u)− f(u)
∣∣∣ ≤ Ce−K′n1/p
which obviously leads to an integrated error bound on the variance of the
metamodel error:
Varδ ≤ Ce−kn1/p
for suitable constants C and k.
Numerical illustration
We illustrate the properties of the RKHS-based sensitivity analysis using the
Ishigami function (3.4.1) as true model, maximin LHSes for design points
selection. RKHS interpolation also depends on the choice of a kernel, which
we choose Gaussian all the way through. All simulations have been made
with the R software [82], together with the lhs package [17] for design sam-
pling and the mlegp package [27] for Kriging.
Figure 3.6, which shows an estimation (based on a sample of 1000 metamodel
errors) of the (logarithm of) variance of metamodel error, plotted against the
cubed root of the learning sample size n1/3. Using an exponential regression,
we find that:
Var(δ) ≈ Ce−kn1/3
(3.4.2)
where:
k = 1.91
Now, if we let the learning sample size n depend on the Monte-Carlo sample
size N by the relation:
n = (a lnN)3
for a > 0, Theorem 1 suggests that the metamodel-based estimators of the
sensitivity indices are asymptotically normal if and only if N−ak+1 → 0
when N → +∞, that is a >1
k, or
a > 0.52, (3.4.3)

NORMALITY AND EFFICIENCY IN SOBOL INDEX ESTIMATION 133
4.5 5.0 5.5 6.0
−2
−1
01
n1 3
ln(V
ar
δn
^)
Figure 3.6: Estimation of the Kriging metamodel error variance (log. scale)
as function of the learning sample size n.
according to our numerical value for k.
Even if it has not been rigorously proved that this condition is necessary
and sufficient (due to the estimation of k and the fact that (3.4.2) provably
holds, possibly with different constants, as an upper bound), one should
observe in practice that the behavior of the empirical confidence intervals
for large values of N changes as this critical value of a is crossed. Table 3.1
below shows the results obtained for different subcritical and supercritical
values of a (i.e., (3.4.3) does not hold, or hold, respectively), and provides a
clear illustration of this fact.
3.4.5 Nonparametric regression
In this section, we consider the case where the true model f is not directly
observable, but is only available through a finite set of noisy realisations of:
fnoisy(Di) = f(Di) + εi, i = 1, . . . , n
where D = (Di = (Xi, Zi))i=1,...,n are independent copies of (X,Z), and
εii=1,...,n are independent, identically distributed centered random vari-
ables.

134 Chapter 3.
a N n Coverage for S1 Cov. for S2 Cov. for S3
.4 3000 33 0.1 0 0.7
.4 4000 37 0.08 0 0.78
.4 6000 43 0.26 0.3 0.88
.4 10000 51 0.28 0.18 0.78
.4 20000 77 0.28 0.1 0.59
.6 3000 111 0.79 0.37 0.9
.6 4000 124 0.8 0.7 0.94
.6 10000 169 0.92 0.82 0.94
.6 20000 210 0.93 0.85 0.95
.7 3000 177 0.93 0.88 0.93
.7 4000 196 0.9 0.91 0.94
.7 6000 226 0.94 0.93 0.97
.8 4000 293 0.95 0.95 0.95
Table 3.1: Estimation of the asymptotic coverages for the RKHS Ishigami
metamodel. Empirical coverages are obtained using 100 confidence interval
replicates. Theoretical coverage is 0.95.
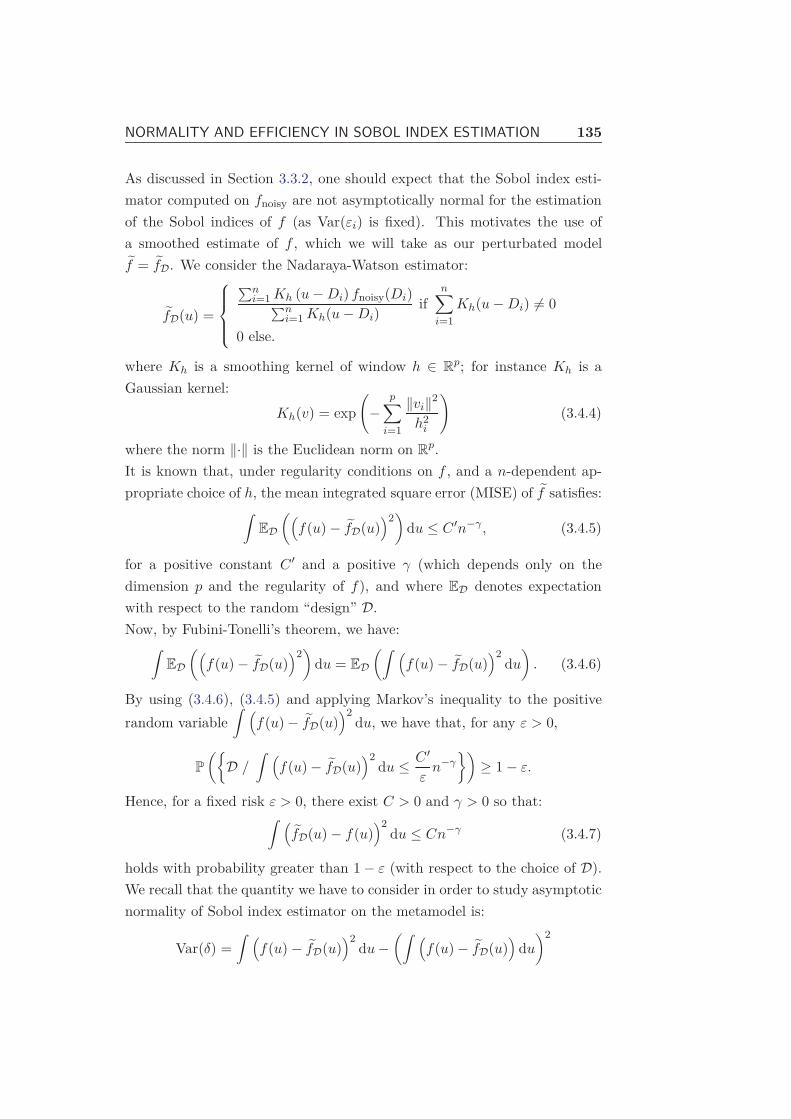
NORMALITY AND EFFICIENCY IN SOBOL INDEX ESTIMATION 135
As discussed in Section 3.3.2, one should expect that the Sobol index esti-
mator computed on fnoisy are not asymptotically normal for the estimation
of the Sobol indices of f (as Var(εi) is fixed). This motivates the use of
a smoothed estimate of f , which we will take as our perturbated model
f = fD. We consider the Nadaraya-Watson estimator:
fD(u) =
∑ni=1Kh (u−Di) fnoisy(Di)∑n
i=1 Kh(u−Di)if
n∑
i=1
Kh(u−Di) 6= 0
0 else.
where Kh is a smoothing kernel of window h ∈ Rp; for instance Kh is a
Gaussian kernel:
Kh(v) = exp
(−
p∑
i=1
‖vi‖2
h2i
)(3.4.4)
where the norm ‖·‖ is the Euclidean norm on Rp.
It is known that, under regularity conditions on f , and a n-dependent ap-
propriate choice of h, the mean integrated square error (MISE) of f satisfies:∫
ED
((f(u)− fD(u)
)2)
du ≤ C ′n−γ , (3.4.5)
for a positive constant C ′ and a positive γ (which depends only on the
dimension p and the regularity of f), and where ED denotes expectation
with respect to the random “design” D.
Now, by Fubini-Tonelli’s theorem, we have:∫
ED
((f(u)− fD(u)
)2)
du = ED
(∫ (f(u)− fD(u)
)2du). (3.4.6)
By using (3.4.6), (3.4.5) and applying Markov’s inequality to the positive
random variable∫ (
f(u)− fD(u))2
du, we have that, for any ε > 0,
P
(D /
∫ (f(u)− fD(u)
)2du ≤ C ′
εn−γ
)≥ 1− ε.
Hence, for a fixed risk ε > 0, there exist C > 0 and γ > 0 so that:∫ (
fD(u)− f(u))2
du ≤ Cn−γ (3.4.7)
holds with probability greater than 1− ε (with respect to the choice of D).
We recall that the quantity we have to consider in order to study asymptotic
normality of Sobol index estimator on the metamodel is:
Var(δ) =∫ (
f(u)− fD(u))2
du−(∫ (
f(u)− fD(u))
du)2

136 Chapter 3.
and that, obviously,
Var(δ) ≤∫ (
f(u)− fD(u))2
du.
This gives, by making use of (3.4.7):
Var (δ) ≤ Cn−γ (3.4.8)
with probability greater than 1− ε.In most cases of application, the design D is fixed. In view of (3.4.8), it is
reasonable to suppose that there exist C > 0 and β > 0 so that:
Var (δ) ≤ Cn−β
and we make n depend on N by the following relation:
n = Na,
for a > 0. By Theorem 1, the estimator sequence SN is asymptotically
normal provided that NVar(δN ) → 0, that is: a >1β
.
Numerical illustration
We now illustrate this property using the Ishigami function (3.4.1) as true
model, and a Gaussian white noise εi of standard deviation 0.3 (yielding to
a signal-to-noise ratio of 90%).
The nonparametric regressions are carried using a Gaussian kernel (3.4.4),
the R package np [47], together with the extrapolation method of [83] for
window selection and the FIGtree [69] C++ library for efficient Nadaraya-
Watson evaluation based on fast gaussian transform.
Figure 3.7, which shows an estimation (based on a test sample of size 3000)
of Var(δ) in function of n, and a power regression shows that:
Var (δ) ≈ Cn−β
with β = 0.86. This gives an estimate of 1.16 as the critical a for asymptotic
normality.
As in the RKHS case, we performed estimations of the coverages of the
asymptotic confidence interval for several values of a and N ; the results are
gathered in Table 3.2. We see that, first, the condition a > 1.16 implies cor-
rect coverages, and, second, the condition also seems to be near-necessary

NORMALITY AND EFFICIENCY IN SOBOL INDEX ESTIMATION 137
0 10000 20000 30000 40000 50000
0.0
0.5
1.0
1.5
2.0
2.5
n
Var
δn
^
Figure 3.7: Estimation of the nonparametric regression error variance (log.
scale) as function of the learning sample size n (Subsection 3.4.5).
a N n Coverage for S1 Cov. for S2 Cov. for S3
0.8 1000 252 0.25 0.01 0.94
0.8 2000 438 0.05 0.02 0.86
1.1 1000 1996 0.95 0.97 0.96
1.1 2000 4277 0.95 0.93 0.96
1.2 1000 3982 0.93 0.95 0.96
1.2 2000 9147 0.96 0.97 0.95
1.3 1000 7944 0.95 0.99 0.94
1.3 2000 19559 0.95 0.95 0.96
Table 3.2: Estimation of the asymptotic coverages for the Ishigami nonpara-
metric regression. Empirical coverages are obtained using 100 confidence
interval replicates. Theoretical coverage is 0.95.

138 Chapter 3.
to have asymptotic normality. We also remark that, for the asymptotic nor-
mality to hold, the necessary number of noisy model evaluations is asymp-
totically comparable to the Monte-Carlo sample size (while, in the RKHS
case, the necessary number of true model evaluations was asymptotically
negligible with respect to the Monte-Carlo sample size): this shows that the
nonparametric regression is suitable in the case of noisy but abundant model
evaluations, while RKHS interpolation is clearly preferable when the true
model output is costly to evaluate (i.e. few model outputs are available).
Acknowledgements: This work has been partially supported by the French
National Research Agency (ANR) through COSINUS program (project COSTA-
BRAVA n°ANR-09-COSI-015).

Chapter 4
Certified reduced-basis
solutions of viscous Burgers
equation parametrized by initial
and boundary values
Résumé: Nous présentons une procédure base réduite offline/online pour
le problème aux limites donné par l’équation de Burgers visqueuse. Cette
procédure permet le calcul rapide approché de solutions à ce problème,
paramétrées par la viscosité et les données initiales et aux limites. Nous
donnons également une borne d’erreur, nécessitant peu de ressources de
calcul, qui certifie l’approximation proposée. Nous présentons des expéri-
mentations numériques montrant que notre méthode permet une économie
significative en temps de calcul, et que la borne d’erreur proposée est effi-
cace.
Abstract: We present a reduced basis offline/online procedure for viscous
Burgers initial boundary value problem, enabling efficient approximate com-
putation of the solutions of this equation for parametrized viscosity and ini-
tial and boundary value data. This procedure comes with a fast-evaluated
rigorous error bound certifying the approximation procedure. Our numeri-
cal experiments show significant computational savings, as well as efficiency
of the error bound.
139

140 Chapter 4.
Introduction
This paper is set in the context of sensitivity analysis and uncertainty anal-
ysis in geophysical models. Such models typically involve a wide range
of parameters, such as: source terms (climatic forcings, heat/wind/matter
fluxes), boundary conditions (forcings, open boundaries), and the initial
state of the system.
Their study generally leads to parametrized partial differential equations
(PDEs). These equations often involve poorly-known parameters. There-
fore, it is important to be able to measure the impact of a given parameter
on the quality of the solution, and also to identify the "sensitive" parameters,
that is, the parameters for which a small variation implies a large variation
of the model solution. Due to their ability to perform global sensitivity
analyses for nonlinear models, stochastic tools [48, 88] are rapidly expand-
ing. These methods require "many queries," that is solving the parametrized
PDE for a large (say, thousands) number of values of the parameters. When
analytic solution to the PDE is not known (as it is often the case), one
has to use a numerical method (such as finite difference or finite element)
to compute an approximate value of the solution. Such methods lead to
computer codes that could take a large time to produce an accurate-enough
approximation — for a single value of the parameter. Having the "many-
query" problem in mind, it is crucial to design a procedure that solves the
equation for several values of the parameter faster than the naïve approach
of calling the numerical code for each required instance of the parameter.
The reduced basis (RB) method is such a procedure; we split the overall
computation into two successive parts: one part, the offline phase, makes
use of the standard, computationally intensive numerical procedure used
to solve the PDE to gather "knowledge" about solutions of the latter; and
the other one, the online phase, where we rely on data collected during
the offline phase to compute, for each desired instance of the parameter, a
good approximation of the solution, for a per-instance cost that is orders of
magnitude smaller than the cost of one run of the standard numerical code.
The advantage is that, for a sufficiently large number of online evaluations,
the fixed cost of the offline phase will be strongly dominated by the reduction
in the marginal cost provided by the online procedure. This cost reduction
is made possible by the fact that, in most cases, the desired solutions of the

REDUCED-BASIS SOLUTIONS OF BURGERS EQUATION 141
PDE, for all the considered values of the parameter, lie in some manifold of
functions that is "close" to a low-dimensional linear subspace. One goal of the
offline phase is to find such a suitable subspace, so that the online procedure
can look for the solution of the PDE as an element of the subspace — so as
to reduce the number of degrees of freedom and thus the computational cost.
One interesting feature of the RB approach is that it comes with an online
error bound, that is a (provably) certified, natural norm, fast-computed
(i.e. almost of the same complexity of the online phase) upper bound of
the distance between the solution provided by the online phase (called the
reduced, or online) solution and the one given by the standard, expensive
numerical procedure (called the full or reference solution). This "certified
RB" framework has been developed for affinely parametrized second-order
elliptic linear PDEs in [72]. It has been extended to nonlinear, non-affinely
parametrized, parabolic PDEs, see e.g. [45], [44] and applied to problems
such as steady incompressible Navier-Stokes [110]. Moreover theoretical
work has been done to ensure a priori convergence of the RB procedure
[12].
In this paper, we are interested in the RB reduction of the time-dependent
viscous Burgers equation (which will serve as a "test case" for the "real"
equations modelling geophysical fluids we are interested in). Papers [46]
and [84] extend certified RB methodology to linear initial-boundary value
problems. The case of homogeneous Dirichlet boundary conditions, zero ini-
tial value and fixed (i.e., not parametrized) source term has been treated in
[111], [71] ; in these works, the only parameter was the viscosity coefficient.
Parametrization of initial and Dirichlet boundary conditions (treated using
a conversion to a homogeneous Dirichlet problem) has been done in [59], for
a general multidimensional quadratically nonlinear equation. Our method-
ology allows parametrization of the viscosity, the initial state, the source
term and and of the boundary conditions. Compared to the works cited
above, we use a weak (penalization) treatment of the Dirichlet boundary
conditions. We will see that this weak treatment is more favorable in terms
of both computation and storage complexities. Besides, our paper features a
new error bound, which has shown to be, in all the testcases we performed,
much more efficient than the existing bound. In particular, we will show
that our bound exhibits improved sharpness for low viscosities, where [71]
pointed out the moderate efficiency of the presented a posteriori bound.

142 Chapter 4.
This paper is organised as follows: in the first part, we introduce the viscous
Burgers equation, and present a standard numerical procedure used to solve
it; in the second part, we expose our offline/online reduction procedure; in
the third part, we develop a certified online error bound; finally in the fourth
part we validate and discuss our results based on numerical experiments.
4.1 Model
In this section, we describe the model we are interested in. Subsection 4.1.1
introduces the viscous Burgers equation, while Subsection 4.1.2 presents the
"full" numerical procedure on which our reduction procedure, described in
Section 4.2, relies on.
4.1.1 Equation
We are interested in u, function of space x ∈ [0; 1] and time t ∈ [0;T ] (for
T > 0), with regularity:
u ∈ C1([0, T ],H1(]0, 1[)
), satisfying the viscous Burgers equation:
∂u
∂t+
12∂
∂x(u2)− ν ∂
2u
∂x2= f (4.1.1)
where ν ∈ R+∗ (R denotes the set of real numbers, R+
∗ the set of positive real
numbers) is the viscosity, and f ∈ C0([0, T ], L2(]0, 1[)
)is the source term.
For u to be well-defined, we also prescribe initial values u0 ∈ H1(]0, 1[):
u(t = 0, x) = u0(x) ∀x ∈ [0; 1] (4.1.2)
and boundary values b0, b1 ∈ C0([0, T ]):
u(t, x = 0) = b0(t)
u(t, x = 1) = b1(t)∀t ∈ [0;T ] (4.1.3)
Where b0, b1 and u0 are given functions, supposed to satisfy compatibility
conditions:
u0(0) = b0(0) and u0(1) = b1(0) (4.1.4)
This problem can be analyzed by means of the Cole-Hopf substitution (see
[50] for instance), which turns (4.1.1) into the heat equation, leading to an
integral representation of u.

REDUCED-BASIS SOLUTIONS OF BURGERS EQUATION 143
4.1.2 Numerical resolution
We now describe the "expensive" numerical resolution of the problem de-
scribed above that will serve as our reference for the reduction procedure
described in the next section. We proceed in two steps: space discretization
in paragraph 4.1.2 and time discretization in paragraph 4.1.2.
Space discretization
For space discretization, we use a P1 finite element procedure with weak
(penalty) setting of the Dirichlet boundary conditions (4.1.3).
We first have to write the weak formulation of our PDE ; to do so, we
multiply (4.1.1) by a function v ∈ H1(]0; 1[) and integrate over ]0; 1[:
∫ 1
0
∂u
∂t(t, x)v(x)dx+
12
∫ 1
0
∂(u2)∂x
(t, x)v(x)dx
− ν∫ 1
0
∂2u
∂x2(t, x)v(x)dx =
∫ 1
0f(t, x)v(x)dx ∀v ∈ H1(]0; 1[) ∀t ∈ [0;T ]
(4.1.5)
Next, we integrate by parts the second and the third integral appearing in
the left hand side of the previous equation:
∫ 1
0
∂(u2)∂x
(t, x)v(x)dx = −∫ 1
0u2(t, x)
∂v
∂x(x)dx+
[u2(t, ·)v
]1
0∫ 1
0
∂2u
∂x2(t, x)v(x)dx = −
∫ 1
0
∂u
∂x(t, x)
∂v
∂x(x)dx+
[∂u
∂x(t, ·)v
]1
0
Inserting this into (4.1.5), we get:
∫ 1
0
∂u
∂t(t, x)v(x)dx− 1
2
∫ 1
0u2(t, x)
∂v
∂x(x)dx+ ν
∫ 1
0
∂u
∂x(t, x)
∂v
∂x(x)dx
+12
[u2(t, ·)v
]1
0−ν
[∂u
∂x(t, ·)v
]1
0=∫ 1
0f(t, x)v(x)dx ∀v ∈ H1(]0; 1[) ∀t ∈ [0;T ]
(4.1.6)
To get rid of the two boundary terms arising in the integrations by parts,
one usually restricts v to satisfy v(0) = v(1) = 0 so as to make the boundary
terms disappear; the Dirichlet boundary conditions (4.1.3) are then incorpo-
rated "outside" of the weak formulation. However, the reduction framework
we are to expose later requires the boundary conditions to be ensured by
the weak formulation itself. The Dirichlet penalty method, presented in

144 Chapter 4.
[4], is a way of doing so, at the expense of a slight approximation error.
This method entails replacement of boundary conditions (4.1.3) with the
following conditions:
−12u2(t, x = 0) + ν
∂u
∂x(t, x = 0) = P (u(t, x = 0)− b0(t))
12u2(t, x = 1)− ν ∂u
∂x(t, x = 1) = P (u(t, x = 1)− b1(t))
∀t ∈ [0;T ]
(4.1.7)
with a fixed penalization constant P > 0.
The intuitive idea underlying (4.1.7) is that it can clearly be rewritten as:
u(t, x = 0) = b0(t) +1P
(−1
2u2(t, x = 0) + ν
∂u
∂x(t, x = 0)
)
u(t, x = 1) = b1(t) +1P
(12u2(t, x = 1)− ν ∂u
∂x(t, x = 1)
) ∀t ∈ [0;T ]
so that (4.1.3) is asymptotically verified for P → +∞. The reader can refer
to [6] for rigorous a priori error estimates when using Dirichlet penalty in
the linear elliptic case.
In practice, we can check if our approximation is sufficiently accurate by
means of the following a posteriori procedure: we take for P some large value
(typically P = 107), we compute (numerically) an approximate solution ud,
using the procedure we are currently describing, and we check if an indicator
of the amount of failure in verification of (4.1.3) is small enough; such an
indicator can be, for instance:
εb = supt
[max (|ud(t, x = 0)− b0(t)|, |ud(t, x = 1)− b1(t)|)] (4.1.8)
where the supremum is taken over all discrete time steps. If this indicator
is larger than a prescribed tolerance, then P has to be increased. Our
numerical results in Section 4.4 will assert this condition. We can then
invoke the well-posedness of the boundary/initial value problem (specifically,
continuous dependence on the boundary values) to ensure that the solution
of (4.1.1), (4.1.2) and (4.1.7) will be close to the solution of (4.1.1), (4.1.2)
and (4.1.3). This reasoning is analogous to the one made when omitting
the approximation made when replacing exact boundary values by their
discretized counterparts.
Going back to our weak formulation, we multiply the first line of (4.1.7) by

REDUCED-BASIS SOLUTIONS OF BURGERS EQUATION 145
v(0), the second one by v(1) and add up these two equations. We get that:
12
[u2(t, ·)v
]1
0− ν
[∂u
∂x(t, ·)v
]1
0
= P [(u(t, x = 0)v(0) − b0(t)v(0)) + (u(t, x = 1)v(1) − b1(t)v(1))]
Putting it back into (4.1.6) and isolating the terms not involving u on the
right-hand side yields the following weak formulation:
∫ 1
0
∂u
∂tv− 1
2
∫ 1
0u2 ∂v
∂x+ν
∫ 1
0
∂u
∂x
∂v
∂x+P (u(t, x = 0)v(0) + u(t, x = 1)v(1))
=∫ 1
0f(t, ·)v + P (b0(t)v(0) + b1(t)v(1)) ∀v ∈ H1(]0; 1[) ∀t ∈ [0;T ]
(4.1.9)
that is:
⟨∂u∂t
(t, ·), v⟩
+ c(u(t, ·), u(t, ·), v) + νa(u(t, ·), v) +B(u(t, ·), v)
= ℓ(v, t) + b0(t)β0(v) + b1(t)β1(v) ∀v ∈ H1(]0; 1[),∀t ∈ [0, T ] (4.1.10)
by introducing the following notations (for all v,w, z ∈ H1(]0; 1[), t ∈ [0;T ]):
〈w, v〉 =∫ 1
0wv a(w, v) =
∫ 1
0
∂w
∂x
∂v
∂x
B(w, v) = P (w(0)v(0) + w(1)v(1)) ℓ(v, t) =∫ 1
0f(t, ·)v
β0(v) = Pv(0) β1(v) = Pv(1)
and:
c(w, v, z) = −12
∫ 1
0wv
∂z
∂x
for every w, v and z in H1(]0; 1[) for which wv∂z
∂x∈ L1(]0; 1[).
The weak formulation is then discretized with Lagrange P1 finite elements
(see [80]) by choosing some integer N and considering a uniform subdivision
of [0; 1] with N + 1 nodes: xii=0,...,N and, for each i = 0, . . . ,N we denote
by φi the piecewise-affine “hat” function whose value is 1 on xi and 0 on
every other nodes.
We denote by X the linear subspace of H1(]0; 1[) spanned by φii=0,...,N .
We also set ‖·‖ to be the L2(]0; 1[) norm.

146 Chapter 4.
Every ψ ∈ X can be written as ψ =N∑
j=0
ψjφj , and we have ψ(xi) = ψi for all
i = 0, . . . ,N . This justifies that π defined below is a projection of H1(]0; 1[)
onto X:
π :
H1(]0; 1[) → X
ψ 7→N∑
j=0
ψ(xj)φj
The space discretization of our problem is the following: for all t ∈ [0;T ],
find u(t, ·) ∈ X so that :
u(t = 0, ·) = π(u0)⟨∂u∂t
(t, ·), v⟩
+ c(u(t, ·), u(t, ·), v) + νa(u(t, ·), v) +B(u(t, ·), v)
= ℓπ(v, t) + b0(t)β0(v) + b1(t)β1(v) ∀v ∈ X(4.1.11)
where
ℓπ(v, t) =∫ 1
0π (f(t, ·)) v
Note that u now stands for a discrete solution, while it was used to designate
an analytic solution before.
Time discretization
We now discretize (4.1.11) in time using the backward Euler scheme: we
choose a timestep ∆t > 0 and consider an uniform subdivision of [0;T ]:
tk = k∆tk=0,...,T where T =T
∆t.
Our fully discrete problem is: for k = 0, . . . ,T , find uk ∈ X, approximation
of u(tk, ·), satisfying:
u0 = π(u0) (4.1.12a)
and:
⟨uk − uk−1
∆t, v⟩
+ c(uk, uk, v) + νa(uk, v) +B(uk, v)
= ℓπ(v, tk) + b0(tk)β0(v) + b1(tk)β1(v) ∀v ∈ X ∀k = 1, . . . ,T(4.1.12b)
We sequentially compute ukk=0,...,T in the following way: u0 comes straight-
forwardly from (4.1.12a), and for k = 1, . . . ,T , uk depends on uk−1 through

REDUCED-BASIS SOLUTIONS OF BURGERS EQUATION 147
(4.1.12b), which can be rewritten:
1∆t〈uk, v〉 + c(uk, uk, v) + νa(uk, v) +B(uk, v)
=1
∆t〈uk−1, v〉+ ℓπ(v, tk) + b0(tk)β0(v) + b1(tk)β1(v) ∀v ∈ X (4.1.13)
We can now expand our unknown uk ∈ X on the φjj basis: uk =N∑
j=1
ukjφj,
and the vector(ukj
)j
becomes our new unknown.
Moreover, it is sufficient for (linear-in-v) relation (4.1.13) to be satisfied for
all v in a basis of X, namely for v = φi, ∀i = 0, . . . ,N .
So (4.1.13) can be rewritten as a nonlinear (due to the nonlinearity in
c(uk, uk, v)) system of N + 1 equations (one for each instantation v = φi)
involving(ukj
)j=0,...,N
. This nonlinear system is solved using Newton iter-
ations: starting with an initial guess uk, one looks for δ =N∑
j=1
δjφj so that
uk = uk + δ satisfies the linearization near δ = 0 of (4.1.13) for v = φi,
i = 0, . . . ,N , that is to say:
1∆t〈uk + δ, φi〉+ c(uk, uk, φi) + 2c(uk, δ, φi) + νa(uk + δ, φi) +B(uk + δ, φi)
=1
∆t〈uk−1, φi〉+ ℓπ(φi, tk) + b0(tk)β0(φi) + b1(tk)β1(φi) ∀i = 0, . . . ,N
(4.1.14)
System (4.1.14) is a (N + 1) × (N + 1) linear system involving (δj)j=0,N .
Once solved for δ, one can test for convergence of the Newton iteration:
if the norm of δ is smaller than a prescribed precision, then we stop here,
produce uk and get to the next time step k + 1; otherwise we do one more
Newton step, this time using uk as initial guess uk.
We can note that the linear system to be solved at each Newton step is not
symmetric but is sparse. Due to this sparsity, its solution (using an iterative
method such as BICGSTAB or GMRES) takes about O(N 2)
operations in
the worst case. One can take advantage of the tridiagonal structure of the
matrix (which is present in the one-dimensional case, since φi and φj have
no common support if |j − i| > 1) and use Thomas’ algorithm [101] to solve
the system with O(N ) operations.

148 Chapter 4.
4.2 Reduction procedure
In this section, we show the offline/online procedure announced in the in-
troduction to produce reduced basis solutions of the problem formed by
(4.1.1), (4.1.2) and (4.1.3), based on the "full basis" numerical method pre-
sented above. We begin by a description of our parameters in Subsection
4.2.1. Our offline/online reduction procedure is described subsequently, in
Subsection 4.2.2.
4.2.1 Parameters
We parametrize u0, b0, b1 and f as:
b0(t) = b0m +n(b0)∑
l=1
Ab0
l Φb0
l (t) b1(t) = b1m +n(b1)∑
l=1
Ab1
l Φb1
l (t)
f(t, x) = fm +nT (f)∑
l=1
nS(f)∑
p=1
AflpΦfTl (t)ΦfS
p (x) u0(x) = u0m +n(u0)∑
l=1
Au0
l Φu0
l (x)
The functions involved in these linear combinations Φb0 , Φb1
l , ΦfTl , ΦfS
p
and Φu0
l as well as the number of terms in the decompositions n(b0), n(b1),
nT (f), nS(f) and n(u0) are fixed, while our parameters, namely: viscosity
ν, coefficients b0m, b1m, fm and u0m, and(Ab0
l
)l=1,...,n(b0)
,(Ab1
l
)l=1,...,n(b1)
,(Aflp
)l=1,...,nT (f);p=1,...,nS(f)
and(Au0
l
)l=1,...,n(u0) live in some Cartesian prod-
uct of intervals P ′, subset of R1+4+n(b0)+n(b1)+nT (f)nS(f)+n(u0). Note that m
stands for mean and is not a "numerical" index.
The compatibility condition (4.1.4) constraints b0m and b1m as functions of
the other parameters:
b0m = u0m and b1m = u0m +n(u0)∑
l=1
Au0
l Φu0
l (x)
so that our "compliant" parameters actually belong to P defined by:
P =µ =
(ν, b0m, A
b0
1 , . . . , Ab0
n(b0), b1m, Ab1
1 , . . . , Ab0
n(b1),
fm, Af11, A
f12, . . . , A
f1,nS(f), A
f2,1, . . . , A
f2,nS(f), . . . , A
fnT (f),nS(f),
u0m, Au0
1 , . . . , Au0
n(u0)
) ∈ P ′ satisfying (4.1.4)
(4.2.1)

REDUCED-BASIS SOLUTIONS OF BURGERS EQUATION 149
4.2.2 Offline/online procedure
The key heuristic [72] for RB approximation of the (linear) parametrized
variational problem is the following: given µ ∈ P,
find u(µ) ∈ X so that A(u(µ), v;µ) = L(v;µ), ∀v ∈ X
is to choose a parameter-independent family R of linearly independent func-
tions in X — with #R≪ dimX, to achieve computational economy — and
then, given an instance of the parameter, to search for the reduced solution:
u(µ) ∈ SpanR, so that A(u(µ), v;µ) = L(v;µ) ∀v ∈ SpanR
Let us apply this idea on problem (4.1.12). We rely on the procedure de-
scribed in [71], modified to allow parametrization of initial condition, bound-
ary data and source term. To simplify notations, we do not explicitly write
dependence of u and u on µ.
We suppose that a reduced basis R = ζ1, . . . , ζN has been chosen (see
Subsection 4.2.3 for one way to do so); we define X = SpanR and we look
forukk=0,...,T
⊂ X satisfying:
u0 = π (π(u0)) (4.2.2a)
and:
⟨ uk − uk−1
∆t, v⟩
+ c(uk, uk, v) + νa(uk, v) +B(uk, v)
= ℓπ(v, tk) + b0(tk)β0(v) + b1(tk)β1(v) ∀v ∈ X ∀k = 1, . . . ,T(4.2.2b)
where π is the orthogonal projection from X onto X , with respect to the
standard L2 inner product on X: 〈w, v〉 =∫ 1
0wv.
The offline/online procedure for computation of u0 will come easily from
our parametrization of u0 in Subsection 4.2.1: since the constant function
1 =N∑
j=0
φj belongs to X, we have:
u0 = u0mπ(1) +n(u0)∑
l=1
Au0
l π(π(Φu0
l (·))) (4.2.3)

150 Chapter 4.
We now discuss computation of uk from uk−1 for k = 1, . . . ,T . We are
willing to proceed with Newton steps as for the solution of (4.1.12b). We
denote, for k = 1, . . . ,T , by
uk−1 =N∑
j=1
uk−1j ζj ; uk =
N∑
j=1
ukj ζj
respectively, the reduced solution at time tk−1, and previous guess for the
reduced solution at time tk.
Our procedure relies on the following proposition:
Proposition 1. 1. The Newton increment δ =N∑
j=1
δjζj satisfies the fol-
lowing equations:
N∑
j=1
δj
〈ζj , ζi〉
∆t+ 2
N∑
j′=1
ukj′c(ζj′ , ζj , ζi) + νa(ζj, ζi) +B(ζj, ζi)
=N∑
j=1
uk−1j
〈ζj , ζi〉∆t
+ ℓπ(ζi, tk) + b0(t)β0(ζi) + b1(t)β1(ζi)
−N∑
j=1
ukj
〈ζj , ζi〉
∆t+
N∑
j′=1
ukj′c(ζj′ , ζj , ζi) + νa(ζj, ζi) +B(ζj, ζi)
∀i = 1, . . . , N
(4.2.4)
2. We have:
ℓπ(ζi, tk) = fm
∫ 1
0ζi +
nT (f)∑
l=1
nS(f)∑
p=1
AflpΦfTl (tk)
∫ 1
0π(ΦfSp (·)
)ζi (4.2.5)
for all i = 1, . . . , N and k = 1, . . . ,T .
Proof. 1. Equation (4.2.2b) for uk = uk + δ linearized near δ = 0, for
v = ζi, ∀i = 1, . . . , N is:
1∆t〈uk+δ, ζi〉+c(uk, uk, ζi)+2c(uk, δ, ζi)+νa(uk+δ, ζi)+B(uk+δ, ζi)
=1
∆t〈uk−1, ζi〉+ ℓπ(ζi, tk) + b0(t)β0(ζi) + b1(t)β1(ζi) ∀i = 1, . . . , N
Rewriting this equation using expansions of uk and δ inR and linearity
of 〈·, ·〉, c, a and B with respect to their first argument, and putting
all (δj)j-dependent terms on the left-hand side give the announced
equation.

REDUCED-BASIS SOLUTIONS OF BURGERS EQUATION 151
2. is a direct consequence of the parametrization of f given in Subsection
4.2.1.
The following Proposition 2 justifies the well-definedness of the Newton it-
eration, for an orthonormal reduced basis ζ1, . . . , ζN. In practice, the
Gram-Schmidt process can always be used to ensure this condition.
Proposition 2. Suppose that ζ1, . . . , ζN is orthonormal with respect to
〈·, ·〉.Then, for ∆t small enough, i.e. ∆t < ∆t∗ (ν, ζii=1,...,N ), and initial guess
uk sufficiently close to uk, the Newton iteration (4.2.4) is well defined and
converges (quadratically) to uk.
Proof. Iteration (4.2.4) is a Newton iteration for solving F (x) = α, for
appropriate α and F given by:
F (x) =N∑
i=1
(〈x, ζi〉∆t
+ c(x, x, ζi) + νa(x, ζi) +B(x, ζi))ζi
We apply the result stated pp. 353–355 of [80] and pp. 362–367 of [40]. To
do so, we have to check that, for ∆t small enough:
1. the differential of F at uk, denoted by DF (uk), is invertible;
2. DF (·) is Lipschitz-continuous i.e. there exist L > 0 so that
∀x, x′ ∈ X, ∀v ∈ X,∥∥DF (x) · v −DF (x′) · v
∥∥ ≤ L∥∥x− x′∥∥ ‖v‖
It is easy to check that the matrix ofDF (uk) in the reduced basis ζ1, . . . , ζNis diagonally dominant, hence invertible, for:
∆t < ∆t∗ := mini=1,...,N
1∑Nj=1 |2c(uk, ζj, ζi) + νa(ζj , ζi) +B(ζj, ζi)|
and (2) is a straightforward computation.
We put our offline/online procedure in Algorithm 1.

152 Chapter 4.
– offline:
1. choose a parameter-, and time-independent reduced basis
ζ1, . . . , ζN (see Section 4.2.3)
2. compute and store the following parameter-independent functions
of X and scalars, for all i, j, j′ = 1, . . . , N , l = 1, . . . , n(u0), p =
1, . . . , nS(f):π(1) π
(π(Φu0
l (·)))
〈ζj , ζi〉 a(ζj, ζi)
c(ζj′ , ζj , ζi) B(ζj, ζi)
β0(ζi) β1(ζi)∫ 1
0ζi
∫ 1
0π(ΦfSp (·)
)ζi
– online:
1. assemble u0 as the linear combination (4.2.3) ;
2. for k = 1, . . . ,T :
(a) set up an initial guess uk =N∑
j=1
ukj ζj ;
(b) compute and store ℓπ(ζi, tk) by using (4.2.5) ;
(c) look for δ =N∑
j=1
δjζj by solving the linear system (4.2.4) ;
(d) set uk ← uk + δ ;
(e) if ‖δ‖ is small enough:
i. output uk
ii. set k = k + 1
(f) else:
i. update the guess : uk ← uk, i.e. ukj ← ukj ∀j = 1, . . . , N
ii. go back to (c)
Algorithm 1: offline/online procedure
Let us make some remarks about the complexity of the above online algo-
rithm, in contrast with the "full basis" one described in Section 4.1.2:
Remark 1. 1. The most computationally demanding step is (2) (c), since
it involves resolution of a (nonsymmetric, dense) N×N linear system;

REDUCED-BASIS SOLUTIONS OF BURGERS EQUATION 153
the "full basis" counterpart solves (N+1)×(N+1) nonsymmetric tridi-
agonal system. Thus significant computational savings are expected for
N ≪ N .
2. Thanks to our parametrization of f(t, ·), all integrals over [0; 1] in
equation (4.2.4) can be precomputed during the offline phase, yielding
a N -independent online phase. This means that one can in princi-
ple choose arbitrary high precision on the full model without impact
on the marginal cost of evaluation of an online solution. This "N -
independence" property shall be required of every complexity of any
online procedure. One should also note that our online procedure does
not produce "nodal" values uk(xi), i = 0, . . . ,N (as this would clearly
violate the N -independence), but rather the components of uk in the
reduced basis.
3. Taken independently, the number of parameters n(u0), n(b0), n(b1),
nS(f) and nT (f), as well as the number of timesteps T have a linear
impact on the online complexity. Moreover, due to the double sum
in (4.2.5), the online complexity is proportional to nS(f)nT (f). We
note that an advantage of treating the Dirichlet boundary condition
weakly, as we do in this paper, is that nT (f) does not get increased by
functions of n(b0) or n(b1). This is a clear advantage of our method:
when boundary conditions are treated by returning to an homogeneous
Dirichlet problem, as in [59], n(b0) + n(b1) terms are added in the
parametrization of f .
4.2.3 Choice of the reduced basis
In this subsection, we describe different ways of choosing a pertinent re-
duced basis ζ1, . . . , ζN. These lead to three different bases fitting into the
certified (that is to say, the three admit the same procedure for online error
bound we describe in Section 4.3) reduced basis framework.
The first is based on proper orthogonal decomposition (POD), the second
is based on a "greedy" selection algorithm. The third is an hybridation of
POD and greedy. These methods are standard in the literature.

154 Chapter 4.
Notation
The two procedures described below involve computation of the reference
solution for different instances of the parameter, so we should use special
notations, local to this section, to emphasize the dependence of the reference
solution on the parameters. We define a parametrized solution u by:
u :
1, . . . ,T × P → X
(k, µ) 7→ u(k, µ) = uk satisfying (4.1.12b) for µ as parameter
POD-driven procedure
We denote by ukj (µ)j the coordinates of u(k, µ) in the basis φ0, . . . , φN :
u(k, µ) =N∑
j=1
ukj (µ)φj
In the POD-based procedure (see [18]) of the reduced basis choice, we choose
a finite-sized parameter sample Ξ ⊂ P, compute the reference solutions
u(k, µ) for all k = 1, . . . ,T and all µ ∈ Ξ, and form the snapshots matrix
containing the components of these solutions in our basis φ0, . . . , φN :
M =
u00(µ1) u1
0(µ1) · · · uT0 (µ1) u0
0(µ2) · · · · · · uT0 (µS)
u01(µ1) u1
1(µ1) · · · uT1 (µ1) u0
1(µ2) · · · · · · uT1 (µS)
......
......
......
......
u0N (µ1) u1
N (µ1) · · · uTN (µ1) u0
N (µ2) · · · · · · uTN (µS)
where Ξ = µ1, . . . , µS.One can check that M has N + 1 rows and S(T + 1) columns.
To finish, we choose the size N < S(T + 1) of the desired reduced basis, we
form the S(T +1)×S(T +1) non-negative symmetric matrix MTΩM , where
Ω is the matrix of our inner product 〈·, ·〉, to find z1, . . . , zN the N leading
nonzero eigenvectors of this matrix (that is, the ones associated with the
N largest eigenvalues, counting repeatedly possible nonsimple eigenvalues),
and, for i = 1, . . . , N , the coordinates of ζi with respect to φ0, . . . , φN are
given by:1
‖Mzi‖Mzi (4.2.6)

REDUCED-BASIS SOLUTIONS OF BURGERS EQUATION 155
"Local" greedy selection procedure
The greedy basis selection algorithm (cf. [45, 43]) is the following:
Parameter: N , the desired size of the reduced basis.
1. Choose a finite-sized, random, large sample of parameters Ξ ⊂ P.
2. Choose µ1 ∈ P and k1 ∈ 1, . . . ,T at random, and set
ζ1 =u(k1, µ1)‖u(k1, µ1)‖
3. Repeat, for n from 2 to N :
(a) Find:
(kn, µn) = argmax(k,µ)∈0,...,T ×Ξε∗(µ,k)
where ε∗(k, µ) is a (fastly evaluated) estimator of the RB error
‖u(k, µ) − u(k, µ)‖, where u(k, µ) stands for the RB approxima-
tion to u(k, µ) using ζ1, . . . , ζn−1 as reduced basis (see below).
(b) Compute ζ∗n = u(kn, µn).
(c) Using one step of the (stabilized) Gram-Schmidt algorithm, find
ζn ∈ Spanζ1, . . . , ζn−1, ζ∗n so that ζ1, . . . , ζn−1, ζn is an or-
thonormal family of (X, 〈·, ·〉).Algorithm 2: Greedy basis selection
The "greedy" name for this algorithm comes from the fact that the algo-
rithm chooses, at each step of the repeat loop, the "best possible" time and
parameter tuple to the reduced basis, that is the one for which the RB
approximation error is estimated to be the worst.
Let’s now discuss the choice for the error indicator ε∗. A natural candidate
would be the online error bound ε described in Section 4.3. However, as we
shall see in the next section, the bound for timestep tk is a compound of
the "propagation" of the error made in the previous timesteps t0, t1, . . . , tk−1
(the εk−1 term) and the "local error" just introduced at the k-th time dis-
cretization. Hence, this error estimator εk has a natural tendency to grow
(exponentially) with k. Thus using it as error indicator ε∗ will favor times
kn near final time T to be chosen at step 3.(a) of the algorithm below. Such
choices are suboptimal, because including them in the reduced basis will not
fix this exponential growth problem which is inherent to our approximation.

156 Chapter 4.
Instead we use, as in [45], a purely local-at-tk error indicator, that is: the
computable error bound described in Section 4.3 when taking εk−1 = 0.
It has been noted in the literature that the greedy procedure can “stall” (i.e.
select vectors for addition in the basis which have no effect in decreasing the
error bounds). The author in [43] provides a “back-up procedure” in such
a case. In our experiments, however, we have not noticed any “stalling” of
the greedy procedure, maybe because of our sharper error bound.
POD-Greedy procedure
We can also make use of the POD-Greedy procedure [46] in Algorithm 3.
This procedure aims to combine the advantages of the greedy and the POD
based procedure; it has also been proposed so as to overcome the “stalling”
of the greedy procedure.
Parameter: P1.
1. Choose a finite-sized, random, large sample of parameters Ξ ⊂ P.
2. Choose µ1 ∈ P at random, and choose as the current reduced basis Ban orthonormalized basis of Spanu(µ1, t0), u(µ1, t1), . . . , u(µ1,T ).
3. Repeat, until the desired number of items in the basis is reached:
(a) Find:
µ∗ = argmaxµ∈Ξ
ε∗(µ)
where ε∗(µ) is a (fastly evaluated) estimator of the RB error
‖u(µ)− u(µ)‖, where u(µ) stands for the RB approximation to
u(µ) using B as reduced basis.
(b) Append to B the P1 leading POD modes of
uproj(µ∗, t0), uproj(µ∗, t1), . . . , uproj(µ∗,T ), where the proj
superscript denotes projection on the orthogonal complement of
Span(B).
4. Output B = ζ1, . . . , ζ#B as reduced basis.
Algorithm 3: POD-Greedy basis selection
Again, an error indicator ε∗ has to be chosen. We do as in [62], where the
authors take the online error bound at final time.

REDUCED-BASIS SOLUTIONS OF BURGERS EQUATION 157
Expansion of the basis by initial data modes
In case they did not get chosen by the POD or greedy algorithm, a classical
strategy is to initialize the basis selection algorithms by taking in the reduced
basis the constant function 1, and the functions Φu0
l (·) for l = 1, . . . , n(u0).
This may increase the size of the reduced basis (and thus online compu-
tation times) but ensures that u0 = u0 (i.e. initial error is zero). Such
an enrichment can possibly be a good move, as the error gets accumulated
and amplified throughout the time iterations, zero initial error will certainly
reduce the (estimated, as well as actual) RB approximation error.
4.3 Error bound
In this section, we derive a parameter and time dependent online error bound
εk (for k = 1, . . . ,T ) satisfying:∥∥∥uke − uk
∥∥∥ ≤ εk, where ‖v‖ =(∫ 1
0v2)1/2
,
and uke is our reference “truth” solution in X satisfying the fully discretized
PDE with strong Dirichlet enforcement, that is:
〈uke − uk−1e , v〉
∆t+ c(uke , u
ke , v) + νa(uke , v) = ℓπ(v, tk) ∀v ∈ X0
uke(0) = b0(tk)
uke(1) = b1(tk)
(4.3.1)
where X0 is the “homogeneous” subspace of X:
X0 = v ∈ X st. v(0) = v(1) = 0.
Our error bound should be precise enough (i.e., not overestimating the actual
error∥∥∥uke − uk
∥∥∥ too much, and approaching zero as N increases) and online-
efficient (that is, admit an offline/online computation procedure with an
N -independent online complexity).
We notice that our error bound measures the error between the reduced
and the reference solution; it does not reflect the discretization error made
when replacing the actual analytical solution of the Burgers equation with
its numerical approximation (4.3.1). This is consistent with the fact that
RB methods relies strongly on the existence of a high-fidelity numerical
approximation of the analytical solution by a discrete one, hence regarded
as “truth”.

158 Chapter 4.
Subsection 4.3.1 deals with the derivation of the error bound; this error
involves quantities whose computation is detailed in Subsections 4.3.2 and
4.3.3.
4.3.1 Error bound
The sketch of the derivation of our error bound is the following: we first
give a "theoretical" error bound in Theorem 4; we then replace the uncom-
putable quantities appearing in this bound by their computable surrogates
in paragraph 4.3.1.
Theoretical error bound
Notation. We suppose that the convergence tests appearing in the New-
ton iterations performed in Section 4.1.2 and Section 4.2.2 are sufficiently
demanding so as to neglect the errors due to the iterative solution of the
nonlinear systems (4.1.13) and (4.2.2b).
We now set up some notations : first the error at time tk:
ek =
uke − uk if k > 0
π(u0)− π (π(u0)) if k = 0
the residual form rk, for v ∈ X0:
rk(v) = ℓπ(v, tk)− 1∆t〈uk − uk−1, v〉 − c(uk, uk, v)− νa(uk, v) (4.3.2)
and the "X0-norm" of the residual:
‖rk‖0 = supv∈X0,‖v‖=1
rk(v)
We introduce :
ψk(v,w) = 2c(uk, v, w) + νa(v,w)
and the so-called stability constants:
Ck = infv∈X0,‖v‖=1
ψk(v, v) (4.3.3)
To finish, we define:
ηk = |ek(0)| ‖φ0‖+|ek(1)| ‖φN ‖ ; σk = 2 |Ck| ηk ; E = supv∈X0,‖v‖=1
v
(1N
)

REDUCED-BASIS SOLUTIONS OF BURGERS EQUATION 159
(E is finite because X0 is finite dimensional), and, finally:
fk = E( |ek(0)| |ψk(φ0, φ1)|+ |ek(1)| |ψk(φN , φN −1)| )
ξAk =
E2(|ek(0)| + |ek(1)|)3
; ξBk =
53E(ek(0)2 + ek(1)2
)
ξγk =|ek(0)|3 + |ek(1)|3
3
We will also make use of the standard notation:
[x]− = max(−x, 0) ∀x ∈ R
The theoretical foundation for our error bound is the following theorem. As
the technique developed in [71] did not fit our problem (because of the weak
Dirichlet treatment, whose advantage has been shown in Remark 1 point
(3)), we developed a new strategy for obtaining this error bound.
Theorem 4. If:1
∆t+ Ck − ξA
k > 0 ∀k = 1, . . . ,T (4.3.4)
then the norm of the error ‖ek‖ satisfies:
‖ek‖ ≤
Bk +√Dk
2Akif Dk ≥ 0
BkAk
if Dk < 0
with:
Ak =1
∆t+Ck − ξA
k
Bk =2ηk + ‖ek−1‖+ E〈φ0, φ1〉(|ek(0)|+ |ek(1)|)
∆t+ σk + fk + ‖rk‖0 + ξB
k
γk =ηk ‖ek−1‖+ Eηk〈φ0, φ1〉(|ek(0)|+ |ek(1)|)
∆t+ ηkfk + [Ck]− η
2k
+16
∣∣∣ek(1)3 − ek(0)3∣∣∣+ ξγk + ‖rk‖0 ηk
and:
Dk = (Bk)2 + 4Akγk.
The proof of Theorem 4 is presented in Section 4.5.

160 Chapter 4.
Computable error bound.
We now find an efficiently computable (that is, with an offline/online de-
composition, with a complexity of the online part independent of N ) error
bound εk derived from the one described above; to do so we discuss each of
the ingredients appearing in its expression.
– Computation of the norm of the initial error ‖e0‖ is addressed in the next
Section 4.3.2; the one of ‖rk‖0 is in Section 4.3.3.
– We have, for w ∈ 0, 1:
ek(w) = uke(w)− uk(w) = bw(tk)− uk(w)
so that ek(0) and ek(1) can be computed during the online phase.
– Similarly, the scalars ‖φ0‖, ψk(φ0, φ1) and ψk(φN ,N −1) can straightfor-
wardly be computed online.
– The "continuity constant" E can be computed offline and stored by solving
the optimization problem defining it. Thus ηk, fk, ξAk , ξB
k and ξγk can be
computed online.
– The exact value of Ck could be found by solving a generalized eigenvalue
problem on X: Ck is the smallest λ ∈ R so that there exists z ∈ X0,
‖z‖ = 1 satisfying:
ψSymk (z, v) = λ〈z, v〉 ∀v ∈ X0
with ψSymk the symmetric bilinear form defined by:
ψSymk (w, v) = νa(w, v) + c(uk, w, v) + c(uk, v, w) ∀w, v ∈ X0
The cost of doing so is prohibitive as it is an increasing function of dimX =
N + 1. Instead, we will see in Section 4.3.4 how to compute lower and
upper bounds Cinfk and Csupk : Cinfk ≤ Ck ≤ Csupk .
– We can then compute the following lower and upper bounds for Ak:
Ainfk =1
∆t+ Cinfk − ξA
k ; Asupk =1
∆t+ Csupk − ξA
k
and the hypothesis (4.3.4) is ensured by checking that Ainfk > 0.
– We can also compute an upper bound of σk:
σsupk = 2ηk max( ∣∣Csupk
∣∣ ,∣∣∣Cinfk
∣∣∣)
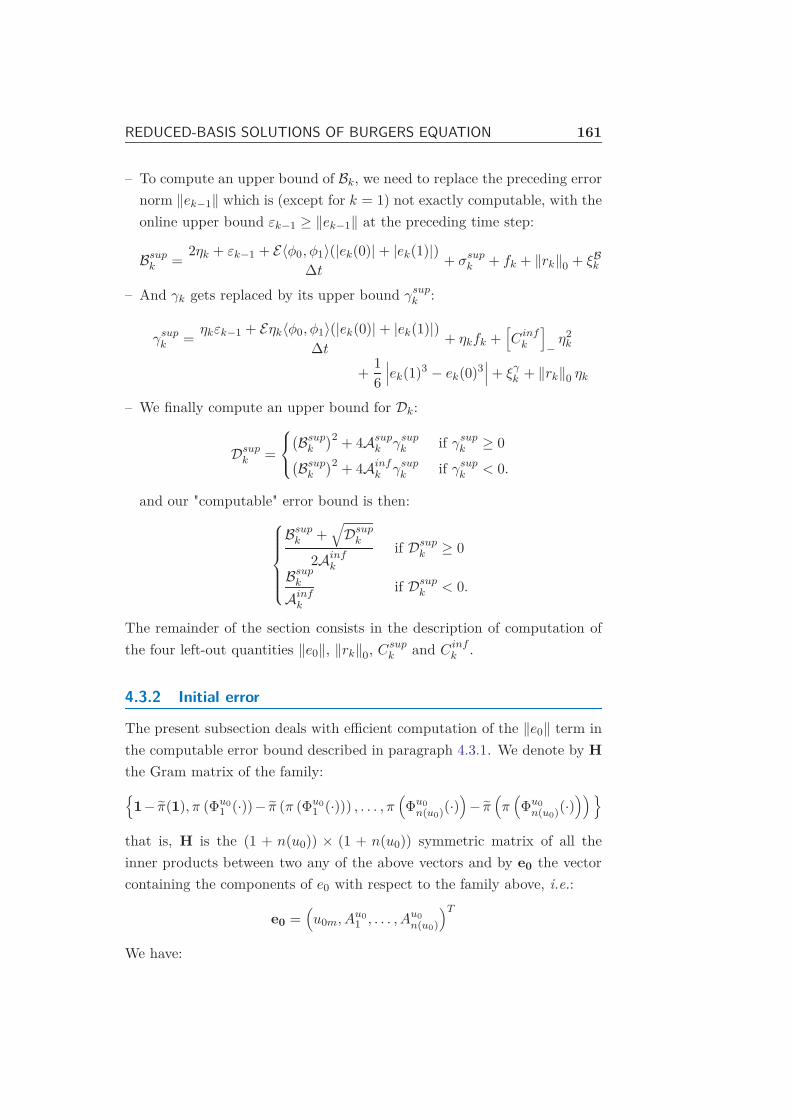
REDUCED-BASIS SOLUTIONS OF BURGERS EQUATION 161
– To compute an upper bound of Bk, we need to replace the preceding error
norm ‖ek−1‖ which is (except for k = 1) not exactly computable, with the
online upper bound εk−1 ≥ ‖ek−1‖ at the preceding time step:
Bsupk =2ηk + εk−1 + E〈φ0, φ1〉(|ek(0)| + |ek(1)|)
∆t+ σsupk + fk + ‖rk‖0 + ξB
k
– And γk gets replaced by its upper bound γsupk :
γsupk =ηkεk−1 + Eηk〈φ0, φ1〉(|ek(0)| + |ek(1)|)
∆t+ ηkfk +
[Cinfk
]−η2k
+16
∣∣∣ek(1)3 − ek(0)3∣∣∣+ ξγk + ‖rk‖0 ηk
– We finally compute an upper bound for Dk:
Dsupk =
(Bsupk
)2 + 4Asupk γsupk if γsupk ≥ 0(Bsupk
)2 + 4Ainfk γsupk if γsupk < 0.
and our "computable" error bound is then:
Bsupk +√Dsupk
2Ainfkif Dsupk ≥ 0
Bsupk
Ainfkif Dsupk < 0.
The remainder of the section consists in the description of computation of
the four left-out quantities ‖e0‖, ‖rk‖0, Csupk and Cinfk .
4.3.2 Initial error
The present subsection deals with efficient computation of the ‖e0‖ term in
the computable error bound described in paragraph 4.3.1. We denote by H
the Gram matrix of the family:
1− π(1), π (Φu0
1 (·))− π (π (Φu0
1 (·))) , . . . , π(Φu0
n(u0)(·))− π
(π(Φu0
n(u0)(·)))
that is, H is the (1 + n(u0)) × (1 + n(u0)) symmetric matrix of all the
inner products between two any of the above vectors and by e0 the vector
containing the components of e0 with respect to the family above, i.e.:
e0 =(u0m, A
u0
1 , . . . , Au0
n(u0)
)T
We have:

162 Chapter 4.
Lemma 6. The norm of the initial error ‖e0‖ is given by:
||e0|| =√
e0THe0 (4.3.5)
Proof. Parametrization 4.2.1 gives:
e0 = π(u0)− π (π(u0)) = u0m (1− π(1)) +n(u0)∑
l=1
Au0
l
(π(Φu0
l (·))− π (π (Φu0
l (·))))
and the result follows from the expansion of ‖e0‖2 when e0 is replaced by
the expression above.
This formula allows us to compute the time and parameter-independent
Gram matrix H during the offline phase, and, during the online phase, to
assemble the (1 + n(u0))-vector e0 and to perform (4.3.5) to get ||e0|| with
an online cost dependent only of n(u0).
4.3.3 Norm of the residual
We now present the computation of the ‖rk‖0 term in the computable error
bound of Section 4.3.1.
– Let the expansions of the reduced solutions with respect to the reduced
basis be:
up =N∑
j=1
upjζj for p ∈ k − 1, k
– Let G be the (1+nS(f)+ 2N +N2)× (1+nS(f)+ 2N +N2)-sized Gram
matrix of
Γint,ΓfS1 , . . . ,ΓfSnS(f),Γ〈〉1 , . . . ,Γ
〈〉N ,Γ
c1,1,Γ
c1,2, . . . ,Γ
c1,N ,
Γc2,1, . . . ,Γc2,N , . . . ,Γ
cN,N ,Γ
a1, . . . ,Γ
aN
where Γint,ΓfSp ,Γ〈〉j ,Γ
cj,j′ ,Γaj ∈ X0 (p = 1, . . . , nS(f); j, j′ = 1, . . . , N) sat-
isfy:
〈Γint, v〉 =∫ 1
0v ∀v ∈ X0
〈ΓfSp , v〉 =∫ 1
0π(ΦfSp (·)
)v ∀v ∈ X0
〈Γ〈〉j , v〉 = 〈ζj, v〉 ∀v ∈ X0
〈Γcj,j′, v〉 = c(ζj , ζj′ , v) ∀v ∈ X0
〈Γaj , v〉 = a(ζj, v) ∀v ∈ X0

REDUCED-BASIS SOLUTIONS OF BURGERS EQUATION 163
(Those Γ’s exist by virtue of the Riesz representation theorem).
– Let ρk be the following vector:
ρk =(fm,
nT (f)∑
l=1
Afl,jΦfTl (tk) (j = 1, . . . , nS(f)),− 1
∆t(ukj−uk−1
j ) (j = 1, . . . , N),
ukjukl (j, l = 1, . . . , N), νukj (j = 1, . . . , N)
)T
Lemma 7. We have:
‖rk‖0 =√
ρTk Gρk (4.3.6)
Proof. From the Riesz representation theorem, there exists a unique ρk ∈ X0
so that
〈ρk, v〉 = rk(v) ∀v ∈ X0 (4.3.7)
and we have: ‖rk‖0 = ‖ρk‖.From (4.3.7) and the definition of rk (4.3.2), we have that ρk is defined
uniquely by:
〈ρk, v〉 = ℓπ(v, tk)− 1∆t〈uk − uk−1, v〉 − c(uk, uk, v) − νa(uk, v)∀v ∈ X0
because β0(v) = β1(v) = B(·, v) = 0 for all v ∈ X0.
Using parametrization (4.2.5) of ℓπ(·, tk), we get that (4.3.7) is equivalent
to:
〈ρk, v〉 = fm
∫ 1
0v+
nT (f)∑
l=1
nS(f)∑
p=1
AflpΦfTl (tk)
∫ 1
0π(ΦfSp (·)
)v− 1
∆t
N∑
j=1
(ukj−uk−1j )〈ζj , v〉
−N∑
j=1
ukj
N∑
j′=1
ukj′c(ζj , ζj′ , v) + νa(ζj, v)
∀v ∈ X0 (4.3.8)
By the superposition principle, ρk can be written as the linear combination:
ρk = fmΓint +nS(f)∑
p=1
nT (f)∑
l=1
AflpΦfTl (tk)
ΓfSp − 1
∆t
N∑
j=1
(ukj − uk−1j )Γ〈〉
j
−N∑
j=1
N∑
j′=1
ukjukj′Γcj,j′ −
N∑
j=1
νukjΓaj
Thus ρk contains the components of ρk with respect to the family whose G
is the Gram matrix, and so:
‖rk‖0 = ‖ρk‖ =√
ρTk Gρk. (4.3.9)

164 Chapter 4.
The offline/online decomposition for computation of ‖rk‖0 is as follows: in
the offline phase, we compute the Γ’s vectors, and compute and store their
Gram matrix G. In the online phase, we compute ρk and compute ‖rk‖0
using (4.3.6). Note that one can reduce offline and online computational
burden, as well as storage requirement, by noticing that Γcj,j′ = Γcj′,j for all
j, j′.
The cost of computation (and storage) of ρk and ‖ρk‖ asymptotically domi-
nates the cost of the online phase. This cost is in O((nS(f)nT (f) +N2
)2)
.
Again, we see that our weak Dirichlet treatment, as nT (f) remains indepen-
dent of n(b0) and n(b1), allows for a better complexity of the online phase.
4.3.4 Lower and upper bounds on stability constant
To find lower and upper bounds on Ck efficiently in order to use them
in our computable error bound of Section 4.3.1, we turn to the successive
constraints method (SCM) [51, 71]. Here we present the application to our
case for the sake of self-containedness. Our difference is the use of the metric
(4.3.10) during the constraint-selection phase.
Notation. As in Section 4.2.3, we will need to handle reduced solutions
of several values of the parameter tuple µ ∈ P (see (4.2.1)), for different
timesteps k = 1, . . . ,T . We thus define an application that is the "reduced"
counterpart of u defined in Section 4.2.3:
u :
1, . . . ,T × P → X0
(k, µ) 7→ u(k, µ) = uk satisfying (4.2.2b) for µ as parameter
We make Ck depend explicitly on µ by defining:
Ck(µ) = infv∈X0,‖v‖=1
[2c(u(k, µ), v, v) + ν(µ)a(v, v)]
SCM lower bound. We now proceed to the derivation of the SCM lower
bound of Ck(µ). We use the RB expansion: u(k, µ) =N∑
j=1
ukj (µ)ζj to rewrite

REDUCED-BASIS SOLUTIONS OF BURGERS EQUATION 165
Ck(µ) as:
Ck(µ) = infv∈X0,‖v‖=1
N∑
j=1
2ukj (µ)c(ζj , v, v) + νa(v, v)
= infy=(y1,...,yN+1)∈Y
N∑
j=1
2ukj (µ)yj + νyN+1
= infy∈Y
J (µ, k, y)
where:
Y =y = (y1, . . . , yN+1) ∈ RN+1|∃v ∈ X0, ‖v‖ = 1 s.t.
yj = c(ζj , v, v)∀j = 1, . . . , N, yN+1 = a(v, v)
and:
J (µ, k, y) = 2N∑
j=1
ukj (µ)yj + νyN+1
We define, for a given "constraint subset" C ⊂ 1, . . . ,T × P that will be
chosen later:
– Y =
(y1, . . . , yN+1) ∈
N+1∏
i=1
[σmini ;σmaxi
]|J (µ′, k′, y) ≥ Ck′(µ′), ∀(µ′, k′) ∈ S(µ, k)
with S(µ, k) standing for the set of the M points in C that are closest to
(µ, k) with respect to this metric:
d((µ, k), (µ′, k′)
)=
dim P∑
i=1
(µi − µ′i
µimin − µimax
)2
+(k − k′
T
)2
(4.3.10)
where(µ1, . . . , µdim P
)are the coordinates of µ ∈ P, and:
µimin = minµ∈P
µi, µimax = maxµ∈P
µi
for i = 1, . . . ,dimP (here dimP = 1 + 2 + n(b0) + n(b1) + nT (f)nS(f) +
n(u0) is the number of parameters).
The metric defined in (4.3.10) quantifies proximity of two parameter-time
tuples, with appropriate weighting so as to account for scaling differences
between the parameters.
– We further define:
σmini = infv∈X0,‖v‖=1
c(ζi, v, v), ∀i = 1, . . . , N σminN+1 = infv∈X0,‖v‖=1
a(v, v)
σmaxi = supv∈X0,‖v‖=1
c(ζi, v, v), ∀i = 1, . . . , N σmaxN+1 = supv∈X0,‖v‖=1
a(v, v)

166 Chapter 4.
The SCM lower bound is then given by the following lemma:
Lemma 8 (Proposition 1 in [51]). For every C ⊂ 1, . . . ,T ×P and M ∈ N,
and every k = 1, . . . ,T , a lower bound for Ck(µ) is given by:
Cinfk (µ) = infy∈Y
[J (µ, k, y)] (4.3.11)
An algorithm for choosing a constraint subset C will be given after the
description of the SCM upper bound and the SCM offline/online procedure.
SCM upper bound. We define:
Yup = y∗(ki, µi) ; i = 1, . . . , I ; (ki, µi) ∈ C
where:
C = (k1, µ1), (k2, µ2), . . . , (kI , µI)
and:
y∗(ki, µi) = arginfy∈Y
[J (µi, ki, y)] (i = 1, . . . , I)
Lemma 9 (Proposition 1 in [51]). For every k = 1, . . . ,T , an upper bound
for Ck is given by:
Csupk (µ) = infy∈Yup
J (µ, k, y) (4.3.12)
SCM offline/online procedure. Relying on Lemmas 8 and 9, our
offline/online procedure for computing Cinfk and Csupk reads:

REDUCED-BASIS SOLUTIONS OF BURGERS EQUATION 167
– offline:
1. choose M and constraint set C (see next paragraph) ;
2. compute and store σmini and σmaxi (i = 1, . . . , N + 1) by solving a
generalized eigenproblem on X0 ;
3. for each (k′, µ′) ∈ C:
(a) solve a generalized eigenproblem on X0 to find Ck′(µ′) (and store
it);
(b) let w ∈ X0 be a unit eigenvector of the above eigenproblem; com-
pute and store (in Yup) y∗(k′, µ′) using:
y∗(k′, µ′)j = c(ζj , w,w) (j = 1, . . . , N)
y∗(k′, µ′)N+1 = a(w,w)
– online:
– for the lower bound:
1. assemble and solve optimization problem (4.3.11) ;
– for the upper bound: test one-by-one each element of Yup to solve
(4.3.12).
Algorithm 4: SCM offline/online
In the lower bound online phase, the optimization problem required to solve
is a linear programming problem (LP) with N + 1 variables and N + 1 +M
constraints (M one-sided inequalities and N + 1 two-sided). There are al-
gorithms, such as the simplex algorithm (see [73] for instance), which solve
such optimization problems under (on average) polynomial complexity with
respect to the number of variables and number of constraints, even if they
can be exponential in the worst cases. What matters here is this complex-
ity is independent of N . The upper bound online phase has a complexity
depending linearily on the cardinality of the reasonably-sized C and on N .
"Greedy" constraint set selection. To choose C in Algorithm 4, step
1, we can use the greedy constraint set selection Algorithm 5.

168 Chapter 4.
1. choose M ∈ N ;
2. initialize C = (k1, µ1) with arbitrary k1 ∈ 1, . . . ,T and µ1 ∈ P;
3. choose a rather large, finite-sized sample Ξ ⊂ 1, . . . ,T × P ;
4. repeat:
– using the "current" C to compute Csup and Cinf , append:
(k∗, µ∗) = argmax(k,µ)∈Ξ
exp(Csupk (µ)
)− exp(Cinfk (µ)
)
exp(Csupk (µ)
) to C.
Algorithm 5: Greedy constraint set selection
The repeat loop in this algorithm can be stopped either when #C has reached
a maximal value, or when the "relative exponential sharpness" indicator:
max(k,µ)∈Ξ
exp(Csupk (µ)
)− exp(Cinfk (µ)
)
exp(Csupk (µ)
)
gets less than a desired precision. We use a measure of the difference between
the exponentials so as to account for the "exponential" effect of the stability
constants on the error bounds [71].
As in the greedy algorithm for basis selection described at Section 4.2.3, this
algorithm makes, at each step, the "best possible" choice, that is the value
of the parameter and time for which the bounds computed using the current
constraint set are the less sharp.
A last remark we can give on the algorithm is about the trade-off in the
choice of M : whatever M is, we always get a certified bound on Ck(µ), but
increasing M will improve sharpness of this bound, at the expense of an
increase in online computation time.
4.4 Numerical results
We now present some numerical results obtained with the methodology de-
scribed above. We implemented it in a software package written in C++,
using GNU OpenMP [42] as threading library, ARPACK [3] for eigenvalues
computation and GLPK [41] as linear programming problems solver.
For all the experiments above, the convergence test for Newton iterations
when solving (4.1.13) and (4.2.2b) was the following: ‖δ‖2 ≤ 3×10⁻¹⁶. The
penalization constant used was P = 107.

REDUCED-BASIS SOLUTIONS OF BURGERS EQUATION 169
We also took M = #C = 10 as parameters for the SCM procedure.
The Φ functions appearing in the parametrizations of u0, b0, b1 and f are
chosen to be sine functions with fixed known angular velocity. More specif-
ically, we suppose that:
b0(t) = b0m +n(b0)∑
l=1
Ab0
l sin(ωb0
l t) b1(t) = b1m +n(b1)∑
l=1
Ab1
l sin(ωb1
l t)
f(t, x) = fm +nT (f)∑
l=1
nS(f)∑
p=1
Aflp sin(ωfTl t) sin(ωfSp x) u0(x) = u0m +n(u0)∑
l=1
Au0
l sin(ωu0
l x)
4.4.1 Reference solutions
Figure 4.1 shows an example of the reference solution of (4.1.1), (4.1.2) and
(4.1.7) every 10 timesteps. The parameters were:
N = 40 ∆t = .02
T = 2 ν = 1
b0(t) = 1 b1(t) = 1.28224
f(t, x) = 1 u0(x) = 1 + 2 sin(3x)
(4.4.1)
Figure 4.2 does the same with a lower viscosity. The parameters were:
N = 40 ∆t = .002
T = 2 ν = .1
b0(t) = 1 b1(t) = 1.28224
f(t, x) = 1 u0(x) = 1 + 2 sin(3x)
(4.4.2)
Figures 4.1 and 4.2 show the solution u of the viscous Burgers’ equation
plotted as functions of space x, for various times t, respectively for the
parameter set (4.4.1) and (4.4.2).
We have checked that the a posteriori indicator of boundary error (4.1.8)
gets no higher than 6× 10⁻⁷ in both cases.
4.4.2 Reduced solutions
Computational economy
To show the substantial time savings provided by the reduced basis approx-
imation, we compute the reduced solution for the parameters set given by

170 Chapter 4.
1
1.2
1.4
1.6
1.8
2
2.2
2.4
2.6
2.8
3
0 0.2 0.4 0.6 0.8 1
Figure 4.1: Full solution with high viscosity ν = 1. Plots of the solution u
of equation (4.1.1), (4.1.2), (4.1.7) as a function of space x, for various times
t ranging from t = 0 to t = 2 (the bottom lines correspond to high times).
We use the parameters defined in (4.4.1).
1
1.2
1.4
1.6
1.8
2
2.2
2.4
2.6
2.8
3
0 0.2 0.4 0.6 0.8 1
Figure 4.2: Full solution with low viscosity ν = .1. Plots of the solution u of
(4.1.1), (4.1.2), (4.1.7) as a function of space x, for various times t ranging
from t = 0 to t = 2 (the bottom lines correspond to high times). We use
the parameters defined in (4.4.2).

REDUCED-BASIS SOLUTIONS OF BURGERS EQUATION 171
(4.4.1), with N = 60. The full solution (with N = 60) takes 0.26s CPU
time to be produced (when using Thomas’ algorithm for tridiagonal matri-
ces inversion).
We use the POD-driven basis selection procedure to select the N = 7 lead-
ing POD modes (using S = 30 snapshots). The resulting basis (with the
functions sorted by increasing magnitude of eigenvalues) is shown in Figure
4.3. We did not make use of the "expansion" procedure described in Section
4.2.3. The overall CPU time for the offline phase was 6.36s.
We used fixed parameters n(b0) = n(b1) = nS(f) = nT (f) = n(u0) = 1 and
parameter ranges as shown in Table 4.1.
Parameter Min. Max. Parameter Min. Max.
ν .8 1.2 Au0
1 1.1 3
Ab0
1 .9 1.2 ωb0
1 1 1
Ab1
1 .9 1.2 ωb1
1 1 1
fm 0 2 ωfT1 2 2
Af1,1 0.7 1.3 ωfS1 2 2
u0m 0 1 ωu0
1 3 3
Table 4.1: Ranges of the different parameters in the benchmark of Section
4.4.2.
We then used this basis to compute the reduced solution for a particular
(randomly chosen) instance of the parameters. The reduced solution was
computed in 0.04s, including the time necessary for the online error bound
computation, shown in Figure 4.4 (solid line). Our procedure reduces the
marginal cost to 15% of the original cost, yet providing a certified L2 relative
error of less than 1‰.
Error bound estimation
Still using the preceding POD basis and instance of the parameters, we com-
pared the online error bound with the actual error, for the same parameter
set as above. The result is shown in Figure 4.4. We see that our error
bound is quite sharp, especially when it follows the decrease in the actual
error near t = 1.3. We also checked for the quality of the SCM procedure,
by comparing the actual stability constant with the lower bound provided
by SCM (Figure 4.5).

172 Chapter 4.
-0.4
-0.3
-0.2
-0.1
0
0.1
0.2
0 0.2 0.4 0.6 0.8 1
zeta
_1
x
-0.4-0.3-0.2-0.1
0 0.1 0.2 0.3 0.4
0 0.2 0.4 0.6 0.8 1
zeta
_2
x
-0.2
-0.1
0
0.1
0.2
0.3
0.4
0 0.2 0.4 0.6 0.8 1
zeta
_3
x
-0.3
-0.2
-0.1
0
0.1
0.2
0.3
0.4
0 0.2 0.4 0.6 0.8 1
zeta
_4
x
-0.15-0.1
-0.05 0
0.05 0.1
0.15 0.2
0.25 0.3
0.35
0 0.2 0.4 0.6 0.8 1
zeta
_5
x
-0.2-0.15
-0.1-0.05
0 0.05
0.1 0.15
0.2 0.25
0.3
0 0.2 0.4 0.6 0.8 1
zeta
_6
x
0.12
0.122
0.124
0.126
0.128
0.13
0.132
0 0.2 0.4 0.6 0.8 1
zeta
_7
x
Figure 4.3: POD reduced basis: plots, as functions of space, of the 7 leading
POD modes, i.e. the ζi (i = 1, . . . , 7) defined by (4.2.6), with zi (i =
1, . . . , 7) the leading eigenvectors of MTΩM . The modes are sorted (from
top to bottom, and from left to right) by increasing magnitude of eigenvalues.
Parameter ranges for snapshot sampling are those in Table 4.1.

REDUCED-BASIS SOLUTIONS OF BURGERS EQUATION 173
1e-09
1e-08
1e-07
1e-06
1e-05
0.0001
0.001
0 0.5 1 1.5 2
t
L2 error bound (relative)L2 actual error (relative)
Figure 4.4: Relative L2 online error bound and actual error. We plot in
solid lineεk‖uk‖ , and in dashed line
∥∥∥uk − uk∥∥∥
‖uk‖ as functions of t = k∆t for
k = 1, . . . ,T .
9.65
9.7
9.75
9.8
9.85
9.9
9.95
0 0.2 0.4 0.6 0.8 1 1.2 1.4 1.6 1.8 2
t
true stability constantSCM lower bound
Figure 4.5: True stability constant Ck defined by (4.3.3) and SCM lower
bound Cinfk defined by (4.3.11) as functions of time. We use M = #C = 10
as SCM parameters.

174 Chapter 4.
1e-06
1e-05
0.0001
0.001
0.01
0.1
5 6 7 8 9 10
reduced basis size
mean relative error on 100 values (POD)maximal relative error on 100 values (POD)
mean relative error on 100 values (GDY)maximal relative error on 100 values (GDY)
Figure 4.6: Convergence benchmark 1. We plot (on a logarithmic scale)
maximal and mean relative online error bounds over a (uniform) random
sample of 100 initial values u0m ∈ [0, 1], as functions of the reduced basis
size N , when the reduced basis is chosen using POD-based procedure (POD)
or greedy procedure (GDY). Fixed parameters are ν = 1 and fm = 1.
4.4.3 Convergence benchmarks
In order to compare our three basis selection procedures (POD, greedy and
POD-Greedy), we have made "convergence benchmarks", i.e. representa-
tions of the maximal and mean (estimated) error over all timesteps, and
over a sample of 100 parameters as functions of the size of the reduced ba-
sis. The same sample of benchmark parameters is used throughout all the
procedure.
Comparison of greedy (with #Ξ = 100) and POD (with S = 60) procedures
for N = 40, T = 2, ∆t = .02, n(b0) = n(b1) = nS(f) = nT (f) = n(u0) = 0,
with parameters fm and ν fixed to unity, and varying u0m ∈ [0, 1] (and thus
initial boundary values b0m and b1m, moving accordingly to compatibility
conditions (4.1.4)) is shown in Figure 4.6.
The benchmarking process for greedy took 19.5s of CPU time, the one for
POD took 14.98s. The online cost, depending only on the size of the reduced
basis, is the same regardless of how the reduced basis has been chosen. We
also see the fast (exponential) convergence of error bound towards zero as
N increases.

REDUCED-BASIS SOLUTIONS OF BURGERS EQUATION 175
Another benchmark was then made, with the same data, except that ν = .1
and ∆t = .002. The result is visualized in Figure 4.7. The POD benchmark-
ing process took 349 s of CPU time, the POD-Greedy, 282 s, and the Greedy,
470 s. We notice that a smaller viscosity leads to degraded precision of our
RB approximation. The resulting final basis selected by the POD-Greedy is
displayed in Figure 4.8.
The POD-Greedy algorithm is run using P1 = 2 and initialized using the
full time-discrete trajectory (hence, 200 vectors) for one parameter value.
Using the initial data as initialization for the POD-Greedy algorithm and
using P1 = 1 may give better overall performance of POD-Greedy (at the
expense of an increased offline computation time), as the sample of error
bounds is updated at every step of the algorithm (instead of every other
step for P1 = 2).
4.4.4 Effect of mesh refinement and penalization constant
To check for the robustness of our bound, we studied the influence of N (the
number of “full” spatial discretization points) and P on the magnitude and
the sharpness of our error bound. We ran the same benchmark as in Section
4.4.2, but with different N or P .
We did the test with refined meshes (N = 200, N = 800) and we obtained
a similar error bound profile; we conclude that the sharpness of our error
bound is quite insensitive to mesh refinement.
In Figure 4.9, we visualize the actual error and the error bound for various
values of P (with N = 60). We see that the error bound is tighter and
sharper for high values of the penalization constant P . This can easily be
explained by the fact that, as P → +∞, the errors at the boundary ek(0)
and ek(1) vanish, hence modifying all the terms in the error bound (i.e.,
decreasing ηk, σk, fk, ξAk , ξB
k , ξγk , Bk, γk and increasing Ak) where these
errors appear.
4.4.5 Comparison with existing bound
We compared our error bound with the bound described in [71], for N = 60,
∆t = .02, T = 2, fixed u0 = b0 = b1 = 0, f = 1 and variable ν ∈ [0.1; 1].
The reduced basis is found by POD with S = 90. Figure 4.10 shows that
our bound is clearly better than the existing reference bound.

176 Chapter 4.
1e-05
0.0001
0.001
0.01
0.1
1
2 4 6 8 10 12 14 16
Mean relative error bound (Greedy)Mean relative error bound (POD)
Mean relative error bound (POD-Greedy)
0.0001
0.001
0.01
0.1
1
10
2 4 6 8 10 12 14 16
Maximal relative error bound (Greedy)Maximal relative error bound (POD)
Maximal relative error bound (POD-Greedy)
Figure 4.7: Convergence benchmark 2. We plot (on a logarithmic scale)
maximal (bottom) and mean (top) online error bounds over a (uniform)
random sample of 100 initial values u0m ∈ [0, 1], as functions of the reduced
basis size N , when reduced basis is chosen using POD-based procedure with
S = 90, Greedy, or POD-Greedy procedure with P1 = 2. Fixed parameters
are ν = 0.1 and fm = 1.

REDUCED-BASIS SOLUTIONS OF BURGERS EQUATION 177
0 0.2 0.4 0.6 0.8 1
zeta
_1
x
0 0.2 0.4 0.6 0.8 1
zeta
_2
x
0 0.2 0.4 0.6 0.8 1
zeta
_3
x
0 0.2 0.4 0.6 0.8 1
zeta
_4
x
0 0.2 0.4 0.6 0.8 1
zeta
_5
x
0 0.2 0.4 0.6 0.8 1
zeta
_6
x
0 0.2 0.4 0.6 0.8 1
zeta
_7
x
0 0.2 0.4 0.6 0.8 1
zeta
_8
x
0 0.2 0.4 0.6 0.8 1
zeta
_9
x
0 0.2 0.4 0.6 0.8 1
zeta
_10
x
0 0.2 0.4 0.6 0.8 1
zeta
_11
x
0 0.2 0.4 0.6 0.8 1
zeta
_12
x
0 0.2 0.4 0.6 0.8 1
zeta
_13
x
0 0.2 0.4 0.6 0.8 1
zeta
_14
x
0 0.2 0.4 0.6 0.8 1
zeta
_15
x
Figure 4.8: Reduced basis selected at the final step of the POD-Greedy pro-
cedure carried out for the previous benchmark (Figure 4.7). Basis elements
are plotted as functions of space, and are sorted (from top to bottom, left
to right) in order of selection in the greedy procedure.

178 Chapter 4.
1e-05
0.0001
0.001
0.01
0.1
0 0.5 1 1.5 2
t
L2 error bound (relative)L2 actual error (relative)
1e-07
1e-06
1e-05
0.0001
0.001
0 0.5 1 1.5 2
t
L2 error bound (relative)L2 actual error (relative)
1e-08
1e-07
1e-06
1e-05
0.0001
0.001
0 0.5 1 1.5 2
t
L2 error bound (relative)L2 actual error (relative)
1e-09
1e-08
1e-07
1e-06
1e-05
0.0001
0.001
0 0.5 1 1.5 2
t
L2 error bound (relative)L2 actual error (relative)
Figure 4.9: Relative L2 online error bound and actual error. We plot in
solid lineεk‖uk‖ , and in dashed line
∥∥∥uk − uk∥∥∥
‖uk‖ as functions of t = k∆t for
k = 1, . . . ,T , and N = 60 and, from left to right and top to bottom,
P = 102, P = 104, P = 105 and P = 1012.

REDUCED-BASIS SOLUTIONS OF BURGERS EQUATION 179
Besides, we have performed a benchmark over a fixed sample of 100 random
values of ν uniformly chosen in [0.1; 1]. For our bound, the mean error bound
is 0.00076, the maximum error bound is 0.02, while for the bound of [71],
we obtain 0.0041 for the mean bound and 0.25 for the maximum.
It is easy to see that, when the boundary conditions are fixed to zero, the
recurrence formula for the error bound reduces to:
‖ek‖ ≤‖ek−1‖+ ∆t ‖rk‖0
1 + Ck∆t
while the error bound described in [71] has the following expression:
‖ek‖ ≤
√√√√‖ek−1‖2 + ∆tν ‖rk‖
20
1 + Ck∆t
where the modified stability constant Ck reads:
Ck = infv∈X0
4c(uk, v, v) + νa(v, v)
‖v‖2
We recall that our stability constant Ck is given by:
Ck = infv∈X0,‖v‖=1
[2c(uk, v, v) + νa(v, v)
]
The ν-dependence of the bound can explain why our bound is better, es-
pecially for small values of ν. Besides, the derivation of our error bound
makes lesser use of inequalities (for instance, we do not make use of Young’s
inequality at the beginning of the proof, each inequality used is a potential
source of optimality loss) and keeps treating more terms.
Conclusion
We have presented a certified procedure for low marginal cost approximate
resolution of the viscous Burgers equation with parametrized viscosity, as
well as initial and boundary value data. This procedure makes use of a
reduced basis offline/online procedure for a penalized weak formulation, an
efficiently computed error bound in natural L2 norm (made possible by the
successive constraints method (SCM)), and three procedures at hand for
choosing a basis to expand reduced solutions in.
Our procedure becomes less useful when the ratio time/viscosity increases,
as this degradates the stability constant Ck. Another limitation of our

180 Chapter 4.
1e-05
0.0001
0.001
0.01
0.1
1
0 0.5 1 1.5 2
t
L2 error bound (relative)L2 reference bound (relative)
L2 actual error (relative)
Figure 4.10: Comparison with the existing error bound for reduced basis
Burgers equation (reference bound). We plot the actual error, the existing
(reference) error bound and our error bound as functions of time. We took
ν = 0.1.
method, for one willing to use it for large times, is that the online procedure
complexity still depends on the temporal discretization step. However, our
numerical experiments show a substantial decrease in marginal cost when
using reduced basis approximation, as well as efficiency (both in terms of
sharpness and computation time) of the provided error bound for moderate
viscosities. This decrease in the cost is made possible by the fact that online
procedure has a complexity that is independent from the number of spatial
discretization points.
4.5 Appendix – Proof of Theorem 4
Proof. Subtracting left-hand side of (4.2.2b) from both sides of relation
(4.3.1) yields that for k = 1, . . . ,T , the error at time tk: ek = uke − uk
satisfies, for every v ∈ X0:
1∆t
(〈ek, v〉−〈ek−1, v〉)+c(uke , uke , v)−c(uk, uk, v)+νa(ek, v) = rk(v) (4.5.1)
We write:
ek = ek(0)φ0 + ek(1)φN + ezk (4.5.2)

REDUCED-BASIS SOLUTIONS OF BURGERS EQUATION 181
with ezk ∈ X0 = v ∈ X st. v(0) = v(1) = 0. And, by applying (4.5.1) with
v = ezk:
1∆t
(〈ek, ezk〉 − 〈ek−1, ezk〉) + c(uke , u
ke , e
zk)− c(uk, uk, ezk) + νa(ek, ezk) = rk(ezk)
(4.5.3)
Since:
〈ek, ezk〉 = ek(0)〈φ0, ezk〉+ ek(1)〈φN , e
zk〉+ ‖ezk‖2
= ‖ezk‖2 + ek(0)ezk
(1N
)〈φ0, φ1〉+ ek(1)ezk
(1− 1
N
)〈φN −1, φN 〉
and that, for every v ∈ X:
c(uke , uke , v)− c(uk, uk, v) = −1
2
∫ 1
0
((uke)
2 − (uk)2) ∂v∂x
= −12
∫ 1
0
(uke − uk
) (uke + uk
) ∂v∂x
= −12
∫ 1
0ek(uk + uk + ek
) ∂v∂x
= 2c(uk, ek, v) + c(ek, ek, v)
We have that (4.5.3) implies:
1∆t
(‖ezk‖2−〈ek−1, ezk〉)+ψk(ek, e
zk)+
1∆t
(ek(0)ezk
(1N
)〈φ0, φ1〉+ ek(1)ezk
(1− 1
N
)〈φN , φN −1〉
)
= rk(ezk)− c(ek, ek, ezk) (4.5.4)
We are now willing to find a lower bound for the left-hand side of (4.5.4)
and an upper bound for its right-hand side.
Lower bound for LHS. From Cauchy-Schwarz inequality:
−〈ek−1, ezk〉 ≥ −‖ek−1‖ ‖ezk‖
and, by the triangle inequality:
‖ek‖ − ηk ≤ ‖ezk‖ ≤ ‖ek‖+ ηk (4.5.5)
because ηk = |ek(0)| ‖φ0‖+ |ek(1)| ‖φN ‖.So:
− 〈ek−1, ezk〉 ≥ −‖ek−1‖ (‖ek‖+ ηk) (4.5.6)
We also have:
‖ezk‖2 ≥ ‖ek‖2 + ‖ek − ezk‖2 − 2 ‖ek‖ ‖ek − ezk‖ ≥ ‖ek‖2 − 2 ‖ek‖ ηk (4.5.7)

182 Chapter 4.
because of Cauchy-Schwarz and triangle inequalities.
Besides,
0 ≤ ‖ezk‖ ≤ ‖ezk − ek‖+ ‖ek‖ ≤ ηk + ‖ek‖
so that:
‖ezk‖2 ≤ (‖ek‖+ ηk)2 (4.5.8)
Using the bilinearity of ψk, we have:
ψk(ek, ezk) = ψk(e
zk, e
zk)+ek(0)ψk(φ0, φ1)ezk
(1N
)+ek(1)ψk(φN , φN −1)ezk
(1− 1
N
)
(4.5.9)
because ψk(φ0, φN ) = ψk(φN , φ0) = 0, since φ0 and φN have no common
support, ψk(φ0, φj) = 0 for j > 1, and ψk(φN , φj) = 0 for j < N − 1.
From the definition of the stability constant Ck:
ψk(ezk, e
zk) ≥ Ck ‖ezk‖2
So that, thanks to (4.5.7) and (4.5.8),
ψk(ezk, e
zk) ≥
Ck ‖ek‖2 − 2ηkCk ‖ek‖ if Ck ≥ 0
Ck ‖ek‖2 + 2ηkCk ‖ek‖+ Ckη2k if Ck ≤ 0
That is
ψk(ezk, ezk) ≥ Ck ‖ek‖2 − σk ‖ek‖ − [Ck]− η
2k (4.5.10)
from the definition of σk.
We have: ∣∣∣∣ezk
(1N
)∣∣∣∣ ≤ E ‖ezk‖ ≤ E ‖ek‖+ Eηk (4.5.11)
and by symmetry:∣∣∣∣ezk
(1− 1
N
)∣∣∣∣ ≤ E ‖ezk‖ ≤ E ‖ek‖+ Eηk (4.5.12)
so that, combining (4.5.11), (4.5.12) and introducing fk:∣∣∣∣ek(0)ψk(φ0, φ1)ezk
(1N
)+ ek(1)ψk(φN , φN −1)ezk
(1− 1
N
)∣∣∣∣ ≤ ‖ek‖ fk+ηkfk
Now we can say that:
ek(0)ψk(φ0, φ1)ezk
(1N
)+ek(1)ψk(φN , φN −1)ezk
(1− 1
N
)≥ −‖ek‖ fk−ηkfk
(4.5.13)

REDUCED-BASIS SOLUTIONS OF BURGERS EQUATION 183
And we also have:∣∣∣∣ek(0)ezk
(1N
)〈φ0, φ1〉+ ek(1)ezk
(1− 1
N
)〈φN −1, φN 〉
∣∣∣∣
≤ |ek(0)| (E ‖ek‖+ Eηk) 〈φ0, φ1〉+ |ek(1)| (E ‖ek‖+ Eηk) 〈φN , φN −1〉= E(|ek(0)| 〈φ0, φ1〉+ |ek(1)| 〈φN , φN −1〉) ‖ek‖+ Eηk(|ek(0)| 〈φ0, φ1〉+ |ek(1)| 〈φN , φN −1〉)= E〈φ0, φ1〉(|ek(0)|+ |ek(1)|) ‖ek‖+ Eηk〈φ0, φ1〉(|ek(0)| + |ek(1)|) (4.5.14)
since 〈φ0, φ1〉 = 〈φN , φN −1〉 by symmetry.
Thus, thanks to (4.5.7), (4.5.6), (4.5.9), (4.5.10), (4.5.13) and (4.5.14), the
left-hand side of (4.5.4) is greater than:
(1
∆t+ Ck
)‖ek‖2−
(2ηk + ‖ek−1‖+ E〈φ0, φ1〉(|ek(0)| + |ek(1)|)
∆t+ σk + fk
)‖ek‖
− ηk ‖ek−1‖+ Eηk〈φ0, φ1〉(|ek(0)| + |ek(1)|)∆t
− [Ck]− η2k − ηkfk (4.5.15)
Upper bound for RHS. We have:
c(ek, ek, ezk) = c(ek, ek, ek)− ek(0)c(ek , ek, φ0)− ek(1)c(ek , ek, φN )
but:
c(ek, ek, ek) = −12
∫ 1
0e2k
∂ek∂x
= −16
∫ 1
0
∂[(ek)3
]
∂x
= −16
((ek(1))3 − (ek(0))3
)
So:
c(ek, ek, ezk) = −16
((ek(1))3 − (ek(0))3
)−(ek(0)
∫ 1
0e2k
∂φ0
∂x+ ek(1)
∫ 1
0e2k
∂φN∂x
)
= −16
((ek(1))3 − (ek(0))3
)+N
(ek(0)
∫ 1/N
0e2k − ek(1)
∫ 1
1−1/Ne2k
)
(4.5.16)
Since, for all x ∈[0;
1N
],
ek(x) = ek(0) +N(ek
(1N
)− ek(0)
)x

184 Chapter 4.
we have, thanks to∣∣∣∣ek(
1N
)∣∣∣∣ ≤ E ‖ek‖:∣∣∣∣∣N × ek(0)
∫ 1/N
0e2k
∣∣∣∣∣ ≤ N|ek(0)|N
×
∣∣∣∣ek(
1N
)∣∣∣∣ |ek(0)| +ek(
1N)2
+ ek(0)2
3+
2∣∣∣ek(
1N)ek(0)
∣∣∣3
≤ |ek(0)|(E ‖ek‖ |ek(0)|+ E2 ‖ek‖2
3+ek(0)2
3+
2 |ek(0)|3
E ‖ek‖)
≤ E2 |ek(0)|3
‖ek‖2 +53|ek(0)|2 E ‖ek‖+
|ek(0)|33
As a similar computation can be worked out for
∣∣∣∣∣N × ek(1)∫ 1
1−1/Ne2k
∣∣∣∣∣, we
have:
−(ek(0)
∫ 1
0e2k
∂φ0
∂x+ ek(1)
∫ 1
0e2k
∂φN∂x
)≤ ξA
k ‖ek‖2 + ξBk ‖ek‖+ ξγk
We also have, thanks to (4.5.5):
|rk(ezk)| ≤ ‖rk‖0 ‖ezk‖ ≤ ‖rk‖0 ‖ek‖+ ‖rk‖0 ηk
where:
‖rk‖0 = supv∈X0,‖v‖=1
rk(v)
Hence, the right-hand side of (4.5.4) is less than:
ξAk ‖ek‖2 + (‖rk‖0 + ξB
k ) ‖ek‖+16
∣∣∣ek(1)3 − ek(0)3∣∣∣+ ξγk + ‖rk‖0 ηk
Conclusion. Now (4.5.4) implies, thanks to (4.5.15), and (4.5.16):
Ak ‖ek‖2 − Bk ‖ek‖ − γk ≤ 0 (4.5.17)
Viewing left-hand side of (4.5.17) as a (convex, thanks to our hypothesis
(4.3.4)) quadratic function Q of ‖ek‖, whose discriminant is Dk, equation
(4.5.17) implies that, if Dk ≥ 0, ‖ek‖ is smaller than the greatest real root
of Q, that is:
‖ek‖ ≤Bk +
√Dk2Ak
If Dk < 0, then necessarily γk < 0 (as Ak is positive). Hence (4.5.17) implies:
Ak ‖ek‖2 − Bk ‖ek‖ ≤ 0

REDUCED-BASIS SOLUTIONS OF BURGERS EQUATION 185
and so:
‖ek‖ ≤BkAk
.
Acknowledgements: We would like to thank the anonymous referees,
whose careful reading and comments have helped to greatly improve this
paper. This work has been partially supported by the French National Re-
search Agency (ANR) through COSINUS program (project COSTA-BRAVA
n° ANR-09-COSI-015).

186 Chapter 4.

Chapter 5
Goal-oriented error estimation
for reduced basis method, with
application to certified
sensitivity analysis
Résumé: La méthode base réduite est une puissante technique de réduc-
tion de modèle, conçue pour accélérer le calcul d’un grand nombre de solu-
tions numériques à des équations aux dérivées partielles (EDP) paramétrées.
Nous considérons le calcul d’une quantité d’intérêt, qui est une fonction-
nelle linéaire de la solution de l’EDP paramétrée. Comparée à la quantité
d’intérêt originale, la quantité d’intérêt calculée en utilisant le modèle ré-
duit est entâchée d’une erreur de réduction. Nous présentons une nouvelle
borne, efficace et explicitement calculable, pour cette erreur. Sur différents
exemples, nous montrons que cette borne d’erreur est plus précise que celles
déjà existantes. Nous présentons également une application de ce travail
aux études certifiées d’analyse de sensibilité.
Abstract: The reduced basis method is a powerful model reduction tech-
nique designed to speed up the computation of multiple numerical solu-
tions of parameterized partial differential equations (PDEs). We consider a
quantity of interest, which is a linear functional of the parameterized PDE
solution. Compared to the original quantity of interest, the quantity of in-
terest computed using the reduced model is tainted by a reduction error. We
187

188 Chapter 5.
present a new, efficiently and explicitly computable bound for this error, and
we show on different examples that this error bound is more precise than
the existing ones. We also present an application of our work to certified
sensitivity analysis studies.

GOAL-ORIENTED ERROR ESTIMATION 189
Introduction
A large number of mathematical models are based on partial differential
equations (PDEs). These models require input data (e.g., the physical fea-
tures of the considered system, the geometry of the domain, the external
forces...) which enter in the PDE as parameters. In many applications (for
instance, design optimization, data assimilation, or uncertainty quantifica-
tion), one has to numerically compute the solution of a parametrized partial
differential equation for a large number of values of the parameters. In such
a case, it is generally interesting, in terms of computation time, to perform
all possible parameter-independent computations in an offline phase, which
is done only once, and to call an online phase for each required value of
the parameter, during which the information gathered in the offline phase
can be used to speed-up the computation of an approximate solution of the
PDE, and, hence, to reduce the marginal (ie., per parameter) computation
cost.
The reduced basis method ([72]) is a way of specifying such offline and online
phases, which has been successfully applied to various well-known PDEs
([45, 61, 110]). One should note that, in the reduced basis (RB) method,
the online phase does not compute a solution which is strictly identical to the
numerical PDE solution, but an approximation of it, obtained by projecting
the original discretized equations onto a well-chosen basis. In the application
cases given above, however, one is not interested in the solution by itself, but
rather in a quantity of interest, or model output, which is a functional of this
solution. Taking this functional into account when performing the model
reduction leads to a so-called goal-oriented method. For instance, goal-
oriented basis choice procedures have been tried with success in the context
of dynamical systems in [115, 53], where the basis is chosen so as to contain
the modes that are relevant to accurately represent the output of interest,
and in a general context in [13], where the basis is chosen so as to minimize
the overall output error. All those papers showed that using an adapted
basis could lead to a great improvement of reduction error. This paper is
about goal-oriented error estimation, that is, the description of a rigorous
and computable error bound between the model output and the reduced one.
In [72], the output error bounds are computed by using an adjoint-based
method, which involves the application of the RB method to an auxiliary

190 Chapter 5.
(dual) problem in order to correct the output and to compute a goal-oriented
error bound. This method, however, has the drawback of doubling offline
and online computational times. In this paper, we propose a new goal-
oriented error bound which does not require a doubled online computation
time, and we show, in numerical examples, that this method, for a fixed
computational budget, outperforms the adjoint-based error bound.
This paper is organized as follows: in the first part, we describe our output
error bound and give its method of computation; in the second part, we see
how to apply our error bound to certified sensitivity analysis studies; finally,
the third and fourth parts present the numerical applications of our method.
5.1 Methodology
5.1.1 Preliminaries
We begin by setting up the context of the reduced basis method for affine-
parameterized linear partial differential equations presented in [72]. Our
reference problem is the following: given a parameter tuple µ ∈ P ⊂ Rp, find
u(µ), the solution (in a discretized functional space X of finite dimension)
of:
A(µ)u(µ) = f(µ), (5.1.1)
where A(µ) is a µ-dependent invertible square matrix of dimension dimX,
and f ∈ X; then compute the output:
s(µ) = s(u(µ)) (5.1.2)
where s : X → R is a linear form on X.
Problems such as (5.1.1) usually appear as discretizations of µ-parametrized
linear partial differential equations (PDE); the X space is typically a finite
element subspace (for instance, Lagrange P 1 finite elements), and A(µ) and
f are given by Galerkin projection of the weak form of the PDE onto a
suitable basis of X. The boundary conditions of the PDE are usually either
encoded in X or in A(µ).
The dimension of the finite element subspace dimX is generally fairly large,
so that the numerical computation of u(µ) from the inversion of A(µ) is
expensive. The reduced basis aims at speeding up “many queries”, that is,
the computation of u(µ) for all parameters µ ∈ P0 where P0 is a finite but

GOAL-ORIENTED ERROR ESTIMATION 191
“large” subset of the parameter set P. We suppose that A(µ) and f(µ)
admit the following so-called affine decomposition [72]:
∀µ ∈ P, A(µ) =Q∑
q=1
Θq(µ)Aq, f(µ) =Q′∑
q′=1
γq′(µ)f ′q (5.1.3)
where Q,Q′ ∈ N∗, Θq : P → R and γq′ : P → R (for q = 1, . . . , Q, q′ =
1, . . . , Q′) are smooth functions, Aq are square matrices of dimension dimX
and fq′ ∈ X.
We suppose that X is endowed with the standard Euclidean inner product:
〈u, v〉 = utv, with associated norm ‖u‖ =√〈u, u〉, and consider a subspace
X of X, and a matrix Z whose columns are the components of a basis of
X in a basis of X. This basis of X is called the reduced basis in the sequel.
We denote by u(µ) the components, in the reduced basis, of the solution of
the Galerkin projection of (5.1.1) onto X, that is, the solution of:
ZtAZu(µ) = Ztf(µ) (5.1.4)
(where, for any matrix M , M t is the transpose of M).
The many-query computation can then be split into two parts: the first
part (usually called the “offline phase”), which is done only once, begins by
finding a reduced subspace and its basis (this gives the Z matrix), then the
Q parameter-independent matrices:
Aq = ZtAqZ, q = 1, . . . , Q
and the Q′ vectors:
fq′ = Ztfq′ , q′ = 1, . . . , Q′
are computed and stored. In the second part (the “online phase”), we com-
pute, for each value of the parameter µ:
A(µ) =Q∑
q=1
Θq(µ)Aq, f(µ) =Q′∑
q′=1
γq(µ)fq′ (5.1.5)
and solve for u(µ) satisfying:
A(µ)u(µ) = f(µ). (5.1.6)
The key point is that the operations in (5.1.5) and (5.1.6) are performed on
vectors and matrices of size dim X, and that the complexity of these oper-
ations is totally independent from the dimension of the underlying “truth”

192 Chapter 5.
subspace X. In many cases, the smoothness of the map µ 7→ u(µ) allows
to find (in a constructive way, ie., compute) X so that dim X ≪ dimX
while keeping ‖u(µ)− Zu(µ)‖ small, hence enabling significant computa-
tional savings.
The output s(µ) can also be approximated from u(µ) using an efficient
offline-online procedure: let l ∈ X be so that:
s(u) = 〈l, u〉 ∀u ∈ X;
in the offline phase we compute and store:
l = Ztl
and in the online phase we take:
s(µ) =⟨l, u(µ)
⟩
as an approximation for s(µ).
Under additional coercivity hypothesis on A, the reduced basis method [72]
also provides an efficient offline-online procedure for computing εu(µ) so that
the approximation can be certified:
∀µ ∈ P ‖u(µ)− Zu(µ)‖ ≤ εu(µ).
The online procedure for the computation of ε(µ) is also of complexity in-
dependent of dimX.
This online error bound can in turn be used to provide a certification on the
output:
∀µ ∈ P |s(µ)− s(µ)| ≤ ‖l‖ εu(µ)︸ ︷︷ ︸=:εL(µ)
(5.1.7)
and this bound is clearly “optimal” amongst those depending on µ through
εu(µ) only. We call this bound the “Lipschitz” bound, and denote it by
εL(µ).
We here notice that [72] uses a different approximation of s(µ), which also
depends on the solution of the adjoint equation of (5.1.1) projected on a
suitably selected dual reduced basis. While this approximation has a better
rate of convergence, its computation roughly requires doubling of both offline
and online complexities as well as storage requirements. The aim of our
work is to bound |s(µ)− s(µ)| by a quantity which is smaller than the right-
hand side of (5.1.7) and can be computed using an efficient offline-online
procedure which does not require computation of εu(µ) nor any adjoint
problem solution during the online phase.

GOAL-ORIENTED ERROR ESTIMATION 193
5.1.2 Theoretical error bound
In this section, we give the expression of our output error bound. We begin
by some notations: let’s denote the residual by r(µ):
r(µ) = A(µ)Zu(µ)− f(µ) ∈ X,
and the adjoint problem solution (which will naturally appear in the proof
of Theorem 5) by w(µ):
w(µ) = A(µ)−tl.
Let, for any orthonormal basis Φ = φ1, . . . , φN of X, any N ∈ N∗, and
i = 1, . . . , N ,
Di(µ,Φ) = 〈w(µ), φi〉 .
We take a partition P1, . . . ,PK of the parameter space P, that is:
P = ∪Kk=1Pk and k 6= k′ → Pk ∩ Pk′ = ∅.
We set, for i = 1, . . . , N and k = 1, . . . ,K:
βmini,k (Φ) = minµ∈Pk
Di(µ), βmaxi,k (Φ) = maxµ∈Pk
Di(µ),
and:
βupi (µ,Φ) =
βmaxi,k(µ)(Φ) if 〈r(µ), φi〉 > 0
βmini,k(µ)(Φ) else,
βlowi (µ,Φ) =
βmini,k(µ)(Φ) if 〈r(µ), φi〉 > 0
βmaxi,k(µ)(Φ) else,
where k(µ) is the only k in 1, . . . ,K so that µ ∈ Pk. We also set:
T low1 (µ,N,Φ) =N∑
i=1
〈r(µ), φi〉 βlowi (µ,Φ), T up1 (µ,N,Φ) =N∑
i=1
〈r(µ), φi〉 βupi (µ,Φ),
T1(µ,N,Φ) = max(∣∣∣T low1 (µ,N,Φ)
∣∣∣ , |T up1 (µ,N,Φ)|).
Finally, we suppose that µ is a random variable on P and set:
T2(N,Φ) = Eµ
(∣∣∣∣∣∑
i>N
〈w(µ), φi〉 〈r(µ), φi〉∣∣∣∣∣
),
where we take, for convenience, φi = 0 for all i > N (so that the sum above
is in fact between N and N ).
We have the following theorem:

194 Chapter 5.
Theorem 5. For any α ∈]0; 1[ and for any N ∈ N∗, we have:
P
(|s(µ)− s(µ)| > T1(µ,N,Φ) +
T2(N,Φ)α
)≤ α.
Proof. We begin by noticing that:
A(µ)−1r(µ) = Zu(µ)− u(µ)
so that:
s(µ)− s(µ) = 〈l, Zu(µ)− u(µ)〉 =⟨l, A(µ)−1r(µ)
⟩= 〈w(µ), r(µ)〉
We expand the residual in the Φ basis:
r(µ) =∑
i≥1
〈r(µ), φi〉φi.
Hence:
s(µ)− s(µ) =∑
i≥1
⟨l, A(µ)−1φi
⟩〈r(µ), φi〉 =
∑
i≥1
〈w(µ), φi〉 〈r(µ), φi〉 .
(5.1.8)
We clearly have that for any N ∈ N∗,:
N∑
i=1
〈r(µ), φi〉βlowi (µ,Φ) ≤N∑
i=1
〈r(µ), φi〉 〈w(µ), φi〉 ≤N∑
i=1
〈r(µ), φi〉βupi (µ,Φ)
and this implies:∣∣∣∣∣N∑
i=1
〈r(µ), φi〉 〈w(µ), φi〉∣∣∣∣∣ ≤ T1(µ,N,Φ). (5.1.9)
So we have:
P
(|s(µ)− s(µ)| > T1(µ,N,Φ) +
T2(N,Φ)α
)
≤ P
(|s(µ)− s(µ)| >
∣∣∣∣∣N∑
i=1
〈r(µ), φi〉⟨A(µ)−tl, φi
⟩∣∣∣∣∣+T2(N,Φ)
α
)by (5.1.9)
= P
(|s(µ)− s(µ)| −
∣∣∣∣∣N∑
i=1
〈r(µ), φi〉⟨A(µ)−tl, φi
⟩∣∣∣∣∣ >T2(N,Φ)
α
)
≤ P
(∣∣∣∣∣∑
i>N
〈r(µ), φi〉⟨A(µ)−tl, φi
⟩∣∣∣∣∣ >T2(N,Φ)
α
)by (5.1.8)
≤ α thanks to Markov’s inequality.

GOAL-ORIENTED ERROR ESTIMATION 195
Choice of Φ. The error bound given in Theorem 5 above is valid for any
orthonormal basis Φ. For efficiency reasons, we would like to choose Φ so
that the parameter-independent part T2(N,Φ) is the smallest possible, for
a fixed truncation index N ∈ N∗.
To our knowledge, minimizing T2(N,Φ) over orthonormal bases of X is an
optimization problem for which no efficient algorithm exists. However, we
can minimize an upper bound of T2(N,Φ).
We define an auto-adjoint, positive operator G : X → X by:
∀φ ∈ X, Gφ =12
Eµ (〈r(µ), φ〉 r(µ) + 〈w(µ), φ〉w(µ)) . (5.1.10)
Let λ1 ≥ λ2 ≥ . . . λN ≥ 0 be the eigenvalues of G. Let, for i ∈ 1, 2 . . . ,N,φGi be an unit eigenvector of G associated with the ith eigenvalue, and ΦG =
φG1 , . . . , φGN .We can state that:
Theorem 6.
T2(N,ΦG) ≤∑
i>N
λ2i .
Proof. We have:
T2(N,Φ) ≤ 12
Eµ
(∑
i>N
〈u(µ), φi〉2 +∑
i>N
〈r(µ), φi〉2)
=: T sup2 (N,Φ) =∑
i>N
〈Gφi, φi〉
Using Theorem 1.1 of [112], we get that the minimum of T sup2 (N,Φ) is
attained for Φ = ΦG, and that minimum is∑
i>N
λ2i .
This theorem suggests to use Φ = ΦG, so as to control T2(N,Φ).
5.1.3 Computable error bound
In this Subsection, we present an implementable offline/online procedure for
the estimation of the upper bound for |s(µ)− s(µ)| presented in Theorem
5.
Estimation of φGi . We fix a truncation index N ∈ N∗, and we estimate
φGi i=1,...,N by using a modification of the method of snapshots used in
Proper Orthogonal Decomposition [96]. This estimation is performed dur-
ing the offline phase. We take a finite (large), subset of parameters Ξ ⊂ P,

196 Chapter 5.
randomly sampled from the distribution of the parameter, and we approxi-
mate the G operator by:
Gφ =1
2#Ξ
∑
µ∈Ξ
(〈r(µ), φ〉 r(µ) + 〈w(µ), φ〉w(µ))
In other words, G is a Monte-Carlo estimator of G. We take φGi i=1,...,N
as the unit eigenvectors associated with the N largest eigenvalues of G.
The operator G admits the following matrix representation:
G =1
2#Ξ
(WW t +RRt
),
where W (resp. R) is the matrix whose columns are the components of w(µ)
(resp. r(µ)) in a basis of X, for µ ∈ Ξ. These two matrices have #Ξ columns
and dimX lines, which means that the matrix above is dimX × dimX. In
general, we take #Ξ ≪ dimX, and so it is computationally advantageous to
notice that if φ is an eigenvector of G associated with a nonzero eigenvalue
λ, then:1λ
12#Ξ
((WW tφ+RRtφ)
)= φ,
so that φ ∈ Im W +Im R =: V. Hence, if V is the matrix of an orthonormal
basis of V, then there exists ψ so that φ = V ψ and we have:
12#Ξ
WW tφ+RRtφ = λφ =⇒[V t 1
2#Ξ
((WW t +RRt)
)V
]ψ = λψ.
As a consequence, it is sufficient to find the dominant eigenvectors ψG1 , . . . , ψGN
of the matrix Σ =1
2#ΞV t(WW t + RRt)V (of size 2Ξ), and to deduce φGi
from ψGi by the relation φGi = V ψGi . Besides, by writing Σ as:
Σ =1
2#Ξ
((V tW )(W tV ) + (V tR)(RtV )
),
it is possible to compute and store Σ without storing nor computing any
dense dimX × dimX matrix.
Computation of T1(µ,N,Φ). For i = 1, . . . , N and k = 1, . . . ,K, the
reals βmini,k (Φ) and βmaxi,k (Φ) can be computed during the offline phase, as
they are parameter-independent. They can be approximated by a simple
discrete minimization:
βmini,k (Φ) = minµ∈Ξ∩Pk
Di(µ,Φ), βmaxi,k (Φ) = maxµ∈Ξ∩Pk
Di(µ,Φ),

GOAL-ORIENTED ERROR ESTIMATION 197
or, thanks to the availability of the gradient of Di(µ) with respect to µ, by
a more elaborate quasi-Newton optimization such as L-BFGS [118].
We also compute the following parameter-independent, offline-computable
quantities:⟨fq′ , φGi
⟩,⟨Aqζj , φ
Gi
⟩(i = 1, . . . , N, j = 1, . . . , n, q = 1, . . . , Q, q′ = 1, . . . , Q′)
where ζ1, . . . , ζn is a basis of the reduced space X.
Now, let a parameter µ ∈ P be given, and let u1(µ), . . . , un(µ) be the com-
ponents of the reduced solution u(µ) in the reduced basis ζ1, . . . , ζn.By using the relation:
⟨r(µ), φGi
⟩=
Q∑
q=1
Θq(µ)n∑
j=1
uj(µ)⟨Aqζj, φ
Gi
⟩−
Q′∑
q′=1
γq′(µ)⟨fq′ , φGi
⟩,
the dot products between the residual and φGi can be computed in the online
phase, with a complexity of O(nQ+Q′) arithmetic operations, O(Q) evalua-
tions of Θ functions and O(Q′) evaluations γ functions, which is independent
of dimX. Then, βlowi and βupi can be straightforwardly deduced.
Estimation of T2(N,Φ), final error bound. We approximate T2(N,Φ)
by computing the following Monte-Carlo estimator:
T2(N,Φ) =1
2#Ξ
∑
µ∈Ξ
∣∣∣∣∣s(µ)− s(µ)−N∑
i=1
〈w(µ), φi〉 〈r(µ), φi〉∣∣∣∣∣ .
As this quantity is µ-independent, it can be computed once and for all during
the offline phase.
By using Theorem 5, we get that for ε(µ, α,N,Φ) = T1(µ,N,Φ)+T2(N,Φ)/α,
we have:
P (|s(µ)− s(µ)| ≥ ε(µ, α,N,Φ)) ≤ α,
so we may take, as estimated error bound with risk α,
ε(µ, α,N,Φ) = T1(µ,N,Φ) +T2(N,Φ)
α. (5.1.11)
5.2 Application to sensitivity analysis
Our error estimation method is applied in sensitivity analysis, so as to quan-
tify the error caused by the replacement of the original model output by the

198 Chapter 5.
reduced basis output during the Monte-Carlo estimation of the Sobol in-
dices. For the sake of self-completeness, we briefly present the aim and the
computation of these indices, and we refer to [88], [86] and [58] for details.
5.2.1 Definition of the Sobol indices
For i = 1, . . . , p, the ith Sobol index of a function of p variables s(µ1, . . . , µp)
is defined by:
Si =Var (E(s(µ1, . . . , µp)|µi))
Var (s(µ1, . . . , µp)), (5.2.1)
the variances and conditional expectation being taken with respect to a
postulated distribution of the (µ1, . . . , µp) input vector accounting for the
uncertainty on the inputs’ value. These indices are well defined as soon as
s ∈ L2(P) and that Var (s(µ1, . . . , µp)) 6= 0. When µ1, . . . , µp are (stochas-
tically) independent, the ith Sobol index can be interpreted as the fraction
of the variance of the output that is caused by the uncertainty on the ith
parameter µi. All the Sobol indices lie in [0; 1]; the closer to zero (resp.,
one) Si is, the less (resp., the more) importance µi’s uncertainty has on s’s
uncertainty.
5.2.2 Estimation of the Sobol indices
The conditional expectation and variances appearing in (5.2.1) are generally
not amenable to analytic computations. In those cases, one can estimate
Si by using a Monte-Carlo method which works as follows: from two M -
sized random, independent samples of inputs’ distribution, we compute 2M
appropriate evaluations sj and s′j of s, and estimate Si by:
Si =1M
∑Mj=1 sjs
′j −
(1M
∑Mj=1 sj
)(1M
∑Mj=1 s
′j
)
1M
∑Mj=1 s
2j −
(1M
∑Mj=1 sj
)2 . (5.2.2)
When M and/or the required time for the evaluation of the model output are
large, it is computationally advantageous to replace s by its surrogate model
s. By using (5.2.2) on s (hence with reduced model outputs sj and s′j),
one estimates the Sobol indices of the surrogate model rather than those of
the true model. We presented in [58], Sections 3.1 and 3.2, a method to
quantify the error made in the Sobol index estimation when replacing the
original model by the surrogate one, we presented in [58], Sections 3.1 and

GOAL-ORIENTED ERROR ESTIMATION 199
3.2, two estimators Smi,αas/2 and SMi,1−αas/2 relying on output error bound
samples εj and ε′j so that we have:
Theorem 7. If:
∀j = 1, . . . ,M, |sj − sj| ≤ εj and∣∣∣s′j − s′
j
∣∣∣ ≤ ε′j,
then we have (under certain hypotheses on the bootstrap method in use):
P(Si ∈ [Smi,αas/2; SMi,1−αas/2]
)≥ 1− αas.
In our case, the output error bound ε(µ) of Theorem 5 does not satisfy the
above hypothesis, but satisfies a weaker “probabilistic” statement. This is
the object of the following Corollary:
Corollary 1. If:
∀j = 1, . . . ,M, P (|sj − sj| ≥ εj) ≤ α and ∀j = 1, . . . ,M, P(∣∣∣s′
j − s′j
∣∣∣ ≥ ε′j
)≤ α,
then we have:
P(Si ∈ [Smi,αas/2; SMi,1−αas/2]
)≥ (1− αas)× (1− α)2M .
Proof. We easily have that:
P(Si ∈ [Smi,αas/2; SMi,1−αas/2]
)≥ P
(Si ∈ [Smi,αas/2; SMi,1−αas/2] | ∀j, |sj − sj| < ε(µ)
)
×P (∀j, |sj − sj| < ε(µ))
≥ (1− αas)× (1− α)2M .
5.3 Numerical results I: Diffusion equation
5.3.1 Benchmark problem
Our benchmark problem [85] is the following: given a parameter vector
µ = (µ1, µ2, µ3) ∈ P = [0.25, 0.5] × [2, 4] × [0.1, 0.2],
we consider the domain Ω = Ω(µ) below:

200 Chapter 5.
1
µ1
µ24
µ3
4
ΓN ΓD
Ω
Our continuous field variable ue = ue(µ) ∈ Xe satisfies:
∆ue = 0 in Ω
ue = 0 on ΓD∂ue∂n
= −1 on ΓN∂ue∂n
= 0 on ∂Ω \ (ΓN ∪ ΓD)
(5.3.1)
where
Xe = v ∈ H1(Ω) s.t. v|ΓD= 0,
∆ denotes the Laplace operator, and∂
∂nis the normal derivative with re-
spect to ∂Ω.
This continuous variable denotes the potential of a steady, incompressible
flow moving in a tube whose profile is given by Ω, with open ends on ΓN and
ΓD. The Neumann boundary condition on ΓN states that the fluid enters by
ΓN with unit speed, the condition on ∂Ω\(ΓN ∪ΓD) states that the velocity
field is tangential to the boundary of the tube; finally the Dirichlet condition
on ΓD guarantees well-posedness, as the potential field is determinated up
to a constant.
The problem (5.3.1) is equivalent to the following variational formulation:
find ue = ue(µ) ∈ Xe so that:∫
Ω∇ue · ∇v = −
∫
ΓN
v ∀v ∈ Xe.
This variational problem is well-posed, as the bilinear form (u, v) 7→∫
Ω∇u ·
∇v is coercive on Xe (see, for instance, [107], lemma A.14).

GOAL-ORIENTED ERROR ESTIMATION 201
The above variational problem is discretized using a finite triangulation Tof Ω and the associated P 1(T ) (see [20] or [80]) finite element subspace: find
u ∈ X so that ∫
Ω∇u · ∇v = −
∫
ΓN
v ∀v ∈ X,
where X = v ∈ P1(T ) s.t. v|ΓD= 0.
In our experiments, dimX = 525.
The affine decomposition of the matrix of the bilinear form in the left-hand
side of the above equation is obtained by using a piecewise affine mapping
from Ω(µ) to a reference domain Ω as explained in [79], page 11. The number
of terms in the obtained affine decompositions are Q = 9 and Q′ = 1.
Our scalar output of interest is taken to be:
s(µ) =
∫
ΓN
u(µ),
and P is endowed with the uniform distribution.
5.3.2 Results
We now present the numerical results obtained using our error estimation
procedure on the output of the model described above. We give a comparison
with the natural “Lipschitz” bound εL(µ) given in (5.1.7) and with the dual-
based error estimation method [72]. The bound εu(µ) on ‖Zu(µ)− u(µ)‖is computed using the procedure described in [72]. Note that we estimated
the “lower bound for the inf-sup parameter” “by inspection”, as explained
in [72], Section 3.3.2.
We also compare our goal-oriented error bound with the dual-based error
bound method described in [72] (Section 3.2). This method involves the com-
putation, during the online phase, of the reduced-basis solution of a linear,
output-dependent, adjoint problem. The solution of this adjoint problem
enables correction and estimation of the reduced output, at the expense of
a doubled online computation cost.
For the comparisons to be fair, one should compare the error bounds of same
online cost. It is widely assumed that there exists a constant C so that this
cost is C × 2(dim X)3 for the dual-based method, and C(dim X)3 for our
method, since dual-based method involves online inversion of two linear
systems of size dim X , and one system of the same size for our method.
Hence, the reported reduced basis sizes for the dual method are multiplied
by a factor 3√
2.

202 Chapter 5.
1e-05
0.0001
0.001
0.01
0.1
1
10
4 4.5 5 5.5 6 6.5 7
Reduced basis size
Mean error bound (Risk 0.0001)Mean error bound (Risk 0.01)Mean dual-based error bound
Mean Lipschitz bound
Figure 5.1: Comparison of the mean error bounds (for risk α ∈ 0.01, 0.0001),the mean Lipschitz bounds and the mean dual-based error bounds.
In all cases, the reduced bases are computed using POD with snapshot size
80. To compute G, we use a snapshot of size 200.
The partition used to split the P set is compound of K = 8 cubes whose
edges are parallel to the axes, and are chosen to contain (approximatively)
the same number of points of an input sample.
In Figure 5.1, we give, for various reduced bases and various target risk
levels α, the mean error bound on the output:
ε =1
#S
∑
µ∈Sε(µ, α,N,Φ)
where S is a random subset of P with size 200, ε(µ, α,N,Φ) is defined at
(5.1.11), and the truncation index N is taken equal to 15.
For all the graphs, an unique test sample S is kept so as to guarantee fair
comparisons.
Note that, due to limited numerical precision, the error bounds have been
truncated upwards to 9× 10⁻⁵.
We observe that our new, goal-oriented, output error bound largely outper-
forms the non-goal-oriented Lipschitz bound and is better than the goal-
oriented, dual-based error bound. Finally, we observe that the high con-

GOAL-ORIENTED ERROR ESTIMATION 203
Input parameter[Smi ; SMi
] [Smi,αas/2; SMi,1−αas/2
]
µ1 [0.530352;0.530933] [0.48132; 0.5791]
µ2 [0.451537;0.452099] [0.397962;0.51139]
µ3 [0.00300247;0.0036825] [-0.0575764;0.0729923]
Table 5.1: Results of the application of Section 5.2 to the estimation of the Sobol
indices of the output of our benchmark model.
centration of T2 around zero allows us to choose a very low target risk and
remain very competitive.
5.3.3 Application to sensitivity analysis
We estimate confidence intervals for the sensitivity indices of s(µ) by using
the method described in [58], together with the remarks in Section 2.2.
We take M = 1000 as sample size, B = 500 as number of bootstrap repli-
cations, dim X = 10 as reduced basis size, α = 0.00001 as output error
bound risk, and αas = 0.05 as Monte-Carlo risk. The level of the combined
confidence interval[Smi,αas/2; SMi,1−αas/2
]is then (1− αas)(1 − α)M > 0.93.
The results are gathered in Table 5.1. The spread between Smi and SMiaccounts for the metamodel-induced error in the estimation of the Sobol in-
dices. The remaining spread between Smi,αas/2 and SMi,1−αas/2 is the impact of
the sampling error (due to the replacement of the variances in the definition
of the Sobol indices by their empirical estimators). We see that, in this case,
the metamodel-induced error (certified by the use of our goal-oriented error
bound) is very small with regard to the sampling error.
5.4 Numerical results II: transport equation
We now apply our error bound on a non-homogeneous linear transport equa-
tion. Compared to the previous example, the considered PDE is of a different
kind (hyperbolic rather than elliptic).

204 Chapter 5.
5.4.1 Benchmark problem
In this problem, the continuous field ue = ue(x, t) is the solution of the
linear transport equation:
∂ue∂t
(x, t) + µ∂ue∂x
(x, t) = sin(x) exp(−x)
for all (x, t) ∈]0, 1[×]0, 1[, satisfying the initial condition:
ue(x, t = 0) = x(1− x) ∀x ∈ [0, 1],
and boundary condition:
ue(x = 0, t) = 0 ∀t ∈ [0, 1].
The parameter µ is chosen in P = [0.5, 1] and P is endowed with the uniform
measure.
We now choose a spatial discretization step ∆x > 0 and a time discretization
step ∆t > 0, and we introduce our discrete unknown u = (uni )i=0,...,Nx;n=0,...,Nt
where
Nx =1
∆x, and Nt =
1
∆t.
We note here that the considered PDE is hyperbolic and time-dependent,
and that we perform the reduction on the space-time unknown u, of dimen-
sion (Nx + 1) · (Nt + 1). This is different from reducing the space-discretized
equation at each time step.
The u vector satisfies the discretized initial-boundary conditions:
∀i, u0i = (i∆x)(1 − i∆x) (5.4.1)
∀n, un0 = 0 (5.4.2)
and the first-order upwind scheme implicit relation:
∀i, n un+1i − uni
∆t+ µ
un+1i+1 − un+1
i
∆x= sin(i∆x) exp(−i∆x). (5.4.3)
Let’s denote by B = B(µ) (resp. y) the matrix (resp. the vector) so that
(5.4.1),(5.4.2) and (5.4.3) are equivalent to:
Bu = y (5.4.4)
that is:
BTBu = BT y, (5.4.5)
so that equation (5.4.5) is (5.1.1) with A(µ) = BTB and f = BT y.
The output of interest is: s(µ) = uNtNx
. In the following, we take ∆t = 0.02
and ∆x = 0.05.

GOAL-ORIENTED ERROR ESTIMATION 205
1e-09
1e-08
1e-07
1e-06
1e-05
0.0001
0.001
0.01
0.1
1
2 3 4 5 6 7 8 9
Reduced basis size
mean error bounddual-based mean error bound
Figure 5.2: Comparison between the mean error bound (for risk α = 0.01) and
the mean dual-based error bound, for different reduced basis sizes.
5.4.2 Results
We took a very low risk level α = 0.01, a snapshot size of 70, N = 10
retained φGi vectors and K = 1. The results (Figure 5.2) show that, once
again, the error bound we propose in this paper outperforms the dual-based
error bound.
Conclusion
We have presented a new explicitly computable output error bound for the
reduced-basis method. We have shown, on two different practical examples,
that this bound is clearly better than the naive Lipschitz bound and that,
at the expense of a slight, controllable risk, the performances of this new
bound are better than the existing dual-based output error bound.

206 Chapitre 5.

Conclusion et perspectives
Ce travail de thèse, dont la particularité est de se situer à la frontière entre
le stochastique (chapitres 2, 3, et, en partie, le chapitre 5) et le déterministe
(chapitres 4 et 5), a permis de montrer qu’en intégrant une analyse de l’er-
reur de métamodèle dans l’estimation des indices de sensibilité de Sobol, il
était possible de profiter du gain en temps de calcul apporté par l’utilisation
d’un métamodèle, tout en bénéficiant d’une certification rigoureusement jus-
tifiée de l’estimation fournie. Cette certification peut se baser sur celle d’un
métamodèle construit par la méthode base réduite, que nous avons étendue
et améliorée sur deux aspects : par l’augmentation de ses performances dans
le cas de l’équation de Burgers, qui devrait ouvrir la voie à son utilisation
sur le modèle de Saint-Venant, ainsi que par la proposition d’une nouvelle
méthode de borne d’erreur sortie-dépendante, dont la précision est cruciale
en analyse de sensibilité. Nous pensons que les contributions présentées dans
cette thèse permettront l’analyse de sensibilité globale certifiée des modèles
numériques utilisés en océanographie.
Présentons maintenant quelques perspectives induites par ce travail.
Perspectives
Les trois premières perspectives que nous présentons sont des prolongements
des questions 1 à 4 que nous avons formulées en section 1.1. La dernière est
reliée à l’utilisation simultanée du modèle et du métamodèle pour l’analyse
de sensibilité. Ces quatre perspectives, toutes reliées à l’estimation certifiée
des indices de Sobol en un minimum de temps de calcul, peuvent être traitées
indépendamment l’une de l’autre.
207

208 Chapitre 5.
Estimation et efficacité pour l’estimation conjointe d’indices
Cette perspective prolonge notre réponse aux questions 1 (traitement de l’er-
reur Monte-Carlo dans l’estimation des indices de Sobol) et 2 (identification
d’un estimateur de variance optimale).
Au chapitre 3, nous avons donné des résultats de normalité asymptotique
univariée dans le cas de l’estimation d’un seul indice de Sobol du premier
ordre.
Il s’agit maintenant de considérer l’estimation conjointe de plusieurs indices
de Sobol, relativement à différentes variables d’entrée, et éventuellement
pour des ordres supérieurs à un. Ceci est motivé par le fait que les utilisateurs
de l’analyse de sensibilité estiment souvent tous les indices d’ordre un et tous
les indices totaux : (S1, . . . , Sp, ST1 , . . . , S
Tp ).
L’obtention d’une propriété de normalité asymptotique pour le vecteur d’es-
timateurs permettra la construction de régions de confiance asymptotiques
fines, ouvrant également la voie à des tests, asymptotiquement justifiés, de
non-significativité conjointe des indices de sensibilité.
De plus, l’estimateur asymptotiquement efficace dans ce contexte peut être
différent de celui identifié dans le cas univarié, car la nature des observations
(les évaluations du modèle) change. Par exemple, dans un modèle à p =
3 variables, l’estimation de (S1, S2) sur un plan Monte-Carlo pick-freeze
conduit à utiliser un échantillon de la loi de (Y, Y ′, Y ′′), où :
Y = f(X1,X2,X3), Y ′ = f(X1,X′2,X
′3), Y ′′ = f(X1,X2,X
′3),
et où (X ′1,X
′2,X
′3) est une copie indépendante de (X1,X2,X3).
Estimation d’erreur pour l’analyse de sensibilité basée sur les po-lynômes de chaos
Nous souhaitons élargir la question 3 (quantification de l’impact de l’utilisa-
tion d’un métamodèle sur l’estimation des indices de Sobol par Monte-Carlo)
en remplaçant l’estimateur de Monte-Carlo par une estimation basée sur la
décomposition en polynômes de chaos de la sortie.
L’utilisation de la décomposition en polynômes de chaos pour estimer les
indices de Sobol est motivée par le fait que cette méthode peut tirer partie
de la régularité de la sortie en fonction des entrées, afin d’atteindre une
vitesse de convergence supérieure à celle obtenue par Monte-Carlo.

GOAL-ORIENTED ERROR ESTIMATION 209
Réduction certifiée pour les équations de Saint-Venant
Cette perspective s’inscrit dans le cadre de la question 4 : développement
de métamodèles certifiés pour des modèles de géophysique.
Dans le chapitre 4, nous avons présenté une méthode efficace applicable à
l’équation de Burgers basée sur l’approximation base réduite, qui offre un
gain substantiel en temps de calcul tout en certifiant les approximations
faites pour permettre ces gains en temps de calcul. L’équation de Burgers
étant un « prototype » des équations de Saint-Venant (Shallow-Water) uti-
lisées en modélisation fluviale et océanographique, au sens où elle présente
les deux principales difficultés mathématiques de celui-ci (la non-linéarité
quadratique, et la dépendance en temps), cette méthode devrait très proba-
blement pouvoir s’adapter aux équations de Saint-Venant.
Nous avons déjà implémenté une version réduite, aux performances encou-
rageantes, d’un code Saint-Venant basé sur un schéma explicite en temps
et une méthode aux différences finies en espace. Cependant, les premiers
résultats laissent penser que la borne d’erreur certifiant ce code réduit sera
beaucoup trop conservative. L’utilisation d’un schéma implicite en temps
(comme pour le travail de réduction de l’équation de Burgers) devrait per-
mettre d’obtenir une borne exploitable.
Multifidélité pour l’estimation des indices de Sobol
Dans tout ce travail de thèse, nous avons effectué l’estimation des indices de
sensibilité en utilisant uniquement des évaluations du métamodèle, les appels
au « vrai » modèle étant effectués seulement lors de la phase de construction
du métamodèle (phase offline).
Une piste de travail, inspirée des quasi-variables de contrôle [34] et des mé-
thodes de Monte-Carlo multiniveau [39] serait d’utiliser également des ap-
pels au modèle, conjointement aux appels au métamodèle, durant la phase
d’analyse de sensibilité. La proportion d’appels au métamodèle et au vrai
modèle est à calibrer en fonction de leurs temps relatifs de calcul, et à la
précision du métamodèle.
Cette piste, qui a donné des résultats intéressants sur des exemples « jouets »,
pourrait encore se prolonger en utilisant une famille de plusieurs codes de
calcul, tous métamodèles d’un même métamodèle, mais ayant des précisions
et des demandes en temps de calcul différentes, afin d’améliorer encore l’es-

210 Chapitre 5.
timation des indices de Sobol.

Bibliographie
[1] GEB Archer, A. Saltelli, and IM Sobol. Sensitivity measures, ANOVA-
like techniques and the use of bootstrap. Journal of Statistical Com-
putation and Simulation, 58(2) :99–120, 1997.
[2] N. Aronszajn. Theory of reproducing kernels. Harvard University,
1951.
[3] ARPACK : Arnoldi Package. http://www.caam.rice.edu/software/ARPACK/.
[4] I. Babuska. The finite element method with penalty. Math. Comp,
27(122) :221–228, 1973.
[5] P. Barbillon. Méthodes d’interpolation à noyaux pour l’approximation
de fonctions type boîte noire coûteuses. PhD thesis, Université Paris
XI, 2010.
[6] J.W. Barrett and C.M. Elliott. Finite element approximation of the
Dirichlet problem using the boundary penalty method. Numerische
Mathematik, 49(4) :343–366, 1986.
[7] G. Blatman. Chaos polynomial creux et adaptatif pour la propagation
d’incertitudes et l’analyse de sensibilité. PhD thesis, Université Blaise
Pascal - Clermont-Ferrand II, 2009.
[8] E. Borgonovo. A new uncertainty importance measure. Reliability
Engineering & System Safety, 92(6) :771–784, 2007.
[9] E. Borgonovo, W. Castaings, and S. Tarantola. Moment independent
importance measures : New results and analytical test cases. Risk
Analysis, 31(3) :404–428, 2011.
211

212 Chapitre 5.
[10] G.E.P. Box and N.R. Draper. Empirical model-building and response
surfaces. John Wiley & Sons, 1987.
[11] S. Boyaval, C. Le Bris, Y. Maday, N.C. Nguyen, and A.T. Patera. A
reduced basis approach for variational problems with stochastic pa-
rameters : Application to heat conduction with variable robin coef-
ficient. Computer Methods in Applied Mechanics and Engineering,
198(41-44) :3187–3206, 2009.
[12] A. Buffa, Y. Maday, A.T. Patera, C. Prud’homme, and G. Turinici.
A priori convergence of the greedy algorithm for the parametrized
reduced basis. Mathematical Modelling and Numerical Analysis, 2009.
[13] T. Bui-Thanh, K. Willcox, O. Ghattas, and B. van Bloemen Waanders.
Goal-oriented, model-constrained optimization for reduction of large-
scale systems. Journal of Computational Physics, 224(2) :880–896,
2007.
[14] G.T. Buzzard and D. Xiu. Variance-based global sensitivity analysis
via sparse-grid interpolation and cubature. 2008.
[15] D.G. Cacuci. Sensitivity and Uncertainty Analysis, Theory. Chapman
& Hall/CRC, 2003.
[16] RH Cameron and WT Martin. The orthogonal development of non-
linear functionals in series of Fourier-Hermite functionals. Annals of
Mathematics, 48(2) :385–392, 1947.
[17] Rob Carnell. lhs : Latin Hypercube Samples, 2009. R package version
0.5.
[18] A. Chatterjee. An introduction to the proper orthogonal decomposi-
tion. Current Science, 78(7) :808–817, 2000.
[19] Y. Chen, J.S. Hesthaven, Y. Maday, and J. Rodríguez. Improved suc-
cessive constraint method based a posteriori error estimate for reduced
basis approximation of 2d maxwell’s problem. ESAIM : Mathematical
Modelling and Numerical Analysis, 43(06) :1099–1116, 2009.
[20] P.G. Ciarlet. The finite element method for elliptic problems. Society
for Industrial Mathematics, 2002.

BIBLIOGRAPHIE 213
[21] T. Crestaux et al. Polynomial chaos expansion for sensitivity analysis.
Reliability engineering & System Safety, 94(7) :1161–1172, 2009.
[22] RI Cukier, CM Fortuin, K.E. Shuler, AG Petschek, and JH. Schai-
bly. Study of the sensitivity of coupled reaction systems to uncertain-
ties in rate coefficients. i theory. The Journal of Chemical Physics,
59(8) :3873, 1973.
[23] RI Cukier, HB Levine, and KE Shuler. Nonlinear sensitivity analysis
of multiparameter model systems. Journal of computational physics,
26(1) :1–42, 1978.
[24] RI Cukier, JH Schaibly, and K.E. Shuler. Study of the sensitivity
of coupled reaction systems to uncertainties in rate coefficients. iii.
analysis of the approximations. The Journal of Chemical Physics,
63 :1140, 1975.
[25] S. Da Veiga and F. Gamboa. Efficient estimation of nonlinear condi-
tional functionals of a density. Submitted, 2008.
[26] S. Da Veiga and A. Marrel. Gaussian process modeling with inequa-
lity constraints, To appear in Annales de la Faculté des Sciences de
Toulouse.
[27] Garrett M. Dancik. mlegp : Maximum Likelihood Estimates of Gaus-
sian Processes, 2011. R package version 3.1.2.
[28] E. De Rocquigny, N. Devictor, and S. Tarantola. Uncertainty in in-
dustrial practice. Wiley Online Library, 2008.
[29] M.K. Deb, I.M. Babuka, and J.T. Oden. Solution of stochastic partial
differential equations using Galerkin finite element techniques. Com-
puter Methods in Applied Mechanics and Engineering, 190(48) :6359–
6372, 2001.
[30] N. Durrande, D. Ginsbourger, O. Roustant, and L. Carraro. Anova
kernels and rkhs of zero mean functions for model-based sensitivity
analysis. Journal of Multivariate Analysis, 2011.
[31] B. Efron. Nonparametric standard errors and confidence intervals.
Canadian Journal of Statistics, 9(2) :139–158, 1981.

214 Chapitre 5.
[32] B. Efron and R. Tibshirani. Bootstrap methods for standard errors,
confidence intervals, and other measures of statistical accuracy. Sta-
tistical science, 1(1) :54–75, 1986.
[33] B. Efron and R.J. Tibshirani. An introduction to the bootstrap. Chap-
man & Hall/CRC, 1993.
[34] M. Emsermann and B. Simon. Improving simulation efficiency with
quasi control variates. 2002.
[35] K. Fang, R. Li, and Agus Sudjianto. Design and modeling for computer
experiments. Computer science and data analysis series. Chapman &
Hall/CRC, 2006.
[36] J.C. Fort, T. Klein, A. Lagnoux, and B. Laurent. Estimation of the
sobol indices in a linear functional multidimensional model. 2012.
[37] K. Frank and S. Heinrich. Computing Discrepancies of Smolyak Qua-
drature Rules. Journal of Complexity, 12(4) :287–314, 1996.
[38] R.G. Ghanem and P.D. Spanos. Stochastic finite elements : a spectral
approach. Dover Pubns, 2003.
[39] M.B. Giles and B.J. Waterhouse. Multilevel quasi-monte carlo path
simulation. Advanced Financial Modelling, Radon Series on Compu-
tational and Applied Mathematics, pages 165–181, 2009.
[40] V. Girault and P.A. Raviart. Finite element methods for Navier-Stokes
equations, volume 5 of Springer Series in Computational Mathematics,
1986.
[41] GLPK : GNU Linear Programming Kit.
http://www.gnu.org/software/glpk/.
[42] GOMP : An OpenMP implementation for GCC.
http://gcc.gnu.org/projects/gomp/.
[43] M.A. Grepl. Reduced-Basis Approximation and A Posteriori Error
Estimation for Parabolic Partial Differential Equations. PhD thesis,
Massachusetts Institute of Technology, 2005.

BIBLIOGRAPHIE 215
[44] M.A. Grepl, Y. Maday, N.C. Nguyen, and A.T. Patera. Efficient
reduced-basis treatment of nonaffine and nonlinear partial differen-
tial equations. Mathematical Modelling and Numerical Analysis,
41(3) :575–605, 2007.
[45] M.A. Grepl and A.T. Patera. A posteriori error bounds for
reduced-basis approximations of parametrized parabolic partial dif-
ferential equations. Mathematical Modelling and Numerical Analysis,
39(1) :157–181, 2005.
[46] B. Haasdonk and M. Ohlberger. Reduced basis method for finite
volume approximations of parametrized linear evolution equations.
ESAIM : Mathematical Modelling and Numerical Analysis, 42(2) :277–
302, 2008.
[47] Tristen Hayfield and Jeffrey S. Racine. Nonparametric econometrics :
The np package. Journal of Statistical Software, 27(5), 2008.
[48] J.C. Helton, J.D. Johnson, C.J. Sallaberry, and C.B. Storlie. Survey
of sampling-based methods for uncertainty and sensitivity analysis.
Reliability Engineering & System Safety, 91(10-11) :1175–1209, 2006.
[49] T. Homma and A. Saltelli. Importance measures in global sensitivity
analysis of nonlinear models. Reliability Engineering & System Safety,
52(1) :1–17, 1996.
[50] E. Hopf. The partial differential equation ut + uux = µxx . Commu-
nications on Pure and Applied Mathematics, 3(3) :201–230, 1950.
[51] D.B.P. Huynh, G. Rozza, S. Sen, and A.T. Patera. A successive
constraint linear optimization method for lower bounds of parametric
coercivity and inf-sup stability constants. Comptes Rendus Mathema-
tique, 345(8) :473–478, 2007.
[52] I.A. Ibragimov and RZ Has’ Minskii. Statistical estimation–asymptotic
theory, volume 16. Springer, 1981.
[53] M. Ilak and C.W. Rowley. Modeling of transitional channel flow
using balanced proper orthogonal decomposition. Physics of Fluids,
20 :034103, 2008.

216 Chapitre 5.
[54] B. Iooss. Revue sur l’analyse de sensibilité globale de modèles numé-
riques. Journal de la Société Française de Statistique, 152(1) :3–25,
2011.
[55] T. Ishigami and T. Homma. An importance quantification technique
in uncertainty analysis for computer models. In First International
Symposium on Uncertainty Modeling and Analysis Proceedings, 1990.,
pages 398–403. IEEE, 1990.
[56] Breton J.-C. Processus gaussiens. 2006.
[57] A. Janon, M. Nodet, and C. Prieur. Certified reduced-
basis solutions of viscous Burgers equations parametri-
zed by initial and boundary values. Preprint available at
http://hal.inria.fr/inria-00524727/en, 2010, Accepted in
Mathematical modelling and Numerical Analysis.
[58] A. Janon, M. Nodet, and C. Prieur. Uncertainties assessment in global
sensitivity indices estimation from metamodels. Preprint available at
http://hal.inria.fr/inria-00567977, 2011, Accepted in Interna-
tional Journal for Uncertainty Quantification.
[59] N. Jung, B. Haasdonk, and D. Kroner. Reduced Basis Method for
quadratically nonlinear transport equations. International Journal of
Computing Science and Mathematics, 2(4) :334–353, 2009.
[60] J.P.C. Kleijnen. Design and analysis of simulation experiments. Sprin-
ger Publishing Company, Incorporated, 2007.
[61] D.J. Knezevic, N.C. Nguyen, and A.T. Patera. Reduced basis approxi-
mation and a posteriori error estimation for the parametrized unsteady
boussinesq equations. Mathematical Models and Methods in Applied
Sciences, 2010.
[62] D.J. Knezevic and A.T. Patera. A certified reduced basis method for
the Fokker-Planck equation of dilute polymeric fluids : FENE dumb-
bells in extensional flow. SIAM Journal on Scientific Computing,
32(2) :793–817, 2010.

BIBLIOGRAPHIE 217
[63] M. Lamboni, B. Iooss, A.L. Popelin, and F. Gamboa. Derivative-
based global sensitivity measures : general links with sobol’indices and
numerical tests. Arxiv preprint arXiv :1202.0943, 2012.
[64] B. Laurent. Efficient estimation of integral functionals of a density.
The Annals of Statistics, 24(2) :659–681, 1996.
[65] WR Madych and SA Nelson. Bounds on multivariate polynomials and
exponential error estimates for multiquadric interpolation. Journal of
Approximation Theory, 70(1) :94–114, 1992.
[66] A. Marrel, B. Iooss, B. Laurent, and O. Roustant. Calculations of sobol
indices for the gaussian process metamodel. Reliability Engineering &
System Safety, 94(3) :742–751, 2009.
[67] G. Matheron. Les variables régionalisées et leur estimation. Paris,
1965.
[68] H. Monod, C. Naud, and D. Makowski. Uncertainty and sensitivity
analysis for crop models. In D. Wallach, D. Makowski, and J. W. Jones,
editors, Working with Dynamic Crop Models : Evaluation, Analysis,
Parameterization, and Applications, chapter 4, pages 55–99. Elsevier,
2006.
[69] Vlad I. Morariu, Balaji Vasan Srinivasan, Vikas C. Raykar, Ramani
Duraiswami, and Larry S. Davis. Automatic online tuning for fast
gaussian summation. In Advances in Neural Information Processing
Systems (NIPS), 2008.
[70] Thomas Muehlenstaedt, Olivier Roustant, Laurent Carraro, and
Sonja Kuhnt. Data-driven Kriging models based on FANOVA-
decomposition, 2010. Preprint.
[71] N.C. Nguyen, G. Rozza, and A.T. Patera. Reduced basis approxima-
tion and a posteriori error estimation for the time-dependent viscous
Burgers’ equation. Calcolo, 46(3) :157–185, 2009.
[72] N.C. Nguyen, K. Veroy, and A.T. Patera. Certified real-time solution
of parametrized partial differential equations. Handbook of Materials
Modeling, pages 1523–1558, 2005.

218 Chapitre 5.
[73] J. Nocedal and S.J. Wright. Numerical optimization. Springer Verlag,
1999.
[74] A. Nouy et al. Generalized spectral decomposition for stochastic non-
linear problems. Journal of Computational Physics, 228(1) :202–235,
2009.
[75] J.E. Oakley and A. O’Hagan. Probabilistic sensitivity analysis of com-
plex models : a bayesian approach. Journal of the Royal Statistical
Society : Series B (Statistical Methodology), 66(3) :751–769, 2004.
[76] N.A. Pierce and M.B. Giles. Adjoint recovery of superconvergent func-
tionals from pde approximations. SIAM Review, pages 247–264, 2000.
[77] Gilles Pujol, Bertrand Iooss, and Alexandre Janon. sensitivity : Sen-
sitivity Analysis, 2012. R package version 1.5.
[78] A. Quarteroni, G. Rozza, and A. Manzoni. Certified reduced basis
approximation for parametrized partial differential equations and ap-
plications. Math. Industry, 2011.
[79] A. Quarteroni, G. Rozza, and A. Manzoni. Certified reduced basis
approximation for parametrized partial differential equations and ap-
plications. Journal of Mathematics in Industry, 1(1) :3, 2011.
[80] A.M. Quarteroni and A. Valli. Numerical approximation of partial
differential equations. Springer, 2008.
[81] R Core Team. R : A Language and Environment for Statistical Compu-
ting. R Foundation for Statistical Computing, Vienna, Austria, 2012.
ISBN 3-900051-07-0.
[82] R Development Core Team. R : A Language and Environment for Sta-
tistical Computing. R Foundation for Statistical Computing, Vienna,
Austria, 2011. ISBN 3-900051-07-0.
[83] J. Racine. An efficient cross-validation algorithm for window width
selection for nonparametric kernel regression. Communications in Sta-
tistics Simulation and Computation, 22 :1107–1107, 1993.
[84] D.V. Rovas, L. Machiels, and Y. Maday. Reduced-basis output bound
methods for parabolic problems. IMA journal of numerical analysis,
26(3) :423, 2006.

BIBLIOGRAPHIE 219
[85] G. Rozza and Patera A.T. Venturi : Potential flow.
http: // augustine. mit. edu/ workedproblems/rbMIT/ venturi/ ,
2008.
[86] A. Saltelli. Making best use of model evaluations to compute sensi-
tivity indices. Computer Physics Communications, 145(2) :280–297,
2002.
[87] A. Saltelli. Sensitivity analysis : an introduction (tutorial), 2004.
[88] A. Saltelli, K. Chan, and E.M. Scott. Sensitivity analysis. Wiley :
New York, 2000.
[89] A. Saltelli, M. Ratto, T. Andres, F. Campolongo, J. Cariboni, D. Ga-
telli, M. Saisana, and S. Tarantola. Global sensitivity analysis : the
primer. Wiley Online Library, 2008.
[90] A. Saltelli, S. Tarantola, and K.P.S. Chan. A quantitative model-
independent method for global sensitivity analysis of model output.
Technometrics, pages 39–56, 1999.
[91] A. Saltelli, S. Tarantola, Campolongo F., and Ratto M. Sensitivity
analysis in practice : a guide to assessing scientific models, 2004.
[92] T. J. Santner, B. Williams, and W. Notz. The Design and Analysis of
Computer Experiments. Springer-Verlag, 2003.
[93] T.J. Santner, B.J. Williams, and W. Notz. The design and analysis of
computer experiments. Springer Verlag, 2003.
[94] R. Schaback. Mathematical results concerning kernel techniques. In
Prep. 13th IFAC Symposium on System Identification, Rotterdam,
pages 1814–1819. Citeseer, 2003.
[95] M. Scheuerer, R. Schaback, and M. Schlather. In-
terpolation of spatial data – a stochastic or a de-
terministic problem ? Preprint, Universität Göttingen.
http: // num. math. uni-goettingen.de/ schaback/ research/ papers/ IoSD. pdf ,
2011.
[96] L. Sirovich. Turbulence and the dynamics of coherent structures. part
i-ii. Quarterly of applied mathematics, 45(3) :561–590, 1987.

220 Chapitre 5.
[97] I. M. Sobol. Sensitivity estimates for nonlinear mathematical models.
Math. Modeling Comput. Experiment, 1(4) :407–414 (1995), 1993.
[98] I.M. Sobol. Global sensitivity indices for nonlinear mathematical mo-
dels and their Monte Carlo estimates. Mathematics and Computers in
Simulation, 55(1-3) :271–280, 2001.
[99] IM Sobol and S. Kucherenko. Derivative based global sensitivity mea-
sures and their link with global sensitivity indices. Mathematics and
Computers in Simulation, 79(10) :3009–3017, 2009.
[100] C.B. Storlie, L.P. Swiler, J.C. Helton, and C.J. Sallaberry. Imple-
mentation and evaluation of nonparametric regression procedures for
sensitivity analysis of computationally demanding models. Reliability
Engineering & System Safety, 94(11) :1735–1763, 2009.
[101] J.C. Strikwerda. Finite difference schemes and partial differential
equations. Society for Industrial Mathematics, 2004.
[102] B. Sudret. Global sensitivity analysis using polynomial chaos expan-
sions. Reliability Engineering & System Safety, 93(7) :964–979, 2008.
[103] S. Tarantola, D. Gatelli, and TA Mara. Random balance designs for
the estimation of first order global sensitivity indices. Reliability En-
gineering & System Safety, 91(6) :717–727, 2006.
[104] J.Y. Tissot. Sur la décomposition ANOVA et l’estimation des indices
de Sobol’. Application à un modèle d’écosystème marin. PhD thesis,
Université de Grenoble, 2012.
[105] J.Y. Tissot and C. Prieur. A bias correction method for the estimation
of sensitivity indices based on random balance designs. Reliability
engineering and systems safety, 2010.
[106] J.Y. Tissot and C. Prieur. Variance-based sensitivity analysis using
harmonic analysis. Submitted, 2012.
[107] A. Toselli and O.B. Widlund. Domain decomposition methods–
algorithms and theory. Springer Verlag, 2005.
[108] K. Urban and A.T. Patera. A new error bound for reduced basis
approximation of parabolic partial differential equations. Comptes
Rendus Mathematique, 2012.

BIBLIOGRAPHIE 221
[109] A.W. Van der Vaart. Asymptotic statistics. Cambridge Univ Press,
2000.
[110] K. Veroy and A.T. Patera. Certified real-time solution of the pa-
rametrized steady incompressible Navier-Stokes equations : Rigorous
reduced-basis a posteriori error bounds. International Journal for Nu-
merical Methods in Fluids, 47(8-9) :773–788, 2005.
[111] K. Veroy, C. Prud’homme, and A.T. Patera. Reduced-basis approxi-
mation of the viscous Burgers equation : rigorous a posteriori error
bounds. Comptes Rendus Mathematique, 337(9) :619–624, 2003.
[112] S. Volkwein. Proper orthogonal decomposition and singular value de-
composition. Tech. report Karl-Franzens-Univ. Graz & Techn. Univ.
Graz, 1999.
[113] R. Von Mises. Mathematical theory of probability and statistics. Ma-
thematical Theory of Probability and Statistics, New York : Academic
Press, 1964, 1, 1964.
[114] H. Weyl. Mean motion. American Journal of Mathematics, 60(4) :889–
896, 1938.
[115] K. Willcox and J. Peraire. Balanced model reduction via the proper
orthogonal decomposition. AIAA journal, 40(11) :2323–2330, 2002.
[116] Curtis Storlie with contributions from Alexandre Janon. Comp-
ModSA : Sensitivity Analysis for Complex Computer Models, 2012.
R package version 1.3.1-1.
[117] C. Xu and G.Z. Gertner. Reliability of global sensitivity indices.
Journal of Statistical Computation and Simulation, 81(12) :1939–1969,
2011.
[118] C. Zhu, R.H. Bryd, and J. Nocedal. L-BFGS-B : Algorithm 778 :
L-BFGS-B, FORTRAN routines for large scale bound constrained op-
timization, 1997.