an interlanguage unification of musical timbre: bridging …josh/documents/2015/zacharakis... · an...
TRANSCRIPT

An Interlanguage Unification of Musical Timbre: Bridging Semantic, Perceptual, and AcousticDimensionsAuthor(s): Asterios Zacharakis, Konstantinos Pastiadis and Joshua D. ReissSource: Music Perception: An Interdisciplinary Journal, Vol. 32, No. 4 (April 2015), pp. 394-412Published by: University of California PressStable URL: http://www.jstor.org/stable/10.1525/mp.2015.32.4.394 .
Accessed: 13/05/2015 05:09
Your use of the JSTOR archive indicates your acceptance of the Terms & Conditions of Use, available at .http://www.jstor.org/page/info/about/policies/terms.jsp
.JSTOR is a not-for-profit service that helps scholars, researchers, and students discover, use, and build upon a wide range ofcontent in a trusted digital archive. We use information technology and tools to increase productivity and facilitate new formsof scholarship. For more information about JSTOR, please contact [email protected].
.
University of California Press is collaborating with JSTOR to digitize, preserve and extend access to MusicPerception: An Interdisciplinary Journal.
http://www.jstor.org
This content downloaded from 138.37.90.245 on Wed, 13 May 2015 05:09:01 AMAll use subject to JSTOR Terms and Conditions

AN INTER LANGUAGE UNIFICATION OF MUSI CAL TIMBRE:BRID G ING SEM ANT IC, PERCEPTUAL, AND ACOUSTIC DIMENS IONS
ASTE RIOS ZAC HAR AKIS
Queen Mary University of London, London,United Kingdom
KONS TAN TINOS PASTIADIS
Aristotle University of Thessaloniki, Thessaloniki, Greece
JO SHUA D. REIS S
Queen Mary University of London, London,United Kingdom
THE CURRENT STUDY EXPANDS OUR PREVIOUS
work on interlanguage musical timbre semantics byexamining the relationship between semantics and per-ception of timbre. Following Zacharakis, Pastiadis, andReiss (2014), a pairwise dissimilarity listening test involv-ing participants from two separate linguistic groups(Greek and English) was conducted. Subsequent multidi-mensional scaling analysis produced a 3D perceptual tim-bre space for each language. The comparison betweenperceptual spaces suggested that timbre perception isunaffected by native language. Additionally, comparisonsbetween semantic and perceptual spaces revealed sub-stantial similarities which suggest that verbal descriptionscan convey a considerable amount of perceptual informa-tion. The previously determined semantic labels ‘‘auditorytexture’’ and ‘‘luminance’’ featured the highest associa-tions with perceptual dimensions for both languages.‘‘Auditory mass’’ failed to show any strong correlations.Acoustic analysis identified energy distribution of har-monic partials, spectral detail, temporal/spectrotemporalcharacteristics and the fundamental frequency as themost salient acoustic correlates of perceptual dimensions.
Received: July 5, 2013, accepted June 21, 2014.
Key words: musical timbre perception, timbre spaces,multidimensional scaling, semantic description, acous-tic correlates
R ELATIONAL MEASURES OF TIMBRE RESEARCH
comprise two popular paradigms: dissimilarityrating and verbal description. The most popular
approach for the study of timbre perception has been
the application of multidimensional scaling (MDS)techniques to dissimilarity matrices obtained by pair-wise dissimilarity ratings of sound stimuli. MDS createsa geometrical configuration of the timbres under studycalled timbre space, which has been used for identifica-tion of the salient perceptual dimensions. Plomp (1970)was the first to make use of this approach which hassince been adopted by a plethora of researchers (e.g.,Caclin, McAdams, Smith, & Winsberg, 2005; Grey,1977; Iverson & Krumhansl, 1993; McAdams, Wins-berg, Donnadieu, Soete, & Krimphoff, 1995).
The verbal description of sound quality and its asso-ciation with the physical properties of sound has alsointrigued researchers for a long time. Helmholtz (1877/1954, p.118-119) has made one of the first systematicattempts to associate semantic attributes with acousticcharacteristics, and Lichte (1941) has broken down thetimbre of complex tones into three independent seman-tic components, namely, brightness, roughness, and full-ness. Efficient as MDS analysis may be for theidentification of timbral perceptual dimensions, it isincapable of applying labels to them. The labeling of thedimensions in such cases often comes as a result ofsome speculative interpretation. However, applying anaccurate semantic label to a perceptual dimension ishighly desirable for intuitive human computer interac-tion applications on sound processing and synthesis.
When the major objective is to investigate verbaldescription of musical timbre, then methods like thesemantic differential (e.g., von Bismarck, 1974; Lichte,1941) and its variant called verbal attribute magnitudeestimation (VAME; e.g., Kendall & Carterette, 1993a,1993b) are usually employed instead of MDS. Bothmethods require the rating of perceptual objects alongsemantic scales. Kendall and Carterette (1993a, 1993b)and Kendall, Carterette, and Hajda (1999) attempted toexploit a combination of pairwise dissimilarity and ver-bal attribute ratings for isolated and dyad timbres. Thetimbre spaces that resulted from these two approacheswere compared but their similarities were found to berather limited. Faure, McAdams, and Nosulenko (1996)have also tried to bridge semantics with perceptionthrough a pairwise dissimilarity test and additional freeverbal description of the perceptual differences and
Music Perception, VOLUME 32, ISSUE 4, PP. 394–412, ISSN 0730-7829, ELECTRONIC ISSN 1533-8312. © 2015 BY THE REGENTS OF THE UNIVERSIT Y OF CALIFORNIA ALL
RIGHTS RESERVED. PLEASE DIRECT ALL REQUESTS FOR PERMISSION TO PHOTOCOPY OR REPRODUC E ARTICLE CONTENT THROUGH THE UNIVERSIT Y OF CALIFORNIA PRESS’S
RIGHTS AND PERMISSIONS WEBSITE, HT TP://WWW.UCPRESSJOURNALS.COM/REPRINTINFO.ASP. DOI: 10.1525/MP.2015.32.4.394
394 Asterios Zacharakis, Konstantinos Pastiadis, & Joshua D. Reiss
This content downloaded from 138.37.90.245 on Wed, 13 May 2015 05:09:01 AMAll use subject to JSTOR Terms and Conditions

similarities. This study identified 22 semantic descrip-tors and associated them with perceptual dimensionsand acoustic characteristics. The majority of the adjec-tives correlated to more than one perceptual dimension.Therefore, the value of musical timbre description byverbal means remained an open question.
Other studies have also addressed this issue froma different viewpoint. From a linguistics perspective,Samoylenko, McAdams, and Nosulenko (1996) foundthat verbal description of perceived timbral dissimilari-ties corresponded well with numerical dissimilarity rat-ings. Therefore, a relationship between timbredescription and timbre dissimilarity was suggested, butas stated by the authors, a remaining question waswhether this relationship held up at the level of timbrespace dimensions. The subsequent work by Kendall et al.(1999) found only weak support for the relationshipsrequested by Samoylenko et al. (1996).
Furthermore, timbre semantics have recently beeninvestigated through a neuroscientific approach thatoffered new insight into the question of meaning con-veyed by timbre. Painter and Koelsch (2011) carried outtwo EEG experiments that demonstrated the ability ofmusical timbre to carry extramusical meaning. Morespecifically, it has been demonstrated that prior listen-ing to a sound can significantly influence the mean-ingful processing of a subsequent word or sound.Alluri and Toiviainen (2010) have also identified threesalient perceptual dimensions for polyphonic timbre,namely activity, brightness, and fullness. In a subse-quent study, Alluri et al. (2012) investigated the neuralunderpinnings of timbral and other features of a natu-ralistic musical stimulus. The acoustic parametersrepresenting the basic perceptual timbre dimensionswere identified and functional magnetic resonanceimaging (fMRI) was utilized to localize parts of thebrain that were responsible for processing each of theseseparate dimensions.
The above suggest that semantic description of musi-cal timbre can provide significant information regard-ing perceptual representation of sound. However, thishas not been adequately validated through comparisonof pairwise dissimilarity rating and verbal descriptionstudies. In a previous interlanguage study betweenEnglish and Greek speaking participants, we demon-strated robustness of musical timbre semantics for dif-ferent languages (Zacharakis et al., 2014). This workfocused merely on iconic musical meaning (seeKoelsch, 2011); that is, timbral descriptions associatingsounds with qualities of objects or qualities of abstractconcepts. The participants were asked to rate the tim-bre of 23 musical tones choosing from a pool of 30
provided adjectives according to the VAME methodol-ogy. These 30 semantic variables were analyzedthrough factor analysis, which identified three salientsemantic dimensions for each language. As is usuallythe case with the interpretation of such factors, thelabeling of these dimensions resulted from the effortto integrate the number of specific adjectives that werehighly loaded on each factor into one single concept.The respective dimensions of the two different lan-guages were characterized by common conceptualproperties and similar sound positioning. Thereforethe suggested labels were luminance, texture, and massfor both English and Greek. Luminance was adopted tounify concepts such as brilliance and depth, textureencapsulated the terms rough, harsh, rounded, warm,soft, and messy, and mass was used to represent con-cepts such as fullness, richness, lightness, andthickness.
The motivation behind the present study was toextend the work of Samoylenko et al. (1996) by inves-tigating the relationship between semantics of musicaltimbre and its underlying perceptual dimensions.Since, our previous work investigated timbral seman-tics between two different linguistic groups, one addi-tional point of interest would be to examine whetherpairwise dissimilarity ratings of timbre are affected bythe first language of the participants. To this end, sim-ilarly to our previous experimental set up, a pairwisedissimilarity listening test using the same sound stim-ulus set as in Zacharakis et al. (2014) was conducted toparticipants belonging to two separate linguistic popu-lations, Greek and English. The data were subsequentlyanalyzed through MDS analysis, resulting in two per-ceptual timbre spaces. This enabled the comparison offour timbre spaces, i.e., one semantic and one percep-tual for each of the two linguistic groups. Unlike otherrelated studies (e.g., Elliott, Hamilton, & Theunissen,2012; Faure et al., 1996) the participants in our workwere different for each of the four separate listeningtests.
The major objectives of this work are:
1) to examine the influence of native language ontimbre perception. A potentially strong relation-ship between the two perceptual spaces will indi-cate a minimal effect of language on dissimilarityratings of timbre and vice versa.
2) to assess the value of musical timbre description(i.e., the extent to which semantics can account forwhat is actually being perceived as measured bydissimilarity ratings) by comparing the perceptualwith the semantic spaces.
Unification of Musical Timbre 395
This content downloaded from 138.37.90.245 on Wed, 13 May 2015 05:09:01 AMAll use subject to JSTOR Terms and Conditions

Method
The perceptual timbre spaces resulted from MDS anal-yses that were separately applied to the pairwise dissim-ilarity ratings of the two linguistic groups (33 Greek and20 English speakers). The semantic spaces were the out-come of separate factor analyses applied to the data ofthe verbal attribute magnitude estimation (VAME) lis-tening tests undertaken by 41 English and 41 Greekspeakers (presented in Zacharakis et al., 2014).
In the pairwise dissimilarity listening test, partici-pants were asked to compare all the pairs among the24 sound stimuli using the free magnitude estimationmethod (Bensmaıa & Hollins, 2005; Cho, Kim, & Casali,2002; DeCarlo & Cross, 1990; Green et al., 1996; Marks,1980; Stevens, 1971; Yoshioka et al., 2007). Therefore,they rated the perceptual distances of 300 pairs (samepairs included) by freely typing in a number of theirchoice to represent dissimilarity of each pair (i.e., anunbounded scale) with 0 indicating a same pair. Thefree magnitude estimation method was favored overbounded magnitude estimation as the latter introducesthe following two issues during a rating procedure. Par-ticipants, not being in a position to anticipate upcomingdissimilarities, may never utilize the available range ofthe scale in case an even larger dissimilarity shows uplater in the test. On the other hand, they may prema-turely select the scale’s maximum when their maximumrating should normally be appointed to an upcomingpair, thus clipping their intended response. Details onconsiderations for MDS data preparation are presentedin subsequent paragraphs.
STIMULI AND APPARATUS
The VAME listening test consisted of 23 stimuli while oneadditional cello tone was included in the pairwise dissim-ilarity test. The 24 sounds within the initial set varied infundamental frequency (range of three octaves). The fol-lowing 15 instrument tones came from the McGill Uni-versity Master Samples (MUMS) library (Opolko &Wapnick, 2006): violin, sitar, trumpet, clarinet, piano, celloeach at A3 (220 Hz), Les Paul Gibson guitar, baritonesaxophone B flat each at A2 (110 Hz), double bass pizzicatoat A1 (55 Hz), oboe at A4 (440 Hz), Gibson guitar, pipeorgan, marimba, harpsichord each at G3 (196 Hz), andFrench horn at A#3 (233 Hz). A flute recording at A4 wasalso used along with a set of 8 synthesizer and electrome-chanical instrument sounds: Acid, Hammond, Moog,Rhodes piano each at A2, electric piano (rhodes), Wurlitzer,Farfisa each at A3, and Bowedpad at A4.
In contrast to the VAME test where the sounds variedin both duration (from 3 to 8 s) and pitch, these two
variables needed to be equalized as much as possible forthe pairwise dissimilarity test. To this end, only the first1.3 s of each sound were retained with an exponentialfade out applied to the last 113 ms (i.e., 5000 samples).Furthermore, the five sound samples at G3 and A#3were all pitch shifted to A3 so that the whole sound setconsisted of merely chroma class ‘A’ (ranging from A1to A4). This mild modification has not affected thetimbral quality of the sounds. This was highlighted byan extra pairwise dissimilarity listening test that wasperformed just on these five stimuli (marimba, harpsi-chord, pipe organ, French horn and Gibson guitar) andtheir pitch shifted versions. The MDS analysis presentedin Appendix A showed that a 2D space is adequate tomodel the relationships within this stimulus set and thatthe original and pitch shifted versions of each stimulusoccupied the same positions. Finally, Krumhansl andIverson (1992) have stated that even though pitch andtimbre are not perceived independently this does notimply that a comparison of timbres with different pitchesis impossible. Marozeau, de Cheveigne, McAdams, andWinsberg (2003) and Marozeau and de Cheveigne (2007)have also shown that listeners were able to ignore pitchdifferences and focus merely on timbre for a range of upto at least 1.5 octave.
The sound samples were loudness equalized in aninformal listening test within the research team. Onesound from the stimulus set was initially picked up asa reference and was set at a convenient listening level.Then the rest of the stimuli were equalized in loudnessaccording to this reference by the first author. Theequalized set was in turn evaluated by the rest of theauthors. The resulting RMS playback level was finallymeasured and found to be between 65 and 75 dB SPL(A-weighted, slow response) for all stimuli. All the par-ticipants found this level comfortable for all stimuli andreported that loudness was perceived as being constantacross stimuli in a subsequent questionnaire-basedevaluation.
The listening test was conducted under controlledconditions in acoustically isolated listening rooms.Sound stimuli were presented through the use of a lap-top computer, with an M-Audio (Fast Track Pro USB)external audio interface, and a pair of Sennheiser HD60ovation circumaural headphones.
PARTICIPANTS
Thirty-three native Greek speakers (age range ¼ 19-50,mean age¼ 24, 19 female) and 20 native English speak-ers (age range ¼ 21-40, mean age ¼ 30, 6 female) par-ticipated in the listening test. None of the participantsreported any hearing loss or absolute pitch and they had
396 Asterios Zacharakis, Konstantinos Pastiadis, & Joshua D. Reiss
This content downloaded from 138.37.90.245 on Wed, 13 May 2015 05:09:01 AMAll use subject to JSTOR Terms and Conditions

been practicing music for 13.2 (Greeks) and 16.1(English) years on average, ranging from 6 to 25 (Greek)and 8 to 30 (English). The absence of absolute pitchfrom the group of our participants was a prerequisiteas such a condition could affect the results due to pitchvariation within the stimulus set. The Greek-speakingparticipants were students in the Department of MusicStudies of the Aristotle University of Thessaloniki andthe English-speaking participants were research stu-dents from the Centre for Digital Music at Queen MaryUniversity of London.
PROCEDURE
Listeners became familiar with the timbral range of theexperiment during an initial presentation of the stimu-lus set (random order). This was followed by a brieftraining stage where listeners rated five selected pairsof stimuli. For the main part of the experiment partici-pants were allowed to listen to each pair of sounds asmany times as needed prior to submitting their rating.The pairs were presented in random order and listenerswere advised to base their ratings merely on timbraldifferences ignoring differences in pitch and to retaina consistent rating strategy throughout the experiment.Participants were prompted to take one break at thecompletion of the first third and a second one at thecompletion of the second third of the overall experi-ment. They were also offered the option to withdrawat any point. In total, the listening test sessions, includ-ing instructions and breaks, lasted around one hour formost of the participants.
NON-METRIC MDS
Multidimensional scaling (MDS) is a series of data anal-ysis techniques that are used to transform distance matri-ces into N-dimensional spatial configurations of theobjects under study. MDS originates from psychometricsand was developed to enable the interpretation of people’spairwise dissimilarity judgments over a set of perceptualobjects (Kruskal, 1964a; Shepard, 1962a). It is particularlypopular in timbre perception research as the spatial rep-resentation of a group of sound objects enables the inves-tigation of the underlying perceptual dimensions.
Figure 1 shows the ratio of maximum-to-mean ratingfor all the participants in the two groups. The maximumratio (appearing in the English group) is on the orderof 3. This is not deemed an outlying value and there-fore no participant was discarded at this point. In orderto accurately profile each participant’s contribution to theMDS solution we incorporated the weighted individualdifferences scaling (INDSCAL) algorithm. INDSCALcomputes weights that represent the importance attrib-uted to each perceptual dimension by each participantand then uses these weights to reconstruct an ‘‘average’’perceptual space. However, since there was variation ofthe mean among participants, we have chosen to analyzethe dissimilarities using a non-metric MDS approach(Kruskal, 1964b; Shepard, 1962b) as offered by the SPSSPROXSCAL (proximity scaling) algorithm (Meulman &Heiser, 2008). PROXSCAL applies an ordinal (rankorder) transformation to the raw dissimilarities withineach participant responses. Additionally, the non-metricMDS approach has been proven robust to the presence of
0 10 20 30
1.2
1.4
1.6
1.8
2
2.2
2.4
2.6
2.8
3
Participant number
max
/mea
n
Greek
0 5 10 15 20
1.2
1.4
1.6
1.8
2
2.2
2.4
2.6
2.8
3
Participant number
max
/mea
n
English
FIGURE 1. Scatter plots of the maximum-to-mean ratios for the pairwise dissimilarity ratings of Greek (left) and English (right) participants.
Unification of Musical Timbre 397
This content downloaded from 138.37.90.245 on Wed, 13 May 2015 05:09:01 AMAll use subject to JSTOR Terms and Conditions

monotonic transformations or random error in the data(Shepard, 1966; Young, 1970).
Analysis and Results
The main objective of this study was to examine theinfluence of language on musical timbre and identifypotential relations between semantics and perception.The block diagram in Figure 2 presents the schema ofour investigation, namely the two perceptual spaces(English and Greek MDS spaces), the two semanticspaces (English and Greek semantic spaces as identifiedthrough factor analysis in Zacharakis et al., 2014), andtheir mutual relationships. These relationships arelabeled as XrXr using the language initials (X ¼ G forGreek and X¼ E for English) and a referral according tothe nature of each space (r ¼ p for perceptual vs. r ¼ sfor semantic). As shown in Figure 2, both heterologousintralanguage (i.e., EpEs and GpGs) and heterologousinterlanguage (i.e., EpGs and GpEs) relations are exam-ined. This is because only after comparing the two casescan we reach a solid conclusion regarding the effect oflanguage. This section is structured in three subsections.The first examines configurational similarity betweenthe timbre spaces under study while the second inves-tigates relationships at the dimension level. Finally, thethird subsection looks at the acoustic correlates of theperceptual dimensions.
Before proceeding to the main body of the analysis weexamined the internal consistency of the responseswithin each linguistic group. Cronbach’s alpha was .96among Greek and .94 among English participants indi-cating high interparticipant reliability. This was alsosupported by the very similar weights attributed by eachparticipant to each of the MDS dimensions as shown inFigure 3. As weights signify the importance attributed toeach dimension by each subject, their tight clusteringacross all three facets of dimensions implies that judg-ments were based on similar criteria among partici-pants. Additionally, the concentration of weights inthe center of each diagram indicates that all three per-ceptual dimensions are of equivalent importance.
In the main body of the analysis, the dissimilarity rat-ings within each linguistic group were analyzed throughnon-metric (ordinal) MDS with dimension weighting(INDSCAL within SPSS PROXSCAL algorithm). Table 1shows two measures-of-fit (S-Stress1 and D.A.F.2) along
with their improvement for each added dimension. Theoptimal dimensionality was deemed to be three as theimprovement of the measures-of-fit from a 3D to a 4Dspace solution was minimal for both groups. All MDSsolutions attained stress values lower than the expectedvalues for random data (Spence, 1979). Both measures-of-fit for the non-metric approach were better than thoseof the metric approach for the same dimensionality.
CONFIGURATIONAL SIMILARITY BETWEEN TIMBRE SPACES
In this section the relationships between the semanticand/or perceptual spaces were investigated in terms oftheir configurational similarity, wherein the examinedsounds represented the objects of the configurations.3
The configurational similarity reflects the similarityof the solid shapes defined by the swarms of objectswithin the spaces. Any global form of similaritybetween spaces should also take into account the ori-entation of the swarms relative to the axes and thescales of the spaces.
An orthogonal Procrustes transformation (i.e., onlyallowing combinations of uniform scaling, translationand rotation) (Borg & Groenen, 2005; Schonemann &Carroll, 1970) was applied within each semantic-to-perceptual comparison.4 The semantic space configura-tion was always the one transformed so that it best fitted
FIGURE 2. Investigation schema consisting of Greek and English
semantic and perceptual spaces and their mutual relationships. The
labeling is according to language and nature of the space (e.g., Gs
stands for Greek semantic, Ep for English perceptual, etc.). The dotted
line combining the semantic spaces signifies a relationship that was
mainly examined in our previous work. FA and MDS denote semantic
space configuration that are driven by Factor Analysis and
Multidimensional Scaling, respectively.
1 S-Stress is a measure of misfit. The lower the value (to a minimum of0) the better the fit.
2 D.A.F.: Dispersion Accounted For is a measure of fit. The higher thevalue (to a maximum of 1) the better the fit.
3 The extra cello tone was removed from the perceptual spaces toenable direct comparison with the semantic spaces.
4 The oblique coordinates of the semantic spaces were changed into anequivalent orthogonal system.
398 Asterios Zacharakis, Konstantinos Pastiadis, & Joshua D. Reiss
This content downloaded from 138.37.90.245 on Wed, 13 May 2015 05:09:01 AMAll use subject to JSTOR Terms and Conditions

the perceptual space, which was unaltered in all cases.No transformation was applied to the perceptual spaceseven for their direct comparison in order to preserve theperceptually meaningful configuration produced by theINDSCAL algorithm.
Subsequently, configurational similarity betweenspaces was judged by two indices computed from thedistances between the objects; Tucker’s congruencecoefficient (Borg & Groenen, 2005; Tucker, 1951) andthe m2 statistic for Procrustes analysis (Gower, 1971,1975; Gower & Dijksterhuis, 2004). The m2 resemblesa measure of alienation 1-r2 (where r is the correlationcoefficient between the sequences of within-space dis-tances of the two examined spaces) (Peres-Neto & Jack-son, 2001). The exploitation of both indices wasmandated by the fact that no single measure of config-urational similarity is globally adequate to depict the
relationship between two examined spaces (Borg &Groenen, 2005; Borg & Leutner, 1985).
As a guideline, for the congruence coefficient, valueslarger than .92 are considered good/fair, and valueslarger than .95 practically show equality between con-figurations (Lorenzo-Seva & ten Berge, 2006). Signifi-cance of the congruence coefficient between the twoconfigurations was tested using a bootstrap analysismethod (Monte Carlo estimate of its expected valueunder chance conditions) (Cutzu & Edelman, 1996;Efron & Tibshirani, 1993). For the m2 statistic, values< .75 (based on recommendations for r2> .25 asdescribed in Ellis, 2010) signify a large effect size. Sta-tistical significance is tested using an approach thatemploys a large number of random permutations of theoriginal data and is suited to Procrustes analysis underthe name of PROcrustean randomization TEST
TABLE 1. Measures-of-fit and Their Improvement for Different MDS Dimensionalities for the Greek and English Groups.
Greek English
Dimensionality S-Stress Improv. D.A.F. Improv. S-Stress Improv. D.A.F. Improv.
1D .34 – .81 – .36 – .81 –2D .19 .15 .92 .11 .19 .17 .92 .113D .12 .07 .95 .03 .13 .06 .95 .034D .10 .02 .97 .02 .10 .03 .97 .02
0.2 0.3 0.4 0.5 0.6
0.25
0.3
0.35
0.4
0.45
0.5
0.55
Greek
0.2 0.3 0.4 0.5 0.6
0.25
0.3
0.35
0.4
0.45
0.5
0.55
English
FIGURE 3. Weights attributed to each dimension by the participants of the two linguistic groups as identified by the INDSCAL algorithm. x-axis and
y-axis represent different dimensions for each type of marker. �: weights between 1st (x-axis) and 2nd (y-axis) dimension, c : weights between 1st
(x-axis) and 3rd (y-axis) dimension, þ: weights between 2nd (x-axis) and 3rd (y-axis) dimension. The tight clustering of all weights around the diagonal
for both languages indicates that participants not only based their judgments on similar criteria but they also attributed equal importance to each of
the perceptual dimensions regardless of language.
Unification of Musical Timbre 399
This content downloaded from 138.37.90.245 on Wed, 13 May 2015 05:09:01 AMAll use subject to JSTOR Terms and Conditions

(PROTEST; Jackson, 1995; Legendre & Legendre, 1998;Peres-Neto, 2000; Peres-Neto & Jackson, 2001). Thestatistical significance of r2 (derived from m2) has onlybeen investigated in a small number of studies(Andrews & Inglehart, 1978; Borg & Leutner, 1985;Langeheine, 1982), which showed that critical values forr2 varied with dimensionality of configurations and withnumber of objects.
Table 2 summarizes the values of the congruencecoefficient and m2 for the relationships of configura-tions between all examined spaces. The configurationsof the English and Greek perceptual (MDS) spaces showa high degree of similarity (congruence coefficient ¼.98, well above the statistical significance of p¼ .05, andm2 highly significant). The similarity between thesemantic configurations of the two languages (GsEs) islower than the similarity of the perceptual spaces, butnevertheless remains fair (congruence coefficient ¼ .93,m2 ¼ 0.41, both highly significant). In general, thehomologous configurations between the two languagesshow the highest degree of similarity among all exam-ined intralinguistic and interlinguistic relationships. Allheterologous configurations also remain fair with minordifferences between intralinguistic and interlinguisticrelationships.
The strong configurational similarity that was quan-tified by the similarity metrics is also evident by visualinspection of Figure 4. Detailed commenting on thedimensions of timbre spaces will follow in the nextsubsection.
RELATIONSHIPS AT THE DIMENSION LEVEL - SEMANTIC
INTERPRETATION OF PERCEPTUAL DIMENSIONS
In this section we investigate one-to-one comparisonsbetween semantic and perceptual dimensions. Thisserves the purpose of semantic interpretation of theunlabeled MDS dimensions. Orthogonal Procrustestransformations may introduce data transformations(e.g., rotation of configurations), which result in alteredinterpretation of semantic dimensions and are alsoinadmissible if applied to MDS solutions with dimen-sion weighting. Thus, the investigation of relationshipsbetween spaces (and not merely configurations) wasbased on the original dimensions and unrotated data.
Table 3 presents the Pearson correlation of dimensionsbetween the perceptual (MDS) spaces of the two lan-guages. As the strong one by one correlations suggest,there is not a mere configurational similarity (based onthe congruence coefficient and the m2) but an almostcomplete coincidence of the two perceptual spaces.
Table 4 presents the Pearson correlation of dimen-sions between the semantic spaces of the two languages.
Such relations have also been reported in detail in a pre-vious work (Zacharakis et al., 2014) where we investi-gated timbre semantics and their relationships betweenGreek and English. There appear statistically significantand strong intercorrelations between dimensions of thesemantic spaces.5 The strongest correlation is observedbetween the dimensions labeled as texture. The lumi-nance dimensions are also strongly correlated, while the
TABLE 4. Correlation Matrix (Pearson’s r) Between the English andGreek Semantic Dimensions (from Data Presented in Zacharakiset al., 2014).
Greek semanticdimensions
English semantic dimensions
Luminance Texture Mass
Luminance �.77** .08 .79**Texture �.54** �.85** �.07Mass �.23 .04 .43*
**Correlation is significant at the .01 level (2-tailed).*Correlation is significant at the .05 level (2-tailed).
TABLE 3. Correlation Matrix (Pearson’s r) Between the English andGreek Perceptual Dimensions.
Perceptualdimensions 1st English 2nd English 3rd English
1st Greek .89** �.01 .042nd Greek �.18 .95** .203rd Greek �.12 �.04 .85**
**Correlation is significant at the .01 level (2-tailed).*Correlation is significant at the .05 level (2-tailed).
TABLE 2. Congruence Coefficients, m2 and r for the MutualRelationships Across Timbre Spaces as Described in the Schema ofFigure 2.
RelationshipCongruence coefficient(expected value, SD)* m2 r
GsGp .93 (.85, .02) .55** .67EsEp .92 (.83, .02) .63** .60GsEp .93 (.84, .02) .61** .63EsGp .94 (.83, .02) .46** .73GpEp .98 (.87, .01) .17** .91GsEs .93 (.84, .02) .41** .77
*expected chance value, estimated by bootstrap with 10000 runs.**p ¼ .001, PROTEST significance testing.
5 The reported negative correlations come from the factor analysissolution, which in some cases yielded reversed axes between the twolanguages without, however, altering their interpretation. For moredetails please see Table 2 from Zacharakis et al. (2014).
400 Asterios Zacharakis, Konstantinos Pastiadis, & Joshua D. Reiss
This content downloaded from 138.37.90.245 on Wed, 13 May 2015 05:09:01 AMAll use subject to JSTOR Terms and Conditions

respective mass dimensions are only mildly related.However, there is a strong intercorrelation between theGreek luminance and English mass dimensions anda less strong effect between the Greek texture andEnglish luminance. Although such findings support aninherent interlinguistic correspondence and a commonunderstanding of specific notions in timbre semantics(Zacharakis et al., 2014), they ultimately confirm justa fair configurational similarity between the two seman-tic spaces, in comparison to the strong similaritybetween perceptual spaces as demonstrated above.
Table 5 presents the relationships between all heter-ologous (semantic vs. perceptual) pairs of spaces. Themost prominent relationships among them are com-mented below. Greek luminance is related to the thirdGreek and English perceptual dimensions. Greek tex-ture is mostly related to the first Greek and Englishperceptual dimensions, and, to a lesser degree, to allother perceptual dimensions. English luminance andtexture also demonstrate similar relationships. However,the Greek mass presents no important association withany perceptual dimension, while the English mass isonly correlated to the third Greek perceptual dimen-sion. Thus, in general, the mass related semantic dimen-sions do not seem to have a clear (if any) perceptualcounterpart. These findings regarding the strength ofrelationships between semantic and perceptual dimen-sions also confirm the just fair configurational similar-ities between heterologous timbre spaces that werereported in the previous subsection.
Multiple regression was subsequently performed inorder to quantify the predictive potential of semanticsupon perceptual dimensions, and thus provide a meansfor their ‘‘semantic labeling.’’ The modeling was intra-language. That is, only combinations of same-languagesemantic and perceptual dimensions (GsGp and EsEp)were considered. The regression models with perceptualdimensions as dependent variables and semantic
dimensions as predictors were constructed from subsetsof predictors entering the regression equation at once(forced entry; Field, 2013). To facilitate substantiveregression modeling, for each prediction equation (i.e.,perceptual dimension as the dependent variable) theselected model was constructed from that subset of pre-dictors (among all possible subsets) according to a tripleheuristic criterion: the model should maintain a cor-rected Akaike Information Criterion (AICc; Hurvich& Tsai 1989) value up to 20% above the minimum, anadjusted R2 (Field, 2013; Rao & Wu, 2001) value downto 20% below the maximum, and should also containthose semantic dimensions that showed statistically sig-nificant correlations with the predicted perceptualdimension. Both the AICc and the adjusted R2 metricsare based on optimization of regression accuracy andpenalization of model complexity. Well-fitted modelshave lower AICc values but higher adjusted R2 values.Tables 6 presents the results of the multiple regressionanalysis.
The accuracy of predictions is acceptable (criterion:adjusted R2 values >.25, again supporting the abovereported fair configurational similarities. The bestresults are obtained in the cases of the third Greek per-ceptual dimension (AICc ¼ -20.65 and adjusted R2 ¼.69) and the first English (AICc ¼ -13.73 and adjustedR2 ¼ .58). The least accurate fit was observed for thesecond perceptual dimension in both languages.
The regression models are in agreement with the cor-relations between dimensions, in terms of regressioncoefficient values and statistical significance. Luminanceis the best predictor for the third dimensions. The firstperceptual dimension in English is adequately modeledby texture which also affects the second dimension, butto a lesser extent. Although in Greek the contribution oftexture on the first perceptual dimension is much lesspronounced (texture also contributes to the second andthird Greek perceptual dimensions), we claim that the
TABLE 5. Pearson Correlation Coefficients Among Perceptual and Semantic Dimensions For the Two Languages.
Greek perceptual dimensions English perceptual dimensions
Semantic dimensions 1st 2nd 3rd 1st 2nd 3rd
Gre
ek Luminance .22 �.10 .74** .09 �.13 .58**Texture �.59** .54* .51* �.73** .42* .45**Mass �4e-3 �.33 .15 �.09 �.33 �.17
En
glis
h Luminance �.02 �.11 �.83** .23 �.03 �.60**Texture .67** �.56** �.38 .74** �.51* �.32Mass .47* �.21 .63** .31 �.18 .36
**Correlation is significant at the .01 level (2-tailed).*Correlation is significant at the .05 level (2-tailed).
Unification of Musical Timbre 401
This content downloaded from 138.37.90.245 on Wed, 13 May 2015 05:09:01 AMAll use subject to JSTOR Terms and Conditions

Greek first perceptual dimension may also reflect tex-ture. Had the Greek data been the only available, itmight not be acceptable to make such a claim. However,texture shows a clear association with the first Englishperceptual dimension, and the correlation between thefirst perceptual dimensions is very strong, r(22) ¼ .89,p < .01. Additionally, texture is the semantic dimensionfeaturing the highest interlanguage agreement (seeTable 4). Thus, within the spirit of a pursued unification,texture is proposed as the optimal interpretation of thefirst perceptual dimensions. Mass does not appear to bea valid predictor for any perceptual dimension. Conse-quently, the perceptual dimensions can be loosely attrib-uted the following semantic labeling: first perceptualdimension-texture, third perceptual dimension-lumi-nance. The second dimension in both languages cannotbe clearly ‘‘labeled’’ as it only relates mildly to texture.
Figure 4 shows the three 2D planes of the perceptual(MDS) spaces for both languages. The spatial config-urations of the sounds could be commented under theprism of semantic-to-perceptual relationships. The tex-ture related dimension (first) features the Moog andAcid synthesizers on the positive extreme (rough) andBowedpad with flute on the negative extreme (smooth).At the same time the influence of F0 on this dimensionis evident as the higher F0s within the set are generallypositioned on the negative end and F0 generallydecreases towards the positive end (with the exceptionof the double bass pizzicato). The luminance relateddimension (third) features double bass and Rhodespiano on the positive extreme (dull) and Farfisa, pipeorgan, harpsichord, and sitar on the negative extreme(brilliant). Nevertheless, the second perceptual dimen-sion, which was not strongly related to any semantic iden-tifier, appears to express the notions of ‘‘percussiveness’’ or‘‘transience’’ since impulsive sounds (e.g., marimba, piano,
etc.) mostly occupy the positive half-planes (along thesecond perceptual dimension) while continuant instru-ments mostly reside on the negative ones.
ACOUSTIC CORRELATES OF PERCEPTUAL DIMENSIONS
A large set of low-level features (see Table B1, AppendixB) was extracted from the experimental sound set as aninitial attempt to identify acoustic correlates for theperceptual dimensions obtained by MDS analysis. Iden-tically to Zacharakis et al. (2014), the selection of acous-tic features was based on the existing literature (e.g.,Peeters, 2004; Peeters, Giordano, Susini, Misdariis, &McAdams, 2011), and they were calculated using thespectral modeling synthesis (SMS) MATLAB platform(Amatriain, Bonada, Loscos, & Serra, 2002). The win-dow length applied was 4,096 samples (fS ¼ 44.1kHz)with an overlapping factor of 87.5%, the zero paddingfactor was 2, and 50 harmonic partials were extractedfor all sounds. A variation of some basic features wasalso extracted using the instantaneous specific loudnessof the ERB bands as calculated by Moore’s loudnessmodel (Moore, Glasberg, & Thomas, 1997) instead ofthe amplitude of the harmonics or the FFT bins. Finally,the mean, median, standard deviation, range, skewnessand kurtosis of each acoustic descriptor were addition-ally computed in an effort to capture elements of thetime-variant behavior of the sounds.
High multicollinearity within our acoustic features setwas addressed applying the same procedure as inZacharakis et al. (2014). The dimensionality of the fea-ture set was reduced by means of principal componentsanalysis (PCA) (see also Alluri & Toiviainen, 2010;Giordano, Rocchesso, & McAdams, 2010; Peeterset al., 2011). The Spearman coefficient correlationmatrix was initially inspected, and when strongly cor-related feature pairs [�(22)� .80] were identified, one of
TABLE 6. Multiple Regression Models Using Perceptual Dimensions as Dependent Variables and Semantic Dimensions of the Same Languageas Predictors (i.e., Greek Semantics Predict Greek Perception and English Semantics Predict English Perception).
Semantic Predictors
Perceptualdimensions
intercept Luminance Texture Mass
B S.E. b B S.E. b B S.E. b B S.E. b Adj.-R2 AIC
Gre
ek 1st 9e-3 .17 – .33 .18 .31 �.67* .18 �.63 – – – .39 �5.22nd .05 .17 – – – – .55* .18 .53 �.34 .18 �.33 .34 �4.63rd �.02 .12 – .71* .13 .68 .44* .13 .42 – – – .68 �20.65
En
glis
h 1st �.02 .12 – – – – .76* .15 .72 .28 .15 .26 .58 �13.732nd .06 .19 – – – – �.50* .19 �.49 �.15 .19 �.15 .20 �3.023rd �.02 .18 – �.63* .18 �.60 – – – – – – .33 �5.01
*Statistically significant at the .05 level (2-tailed)
402 Asterios Zacharakis, Konstantinos Pastiadis, & Joshua D. Reiss
This content downloaded from 138.37.90.245 on Wed, 13 May 2015 05:09:01 AMAll use subject to JSTOR Terms and Conditions

FIGURE 4. 2D planes of the perceptual (MDS) spaces for Greek (left) and (English). Black symbols: Continuant, white symbols: Impulsive, ~: Single
reed, !: Double reed, 3: Aerophone, ": Lip reed,�: Chordophone, ♦: Idiophone, «: Electrophone, &: Synthesizer. Abbreviations of instrument names,
Acid: Acid, Bow: Bowedpad, Cl: clarinet, dB: double bass pizzicato, ePi: electric piano (rhodes), Farf: Farfisa, Fl: flute, Gibs: Gibson guitar, Ham:
Hammond, Hn: French horn, Hp: Harpsichord, LesP: Les Paul Gibson guitar, Mar: marimba, Mg: Moog, Ob: oboe, Org: pipe organ, Pf: piano, Rhd:
Rhodes piano, Sax: saxophone, Sit: sitar, Tpt: trumpet, Vc: cello, Vn: violin, Wurl: Wurlitzer. The number next to each instrument represents its F0, 1
for 55 Hz, 2 for 110 Hz, 3 for 220 Hz and 4 for 440 Hz.
Unification of Musical Timbre 403
This content downloaded from 138.37.90.245 on Wed, 13 May 2015 05:09:01 AMAll use subject to JSTOR Terms and Conditions

them was discarded.6 We then rank ordered the featuresand applied PCA to the reduced data set. Inspection ofthe anti-image correlation matrix7 diagonal led to fur-ther removal of features whose individual Kaiser-Meyer-Olkin measure of sampling adequacy (KMO)was less than .50 so as to achieve an acceptable overallKMO. The final solution consisted of 4 components(KMO ¼ .64, Bartlett’s test of sphericity, p < .001) thatexplained 83.2% of the total variance. Table 7 shows theloadings of the features on the four components afterorthogonal varimax rotation. The components arelabeled based on the acoustic correlates that are highlyloaded on each one. As shown in Table 7 and discussedbelow, the groupings of the acoustic features withinprincipal components afford a qualitative perspectivethat is in close relevance with the existing literature.This organization of acoustic features facilitates a cohe-sive representation of the physical ground of timbre andits relationship to semantics and perception.
Features like the normalized harmonic spectral centroid(SC_norm), tristimulus 3 (T3) (Pollard & Jansson, 1982),and SC_loud_cor (corrected version of the spectral cen-troid calculated from Moore’s specific loudness in orderto remove the influence of F0; for an example, see Mar-ozeau & de Cheveigne, 2007) all represent spectral struc-ture (i.e., distribution of energy among harmonicpartials) rather than spectral content (i.e., concentrationof energy on frequency bands). Therefore, the first com-ponent is labeled: energy distribution of harmonic partials(EDHP). The second component is represented by bothodd even ratio (OER) and inharmonicity and we call itspectral detail (SDT). The third component is related totwo spectrotemporal variation (STV) characteristics suchas noisiness, harmonic spectral Flux (Flux), and the stan-dard deviation of the harmonic spectral centroid (SC_std).Finally, the fourth component is related to temporal char-acteristics such as the logarithm of the attack time(Log_At_time), temporal centroid (TC), and a spectrotem-poral one (temporal variation of the first nine harmonicsdescribed by the Mean coefficient of variation, MCV, Ken-dall & Carterette, 1993b), thus we call it temporal/spectro-temporal (T/STV). The small differences between theloadings on principal components reported in this workcompared to the ones in Zacharakis et al. (2014) come
from the fact that the stimulus set in this case wasenhanced with an additional cello tone.
Acoustical interpretation of perceptual dimensions. Therelationships between acoustic components and percep-tual dimensions were examined in the same way as therelationships between perceptual and semantic dimen-sions. Such an investigation may facilitate a subsequentinterpretation and labeling of the perceptual dimen-sions in terms of acoustical signal properties.
Pearson’s correlation coefficients among the principalacoustic components and the perceptual dimensions foreach linguistic group were initially calculated. We havealso included F0 in the correlation analysis to examineits influence on the formulation of the spaces. Table 8presents the obtained correlation coefficients.
All statistically significant correlations show medium(r > .30) and large effects (r > .50) (Ellis, 2010). Asexpected by the high similarity between the Greek andEnglish perceptual spaces the major acoustic correlatesfor each space are also almost similar.
The first perceptual dimension for both languages isstrongly correlated to F0, r(22) ¼ �.74, p ¼ .001 forGreek and r(22) ¼ �.63, p ¼ .001 for English, and toEDHP, r(22) ¼ .64, p ¼ .001 for Greek and r(22) ¼ .73,p ¼ .001 for English. The second dimension in bothlanguages shows strong correlations to T/STV, r(22) ¼�.62, p ¼ .001 for Greek and r(22) ¼ �.65, p ¼ .001 for
TABLE 7. Loadings of the Audio Features on the First 4 PrincipalComponents as a Result of PCA with Varimax Rotation.
Component
1 2 3 4EDHP SDT STV T/STV
T3 .96 .06 �.02 .04SC_norm .94 .04 .05 �.04T2 �.93 .16 .09 .14SC_loud_cor .85 .50 .03 .01Spread .73 .45 �.01 �.02SC_loud .70 .65 .01 .07OER �.17 �.77 �.03 �.15Inharmonicity .15 �.71 .43 �.35Noisiness .24 .08 .87 �.15Flux �.05 �.14 .82 .04SC_std �.30 .25 .72 .22Log_At_time .08 �.04 .23 .88MCV �.22 �.44 �.02 .76TC .24 �.47 �.13 .74SC_var_loud �.62 �.61 �.07 �.15
Note: Loadings � .7 are presented in bold and used for labeling the components. SeeTable B1 for the abbreviations. EDHP ¼ energy distribution of harmonic partials;SDT ¼ spectral detail; STV ¼ spectrotemporal variation; T/STV ¼ temporal/spectro-temporal variation).
6 The principles by which the rejection of multicollinear features wasperformed was to always prefer the mean statistic over the rest and tofavor features that are commonly found in the literature over lesscommon descriptors.
7 The anti-image correlation matrix contains measures of samplingadequacy for each variable along the diagonal and the negatives of thepartial correlation on the off-diagonals.
404 Asterios Zacharakis, Konstantinos Pastiadis, & Joshua D. Reiss
This content downloaded from 138.37.90.245 on Wed, 13 May 2015 05:09:01 AMAll use subject to JSTOR Terms and Conditions
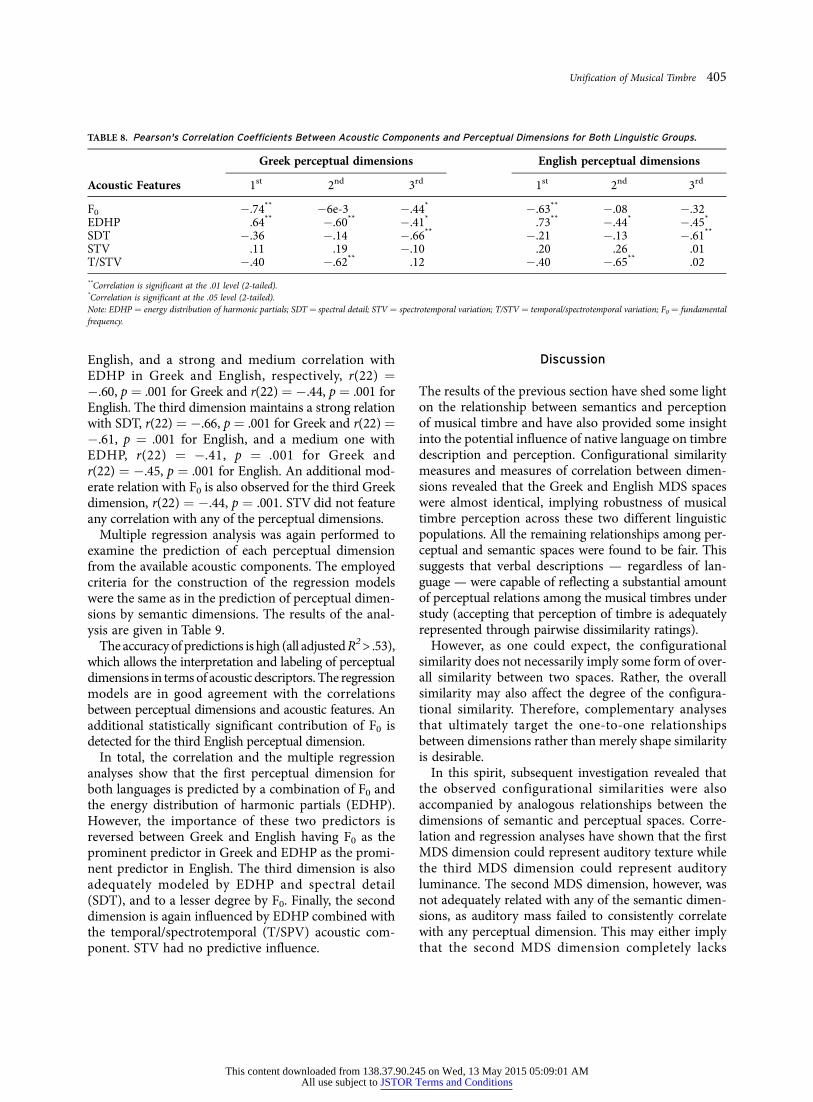
English, and a strong and medium correlation withEDHP in Greek and English, respectively, r(22) ¼�.60, p ¼ .001 for Greek and r(22) ¼ �.44, p ¼ .001 forEnglish. The third dimension maintains a strong relationwith SDT, r(22) ¼ �.66, p ¼ .001 for Greek and r(22) ¼�.61, p ¼ .001 for English, and a medium one withEDHP, r(22) ¼ �.41, p ¼ .001 for Greek andr(22) ¼ �.45, p ¼ .001 for English. An additional mod-erate relation with F0 is also observed for the third Greekdimension, r(22) ¼ �.44, p ¼ .001. STV did not featureany correlation with any of the perceptual dimensions.
Multiple regression analysis was again performed toexamine the prediction of each perceptual dimensionfrom the available acoustic components. The employedcriteria for the construction of the regression modelswere the same as in the prediction of perceptual dimen-sions by semantic dimensions. The results of the anal-ysis are given in Table 9.
The accuracy of predictions is high (all adjusted R2 > .53),which allows the interpretation and labeling of perceptualdimensions in terms of acoustic descriptors. The regressionmodels are in good agreement with the correlationsbetween perceptual dimensions and acoustic features. Anadditional statistically significant contribution of F0 isdetected for the third English perceptual dimension.
In total, the correlation and the multiple regressionanalyses show that the first perceptual dimension forboth languages is predicted by a combination of F0 andthe energy distribution of harmonic partials (EDHP).However, the importance of these two predictors isreversed between Greek and English having F0 as theprominent predictor in Greek and EDHP as the promi-nent predictor in English. The third dimension is alsoadequately modeled by EDHP and spectral detail(SDT), and to a lesser degree by F0. Finally, the seconddimension is again influenced by EDHP combined withthe temporal/spectrotemporal (T/SPV) acoustic com-ponent. STV had no predictive influence.
Discussion
The results of the previous section have shed some lighton the relationship between semantics and perceptionof musical timbre and have also provided some insightinto the potential influence of native language on timbredescription and perception. Configurational similaritymeasures and measures of correlation between dimen-sions revealed that the Greek and English MDS spaceswere almost identical, implying robustness of musicaltimbre perception across these two different linguisticpopulations. All the remaining relationships among per-ceptual and semantic spaces were found to be fair. Thissuggests that verbal descriptions — regardless of lan-guage — were capable of reflecting a substantial amountof perceptual relations among the musical timbres understudy (accepting that perception of timbre is adequatelyrepresented through pairwise dissimilarity ratings).
However, as one could expect, the configurationalsimilarity does not necessarily imply some form of over-all similarity between two spaces. Rather, the overallsimilarity may also affect the degree of the configura-tional similarity. Therefore, complementary analysesthat ultimately target the one-to-one relationshipsbetween dimensions rather than merely shape similarityis desirable.
In this spirit, subsequent investigation revealed thatthe observed configurational similarities were alsoaccompanied by analogous relationships between thedimensions of semantic and perceptual spaces. Corre-lation and regression analyses have shown that the firstMDS dimension could represent auditory texture whilethe third MDS dimension could represent auditoryluminance. The second MDS dimension, however, wasnot adequately related with any of the semantic dimen-sions, as auditory mass failed to consistently correlatewith any perceptual dimension. This may either implythat the second MDS dimension completely lacks
TABLE 8. Pearson's Correlation Coefficients Between Acoustic Components and Perceptual Dimensions for Both Linguistic Groups.
Greek perceptual dimensions English perceptual dimensions
Acoustic Features 1st 2nd 3rd 1st 2nd 3rd
F0 �.74** �6e-3 �.44* �.63** �.08 �.32EDHP .64** �.60** �.41* .73** �.44* �.45*
SDT �.36 �.14 �.66** �.21 �.13 �.61**
STV .11 .19 �.10 .20 .26 .01T/STV �.40 �.62** .12 �.40 �.65** .02
**Correlation is significant at the .01 level (2-tailed).*Correlation is significant at the .05 level (2-tailed).Note: EDHP ¼ energy distribution of harmonic partials; SDT ¼ spectral detail; STV ¼ spectrotemporal variation; T/STV ¼ temporal/spectrotemporal variation; F0 ¼ fundamentalfrequency.
Unification of Musical Timbre 405
This content downloaded from 138.37.90.245 on Wed, 13 May 2015 05:09:01 AMAll use subject to JSTOR Terms and Conditions

a semantic ‘‘charge’’ or that its semantic interpretationshould be sought among additional appropriate descrip-tors. This, in turn, suggests the potential expansion ofour previous results (Zacharakis et al., 2014) so as toinclude semantic terms able to express such effects. Atthis point, it also has to be highlighted that mass carriedthe smallest amount of semantic information for bothlanguages and was the least clearly understood semanticdimension between them (see Zacharakis et al., 2014).Therefore, a further evaluation of its potency asa semantic dimension of musical timbre is mandated.
The fit between semantic and perceptual dimensionswas acceptable and an interpretational improvementwas observed in comparison to previous studies (e.g.,Kendall & Carterette, 1993a, 1993b; Kendall et al.,1999). Therefore, these results realize the prospects setby Samoylenko et al. (1996) regarding wider associa-tions between semantics and perception of timbre. Fur-thermore, the fact that heterologous interlanguagerelations both at configurational and dimensional levelswere of very similar strength to the intralanguage onesfurther supports the notion that the process of capturingperception through semantic description is not seri-ously affected by language.
However, differences between the perceptual andsemantic spaces do exist and could be explained by twopossible scenarios that require further investigation. Thefirst would be that timbre perception cannot be com-pletely captured by mere semantic description as someperceived aspects of sound are impossible to describe.To this end, the probability that representation of tim-bre through sensory modalities such as sight or touchmay be complementary to semantic description mightbe worth examining. The second possibility would bethat the inclusion of additional semantic scales, uponwhich a rating is made (e.g., replacing mass with a
descriptor of non-stationarity), may result in increasedcommon information between semantics and perception.Apart from artistic applications (e.g., contributing tomusical creativity and interaction), pursuing suchresearch directions could also improve music apprecia-tion for specific groups of listeners (e.g., hearing impairedindividuals).
The results of our analysis extend our previous find-ings (Zacharakis et al., 2014) regarding acoustic corre-lates of timbral semantic dimensions, with theconsideration of their effect on perceptual dimensions.The acoustic features correlate highly with perceptualdimensions and allow their accurate prediction. Theenergy distribution of harmonic partials (EDHP), whichwas generally present in most perceptual dimensions forboth languages, seems to mostly affect the texture-relatedEnglish perceptual dimension (first), and to a lesserextent the remaining ones. The picture is slightly differ-ent for the Greek data where the first MDS dimension isbetter predicted by F0 than by EDHP. It appears that thiscould account for the small percentage of uncommonvariance between the first perceptual dimensions. How-ever, the effects are of similar order, which leaves smallspace for rigorous interpretation. The fact that EDHP(rather than F0) was the acoustic descriptor that had beenpreviously associated with texture (Zacharakis et al.,2014) might account for Greek texture appearing‘‘shifted’’ towards the second MDS dimension in com-parison to the English texture. The association of audi-tory texture with EDHP is also confirmed by the fact thatboth are similarly correlated with most of the MDSdimensions. Furthermore, we now have more evidencethat auditory luminance (i.e., third MDS dimension) isrelated to SDT (i.e., OER and inharmonicity). Thesemantically ‘‘unlabeled’’ second perceptual dimensionseems to be influenced by temporal and spectrotemporal
TABLE 9. Multiple Regression Models for Perceptual Dimensions as Dependent Variables and Acoustic Descriptors as Predictors.
Perceptualdimensions
Acoustic Features
Adj
.-R
2
AIC
intercept F0 EDHP SDT STV T/STV
B S.E. B S.E. b B S.E. b B S.E. b B S.E. b B S.E. b
Gre
ek
1st 1.26* .29 �6e-3* 1e-3 �.59 �.46* .13 .44 – – – – – – – – – .70 �20.032nd �.02 .12 – – – �.66* .13 �.61 – – – – – – �.62* .12 �.62 .71 �15.473rd .80 .37 �4e-3* 2e-3 �.39 �.57* .14 �.56 �.45* .16 �.44 – – – – – – .65 �11.58
En
glis
h 1st .93* .30 �4e-3* 1e-3 �.43 .60* .13 .59 – – – – – – – – – .68 �17.16
2nd �2e-3 .14 – – – �.45* .14 �.45 – – – – – – �.67* .15 �.63 .54 �7.62
3rd .51 .42 �2e-3* 2e-3 �.25 �.56* .16 �.55 �.48* .18 �.47 – – – – – – .56 �10.82
**Correlation is significant at the .01 level (2-tailed).*Correlation is significant at the .05 level (2-tailed).Note: EDHP ¼ energy distribution of harmonic partials; SFS ¼ spectral fine structure; STV ¼ spectrotemporal variation; T/STV ¼ temporal/spectrotemporal variation;F0 ¼ fundamental frequency.
406 Asterios Zacharakis, Konstantinos Pastiadis, & Joshua D. Reiss
This content downloaded from 138.37.90.245 on Wed, 13 May 2015 05:09:01 AMAll use subject to JSTOR Terms and Conditions

acoustic characteristics. This could imply that the pro-vided semantic descriptions have mainly been able tocapture static/stationary phenomena (i.e., spectral con-tent and detail) but were deprived of the potential torepresent dynamic aspects of the sounds such as theattack time and temporal centroid. The summary of theidentified relationships among perceptual dimensions,semantics and acoustic correlates is given in Figure 5.
Whereas these results agree with the existing literatureregarding acoustic correlates of perceptual dimensions,there seems to be some discrepancy concerning thesemantic interpretation. Most studies (Grey & Gordon,1978; Iverson & Krumhansl, 1993; Kendall et al., 1999;Krimphoff, 1993; Krumhansl, 1989; Lakatos, 2000; Mc-Adams et al., 1995; ) have identified the spectral centroidand some measure of impulsiveness (e.g., logarithm ofthe attack time) as the acoustic correlates of the first andsecond MDS dimensions, respectively. On the otherhand, the third dimension of a typical 3D perceptualspace appears more controversial, as some works havelinked it to spectral variation (Kendall & Carterette,1993b; Kendall et al., 1999; Krimphoff, McAdams, &Winsberg, 1994; McAdams, 1999), while others link itto spectral fine structure (Krumhansl, 1989; Krimphoff,1993b, McAdams, 1999). Our findings do not contradictthe literature in this respect. However, when it comes tosemantics, the typically reported univocal relationbetween auditory brightness and spectral content was notso evident in our work. Rather, the energy distribution ofthe partials was mostly associated with texture, whileluminance was related to both energy distribution of thepartials and spectral detail.
Finally, an observation regarding the possible effectof different F0 values to the listeners’ judgments has to
be made; participants were capable of providing mean-ingful judgments of timbral dissimilarity even withinan F0 range of three octaves. Although F0 was corre-lated with the first MDS dimensions (supporting thefindings of Marozeau et al., 2003, and Marozeau & deCheveigne 2007), F0 variation was by no means dom-inating over the other perceptual dimensions as has beenthe case with previously reported results on simple syn-thetic stimuli (Miller & Carterette, 1975). A possibleexplanation could be that the inherent timbral diversitystemming from complex musical timbres like the onesused in our investigation (combination of natural andsynthetic instruments) prevailed over the effect of F0
variation.
Conclusion
This study investigated the relationship of timbralsemantics with timbre perception and the extent towhich this relationship was influenced by native lan-guage. Two semantic timbre spaces obtained using verbalattribute magnitude estimation listening experimentswere compared with two perceptual timbre spaces frompairwise dissimilarity rating experiments. All four timbrespaces concerned the same stimulus set and each type ofexperiment was performed by separate groups ofEnglish- and Greek-speaking participants. Additionally,acoustic features were employed to provide physicalinterpretation and labeling of the perceptual dimensions.Thus, the present work was an attempt to provide aninterlinguistic unifying framework of musical timbredescription in terms of semantic, perceptual, and acous-tical consideration.
The main findings can be summarized as follows:
1) The strong similarity between the two perceptualspaces suggests that native language has no effecton timbre perception, at least for the two linguisticcultures tested.
2) The fair configurational similarity between semanticand perceptual spaces combined with some signifi-cant correlations between semantic and perceptualdimensions shows that verbal description of timbralqualities can indeed capture some aspects of theperceptual structure within a set of timbres. It alsoprovides a partial basis for a ‘‘semantic labeling’’ ofperceptual dimensions.
3) An interpretation of perceptual spaces by means ofacoustic terms showed that the energy distributionof harmonic partials (EDHP) is the most promi-nent acoustic correlate. It is associated with all threeperceptual dimensions for both languages. The first
FIGURE 5. A proposal for a unified framework among timbre
perception, semantics and acoustics. Solid lines represent primary
effects and dotted lines represent weaker associations.
Unification of Musical Timbre 407
This content downloaded from 138.37.90.245 on Wed, 13 May 2015 05:09:01 AMAll use subject to JSTOR Terms and Conditions

perceptual dimension receives the strongest associ-ation of EDHP and a major contribution of F0. Thethird perceptual dimension is also affected byEDHP and F0 together with spectral detail (SDT).Finally, the second perceptual dimension is ade-quately modeled by the combination of energy dis-tribution of harmonic partials (EDHP) andtemporal/spectrotemporal variation (T/STV).
The configurational similarity between the semanticand perceptual spaces, even though not very strong,indicates that the relationships between sounds withinone space closely resemble the respective relationshipsin the other. This holds for both languages. The overallsimilarity (configurational and dimensional) betweensemantic and perceptual spaces allows for a hypothesisthat there may exist a substantial latent influence oftimbre semantics on pairwise dissimilarity judgments.That is, the perceived dissimilarity between a pair ofdifferent timbres might be influenced by combined eva-luations over several latent semantic constructs such asauditory texture and luminance. This hypothesis couldbe further investigated by combining an MDS witha structural equation modeling (confirmatory factoranalysis) approach.
An important implication of this result is that changeswithin one space may produce similar alterations to theother. The processing of a musical sound based onsemantic terms would produce a predictable and similarshift of its location in the perceptual space. It would alsoaffect the sound’s perceived relationships with othertimbral objects in a similar manner. As an applicationexample, a collection of appropriate semantic scaleslinked with a specialized lexicon of signal processingoperations could be used to drive certain types of per-ceived sound transformations.
Author Note
The authors wish to thank Prof. Stephen McAdams, Dr.Andy Simpson, Dr. Michael Terrell, Prof. Steven Handel,Prof. Petri Toiviainen, and two anonymous reviewers fortheir very helpful comments on previous versions of thismanuscript. Finally, we would like to thank all the peoplewho participated in the listening experiments.
Correspondence concerning this article should beaddressed to Asterios Zacharakis, Aristotle Universityof Thessaloniki, School of Fine Arts, Music Department,54124, University Campus, Thessaloniki, Greece,E-mail: [email protected]
References
ALLURI, V., & TOIVIAINEN, P. (2010). Exploring perceptual andacoustical correlates of polyphonic timbre. Music Perception,27, 223-242.
ALLURI, V., TOIVIAINEN, P., JAASKELAINEN, I. P., GLEREAN, E.,SAMS, M., & BRATTICO, E. (2012). Large-scale brain networksemerge from dynamic processing of musical timbre, key andrhythm. NeuroImage, 59, 3677-3689.
AMATRIAIN, X., BONADA, J., LOSCOS, A., & SERRA, X. (2002).Spectral processing. In Udo Zolzer (Ed.), DAFX - Digital AudioEffects (pp. 373-438). Chichester, England: John Wiley andSons Ltd.
ANDREWS, F. M., & INGLEHART, R. F. (1978). The structure ofsubjective well-being in nine Western societies. SocialIndicators Research, 6, 73-90.
BENSMAIA, S., & HOLLINS, M. (2005). Pacinian representations offine surface texture. Perception and Psychophysics, 67, 842-854.
BORG, I., & GROENEN, P. J. F. (2005). Modern multidimensionalscaling: Theory and applications (2nd ed.). New York: Springer.
BORG, I., & LEUTNER, D. (1985). Measuring the similarity ofMDS configurations, Multivariate Behavioral Research, 20,325-334.
CACLIN, A., MCADAMS, S., SMITH, B. K., & WINSBERG, S.(2005). Acoustic correlates of timbre space dimensions:
A confirmatory study using synthetic tones. Journal of theAcoustical Society of America, 118, 471-482.
CHO, G., KIM, C., & CASALI, J. G. (2002). Sensory evaluation offabric touch by free modulus magnitude estimation. Fibers andPolymers, 3, 169-173.
CUTZU, F., & EDELMAN, S. (1996). Faithful representation ofsimilarities among three-dimensional shapes in human vision.Proceedings of the National Academy of Sciences, 93,12046-12050.
DECARLO, L. T., & CROSS, D. V. (1990). Sequential effects inmagnitude scaling: Models and theory. Journal of ExperimentalPsychology: General, 119, 375-396.
EFRON, B., & TIBSHIRANI, R. (1993). An introduction to thebootstrap. London, UK: Chapman and Hall.
ELLIOT, T. M., HAMILTON, L. S., & THEUNISSEN, F. E. (2012).Acoustic structure of the five perceptual dimensions of timbrein orchestral instrument tones. Journal of the Acoustical Societyof America, 133, 389-404.
ELLIS, P. D. (2010). The essential guide to effect sizes: Statisticalpower, meta-analysis, and the interpretation of research results.Cambridge, UK: Cambridge University Press.
FAURE, A., MCADAMS, S., & NOSULENKO, V. (1996). Verbalcorrelates of perceptual dimensions of timbre. In B. Pennycook
408 Asterios Zacharakis, Konstantinos Pastiadis, & Joshua D. Reiss
This content downloaded from 138.37.90.245 on Wed, 13 May 2015 05:09:01 AMAll use subject to JSTOR Terms and Conditions

& E. Costa-Giomi (Eds.), Proceedings of the 4th InternationalConference on Music Perception and Cognition (ICMPC 04)(pp. 79-84). Montreal, Canada: McGill University.
FIELD, A. (2013). Discovering statistics using IBM SPSS statistics(4th ed.). London, UK: Sage Publications Ltd.
GIORDANO, B. L., ROCCHESSO, D., & MCADAMS, S. (2010).Integration of acoustical information in the perception ofimpacted sound sources: The role of information accuracy andexploitability. Journal of Experimental Psychology: HumanPerception and Performance, 36, 462-479.
GOWER, J. C. (1971). Statistical methods for comparing differentmultivariate analyses of the same data. In J. R. Hodson, D. G.Kendall, & P. Tautu (Eds.), Mathematics in the archaeologicaland historical sciences (pp. 138-149). Edinburgh, Scotland:Edinburgh University Press.
GOWER, J. C. (1975). Generalized Procrustes analysis.Psychometrika, 40, 33-51.
GOWER, J. C., & DIJKSTERHUIS, G. B. (2004). Procrustes pro-blems. Oxford, UK: Oxford University Press.
GREEN, B. G., DALTON, P., COWART, B., SHAFFER G., RANKIN, K.,& HIGGINS, J. (1996). Evaluating the ‘Labeled Magnitude Scale’for measuring sensations of taste and smell. Chemical Senses,21, 323-334.
GREY, J. M. (1977). Multidimensional perceptual scaling ofmusical timbres. Journal of the Acoustical Society of America,61, 1270-1277.
GREY, J. M., & GORDON J. W. (1978). Perceptual effects ofspectral modifications on musical timbres. Journal of theAcoustical Society of America, 63, 1493-1500.
HELMHOLTZ, H. L. F. VON (1954). On the sensations of tone (A. J.Ellis, Trans.). New York: Dover. (Original work published1877)
HURVICH, C. M., & TSAI, C. L. (1989). Regression and time seriesmodel selection in small samples. Biometrika, 76, 297-307.
IVERSON, P., & KRUMHANSL, C. L. (1993). Isolating the dynamicattributes of musical timbre. Journal of the Acoustical Society ofAmerica, 94, 2595-2603.
JACKSON, D. A. (1995). PROTEST: A PROcrustean randomiza-tion TESTof community environment concordance. EcoscienceSainte-Foy, 2, 297-303.
KENDALL, R. A., & CARTERETTE, E. C. (1993a). Verbal attributesof simultaneous wind instrument timbres: I. von Bismarck’sadjectives. Music Perception, 10, 445-468.
KENDALL, R. A., & CARTERETTE, E. C. (1993b). Verbal attributesof simultaneous wind instrument timbres: II. Adjectivesinduced from Piston’s Orchestration. Music Perception, 10,469-502.
KENDALL, R. A., & CARTERETTE, E. C. (1996). Differencethresholds for timbre related to spectral centroid. In B.Pennycook & E. Costa-Giomi (Eds.), Proceedings of the 4thInternational Conference on Music Perception and CognitionICMPC 04 (pp. 91-95). Montreal, Canada: McGill University.
KENDALL, R. A., CARTERETTE, E. C., & HAJDA, J. M. (1999).Perceptual and acoustical features of natural and syntheticorchestral instrument tones. Music Perception, 16, 327-364.
KOELSCH, S. (2011). Towards a neural basis of processing musicalsemantics. Physics of Life Reviews, 8, 89-105.
KRIMPHOFF, J. (1993). Analyse acoustique et perception du timbre[Acoustic analysis and perception of timbre] Unpublishedmaster’s thesis). Universite du Maine, Le Mans, France.
KRIMPHOFF, J., MCADAMS, S., & WINSBERG, S. (1994).Caracterisation du timbre des sons complexes. II : Analysesacoustiques et quantification psychophysique.[Characterization of the timbre of complex sounds. 2. Acousticanalysis and psychophysical quantification]. Journal dePhysique, 4, 625-628.
KRUMHANSL, C. L. (1989). Why is musical timbre so hard tounderstand? In S. Nielzen & O. Olsson (Eds.), Structure andperception of electroacoustic sound and music: Proceedings ofthe Marcus Wallenberg symposium (pp. 43-53). Lund, Sweden:Excerpta Medica, Amsterdam.
KRUMHANSL, C. L., & IVERSON, P. (1992). Perceptual interac-tions between musical pitch and timbre. Journal ofExperimental Psychology: Human Perception andPerformance, 18, 739-751.
KRUSKAL, J. B. (1964a). Multidimensional scaling by optimizinggoodness-of-fit to a nonmetric hypothesis. Psychometrica, 29,1-28.
KRUSKAL, J. B. (1964b). Nonmetric multidimensional scaling:a numerical method. Psychometrica, 29, 115-130.
LANGEHEINE, R. (1982). Statistical evaluation of measures of fit inthe Langeheine-Borg Procrustean individual differences scal-ing. Psychometrika, 47, 427-442.
LAKATOS, L. (2000). A common perceptual space for harmonicand percussive timbres. Perception and Psychophysics, 62,1426-1439.
LEGENDRE, P., & LEGENDRE, L. (1998). Numerical ecology (92ndEnglish ed.). Amsterdam: Elsevier Science.
LICHTE, W. (1941). Attributes of complex tones. Journal ofExperimental Psychology, 28, 455-480.
LORENZO-SEVA, U., & TEN BERGE, J. M. F. (2006). Tucker’scongruence coefficient as a meaningful index of factor simi-larity. Methodology, 2, 57-64.
MARKS, L. E. (1980). The effect binaural summation of loudness:Noise and two-tone complexes. Perception and Psychophysics,27, 489-498.
MAROZEAU, J., & DE CHEVEIGNE, A. (2007). The effect offundamental frequency on the brightness dimension oftimbre. Journal of the Acoustical Society of America, 121,383-387.
MAROZEAU, J., DE CHEVEIGNE, A., MCADAMS, S., & WINSBERG,S. (2003). The dependency of timbre on fundamental fre-quency. Journal of the Acoustical Society of America, 114,2946-2957.
Unification of Musical Timbre 409
This content downloaded from 138.37.90.245 on Wed, 13 May 2015 05:09:01 AMAll use subject to JSTOR Terms and Conditions

MCADAMS, S. (1999). Perspectives on the contribution oftimbre to musical structure. Computer Music Journal, 23,85-102.
MCADAMS, S., WINSBERG, S., DONNADIEU, S., SOETE, G. D., &KRIMPHOFF, J. (1995). Perceptual scaling of synthesized musi-cal timbres: Common dimensions, specificities, and latentsubject classes. Psychological Research, 58, 177-192.
MEULMAN, J. J., & HEISER, W. J. (2008). Categorical principalcomponent analysis (CATPCA). Chicago, IL: SPSS Inc.
MILLER, J. R., & CARTERETTE, E. C. (1975). Perceptual space formusical structures. Journal of the Acoustical Society of America,58, 711-720.
MOORE, B. C. J., GLASBERG, B. R., & THOMAS, B. (1997).A model for the prediction of thresholds, loudness, and partialloudness. Journal of the Audio Engineering Society, 45, 224-240.
OPOLKO, F., & WAPNICK, J. (2006). McGill university master sam-ples collection on DVD. Montreal, Canada: McGill University.
PAINTER, J. G., & KOELSCH, S. (2011). Can out-of-contextmusical sounds convey meaning? An ERP study on the pro-cessing of meaning in music. Psychophysiology, 48, 645-655.
PEETERS, G. (2004). A large set of audio features for sounddescription (similarity and classification) in CUIDADO project.CUIDADO 1st Project Report. Paris, France: IRCAM.
PEETERS, G., GIORDANO, B. L., SUSINI, P., MISDARIIS, N., &MCADAMS, S. (2011). The Timbre Toolbox: Extractingacoustic descriptors from musical signals. Journal of theAcoustical Society Of America, 130, 2902-2916.
PERES-NETO, P. R. (2000). Documentation for programPROTEST.EXE. Toronto, Canada: University of Toronto.
PERES-NETO, P. R., & D. A. JACKSON. (2001). How well domultivariate data sets match? The advantages of a Procrusteansuperimposition approach over the Mantel test. Oecologia 129,169-178.
PLOMP, R. (1970). Timbre as a multidimensional attribute ofcomplex tones. In R. R. Plomp & G. F. Smoorenburg (Eds.),Frequency analysis and periodicity detection in hearing (pp.397-414). Leiden, Netherlands: Sijthoff.
POLLARD, H., & JANSSON, E. (1982). A tristimulus method for thespecification of musical timbre. Acustica, 51, 162-171.
RAO, C. R., & WU, Y. (2001). On model selection. IMS LectureNotes-Monograph Series, 38, 1-57.
SAMOYLENKO, E., MCADAMS, S., & NOSULENKO, V. (1996).Systematic analysis of verbalizations produced in comparingmusical timbres. International Journal of Psychology, 31,255-278.
SCHONEMANN, P. H., & CARROLL, R. M. (1970). Fitting onematrix to another under choice of a central dilation and a rigidmotion. Psychometrika, 35, 245-255.
SHEPARD, R. N. (1962a). The analysis of proximities:Multidimensional scaling with an unknown distance function:I. Psychometrica, 27, 125-140.
SHEPARD, R. N. (1962b). The analysis of proximities:Multidimensional scaling with an unknown distance function:II. Psychometrica, 27, 219-246.
SHEPARD, R. N. (1966). Metric structures in ordinal data. Journalof Mathematical Psychology, 3, 287-315.
SPENCE, I. (1979). A simple approximation for randomrankings stress values. Multivariate Behavioral Research, 14,355-365.
STEVENS, S. S. (1971). Issues in psychophysical measurement.Psychological Review, 78(5), 426-450.
TUCKER, L. R. (1951). A method for synthesis of factor analysisstudies [Personnel Research Section Report No. 984].Washington, DC: Department of the Army.
VON BISMARCK, G. (1974). Timbre of steady tones:A factorial investigation of its verbal attributes. Acustica,30, 146-159.
YOSHIOKA, T., BENSMAIA, S. J., CRAIG, J. C., & HSIAO, S. S.(2007). Texture perception through direct and indirect touch:An analysis of perceptual space for tactile textures in twomodes of exploration. Somatosensory and Motor Research, 24,53-70.
YOUNG, F. W. (1970). Nonmetric multidimaneional scaling:Recovery of metric information. Psychometrica, 35, 455-473.
ZACHARAKIS, A., PASTIADIS, K., & REISS, J. D. (2014).An interlanguage study of musical timbre semanticdimensions and their acoustic correlates. Music Perception,31, 337-356.
410 Asterios Zacharakis, Konstantinos Pastiadis, & Joshua D. Reiss
This content downloaded from 138.37.90.245 on Wed, 13 May 2015 05:09:01 AMAll use subject to JSTOR Terms and Conditions

Appendix A
ASSESSMENT OF THE INFLUENCE OF SMALL PITCH DIFFERENCES ON
TIMBRE PERCEPTION
In order to assess whether the mild pitch shifting thatwe applied to a few of our sound stimuli had notaffected their timbral quality, we performed an extrapairwise dissimilarity listening test merely on these fivestimuli (marimba, harpsichord, pipe organ and Gibsonguitar at G3 and French horn at A#3) and their pitch-shifted versions.
Twenty-seven participants (age range ¼ 20-23, meanage ¼ 21.4, 20 female) took part in the listening test.None of the participants reported any hearing loss orabsolute pitch, and they had been practicing music for12.9 years on average, ranging from 6 to 19. The absenceof absolute pitch from the group of our participants wasagain a prerequisite as such a condition could affect theresults due to pitch variation within the stimulus set. Allparticipants were students in the Department of MusicStudies of the Aristotle University of Thessaloniki andwere provided with course bonus for their participation.
The procedure and instructions given were identicalto the ones of the main listening test. The overall exper-iment time, including instructions, lasted around thirtyminutes on average.
The pairwise dissimilarity data were analyzed throughthe same MDS analysis (INDSCAL) as the one applied tothe data of the main experiment. Table A1 shows themeasures-of-fit for three dimensionalities. The minimalimprovement of the measures-of-fit between the 2D and3D solutions suggests that a 2D space is adequate tomodel the relationships within this stimulus set.
As shown in Figure A1, the original and pitch shiftedversions of each stimulus occupy almost the same posi-tion in the two-dimensional timbre space. Therefore, itseems that the timbre of these five sounds was unaf-fected by the pitch shifting.
TABLE A1. Measures-of-fit and Their Improvement for DifferentMDS Dimensionalities Concerning the Pairwise DissimilarityExperiment That Examined the Influence of Mild Pitch Shifting onTimbre.
Dimensionality S-Stress Improv. D.A.F. Improv.
1D .21 – .90 –2D .08 .13 .97 .073D .04 .04 .99 .02
−1.5 −1 −0.5 0 0.5 1 1.5
−1.5
−1
−0.5
0
0.5
1
1.5
Hn A3
Hp A3 Mar A3
Org A3
Gibs A3
Hn A#3
Hp G3 Mar G3
Org G3
Gibs G3
1st dimension
2nd
dim
ensi
on
FIGURE A1. The 2-dimensional timbre space shows the positions of the
original and pitch shifted version of each stimulus.
Unification of Musical Timbre 411
This content downloaded from 138.37.90.245 on Wed, 13 May 2015 05:09:01 AMAll use subject to JSTOR Terms and Conditions

Appendix B
THE EXTRACTED AUDIO FEATURES
TABLE B1. Abbreviations and Definitions of the Significant Audio Features.
Category Feature Abbreviation Explanation
Spectral Content Harmonic SpectralCentroid
SC Barycenter of the harmonic spectrum (Peeters et al., 2011)
Spectral Centroid(loudness model)
SC_loud SC of the specific loudness (Moore et al., 1997)
Energy distributionof harmonic partials
Normalized HarmonicSpectral Centroid
SC_norm Normalized barycenter of the harmonic spectrum
Tristimulus 1, 2, and 3 T1, T2, T3 Relative amplitudes of the 1st, the 2nd to the 4th and the5th to the rest of the harmonics (Pollard & Jansson,1982)
Harmonic SpectralSpread
Spread Spread of the harmonic spectrum around its mean value(Peeters et al., 2011)
SC (loudness model)corrected
SC_loud_cor SC of the specific loudness corrected for F0 (Moore at al.,1997; Marozeau & de Cheveigne, 2007)
Spectrotemporal Harmonic SpectralFlux (or variation)
Flux Amount of variation of the harmonic spectrum over time(Krimphoff, 1993)
Mean Coefficient ofVariation
MCV Variation of the first 9 harmonics over time (Kendall &Carterette, 1993b)
SC standard deviation SC_std SC standard deviation over timeSC variation SC_var SC_std/SC_mean (Krimphoff, 1993)SC variation (loudness) SC_var_loud SC variation of the specific loudnessNoisiness Noisiness Ratio of the noise energy to the total energy (Peeters
et al., 2011)Spectral fine structure Harmonic Spectral
IrregularitySp_Irreg Measure of the harmonic spectrum fine structure (Kendall
& Carterette, 1996)Odd Even Ratio OER Ratio of the energy contained in odd versus even
harmonics (Peeters et al., 2011)Harmonic series Inharmonicity Inharmonicity Measure of the degree to which partials depart from whole
multiples of the fundamental frequency (Peeters et al.,2011)
Temporal Log of attack time Log_At_time Logarithm of the rise time (Peeters et al., 2011)Temporal Centroid TC Barycenter of the energy envelope (Peeters et al., 2011)Normalized Temporal
CentroidTC_norm TC/duration
412 Asterios Zacharakis, Konstantinos Pastiadis, & Joshua D. Reiss
This content downloaded from 138.37.90.245 on Wed, 13 May 2015 05:09:01 AMAll use subject to JSTOR Terms and Conditions