an assessment of status and progress of mdg accomplishment ... · an assessment of status and...
TRANSCRIPT
S O C I A L W A T C H P H I L I P P I N E S �0�
Missing Targets: An alternative MDG midterm report
An assessment of status and progress of MDG accomplishment in Region ��
� By JOSEPH GLORIA*
* Joseph Gloria is the Mindanao Coordinator of Social Watch Philippines and Assisstant Director for Visayas and Mindanao of Philippine Rural Reconstruction Movement.
THIS paper tries to assess the government’s positive outlook on the
attainment of the Millennium Development Goal targets in Central
Mindanao. It tries to answer the question: Will government deliver on
its promise on the MDG in Central Mindanao amid constant threats?
What government claims
The NEDA Region XII assessment on probable MDG attainment in the
region gives a rosy picture. On all goals presented, the government claims a high
probability of attainment in the region by 2015. Data presented supporting this
assessment all point to a positive trend.1 The data are also supported by and con-
sistent with by the National Statistical Coordination Board-Region 12’s MDG
Statistics Capsule that provided the baseline data for 1997 and data for 2003.
1 It should be noted that most of the data presented to support this claims used 2000 as a baseline and trends ending in 2003 as an endpoint.
Missing Targets: An alternative MDG midterm report
�0� S O C I A L W A T C H P H I L I P P I N E S
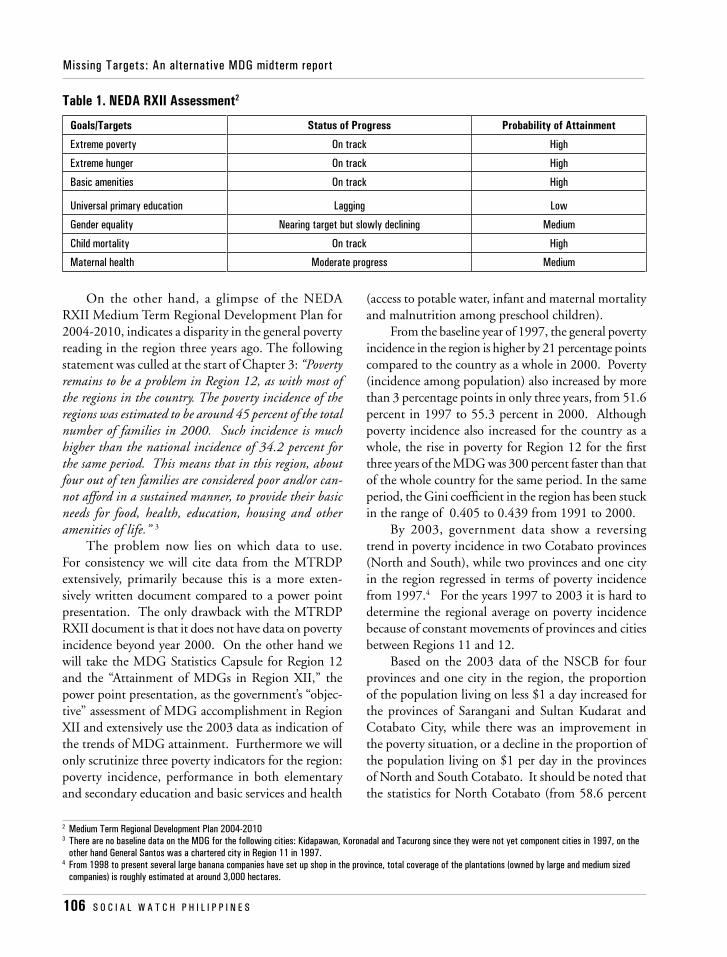
On the other hand, a glimpse of the NEDA RXII Medium Term Regional Development Plan for 2004-2010, indicates a disparity in the general poverty reading in the region three years ago. The following statement was culled at the start of Chapter 3: “Poverty remains to be a problem in Region 12, as with most of the regions in the country. The poverty incidence of the regions was estimated to be around 45 percent of the total number of families in 2000. Such incidence is much higher than the national incidence of 34.2 percent for the same period. This means that in this region, about four out of ten families are considered poor and/or can-not afford in a sustained manner, to provide their basic needs for food, health, education, housing and other amenities of life.” 3
The problem now lies on which data to use. For consistency we will cite data from the MTRDP extensively, primarily because this is a more exten-sively written document compared to a power point presentation. The only drawback with the MTRDP RXII document is that it does not have data on poverty incidence beyond year 2000. On the other hand we will take the MDG Statistics Capsule for Region 12 and the “Attainment of MDGs in Region XII,” the power point presentation, as the government’s “objec-tive” assessment of MDG accomplishment in Region XII and extensively use the 2003 data as indication of the trends of MDG attainment. Furthermore we will only scrutinize three poverty indicators for the region: poverty incidence, performance in both elementary and secondary education and basic services and health
(access to potable water, infant and maternal mortality and malnutrition among preschool children).
From the baseline year of 1997, the general poverty incidence in the region is higher by 21 percentage points compared to the country as a whole in 2000. Poverty (incidence among population) also increased by more than 3 percentage points in only three years, from 51.6 percent in 1997 to 55.3 percent in 2000. Although poverty incidence also increased for the country as a whole, the rise in poverty for Region 12 for the first three years of the MDG was 300 percent faster than that of the whole country for the same period. In the same period, the Gini coefficient in the region has been stuck in the range of 0.405 to 0.439 from 1991 to 2000.
By 2003, government data show a reversing trend in poverty incidence in two Cotabato provinces (North and South), while two provinces and one city in the region regressed in terms of poverty incidence from 1997.4 For the years 1997 to 2003 it is hard to determine the regional average on poverty incidence because of constant movements of provinces and cities between Regions 11 and 12.
Based on the 2003 data of the NSCB for four provinces and one city in the region, the proportion of the population living on less $1 a day increased for the provinces of Sarangani and Sultan Kudarat and Cotabato City, while there was an improvement in the poverty situation, or a decline in the proportion of the population living on $1 per day in the provinces of North and South Cotabato. It should be noted that the statistics for North Cotabato (from 58.6 percent
Table �. NEDA RXII Assessment�
Goals/Targets Status of Progress Probability of Attainment
Extreme poverty On track High
Extreme hunger On track High
Basic amenities On track High
Universal primary education Lagging Low
Gender equality Nearing target but slowly declining Medium
Child mortality On track High
Maternal health Moderate progress Medium
2 Medium Term Regional Development Plan 2004-20103 There are no baseline data on the MDG for the following cities: Kidapawan, Koronadal and Tacurong since they were not yet component cities in 1997, on the
other hand General Santos was a chartered city in Region 11 in 1997. 4 From 1998 to present several large banana companies have set up shop in the province, total coverage of the plantations (owned by large and medium sized
companies) is roughly estimated at around 3,000 hectares.

S O C I A L W A T C H P H I L I P P I N E S �0�
Missing Targets: An alternative MDG midterm report
to 32.1% proportion of population living on $1 per day) was the biggest improvement in the region for the six-year period.
The regional average for the same indicator in 1997 was 44.1 percent and for 2003, at 42.52 percent. The average target for the region to reduce poverty incidence in the region is at 22.25 percent. Based on the data presented above, the general rate of decrease is only -.26 percent per year. In order for the region to reach the specified target by 2015, theoretically, poverty incidence among the population should decrease by -2.53 percent per year or 10 times more than the average decrease for the past six years (1997-2003). Ten times the decrease can be roughly translated to 10 times the effort to im-prove the quality of life among the general population or 10 times the needed resources to provide the basic necessities and services. With decreasing government allocation on local government units, it is doubtful that MDG targets will be met.
What about private sector contribution to poverty reduction? If we look at the disparity among the prov-inces and cities in the reduction of poverty incidence, this should show some indication of possible effects of private sector involvement in poverty reduction. Take North Cotabato for example; there is strong basis to believe that the marked improvement in the general poverty situation was brought about by the influx of
large banana plantations in the province.5 Improve-ments in daily incomes among plantation workers are concentrated on several municipalities and do not represent the general poverty situation as a whole, as can be gleaned from the NSCB data of 2005.6 Although a significant number of people enjoy better incomes from plantations, a significant number of the province’s population is still not affected. Still, municipalities with significant number of indigenous peoples and Muslims (Magpet, Pikit, Aleosan, Alamada, etc) are lagging behind.
Education performanceElementary Education. Data from the Depart-
ment of Education (DepEd) show a declining trend in primary education for children in the 6-11 years age bracket. For SY 2002-2003 the participation rate was at 78.56 percent and after three years, SY 2005-2006, this significantly dropped by more than five percentile points to 73.21 percent. The province with the lowest participation rate and with the biggest decline com-pared to SY 2002-2003 figures is Sultan Kudarat—from 75.05 percent in SY 2002-2003 to 67.01 percent for SY 2005-06.
Cohort survival and completion rate for the same comparative period also dropped significantly in all areas except for Kidapawan City, which experienced
Table �. Performance Indicators (Elementary Level), By Province and citySchool Years �00�-0� and �00�-0�, Region XII
AREA
Participation Rate Cohort Survival Rate Dropout Rate Completion Rate
2002-03 2005-06 2002-03 2005-06 2002-03 2005-06 2002-03 2005-06
Region XII 78.56 73.21 53.29 45.62 2.66 2.88 51.25 43.66
North Cotabato 83.40 77.52 48.20 39.60 3.40 3.72 46.65 38.46
Sarangani 73.03 68.13 51.45 47.90 2.49 2.42 48.69 44.62
South Cotabato 75.61 70.91 59.94 48.85 1.51 1.77 58.22 46.89
Sultan Kudarat 75.05 67.01 49.16 44.60 3.40 3.78 46.91 41.87
Cotabato City 91.65 92.72 52.56 44.27 1.87 2.04 52.19 43.46
Gen. Santos City 80.31 77.81 67.06 48.00 1.78 2.23 64.79 45.62
Kidapawan City 75.43 70.35 47.04 51.16 3.12 3.11 41.26 49.59
Koronadal City 76.37 67.51 59.20 58.15 2.61 2.89 57.21 56.81
Tacurong City 66.77 68.60 2.07 65.32 Note: Tacurong City data is included in Sultan Kudarat data for SY 2002-2003 Source: DepEd BEIS 2002-2003 and 2005-06
5 Poverty incidence among several municipalities in North Cotabato.6 Chapter 3, Social Justice and Basic Needs, Page 47, Medium Term Regional Development Plan 2004-2010
Missing Targets: An alternative MDG midterm report
�0� S O C I A L W A T C H P H I L I P P I N E S
an increase of four to eight percentile points in both ratings.
Net enrollment in primary schools is lower in the region compared to the country as a whole, except for Cotabato City which registered a higher net enrollment ratio than the whole country. The lowest net enrolment for primary education is in Sarangani Province. The high gross enrollment rate suggests that a significant number of children enrolled in primary education are beyond the prescribed ages for that level.
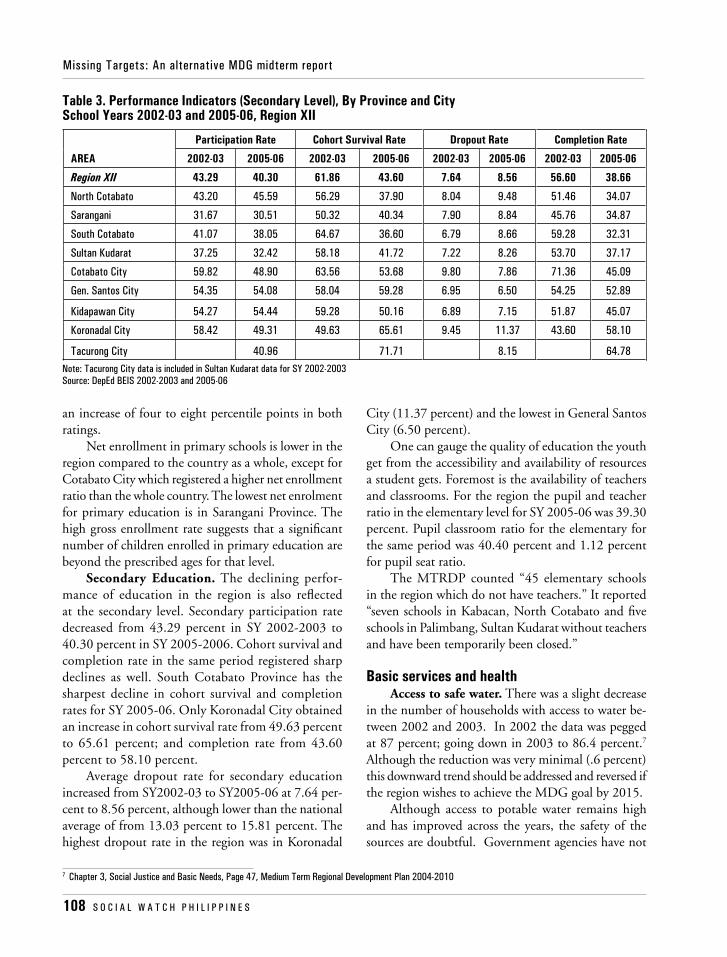
Secondary Education. The declining perfor-mance of education in the region is also reflected at the secondary level. Secondary participation rate decreased from 43.29 percent in SY 2002-2003 to 40.30 percent in SY 2005-2006. Cohort survival and completion rate in the same period registered sharp declines as well. South Cotabato Province has the sharpest decline in cohort survival and completion rates for SY 2005-06. Only Koronadal City obtained an increase in cohort survival rate from 49.63 percent to 65.61 percent; and completion rate from 43.60 percent to 58.10 percent.
Average dropout rate for secondary education increased from SY2002-03 to SY2005-06 at 7.64 per-cent to 8.56 percent, although lower than the national average of from 13.03 percent to 15.81 percent. The highest dropout rate in the region was in Koronadal
City (11.37 percent) and the lowest in General Santos City (6.50 percent).
One can gauge the quality of education the youth get from the accessibility and availability of resources a student gets. Foremost is the availability of teachers and classrooms. For the region the pupil and teacher ratio in the elementary level for SY 2005-06 was 39.30 percent. Pupil classroom ratio for the elementary for the same period was 40.40 percent and 1.12 percent for pupil seat ratio.
The MTRDP counted “45 elementary schools in the region which do not have teachers.” It reported “seven schools in Kabacan, North Cotabato and five schools in Palimbang, Sultan Kudarat without teachers and have been temporarily been closed.”
Basic services and healthAccess to safe water. There was a slight decrease
in the number of households with access to water be-tween 2002 and 2003. In 2002 the data was pegged at 87 percent; going down in 2003 to 86.4 percent.7 Although the reduction was very minimal (.6 percent) this downward trend should be addressed and reversed if the region wishes to achieve the MDG goal by 2015.
Although access to potable water remains high and has improved across the years, the safety of the sources are doubtful. Government agencies have not
Table �. Performance Indicators (Secondary Level), By Province and city School Years �00�-0� and �00�-0�, Region XII
Note: Tacurong City data is included in Sultan Kudarat data for SY 2002-2003 Source: DepEd BEIS 2002-2003 and 2005-06
AREA
Participation Rate Cohort Survival Rate Dropout Rate Completion Rate
2002-03 2005-06 2002-03 2005-06 2002-03 2005-06 2002-03 2005-06
Region XII 43.29 40.30 61.86 43.60 7.64 8.56 56.60 38.66
North Cotabato 43.20 45.59 56.29 37.90 8.04 9.48 51.46 34.07
Sarangani 31.67 30.51 50.32 40.34 7.90 8.84 45.76 34.87
South Cotabato 41.07 38.05 64.67 36.60 6.79 8.66 59.28 32.31
Sultan Kudarat 37.25 32.42 58.18 41.72 7.22 8.26 53.70 37.17
Cotabato City 59.82 48.90 63.56 53.68 9.80 7.86 71.36 45.09
Gen. Santos City 54.35 54.08 58.04 59.28 6.95 6.50 54.25 52.89
Kidapawan City 54.27 54.44 59.28 50.16 6.89 7.15 51.87 45.07
Koronadal City 58.42 49.31 49.63 65.61 9.45 11.37 43.60 58.10
Tacurong City 40.96 71.71 8.15 64.78
7 Chapter 3, Social Justice and Basic Needs, Page 47, Medium Term Regional Development Plan 2004-2010
S O C I A L W A T C H P H I L I P P I N E S �0�
Missing Targets: An alternative MDG midterm report
conducted thorough and regular tests of water sources for most communities with communal water sources, either deep well or open spring. At most, testing is done to determine bacterial content. In one foreign- assisted project of the Department of Agrarian Reform in Re-gion XII that had a water system improvement project component (deep wells and communal springs), sources that had been the source of drinking water by the com-munities actually failed water potability testing (done by a private laboratory). Most of the sites tested failed in terms breaching allowable metal contents.
The quality of water sources remains doubtful “as diarrhea, a water-borne disease, remains to be the leading cause of morbidity not only among the regional population but nationwide.”8
Infant and Maternal Mortality. Infant death rate in the region is lower compared to national figures although the figures for Cotabato City and Sultan Kudarat (8.2 percent and 6.1 percent, respectively) are higher compared to the rest of the provinces and cities in the region.
Maternal death rates in the region are slightly higher than that of the country as a whole. Both North Cotabato and Cotabato City registered a figure (1.7 percent) that is double the national figure.
Malnutrition. The prevalence of underweight preschool children tripled from 6.73 percent in 2002 to 20.44 percent in 2003, owing to a change in standards between the two years. This means that two of every 10 children of preschool age have already been compro-mised in the development of their motor and mental skills. By the time they reach the school age of six, their survival in the elementary level will be doubtful.
What the data suggest. The three indicators criti-cal in measuring poverty (poverty incidence, education and health) in the region are not as rosy as NEDA Region XII suggests. Let us start with our assessment on the attainment of MDG goals in the region with a direct quote from the NEDA MTRDP:
“…about four out of ten families are considered poor and/or cannot afford, in a sustained manner, to provide their basic needs for food, health, education, housing and other amenities of life.”
Data and trends from the NEDA RXII MTRDP document have shown a significant decline in the attain-ment for several poverty indicators. The summation of
these indicators: performance in both elementary and secondary education and basic services and health (ac-cess to potable water, infant and maternal mortality and malnutrition among preschool children) and the trends each indicator exhibits would provide us a snapshot of the state of poverty in the region.
• Most alarming is the data presented for the education performance for school year 2002 to 2004. Unless drastic changes are made in the education sector in the region to reverse the trends particularly in participation, cohort survival and completion rate both for elementary and secondary education, it is doubtful that MDGs 2 and 3 will be achieved by 2015.
8 Page 6, The Mindanao Conflict in the Philippines: Roots, Cause and Potential Peace Dividend
• Doubtless, large populations in the region have access to water, but again data showed that access of households to water dropped by 0.6 percentage points in only one year. Since most of this water sources are communal (dug wells and springs), the slight decrease might be a reflec-tion of the state of the environment around this sources. Again, at the provincial level, we can find similarities in the provinces with low access (similar to North Cotabato municipalities with low access to water), these are predominantly landlocked areas within the region with a high percentage of the land area in the uplands. Even more alarming is the doubtful state of these water sources. Again MDG 7 specifically states access to safe drinking water. Again, if the slight decline can be reversed, access can be attained; but again, without a thorough inspection and
Missing Targets: An alternative MDG midterm report
��0 S O C I A L W A T C H P H I L I P P I N E S
testing to ascertain the quality of these sources, there is considerable doubt that MDG 7 will be attained.
• The prevalence of malnutrition among preschool children is alarmingly high (despite the claim that the sharp increase was due to a change in standards). The figure for 2003 should cause alarm. Infant and maternal mortality data at the regional data showed increasing trends in some provinces and cities. Similar to North Cotabato, these are areas that should be given special atten-tion to reverse the trend. Again these provinces and cities have areas and population that reside on the margins, and hence, the delivery of basic health and nutrition services are affected because of location. Unless government specifically targets vulnerable groups (i.e. IPs and Moros) and those geographically located in the margins, MDGs 4 and 5 would be difficult to achieve by 2015.
Given the low probability of attainment for MDGs 2, 3, 4, 5 and 7, the aim to eradicate extreme poverty by 2015 in the region is doubtful. Data suggests that contrary to government’s claim, poverty incidence in the region is growing.
Threats to attaining MDG in the regionAmong the different islands in the country
Mindanao has always been blessed with its own uniqueness, natural resources are abundant, from agriculture, fisheries, mineral deposits, etc. What also sets apart Mindanao from the rest of the country is that it is home of the second oldest conflict in the world. This conflict has inflicted heavy damage on the island and its people. Studies have estimated that the annual economic cost of the conflict during the periods 1975-1982 and 1997 to 2001 was at $200 million. These were the periods when the conflict intensified. It was also estimated that the number of the displaced during then-president Joseph Estrada’s all out war in year 2000 was at 1 million.
Related above is the impact of insecurity on ag-ricultural production and productivity. Conflict and uncertainty (i) create community-level responses that inhibit agricultural investment—from the establish-ment of tree farms to irrigation improvements, and (ii) disintegrate agricultural marketing, thus reducing the profitability of current crop production. Families and
population that rely on agriculture in conflict affected areas find it difficult to revert to normal and productive lives once hostilities break out.
As in the case of most civil conflicts, the Mindanao conflict also has its social costs, foremost of which is the disruption of education and health services. This may range from the destruction of infrastructure needed to deliver the services to restricted access of the population to these services.
Another consequence of these encounters are in-ternally displaced persons (IDPs) that cross municipal and even provincial boundaries within the region. The negative impact is on the ability of the national, regional and provincial governments to deliver basic services as they are compelled to absorb the cost of conflict. This regularly puts a strain on the already-scarce local government resources.
Furthermore, economic productivity in the region is regularly threatened by the occurrence of the El Niño phenomenon. The El Niño had been observed to have had a considerable impact on the gross regional domestic product or GRDP (particularly in the agri-culture sector) in the past. At least 43 percent of the GRDP was contributed by the Agriculture, Fishery and Forestry sector. With the observed shortening of the periods between recurrences, the El Niño might recur before 2015.
Factoring in the recurring threat of war and con-flict and the threat of natural calamities, attaining the MDGs within the region is further compromised, as already borne out by historical data.
Focus on North cotabatoAlthough the province does not lag behind the rest
of the provinces and cities in the region, it has remained almost at the middle of the lowest and highest of the provinces and cities in terms of poverty indicators.
According to the NEDA’s 2003 report on poverty incidence, 26.10 percent of North Cotabato families and 32.10 percent of the population are poor. This represented a decline from the poverty incidence in terms of families and population of 39.6 percent and 37.7 percent in 2000. The national and regional data for the same period is at 27.4 percent and 32 percent, respectively.
In terms of health and sanitation, accessibility to sanitary toilets is very low in the province. The municipalities of Arakan, Antipas and Matalam have
S O C I A L W A T C H P H I L I P P I N E S ���
Missing Targets: An alternative MDG midterm report
high numbers of households without sanitary toilets.
Although the province registered a high percentage of households with access to potable water at 89 percent, two municipalities, Arakan and Midsayap, are notable: their population has the lowest accessibility to potable water. Both municipalities possess distinct geographi-cal characteristics: Midsayap has a large area that overlaps with the vast Liguasan Marsh, which consistently floods during the rainy season; and Arakan is characterized by rolling hills and mountainous areas. In both mu-nicipalities we can also find a concentration of Muslims ( in Midasayap) and indigenous peoples (in Arakan).
Infant mortality in North Cotabato was pegged by the IPHO at 3.34 per 1000 live births in 2005. Infant mortality is higher than the provincial average in the following municipalities: Midsayap at 8.39 deaths per 1000 live births, Libun-gan at 8.13, Magpet at 8.11 and Pigcawayan at 7.53. Malnutrition is likewise prevalent in the muncipalities of Magpet, Tulunan and Arakan.
Municipalities with dismal performance in health and sanitation have several commonalities. First, most of them are generally upland municipalities; second, the highest concentration in the province of indigenous and Moro peoples are found in these municipalities; and third, except for Midsayap, these are third- and fourth-class municipalities. With very low health and sanitation indicators, these municipalities are even chal-lenged to deliver basic social services to their population
because of low revenues. Education. Carmen has the lowest elementary
completion rate at 23 percent. The elementary comple-tion rates of other towns are similarly low—27 percent for Pikit, and 28 percent for Arakan and Alamada. The highest rate of illiteracy among household populations 10 years old and above is in Pikit (31.8 percent).
Alarming are the indicators for high school completion rates, with Antipas having the lowest high school completion rate of 13 percent. Again we can find similarities in the abovementioned municipalities: they are mostly upland, with indigenous and Moro people and classified as third- and fourth-class mu-nicipalities. n

BLANK PAGE