philippine mdg progress report 5
DESCRIPTION
Executive Summary of the Philippines' Fifth MDG Progress Report.Provided by NEDA and UNDPTRANSCRIPT

001EXECUTIVE SUMMARY
002 Philippines Fifth Progress Report on the Millennium Development Goals
©2014 by the National Economic and Development Authority and United Nations Development Programme
All rights reserved. Any part of this publication may be used and reproduced, provided proper acknowledgement is made.
The Philippines Fifth Progress Report - Millennium Development GoalsExecutive Summary
Published by:National Economic and Development Authority12 Escriva Drive, Ortigas Center, Pasig CityTel: (+632) 631 0945 to 56Email: [email protected]
Printed in the Philippines
01EXECUTIVE SUMMARY
The Philippines
Fifth Progress ReportMillennium Development Goals
Executive Summary
ii Philippines Fifth Progress Report on the Millennium Development Goals
UN Secretary General Ban Ki-Moon has cited the MDGs as “the most successful global anti-poverty push in history.” From the development planning perspective, the MDGs have evidently helped us in setting priorities and attaining desired results. The Philippines has adopted the MDG targets and ensured that the indicators would be relevant to our national situation and context.
The MDG Country Reports now stand among the best instruments to monitor our efforts and gains from the ground. From these reports, we are able to extract lessons in order to continuously improve and maintain the momentum towards the attainment of the MDGs.
The “Philippines Fifth Progress Report on the MDGs” is the penultimate report before 2015. With inputs from consultations with government agencies, the academe, research institutions, civil society organizations, and the UN Country Team, this publication intends to provide the status, trends, emerging challenges, lessons learned, best practices, and recommendations to meet the MDGs.
This Report shows that the Philippines is on track to meet the following MDG targets: (1) providing universal access to primary education; (2) providing educational opportunities for girls;
(3) reducing infant and under-five mortality; (4) reversing the incidence of malaria; (5) increasing tuberculosis detection and cure rates; and (6) increasing the proportion of households with access to safe water supply. Furthermore, the target of halving the proportion of people with no access to basic sanitation has already been achieved.
On the other hand, there is a need to exert greater effort to accelerate progress on the following areas where we are lagging behind: (1) elementary education in terms of completion rate; (2) maternal mortality; (3) access to reproductive health; and (4) HIV/AIDS.
On education, the participation rate has significantly improved but the completion rate at the elementary level has declined.
On health, the increase in maternal mortality ratio indicates that the target of 52 deaths per 100,000 live births has a low probability of being met. The contraceptive prevalence rate decreased from 50.1 percent in 2008 to 48.9 percent in 2011, still far from the country’s CPR target for 2015 which is at 63 percent, which indicates that the target for universal access to reproductive health is also unlikely to be achieved. Fast-tracking the implementation of the Responsible Parenthood and Reproductive Health Law is crucial, not just in improving the performance of the MDG 5 targets, but also in empowering women to make informed choices. Efforts must be also intensified in halting the increasing number of HIV/AIDS cases.
On gender, boys are at a disadvantage in terms of elementary and secondary education participation, cohort survival rate, and completion rate. The Report also shows that more females enrol in tertiary education and that there is a wide disparity in terms of functional literacy between males and females, with the latter having the advantage.
Inequality at the national level has remained high, despite a slight decrease of the Gini coefficient from 0.48 in 1991 to 0.47 in 2012. Uneven progress across regions also remains a pressing issue. Regional assessments of MDG
Preface
iiiEXECUTIVE SUMMARY
national government as the enabling body for policy formulation and budget allocation; the local government units as the frontline planners, resource programmers and implementers of policies and programs at the grassroots level; the private sector as the government’s partner in providing investments and service delivery; and the civil society as active advocates and monitors.
We are also starting to define our post-2015 agenda by involving stakeholders in crafting our future direction. This will require us to aggressively recalibrate and strategically re-think our programs, projects and activities. The Philippine Development Plan (PDP) 2011-2016 Midterm Update is paving the way for our post-MDG initiatives by putting in place spatial and sector-focused strategies for the Plan period. In terms of development goals, the Updated PDP introduces the multidimensional poverty index (MPI) as a performance indicator that complements the traditional income poverty data. These initiatives will hopefully help us in attaining our vision of inclusive growth, where no Filipino is left behind.
With only less than 500 days to the MDG deadline, “business as usual” is no longer the practice. What we need is a strong and unified determination from all sectors, at the national and local levels, for our country to make good on our Millennium promise.
ARSENIO M. BALISACANEconomic Planning Secretary
progress show that Bicol and most regions in Mindanao performed poorly in most of the goals, implying a high unmet need for social services, economic opportunities and social safety nets. The signing of the Comprehensive Agreement on the Bangsamoro, however, is a milestone that hopes to trigger genuine development in conflict-torn areas in the South.
Poverty incidence has been decreasing from 34.4 percent in 1991 to 25.2 in 2012. Poverty incidence in the first semester of 2013 was estimated at 24.9 percent which shows a 3 percentage point reduction from the 27.9 percent poverty incidence recorded for the first semester of 2012.
The devastation caused by typhoon Yolanda is seen to negate the progress for the MDGs, particularly in poverty reduction. The Report stresses that natural disasters and man-made shocks impede the sustainability of poverty reduction efforts and consequently increase poverty incidence, if no appropriate social safety nets are established to empower and protect the most disadvantaged and vulnerable sectors from further risks. With extreme changes in weather patterns becoming the new norm, we need to intensify the institutionalization of climate change adaptation and mitigation measures, particularly at the local levels.
The challenges ahead and the urgency to achieve the MDGs reinforce the role of every stakeholder in the development process: the

iv Philippines Fifth Progress Report on the Millennium Development Goals
With this Philippines Fifth Progress Report on the Millennium Development Goals, the Philippines examines itself and invites the scrutiny of civil society on how efforts have fared towards pre-determined MDG targets and how it plans to utilize the remaining months before the global reckoning at the end of 2015.
It is a comprehensive and transparent report. It summarizes the status of 35 MDG indicators, where we see that 14 indicators have a high probability of being attained (pace of progress is greater than 90 percent), 14 indicators have a low chance of being attained (pace of progress is less than 50 percent), and 7 indicators have a medium or fair chance (pace of progress is between 50 and 90 percent). It reports significant achievements in reducing infant and under-five mortality, empowering girls and women, increasing the proportion of households with access to safe water and sanitary toilet facilities, reversing the incidence of malaria, and increasing tuberculosis detection and cure rates, alongside disappointing misses in improving maternal health, combatting HIV/AIDS, and addressing the underperformance of boys relative to girls in all levels of education. High scores with respect to universal access to primary education are described in the same breath as internal inefficiencies in the sector, which are reflected in low cohort survival rates and completion rates.
It is also a forthright report. It questions the nature of the economic growth recorded in recent years, asking whether and how that growth has been inclusive, and offers an inequality analysis and a reflection on key bottlenecks for each goal. It takes note of striking disparities between regions and across income groups and admits shortcomings in both access to employment and the quality of employment, observing how the latter is intimately linked with both income poverty and education achievements. It examines the dynamic between transient poverty and natural hazard so relevant for Philippines.
Above all, it is a hopeful report, signifying the resolve of the Filipino Government and people to pursue the inclusive and sustainable development embodied in the MDGs despite having just a little more than a year to go. Nowhere else has this resolve been demonstrated than in the fight to eradicate poverty, where recent data suggests a reduction in poverty incidence by 3 percentage points year-on-year, from the first semester of 2012 to the first semester of 2013, a substantial change in pace from the 9.2 percentage point reduction observed over the 20 years between 1991 to 2012. This result shows the power of public and social policies, when they are well-designed and targeted, to reverse the intergenerational cycle of poverty that has perpetuated exclusions and vulnerabilities thus far. The ‘priorities for action’ in this Report will be the object of the same collective and concentrated effort by national government, local governments, civil society and the private sector over the next year – and beyond, as the post-2015 Development Agenda is finalized and adopted. Indeed, there is no better basis for optimism.
Mabuhay Philippines!
LUIZA CARVALHO UN Resident Coordinator and UNDP Resident Representative
Message
vEXECUTIVE SUMMARY
This Report was prepared through the collaborative efforts of the National Economic and Development Authority, under the leadership and guidance of Secretary Arsenio M. Balisacan, and the United Nations Country Team, led by Dr. Luiza Carvalho, UN Resident Coordinator.
The NEDA would like to thank the consultant, Dr. Celia Reyes of the Philippine Institute for Development Studies (PIDS) for her invaluable expertise in assessing MDG progress, consolidating and analyzing relevant data, integrating outputs of various stakeholders consulted during the report’s formulation, and providing evidence-based recommendations for the achievement of the MDGs in 2015.
Sincerest appreciation is also due to the United Nations Country Team (UNCT), members of the Multisectoral Committee on International Human Development Commitments (MC-IHDC), NEDA-Social Development Committee (SDC), nongovernment organizations, private sector, and academe/research institutions who participated during the Technical Workshop on the Philippines Fifth Progress Report on the MDGs held last June 18, 2013.
We would also like to thank the members of the Human Development and Poverty Reduction Cluster (HDPR) for their valuable inputs/recommendations. We also acknowledge the technical inputs shared by the Deputy Director-General Emmanuel F. Esguerra, Assistant Deputy Director-General Rosemarie G. Edillon, and other NEDA Staffs, namely: Agriculture Staff; Infrastructure Staff; Trade, Industry and Utilities Staff; National Planning and Policy Staff; Project Monitoring Staff; Regional Development Coordination Staff; Management Staff; and Development Information Staff.
Recognition is also due to the NEDA-Social Development Staff for their technical contributions and the Accelerating Progress on the MDGs Project Unit and for the full coordination of activities from the conceptualization of the project to publication.
Lastly, the NEDA would like to thank the United Nations Development Programme for funding support and technical assistance.
Acknowledgements
vi Philippines Fifth Progress Report on the Millennium Development Goals
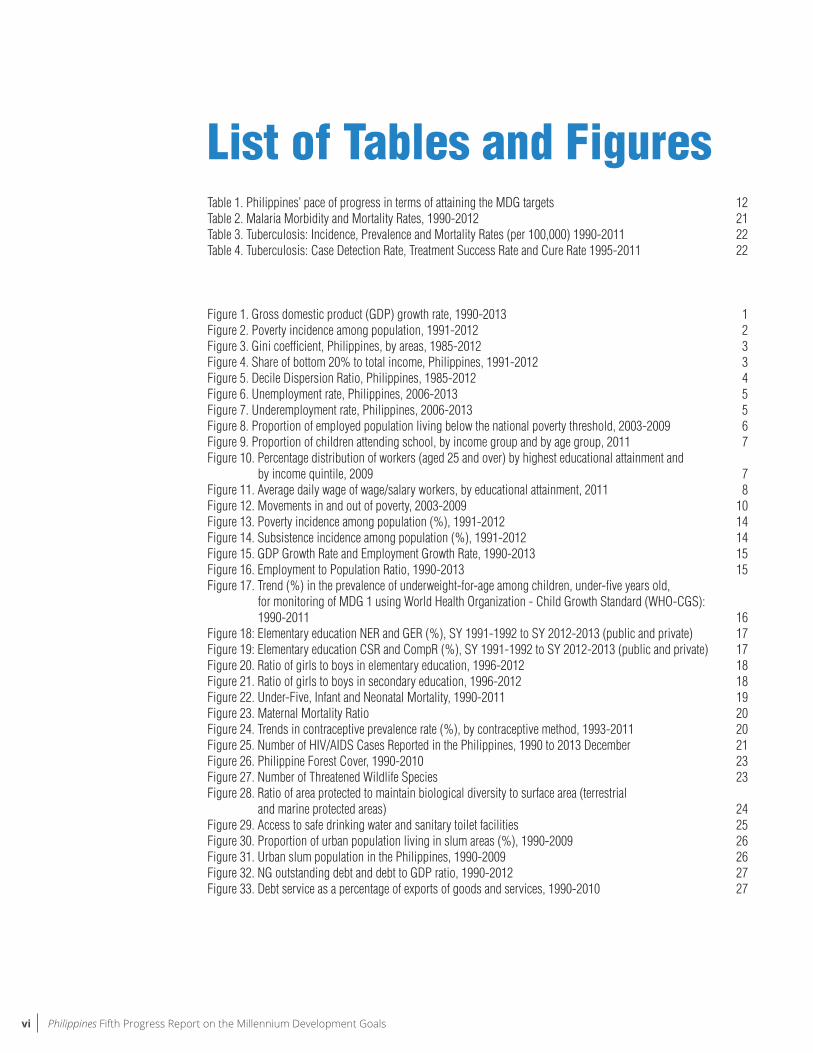
List of Tables and FiguresTable 1. Philippines’ pace of progress in terms of attaining the MDG targets 12Table 2. Malaria Morbidity and Mortality Rates, 1990-2012 21Table 3. Tuberculosis: Incidence, Prevalence and Mortality Rates (per 100,000) 1990-2011 22Table 4. Tuberculosis: Case Detection Rate, Treatment Success Rate and Cure Rate 1995-2011 22
Figure 1. Gross domestic product (GDP) growth rate, 1990-2013 1Figure 2. Poverty incidence among population, 1991-2012 2Figure 3. Gini coefficient, Philippines, by areas, 1985-2012 3Figure 4. Share of bottom 20% to total income, Philippines, 1991-2012 3Figure 5. Decile Dispersion Ratio, Philippines, 1985-2012 4Figure 6. Unemployment rate, Philippines, 2006-2013 5Figure 7. Underemployment rate, Philippines, 2006-2013 5Figure 8. Proportion of employed population living below the national poverty threshold, 2003-2009 6Figure 9. Proportion of children attending school, by income group and by age group, 2011 7Figure 10. Percentage distribution of workers (aged 25 and over) by highest educational attainment and by income quintile, 2009 7Figure 11. Average daily wage of wage/salary workers, by educational attainment, 2011 8Figure 12. Movements in and out of poverty, 2003-2009 10Figure 13. Poverty incidence among population (%), 1991-2012 14Figure 14. Subsistence incidence among population (%), 1991-2012 14Figure 15. GDP Growth Rate and Employment Growth Rate, 1990-2013 15Figure 16. Employment to Population Ratio, 1990-2013 15Figure 17. Trend (%) in the prevalence of underweight-for-age among children, under-five years old, for monitoring of MDG 1 using World Health Organization - Child Growth Standard (WHO-CGS): 1990-2011 16Figure 18: Elementary education NER and GER (%), SY 1991-1992 to SY 2012-2013 (public and private) 17Figure 19: Elementary education CSR and CompR (%), SY 1991-1992 to SY 2012-2013 (public and private) 17Figure 20. Ratio of girls to boys in elementary education, 1996-2012 18Figure 21. Ratio of girls to boys in secondary education, 1996-2012 18Figure 22. Under-Five, Infant and Neonatal Mortality, 1990-2011 19Figure 23. Maternal Mortality Ratio 20Figure 24. Trends in contraceptive prevalence rate (%), by contraceptive method, 1993-2011 20Figure 25. Number of HIV/AIDS Cases Reported in the Philippines, 1990 to 2013 December 21Figure 26. Philippine Forest Cover, 1990-2010 23Figure 27. Number of Threatened Wildlife Species 23Figure 28. Ratio of area protected to maintain biological diversity to surface area (terrestrial and marine protected areas) 24Figure 29. Access to safe drinking water and sanitary toilet facilities 25Figure 30. Proportion of urban population living in slum areas (%), 1990-2009 26Figure 31. Urban slum population in the Philippines, 1990-2009 26Figure 32. NG outstanding debt and debt to GDP ratio, 1990-2012 27Figure 33. Debt service as a percentage of exports of goods and services, 1990-2010 27
1EXECUTIVE SUMMARY
Introduction
It is less than 500 days before the 2015 target date of achieving the MDG targets. This report is the penultimate before 2015 and is very important in assessing where the Philippines is vis-à-vis the targets. Moreover, this report can be the basis for action to achieve accelerated progress within the next two years.
Has growth been inclusive?
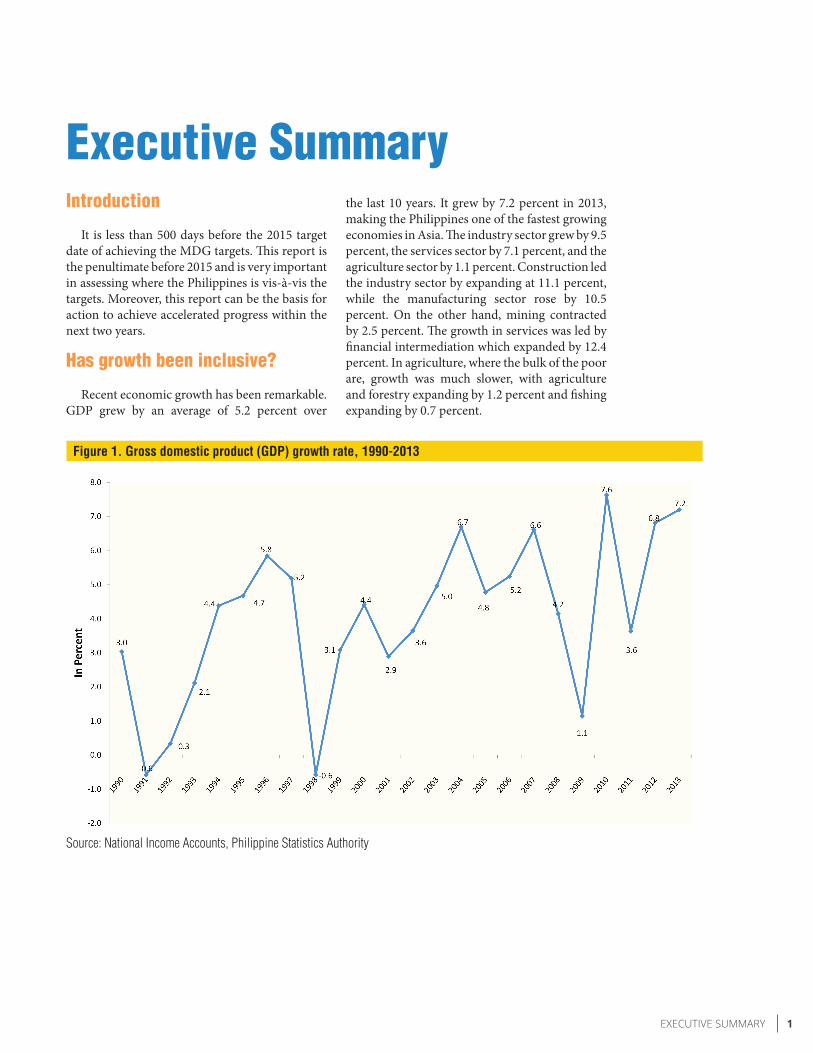
Recent economic growth has been remarkable. GDP grew by an average of 5.2 percent over
the last 10 years. It grew by 7.2 percent in 2013, making the Philippines one of the fastest growing economies in Asia. The industry sector grew by 9.5 percent, the services sector by 7.1 percent, and the agriculture sector by 1.1 percent. Construction led the industry sector by expanding at 11.1 percent, while the manufacturing sector rose by 10.5 percent. On the other hand, mining contracted by 2.5 percent. The growth in services was led by financial intermediation which expanded by 12.4 percent. In agriculture, where the bulk of the poor are, growth was much slower, with agriculture and forestry expanding by 1.2 percent and fishing expanding by 0.7 percent.
Executive Summary
Figure 1. Gross domestic product (GDP) growth rate, 1990-2013
Source: National Income Accounts, Philippine Statistics Authority
2 Philippines Fifth Progress Report on the Millennium Development Goals
Slow progress in poverty reduction
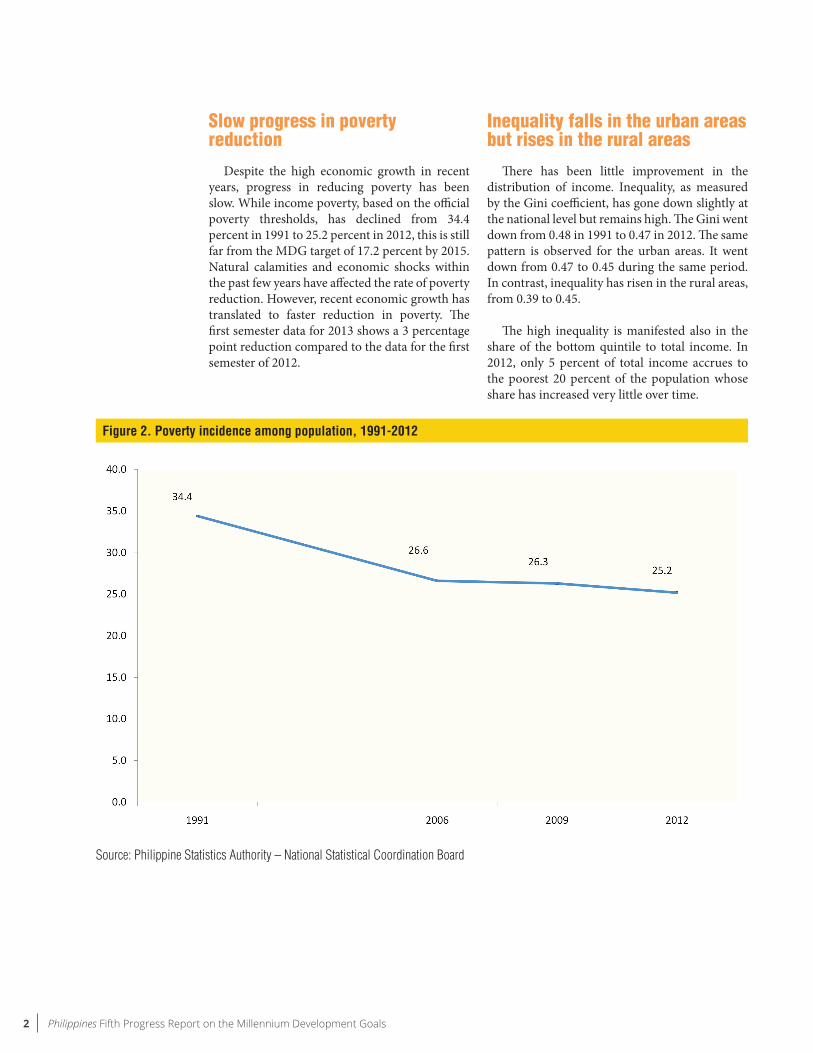
Despite the high economic growth in recent years, progress in reducing poverty has been slow. While income poverty, based on the official poverty thresholds, has declined from 34.4 percent in 1991 to 25.2 percent in 2012, this is still far from the MDG target of 17.2 percent by 2015. Natural calamities and economic shocks within the past few years have affected the rate of poverty reduction. However, recent economic growth has translated to faster reduction in poverty. The first semester data for 2013 shows a 3 percentage point reduction compared to the data for the first semester of 2012.
Inequality falls in the urban areas but rises in the rural areas
There has been little improvement in the distribution of income. Inequality, as measured by the Gini coefficient, has gone down slightly at the national level but remains high. The Gini went down from 0.48 in 1991 to 0.47 in 2012. The same pattern is observed for the urban areas. It went down from 0.47 to 0.45 during the same period. In contrast, inequality has risen in the rural areas, from 0.39 to 0.45.
The high inequality is manifested also in the share of the bottom quintile to total income. In 2012, only 5 percent of total income accrues to the poorest 20 percent of the population whose share has increased very little over time.
Figure 2. Poverty incidence among population, 1991-2012
Source: Philippine Statistics Authority – National Statistical Coordination Board

3EXECUTIVE SUMMARY
Source: Celia M. Reyes, Aubrey D. Tabuga, Ronina D. Asis and Maria Blessila G. Datu, 2012, Poverty and Agriculture in the Philippines: Trends in Income Poverty and Distribution (PIDS DP 2012-09); and 2012 Family Income and Expenditure Survey.
Figure 3. Gini coefficient, Philippines, by areas, 1985-2012
Figure 4. Share of bottom 20% to total income, Philippines, 1991-2012
Source: Celia M. Reyes, Aubrey D. Tabuga, Ronina D. Asis and Maria Blessila G. Datu, 2012, Poverty and Agriculture in the Philippines: Trends in Income Poverty and Distribution (PIDS DP 2012-09); and 2012 Family Income and Expenditure Survey.

4 Philippines Fifth Progress Report on the Millennium Development Goals
The small improvement in income distribution over time is observed in the decile dispersion ratio. The average income of the households belonging to the richest decile is now about 18 times that of the average income of the households belonging to the poorest decile. This reflects a small decline since 1985 when the ratio was 21. Nevertheless, the ratio remains high.
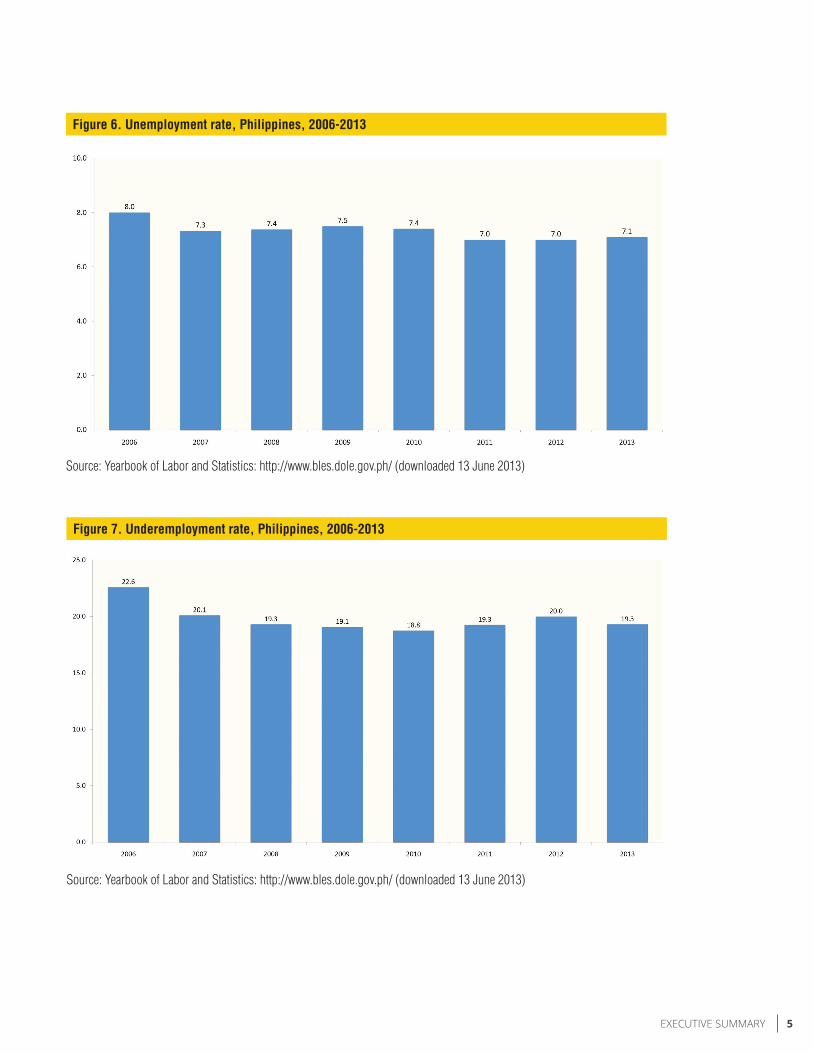
The recent economic growth has not translated to lower unemployment. In fact, the unemployment rate has been flat at around 7 percent since 2011, prompting many to regard the economic phenomenon as “jobless growth”. The 7.1 percent unemployment rate in 2013 translates to 2.9 million unemployed persons. On a more positive note, the proportion of employed persons seeking additional work has declined slightly from 20 percent to 19.3 percent. Nevertheless, the underemployment rate still remains high with 19 out of every 100 employed seeking additional work.
Figure 5. Decile Dispersion Ratio, Philippines, 1985-2012
Source: Celia M. Reyes, Aubrey D. Tabuga, Ronina D. Asis and Maria Blessila G. Datu, 2012, Poverty and Agriculture in the Philippines: Trends in Income Poverty and Distribution (PIDS DP 2012-09); and 2012 Family Income and Expenditure Survey.
5EXECUTIVE SUMMARY
Figure 6. Unemployment rate, Philippines, 2006-2013
Source: Yearbook of Labor and Statistics: http://www.bles.dole.gov.ph/ (downloaded 13 June 2013)
Figure 7. Underemployment rate, Philippines, 2006-2013
Source: Yearbook of Labor and Statistics: http://www.bles.dole.gov.ph/ (downloaded 13 June 2013)
6 Philippines Fifth Progress Report on the Millennium Development Goals
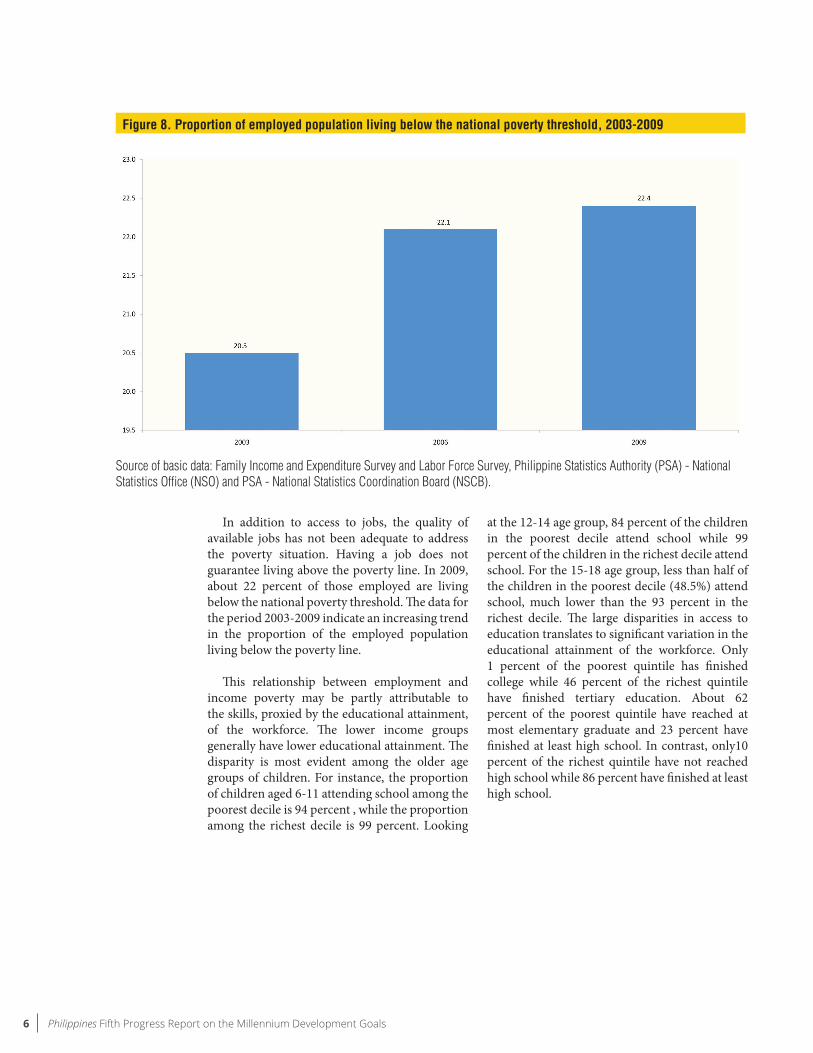
In addition to access to jobs, the quality of available jobs has not been adequate to address the poverty situation. Having a job does not guarantee living above the poverty line. In 2009, about 22 percent of those employed are living below the national poverty threshold. The data for the period 2003-2009 indicate an increasing trend in the proportion of the employed population living below the poverty line.
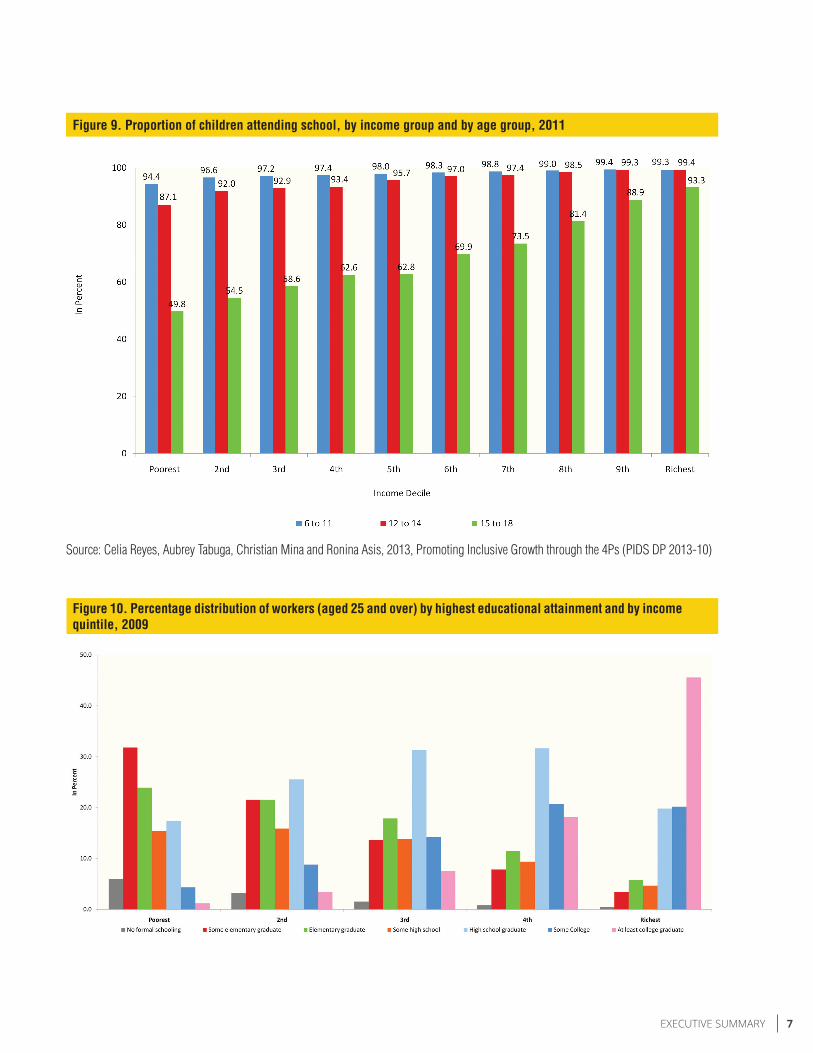
This relationship between employment and income poverty may be partly attributable to the skills, proxied by the educational attainment, of the workforce. The lower income groups generally have lower educational attainment. The disparity is most evident among the older age groups of children. For instance, the proportion of children aged 6-11 attending school among the poorest decile is 94 percent , while the proportion among the richest decile is 99 percent. Looking
at the 12-14 age group, 84 percent of the children in the poorest decile attend school while 99 percent of the children in the richest decile attend school. For the 15-18 age group, less than half of the children in the poorest decile (48.5%) attend school, much lower than the 93 percent in the richest decile. The large disparities in access to education translates to significant variation in the educational attainment of the workforce. Only 1 percent of the poorest quintile has finished college while 46 percent of the richest quintile have finished tertiary education. About 62 percent of the poorest quintile have reached at most elementary graduate and 23 percent have finished at least high school. In contrast, only10 percent of the richest quintile have not reached high school while 86 percent have finished at least high school.
Figure 8. Proportion of employed population living below the national poverty threshold, 2003-2009
Source of basic data: Family Income and Expenditure Survey and Labor Force Survey, Philippine Statistics Authority (PSA) - National Statistics Office (NSO) and PSA - National Statistics Coordination Board (NSCB).
7EXECUTIVE SUMMARY
Figure 9. Proportion of children attending school, by income group and by age group, 2011
Figure 10. Percentage distribution of workers (aged 25 and over) by highest educational attainment and by income quintile, 2009
Source: Celia Reyes, Aubrey Tabuga, Christian Mina and Ronina Asis, 2013, Promoting Inclusive Growth through the 4Ps (PIDS DP 2013-10)
8 Philippines Fifth Progress Report on the Millennium Development Goals
The less educated workers would dominate certain subsectors such as cultivation of coconut and copra making, seaweeds farming, inland fishing, and cultivation of fruits and nuts. They would not be working in the more productive, higher paying jobs such as in business process outsourcing (BPO), manufacture of electrical equipment, or in the financial sector.
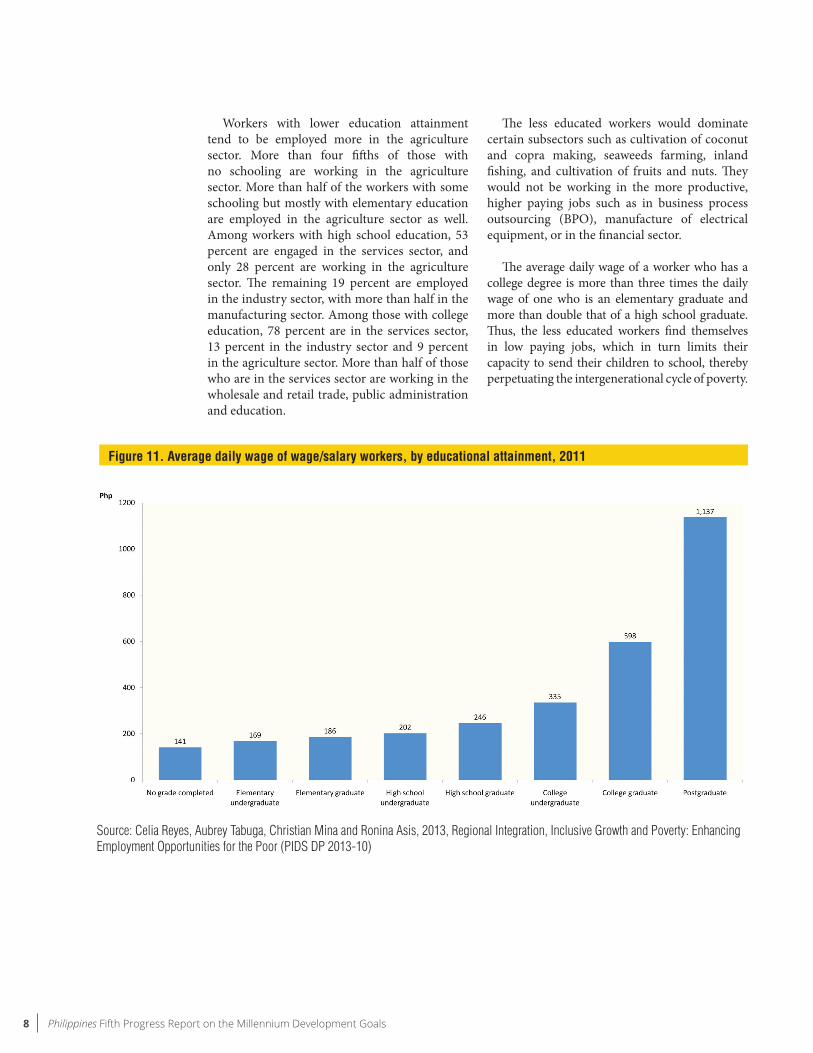
The average daily wage of a worker who has a college degree is more than three times the daily wage of one who is an elementary graduate and more than double that of a high school graduate. Thus, the less educated workers find themselves in low paying jobs, which in turn limits their capacity to send their children to school, thereby perpetuating the intergenerational cycle of poverty.
Workers with lower education attainment tend to be employed more in the agriculture sector. More than four fifths of those with no schooling are working in the agriculture sector. More than half of the workers with some schooling but mostly with elementary education are employed in the agriculture sector as well. Among workers with high school education, 53 percent are engaged in the services sector, and only 28 percent are working in the agriculture sector. The remaining 19 percent are employed in the industry sector, with more than half in the manufacturing sector. Among those with college education, 78 percent are in the services sector, 13 percent in the industry sector and 9 percent in the agriculture sector. More than half of those who are in the services sector are working in the wholesale and retail trade, public administration and education.
Figure 11. Average daily wage of wage/salary workers, by educational attainment, 2011
Source: Celia Reyes, Aubrey Tabuga, Christian Mina and Ronina Asis, 2013, Regional Integration, Inclusive Growth and Poverty: Enhancing Employment Opportunities for the Poor (PIDS DP 2013-10)
9EXECUTIVE SUMMARY
Impact of natural and man-made shocks
Based on the number of events, the Philippines is the third most disaster prone country in the world after Tonga and Vanuatu, according to the World Disasters Report 2012,. Moreover, the Philippines topped the list of countries with the most number of people killed by natural disasters in 2012. According to the EM-DAT: The OFDA/CRED International Disaster Database, 2,360 people died in the Philippines due to natural disasters, of which 1901 were attributed to Typhoon Pablo (international name Bopha) by CRED. According to the Citizens Disaster Response Center1, a total of 471 natural and human-induced disasters were reported in the Philippines in 2012. These led to loss of 1,615 lives, and affected about 12 million people, and caused over PhP 39.9 billion in economic damages. The number of disaster events recorded was 9 percent higher than in 2011.
Typhoon Pablo struck the Philippines in December 2012 and has been regarded as the typhoon with the greatest economic damage to the country up to that time. Earlier years also saw strong typhoons that resulted to significant losses in human lives, income and assets. In September 2009, Typhoon Ondoy (Ketsana) in 2009 brought the heaviest rainfall in Metro Manila and caused 464 deaths and PhP 11 billion in economic losses according to the National Disaster Risk Reduction and Management Council (NDRRMC). A few days after, Typhoon Pepeng (Parma) hit the country resulting to 465 deaths and more than PhP 27 billion in damages to infrastructure and agriculture. In October 2010, Typhoon Juan (Megi) claimed 26 lives and over PhP 8 billion in damages. Typhoon Pedring in September 2011 claimed 85 lives and almost PhP 16 billion worth of damages in infrastructure and agriculture. But it was Typhoon Sendong in December 2011 that proved to be one of the worst disasters to hit the country. It brought heavy rains that caused flash floods in Cagayan de Oro and nearby provinces that led to 1, 257 deaths and more than PhP 1 billion in damages.
On November 8, 2013, Supertyphoon Yolanda (Haiyan) caused massive storm surges that devastated parts of the country affecting about 16.1 million persons in 12, 139 barangays in 591
municipalities and 57 cities in 44 provinces in Regions IV-A, IV-B, V, VI, VII, VIII, X, XI and CARAGA. Of this, 4.1 million persons were displaced. The National Disaster Risk Reduction and Management Council reported that the provinces of Leyte, Eastern and Western Samar, Cebu, Capiz, Iloilo, Aklan and Palawan were badly hit. It estimated 6, 293 fatalities, 28,689 injured and 1,061 still missing as of April 3, 2014. Damages to agriculture and infrastructure and private properties reached almost PhP 40 billion. ADB estimated that it would have increased the national poverty incidence by 1.9 percentage points.
The National Economic and Development Authority (NEDA) has formulated the Reconstruction Assistance on Yolanda (RAY) to guide the recovery and reconstruction of the economy, lives, and livelihoods of people and communities in the areas affected by Yolanda. The plan aims to restore the economic and social conditions of the said areas at the very least to their pre-typhoon levels and to a higher level of disaster resilience. An estimated PhP 361 billion is required for shelter and resettlement, public infrastructure, education and health services, agriculture, livelihoods and enterprises and services, local government and social protection.
With climate change, it is expected that extreme weather events will be more frequent and more severe. Coupled with man-made shocks, these could push people into poverty and poor people into deeper poverty.
Implications on the MDGs
The disasters would affect the pace of progress towards the achievement of the MDGs and may even push back progress in some target areas. For instance, damages to crops and assets may lead people to lesser income and consequently, move them into poverty. Aside from bringing about hunger and malnutrition, disasters interrupt children’s schooling, especially when schools are used as evacuation centers. Moreover, families whose houses are damaged may lose access to safe water and sanitation and may force them to live in informal settlements.
Moreover, the physical damages brought about by these disasters increase current infrastructure shortages such as housing, schools and health
1 http://www.cdrc-phil.com/wp-content/uploads/2009/08/PDR-2012.pdf - accessed on April 14, 204.

10 Philippines Fifth Progress Report on the Millennium Development Goals
facilities. In the case of Yolanda, the private sector and the international community have been working with the Philippine government to address these shortages.
Unless recovery efforts are accelerated, the short-term impacts could extend over the long term as households adopt various coping mechanisms that may have lasting detrimental effects. Households may sell productive assets to address their consumption needs which consequently affects their capacity to earn in the future. Households may also forego seeking medical attention or children may permanently drop out of school, thereby adversely affecting future human capital.
The natural calamities and other man-made shocks would tend to move the non-poor into poverty and the poor into deeper poverty, thereby undermining poverty reduction efforts. Reyes et. al. (2011) show that during the period 2003-2009, some families were able to move out
of poverty but the slots they vacated have been filled up by the new poor. Thus, it would seem that there has been no change in the poverty incidence. Based on a panel dataset, 23.4 percent of the families in 2009 are classified as poor. Of these families, 47 percent are chronically poor or consistently poor all throughout 2003-2009. The rest were previously non-poor. The over-all poverty incidence in 2009 of 23.4 percent is not very different from the poverty incidence in 2003 of 23.1 percent. Yet, Figure 13 shows that there have been considerable movements in and out of poverty. This analysis highlights the importance of appropriate safety nets to help families from falling into poverty in times of shocks. With well-established safety nets that can be rolled out immediately after a shock, the non-poor need not fall into poverty and the poor will not fall deeper into poverty. Fewer transient poor would translate to a much lower poverty incidence, consisting mainly of the chronic poor.
Figure 12. Movements in and out of poverty, 2003-2009
11EXECUTIVE SUMMARY
Achievements towards the MDG targets
Some progress has been made in reducing extreme poverty but not fast enough to achieve the targeted rate of reduction. Sustained economic growth and more focused poverty reduction efforts are necessary to achieve the target of halving extreme poverty by 2015. Similarly, the prevalence of malnutrition has significantly declined since 1990 but the malnutrition rate of 20.2 percent in 2011 remains far from the target rate of 13.6 percent in 2015.
The Philippines is likely to meet its target of universal access to primary education. With greater resources being allocated to the education sector, the backlogs in classrooms, teachers and books are being addressed. However, the cohort survival and completion rates are still low and the quality of education still needs to be improved.
Gender disparities in education of political participation continue to be noted. Significant gains have been achieved in empowering girls and women. Girls consistently have higher rates in school participation, cohort survival and completion. There has also been an increase in the proportion of elective seats held by women, although still far from the desired 50 percent.
Infant and under-five mortality rates have been considerably reduced and the targets will likely be achieved by 2015. It is important to note, however, that neonatal mortality has only been reduced slightly and is very much linked with the low rate of delivery in facilities.
Data on maternal mortality ratio (MMR), based on either the NSO surveys or the Field Health Services Information System (FHSIS), do not show progress in recent years. It is unlikely that the target of reducing the MMR by three quarters, between 1990 and 2015, would be achieved. While the probability that a woman will die is low if she gives birth in a facility, only 55 percent of the births are delivered in facilities. Moreover, the total fertility rate has been going down but, a rising trend in teenage pregnancy and delivery has been observed.
Improvements in morbidity and mortality rates associated with malaria have been noted. In fact, 27 provinces have been declared as malaria-free in 2012 from only 13 provinces in 2004. Similarly, the incidence, prevalence and mortality rates associated with tuberculosis (TB) have declined considerably, although TB is still one of the leading causes of morbidity and mortality in the country. On the other hand, the number of new HIV cases has been increasing, although the HIV prevalence is estimated to still be less than one percent.
The country has already surpassed its target of halving the proportion of people with no access to basic sanitation. It is very likely to meet its target with regards access to safe water by 2015.
Recent developments indicate that the country will sustain its higher growth trajectory. This would mean faster progress as the people and the government would have more resources to meet its needs.
12 Philippines Fifth Progress Report on the Millennium Development Goals
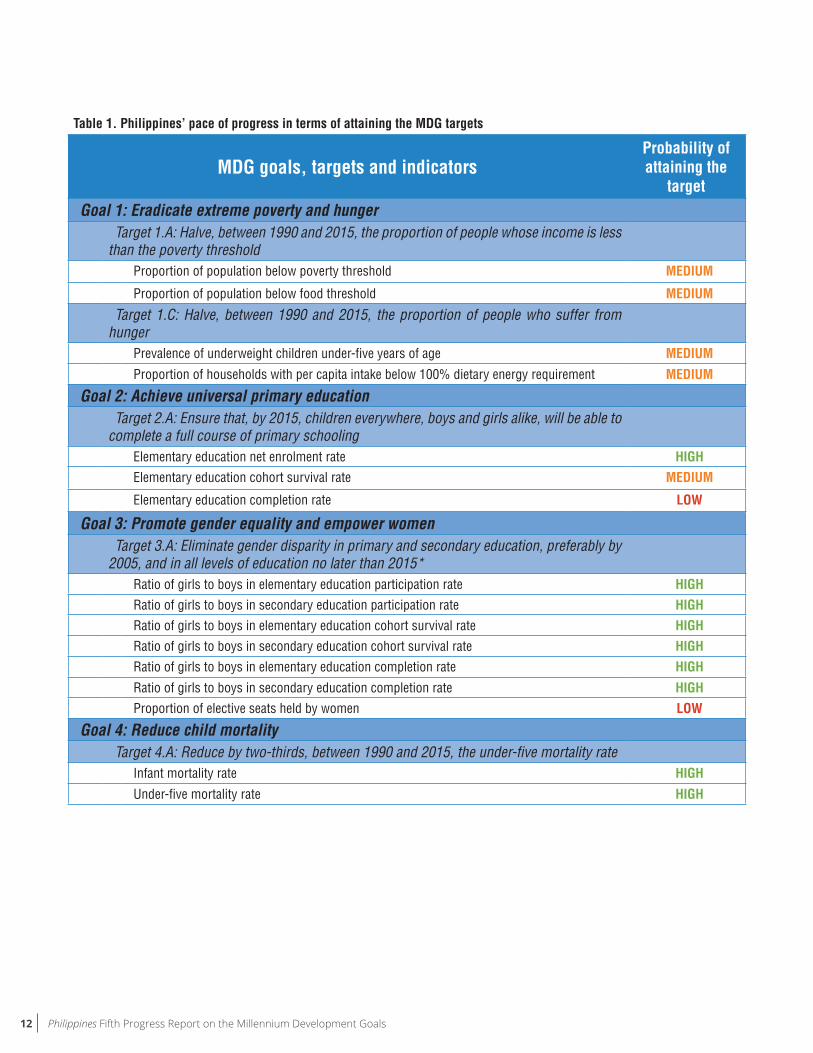
Table 1. Philippines’ pace of progress in terms of attaining the MDG targets
MDG goals, targets and indicatorsProbability of attaining the
targetGoal 1: Eradicate extreme poverty and hunger Target 1.A: Halve, between 1990 and 2015, the proportion of people whose income is less
than the poverty threshold
Proportion of population below poverty threshold MEDIUM
Proportion of population below food threshold MEDIUM
Target 1.C: Halve, between 1990 and 2015, the proportion of people who suffer from hunger
Prevalence of underweight children under-five years of age MEDIUM
Proportion of households with per capita intake below 100% dietary energy requirement MEDIUM
Goal 2: Achieve universal primary education Target 2.A: Ensure that, by 2015, children everywhere, boys and girls alike, will be able to
complete a full course of primary schooling
Elementary education net enrolment rate HIGH
Elementary education cohort survival rate MEDIUM
Elementary education completion rate LOW
Goal 3: Promote gender equality and empower women Target 3.A: Eliminate gender disparity in primary and secondary education, preferably by
2005, and in all levels of education no later than 2015*
Ratio of girls to boys in elementary education participation rate HIGH Ratio of girls to boys in secondary education participation rate HIGH Ratio of girls to boys in elementary education cohort survival rate HIGH Ratio of girls to boys in secondary education cohort survival rate HIGH Ratio of girls to boys in elementary education completion rate HIGH
Ratio of girls to boys in secondary education completion rate HIGHProportion of elective seats held by women LOW
Goal 4: Reduce child mortality Target 4.A: Reduce by two-thirds, between 1990 and 2015, the under-five mortality rate Infant mortality rate HIGH
Under-five mortality rate HIGH
13EXECUTIVE SUMMARY
MDG goals, targets and indicatorsProbability of attaining the
targetGoal 5: Improve maternal health Target 5.A: Reduce by three quarters, between 1990 and 2015, the maternal mortality
ratio
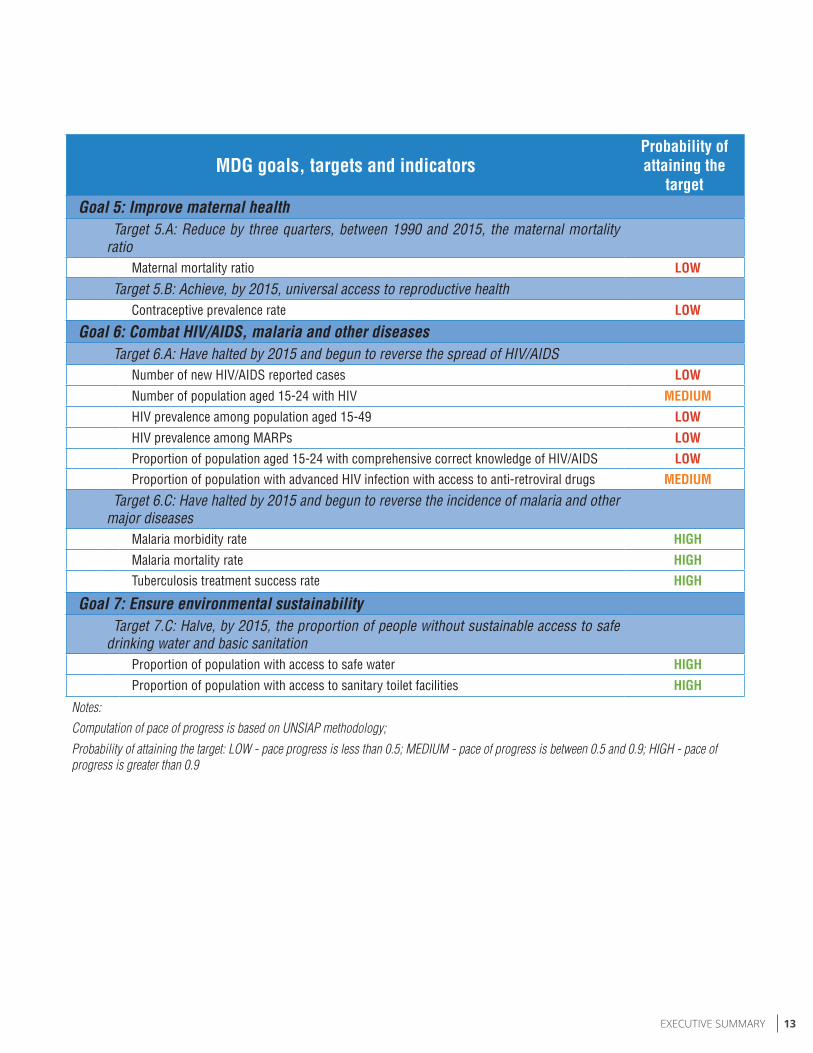
Maternal mortality ratio LOW
Target 5.B: Achieve, by 2015, universal access to reproductive health Contraceptive prevalence rate LOW
Goal 6: Combat HIV/AIDS, malaria and other diseases Target 6.A: Have halted by 2015 and begun to reverse the spread of HIV/AIDS Number of new HIV/AIDS reported cases LOW
Number of population aged 15-24 with HIV MEDIUM
HIV prevalence among population aged 15-49 LOW
HIV prevalence among MARPs LOW
Proportion of population aged 15-24 with comprehensive correct knowledge of HIV/AIDS LOW Proportion of population with advanced HIV infection with access to anti-retroviral drugs MEDIUM
Target 6.C: Have halted by 2015 and begun to reverse the incidence of malaria and other major diseases
Malaria morbidity rate HIGH
Malaria mortality rate HIGH Tuberculosis treatment success rate HIGH
Goal 7: Ensure environmental sustainability Target 7.C: Halve, by 2015, the proportion of people without sustainable access to safe
drinking water and basic sanitation
Proportion of population with access to safe water HIGH
Proportion of population with access to sanitary toilet facilities HIGH
Notes:
Computation of pace of progress is based on UNSIAP methodology;
Probability of attaining the target: LOW - pace progress is less than 0.5; MEDIUM - pace of progress is between 0.5 and 0.9; HIGH - pace of progress is greater than 0.9
14 Philippines Fifth Progress Report on the Millennium Development Goals
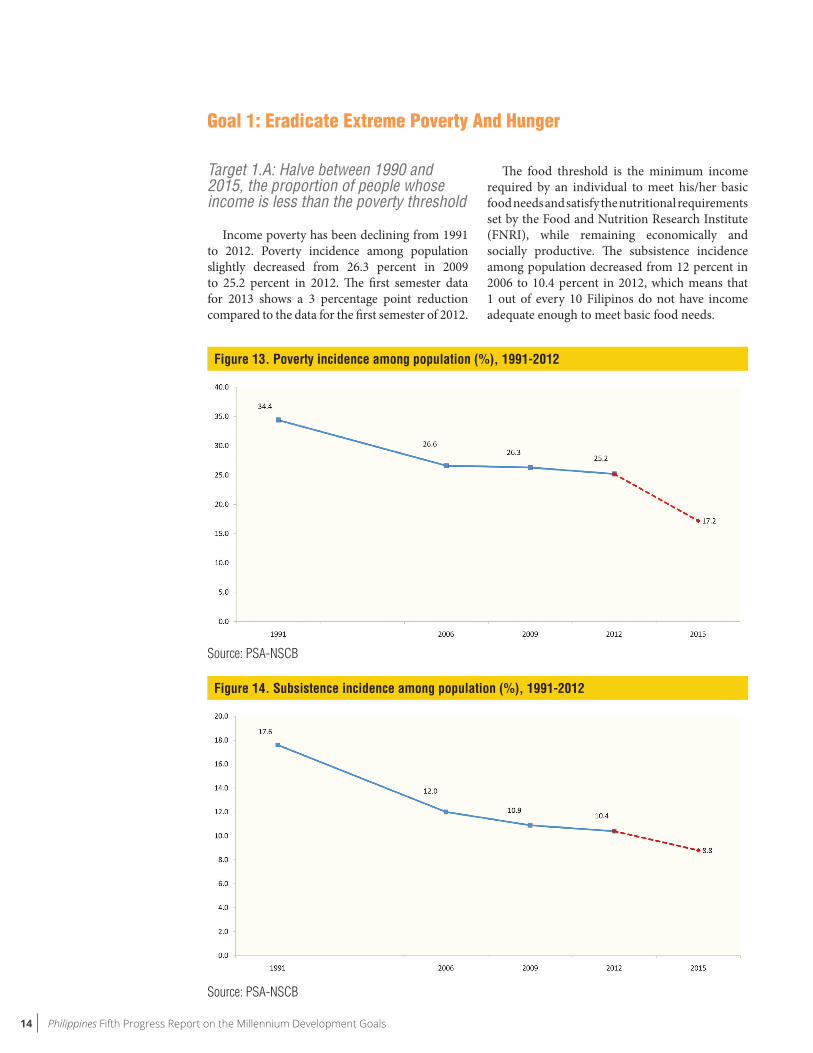
Target 1.A: Halve between 1990 and 2015, the proportion of people whose income is less than the poverty threshold
Income poverty has been declining from 1991 to 2012. Poverty incidence among population slightly decreased from 26.3 percent in 2009 to 25.2 percent in 2012. The first semester data for 2013 shows a 3 percentage point reduction compared to the data for the first semester of 2012.
Goal 1: Eradicate Extreme Poverty And Hunger
The food threshold is the minimum income required by an individual to meet his/her basic food needs and satisfy the nutritional requirements set by the Food and Nutrition Research Institute (FNRI), while remaining economically and socially productive. The subsistence incidence among population decreased from 12 percent in 2006 to 10.4 percent in 2012, which means that 1 out of every 10 Filipinos do not have income adequate enough to meet basic food needs.
Figure 14. Subsistence incidence among population (%), 1991-2012
Figure 13. Poverty incidence among population (%), 1991-2012
Source: PSA-NSCB
Source: PSA-NSCB
15EXECUTIVE SUMMARY
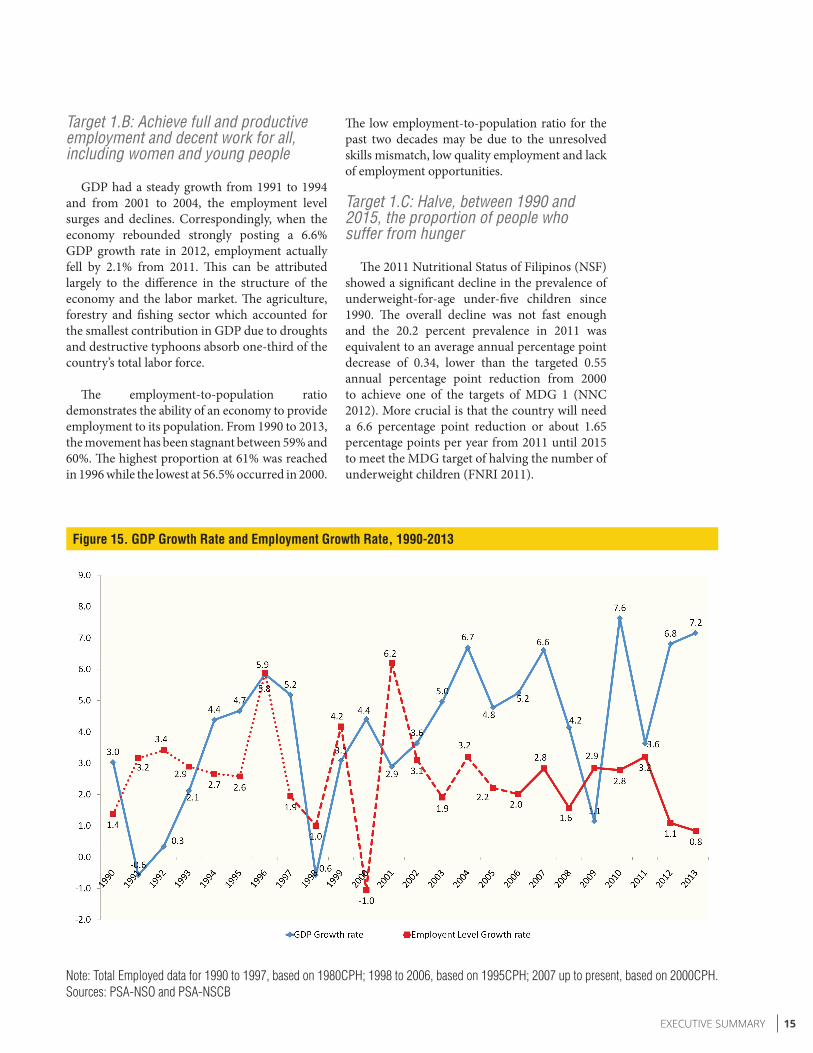
Target 1.B: Achieve full and productive employment and decent work for all, including women and young people
GDP had a steady growth from 1991 to 1994 and from 2001 to 2004, the employment level surges and declines. Correspondingly, when the economy rebounded strongly posting a 6.6% GDP growth rate in 2012, employment actually fell by 2.1% from 2011. This can be attributed largely to the difference in the structure of the economy and the labor market. The agriculture, forestry and fishing sector which accounted for the smallest contribution in GDP due to droughts and destructive typhoons absorb one-third of the country’s total labor force.
The employment-to-population ratio demonstrates the ability of an economy to provide employment to its population. From 1990 to 2013, the movement has been stagnant between 59% and 60%. The highest proportion at 61% was reached in 1996 while the lowest at 56.5% occurred in 2000.
The low employment-to-population ratio for the past two decades may be due to the unresolved skills mismatch, low quality employment and lack of employment opportunities.
Target 1.C: Halve, between 1990 and 2015, the proportion of people who suffer from hunger
The 2011 Nutritional Status of Filipinos (NSF) showed a significant decline in the prevalence of underweight-for-age under-five children since 1990. The overall decline was not fast enough and the 20.2 percent prevalence in 2011 was equivalent to an average annual percentage point decrease of 0.34, lower than the targeted 0.55 annual percentage point reduction from 2000 to achieve one of the targets of MDG 1 (NNC 2012). More crucial is that the country will need a 6.6 percentage point reduction or about 1.65 percentage points per year from 2011 until 2015 to meet the MDG target of halving the number of underweight children (FNRI 2011).
Figure 15. GDP Growth Rate and Employment Growth Rate, 1990-2013
Note: Total Employed data for 1990 to 1997, based on 1980CPH; 1998 to 2006, based on 1995CPH; 2007 up to present, based on 2000CPH. Sources: PSA-NSO and PSA-NSCB

16 Philippines Fifth Progress Report on the Millennium Development Goals
Figure 17. Trend (%) in the prevalence of underweight-for-age among children, under-five years old, for monitoring of MDG 1 using World Health Organization - Child Growth Standard (WHO-CGS): 1990-2011
Figure 16. Employment to Population Ratio, 1990-2013
Source: PSA-BLES
Source of basic data: National Science Fair 2011, Food and Nutrition Research and Institute (FNRI)
17EXECUTIVE SUMMARY
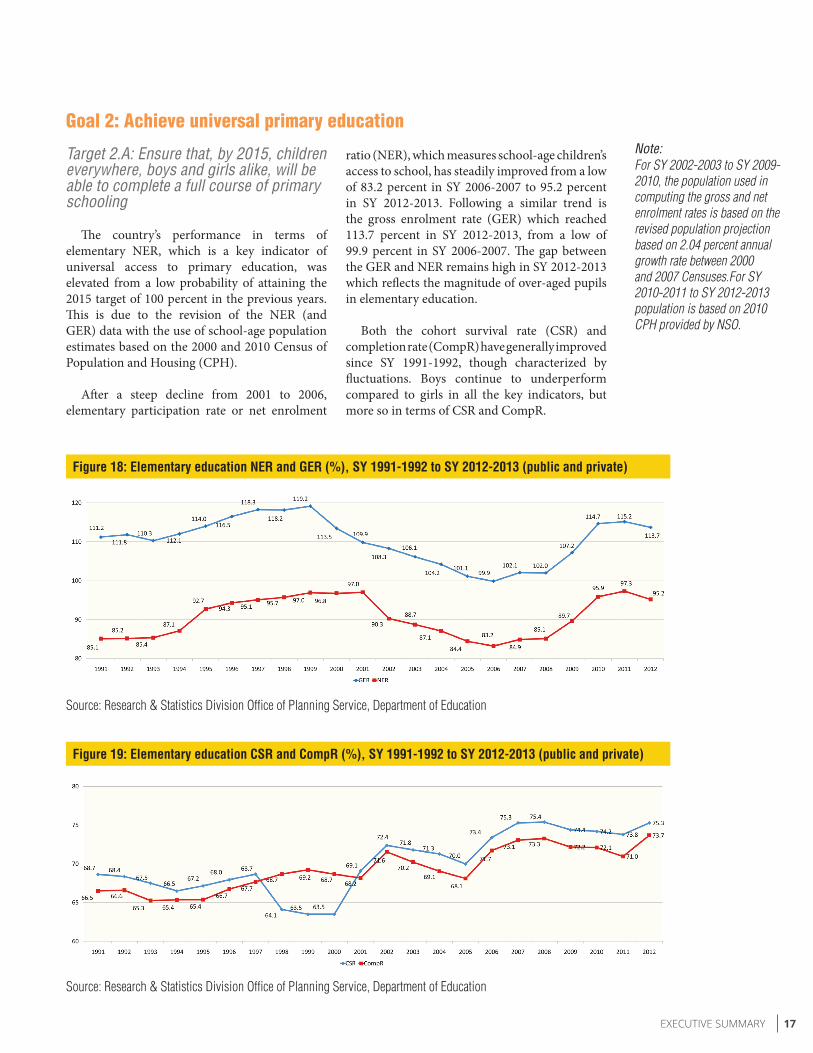
Target 2.A: Ensure that, by 2015, children everywhere, boys and girls alike, will be able to complete a full course of primary schooling
The country’s performance in terms of elementary NER, which is a key indicator of universal access to primary education, was elevated from a low probability of attaining the 2015 target of 100 percent in the previous years. This is due to the revision of the NER (and GER) data with the use of school-age population estimates based on the 2000 and 2010 Census of Population and Housing (CPH).
After a steep decline from 2001 to 2006, elementary participation rate or net enrolment
ratio (NER), which measures school-age children’s access to school, has steadily improved from a low of 83.2 percent in SY 2006-2007 to 95.2 percent in SY 2012-2013. Following a similar trend is the gross enrolment rate (GER) which reached 113.7 percent in SY 2012-2013, from a low of 99.9 percent in SY 2006-2007. The gap between the GER and NER remains high in SY 2012-2013 which reflects the magnitude of over-aged pupils in elementary education.
Both the cohort survival rate (CSR) and completion rate (CompR) have generally improved since SY 1991-1992, though characterized by fluctuations. Boys continue to underperform compared to girls in all the key indicators, but more so in terms of CSR and CompR.
Goal 2: Achieve universal primary education
Figure 18: Elementary education NER and GER (%), SY 1991-1992 to SY 2012-2013 (public and private)
Source: Research & Statistics Division Office of Planning Service, Department of Education
Figure 19: Elementary education CSR and CompR (%), SY 1991-1992 to SY 2012-2013 (public and private)
Source: Research & Statistics Division Office of Planning Service, Department of Education
Note: For SY 2002-2003 to SY 2009-2010, the population used in computing the gross and net enrolment rates is based on the revised population projection based on 2.04 percent annual growth rate between 2000 and 2007 Censuses.For SY 2010-2011 to SY 2012-2013 population is based on 2010 CPH provided by NSO.

18 Philippines Fifth Progress Report on the Millennium Development Goals
Target 3.A: Eliminate gender disparity in primary and secondary education, preferably by 2005, and in all levels of education no later than 2015
Goal 3: Promote gender equality and empower women
Figure 20. Ratio of girls to boys in elementary education, 1996-2012
Source of basic data: Research & Statistics Division Office of Planning Service, Department of Education
Figure 21. Ratio of girls to boys in secondary education, 1996-2012
Education indicators continue to lean towards girls as basic education data show that girls nearly surpass boys in formal basic education. The ratio of girls to boys in elementary education is consistently at less than 1.0 from 1996 to 2012. In secondary education, girls had consistently outnumbered boys.
19EXECUTIVE SUMMARY
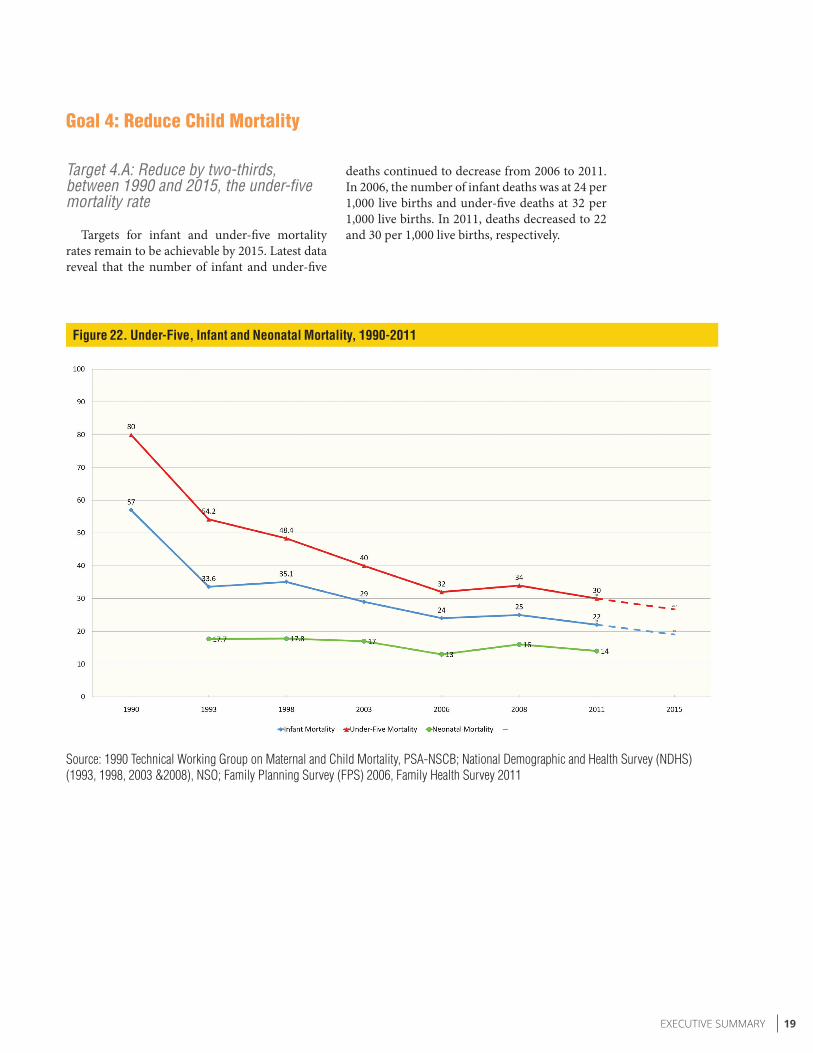
Target 4.A: Reduce by two-thirds, between 1990 and 2015, the under-five mortality rate
Targets for infant and under-five mortality rates remain to be achievable by 2015. Latest data reveal that the number of infant and under-five
deaths continued to decrease from 2006 to 2011. In 2006, the number of infant deaths was at 24 per 1,000 live births and under-five deaths at 32 per 1,000 live births. In 2011, deaths decreased to 22 and 30 per 1,000 live births, respectively.
Goal 4: Reduce Child Mortality
Figure 22. Under-Five, Infant and Neonatal Mortality, 1990-2011
Source: 1990 Technical Working Group on Maternal and Child Mortality, PSA-NSCB; National Demographic and Health Survey (NDHS) (1993, 1998, 2003 &2008), NSO; Family Planning Survey (FPS) 2006, Family Health Survey 2011
20 Philippines Fifth Progress Report on the Millennium Development Goals
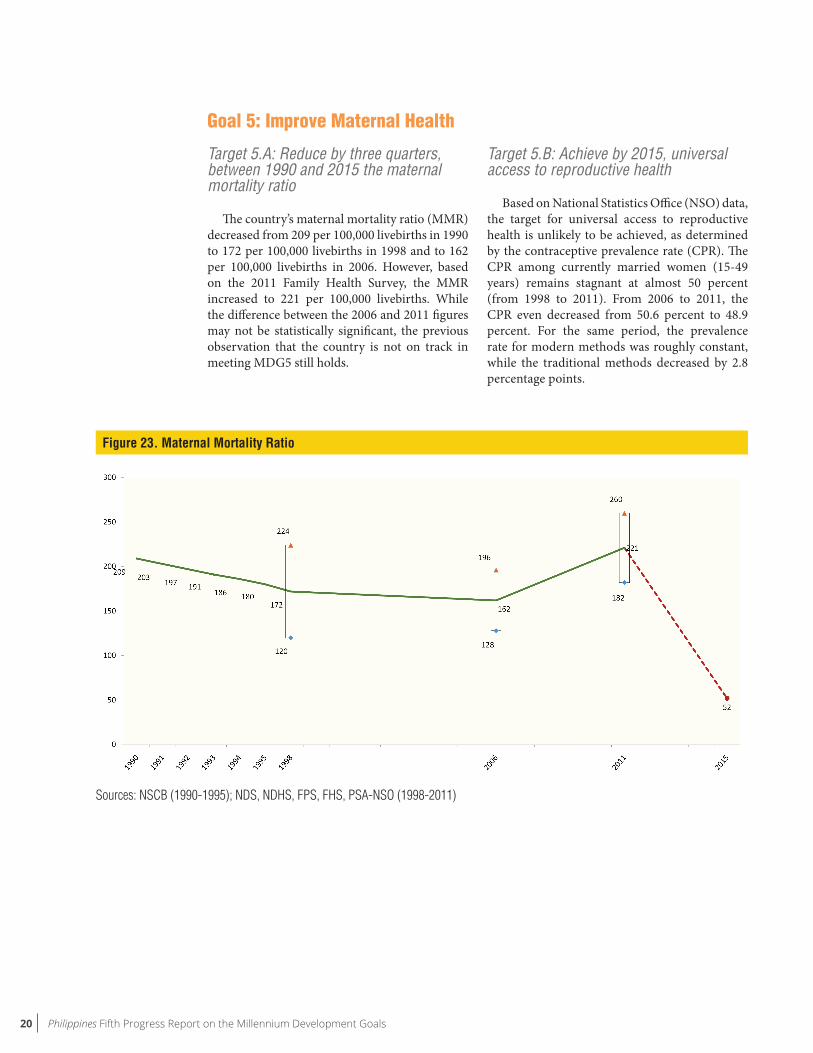
Target 5.A: Reduce by three quarters, between 1990 and 2015 the maternal mortality ratio
The country’s maternal mortality ratio (MMR) decreased from 209 per 100,000 livebirths in 1990 to 172 per 100,000 livebirths in 1998 and to 162 per 100,000 livebirths in 2006. However, based on the 2011 Family Health Survey, the MMR increased to 221 per 100,000 livebirths. While the difference between the 2006 and 2011 figures may not be statistically significant, the previous observation that the country is not on track in meeting MDG5 still holds.
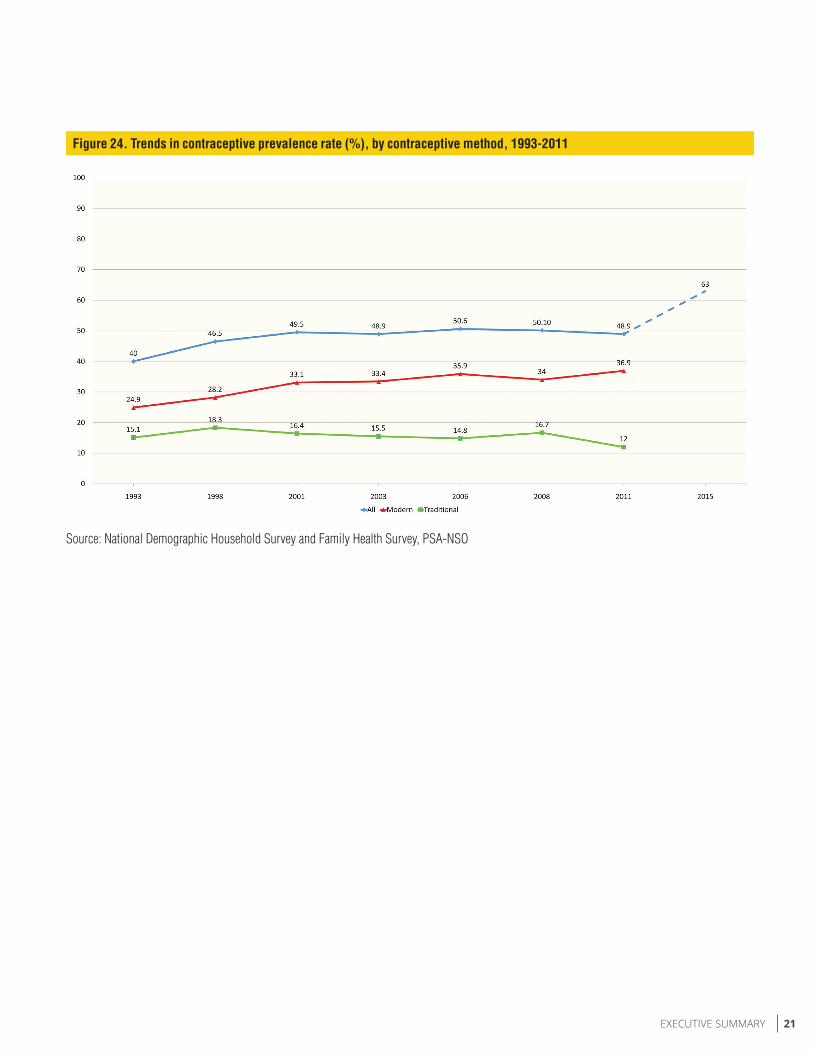
Target 5.B: Achieve by 2015, universal access to reproductive health
Based on National Statistics Office (NSO) data, the target for universal access to reproductive health is unlikely to be achieved, as determined by the contraceptive prevalence rate (CPR). The CPR among currently married women (15-49 years) remains stagnant at almost 50 percent (from 1998 to 2011). From 2006 to 2011, the CPR even decreased from 50.6 percent to 48.9 percent. For the same period, the prevalence rate for modern methods was roughly constant, while the traditional methods decreased by 2.8 percentage points.
Goal 5: Improve Maternal Health
Figure 23. Maternal Mortality Ratio
Sources: NSCB (1990-1995); NDS, NDHS, FPS, FHS, PSA-NSO (1998-2011)
21EXECUTIVE SUMMARY
Figure 24. Trends in contraceptive prevalence rate (%), by contraceptive method, 1993-2011
Source: National Demographic Household Survey and Family Health Survey, PSA-NSO
22 Philippines Fifth Progress Report on the Millennium Development Goals
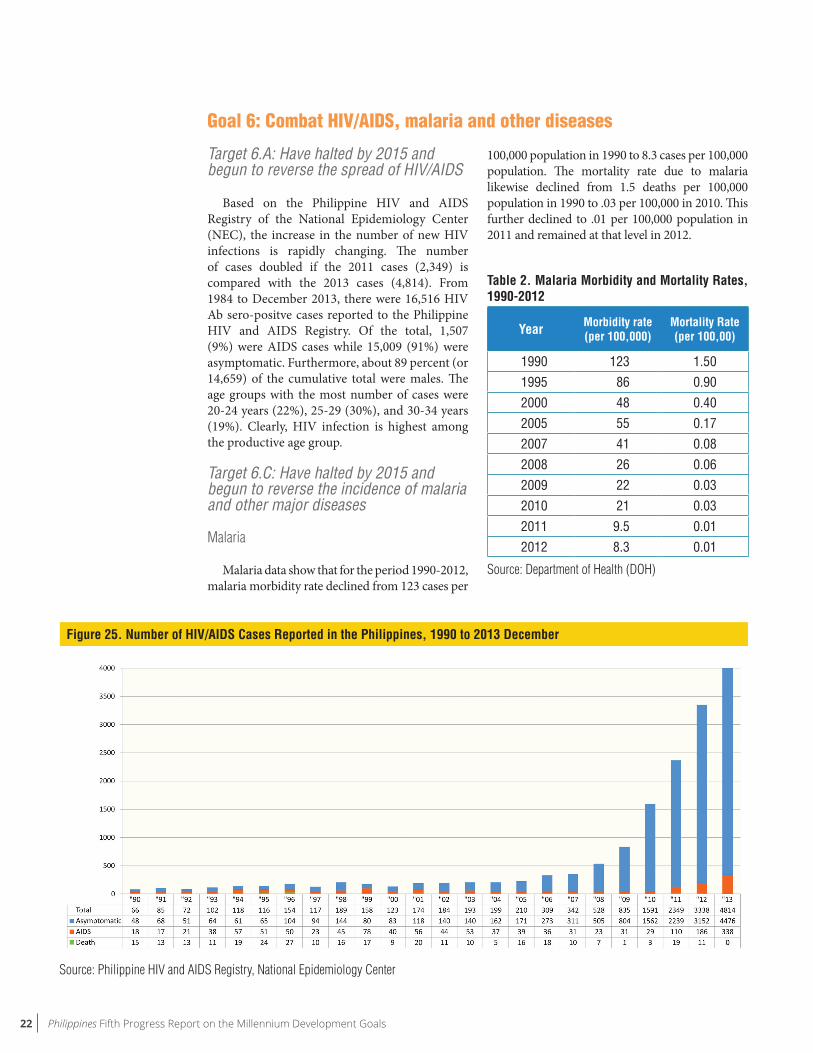
Target 6.A: Have halted by 2015 and begun to reverse the spread of HIV/AIDS
Based on the Philippine HIV and AIDS Registry of the National Epidemiology Center (NEC), the increase in the number of new HIV infections is rapidly changing. The number of cases doubled if the 2011 cases (2,349) is compared with the 2013 cases (4,814). From 1984 to December 2013, there were 16,516 HIV Ab sero-positve cases reported to the Philippine HIV and AIDS Registry. Of the total, 1,507 (9%) were AIDS cases while 15,009 (91%) were asymptomatic. Furthermore, about 89 percent (or 14,659) of the cumulative total were males. The age groups with the most number of cases were 20-24 years (22%), 25-29 (30%), and 30-34 years (19%). Clearly, HIV infection is highest among the productive age group.
Target 6.C: Have halted by 2015 and begun to reverse the incidence of malaria and other major diseases
Malaria
Malaria data show that for the period 1990-2012, malaria morbidity rate declined from 123 cases per
100,000 population in 1990 to 8.3 cases per 100,000 population. The mortality rate due to malaria likewise declined from 1.5 deaths per 100,000 population in 1990 to .03 per 100,000 in 2010. This further declined to .01 per 100,000 population in 2011 and remained at that level in 2012.
Goal 6: Combat HIV/AIDS, malaria and other diseases
Figure 25. Number of HIV/AIDS Cases Reported in the Philippines, 1990 to 2013 December
Source: Philippine HIV and AIDS Registry, National Epidemiology Center
Table 2. Malaria Morbidity and Mortality Rates, 1990-2012
Year Morbidity rate (per 100,000)
Mortality Rate (per 100,00)
1990 123 1.501995 86 0.902000 48 0.402005 55 0.172007 41 0.082008 26 0.062009 22 0.032010 21 0.032011 9.5 0.012012 8.3 0.01
Source: Department of Health (DOH)
23EXECUTIVE SUMMARY
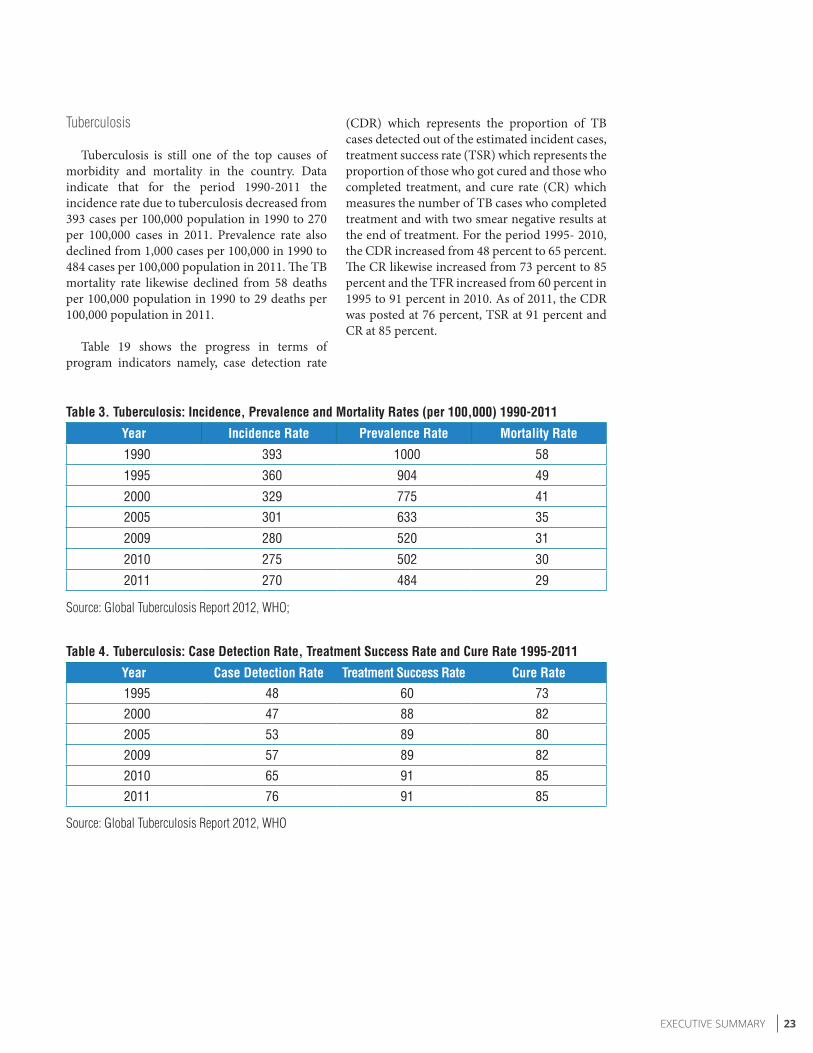
Tuberculosis
Tuberculosis is still one of the top causes of morbidity and mortality in the country. Data indicate that for the period 1990-2011 the incidence rate due to tuberculosis decreased from 393 cases per 100,000 population in 1990 to 270 per 100,000 cases in 2011. Prevalence rate also declined from 1,000 cases per 100,000 in 1990 to 484 cases per 100,000 population in 2011. The TB mortality rate likewise declined from 58 deaths per 100,000 population in 1990 to 29 deaths per 100,000 population in 2011.
Table 19 shows the progress in terms of program indicators namely, case detection rate
Table 3. Tuberculosis: Incidence, Prevalence and Mortality Rates (per 100,000) 1990-2011
Year Incidence Rate Prevalence Rate Mortality Rate
1990 393 1000 58
1995 360 904 49
2000 329 775 412005 301 633 35
2009 280 520 31
2010 275 502 30
2011 270 484 29
Source: Global Tuberculosis Report 2012, WHO;
Table 4. Tuberculosis: Case Detection Rate, Treatment Success Rate and Cure Rate 1995-2011
Year Case Detection Rate Treatment Success Rate Cure Rate1995 48 60 732000 47 88 822005 53 89 802009 57 89 822010 65 91 852011 76 91 85
Source: Global Tuberculosis Report 2012, WHO
(CDR) which represents the proportion of TB cases detected out of the estimated incident cases, treatment success rate (TSR) which represents the proportion of those who got cured and those who completed treatment, and cure rate (CR) which measures the number of TB cases who completed treatment and with two smear negative results at the end of treatment. For the period 1995- 2010, the CDR increased from 48 percent to 65 percent. The CR likewise increased from 73 percent to 85 percent and the TFR increased from 60 percent in 1995 to 91 percent in 2010. As of 2011, the CDR was posted at 76 percent, TSR at 91 percent and CR at 85 percent.
24 Philippines Fifth Progress Report on the Millennium Development Goals
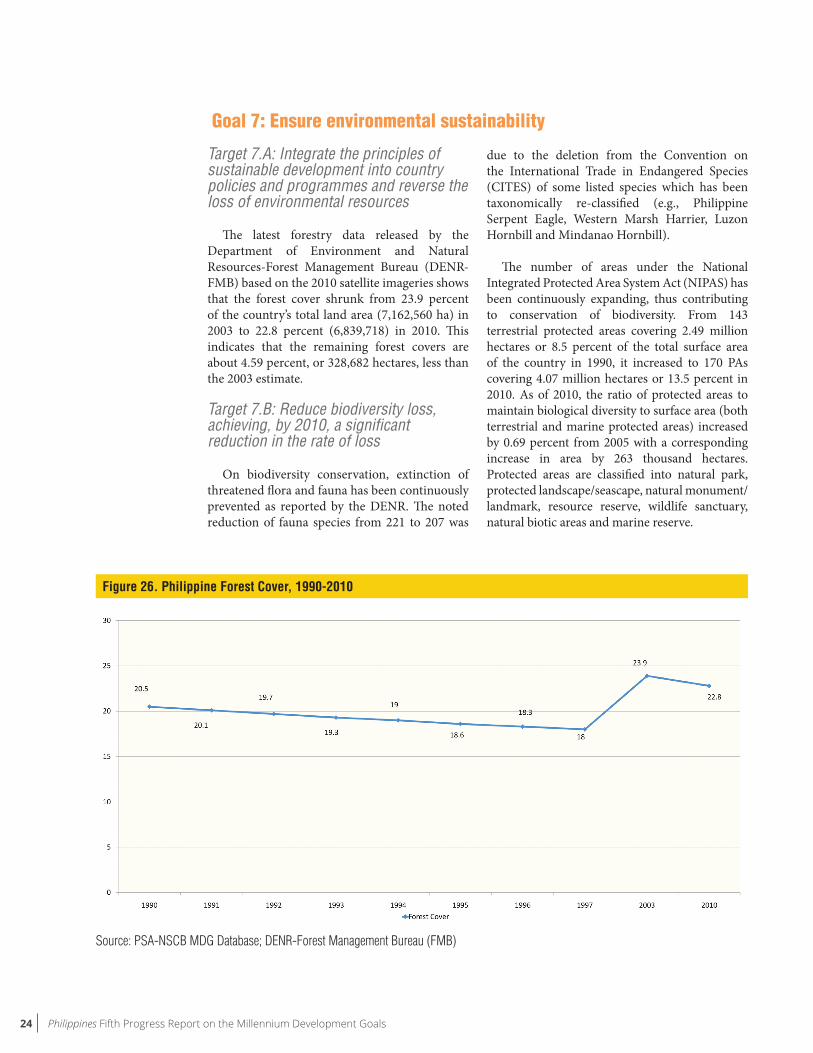
Target 7.A: Integrate the principles of sustainable development into country policies and programmes and reverse the loss of environmental resources
The latest forestry data released by the Department of Environment and Natural Resources-Forest Management Bureau (DENR-FMB) based on the 2010 satellite imageries shows that the forest cover shrunk from 23.9 percent of the country’s total land area (7,162,560 ha) in 2003 to 22.8 percent (6,839,718) in 2010. This indicates that the remaining forest covers are about 4.59 percent, or 328,682 hectares, less than the 2003 estimate.
Target 7.B: Reduce biodiversity loss, achieving, by 2010, a significant reduction in the rate of loss
On biodiversity conservation, extinction of threatened flora and fauna has been continuously prevented as reported by the DENR. The noted reduction of fauna species from 221 to 207 was
due to the deletion from the Convention on the International Trade in Endangered Species (CITES) of some listed species which has been taxonomically re-classified (e.g., Philippine Serpent Eagle, Western Marsh Harrier, Luzon Hornbill and Mindanao Hornbill).
The number of areas under the National Integrated Protected Area System Act (NIPAS) has been continuously expanding, thus contributing to conservation of biodiversity. From 143 terrestrial protected areas covering 2.49 million hectares or 8.5 percent of the total surface area of the country in 1990, it increased to 170 PAs covering 4.07 million hectares or 13.5 percent in 2010. As of 2010, the ratio of protected areas to maintain biological diversity to surface area (both terrestrial and marine protected areas) increased by 0.69 percent from 2005 with a corresponding increase in area by 263 thousand hectares. Protected areas are classified into natural park, protected landscape/seascape, natural monument/landmark, resource reserve, wildlife sanctuary, natural biotic areas and marine reserve.
Goal 7: Ensure environmental sustainability
Figure 26. Philippine Forest Cover, 1990-2010
Source: PSA-NSCB MDG Database; DENR-Forest Management Bureau (FMB)

25EXECUTIVE SUMMARY
Figure 27. Number of Threatened Wildlife Species
* Based on DENR Administrative Order No. 2004-15 re National List of Threatened Fauna and 2011 CITES listed species** Based on DENR Administrative Order No. 2007-01 re National List of Threatened Philippine Plants
Figure 28. Ratio of area protected to maintain biological diversity to surface area (terrestrial and marine protected areas)
Source: Protected Areas and Wildlife Bureau, Department of Environment and Natural Resources
26 Philippines Fifth Progress Report on the Millennium Development Goals
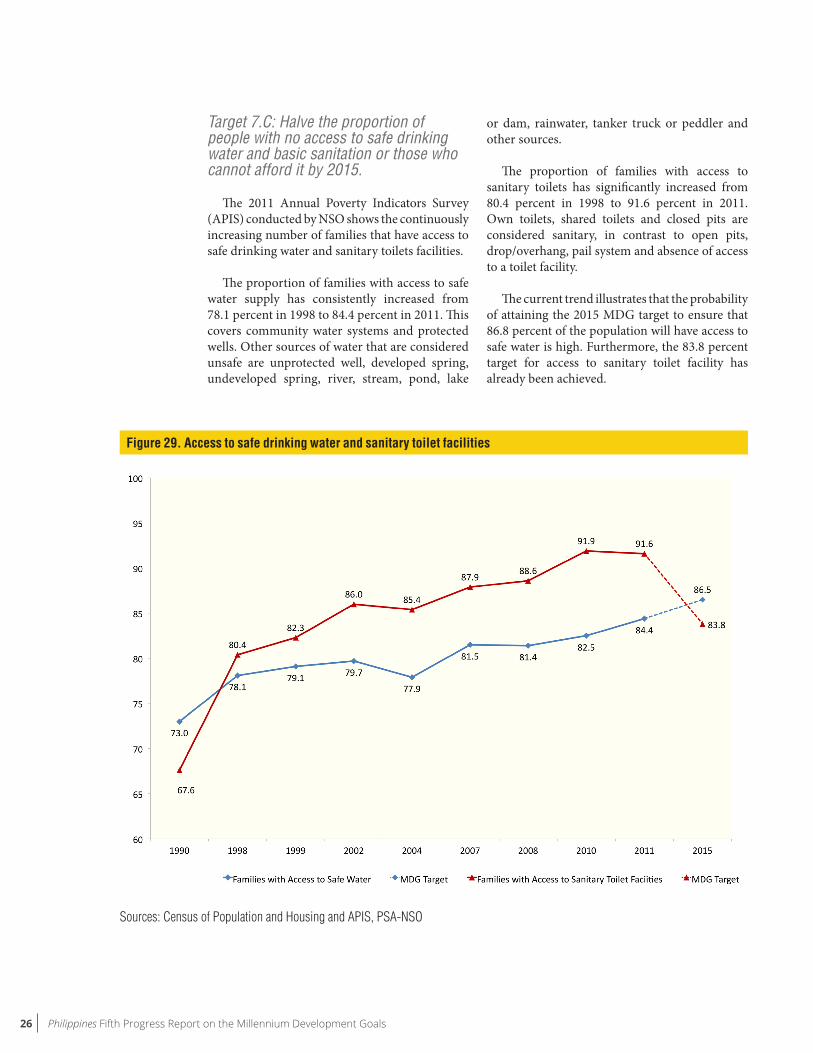
Target 7.C: Halve the proportion of people with no access to safe drinking water and basic sanitation or those who cannot afford it by 2015.
The 2011 Annual Poverty Indicators Survey (APIS) conducted by NSO shows the continuously increasing number of families that have access to safe drinking water and sanitary toilets facilities.
The proportion of families with access to safe water supply has consistently increased from 78.1 percent in 1998 to 84.4 percent in 2011. This covers community water systems and protected wells. Other sources of water that are considered unsafe are unprotected well, developed spring, undeveloped spring, river, stream, pond, lake
or dam, rainwater, tanker truck or peddler and other sources.
The proportion of families with access to sanitary toilets has significantly increased from 80.4 percent in 1998 to 91.6 percent in 2011. Own toilets, shared toilets and closed pits are considered sanitary, in contrast to open pits, drop/overhang, pail system and absence of access to a toilet facility.
The current trend illustrates that the probability of attaining the 2015 MDG target to ensure that 86.8 percent of the population will have access to safe water is high. Furthermore, the 83.8 percent target for access to sanitary toilet facility has already been achieved.
Figure 29. Access to safe drinking water and sanitary toilet facilities
Sources: Census of Population and Housing and APIS, PSA-NSO

27EXECUTIVE SUMMARY
Target 7.D: By 2020, to have achieved a significant improvement in the lives of at least 100 million slum dwellers
The United Nations defines the proportion of urban population living in slums as the proportion of urban population living in households lacking one or more of the following conditions: (a) access to improved water; (b) access to improved sanitation; (c) sufficient living area; (d) durability
of housing; and (e) security of tenure. Based on this definition, the proportion of urban population living in slum areas in the Philippines has been estimated and shows a declining trend from 54.3 percent in 1990 to about 40.9 percent in 2009 (Figure 86). However, while the proportion is declining over time, the magnitude of the slum dwellers has steadily increased from 16.47 million in 1991 to about 18.30 million in 2009.
Figure 30. Proportion of urban population living in slum areas (%), 1990-2009
Source: State of the World’s Cities 2012/2013, UN Habitat
Figure 31. Urban slum population in the Philippines, 1990-2009
Source: State of the World’s Cities 2012/2013, UN Habitat
28 Philippines Fifth Progress Report on the Millennium Development Goals
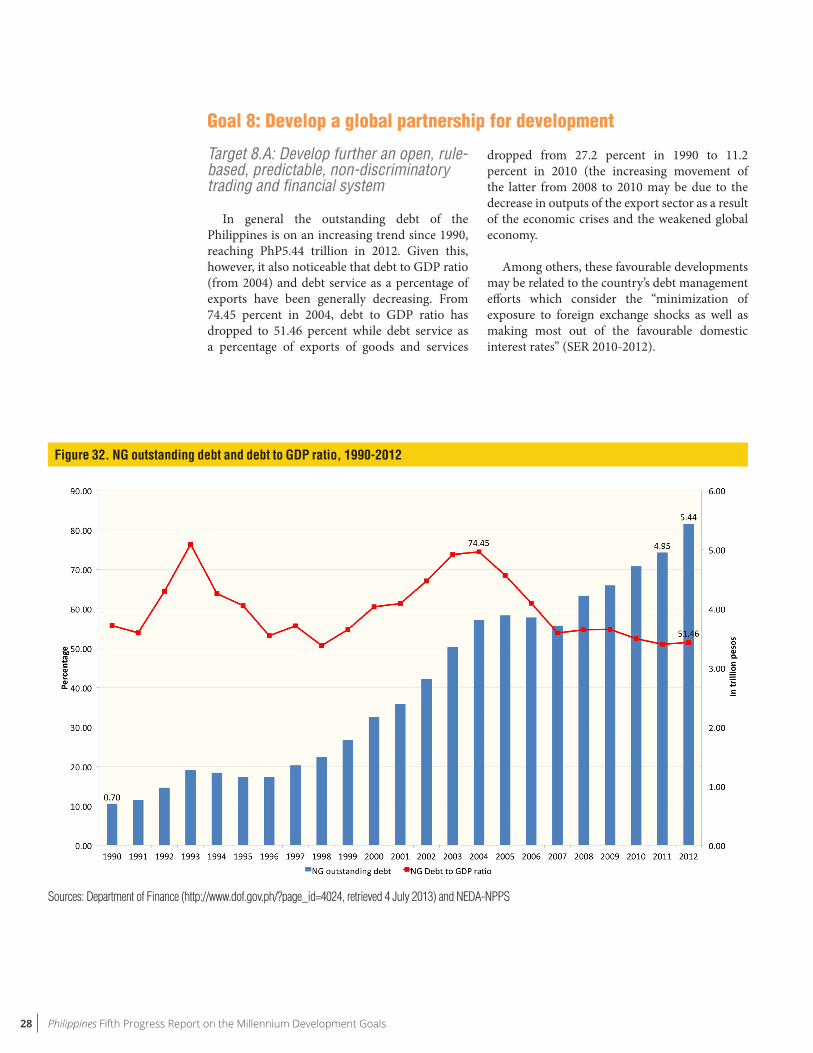
Target 8.A: Develop further an open, rule-based, predictable, non-discriminatory trading and financial system
In general the outstanding debt of the Philippines is on an increasing trend since 1990, reaching PhP5.44 trillion in 2012. Given this, however, it also noticeable that debt to GDP ratio (from 2004) and debt service as a percentage of exports have been generally decreasing. From 74.45 percent in 2004, debt to GDP ratio has dropped to 51.46 percent while debt service as a percentage of exports of goods and services
dropped from 27.2 percent in 1990 to 11.2 percent in 2010 (the increasing movement of the latter from 2008 to 2010 may be due to the decrease in outputs of the export sector as a result of the economic crises and the weakened global economy.
Among others, these favourable developments may be related to the country’s debt management efforts which consider the “minimization of exposure to foreign exchange shocks as well as making most out of the favourable domestic interest rates” (SER 2010-2012).
Figure 32. NG outstanding debt and debt to GDP ratio, 1990-2012
Sources: Department of Finance (http://www.dof.gov.ph/?page_id=4024, retrieved 4 July 2013) and NEDA-NPPS
Goal 8: Develop a global partnership for development

29EXECUTIVE SUMMARY
Figure 33. Debt service as a percentage of exports of goods and services, 1990-2010
Source: PSA-NSCB

30 Philippines Fifth Progress Report on the Millennium Development Goals