aigl greenbook april11 online
TRANSCRIPT

7/30/2019 AIGL GreenBook April11 Online
http://slidepdf.com/reader/full/aigl-greenbook-april11-online 1/9
VOLUME 16 NUMBER 1 APRIL 2011
AMERICAN JERSEY CATTLE ASSOCIATION
JERSEY
GENETIC
SUMMARY
USJersey

7/30/2019 AIGL GreenBook April11 Online
http://slidepdf.com/reader/full/aigl-greenbook-april11-online 2/9
For the past year, there have been two kinds of genetic evaluations for Jersey cows:
one for those that have been genotyped, another for those that have not—making it impossible to
accurately compare genomic PTAs against traditional PTAs.
A year ago in April, AIPL geneticists addressed the long-standing problem of over-evaluating cow genetic merit by applying what they had learned from the development of genomic evaluations to remove the bias in PAs for yield traits, starting with genomic-tested cows and heifers. Tis was a signicant advance. Reliability improved. Cow information was madeavailable for further development of genomic predictions. Te adjustments, however, put genotyped females on a dierent
genetic scale. For the past 12 months, it has not been possible to fairly compare genomic PAs against traditional PAs.
Fast-forward 12 months, and the sta at AIPL has completed the task they set out to accomplish. Procedures wereimplemented for the April evaluations that better measure true genetic merit for all Jersey cows and allow for faircomparisons of genotyped and non-genotyped cows.
In an interview for “Tis Month in Jersey Genomics” aired March 16 (available online at http://vimeo.com/21125569), Dr.Bennet Cassell of Virginia ech talked about the steps in the new evaluation procedures and why they were needed.
“If you compare a cow and a bull that have similar information about their own merit, (research showed) we made moreextreme estimates of cow merit from a similar kind or amount of information. So the rst adjustment is based on thereliability of the individual performance information in a cow’s PA and it changes the variance of that PA to be morelike bulls that have similar information. Te second step adjusts for dierences between the pedigree merit of that cow andthe pedigree merit of all cows born in the same birthyear. Again, it’s based on research. Cows that weremuch dierent from the year-of-birth average had moreextreme estimates of genetic merit than bulls that hada similar deviation from the year-of-birth average inpedigree merit. (With these adjustments) we’re bringing our extreme PAs more toward the middle ground. We’re less willing to declare cows exceptionally good orexceptionally bad with this new procedure.”
“Tis is a change that is going to aect all the cows inthe population,” as shown in able 1. “You will see changes in individual cows,” Cassell continued. “Tere’s simply no way to generalize what (owners) are going to see in all cases. Tere are just too many cows and too many circumstances.”
“Cows that don’t have genomic evaluations, that have pedigree merit that is typical at the time that cow was born, are notgoing to be adjusted very much in many cases,” he observed. “Adjustments are not expected to be very large, except foranimals that are more towards the extreme for pedigreemerit within any given year of birth, or for animals thathave unusually high or low estimates of Yield Deviationscompared to the amount of information available.Keep in mind, these are the cows that are towards theextreme of the distribution and they are the ones that wetended to over-estimate their genetic merit based on ourtraditional systems.”
Te overall eect is that it is now possible to compare
genotyped and non-genotyped cows more fairly than was possible in 2010. Tis is well illustrated in able 2, which compares the published traditional and genomicPAs of the op 200 Jersey cows and op 500 Jersey heifers for April 2011.
Dr. Cassell tackles this subject in his column for the March 25 Hoard’s Dairyman, and in a technical article co-authored withDr. George Wiggans posted on the AIPL web site (see Table 1 for link). “It’s important that we remember the purpose of theseadjustments,” he concluded, “and that is to make the genetic evaluations of our females more accurate and more useful.”
Oh, and another thing. “One of the by-products of doing this is that we are going to add value to elite animals—even morevalue than has been added in the last year.”
Table 1. Comparison of December 2010 PTA milk of top 100 non-genotyped cows and top 100 genotyped cows with their Apri
2011 PTA milk using the new adjustment procedure.
December 2010 April 2011 Change
Non-genotyped 1,718 1,507 –211
Genotyped 1,263 1,421 +158
Source: AnimalImprovementProgramsLaboratory,ARS-USDA.Forbackground,see“AdjustmentsmakeallcowPTAssimilartothoseongenomically
testedcows,”http://aipl.arsusda.gov/publish/other/2011/ADJ_article.htm
Table 2. Comparison of April 2011 PTA averages of the Top 200 non
genotyped and genotyped cows and Top 500 non-genotyped and
genotyped heifers.
Milk Fat Protein JPITM Rel%
Top 200 GJPI Cows 1,098 56 43 187 65
Top 200 JPI Cows 1,019 55 40 165 53
Difference 79 1 3 23 12
Top 500 GJPI Heifers 1,058 55 40 184 50
Top 500 JPI Heifers 1,076 53 39 173 31
Difference -18 2 1 11 19
Source: Research&GeneticDevelopment,AmericanJerseyCattleAssociation
2

7/30/2019 AIGL GreenBook April11 Online
http://slidepdf.com/reader/full/aigl-greenbook-april11-online 3/9
JERSEY GENETIC SUMMARY
SECTION I. BACKGROUND INFORMATION
About the Jersey Performance Index™ (JPI) ......................................................................................... 5Active A.I. Bull Averages (Table 2) ....................................................................................................... 4
Average PTAs for All Bulls, April, 2011 Evaluations (Table 1) ............................................................ 4
Comparison of Genetic Evaluations for A.I. and Non-A.I. Sires (Table 1) ........................................... 4
Explanation of Headings for Production and Type Summaries ............................................................. 7
Glossary of Terms .................................................................................................................................. 4
Heifer Percentile Ranking Levels (P-Levels)......................................................................................... 7
Heritability Estimates of Selected Traits (Table 3) ................................................................................ 4
Stud Code Index................................................................................................................................. 157
SECTION II. ACTIVE A.I. BULLS AND BULLS MARKETED IN THE U.S.
Active A.I. Bulls with Minimum 70% Reliability (PTA Protein), Production and Type ....................... 8
Active A.I. and Foreign Bulls Marketed in the U.S., Ranked by Jersey Performance IndexTM.....................12
Genomic Tested (Code G) Bulls Without Daughters ........................................................................... 18
Codes A, F and G Bulls Marketed with Yield Deviation and Parent Average ..................................... 22
Codes A, F and G Bulls Marketed with Sire, Maternal Grandsire and Expected Future Inbreeding.. 27
Three Generation Potential Matings with Resulting Inbreeding Levels .............................................. 32
Regional JPITM for Active A.I. and Foreign Bulls ................................................................................ 33
Top Ten Bulls Ranked for Yield, Fitness and Type Traits ..................................................................... 36
Bulls Marketed in the U.S. listed in NAAB Stud Code Order ............................................................. 38
Bulls Marketed in the U.S. listed in NAAB Short Name Order .......................................................... 40
Sire Conception Rate ........................................................................................................................... 42
Expanded Type Information for Top 30 Sires ...................................................................................... 44
SECTION III. SUMMARIZED BULLS ................................................................................................................... 54
Alphabetical listing of all active A.I. bulls, all non-active A.I. bulls less than 11 years of age, A.I bulls between 11 and 12 years of age with a summary Reliability equal to or greater than 80%, and all non-
A.I. bulls less than eight years of age. A bull must have at least 10 daughters, each with a usable
lactation record, to have an initial sire summary calculated and released.
SECTION IV. GENOMICALLY EVALUATED COWS AND HEIFERS
Top 100 Females with Genomic Evaluations through Ancestry ........................................................ 124
Top 200 Cows Ranked by Genomic Jersey Performance IndexTM ..................................................... 107
Top 500 Females Ranked by Genomic Jersey Performance IndexTM ................................................... 96
Top 500 Heifers Ranked by Genomic Jersey Performance IndexTM .................................................. 111
SECTION V. TRADITIONALLY EVALUATED COWS AND HEIFERS
Top 200 Cows Ranked by Traditional Jersey Performance IndexTM .................................................. 126
Top 400 Heifers Ranked by Traditional Parent Average JPITM .......................................................... 131
SECTION VI. YOUNG SIRES
Born after October 1, 2008 and listed in NAAB Stud Code Order ................................................... 141
Born after April 1, 2010 and ranked by PA JPITM .............................................................................. 147
April 2011 The “Green Book” Online at http://greenbook.usjersey.com Volume 16, Number 1

7/30/2019 AIGL GreenBook April11 Online
http://slidepdf.com/reader/full/aigl-greenbook-april11-online 4/9
No. of PREDICTED TRANSMITTING ABILITYCategory Bulls Milk % Fat Fat % Prot Protein SCS PL DPR NM$ FM$ CM$
Active AI average 137 404 0.08 32 0.02 18 3.00 2.2 0.0 243 223 271
Genomic (G-Code Bulls) average 134 764 0.04 42 0.01 28 2.97 3.2 0.2 358 340 385
Non-AI average 439 -55 0.03 3 0.01 0 3.00 0.8 0.1 48 41 55
Active AI Difference from non-AI 459 0.05 29 0.01 18 0.00 1.4 -0.1 195 182 216
G Code Bull Difference from non-AI 819 0.01 39 0.00 28 -0.03 2.4 0.1 310 299 330
First-evaluation AI bulls 54 361 0.08 31 0.02 17 3.01 1.2 -0.2 190 172 215
First-evaluation non-AI 36 -26 0.02 3 0.01 0 3.00 1.0 0.1 53 49 58
Difference 387 0.06 28 0.01 17 0.01 0.2 -0.3 137 123 157
Glossary of Terms
Daughter Pregnancy Rate (DPR): Genetic evaluation of fertility
based on the percentage of non-pregnant, eligible cows that become
pregnant during each 21-day period. 1% DPR equals 4 less days
open.
Expected Future Inbreeding (EFI): Estimate of future progeny
inbreeding, assuming that an animal is mated randomly.
Genomic “G” Codes: GT, animal has been genotyped; GT3K
genotyped with 3K chip; GT50K, genotyped with 50K chip; GI for
genotype through imputation from progeny; and GA for inclusionof genomic information from genotyped ancestors.
Genomic Estimate of Future Inbreeding (GFI): Estimate of
inbreeding in future offspring, based upon DNA testing of parent’s
actual homozygosity and percentages of genes in common with the
genotyped breed population.
Genomic Predicted Transmitting Abilities (GPTAs): Estimate of
genetic merit calculated from (1) information from genotypes or
imputed genotypes of ancestors DNA analysis of functional genes
inherited by a particular animal; plus (2) individual performance
and (3) pedigree information.
Heritability:The proportion of observed differences in a trait between
individuals attributed to transmittable genetic factors in contrast
with environmental factors. (See Table 3)
Jersey Performance IndexTM (JPI): Combines PTA or GPTA
Protein, Fat, Functional Trait Index (FTI), PL, DPR, and SCS with
the emphasis of 42% Protein : 15% Fat : 15% FTI : 12% PL : 10%
DPR and 6% SCS. Used to rank animals for combined genetic merit
for production, type and fitness traits.
Jersey Udder IndexTM (JUI): Based on the Functional Trait Index
(FTI) weightings for udder traits (refer to Table 2, page 5).
Net Merit dollars (NM$): Expected lifetime profit as compared with
the breed base cows born in 2005. Described at http://
aipl.arsusda.gov/reference/nmcalc.htm.
Parent Average: Estimate of an individual’s eventual PTA based on
the average of the parents’ traditional PTAs.
Percentile: A ranking relative to the population. For example, a bullwith a 90 percentile ranking or a heifer that is a P9 is ranked higher
than 90 percent of the population.
Predicted Transmitting Ability (PTA):The best predictor of genetic
merit; specifically what a bull or cow is expected to transmit for a
particular trait to their offspring. See also GPTA (above).
Productive Life (PL): Time in the milking herd before removal by
voluntary culling, involuntary culling, or death.
Sire Conception Rate (SCR): Phenotypic predictor of bull fertility
expressed as a relative conception rate, measured for the first seven
(7) breedings of the cow (no heifer breedings).
Somatic Cell Score (SCS): Indicator trait for mastitis resistance based
on the direct measure of somatic cells in milk samples.
Trait Average SD
Jersey Performance IndexTM 92 65
JPITM Reliability 82 9
Herds 224 709
Daughters 1,347 4222
Milk 404 671
Fat % 0.08 0.15Fat 32 25
Protein % 0.02 0.06
Protein 18 19
Cheese Merit Dollars $271 $190
Net Merit Dollars $243 $174
Fluid Merit Dollars $223 $167
Productive Life 2.2 1.78
Somatic Cell Score 3.00 0.13
Final Score (Type) 0.85 0.70
Stature 0.71 1.27
Strength 0.38 0.77
Dairy Form 0.64 0.72
Rump Angle H0.10 0.83Rump Width 0.35 0.73
Rear Legs S0.08 0.54
Foot Angle S0.57 0.39
Fore Udder Attachment 0.78 0.92
Rear Udder Height 0.91 0.82
Rear Udder Width 0.69 0.66
Udder Cleft 0.33 0.62
Udder Depth S0.73 1.17
Front Teat Placement C0.50 0.87
Front Teat Length L0.26 0.69
Jersey Udder Index™ (JUI) 2.01 1.95
Expected Future Inbreeding (EFI/GFI) 7.1 2.7
Daughter Pregnancy Rate 0.02 0.98
Table 2. Summary of Active A.I. Bull Averages, with
Standard Deviations, April 2011
Milk 0.35
Fat 0.35
Protein 0.35
Productive Life 0.08
Somatic Cell Score 0.12
Daughter Pregnancy Rate 0.04
Table 3. Heritability Estimates of Selected Traits
Trait Heritability (h2)
Table 1. Average Predicted Transmitting Ability (PTA) of Jersey Bulls Evaluated April, 2011
4

7/30/2019 AIGL GreenBook April11 Online
http://slidepdf.com/reader/full/aigl-greenbook-april11-online 5/9
2010 Jersey Performance Index™ (JPI)Trait weightings for the AJCA Jersey Performance IndexTM
and a major component, the AJCA Functional Trait Index, were
updated for the April 2010 bull and cow genetic evaluations.
In JPI10
, 57% of the index’s value is placed on production
traits (PTA protein and PTA fat). The remaining 43% is
contributed by four
fitness and longevity
traits: the FunctionalTrait Index (FTI
10), and
USDA PTAs for
Productive Life (PL),
Somatic Cell Score
(SCS), and Daughter
Pregnancy Rating
(DPR).
Specific weights
for each trait included
in JPI10
(changes
from the previous version noted in parentheses), are 42% PTA
protein (+2%); 15% PTA fat (-5%); 12% Productive Life (nochange); 6% Somatic Cell Score (+3%); 10% Daughter
Pregnancy Rate (+3%); and
15% Functional Trait Index
(no change) (see also Table
1, below).
Regrouping traits by
functional categories
reveals a set of “Big
Four” factors that
determine whether
cows put money into
your pocket, and howmuch. Production gets 57% of the emphasis in the new
formula. There’s 19% on herd life, through Productive Life
plus the body traits in the Functional Trait Index (FTI). Udder
health at 14% combines direct selection for lower Somatic
Cell Score (especially important to capture quality premiums)
and the udder traits in FTI. Lastly, 10% is placed on fertility,
using the trait of Daughter Pregnancy Rate.
More About Component Traits
Functional Trait Index (15%) is designed to separate the im-
pact of production and type traits on lifetime profitability. It is
composed of the sum of the PTAs for the linear traits times their
relative economic values. Udder Depth is set to 1.0, and all other
traits are expressed relative to it. FTI is not published separately.
The reason is, since estimates of trait economic importance are
calculated holding production constant, FTI needs to be com-
bined with the production traits to be interpreted correctly. In-
troduced in January of 1992, FTI weights were previously up-
dated in 1998 and 2006.
Study of changes in these
weights reflects the changein Jersey type over time
(see Table 2, next page).
Productive Life (12%) is
defined as “time in the
milking herd before re-
moval by voluntary culling,
involuntary culling, or
death.” An economic def i-
nition of PL has been in
place since 2006. Credits
are based on standard lactation curves, with highest credits at
the peak of lactation and diminishing credits across the remain-
der of lactation. The standard is that a second-lactation cow with305 days in milk gets 10 months credit. First lactations get less
credit and later lactations slightly
more credit in proportion to average
production. Cows get credit for con-
tinuing in milk after 305 days of lac-
tation and after 84 months of age.
Lactation-curve credits ensure that
cows with multiple lactations get
more total credit than cows with
just one long lactation.
Daughter Pregnancy Rate
(10%) is defined as the percent-
age of non-pregnant cows that be-
come pregnant during each 21-day period. A bull with a DPR of
1 indicates that his daughters are 1% more likely to become preg-
nant during an estrus cycle than a bull with an evaluation of 0.
Each 1% increase in PTA DPR equals a decrease of four (4)
days in days open. The heritability estimate for DPR is 4%. While
modest, the economic impact of reproductive performance is
significant and variation for DPR does exist. The April 2010
Active A.I. and Foreign Jersey bulls range from 2.6 to -2.7 DPR.
That translates into a genetic difference of 21.2 days open among
the daughters of these bulls.
Somatic Cell Score (6%) is an indicator trait for mastitis re-
(continued on next page)
Table 1. History of Weights Used to Calculate PTI (1998) and Jersey Performance Index™ .
Year Protein Fat FTI PL SCS FUI DPR
1998 55.5% 22.2% 16.7% — 5.6% — —
2002 50.0 20.0 15.0 5.0% 5.0 5.0% —
2005 50.0 20.0 15.0 3.75 3.75 3.75 3.75%
2006 40.0 20.0 15.0 12.0 3.0 3.0 7.0
2010 42.0 15.0 15.0 12.0 6.0 — 10.0
Calculation of the Jersey Performance Index™Effective April 2010, bull and cow JPITM are calculated as follows:
JPI2010
= (42 x PTA protein / 16.8) + (15 x PTA fat / 23.5) + (15 x (FTI10
/ 2.0)
+ (12 x Productive Life / 1.9) + (10 x PTA Daughter Pregnancy Rate / 1.0)
+ (6 x (3.00 – PTA Somatic Cell Score) / 0.15)
where:
FTI10
(Functional Trait Index) = Sum of the bull /cow PTAs of linear type traitsmultiplied by the respective relative economic value,updated for 2010 (see Table 2, next page)
7/30/2019 AIGL GreenBook April11 Online
http://slidepdf.com/reader/full/aigl-greenbook-april11-online 6/9
sistance based on the direct measure of somatic cells in milk
samples. The genetic correlation between Somatic Cell Score
and clinical mastitis is about 0.6.
Method Used For 2010 Updates
The revisions implemented for JPI10
were based on extensive
research conducted by Dr. Ronald E. Pearson of Virginia Tech,
with recommendations based on simultaneous evaluation of
multiple traits and their relationships to lifetime net income for
nearly 117,000 Jersey cows.Pearson used lactation records for Jersey cows born after 1995
and in herds that continued on production testing programs for
eight years after the cow was born. All lactations started by cows’
eighth birthday were included. Total milk yield of the cows ranged
from 41 to 179,169 lbs., with a group average of 51,272 lbs.
milk, 2,343 lbs. fat and 1,839 lbs. protein. Lifetime average days
in milk was 956 and the average number of calvings was 3.05.
Relative lifetime net income (RNI) was estimated for each
cow, calculated from DHI lactation data for total yield of fat and
protein, multipled by the net price for each component; number
of calvings, with net value calculated for each calf born; rearing
cost for the cow plus net salvage value at culling; less the daily
costs of feed for maintenance, labor and fixed and other operating
costs across the cow’s lifetime. RNI is relative because the same
prices were used for all herds across the United States.
RNI was then adjusted for costs not directly measured in DHI
records. For mastitis, these
included treatments and
added labor cost for
mastitis, value of
discarded milk and cost of
lost premiums for lower
somatic cell score. For
fertility, the costs included were for increased heat detection,
pregnancy exams and drugs for treatment. The additional costsof rearing and maintaining animals with larger body size was
included, as was their increased salvage value. Adjustments were
also included for costs incurred because of udder and feet and
legs problems.
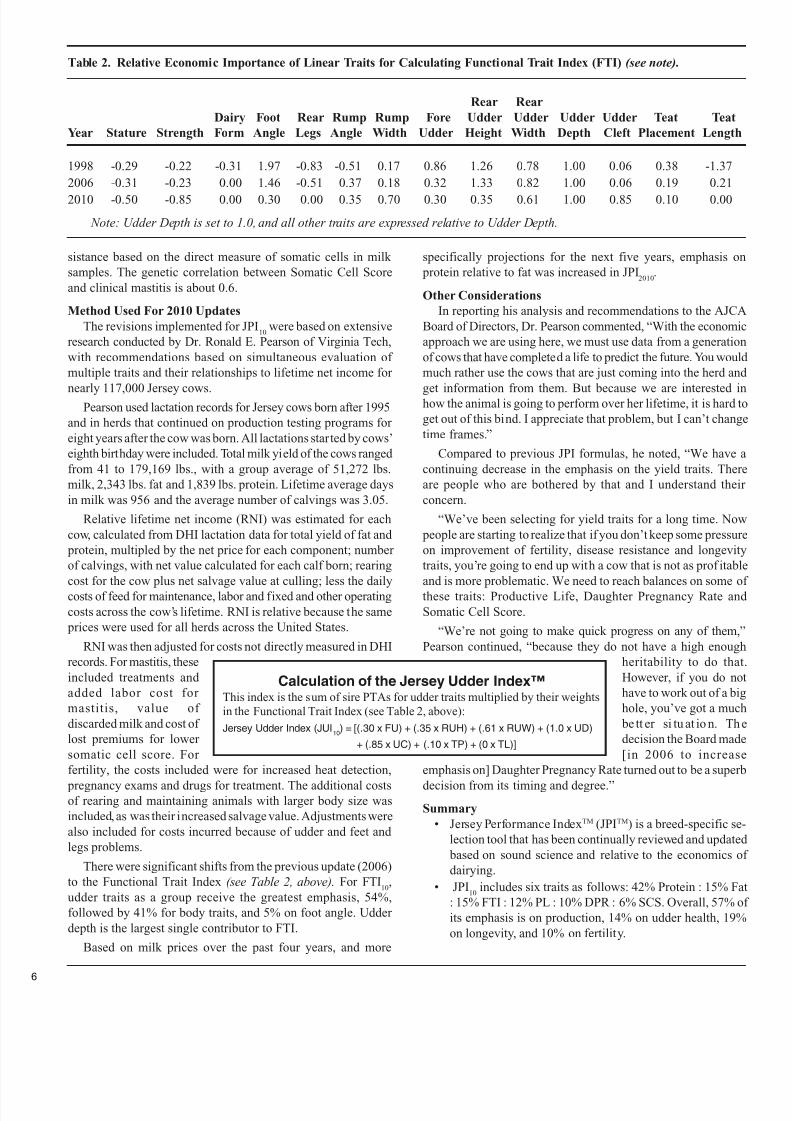
There were significant shifts from the previous update (2006)
to the Functional Trait Index (see Table 2, above). For FTI10
,
udder traits as a group receive the greatest emphasis, 54%,
followed by 41% for body traits, and 5% on foot angle. Udder
depth is the largest single contributor to FTI.
Based on milk prices over the past four years, and more
Rear Rear
Dairy Foot Rear Rump Rump Fore Udder Udder Udder Udder Teat Teat
Year Stature Strength Form Angle Legs Angle Width Udder Height Width Depth Cleft Placement Length
1998 -0.29 -0.22 -0.31 1.97 -0.83 -0.51 0.17 0.86 1.26 0.78 1.00 0.06 0.38 -1.37
2006 -0.31 -0.23 0.00 1.46 -0.51 0.37 0.18 0.32 1.33 0.82 1.00 0.06 0.19 0.21
2010 -0.50 -0.85 0.00 0.30 0.00 0.35 0.70 0.30 0.35 0.61 1.00 0.85 0.10 0.00
Note: Udder Depth is set to 1.0, and all other traits are expressed relative to Udder Depth.
Table 2. Relative Economic Importance of Linear Traits for Calculating Functional Trait Index (FTI) (see note).
specifically projections for the next five years, emphasis on
protein relative to fat was increased in JPI2010
.
Other Considerations
In reporting his analysis and recommendations to the AJCA
Board of Directors, Dr. Pearson commented, “With the economi
approach we are using here, we must use data from a generation
of cows that have completed a life to predict the future. You woul
much rather use the cows that are just coming into the herd and
get information from them. But because we are interested inhow the animal is going to perform over her lifetime, it is hard t
get out of this bind. I appreciate that problem, but I can’t chang
time frames.”
Compared to previous JPI formulas, he noted, “We have
continuing decrease in the emphasis on the yield traits. Ther
are people who are bothered by that and I understand thei
concern.
“We’ve been selecting for yield traits for a long time. Now
people are starting to realize that if you don’t keep some pressur
on improvement of fertility, disease resistance and longevity
traits, you’re going to end up with a cow that is not as prof itabl
and is more problematic. We need to reach balances on some o
these traits: Productive Life, Daughter Pregnancy Rate an
Somatic Cell Score.
“We’re not going to make quick progress on any of them,”
Pearson continued, “because they do not have a high enough
heritability to do that
However, if you do no
have to work out of a big
hole, you’ve got a muc
be tt er si tu at io n. Th
decision the Board mad
[in 2006 to increas
emphasis on] Daughter Pregnancy Rate turned out to be a superb
decision from its timing and degree.”
Summary
• Jersey Performance IndexTM (JPITM) is a breed-specific se
lection tool that has been continually reviewed and update
based on sound science and relative to the economics o
dairying.
• JPI10
includes six traits as follows: 42% Protein : 15% Fa
: 15% FTI : 12% PL : 10% DPR : 6% SCS. Overall, 57% o
its emphasis is on production, 14% on udder health, 19%
on longevity, and 10% on fertility.
Calculation of the Jersey Udder Index™This index is the sum of sire PTAs for udder traits multiplied by their weightsin the Functional Trait Index (see Table 2, above):
Jersey Udder Index (JUI10
) = [(.30 x FU) + (.35 x RUH) + (.61 x RUW) + (1.0 x UD)
+ (.85 x UC) + (.10 x TP) + (0 x TL)]
6

7/30/2019 AIGL GreenBook April11 Online
http://slidepdf.com/reader/full/aigl-greenbook-april11-online 7/9
Explanation of Headings for Summarized Bulls: Left Page
Identification1. Registered name of bull2. Registration number with country code3. Asterisk in this column indicates that
animal’s DNA genotype used in evalu-
ations4. A.I. stud code of bull: stud code, breedcode, and stud's number for bull
8. Reliability of production summary9–13. PTA values for production, milk, fat per-
cent, pounds of fat, protein percent andpounds of protein
14. Index for Cheese Merit Dollars
15. Index for Net Merit Dollars16. Index for Fluid Merit Dollars
USDA Production Information1. PTA Somatic Cell Score2. PTA for Productive Life3. PTA for Daughter Pregnancy Rate4. Expected Future Inbreeding5. Percentile ranking of bull based on Net
Merit dollarsJPI6. Jersey Performance Index™7. Reliability of JPI
Predicted Transmitting Ability for Type8. Number of herds with daughters
contributing information to the sire’stype summary
Explanation of Headings for Summarized Bulls: Right Page
9. Number of daughters in type summary10. Reliability of PTA type (based on final
score)11. PTA for Final Score and Type
PTA Values for Linear Type Traits12. Stature (ST)13. Strength (SR)14. Dairy Form (DF)15. Rump Angle (RA):
H=High Pins, L=Low Pins16. Rump Width (RW)17. Rear Leg Set (RL): P=Posty, S=Sickle
The P-level may be the most important guide on the pedigree
when evaluating Jersey heifers’ genetic merit. The P-level is a
percentile ranking of the Parent Average (PA) Jersey Production
Index™ (JPI), displayed as P0 through P9. When PA JPI is notavailable, percentile rankings are based on PA Protein.
The P-level indicates how one heifer ranks compared to all
other Registered Jersey™ heifers born in the same year. To inter-
pret, insert the P-level in the blank in the following statement:
"This heifer has a higher PA JPI than __0 percent of the regis-
tered Jersey heifers born in the same year." Example: A P8 heifer
born in 2008 has a higher PA JPI than 80 percent of the Regis-
tered Jersey heifers born in 2008.The tables show means and minimum values for percentile
ranking levels based on Parent Average JPI for the birth years
2006 to 2010 and projected for 2011 and 2012; and also for PA
Protein for 2006 to 2010, with projections for 2011 and 2012.
Heifer Percentile Ranking Levels (P-Level)
Birth Year Mean P0 P1 P2 P3 P4 P5 P6 P7 P8 P9
Table 2. Parent Average Protein at P-Levels
2006 0 < -21 -21 -10 -5 -1 2 5 9 12 17
2007 1 < -20 -20 -8 -3 1 5 7 10 14 19
2008 4 < -17 -17 -6 -1 3 7 10 13 17 22
2009 7 < -13 -13 -3 3 7 10 13 17 20 25
2010 11 < -8 -8 2 7 11 14 17 20 23 28
2011 projected 13 < -6 -6 4 9 13 16 19 23 26 31
2012 projected 16 < -3 -3 7 12 16 19 22 25 28 33
Table 1. Parent Average JPI for P-Levels
Birth Year Mean P0 P1 P2 P3 P4 P5 P6 P7 P8 P9
2006 10 < -51 -51 -23 -8 4 15 25 36 49 67
2007 20 < -42 -42 -14 2 15 26 36 47 60 77
2008 30 < -33 -33 -5 11 24 36 47 58 72 90
2009 44 < -18 -18 11 27 39 49 60 71 84 102
2010 61 < 2 2 29 44 55 66 76 87 100 117
2011 projected 71 < 11 11 38 54 65 76 87 98 111 1282012 projected 83 < 24 24 51 67 78 88 99 110 123 141
USDA Production Information5. Number of herds with bull’s daughters
on test, providing milk, fat and produc-tion information for the summary
6. Number of daughters that have produc-
tion data included in the summary7. % of first lactations that were in progressat the time the summary was completed
18. Foot Angle (FA): L=Low, S=Steep
19. Fore Udder Attachment (FU)
20. Rear Udder Height (RH)
21. Read Udder Width (RUW)
22. Udder Cleft (UC)
23. Udder Depth (UD): D=Deep, S=Shallow
24. Front Teat Placement (TP):
W=Wide, C=Close
25. Teat Length (TL): L=Long, S=Short
26. Jersey Udder IndexTM
(1) (2) (3) (4) (5) (6) (7) (8) (9) (10) (11) (12) (13) (14) (15) (16)
(1) (2) (3) (4) (5) (6) (7) (8) (9) (10) (11) (12) (13) (14) (15) (16) (17) (18) (19) (20) (21) (22) (23) (24) (25) (26)

7/30/2019 AIGL GreenBook April11 Online
http://slidepdf.com/reader/full/aigl-greenbook-april11-online 8/9
Active AI Bulls - Page 1
DUTCHHOLLOWABRAM-ET USA115348079 * 14JE503 19 35 100 79 424 0.08 35 0.06 27 392 3 27
AHLEMHALLMARKSHERO-ET USA112821168 * 147JE6067 19 98 5 87 926 -0.06 31 -0.04 26 317 312
SRMANHATTENBRUT-ET USA115010532 * 29JE3552 35 71 44 87 990 0.08 61 0.02 39 279 247
FORESTGLENJACEJESTER-ET USA067006748 * 11JE834 23 46 9 87 632 0.05 39 0.00 22 393 371
CHASIN-RAINBOWSACTRILEY-ET USA067029404 * 7JE859 36 87 45 88 389 -0.07 5 -0.02 11 332 330
IMPULSEVETERANOFSHAN-MAR USA067003433 * 1JE644 48 150 7 89 101 0.20 42 0.07 18 420 360
SUNVALLEYNATHANAONE USA114960414 * 14JE488 19 42 31 82 554 0.00 26 0.02 24 320 2 89
JENKSPARAMOUNTSUMMIT-ET USA112505219 * 147JE6063 42 157 35 92 527 0.10 43 -0.01 16 381 376
BWARON-ET USA114202925 * 11JE877 32 89 30 89 835 -0.04 31 -0.07 1 7 295 321
AVI-LANCHEREBELKAYLAR USA115021969 * 11JE934 19 49 71 84 527 0.06 36 0.04 27 350 300
CAVECREEKKOKOMOO-ET USA114118200 * 11JE869 30 94 12 89 86 0.21 42 0.09 20 457 382
FAIRWAYKLIPPER-ET USA114656658 * 29JE3541 24 49 27 84 873 -0.01 39 -0.02 27 334 317
AHLEMACTIONACCESS USA114725963 * 14JE483 41 73 21 89 1146 -0.15 23 -0.06 29 260 277
RALAINEPARAMOUNTPETER USA113012583 * 14JE415 76 210 60 94 974 -0.09 27 -0.04 27 295 302
FORESTGLENARTISTKARL USA067037285 * 29JE3509 33 57 5 87 723 0.14 60 0.05 35 369 318
MAACKDAIRYECLIPES-P-ET USA114845461 * 7JE860 53 91 47 89 551 0.11 47 0.03 26 309 263
BWMAGICIAN-ET USA114903433 * 11JE931 26 61 74 85 290 0.24 58 0.07 24 381 320
THREEVALLEYSCOUNTRYMILES-ET USA115089482 * 7JE886 33 54 83 84 774 0.10 55 0.00 28 336 312
FORESTGLENJACEADDISON USA067037421 * 506JE172 18 101 8 87 740 0.01 36 0.01 29 353 321
BHF-SSFPARADELOUIE-ET USA113486117 * 7JE738 155 420 70 96 1407 -0.18 29 -0.02 47 203 186
ALTAMONTMHFANTOM USA113636848 * 7JE762 52 80 11 90 194 0.04 17 0.03 13 369 336
AHLEMCOUNTRYCYRUS USA114975265 * 11JE926 24 70 84 86 767 -0.10 16 -0.07 13 243 281
O.F.MANNIXREBEL-ET USA111080315 * 14JE365 962 6,593 8 99 620 0.10 47 0.03 28 275 234
FORESTGLENVDJADESJIMMIE-ET USA112894928 * 14JE408 166 573 72 97 339 -0.07 2 0.08 27 277 206
SUNSETCANYONBELVEDERE-ET USA114495974 * 7JE840 32 83 31 90 470 0.05 31 0.00 16 257 248
FANPERTACOTUESDAYF2961 USA112287238 * 11JE771 74 1 ,375 26 96 129 0.13 31 0.05 14 411 369
CALAMITYSACTIONCAMPBELL-ET USA114644163 * 14JE484 79 148 18 94 815 -0.03 31 -0.05 19 263 274
MAACKDAIRYREGION-ET USA114011567 * 200JE944 37 80 6 90 419 0.16 50 0.03 20 311 279
DUTCHHOLLOWIMPACT-ET USA114698591 * 76JE158 20 43 56 81 1278 -0.11 36 -0.05 36 240 248
BWSEVILLE USA112984032 * 200JE985 27 156 55 89 671 -0.16 1 0.03 30 283 231
GALAXIESCELEBRITY-ET USA113586152 * 11JE826 32 73 11 90 537 0.02 29 0.01 21 299 273
BWBLAISE-ET USA114203029 * 200JE988 21 134 51 89 644 -0.02 26 -0.01 21 281 271
ASPENGROVEPARAMOUNTDUKE -ET USA113521285 * 11JE819 52 208 69 94 63 0.06 14 0.09 18 349 279
AHLEMJACEEPIC-ET USA113978283 * 14JE460 51 112 5 92 544 0.12 47 0.03 25 299 259
DEERVIEWRUBEX-ET USA067001519 * 11JE814 35 177 56 92 1443 -0.06 55 -0.04 43 189 194
THREEVALLEYSMAGNUM-ET USA115089512 * 200JE40 10 29 97 77 666 0.04 38 0.01 25 322 301
BWVENERABLE-ET USA114901730 * 200JE986 4 14 64 70 864 0.26 90 0.04 39 478 422
CAVECREEKVERMEER-ET USA114849531 * 1JE666 13 57 96 80 786 0.13 62 0.01 29 509 483
GABYSBALLARD-ET USA114826570 * 29JE3542 28 65 25 86 912 -0.02 37 -0.01 30 434 423
PROOMSDALEJACEGRATUDEGANNON-ET USA067010225 * 1JE604 99 234 59 95 1958 -0.14 62 -0.12 46 306 346
SFIMPULS8916 USA114635185 * 1JE648 20 68 47 84 600 0.12 50 0.03 28 557 499
D&EPAUL-ET USA115181456 * 11JE944 11 32 9 4 8 1 1233 -0.07 4 3 -0.02 40 356 335
SCHULTZRESCUEHEADLINE USA114114336 * 29JE3510 33 62 6 88 1293 -0.19 21 -0.08 30 388 418
FAIRWAYKLASSICKILOWATT-ET USA114656667 * 11JE921 31 76 42 88 478 0.09 39 0.04 25 523 469
AHLEMJACESENTRY-ET USA113978377 * 147JE6173 1 20 25 76 782 0.01 37 0.02 31 471 424
SRIMPULSSTONE-ET USA114332783 * 1JE634 19 33 9 82 1 029 0.05 56 0.05 47 441 369
ISDKQIMPULS DNK000301592 * 236JE3 1,906 18,775 30 99 604 0.19 63 0.12 44 590 487
PROOMSDALEROCKETGOOSE-ET USA067027311 * 1JE672 24 32 62 78 1333 -0.02 58 0.00 48 462 421
VANTAGEMONROE-ET USA114899330 * 200JE337 19 27 93 79 693 0.14 58 0.02 28 406 365
TOLLENAARSIMPULSLOUIE260-ET USA061929276 * 14JE473 69 124 6 93 1643 -0.01 73 -0.05 48 520 524
CAVECREEKKANOO-ET USA114118219 * 7JE1100 10 75 9 86 958 0.07 58 0.01 36 566 532
VICTORKIRKOFALLLYNNS USA115255083 * 11JE943 5 13 100 71 1364 -0.04 54 -0.02 44 380 372
ABBOTTOFD&E USA114756406 * 11JE928 25 63 33 86 815 0.07 50 0.05 38 487 426
TOLLENAARSIMPULSLEGAL233-ET USA061929249 * 29JE3506 32 53 17 85 822 -0.01 36 0.05 38 494 434
RICHIESJACETBONEA364 USA113672851 * 7JE1000 82 3,264 43 97 560 0.20 63 0.09 37 490 4 08
AHLEMLEMVIGABE-ET USA111334898 * 122JE5198 430 5,512 18 99 834 0.13 63 0.05 40 501 435
ISDKJASBUNGY DNK000301617 228JE105 818 8,148 14 92 108 0.18 38 0.09 20 554 483
SUNSETCANYONRPMILITIA-ET USA111953541 * 200JE990 536 3,600 33 99 370 0.18 51 0.08 29 480 420
AHLEMCOUNTRYCLEM-ET USA114911764 * 11JE946 23 68 97 85 925 0.02 47 0.02 36 360 317
PROOMSDALEGRATITUDECOUNTRYCARL-ET U SA067010255 * 11JE885 47 131 13 92 1559 -0.15 41 -0.05 46 251 251
CAL-MARTIMPULSNESTOR3831 USA114118901 * 1JE631 66 133 4 89 341 0.28 67 0.14 38 484 373
LYONIMPULSAMITY USA114523824 * 29JE3527 31 67 6 87 720 0.01 34 0.04 33 387 333
MAACKDAIRYSPECTACULAR-ET USA114245720 * 7JE821 49 73 12 88 261 0.16 42 0.07 23 435 367
SUNSETCANYONMATINEE-ET USA111981214 * 7JE714 367 2,610 37 99 892 0.26 91 0.00 32 476 451
SUNSETCANYONSCFMAGNIFICENT-ET USA114891529 * 203JE722 10 63 83 81 785 0.02 39 0.04 36 329 272
BUTTERCRESTFORBES USA114896953 * 29JE3563 23 34 88 80 472 0.33 85 0.11 37 458 367
TOLLENAARSARTISTLYNDON-ET USA061929278 * 29JE3508 32 60 10 86 952 0.00 44 -0.03 28 404 406
DUTCHHOLLOWABEL-ET USA115149241 * 7JE935 31 43 93 82 169 0.22 48 0.10 24 517 432
PROOMSDALEBRAZOGRATITUDEGHENT-ET USA067027314 * 11JE930 24 84 81 86 1242 -0.08 42 -0.02 41 377 358
SUNSETCANYONANTHEMSALLSTAR-ET USA114581918 * 1JE654 34 114 18 92 16 0.45 83 0.13 24 534 436
WILSONVIEWARTISTICROMEO USA114630694 * 1JE655 21 53 77 83 537 0.09 42 0.04 27 483 431
FORESTGLENARTISTALEXANDER USA067037158 * 14JE472 62 115 5 93 451 0.13 46 0.03 22 490 451
FORESTGLENMECCASJEVON-ET USA112797481 * 29JE3346 327 2,693 67 99 1159 0.05 63 -0.04 34 455 446
SUNSETCANYONKYROS-ET USA114704155 * 7JE865 60 86 58 88 953 0.09 59 0.02 38 387 3 46
SUNSETCANYONMAXIMUM-ET USA111950696 * 203JE607 206 3,986 39 98 206 0.43 91 0.09 25 565 484
April 2011, Active AI 70% REL Bulls by JPI
Name of Bull
5HJLVWUDWLRQ1XPEHU GT
1$$%&RGH
1R+UGV
1R'DXV
5,3
5(/ Milk
)DW Fat
3URW Prot CM$ NM$ F
REGISTRY STATUS CODES IN ANIMAL NAMES. Registry status codes PR and GR are an integral part of the AJCA registration name and NAAB short name (males onfor those animals recorded at the Provisional Register and Genetic Recovery levels, respectively. When animals are recorded in the AJCA Herd Register, the registrystatus code of HR is not included in the registration name. Refer to the inside back cover for more information about the AJCA animal recording systems.
8

7/30/2019 AIGL GreenBook April11 Online
http://slidepdf.com/reader/full/aigl-greenbook-april11-online 9/9
Active AI Bulls - Page 2
2.95 3.6 -0.3 7.7 69 122 72 11 23 71 0.7 0.3 0.4 0.5 L2.1 0.2 S0.4 0.0 0.3 0.9 0.7 0.3 D0.1 C0.4 L1.3 1
2.85 2.6 0.0 9.5 64 122 83 11 68 87 0.8 0.7 -0.6 1.1 L0.4 -0.6 S0.4 L0.3 0.0 0.8 0.7 0.6 S0.8 C1.4 S0.2 2
3.19 0.5 -0.6 6.4 42 122 79 20 41 78 0.5 1.9 1.8 0.5 L0.7 1.3 0.0 S0.6 0.2 -0.2 -0.2 0.5 S0.3 C0.4 L0.5 0
2.85 3.9 0.4 11.8 80 123 81 14 25 79 0.9 -0.4 0.1 1.3 H0.6 0.1 S0.5 L0.2 0.2 1.1 0.8 0.8 D0.5 C0.9 L1.0 1
2.89 4.8 1.9 8.7 69 123 80 20 29 75 1.6 1.1 0.2 0.6 L0.2 0.1 S0.2 S0.7 1.7 1.5 1.2 1.7 S2.1 C2.0 L0.5 5
3.04 3.6 2.1 2.6 76 117 82 25 83 78 0.1 0.0 0.8 0.0 L0.3 0.4 P0.2 S0.4 0.4 0.5 0.4 -0.2 S0.2 W0.1 S0.5 0
3.04 3.2 0.0 7.5 60 116 75 11 26 73 0.8 0.2 0.4 0.4 L0.7 -0.1 S0.5 S0.4 1.0 1.5 1.1 0.0 S1.5 W0.3 L0.2 2
2.95 4.1 1.1 9.0 81 118 87 20 86 90 0.4 0.1 -0.2 0.7 H0.8 -0.3 S0.6 L0.1 0.0 0.9 0.7 1.2 S0.2 W0.2 L0.8 1
2.90 3.4 0.6 8.7 68 121 84 20 50 84 1.5 2.1 0.2 1.0 L1.7 0.3 S0.1 S0.3 1.7 1.4 1.1 0.2 S1.9 C1.5 L0.2 3
2.96 2.9 0.0 9.7 62 120 77 13 26 75 0.1 0.9 -0.1 0.0 L0.7 0.2 S0.3 L0.3 -0.1 0.8 0.6 0.5 S0.4 W0.7 S0.3 1
2.91 4.1 0.6 3.4 82 127 83 21 68 86 0.4 -0.7 -0.1 0.1 H0.1 0.2 P0.1 S0.1 0.4 0.3 0.3 0.3 S0.7 C0.5 S0.1 1
2.82 1.9 0.3 9.5 65 125 78 13 32 77 0.9 1.1 0.2 1.3 L1.1 -0.2 S0.3 0.0 0.2 1.2 0.9 0.9 0.0 C1.1 S0.1 1
3.01 1.7 1.0 10.2 54 127 83 29 49 83 1.4 0.7 -0.2 1.5 L0.8 -0.4 S0.3 S0.5 0.6 1.4 1.1 1.3 0.0 C1.2 L0.2 2
3.02 3.2 0.0 8.6 63 130 89 50 85 88 1.2 0.6 -0.5 1.2 L0.1 -0.3 S0.3 L0.2 0.7 1.3 1.0 1.4 S1.1 C0.5 0.0 3
3.14 1.5 -0.6 4.9 67 128 77 12 15 66 0.2 0.1 0.1 0.7 L1.0 0.0 S0.1 S0.6 0.1 0.5 0.4 -0.5 S0.2 W0.2 L0.6 0
2.91 1.5 -1.3 8.6 47 123 81 18 35 78 1.6 1.5 0.9 1.7 L0.5 0.8 S1.0 0.0 1.6 1.7 1.4 1.6 S1.0 C1.8 L0.5 4
3.03 2.6 -0.8 5.3 68 123 77 18 34 75 0.5 1.2 0.9 0.2 L1.0 0.8 S0.2 0.0 1.1 1.3 1.0 -0.3 S1.8 W0.5 L0.3 2
2.99 1.7 -0.8 6.7 64 123 75 10 16 69 1.5 1.0 0.6 1.1 H0.3 0.3 S0.4 S0.3 1.3 1.7 1.3 0.6 S0.4 C1.2 L1.3 2
3.00 2.7 -0.1 11.0 68 124 82 9 61 86 0.9 0.0 -0.3 1.3 H0.2 -0.3 P0.1 S0.5 0.5 0.9 0.7 0.8 D0.3 C2.0 L0.4 1
3.11 -0.3 -1.0 8.3 25 123 91 70 125 91 1.3 0.4 0.7 1.8 H0.1 0.4 S0.2 S0.2 0.5 1.3 1.0 0.9 D1.3 C2.0 S0.9 0
2.93 4.9 0.7 7.1 71 115 84 28 37 81 1.2 1.6 0.6 -0.4 L1.1 0.2 P1.0 S1.5 1.4 0.9 0.7 0.7 S2.6 C1.1 L0.5 4
2.95 3.4 1.2 8.3 57 104 79 20 56 81 1.6 0.9 0.2 1.0 L0.1 0.0 S0.4 S0.4 1.0 2.1 1.7 1.0 S0.9 C1.5 L0.6 3
2.95 1.2 -1.0 9.6 39 103 99 502 2,982 99 0.1 0.2 -0.2 0.2 H0.1 -0.3 S0.9 L1.0 -0.6 0.4 0.3 1.6 D0.6 W0.3 S0.7 0
3.02 1.4 -0.3 10.0 31 104 93 121 343 96 1.4 -1.1 -1.1 1.2 H0.1 -1.1 P0.8 S0.2 0.8 2.1 1.6 0.4 S1.0 0.0 S0.1 3
2.97 2.3 -0.8 9.8 43 105 84 27 60 84 1.7 2.1 0.3 0.6 H0.7 0.8 P0.1 S0.7 2.2 2.1 1.6 0.3 S3.2 C0.1 L0.5 5
3.02 4.6 1.4 9.5 78 105 94 36 803 98 0.5 -1.8 -0.6 0.2 H1.5 -0.4 S0.1 S0.3 0.8 0.6 0.5 -0.6 S0.2 W0.4 S0.1 0
2.84 1.8 0.8 8.6 53 110 88 51 100 89 1.1 2.3 0.3 1.1 L0.8 0.4 S0.5 S0.3 1.2 1.3 1.0 0.1 S1.5 W0.2 0.0 2
2.97 2.4 -1.4 8.2 55 109 84 33 61 85 1.7 1.1 1.3 1.2 H0.2 1.0 S0.7 S0.8 2.2 1.5 1.2 0.6 S1.5 C1.2 L0.4 4
3.04 0.9 -0.2 5.7 43 111 74 13 33 76 0.7 0.1 -0.1 1.2 L0.7 -0.1 P0.1 0.0 0.2 0.3 0.2 -0.6 D0.6 C0.6 S0.3 -0
2.84 1.9 -0.2 8.6 37 114 83 13 82 88 0.9 0.4 -0.5 1.0 H0.3 -0.4 S0.5 L0.1 1.0 2.2 1.7 0.6 S0.6 W0.6 S0.1 3
2.94 2.8 -0.3 10.8 51 113 85 26 64 87 1.7 1.9 0.7 1.5 H0.3 0.7 0.0 S0.3 1.4 1.9 1.5 1.2 S1.3 C1.2 L0.3 4
2.96 2.7 1.4 8.4 49 106 84 9 60 86 0.9 1.9 0.9 0.5 0.0 0.7 S0.2 S0.2 0.8 0.4 0.3 0.2 S0.9 C0.9 S0.3 1
2.92 3.6 1.3 8.7 55 105 88 34 66 86 0.8 0.4 0.7 0.2 L0.7 0.7 P0.4 S0.7 0.0 0.2 0.2 1.7 D0.2 C0.7 S0.1 1
2.95 1.4 -1.4 9.8 46 107 87 35 71 86 0.9 1.1 -0.1 0.9 L0.1 0.1 S0.4 S0.3 0.5 1.1 0.8 0.6 S1.1 C0.5 L0.5 2
3.16 -0.5 -2.5 8.9 27 107 87 29 76 88 0.7 -0.1 0.2 2.0 H0.6 0.3 S0.1 S0.1 -0.9 1.0 0.8 0.4 D1.0 C0.5 S1.0 -0
3.05 3.0 -0.1 7.4 63 107 70 6 13 67 0.9 -0.4 0.3 0.8 H0.2 -0.1 S0.5 S0.1 0.8 1.5 1.2 0.3 D1.0 C0.4 L0.6 0
3.04 1.5 -1.1 5.8 86 161 64 3 6 60 1.0 1.5 0.9 1.8 L0.3 0.7 S0.2 S0.4 1.1 2.0 1.6 -0.3 S0.3 C0.2 L0.3 2
2.93 4.4 0.8 5.5 94 161 71 3 15 64 1.0 -0.1 0.5 0.6 L0.8 0.4 P0.2 S0.6 0.7 0.8 0.6 0.0 S0.2 C0.1 L0.5 1
3.04 5.1 0.3 8.8 86 162 80 18 49 81 1.3 -0.3 -0.1 1.1 L0.4 -0.2 S0.7 S0.6 1.1 1.6 1.3 1.1 S0.9 C0.4 L0.2 3
2.90 1.5 -0.6 3.2 74 161 89 58 120 90 1.4 3.9 2.1 1.4 L 0.9 1.9 S0.7 S0.1 0.2 1.7 1.3 1.1 D0.5 W0.2 L 1.9 1
2.68 4.3 0.1 5.4 97 161 76 8 33 74 0.6 -1.6 -0.6 -0.1 L0.5 -0.7 P0.6 S0.6 0.9 0.4 0.3 -0.1 S0.7 C0.7 0.0 1
2.94 2.0 -1.0 10.0 71 159 74 9 15 70 1.4 1.9 0.1 0.9 H0.4 0.1 S0.4 S0.3 0.8 1.7 1.3 1.5 S1.6 C0.7 L0.4 4
2.95 5.6 0.9 8.8 84 159 81 17 31 78 1.4 1.0 0.3 1.3 L1.7 0.1 S0.4 S0.1 1.5 2.1 1.6 0.2 S0.9 C1.2 L0.2 3
2.84 4.6 1.7 9.1 94 161 81 23 45 80 0.6 -0.4 -0.7 0.4 L0.3 -0.9 S0.1 L0.3 0.3 1.6 1.2 0.5 S0.9 W0.1 S0.5 2
2.77 4.0 -0.7 11.5 87 160 72 1 15 75 1.7 1.4 0.2 1.0 H0.8 0.4 P0.7 S1.6 1.4 1.4 1.1 1.4 S1.7 C1.4 L0.7 4
2.92 1.9 -0.8 6.5 78 162 76 16 30 77 0.8 2.3 0.9 1.5 L0.8 0.8 S0.2 S0.5 0.1 0.9 0.7 -0.2 S0.5 C0.9 S0.9 1
3.10 3.8 1.2 2.4 97 189 99 851 9,783 99 0.6 1.5 0.7 0.5 L0.6 0.6 P0.6 S0.8 0.3 0.7 0.5 -0.1 S0.8 W0.1 L0.2 1
2.90 2.2 0.9 -1.0 85 188 72 21 26 71 1.8 3.5 2.8 1.2 H0.8 2.7 P0.3 S0.6 1.1 1.6 1.2 0.8 S0.6 W0.2 L1.7 2
2.85 2.7 -0.1 9.1 77 130 72 11 14 68 0.4 0.6 0.8 0.1 0.0 0.3 S0.6 S0.1 0.2 0.2 0.1 0.9 D0.1 C0.1 L0.5 0
3.03 3.6 1.2 5.7 98 207 87 47 76 87 0.9 1.9 0.9 1.1 L0.7 0.7 P0.1 S0.8 0.1 0.8 0.6 0.9 S0.3 W0.2 0.0 1
2.99 5.3 1.5 3.6 99 187 81 8 72 88 0.6 -0.2 -0.2 0.5 H0.6 0.0 0.0 S0.3 0.3 0.0 0.0 0.7 S0.6 C0.3 S0.1 1
3.16 2.8 -0.8 8.5 80 166 64 0 0 56 1.1 1.3 0.0 1.1 L1.3 0.3 S0.2 S0.4 0.5 1.5 1.2 0.5 S0.4 C0.6 L1.0 2
2.95 3.8 0.0 7.7 88 166 78 20 40 78 0.7 0.5 0.8 0.0 L0.6 0.3 S0.3 S0.2 1.3 1.0 0.8 -0.8 S1.6 C0.2 S1.0 2
2.98 4.5 0.4 5.1 89 175 77 17 26 74 1.3 0.3 0.7 0.4 H0.5 0.5 P0.2 S1.1 1.5 0.6 0.5 0.6 S1.8 C1.8 S0.4 3
3.04 2.5 -0.3 10.0 83 173 95 51 1,977 99 1.6 1.0 0.1 1.4 L0.5 0.5 S0.9 S0.9 1.6 1.1 0.8 0.8 S1.4 C2.8 L0.8 3
2.98 4.0 -0.7 4.8 90 157 98 252 3,873 99 0.1 -0.5 0.6 0.5 L1.8 0.2 S0.5 S0.1 0.2 0.1 0.0 -0.8 D0.3 C0.9 S0.9 - 0
2.79 5.7 2.0 2.0 94 140 87 367 4,448 82 0.1 -0.8 0.8 -0.9 H1.1 0.4 P0.3 S0.9 0.2 0.0 -0.4 0.0 S0.6 W0.7 S0.7 0
3.24 4.8 2.3 5.9 85 139 98 318 1,565 99 -0.1 2.6 0.4 0.4 L0.6 0.2 P0.7 S1.1 -1.4 0.0 0.0 0.7 D0.3 W2.1 L1.2 -0
2.93 1.8 -0.5 8.1 65 142 78 18 36 77 1.3 0.8 0.9 1.0 H0.5 0.5 S0.9 L0.5 0.6 1.4 1.1 1.2 S0.3 C2.0 L0.4 2
3.04 1.4 -0.3 0.5 45 140 87 44 111 89 1.1 2.6 3.3 0.4 H0.5 2.6 S0.6 L0.3 0.7 1.6 1.2 1.0 D0.6 C0.2 L1.6 1
3.08 1.9 0.3 2.5 80 138 82 30 65 77 -0.1 0.8 1.1 0.1 H0.1 0.6 P0.8 S0.8 0.1 -0.2 -0.1 -0.6 D0.2 W0.4 S0.2 -0
2.95 2.6 1.2 5.2 71 133 79 15 29 75 0.5 0.6 1.1 0.9 L0.6 1.0 P0.4 0.0 0.2 0.7 0.6 -0.2 D0.4 C0.4 S0.4 0
2.95 3.0 0.5 3.1 77 133 81 29 42 79 1.0 0.8 0.8 0.0 L0.1 0.4 P0.5 S1.2 1.8 1.0 0.8 -0.5 S2.5 W0.2 S0.5 3
2.97 2.5 0.7 3.8 92 135 97 196 948 98 -0.2 0.6 0.8 0.6 L0.2 0.7 S0.1 S0.3 -0.8 -0.2 -0.2 -0.8 D2.2 C0.2 L0.1 -3
2.94 0.8 -1.0 7.8 51 133 73 6 6 62 1.5 1.6 1.3 0.8 L0.1 1.1 P0.6 S0.8 2.1 2.2 1.7 0.1 S1.1 W0.2 L1.4 3
3.05 0.8 -1.1 6.5 77 142 71 11 17 66 0.9 1.4 0.6 1.3 L0.6 0.5 S0.1 S0.9 0.2 0.8 0.7 -0.1 S0.1 C0.6 L0.3 0
3.06 3.9 0.5 6.0 82 149 77 8 9 64 1.1 -0.5 0.0 0.7 H0.6 0.1 P0.1 S0.9 1.3 1.1 0.9 0.4 S1.0 C0.5 L0.1 2
2.84 5.1 -1.0 7.9 89 148 73 9 11 65 1.4 0.3 0.6 0.5 L0.9 0.6 S0.2 S0.6 1.6 1.7 1.3 0.1 S1.5 C0.8 L0.5 3
3.02 3.3 0.0 3.5 75 156 79 21 54 81 1.2 2.5 1.6 0.6 0.0 1.6 P0.2 0.0 0.9 1.6 1.2 0.1 S0.7 C0.1 L0.2 2
2.96 2.5 -0.6 5.9 91 152 86 28 89 89 0.9 0.9 0.2 0.8 L0.4 0.2 P0.1 S0.5 1.1 1.9 1.5 0.2 S1.9 W0.8 L0.7 3
2.86 4.5 0.2 5.8 88 147 75 11 30 73 0.6 -0.7 -0.9 0.2 L0.1 -0.6 S0.3 L0.4 0.6 0.9 0.7 -0.3 S1.0 W1.0 L1.3 1
2.94 4.6 1.7 6.3 92 144 87 50 78 87 0.5 -0.3 -0.3 0.2 H1.4 -0.1 S0.1 S0.6 0.7 -0.1 -0.1 -0.3 S1.6 C0.1 S0.3 1
2.85 3.9 0.3 8.0 91 143 96 171 1,279 99 0.3 -0.7 0.5 0.8 H0.4 0.0 S1.0 L1.2 -0.6 0.8 0.6 0.3 D2.2 W0.4 L1.4 -1
3.01 2.1 -1.1 7.0 74 145 78 35 50 67 1.7 2.2 1.2 2.1 L0.3 0.7 S0.6 S0.6 0.9 2.1 1.6 -0.1 S0.9 W0.6 L1.0 2
2.93 3.9 -0.4 3.8 96 144 96 86 873 98 0.7 0.5 0.9 0.4 L0.6 0.4 S0.2 S0.8 0.8 0.1 0.1 -0.3 S0.1 C0.5 L0.6 0
April 2011, Active AI 70% REL Bulls by J
SCS PL DPR EFI
10LOH JPI
-3,5(/
7\SH+UGV
7\SH'DXV
7\SH5(/ FS ST SR DF RA RW RL FA FU RH RUW UC UD TP TL J