agriculture - · pdf fileagriculture is the lifeline of pakistan’s ... investments...
TRANSCRIPT

Agriculture is the lifeline of Pakistan’s economy accounting for 19.5 percent of the gross domestic product, employing 42.3 percent of the labour force and providing raw material for several value-added sectors. It thus plays a central role in national development, food security and poverty reduction. The rapid growth of Pakistan’s urban areas indicate that demand for high-value perishable products such as fruits, vegetables, dairy, and meat is rising. Government is focusing to increase the yield for rural growers through major infrastructure investments including reliable transport networks and other building blocks for modern supply chains. CPEC will go a long way in the enhancement of agribusiness benefits by tapping value-added product innovation and supply chain.
Performance during 2016-17
During 2016-17, performance of the agriculture sector remained up to the mark and achieved growth of 3.46 percent against the target of 3.5 percent and last year’s meager growth of 0.27 percent. This was possible by better harvesting of major crops through greater availability of agriculture inputs like water, agriculture credit and intensive fertilizers offtake. The growth in crops was registered at 3.02 percent against the negative growth of 4.97 percent during the same period last year. The growth of sub sector of important crops, other crops and cotton ginning posted growths of 4.12 percent, 0.21 percent and 5.59 percent, respectively against last year growths of -5.47 percent, 0.59 percent
and -22.12 percent respectively. Other sub sectors of Agriculture like Livestock, Forestry and Fishing posted growth of 3.43 percent, 14.49 percent and 1.23 percent, respectively. The upturn in crop yields by significant margins occurred both on account of increase in production and improved yields. Maize production increased 16.30 percent against 6.77 percent last year, Sugarcane 12.41 percent against 4.23 percent, Cotton 7.59 percent against -28.96 and Rice 0.71 percent against -2.88 percent last year. Only wheat production growth remained slightly low at 0.46 percent compared to 2.18 percent last year. Other crops accounted for 11.03 percent in value addition of agriculture grew by 0.21 percent during 2016-17 against 0.59 percent during the same period last year due to decline in the production of vegetables and oilseeds by posting negative growth of 0.73 percent and 5.93 percent, respectively.
Livestock accounts 58.33 percent share in the agriculture. It witnessed a growth of 3.43 percent compared to 3.36 percent during corresponding period last year. The Fishing sector contribution stands at 2.12 percent in agriculture value addition and recorded a growth of 1.23 percent compared to 3.25 percent growth of same period last year. Forestry sector having contribution of 2.33 percent in the agriculture value addition witnessed a significant growth of 14.49 percent during 2016-17 due to higher timber production reported by Khyber Pakhtunkhwa. (Table 2.1)
Chapter 02
Agriculture

Pakistan Economic Survey 2016-17
20
Table 2.1: Agriculture Growth Percentages (Base=2005-06) Sector 2010-11 2011-12 2012-13 2013-14 2014-15 2015-16 2016-17
(P) Agriculture 1.96 3.62 2.68 2.50 2.13 0.27 3.46 Crops 0.99 3.22 1.53 2.64 0.16 -4.97 3.02 i) Important Crops 1.50 7.87 0.17 7.22 -1.62 -5.47 4.12 ii) Other Crops 2.27 -7.52 5.58 -5.71 2.51 0.59 0.21 iii) Cotton Ginning -8.48 13.83 -2.90 -1.33 7.24 -22.12 5.59 Livestock 3.39 3.99 3.45 2.48 3.99 3.36 3.43 Forestry 4.76 1.79 6.58 1.88 -12.45 14.31 14.49 Fishing -15.20 3.77 0.65 0.98 5.75 3.25 1.23 Source: Pakistan Bureau of Statistics P: Provisional Pakistan has two crop seasons, "Kharif" being the first sowing season starting from April-June and is harvested during October-December. Rice, sugarcane, cotton, maize, moong, mash, bajra and jowar are “Kharif" crops. "Rabi", the second sowing season, begins in October-December and is harvested in April-May. Wheat, gram, lentil (masoor), tobacco, rapeseed, barley and mustard are "Rabi" crops. Pakistan’s agricultural production is closely
linked with the availability of irrigation water. During 2016-17, the availability of water for Kharif 2016 stood at 71.4 million acre feet (MAF) showing an increase of 9.0 percent over Kharif 2015 and 6.4 percent more than the normal supplies of 67.1 MAF. During Rabi season 2016-17, the water availability remained at 29.7 MAF, which is 9.7 percent less than Rabi 2015-16 and 18.4 percent less than the normal availability of 36.4 MAF. (Table 2.2).
Table 2.2: Actual Surface Water Availability (Million Acre Feet)
Period Kharif Rabi Total % age increase/decrease.
over the Avg. Average system usage 67.1 36.4 103.5 -
2008-09 66.9 24.9 91.8 -11.3
2009-10 67.3 25.0 92.3 -10.8 2010-11 53.4 34.6 88.0 -15.0
2011-12 60.4 29.4 89.8 -13.2
2012-13 57.7 31.9 89.6 -13.4
2013-14 65.5 32.5 98.0 -5.3
2014-15 69.3 33.1 102.4 -1.1
2015-16 65.5 32.9 98.4 -4.9
2016-17 71.4 29.7 101.1 -2.3
Source: Indus River System Authority
I. Crop Situation
The important crops (wheat, rice, sugarcane maize and cotton) account for 23.85 percent of the value added in overall agriculture and 4.66 percent of GDP. The other crops account for 11.03 percent of the value added in overall agriculture and 2.15 percent of GDP. Livestock contributes 58.33 percent to agricultural value
addition and 11.39 percent to GDP. Forestry contributes 2.33 percent to agricultural value addition and 0.46 percent to GDP. Fishing contributes 2.12 percent to agricultural value addition and 0.41 percent to GDP. The production performance of important crops is given in Table 2.3

Table 2.3: Production of Important CropsYear Cotton
(000 bales)2010-11 11,460
(-11.3)2011-12 13,595
(18.6)2012-13 13,031
(-4.1)2013-14 12,769
(-2.0)2014-15 13,960
(9.3)2015-16 9,917
(-29.0)2016-17(P) Growth percent
10,671(7.6)
Source: Pakistan Bureau of Statistics P: Provisional (July-March), Figures in parentheses are
a) Important Crops
i) Cotton
During 2016-17, Cotton production was estimated at 10.671 million bales registering 7.6 percent increase over the production of 9.917 million bales during 2015-16 but was lower than the target of 14.1 million bales by a considerable margin. Cotton crop has 1.0 percent share in GDP and contributes 5.2 percent in agriculture value addition. The weaker than expected recovery in cotton production is mainly due to a sharp decline of 14.2 percent in the sowing area which stood at 2489 thousand hectares during 2016compared to 2902 thousand hectares during the corresponding period of last year due to exceptional losses from previous year’s pest infestation and low domestic prices at the sowing time that pushed growers away from
Table 2.4: Area, Production and Yield of CottonYear Area
(000 Hectare)2012-13 2,8792013-14 2,8062014-15 2,9612015-16 2,9022016-17(P) 2,489Source: Pakistan Bureau of Statistics
ction of Important Crops
(000 bales) Sugarcane Rice Maize
11,460 55,309 4,823 11.3) (12.0) (-29.9)
13,595 58,397 6,160 (18.6) (5.6) (27.7)
13,031 63,750 5,536 4.1) (9.2) (-10.1)
12,769 67,460 6,798 2.0) (5.8) (22.8)
13,960 62,826 7,003 (9.3) (-6.9) (3.0)
9,917 65,482 6,801 29.0) (4.2) (-2.9)
10,671 73,607 6,849 (7.6) (12.4) (0.7)
Source: Pakistan Bureau of Statistics March), Figures in parentheses are growth/decline rates
17, Cotton production was estimated at 10.671 million bales registering 7.6 percent increase over the production of 9.917
16 but was lower the target of 14.1 million bales by a
considerable margin. Cotton crop has 1.0 percent share in GDP and contributes 5.2 percent in agriculture value addition. The weaker than expected recovery in cotton production is mainly due to a sharp decline of
ercent in the sowing area which stood at 2489 thousand hectares during 2016-17 compared to 2902 thousand hectares during the corresponding period of last year due to exceptional losses from previous year’s pest infestation and low domestic prices at the
wing time that pushed growers away from
cotton to other competitive crops (sugarcane and maize). The area, production and yield of cotton for the last five years are shown in Table 2.4 and Figure 2.1.
and Yield of Cotton Area Production
(000 Hectare) % Change (000 Bales) % Change (Kgs/Hec)2,879 - 13,031 - 2,806 -2.5 12,769 -2.0 2,961 5.5 13,960 9.3 2,902 -2.0 9,917 -29.0 2,489 -14.2 10,671 7.6
Source: Pakistan Bureau of Statistics P: Provisional (July-March)
9000
10000
11000
12000
13000
14000
2012-13 2013-14 2014
Figure 2.1: Cotton Production (000 bales)
Source: PBS
Agriculture
21
(Thousand Tonnes) Maize Wheat
3,707 25,214 (13.7) (8.2) 4,338 23,473 (17.0) (-6.9) 4,220 24,211 (-2.7) (3.1) 4,944 25,979 (17.2) (7.3) 4,937 25,086 (-0.1) (-3.4) 5,271 25,633 (6.8) (2.2)
6,130 25,750 (16.3) (0.5)
cotton to other competitive crops (sugarcane The area, production and yield of
cotton for the last five years are shown in Table
Yield (Kgs/Hec) % Change
769 - 774 0.6 802 3.6 582 -27.4 730 25.4
2014-15 2015-16 2016-17 (P)
Figure 2.1: Cotton Production (000 bales)

Pakistan Economic Survey 2016
22
World Cotton Outlook The production and consumption of major cotton growing countries are given in Table 2.5.
Table 2.5: Production and Consumption of Major Cotton Growing Countries Production India
China
USA
Pakistan
Brazil
Uzbekistan
Others
World Total Consumption China
India
Pakistan
Europe & Turkey
Vietnam Bangladesh
USA
Brazil
Others
World Total
Source: Pakistan Central Cotton Committee, Ministry of Textile Industry (April ,2017) P: Projected ii) Sugarcane During 2016-17, the production of sugarcaneportrayed a very promising picture and reached to historical high of 73.6 million tonnes showing an increase of 12.4 percent over the production of 65.5 million tonnes during 201516 and comfortably exceeded the target of 67.5 million tonnes by a considerable margin of 9.0 percent. Its production accounted for 3.4 percent in agriculture’s value addition and 0.7 percent in overall GDP. The area cultivated for sugarcane crop reached 1217 thousand hectares compared to last year’s area of 1131 thousand hectares showing an increase of 7.6 percent. The production increased due to increase in area cultivated as it shifted from other competitive crops facing frequent distress, as for example from cotton crop which suffered on account of pest attacks. The area, pro
Pakistan Economic Survey 2016-17
The production and consumption of major cotton growing countries are given in Table 2.5.
and Consumption of Major Cotton Growing Countries 2014-15 E 2015-16 P
6.56 5.75
6.50 4.75
3.55 2.81
2.30 1.51
1.56 1.29
0.88 0.83
4.82 4.10
26.19 21.04
7.48 7.44
5.26 5.27
2.49 2.26
1.69 1.69
0.87 1.01 1.20 1.32
0.78 0.75
0.80 0.73
3.86 3.65
24.44 24.13
Source: Pakistan Central Cotton Committee, Ministry of Textile Industry (April ,2017)
17, the production of sugarcane portrayed a very promising picture and reached to historical high of 73.6 million tonnes showing an increase of 12.4 percent over the production of 65.5 million tonnes during 2015-16 and comfortably exceeded the target of 67.5
able margin of 9.0 Its production accounted for 3.4
percent in agriculture’s value addition and 0.7 area cultivated for
sugarcane crop reached 1217 thousand hectares compared to last year’s area of 1131 thousand
s showing an increase of 7.6 percent. The production increased due to increase in
shifted from other competitive crops facing frequent distress, as for example from cotton crop which suffered on account of pest attacks. The area, production
and yield of sugarcane for the last five years are given in Table 2.6 and Figure 2.2.
60000
62000
64000
66000
68000
70000
72000
74000
2012-13 2013-14
Fig 2.2: Sugarcane Production (000 Tonnes)
Source: PBS
The production and consumption of major cotton growing countries are given in Table 2.5.
(Million Tonnes) 2016-17 P
5.80
4.74
3.75
1.68
1.44
0.79
4.58
22.78
7.59
5.12
2.23
1.63
1.14 1.40
0.72
0.72
3.54
24.10
Source: Pakistan Central Cotton Committee, Ministry of Textile Industry (April ,2017) E: Estimated,
and yield of sugarcane for the last five years are given in Table 2.6 and Figure 2.2.
2014-15 2015-16 2016-17 (P)
Fig 2.2: Sugarcane Production (000 Tonnes)

Table 2.6: Area, Production and Yield of SugarcaneYear Area
(000 Hectare) 2012-13 1,129 2013-14 1,173 2014-15 1,141 2015-16 1,131 2016-17(P) 1,217 Source: Pakistan Bureau of StatisticsP: Provisional (July-March)
iii) Rice
Rice accounts for 3.0 percent in the value added in agriculture and 0.6 percent of GDP.2016-17, rice crop was sown on area of 2724 thousand hectares showing a decrease of 0.6 percent over the last year’s area of 2793 thousand hectares. Rice production stood at 6849 thousand tonnes achieving its targeted production of 6838 thousand tonnes and showing percent over corresponding period of last year’s production of 6801 thousand tonnes. Rice area decreased due to decline in domestic prices of rice which reduced the area under the crop and growers shifted to sugarcane and maize crop. Tharea, production and yield of rice for the last five years are shown in Table 2.7 and Figure 2.3.
Table 2.7: Area, Production and Yield of RiceYear Area
(000 Hectare) 2012-13 2,309 2013-14 2,789 2014-15 2,891 2015-16 2,739 2016-17(P) 2,724 Source: Pakistan Bureau of StatisticsP: Provisional (July-March)
iv) Wheat
Wheat accounts for 9.6 percent of the value added in agriculture and 1.9 percent of GDP of Pakistan. During 2016-17, sown on an area of 9052 thousand hectares witnessing a decrease of 1.9 percent compared to 9224 thousand hectares during same period last year. Wheat production was estimated at 25.750 million tonnes during 2016witnessing an increase of 0.5 percent over the last year’s production of 25.633 million tonnes. The production increased due to better supply of inputs which contributed in enhancing per hectare yield. The position is given in Table 2.8
Table 2.6: Area, Production and Yield of Sugarcane Area Production
% Change (000 Tonnes) % Change (Kgs/Hec.)- 63,750 -
3.9 67,460 5.8 -2.7 62,826 -6.9 -0.9 65,482 4.2 7.6 73,607 12.4
Statistics
Rice accounts for 3.0 percent in the value added in agriculture and 0.6 percent of GDP. During
rice crop was sown on area of 2724 thousand hectares showing a decrease of 0.6 percent over the last year’s area of 2793 thousand hectares. Rice production stood at 6849 thousand tonnes achieving its targeted production of 6838
an increase of 0.7 percent over corresponding period of last year’s production of 6801 thousand tonnes. Rice area decreased due to decline in domestic prices of rice which reduced the area under the crop and growers shifted to sugarcane and maize crop. The
production and yield of rice for the last five years are shown in Table 2.7 and Figure 2.3.
Table 2.7: Area, Production and Yield of Rice Area Production
% Change (000 Tonnes) % Change (Kgs/Hec.)- 5,536 -
20.8 6,798 22.8 3.7 7,003 3.0
-5.3 6,801 -2.9 -0.6 6,849 0.7
Statistics
Wheat accounts for 9.6 percent of the value added in agriculture and 1.9 percent of GDP of
wheat crop was sown on an area of 9052 thousand hectares witnessing a decrease of 1.9 percent compared to 9224 thousand hectares during same period last year. Wheat production was estimated at 25.750 million tonnes during 2016-17,
f 0.5 percent over the last year’s production of 25.633 million tonnes. The production increased due to better supply of inputs which contributed in enhancing per hectare yield. The position is given in Table 2.8
and Figure 2.4.
5000
5500
6000
6500
7000
2012-13 2013-14 2014
Fig 2.3: Rice Production (000 Tonnes)
Source: PBS
23000
24000
25000
26000
2012-13 2013-14 2014
Fig 2.4: Wheat Production (000 Tonnes)
Source: PBS
Agriculture
23
Yield (Kgs/Hec.) % Change
56,466 - 57,511 1.8 55,062 -4.3 57,897 5.1 60,428 4.4
Yield (Kgs/Hec.) % Change
2,398 - 2,437 1.6 2,422 -0.6 2,483 2.5 2,514 1.2
2014-15 2015-16 2016-17 (P)
Fig 2.3: Rice Production (000 Tonnes)
2014-15 2015-16 2016-17 (P)
Fig 2.4: Wheat Production (000 Tonnes)

Pakistan Economic Survey 2016
24
Table 2.8: Area, Production and Yield of WheatYear Area
(000 Hectares) 2012-13 8,660
2013-14 9,199
2014-15 9,204
2015-16 9,224
2016-17(P) 9,052
Source: Pakistan Bureau of StatisticsP: Provisional (July-March) v) Maize
Maize contributes 2.7 percent to the value added in agriculture and 0.5 percent to GDP. During 2016-17, area sown under maize crop has increased to 1334 thousand hectares, showing a significant increase of 12.0 percent over last year’s sown area of 1191 thousanhectares. Maize crop production stood at record high of 6.130 million tonnes during 2016showing a major increase of 16.3 percent over the last year’s production of 5.271 million tonnes. The record production achieved on the back of intensiagricultural inputs (fertilizers) coupled with increase in area sown. The position is presented in Table 2.9 and Figure 2.5.
Table 2.9: Area, Production and Yield of MaizeYear Area
(000 Hectares)
2012-13 1,060
2013-14 1,168
2014-15 1,142
2015-16 1,191
2016-17(P) 1,334
Source: Pakistan Bureau of StatisticsP:Provisional(July-March) b) Other Crops
Gram is the largest Rabi pulse crop, accounting for 76 percent of total production of pulses in the country It registered an increase of 25.5 percent in production during 2016production of Bajra also posted an increase in its production by 1.7 percent during 2016
Pakistan Economic Survey 2016-17
Table 2.8: Area, Production and Yield of Wheat Area Production
% Change (000 Tonnes) % Change (Kgs /Hec.)- 24,211 -
6.2 25,979 7.3
0.1 25,086 -3.4
0.2 25,633 2.2
-1.9 25,750 0.5
Source: Pakistan Bureau of Statistics
contributes 2.7 percent to the value added in agriculture and 0.5 percent to GDP.
rea sown under maize crop has increased to 1334 thousand hectares, showing a significant increase of 12.0 percent over last year’s sown area of 1191 thousand hectares. Maize crop production stood at record
6.130 million tonnes during 2016-17, showing a major increase of 16.3 percent over the last year’s production of 5.271 million
. The record production has been achieved on the back of intensive use of critical agricultural inputs (fertilizers) coupled with increase in area sown. The position is presented
Table 2.9: Area, Production and Yield of Maize Area Production
% Change (000 Tonnes)
% Change (Kgs /Hec.)
- 4,220 -
10.2 4,944 17.2
-2.2 4,937 -0.1
4.3 5,271 6.8
12.0 6,130 16.3
Source: Pakistan Bureau of Statistics
Gram is the largest Rabi pulse crop, accounting 76 percent of total production of pulses in
the country It registered an increase of 25.5 percent in production during 2016-17. The production of Bajra also posted an increase in its production by 1.7 percent during 2016-17 as
compared to the same period last year. The production of Barley, Jowar, Rapeseed &Mastard and Tobacco has witnessed din production during 2016negative growth of 9.8 percent,percent and 2.6 percent, respectively over the same period last year due to decrease in area
2500
3500
4500
5500
6500
2012-13 2013-14 2014
Fig 2.5: Maize Production (000 Tonnes)
Source: PBS
Yield (Kgs /Hec.) % Changes
2796 -
2824 1.0
2726 -3.5
2779 1.9
2845 2.4
Yield (Kgs /Hec.) % Changes
3,981 -
4,233 6.3
4,323 2.1
4,426 2.4
4,595 3.8
compared to the same period last year. The production of Barley, Jowar, Rapeseed & Mastard and Tobacco has witnessed decrease in production during 2016-17 by posting negative growth of 9.8 percent, 7.5 percent, 3.2 percent and 2.6 percent, respectively over the same period last year due to decrease in area
2014-15 2015-16 2016-17 (P)
Fig 2.5: Maize Production (000 Tonnes)

Agriculture
25
sown. The area and production of other crops are given in Table 2.10.
Table 2.10: Area and Production of other Kharif and Rabi Crops Crops 2015-16 2016-17 (P) % Change in
production over Last year
Area (000
Hectares)
Production (000 Tonnes)
Area (000
Hectares)
Production (000 Tonnes)
Bajra 486 300 469 305 1.7
Jowar 274 161 257 149 -7.5
Gram 940 286 931 359 25.5
Barley 66 61 59 55 -9.8
Rapeseed & Mustard 201 185 193 179 -3.2
Tobacco 53 116 51 113 -2.6
Source: Pakistan Bureau of Statistics P: Provisional (July-March) During 2016-17, the production of Moong, Onion and Chillies recorded positive growth of 27.4 percent, 2.7 percent and 0.2 percent, respectively, comparing to production of corresponding period last year. The reason for increase in production is increase in area
cultivated. However, the production of pulses Masoor (Lentil), Mash and Potato decreased by 17.9 percent 15.3 percent and 3.2 percent, respectively. The area and production of other crops are given in Table 2.11.
Table 2.11: Area and Production of Other Crops Crops 2015-16 2016-17(P) % Change in
production over Last year
Area (000 Hectares)
Production (000 Tonnes)
Area (000 Hectares)
Production (000 Tonnes)
Masoor 17.9 7.8 14.2 6.4 -17.9
Moong 146.3 102.1 178.8 130.1 27.4
Mash 19.2 8.5 17.1 7.2 -15.3
Potato 177.3 3,977.6 179.3 3,849.5 -3.2
Onion 135.9 1,736.4 138.4 1,783.5 2.7
Chillies 64.8 142.2 64.2 143.1 0.6
Source: Pakistan Bureau of Statistics P: Provisional (July-March) i) Oilseeds
The major oilseed crops in the country include Sunflower, Canola, Rapeseed/Mustard and Cotton. Total availability of edible oils during 2015-16 remained at 3.726 million tonnes of which local production contributed 0.462 million tonnes (14 percent) and the import share of edible oil/oilseeds was 3.264 million tonnes (86 percent). The import bill of edible oil during 2015-16 was Rs.284.546 billion (US$ 2.710 billion).
During 2016-17 (July-March), 1.98 million tonnes edible oil of value Rs.152.514 billion (US$ 1.457 billion) was imported which remained lower by 4.0 percent during the same period of last year. Local production of edible oil during 2016-17 (July-March) is provisionally estimated at 0.446 million tonnes. Total availability of edible oil from all sources is provisionally estimated at 2.426 million tonnes during 2016-17 (July-March).The area and production of oilseed crops during 2015-16 and 2016-17 is given in Table 2.12.

Pakistan Economic Survey 2016-17
26
Table 2.12: Area and Production of Major Oilseed Crops Crops 2015-16 (Jul-Mar) 2016-17 (Jul-Mar) (P)
Area Production Area Production (000
Acres) Seed (000
Tonnes)
Oil (000
Tonnes)
(000 Acres) Seed (000
Tonnes)
Oil (000
Tonnes) Cottonseed 7,685 2,966 356 5,931 2,816 338 Rapeseed/ Mustard 543 202 65 494 190 61 Sunflower 215 95 35 216 109 41 Canola 35 15 6 33 15 6 Total 8,478 3,278 462 6,674 3,130 446 Source: Pakistan Oilseed Development Board (PODB), Pakistan Bureau of Statistics P: Provisional II. Farm Inputs
i) Fertilizers
Fertilizer is the most important and expensive agricultural input. Its contribution in increase in crop yield is from 30 to 50 percent. Almost all of our soils are deficient in nitrogen, 90 percent soils have deficiency of phosphorus while 40 percent are deficient in potash.
The domestic production of fertilizers during 2016-17 (July-March) decreased slightly by 0.3 percent over the same period of last fiscal year.The imported fertilizer also decreased by 5.8 percent. Therefore, total availability of fertilizer also decreased marginally by 1.5 percent during current fiscal year.Total offtake of fertilizer nutrients witnessed increase by 30.5 percent. Nitrogen offtake increased by 33 percent while phosphate increased by 23.2 percent. Potash offtake recorded a significant boost of 82.5 percent during 2016-17 (July-March). Increase in offtake of fertilizer is due to substantial reduction in prices of all fertilizer products as a result of subsidy announcement by the government in June,2016 as detailed below:
• Cash subsidy on phosphate fertilizer equivalent to Rs. 300 per 50 kg bag of DAP.
• Reduction in GST on urea from 17 to 5 percent.
• Cash subsidy on nitrogenous fertilizer equivalent to Rs. 156 per 50 kg bag of urea.
• Subsidy of Rs. 800 and Rs. 500 per bag of SOP and MOP respectively, from 1st
February 2017 by Government of Punjab in order to promote the use of Potash.
Better market prices of agriculture produce especially rice, cotton and sugarcane also had positive effect on fertilizer use.
Total availability of urea during Kharif 2016 was 4278 thousand tonnes comprising of 1200 thousand tonnes of opening inventory and 3078 thousand tonnes of domestic production (Table 2.13). Urea offtake was about 2704 thousand tonnes, leaving inventory of 1565 thousand tonnes for Rabi 2016-17. Availability of DAP was 1151 thousand tonnes comprising of 253 thousand tonnes of opening inventory, 482 thousand tonnes of imported supplies and 416 thousand tonnes of local production. DAP offtake was 697 thousand tonnes leaving an inventory of 458 thousand tonnes for upcoming Rabi 2016-17.
Rabi 2016-17 started with an opening balance of 1565 thousand tonnes of urea (Table 2.13). Domestic production during Rabi 2016-17 was estimated around 2840 thousand tonnes. Urea offtake during current Rabi 2016-17 was around 3085 thousand tonnes, against 4405 thousand tonnes of total availability, leaving a closing balance of 1318 thousand tonnes for next season. DAP availability for Rabi 2016-17 was around 1673 thousand tonnes, which included 458 thousand tonnes of opening inventory, 843 thousand tonnes of imported supplies and domestic production of 372 thousand tonnes. Offtake of DAP during Rabi season was around 1503 thousand tonnes,

Agriculture
27
leaving a balance of 177 thousand tonnes for next season.
Total availability of urea during Kharif 2017 will be about 4018 thousand tonnes comprising of 1318 thousand tonnes of opening balance and 2700 thousand tonnes of domestic production (Table 2.13). Urea offtake is
expected to be around 3000 thousand tonnes, reflecting a closing balance of 1018 thousand tonnes. Total availability of DAP will be 639 thousand tonnes against expected offtake of 900 thousand tonnes. Thus, there is gap of 261 thousand tonnes of DAP which should be met through imports by private sector.
Table 2.13: Fertilizer Supply Demand Situation (000 Tonnes) Description Kharif (Apr-Sep) 2016 Rabi (Oct-Mar) 2016-17 Kharif (Apr-Sep) 2017*
Urea DAP Urea DAP Urea DAP Opening stock 1200 253 1565 458 1318 177 Imported supplies 0 482 0 843 0 40 Domestic Production 3078 416 2840 372 2700 422 Total Availability 4278 1151 4405 1673 4018 639 Offtake/Demand 2704 697 3085 1503 3000 900 Write on/off -9 4 -2 7 0 0 Closing stock 1565 458 1318 177 1018 -261 Source: National Fertilizer Development Center *: Outlook
ii) Improved Seed
Federal Seed Certification & Registration Department (FSC&RD) is an attached department of Ministry of National Food Security & Research, with the mandate to regulate quality of seeds of various crops. Seed quality being a key input in crop production plays a vital role for sustainable agricultural production and national food security. Brief activities performed by department are as followed:
1. Achievements
a) Registration of Seed Companies
i. As per decision of the Working Group (for registration of new seed companies) in its 55th meeting, the registration of Seed Companies and other related issues were withheld till notification of Seed (Business Regulation) Rules, 2016.
ii. The Gazette Notification of Seed (Business Regulation) Rules, 2016 took place on 28th September, 2016. The Registration to do seed business comes under Section 22B with prescribed amount of fee for Seed Certification and Registration Services that will generate a sustainable amount to the government exchequer.
b) Field Crop Inspection: A total of 199819.54 acres of different crops (wheat, cotton, paddy, maize, pulses, oilseeds, vegetables, fodders, barley and potato) offered by the public and private seed agencies were inspected for certification purposes.
c) Seed Sampling &Testing: A total quantity of 428112 m.tons locally produced seed of major and minor crops was sampled and tested for purity, germination and seed health purposes.
d) Seed Quality Monitoring in the Markets: Under the Seed Act Enforcement, 91 cases were filed in different Courts of Law against the seed dealers found selling substandard seeds and 24.69 m.tons seeds of different crops were seized.
e) Imported Seed Consignments: A total quantity of 39.784 thousand m.tons of imported seed of various crops/hybrids (maize, paddy, sunflower, canola, fodders, potato, vegetables etc.) were tested under Seed (Truth in Labeling) Rules, 1991 at the port of entries i.e. Lahore and Karachi.
f) Central Seed Testing Laboratory, Islamabad: Central Seed Testing Laboratory (CSTL) Islamabad received approximately

Pakistan Economic Survey 2016-17
28
1126 seed samples from FSC&RD field stations through Quality Manager/Director. One thousand and thirty seven (1037) seed samples of different crops i.e. Wheat, Paddy, Cotton, Pulses and vegetables were tested for seed purity, seed moisture and other components. CSTL being International Seed Testing Association (ISTA) member laboratory participated in ISTA proficiency tests and CSTL received one sample (B. brizantha) from ISTA for seed purity, moisture determination and Other Seed Determination (OSD).
CSTL applied to ISTA through electronic communication for getting Accreditation status. Quality documents i.e. Standard Operating Procedures (SOP), quality forms and technical procedures were prepared in compliance with ISTA accreditation procedures. Formal application and quality documents have already been submitted to ISTA secretariat for pre-evaluation. CSTL has qualified this pre-evaluation and final evaluation would be done by ISTA audit team tentatively in April, 2017. CSTL has also submitted quality and technical manuals to Pakistan National Accreditation Council (PNAC) for final audit for getting national accreditation.
g) Seed Health Testing: Seed Health Testing Laboratory, FSC&RD has made headway towards laboratory accreditation by starting Inter Laboratory Comparison (ILC). Proficiency Testing (PT) or ILC with world renowned accredited laboratories is indispensable for laboratory accreditation. Subsequent upon the guidelines of ISTA, Seed Health Testing Committee, Department of DUS Testing and Seed Inspection, Centre for Seeds and Seedlings, NARO (NCSS), Japan has acceded to commence Inter Laboratory Comparison studies with Seed Health Testing Laboratory. In this connection, Seed Health Laboratory has received paddy seed samples infected with various diseases from Japan Laboratory. Results of the said analyses will be sent to Japan for ILC studies.
2. Up-dation of Seed Regulatory Framework
a) Plant Breeders’ Rights Act, 2016 Pakistan being a member of World Trade
Organization (WTO) is obliged to provide rights to the breeders of new plant varieties under Article 27.3(b) of Trade Related Aspects for Intellectual Property Rights (TRIP’s) Agreement. This protection to the breeders of new plant varieties in various countries is provided in the shape of Plant Breeders’ Rights Law.
The Plant Breeders’ Rights Bill, 2016 was passed by the National Assembly on 5th September, 2016 and transferred to the Senate. The Senate Standing Committee on National Food Security and Research approved the Plant Breeders’ Rights Bill, 2016 on 26th October, 2016. On 23rd November, 2016, the Senate passed the Plant Breeders’ Bill, 2016. The Plant Breeders’ Rights Bill, 2016 after being approved by both the houses of the Parliament, was signed by the President of Islamic Republic of Pakistan on 5th December, 2016.
b) Importance of the Plant Breeders’ Rights Act, 2016
In Seed Act, 1976, only the public sector was given the dominant role in seed development and registration processes and no role in this regard was assigned to the private sector.
• The promulgation of PBR law in the country will not only complement the recently passed Seed (Amendment) Act, 2015 but would also assist the seed industry to usher in a new era of research based innovations and technology led developments;
• At present the Plant Breeders’ Rights law is enforced in more than 74 countries of the world;
• Many foreign companies are reluctant to invest in our seed sector due to lack of protection for their products because of the absence of an effective variety protection system;
• We are hopeful that after the promulgation of PBR law our seed industry would experience a quantum jump in terms of investment and transfer of modern technologies to harness the potential of

Agriculture
29
hybrid plant varieties and other emerging technologies.
c) Formulation of Plant Breeders’ Rights Rules, 2017
An inter-ministerial and inter-departmental committee constituted by the Ministry of National Food Security and Research has finalized Draft Rules under the PBR Act, 2016,which have been circulated to concerned stakeholders to seek their viewpoints.
d) Passage and Implementation of Seed (Amendment) Act, 2015
After the passage of Seed (Amendment) Act, 2015 by the Parliament, Seed Rules, 2016 have been approved and circulated. Implementation of activities as a result of amendments in the Seed Act, are being expedited.
e) Impact of Seed (Amendment) Act, 2015 Rules
• Private sector has been given larger role in all areas of seed testing, production, multiplication and processing;
• Accredited seed testing laboratories allowed to be established by public and private seed sectors to enhance internal seed quality assurance and to link with national and international seed markets for export;
• Effective deterrence is expected to be created by enhancement of penalties against sale of fake and substandard seed;
• To bring discipline in the seed industry, mandatory registration of seed business has been introduced.
3. Distinctness, Uniformity & Stability (DUS) Examination
The DUS trials are performed by the FSC&RD. The Breeders have to submit seed sample of candidate variety along with the following to the FSC&RD of DUS testing:
• Application for registration of the new variety;
• Detailed botanical description of the variety along with comparable variety closely resembling to candidate variety. It also includes parentage and brief breeding history;
• Data regarding Value for Cultivation and Use (VCU);
• True specimens of plants of the variety and plant parts.
• On receiving seed samples, crop variety
registration trials are carried out for two years at suitable locations, to determine DUS characteristics of the variety according to the stabilized descriptors.
• • A total of about 57 new candidate lines have
been studied for DUS trials.
4. Fruit Plant Certification • FSC&RD has registered one new fruit plant
nursery established at Quetta to promote production and dissemination of disease free and true-to-type nursery fruit plants;
• Registration cases of ten fruit plant nurseries are in-process;
• Minimum Fruit Plant Certification Standards for citrus, mango and guava have been drafted and submitted to National Seed Council for approval;
• Minimum Fruit Plant Certification Standards for olive have been drafted and are ready for submission to National Seed Council.
5. FSC&RD Development Initiatives
Following two developmental projects have been drafted by FSC&RD and submitted to Ministry of National Food Security & Research for approval:
• Up-gradation and Accreditation of Seed Testing Laboratory, FSC&RD, Karachi;
• Up-gradation of seed certification services in Balochistan.
6. International Collaboration For seed sector development in Pakistan, FSC&RD International Cooperation section was in the process of deliberations during the period FY 2016-17 (July-March) through

Pakistan Economic Survey 2016-17
30
different cooperation proposals with the following countries and international organizations; ECO, Jordan, Senegal, Uzbekistan, Turkmenistan, Middle East,
Germany, Bahrain, Qatar, Italy, FAO, Tajikistan, Japan, Thailand, Turkey, SAARC, China, Brazil, D-8 and Papua New Guinea.
The detail is given in Table 2.14.
Table 2.14: Area ,Seed Requirements and Seed Availability* Crop Sowing
Area 000 Ha
Total Seed Requirement
MT
Targeted Seed Requirement
MT
Seed Availability (Metric Tonnes) Public Private Imported Total
(Loc+Imp) Wheat 9,045 1,085,400 217,080 86,200 335,415 - 421,615
Cotton 3,200 40,000 40,000 687 28,677 - 29,364
Paddy 2,830 44,800 12,744 3,322 43,097 619 47,038
Maize 1,109 33,270 9,981 656 17,078 9,302 27,036
Pulses 1,337 47,496 9,499 704 2,436 0 3,140
Oilseeds 830 10,582 2116 3 529 99 631
Vegetables 254 5,570 5,070 96 874 6,872 7,841
Fodders 1,942 40,138 40,138 5 7 16,054 16,065
Potato 149 372,725 74,545 - - 6,839 6,839
Total 20,696 1,679,981 411,173 91,673 428,112 39,784 559,569
Source: Federal Seed Certification & Registration Department * : Provisional 2016-17 (July-March)
iii) Mechanization
During 2016-17 (July-March), a total number of 37,634 tractors were locally manufactured compared to the production of 21,229 during same period last year witnessing a significant increase of 77.3 percent as the GST on locally manufactured/imported tractors have been reduced from 10 percent to 5 percent that has increased the demand of tractors. On positive
note the import of agriculture machinery has witnessed a significant growth of 25.6 percent during FY 2016-17(July-March) compared to the corresponding period of last year as customs duty on import of harvesters and planters was reduced to zero to promote mechanized harvesting and planting operations in the country. The production and price of locally manufactured tractors are given in Table 2.15.
Table 2.15: Prices and Production of Locally Manufactured Tractors 2016-17 (July-March)
Tractors Model – HorsePower (HP)
Price/Unit Excluding GST (Rs)
Price/Unit Including GST (Rs)
Production (in Nos.)
Actual Sale (in Nos.)
M/s Al-Ghazi Tractors NH 480-S (55 HP) 684,000 718,200 3,989 4,116
NH 480-S-W.P (55 HP) 690,000 724,000 1,692 1,720
NH-Ghazi (65 HP) 775,000 813,750 5,295 5,331
NH-Ghazi WDB(65 HP) 782,000 821,100 306 362
NH- 640 (75 HP) 984,000 1,033,200 1,669 1,669
NH -640 WDB (75 HP) 990,000 1,039,500 126 131
NH -640-S (85 HP) 1,027,000 1,078,350 77 77
NH -640-S WDB (85 HP) 1,041,000 1,093,050 27 28
NH-70-56 (85 HP) 1,540,000 1,617,000 5 5
Dabung- (85-HP) 1,041,000 1,617,000 489 487 M/s Millat Tractors MF-240 (50 HP) 682,500 716,625 8,837 8,697

Agriculture
31
Table 2.15: Prices and Production of Locally Manufactured Tractors 2016-17 (July-March) Tractors Model – HorsePower
(HP) Price/Unit Excluding GST (Rs)
Price/Unit Including GST (Rs)
Production (in Nos.)
Actual Sale (in Nos.)
MF-350 Plus (50 HP) 699,500 734,475 28 33
MF-260 (60 HP) 782,300 821,415 5,819 5,894
MF-360 (60 HP) 798,500 838,425 324 458
MF-375-S (75 HP) 1,014,500 1,065,225 1,792 1,808
MF-385 (85 HP) 1,073,200 1,126,860 6,840 6,951
MF-385 4WD (85 HP) 1,613,500 1,694,175 319 318
Grand Total 37,634 38,085 Source: Tractor Manufacturer Association, Federal Water Management Cell Note: GST @ 5 percent
iv) Irrigation
During the monsoon season (July-September) 2016, the normal average rainfall is 140.9 mm, while the actual rainfall received was 176.2 mm, which is 25.1 percent above normal rainfall. During the post-monsoon season (October-December) 2016, the normal average rainfall is 26.4 mm, while the actual rainfall
received was 3.0 mm, which was 88.6 percent below the normal rainfall. During winter season (January-March) 2017, normal average rainfall is 74.3 mm and the actual rainfall received was 75.5 mm, which was 1.6 percent above the normal average rainfall. Rainfall recorded during the monsoon, post monsoon and winter season is given in Table 2.16.
Table 2.16: Rainfall* Recorded During 2016-17 (in Millimeters) Monsoon Rainfall
(Jul-Sep) 2016 Post Monsoon Rainfall
(Oct-Dec) 2016 Winter Rainfall (Jan-Mar) 2017
Normal** 140.9 26.4 74.3 Actual 176.2 3.0 75.5 Shortage (-)/excess (+) + 35.3 -23.4 +1.2 % Shortage (-)/excess (+) +25.1 % - 88.6 % + 1.6 % Source: Pakistan Meteorological Department *: Area Weighted **: Long Period Average (1961-2010)
During Kharif (April-September) 2016, canal head withdrawals stood at 71.35 million acre feet (MAF) showing an increase of 9 percent as compared to 65.47 MAF during same period last year. During Rabi (October-March) 2016-
17, the canal head withdrawals decreased by 10 percent and stood at 29.66 MAF, compared to 32.90 MAF during same period last year. The province-wise detail is shown in Table 2.17.
Table 2.17: Canal Head Withdrawals (Below Rim Station) Million Acre Feet(MAF) Province Kharif
(Apr-Sep) 2015
Kharif (Apr-Sep)
2016
% Change in Kharif 2016 Over 2015
Rabi (Oct-Mar)
2015-16
Rabi (Oct-Mar) 2016-17
% Change in Rabi 2016-17 Over 2015-16
Punjab 32.53 36.39 12 16.87 15.93 -6
Sindh 30.55 32.13 5 14.57 12.04 -17
Balochistan 1.62 1.93 19 0.98 1.10 12
Khyber Pakhtunkhwa 0.76 0.92 20 0.48 0.59 23
Total 65.47 71.35 9 32.90 29.66 -10
Source: Indus River System Authority
Pakistan Economic Survey 2016-17
32
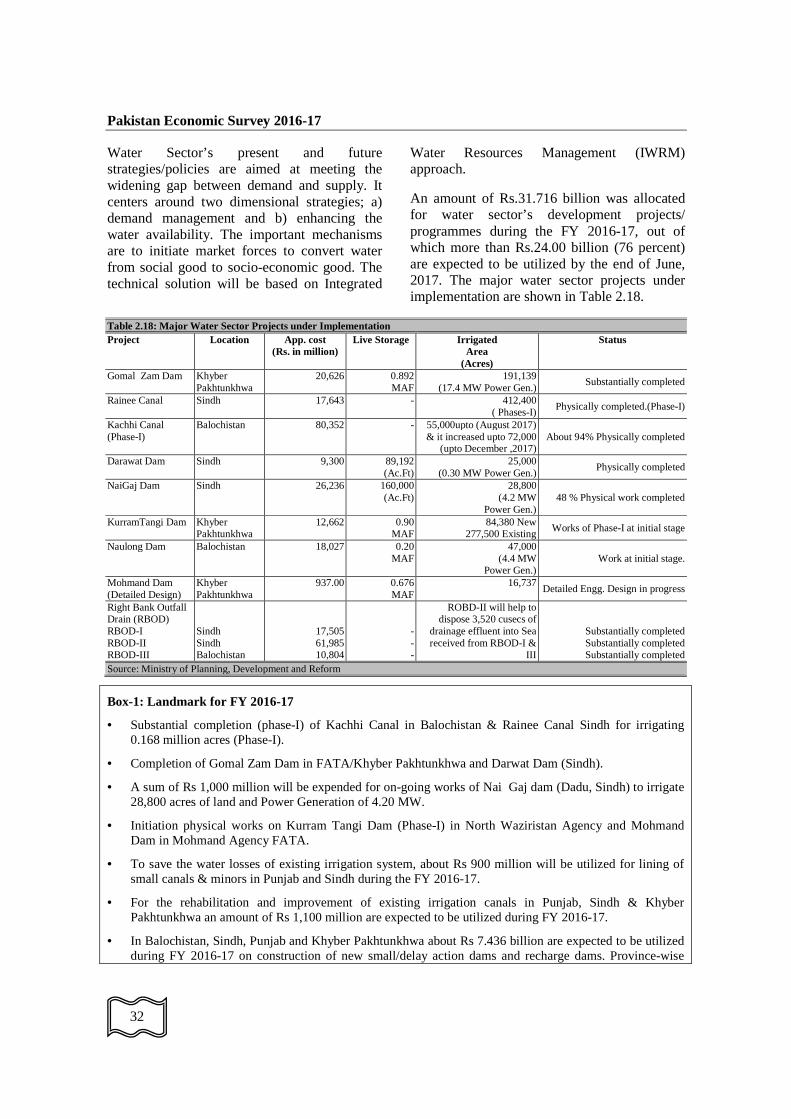
Water Sector’s present and future strategies/policies are aimed at meeting the widening gap between demand and supply. It centers around two dimensional strategies; a) demand management and b) enhancing the water availability. The important mechanisms are to initiate market forces to convert water from social good to socio-economic good. The technical solution will be based on Integrated
Water Resources Management (IWRM) approach.
An amount of Rs.31.716 billion was allocated for water sector’s development projects/ programmes during the FY 2016-17, out of which more than Rs.24.00 billion (76 percent) are expected to be utilized by the end of June, 2017. The major water sector projects under implementation are shown in Table 2.18.
Table 2.18: Major Water Sector Projects under Implementation Project Location App. cost
(Rs. in million) Live Storage Irrigated
Area (Acres)
Status
Gomal Zam Dam Khyber Pakhtunkhwa
20,626 0.892 MAF
191,139 (17.4 MW Power Gen.)
Substantially completed
Rainee Canal Sindh 17,643 - 412,400 ( Phases-I)
Physically completed.(Phase-I)
Kachhi Canal (Phase-I)
Balochistan 80,352 - 55,000upto (August 2017) & it increased upto 72,000
(upto December ,2017) About 94% Physically completed
Darawat Dam Sindh 9,300 89,192 (Ac.Ft)
25,000 (0.30 MW Power Gen.)
Physically completed
NaiGaj Dam Sindh 26,236 160,000 (Ac.Ft)
28,800 (4.2 MW
Power Gen.) 48 % Physical work completed
KurramTangi Dam Khyber Pakhtunkhwa
12,662 0.90 MAF
84,380 New 277,500 Existing
Works of Phase-I at initial stage
Naulong Dam Balochistan 18,027 0.20 MAF
47,000 (4.4 MW
Power Gen.) Work at initial stage.
Mohmand Dam (Detailed Design)
Khyber Pakhtunkhwa
937.00 0.676 MAF
16,737 Detailed Engg. Design in progress
Right Bank Outfall Drain (RBOD) RBOD-I RBOD-II RBOD-III
Sindh Sindh Balochistan
17,505 61,985 10,804
- - -
ROBD-II will help to dispose 3,520 cusecs of
drainage effluent into Sea received from RBOD-I &
III
Substantially completed Substantially completed Substantially completed
Source: Ministry of Planning, Development and Reform
Box-1: Landmark for FY 2016-17
• Substantial completion (phase-I) of Kachhi Canal in Balochistan & Rainee Canal Sindh for irrigating 0.168 million acres (Phase-I).
• Completion of Gomal Zam Dam in FATA/Khyber Pakhtunkhwa and Darwat Dam (Sindh).
• A sum of Rs 1,000 million will be expended for on-going works of Nai Gaj dam (Dadu, Sindh) to irrigate 28,800 acres of land and Power Generation of 4.20 MW.
• Initiation physical works on Kurram Tangi Dam (Phase-I) in North Waziristan Agency and Mohmand Dam in Mohmand Agency FATA.
• To save the water losses of existing irrigation system, about Rs 900 million will be utilized for lining of small canals & minors in Punjab and Sindh during the FY 2016-17.
• For the rehabilitation and improvement of existing irrigation canals in Punjab, Sindh & Khyber Pakhtunkhwa an amount of Rs 1,100 million are expected to be utilized during FY 2016-17.
• In Balochistan, Sindh, Punjab and Khyber Pakhtunkhwa about Rs 7.436 billion are expected to be utilized during FY 2016-17 on construction of new small/delay action dams and recharge dams. Province-wise

Agriculture
33
detail is as under:
a) Punjab Rs. 550 million (Ghabir & Papin dam) b) Sindh Rs. 500 million (Kohistan & Nagarparkar areas of Sindh) c) Khyber Pakhtunkhwa Rs. 1,450 million (Kundal/Sanam dam, Baran dam & 20 small
dams in districts Nowshera,Karak,Swabi,Haripur&Kohat) d) Balochistan Rs. 4,936.37 million (Shadi Kaur, Bathozai, Construction of 100
small dams (Package-II & III), Basol dam, Mangi dam & others) • Due to above mentioned water sector’s development programme it is expected that water availability at
farm gate will remain about 132.70 MAF.
• In drainage sector a sum of Rs. 4.80 billion are expected to be utilized for the implementation of RBOD-I, II & III Projects to protect & reclaim waterlogged & salt effected irrigated land and Manchar Lake for water pollution.
Source: Ministry of Planning, Development and Reform
iv) Agricultural Credit
In backdrop of the government’s priority for agriculture sector, Agriculture Credit Advisory Committee (ACAC) has set the indicative agricultural credit disbursement targets of Rs700 billion for FY 2016-17 to 52 participating institutions including 20 Commercial banks, 2 Specialized Banks, 4 Islamic Banks and 10 Microfinance Banks and 16 Microfinance Institutions/Rural Support Programmes (MFIs/RSPs)
This indicative agriculture target is 17 percent higher than the last year’s disbursement of Rs 598.3 billion. Out of the total target, Rs 340.0 billion have been allocated to five major banks, Rs 102.5 billion to ZTBL, Rs 139.6 billion to 15 Domestic Private banks, Rs 12.5 billion to Punjab Provincial Cooperative Bank Limited (PPBCL), Rs 60.1 billion to 10 Microfinance banks, Rs 11.0 billion to four Islamic banks and Rs 34.3 billion to 16 newly inducted MFIs/RSPs for FY 2016-17.
Agricultural Credit Disbursements Recent Trends
During FY 2016-17 (July-March), the banks disbursed Rs.473.1 billion which is 67.6 percent of the overall annual target of Rs 700 billion and 22.7 percent higher than disbursement of Rs.385.5 billion made during the corresponding period last year. The outstanding portfolio of
agriculture loans has also been increased by Rs.45.3 billion i.e. from Rs.333.8 billion to Rs.379.1 billion with 13.6 percent growth at end March 2017 as compared to same period last year. Despite having various real sector challenges, the overall performance of banks remained encouraging and witnessed 22.7 percent growth in disbursement during the period under review.
Five major banks as a group have disbursed Rs 236.6 billion or 69.6 percent of its annual target, ZTBL disbursed Rs.57.5 billion or 56.1 percent of its target of Rs.102.5 billion while PPCBL disbursed Rs.6.9 billion i.e. 55.1 percent against its target of Rs.12.5 billion during the period under review.
Fifteen Domestic Private Banks collectively disbursed Rs 90.2 billion or 64.6 against their target of Rs.139.6 billion. Ten Microfinance banks have disbursed Rs.61.3 billion and as a group has already surpassed their annual targets while under Islamic mode of financing, Islamic Banks collectively disbursed Rs.8.4 billion or 76 percent against their targets of Rs.11.0 billion to agriculture borrowers. Further, under MFIs/RSPs category Rs12.2 billion has been disbursed to small and marginalized farmers. The group wise performance of banks during FY 2016-17 (July-March) is summarized below in Table 2.19.

Pakistan Economic Survey 2016-17
34
Table 2.19: Supply of Agricultural Credit by Instit utions (Rs in billion) Banks Target
2015-16 2015-16 (July-March) Target
2016-17 2016-17 (July-March) % Change over
the Period Disbursement Achieved (%) Disbursement Achieved (%) 5 Major Commercial Banks
305.7 198.8 65.0 340.0 236.6 69.6 19.0
ZTBL 102.0 55.3 54.2 102.5 57.5 56.1 3.9 PPCBL 12.5 6.1 48.8 12.5 6.9 55.1 12.8 DPBs (15) 131.8 84.8 64.4 139.6 90.2 64.6 6.4 Islamic Banks (5) 7.9 6.0 76.4 11.0 8.4 76.0 39.3 MFBs (10) 40.1 34.5 86.0 60.1 61.3 102.1 77.7 MFIs/RSPs - - - 34.3 12.2 35.6 - Total 600.0 385.5 64.3 700.0 473.1 67.6 22.7 Source: State Bank of Pakistan
Box-2: Credit Disbursement to Farm and Non-Farm Sector The sector wise breakup of disbursements witnessed that the farm sector has received Rs.232.0 billion or 49 percent while non-farm sector absorbed Rs.241.1 billion or 51 percent during FY 2016-17 (July-March). Under farm credit sector disbursement, Rs.102.6 billion or 21.7 percent were disbursed to subsistence land holding, Rs.46.1 billion or 9.7 percent to economic holding, Rs.83.3 billion or 17.6 percent to above economic holding category. However, in non-farm credit sector disbursement, Rs.155.6 billion or 32.9 percent were disbursed to large farm while Rs. 85.5 billion or 18.1 percent to small farms category. The increasing trend of non-farm sector is mainly due to more opportunities for Agricultural Value Chain Financing (AVCF) especially in Livestock/Dairy and Poultry sectors. The sector-wise comparative details of credit disbursements are provided in Table 2.20.
Table 2.20 : Credit Disbursement to Farm & Non-Farm Sectors (Rs. in billion) Sector 2015-16 (July-March) 2016-17 (July-March)
Disbursement % Share in Total
Disbursement % Share in Total
A Farm Credit 188.1 48.8 232.0 49.0 1 Subsistence Holding 99.5 25.8 102.6 21.7 2 Economic Holding 41.2 10.7 46.1 9.7 3 Above Economic
Holding 47.4 12.3 83.3 17.6
B Non-Farm Credit 197.4 51.2 241.1 51.0 1 Small Farms 69.7 18.1 85.5 18.1 2 Large Farms 127.7 33.1 155.6 32.9
Total (A+B) 385.5 100 473.1 100 Source: State Bank of Pakistan
SBP’s Initiatives for the Promotion of Agriculture Financing
SBP, in collaboration with banks, federal & provincial governments, farming community and other stakeholders has been encouraging banks to adopt agricultural lending as a viable business line. Recently a number of policy and regulatory initiatives have been taken to remove the bottlenecks and enhance access to financial services for the farmers, especially smaller ones. Some of the major initiatives are as under;
1. Framework for Warehouse Receipt Financing (WHRF): In accordance with the objective of improving the performance of the agriculture sector and to develop commodities’ physical trade and marketing system, SBP issued draft framework for Warehouse Receipt Financing. The framework facilitates banks in development of specialized products for providing financing to farmers, traders, processors, and other players in the value chain. SECP in consultation with banks and other

Agriculture
35
stakeholders has developed Collateral Management & Warehousing Rules for WHRF system in Pakistan. The regulatory framework for collateral management companies and warehouse operators are being finalized by SECP.
2. Credit Guarantee Scheme for Small and Marginalized Farmers (CGSMF): SBP implemented the Credit Guarantee Scheme for Small & Marginalized Farmers, in line with the budgetary announcement 2014-15.The CGSMF, with funding support of federal government, with objective to sensitize financial institutions to lend to small farmers who do not have adequate collateral (acceptable to banks) in order to meet their working capital requirements. The scheme is providing 50 percent credit risk coverage to Participating Financial Institutions (PFIs) on loans up to Rs 100,000 extended to small farmers having upto 5 acres canal-fed or 10 acres rain-fed land.
3. Crop Loan Insurance Scheme (CLIS): To reduce vulnerability of small farmers, SBP in collaboration with GoP introduced CLIS in 2008 for five major crops i.e. wheat, rice, sugarcane, cotton and maize for mitigating the default risk due to natural calamities and provide repayment assurance to banks. The scope of CLIS covers payment of insurance premium of the farmers with landholding up to 25 acres. Under the mandatory scheme, the government is bearing the cost of premium up to 2 percent per crop per season.
4. Livestock Loan Insurance Scheme
(LLIS) was launched in November 2013 which covers all livestock loans up to Rs 5 million for purchase of animals. Under LLIS, the borrowers are covered against death of animals due to disease/natural death due to flood, heavy rains, wind storm and accidental death. Under this scheme, the GoP is bearing cost of premium (up to 4 percent annum) of small farmers obtaining loan from banks for up to 10 animals.
III. Livestock and Poultry
a) Livestock
Livestock contributed approximately 58.3 percent to the agriculture value added and 11.4 percent to the overall GDP during 2016-17 compared to 58.3 percent and 11.6 percent during the corresponding period last year, respectively. Gross value addition of livestock at constant cost factor of 2005-06 has increased from Rs. 1288 billion (2015-16) to Rs. 1333 billion (2016-17), showing an increase of 3.4 percent over the same period last year.
Livestock has an important and crucial role in rural economy and rural socio economic development. Nearly 8 million families are involved in livestock raising deriving more than 35 percent income from livestock production activities. It is central to the livelihood of the rural poor in the country. It is a source of cash income, providing a vital and often the only source of income for the rural and most marginal people. It can play an important role in poverty alleviation and foreign exchange earnings for the country.
The livestock population for the last three years is given in Table 2.21.
Table 2.21: Estimated Livestock Population (Million Nos.) Species 2014-151 2015-161 2016-171 Cattle 41.2 42.8 44.4 Buffalo 35.6 36.6 37.7 Sheep 29.4 29.8 30.1 Goat 68.4 70.3 72.2 Camels 1.0 1.0 1.1 Horses 0.4 0.4 0.4 Asses 5.0 5.1 5.2 Mules 0.2 0.2 0.2 Source: Ministry of National Food Security & Research 1: Estimated figure based on inter census growth rate of Livestock Census 1996 & 2006

Pakistan Economic Survey 2016-17
36
The major products of livestock are milk and meat for the last three years is given in Table 2.22.
Table:2.22 Estimated Milk and Meat Production (000 Tonnes) Species 2014-151 2015-161 2016-171 Milk (Gross Production) 52,632 54,328 56,080 Cow 18,706 19,412 20,143 Buffalo 32,180 33,137 34,122 Sheep2 38 39 39 Goat 845 867 891 Camel2 862 873 885 Milk (Human Consumption)3
42,454 43,818 45,227
Cow 14,965 15,529 16,115 Buffalo 25,744 26,510 27,298 Sheep 38 39 39 Goat 845 867 891 Camel 862 873 885 Meat4 3,696 3,873 4,061 Beef 1,951 2,017 2,085 Mutton 671 686 701 Poultry meat 1,074 1,170 1,276 Source: Ministry of National Food Security & Research 1: The figures for milk and meat production for the indicated years are calculated by applying milk production
parameters to the projected population of respective years based on the inter census growth rate of Livestock Census 1996 & 2006.
2: The figures for the milk production for the indicated years are calculated after adding the production of milk from camel and sheep to the figures reported in the Livestock Census 2006.
3: Milk for human consumption is derived by subtracting 20% (15% wastage in transportation and 5% in calving) of the gross milk production of cows and buffalo.
4: The figures for meat production are of red meat and do not include the edible offal’s.
The estimated production of other livestock products for the last three years is given in Table 2.23.
Table: 2.23 Estimated Livestock Products Production Species Units 2014-151 2015-161 2016-171 Eggs Million Nos. 15,346 16,188 17,083 Hides 000 Nos. 15,368 15,886 16,421 Cattle 000 Nos. 7,816 8,111 8,416 Buffalo 000 Nos. 7,447 7,669 7,897 Camels 000 Nos. 105 106 108 Skins 000 Nos. 53,060 54,278 55,526 Sheep Skin 000 Nos. 11,132 11,264 11,397 Goat Skin 000 Nos. 26,359 27,073 27,807 Fancy Skin 000 Nos. 15,569 15,941 16,322 Lamb skin 000 Nos. 3,306 3,345 3,385 Kid skin 000 Nos. 12,263 12,595 12,937 Wool 000 Tonnes 44.6 45.1 45.7 Hair 000 Tonnes 25.8 26.5 27.2 Edible Offal’s 000 Tonnes 383 394 405 Blood 000 Tonnes 64.4 66.1 67.8 Guts 000 Nos. 53,603 54,833 56,094 Casings 000 Nos. 16,347 16,895 17,461 Horns & Hooves 000 Tonnes 55.5 57.2 58.9 Bones 000 Tonnes 827.2 852.3 878.2

Agriculture
37
Table: 2.23 Estimated Livestock Products Production Species Units 2014-151 2015-161 2016-171 Fats 000 Tonnes 263.3 271.0 279.0 Dung 000 Tonnes 1,171 1,207 1,244 Urine 000 Tonnes 358 368 379 Head & Trotters 000 Tonnes 238.8 245.6 252.5 Ducks, Drakes & Ducklings
Million Nos. 0.5 0.5 0.5
Source: Ministry of National Food Security & Research 1: The figures for livestock product for the indicated years were calculated by applying production parameters
to the projected population of respective years. The population growth, increases in per capita income and export opportunities are fueling the demand of livestock and livestock products in the country. The overall livestock development strategy aims to foster "private sector-led development with public sector providing enabling environment through policy interventions”. The regulatory measures are aimed at improving per unit animal productivity by improving health coverage, management practices, animal breeding practices, artificial insemination services, use of balanced ration for animal feeding, and controlling livestock diseases of trade and economic importance. The objective is to exploit the livestock sector and its potential for economic growth, food security and rural socioeconomic uplift.
b) Poultry
Poultry sector is one of the vibrant segments of livestock sector in Pakistan. This sector provides employment (direct /indirect) to over 1.5 million people. The current investment in
Poultry Industry is more than Rs. 700 billion. Poultry has not only been a balancing force to keep check on the prices of mutton and beef, but also serving as backbone of agriculture sector, as it consumes over 7 million metric tons of agro residues. Poultry meat contributes 31 percent of the total meat production in the country. The commercial layer, breeders and broiler stocks showed estimated growth of 7.0 percent, 5.0 percent and 10 percent respectively while rural poultry developed @ 1.5 percent when compared to 2015-16. The poultry has contributed 1.4 percent in GDP during 2016-17 while its contribution in agriculture and livestock value added stood at 7.1 percent and 12.2 percent respectively. The poultry value added at current factor cost has increased from Rs. 151.1 billion (2015-16) to Rs.162.8 billion (2016-17) showing an increase of 7.7 percent compared to the same period last year. The estimated production of commercial and rural poultry and poultry products for the last three years is given in Table 2.24.
Table 2.24: Estimated Domestic/Rural & Commercial Poultry Type Units 2014-151 2015-161 2016-171 Domestic Poultry Million Nos. 83.32 84.58 85.86 Cocks Million Nos. 10.95 11.24 11.55 Hens Million Nos. 40.18 40.90 41.64 Chicken Million Nos. 32.19 32.43 32.67 Eggs2 Million Nos. 4,018 4,090 4,164 Meat 000 Tonnes 112.99 115.24 117.54 Duck, Drake & Duckling Million Nos. 0.48 0.46 0.44 Eggs2 Million Nos. 21.25 20.36 19.52 Meat 000 Tonnes 0.65 0.62 0.59 Commercial Poultry Million Nos. 53.4 56.9 60.6 Layers Million Nos. 42.65 45.64 48.83 Broilers Million Nos. 794.63 874.09 961.50 Breeding Stock Million Nos. 10.70 11.24 11.80 Day Old Chicks Million Nos. 829.99 912.99 1,004.29

Pakistan Economic Survey 2016-17
38
Eggs2 Million Nos. 11,307 12,077 12,900 Meat 000 Tonnes 960.65 1,054.46 1,157.51 Total Poultry Day Old Chicks Million Nos. 862 945 1,037 Poultry Birds Million Nos. 932 1,016 1,108 Eggs Million Nos. 15,346 16,188 17,083 Poultry Meat 000 Tonnes 1,074 1,170 1,276 Source: Ministry of National Food Security & Research 1 : The figures for the indicated years are statistically calculated using the figures of 2005-06. 2 : The figures for Eggs (Farming) and Eggs (Desi) are calculated using the poultry parameters for egg production.
Government Policy Measures
Livestock Wing of Ministry of NFS&R with its redefined role under 18th Constitutional amendment continued regulatory measures that included allowing import of high yielding animals, semen and embryos for the genetic improvement of indigenous dairy animals, allowing import of high quality feed stuff/micro ingredients for improving the nutritional quality of animal & poultry feed and allowing import of veterinary, dairy and livestock machinery / equipment at reduced duty rates in order to encourage establishment of value added industry in the country. Livestock insurance scheme for farmers having 10 animals or more, introduced during 2014-15 promoted cooperative dairy farming in the country. Zero rating on processed valued added chicken products has been withdrawn.
Livestock Wing also provided facilitation for export of red meat. A total of 41.286 thousand tons of red meat was exported during 2016-17 (July-Mar). The export of meat fetched US $ 135.036 million. This meat was exported from private sector slaughterhouses. During same period export facilitation was also provided for livestock by-products like animal casing, bones, horns & hooves and gelatin. The effort continued for market access with the concerned authorities of Russia, China, South Africa, Egypt, Hong Kong and Indonesia through diplomatic channel for export of our meat and meat products.
Livestock Wing regulated import of superior quality semen and high yielding exotic dairy cattle of Holstein-Friesian & Jersey breeds for genetic improvement of indigenous dairy
animals. During 2016-17 (July-March), 556,565 thousand doses of semen and 9,123 exotic dairy cows were imported. The exotic dairy cows added approximately 70 million tons of milk per annum in the commercial milk chain/system.
In order to facilitate dairy farmer, duty free import of calf milk replacer & cattle feed premix was allowed. During 2016-17 (July-March), 310.2 metric tons of calf milk replacer & 298.9 metric tons of cattle feed premix was imported. Similarly, to promote and encourage value added livestock processing industry in the country, duty free import of machinery for milk, beef, mutton & poultry processing was allowed.
During 2016-17 (July-March), the Animal Quarantine Department (AQD) provided quarantine services and issued 28,217 Health Certificates for the export of live animals, mutton, beef, eggs and other livestock products having value of US$ 294.414 million. The AQD generated non-tax revenue of Rs. 103.232 million during 2016-17 (July-March) as certificate / laboratory examination fee of animal and animal products exported during the year.
The National Veterinary Laboratory (NVL), Islamabad is a national institution for service and regulatory support to national livestock wealth with mission to promote greater productivity and profitability from the livestock industries in Pakistan. The NVL conducted surveillance and diagnostics on highly contagious diseases of animals. It also carried out activities on National and Regional Projects regarding prevention and control of

Agriculture
39
Transboundary Animal Diseases in Pakistan. During 2016-17 (July-March), 10,264 samples were analyzed for disease diagnosis surveillance, veterinary vaccines and residue testing. These samples were submitted from provincial livestock departments, development projects, ICT, AJK and FATA besides animal product exporters.
Livestock Wing also collaborated with international (Office International des Epizooties OIE, Food and Agriculture Organization FAO) and regional organizations (South Asian Association for Regional Cooperation (SAARC), Economic Cooperation Organization (ECO), Animal Production & Health Commission for Asia (APHCA) and European Union (EU) for human resource development (HRD) and capacity building of national and provincial livestock institutions for diagnosis and control of animal diseases. Inter Provincial Coordination is being done by the Livestock Wing to implement the National Programme to Control Foot & Mouth Disease (FMD) and Peste des Petitis Ruminants (PPR) disease in Pakistan. Pakistan has been progressing on OIE FMD freedom pathway and moved to stage 02 of the 06 stage pathway. A National FMD Control Programme at a cost of Rs.764 million for the period of six years has been through from competent forums to sustain and continue project activities during the subsequent years. This will help in improving animal health status of the country regarding transboundary animal diseases.
On account of concerted efforts, two members of UAE technical team visited Pakistan from 16th-20th January, 2017. The delegation visited National Reference Laboratory for Poultry Diseases (NRLPD), NARC, National Veterinary Laboratories, Islamabad; Poultry Research Institute, Rawalpindi, Diagnostic Laboratory of University of Veterinary and Animal sciences (UVAS), Lahore; Quarantine facilities, poultry farms/hatcheries and poultry processing plants, in order to witness/examine the diagnostic facilities, test protocols, inspection services, bio security/ bio safety measures, standard operating procedure, (SOP), good management practices (GMP) and
sanitary/hygiene etc., at these places. On receipt of inspection report from UAE technical team, Government of UAE has lifted ban on import of poultry and poultry products from Pakistan. This would go a long way in promoting export of poultry and poultry products from the country.
In December, 2016, Royal Friesland Company acquired 51 percent of Engro Food Pakistan. This is one of the largest private sector Foreign Direct Investment in dairy sector of Pakistan amounting to investment of US $ 450 Million. Under new deal and 2020 strategy arrangements, Engro food will go for higher milk quality, variety of milk packages and products and farmers’ capacity building leading to reduction in poverty. This has given, a positive signal and more investments in dairy sector are expected during the coming years.
Moreover, to attract further investment in dairy sector, protect the small dairy farmers and the corporate dairy sector, beside discouraging import and mitigate use of synthetic milk and recipe products, regulatory duties to the tune of 25 percent have been imposed on import of Skimmed Milk Powder (SMP) and Whey Powder (WP).
Future Plans
The Future Plans will continue to focus on i) Inter-Provincial Coordination for development of livestock sector, ii) Coordination with private sector to promote value addition livestock industry and diversification of livestock products, iii) Controlling Trans-boundary Animal Diseases (FMD, PPR, Zoonotic diseases) of trade and economic importance through provincial participation, iv)Bringing more investments in livestock sectors and v) Exploring new markets for export of meat and dairy products with focus on Global Halal Food Trade Market.
IV. Fisheries
Fishery plays an important role in Pakistan’s economy and is considered to be a source of livelihood for the coastal inhabitants. Apart from marine fisheries, inland fisheries (based in rivers, lakes, ponds, dams etc.) is also very
Pakistan Economic Survey 2016-17
40
important activity throughout the country. Fisheries’share in GDP is 0.41 percent but has a value addition in export earnings.
During 2016-17 (July-March), total marine and inland fish production was estimated at 520,000 m. tons out of which 375,000 m. tons was marine production and the remaining catch came from inland waters. Whereas the production for the period 2015-16 (July-March), was estimated to be 501,000 m. tons in which 368,000 m. tons was marine and the remaining was produced by inland fishery sector.
A total of 103,277 m. tons of fish and fish preparations was exported during 2016-17 (July-March). Pakistan’s major buyers are China, Thailand, Malaysia, Middle East, Sri Lanka, Japan, etc. Pakistan earned US $ 276.269 million. Whereas the export of fish and fish preparations for 2015-16 (July-March) was 92,046 m. tons amounting to US $ 240.038 million. The exports of fish and fish preparations have increased by 12.20 percent in quantity and 15.09 percent in value during 2016-17 (July-March).
Government of Pakistan is taking a number of steps to improve fisheries sector. A number of initiative are being taken by federal and provincial fisheries departments which includes inter alia strengthening of extension services, introduction of new fishing methodologies, development of value added products, enhancement of per capita consumption of fish, and up-gradation of socio-economic conditions of the fishermen’s community.
i) Biological and Hydrological Research
During 2016-17 (July-March), samples of seawater collected from coastal areas were analyzed to determine parameters which affect fish distribution. Fish samples of different species were examined for study of length-weight relationship, sex ratio, maturity, food and feeding habit and fecundity etc. Monitoring for fish landing to determine stock position was also carried out at Karachi Fish Harbour.
ii) Quality Control Services
Marine Fisheries Department (MFD) is responsible to regulate quality and promote export of fish and fishery products and to prevent export of substandard quality of seafood products. In this connection, during 2016-17 (July-March), the Quality Control Section of MFD has issued 14,174 certificates of Health and Quality & Origin for seafood commodities exported from Pakistan.
iii) Turtle Excluder Device (TED) and Trials of TED by Local Fishermen
A training course on construction, installation and use of TED was also conducted for the fishermen of shrimp trawlers. Fifty Five fishermen including representatives of the other organizations participated in this meeting. The primary purpose of introduction of TED is to reduce the mortality of sea turtles in fishing nets and to fulfill the obligatory requirement of United States regulation for the export of shrimp to USA.
Pakistan is also a signatory to the FAO’s Code of Conduct for responsible fishing. The federal and provincial governments have assigned the task to the Maritime Security Agency for ensuring compliance with the TED on all the fishing boats in the sea.
v) Modernized Fishing Fleets
To meet the requirement of EU and other importing countries, technical assistance in respect of modification of fishing boats was rendered to provincial governments and relevant stakeholders, as a result a total number of 1300 fishing boats have been modified. Monitoring of modification is carried out by MFD.
vi) Deep Sea Fishing
During the period under report no deep sea fishing vessel was not in operation. As per direction Prime Minister’s Deep Sea Fishing Policy is being revised in consultation with all relevant stakeholders.