unlocking pakistan’s revenue potential - imf.org · pdf fileunlocking pakistan’s...
TRANSCRIPT
WP/16/182
Unlocking Pakistan’s Revenue Potential
by Serhan Cevik
© 2016 International Monetary Fund WP/16/182
IMF Working Paper
Fiscal Affairs Department
Unlocking Pakistan’s Revenue Potential
Prepared by Serhan Cevik
Authorized for distribution by Era Dabla-Norris
August 2016
Abstract
Despite the significant progress in recent years, Pakistan’s tax revenue remains low relative to comparator countries and the tax effort expected for the country’s level of development. In light of the potential endogenity of tax revenue and economic growth, this paper contributes to the literature by developing a novel identification strategy to estimate the short-run and long-run elasticities of tax revenue. The empirical findings indicate that a tax system with low elasticity cannot take full advantage of economic growth. Accordingly, unlocking revenue potential is dependent on broadening the tax base, strengthening administration, and rationalizing tax policy across all levels of the general government.
JEL Classification Numbers: C23, C32, E62, H2, H62, H68
Keywords: Tax policy, revenue administration, tax bouyancy, tax elasticity
Author’s E-Mail Address: [email protected]
The author would like to thank Harald Finger, Mario Mansour, Tigran Poghosyan, Alexander Tieman, participants at a seminar organized by the Fiscal Affairs Department of the International Monetary Fund, and representatives of the Federal Board of Revenue and the Ministry of Finance for insightful comments and suggestions, and Tasneem Alam and Hiba Zaidi for assistance in data collection. An earlier version of this paper was issued as a Selected Issues Paper and served as background material for the Executive Board Meeting on the 2015 Article IV Consultation for Pakistan.
IMF Working Papers describe research in progress by the author(s) and are published to elicit comments and to encourage debate. The views expressed in IMF Working Papers are those of the author(s) and do not necessarily represent the views of the IMF, its Executive Board, or IMF management.
2
Contents Page
Abstract ................................................................................................................................................................................. 2
I. Introduction ..................................................................................................................................................................... 3
II. Tax Regime and Revenue Performance ............................................................................................................... 5
III. Evolution of Tax Buoyancy and Efficiency .......................................................................................................... 9
IV. Estimating Tax Revenue Elasticity ...................................................................................................................... 11
V. Robustness Check—A Cross-Country Perspective ....................................................................................... 15
VI. Conclusion—The Way Forward .......................................................................................................................... 17
References ......................................................................................................................................................................... 21 Tables 1. Composition of Tax Revenues ................................................................................................................................. 5 2. Cost of Tax Expenditures ........................................................................................................................................... 8 3. Tax Revenue Elasticity: IV-2SLS Estimates ........................................................................................................ 13 4. Tax Revenue Elasticity: Two-Step ECM Estimates ......................................................................................... 14 5. Cross-Country Tax Revenue Elasticity: IV-2SLS Estimates .......................................................................... 16
Figures 1. Tax Revenues in International Perspective ......................................................................................................... 3 2. Number of Taxpayers .................................................................................................................................................. 6 3. Agricultural Sector and Tax Revenues .................................................................................................................. 7 4. Tax Buoyancy ............................................................................................................................................................... 10 6. Corruption, Business Climate and Tax Revenues .......................................................................................... 19
3
I. INTRODUCTION
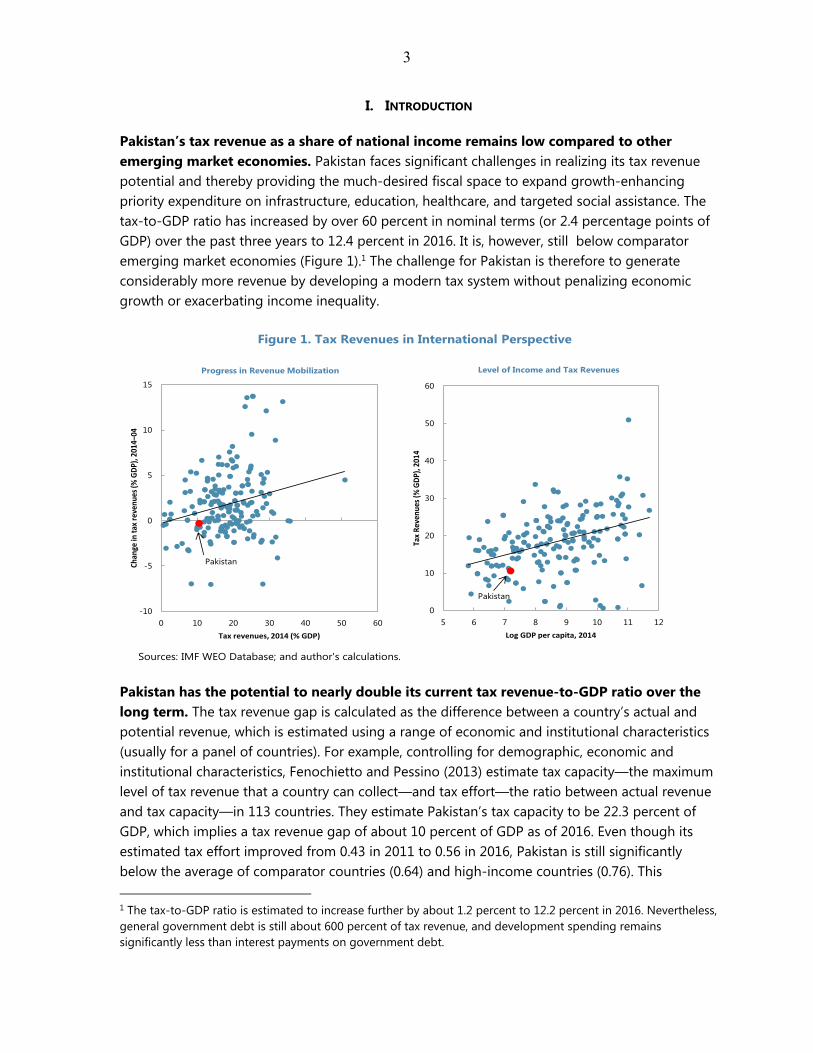
Pakistan’s tax revenue as a share of national income remains low compared to other emerging market economies. Pakistan faces significant challenges in realizing its tax revenue potential and thereby providing the much-desired fiscal space to expand growth-enhancing priority expenditure on infrastructure, education, healthcare, and targeted social assistance. The tax-to-GDP ratio has increased by over 60 percent in nominal terms (or 2.4 percentage points of GDP) over the past three years to 12.4 percent in 2016. It is, however, still below comparator emerging market economies (Figure 1).1 The challenge for Pakistan is therefore to generate considerably more revenue by developing a modern tax system without penalizing economic growth or exacerbating income inequality.
Pakistan has the potential to nearly double its current tax revenue-to-GDP ratio over the long term. The tax revenue gap is calculated as the difference between a country’s actual and potential revenue, which is estimated using a range of economic and institutional characteristics (usually for a panel of countries). For example, controlling for demographic, economic and institutional characteristics, Fenochietto and Pessino (2013) estimate tax capacity—the maximum level of tax revenue that a country can collect—and tax effort—the ratio between actual revenue and tax capacity—in 113 countries. They estimate Pakistan’s tax capacity to be 22.3 percent of GDP, which implies a tax revenue gap of about 10 percent of GDP as of 2016. Even though its estimated tax effort improved from 0.43 in 2011 to 0.56 in 2016, Pakistan is still significantly below the average of comparator countries (0.64) and high-income countries (0.76). This 1 The tax-to-GDP ratio is estimated to increase further by about 1.2 percent to 12.2 percent in 2016. Nevertheless, general government debt is still about 600 percent of tax revenue, and development spending remains significantly less than interest payments on government debt.
Figure 1. Tax Revenues in International Perspective
Sources: IMF WEO Database; and author's calculations.
-10
-5
0
5
10
15
0 10 20 30 40 50 60
Chan
ge in
tax
rev
enue
s (%
GD
P), 2
014–
04
Tax revenues, 2014 (% GDP)
Progress in Revenue Mobilization
Pakistan
0
10
20
30
40
50
60
5 6 7 8 9 10 11 12
Tax
Rev
enu
es (%
GD
P), 2
014
Log GDP per capita, 2014
Pakistan
Level of Income and Tax Revenues
4
indicates that Pakistan can realistically achieve a tax ratio of 14-15 percent of GDP over the medium term by bringing the tax effort toward the average level of developing countries.
Pakistan’s tax system with low elasticity cannot take advantage of economic growth to a greater extent. In this paper, I estimate both short-run and long-run elasticities of tax revenue in Pakistan over the period 1960-2015 to better understand the evolution of tax revenue in the context of changing economic activity. In view of the potential endogeneity of tax revenue and economic growth, I apply both an instrumental variable (IV) approach and a multivariate cointegration analysis to estimate an Error Correction Model (ECM). The empirical results indicate that both short-run and long-run elasticities of tax revenue are slightly above 1 over the sample period. There is, however, significant variation in short-run and long-run elasticities across subcategories of tax revenue. I find that corporate income tax (CIT) and the general sales tax (GST) are more responsive to GDP, with elasticity coefficient well above 1, while personal income tax (PIT) appears to be significantly less elastic. This could, however, partly reflect the fact that Pakistan's income tax system relies heavily on withholding taxes, a substantial amount of which is treated as a final tax and often not declared in PIT returns either as adjustable tax or final tax. I also conduct a panel data analysis to put Pakistan’s performance in an international perspective and find that Pakistan’s tax revenue elasticity is well below the average of developing countries.
The empirical findings have notable policy implications and underscore the need for comprehensive reforms. Unlocking Pakistan’s tax revenue potential through reforms at federal and provincial levels can help achieve stable public finances, boost economic growth, employment and competitiveness, and contribute to a fair distribution of income.2 The government has already implemented a series of reforms aimed at improving tax revenue mobilization by rationalizing tax expenditures, broadening the tax base and strengthening taxpayer compliance, and it plans to increase the tax revenue ratio to close to 15 percent of GDP by 2020. This paper offers recommendations on additional tax reforms, while avoiding to increase revenue by further taxing already compliant taxpayers, which would worsen inequalities, undermine tax morale and cause distortions in economic activity. Empirical findings indicate that sustainable domestic revenue mobilization requires a concerted agenda of well-defined reform efforts aimed at broadening tax bases, strengthening revenue administration and taxpayer compliance, eliminating distortionary and overgenerous tax concessions and exemptions, and rationalizing tax policy in an efficient and equitable manner. In this context, improving the perceived fairness of the tax system is a cornerstone of revenue mobilization efforts, as Pakistan ranks low on measures of corruption and has weak auditing procedures.
The remainder of this paper is organized as follows. Section II describes main features of Pakistan’s tax system and reviews revenue performance over time. Section III presents the evolution of tax buoyancy and efficiency at a disaggregated level. Section IV empirically analyzes
2 Expenditure rationalization aiming to change the composition in favor of growth-enhancing social and infrastructure spending is also critical, but beyond the scope of this paper.

5
short- and long-run tax revenue elasticities. Section V provides recommendations on comprehensive tax reforms, followed by concluding remarks in the final section.
II. TAX REGIME AND REVENUE PERFORMANCE
The lackluster performance in mobilizing tax revenue is a result of a labyrinth of interconnected factors. Narrow tax bases, extensive tax concessions and exemptions, challenges in revenue administration, and low taxpayer compliance through informal economic activity and underreporting of formal income result in substantial loss of tax revenue relative to the country’s potential. While many developing countries struggle with similar challenges, the situation in Pakistan is further complicated by fragmentation in revenue administration. According to the constitution, provincial governments are responsible for taxation of agriculture, services and immovable property, which represent a significant share of economic activity and thereby a substantial pool of potential tax revenues. However, provincial governments appear to have inadequate administrative capacity and limited incentive for local revenue mobilization, as they rely on the transfer of shared revenues from the federal government. While provinces have already been able to strengthen their own tax collection as result of administrative improvements, revenue collection remains highly centralized with the federal government collecting over 92 percent of total tax revenues, with provincial governments’ own revenues contributing the remaining 7.7 percent. High levels of informality in the economy further constrain tax compliance and enforcement, especially given significant gaps in information gathering and sharing across all layers of government. In addition, institutional challenges in revenue administration, such as bureaucratic red tape and corruption, undermine tax morale and compliance.
2009 2011 2012 2016
Tax revenue 10.1 10.1 9.5 10.4 10.0 10.5 11.0 12.4Federal 9.7 9.7 9.2 9.8 9.3 9.7 10.2 11.4
FBR revenue 8.8 8.9 8.5 9.4 8.6 9.0 9.4 10.5Direct taxes 3.3 3.6 3.3 3.7 3.3 3.5 3.7 4.0Federal excise duty 0.9 0.8 0.8 0.6 0.5 0.6 0.6 0.6Sales tax 3.4 3.5 3.5 4.0 3.8 4.0 4.0 4.5Customs duties 1.1 1.1 1.0 1.1 1.1 1.0 1.1 1.4
Other 1.0 0.8 0.6 0.5 0.6 0.7 0.8 0.9Provincial 0.3 0.4 0.4 0.5 0.7 0.8 0.7 1.0
Agriculture 0.0 0.0 0.0 0.0 0.0 0.0 0.0 0.0Property 0.0 0.0 0.0 0.0 0.0 0.0 0.0 0.1Other 1/ 0.3 0.3 0.3 0.5 0.6 0.7 0.7 0.9
Sources: Ministry of Finance; and author's calculations.1/ Other provincial tax revenue includes excise and stamp duties, motor vehicle tax and GST on services.
Table 1. Composition of Tax Revenues(In percent of GDP)
2010 2013 2014 2015
6
The composition of tax revenues is highly skewed towards indirect taxes, which account for about two-thirds of total tax revenue. Although trade liberalization and tariff rationalization have lowered revenues related to foreign trade in Pakistan, indirect taxes still account for about 65 percent of federal tax revenue (Table 1). The share of direct taxes, on the other hand, has increased from an average of 18.5 percent in the first half of the 1990s to 29 percent in 2000 and about 38 percent in recent years. However, the level of income taxes in Pakistan (4 percent of GDP) remains unfavorable compared to other developing countries, where direct taxes amount to 5.5 percent of GDP and 55 percent of total tax revenue. Although the statutory CIT and PIT rates declined from 45 percent in 1990 to 31 percent and 20 percent, respectively, by 2016, Pakistan’s low level of direct taxes is mostly a result of weak compliance and enforcement and abundant concessions and exemptions. This leaves Pakistan with an unusually heavy dependence on indirect taxes collected from very narrow tax bases and vulnerable to fluctuations in import prices.
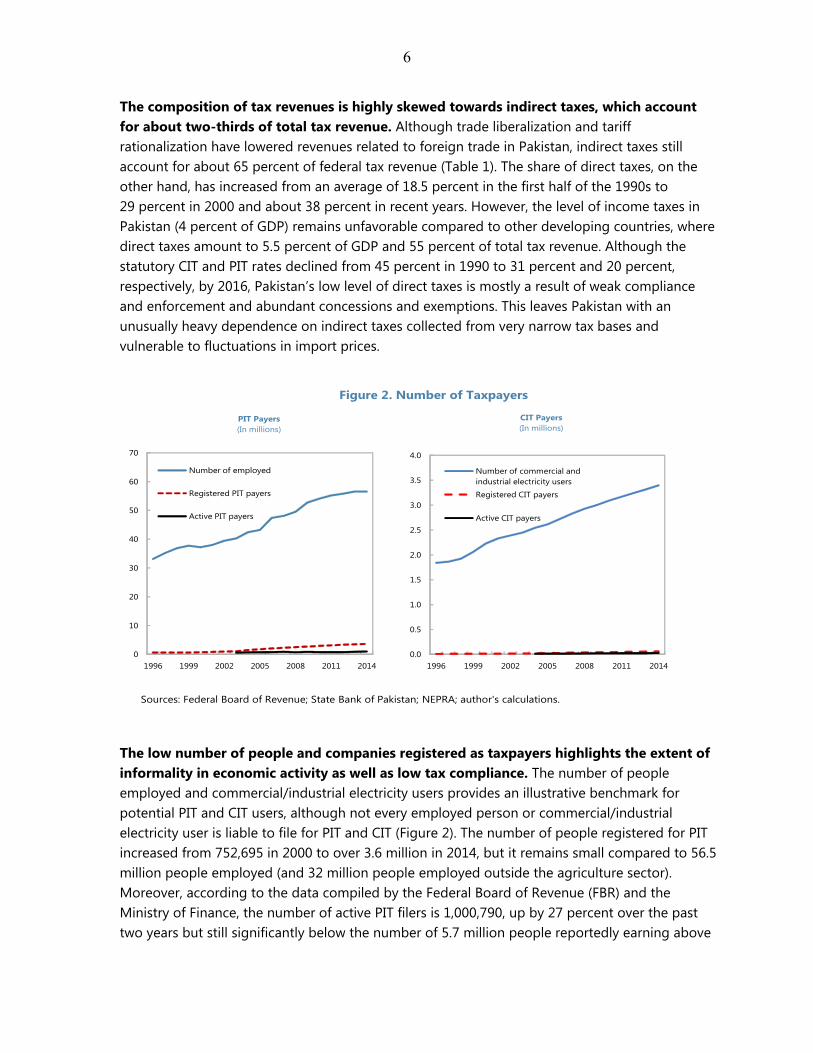
The low number of people and companies registered as taxpayers highlights the extent of informality in economic activity as well as low tax compliance. The number of people employed and commercial/industrial electricity users provides an illustrative benchmark for potential PIT and CIT users, although not every employed person or commercial/industrial electricity user is liable to file for PIT and CIT (Figure 2). The number of people registered for PIT increased from 752,695 in 2000 to over 3.6 million in 2014, but it remains small compared to 56.5 million people employed (and 32 million people employed outside the agriculture sector). Moreover, according to the data compiled by the Federal Board of Revenue (FBR) and the Ministry of Finance, the number of active PIT filers is 1,000,790, up by 27 percent over the past two years but still significantly below the number of 5.7 million people reportedly earning above
Figure 2. Number of Taxpayers
Sources: Federal Board of Revenue; State Bank of Pakistan; NEPRA; author's calculations.
0
10
20
30
40
50
60
70
1996 1999 2002 2005 2008 2011 2014
Number of employed
Registered PIT payers
Active PIT payers
PIT Payers(In millions)
0.0
0.5
1.0
1.5
2.0
2.5
3.0
3.5
4.0
1996 1999 2002 2005 2008 2011 2014
Number of commercial and industrial electricity users
Registered CIT payers
Active CIT payers
CIT Payers(In millions)
7
the income tax threshold set at PRs 400,000 (or about US$3,800).3 Similarly, the number of active CIT filers is 27,334out of more than 60,000 companies registered for CIT and a mere 0.8 percent of the number of commercial/industrial electricity users, which represent an illustrative pool of potential entities liable for taxation. With regards to the sales tax regime, the number of entities registered for the GST is 178,190 out of about 1.4 million retailers and 3.4 million commercial and industrial electricity users.
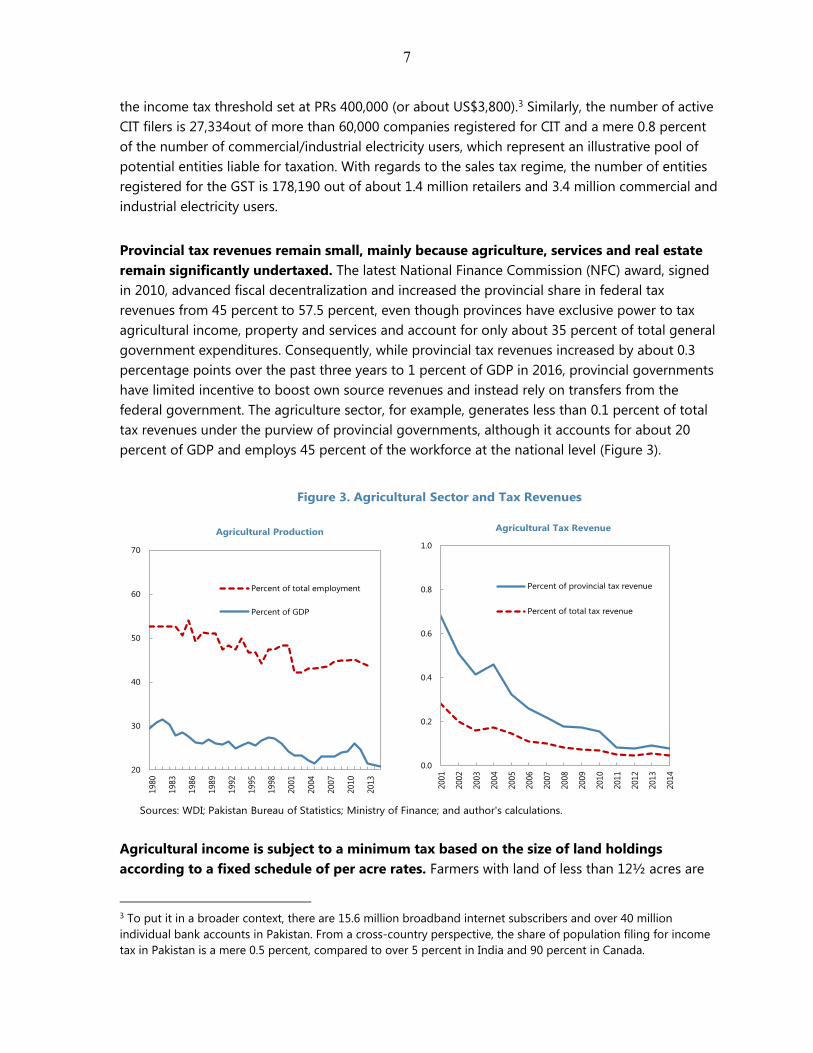
Provincial tax revenues remain small, mainly because agriculture, services and real estate remain significantly undertaxed. The latest National Finance Commission (NFC) award, signed in 2010, advanced fiscal decentralization and increased the provincial share in federal tax revenues from 45 percent to 57.5 percent, even though provinces have exclusive power to tax agricultural income, property and services and account for only about 35 percent of total general government expenditures. Consequently, while provincial tax revenues increased by about 0.3 percentage points over the past three years to 1 percent of GDP in 2016, provincial governments have limited incentive to boost own source revenues and instead rely on transfers from the federal government. The agriculture sector, for example, generates less than 0.1 percent of total tax revenues under the purview of provincial governments, although it accounts for about 20 percent of GDP and employs 45 percent of the workforce at the national level (Figure 3).
Agricultural income is subject to a minimum tax based on the size of land holdings according to a fixed schedule of per acre rates. Farmers with land of less than 12½ acres are
3 To put it in a broader context, there are 15.6 million broadband internet subscribers and over 40 million individual bank accounts in Pakistan. From a cross-country perspective, the share of population filing for income tax in Pakistan is a mere 0.5 percent, compared to over 5 percent in India and 90 percent in Canada.
Figure 3. Agricultural Sector and Tax Revenues
Sources: WDI; Pakistan Bureau of Statistics; Ministry of Finance; and author's calculations.
20
30
40
50
60
70
1980
1983
1986
1989
1992
1995
1998
2001
2004
2007
2010
2013
Percent of total employment
Percent of GDP
Agricultural Production
0.0
0.2
0.4
0.6
0.8
1.0
2001
2002
2003
2004
2005
2006
2007
2008
2009
2010
2011
2012
2013
2014
Percent of provincial tax revenue
Percent of total tax revenue
Agricultural Tax Revenue

8
exempted from taxation, while those owning up to 25 acres of land pay PRs 100 per acre and the per acre rate increases to PRs 250 for land holdings between 26 and 50 acres and to PRs 300 for over 50 acres of land. Farmers with over 50 acres of irrigated land are also required to file for income tax. Since over 90 percent of farmers appear to have land holdings less than 12½ acres, agricultural income remains largely untaxed and annual agricultural tax revenue amounts to PRs 270 (or less than US$3) per acre on average. Similarly, taxes on property and services under the purview of provincial governments generate a mere 0.04 percent and 0.6 percent of GDP, respectively. With changes in consumption patterns and sectoral composition of economic activity over time, taxation of services has become far more important for revenue mobilization.4
The extensive use of tax concessions and exemptions has resulted in a distortionary tax regime. The overall cost of tax expenditures increased from 0.2 percent of GDP (or about 2 percent of tax revenues) in 2000 to the peak of 1.9 percent of GDP (or almost 20 percent of tax revenues) in 2014.5 Moreover, most of these concessions and exemptions have been granted under a variety of schemes and modalities, such as the Statutory Regulatory Orders (SROs), with limited transparency and parliamentary oversight. As part of fiscal consolidation through tax reforms, the government eliminated tax concessions and exemptions amounting to about 0.6 percent of GDP since 2014 (Table 2). In addition, parliament passed legislation that limits the authorization for concessional SROs on a temporary basis in a number of exceptional circumstances by the Economic Coordination Committee of the cabinet. There is, however, further need for rationalizing overgenerous tax expenditures, which pose a considerable threat to the integrity of the tax system as a whole as it creates loopholes in legislation and distortions in economic activity (IMF, 2011; 2015).
4 Services make up over 52 percent of GDP, while industry and agriculture account for about 22 percent and 25 percent, respectively.
5 A part of the increase in GST exemptions in FY2013/14 is a result of improvements in measurement.
2010/11 2011/12 2012/13 2013/14 2014/15 2015/16
Income tax 46.5 69.6 82.4 96.6 83.0 67.3Percent of GDP 0.3 0.3 0.4 0.4 0.3 0.2
GST 25.3 24.3 37.4 249.0 225.4 207.3Percent of GDP 0.1 0.1 0.2 1.0 0.8 0.7
Customs duty 94.9 112.0 119.7 131.5 103.0 120.0Percent of GDP 0.5 0.6 0.5 0.5 0.4 0.4
Total 166.7 205.9 239.5 477.1 411.4 394.6Percent of GDP 0.9 1.0 1.1 1.9 1.5 1.3
Sources: Ministry of Finance; and author's calculations.
Table 2. Cost of Tax Expenditures(In billion rupees)

9
III. EVOLUTION OF TAX BUOYANCY AND EFFICIENCY
Analyzing factors that determine revenue performance is complicated, since these can be attributed to changes in both the tax system and the tax base. One of the useful concepts is tax buoyancy, explaining how tax revenue varies with changes in the underlying tax base (Belinga, Benedek, de Mooji and Norregaard, 2014). The tax base is typically gauged by GDP in developing countries (mainly because of data constraints), although more specific measures are possible, such as private consumption as the base for the GST, or imports as the base for trade tariffs. Tax buoyancy is defined as the change in tax revenue (actual net receipts) in a given year, divided by the change in the tax base, and measured in real terms to avoid a bias towards 1 that may have been caused by using nominal values in calculations. Accordingly, a buoyancy of 1 would imply that an additional 1 percent of GDP would increase tax revenue also by 1 percent, which results in a neutral impact on the tax-to-GDP ratio. The objective of tax reforms is therefore to raise tax buoyancy above 1 in order to increase tax revenue collection by more than the extent of change in nominal GDP.6 As tax buoyancy may vary significantly from one year to another, it is more appropriate to look at its trend over a longer period, using a simple average or a regression analysis. Negative buoyancy values can occur either because real GDP growth is negative or because real tax revenue growth turns out negative. On the other hand, if both readings are negative, tax buoyancy has a positive value. International evidence on tax buoyancy provided by Talvi and Vegh (2005) indicates that the magnitude of the change in tax revenues tends to be significantly greater than the rate of change of the appropriate tax base.7
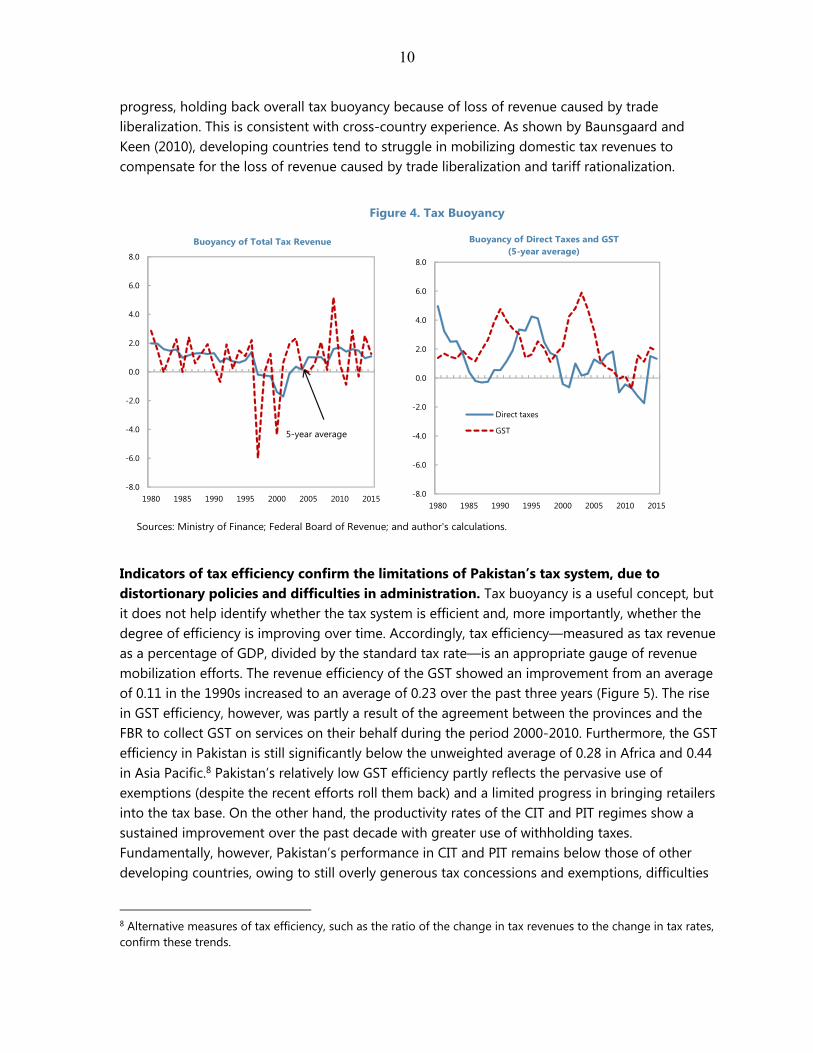
Pakistan’s tax revenue buoyancy has exceeded unity in recent years, but it remains prone to high volatility. Over the last two and half decades, Pakistan’s tax revenue-to-GDP ratio remained in a narrow range—oscillating between the low of 9 percent and the peak of 12.4 percent. Tax buoyancy, on the other hand, has exhibited a boom-bust pattern with high volatility that reflects not only tax policy changes, but also the impact of administrative challenges, political crises and economic difficulties on taxpayer behavior. In recent years, tax buoyancy has improved to well above unity from an average of 0.2 in the 1990s (Figure 4). However, the five-year moving average of aggregate tax buoyancy remains below the recent peak. The analysis using disaggregated data at the federal level shows interesting features of tax buoyancy. First, there is limited synchronization of buoyancy across subcategories of tax revenue. Second, the GST buoyancy has recovered in recent years with the elimination of exemptions, but remains significantly below the peak when provinces agreed to the collection of GST on services by the FBR. Third, the buoyancy of direct taxes shows no sustained improvement, except over the past few years with the elimination of concessions and exemptions. Fourth, the buoyancy of excises (which are generally structured as non-ad valorem) is significant cause of limited
6 The numerator reflects both tax policy and administration efforts, and therefore it may be difficult to interpret this concept exclusively for policymaking purposes.
7 The correlation between tax revenue growth and trend output growth is estimated to be 0.53 for developing countries and 0.38 for advanced economies.
10
progress, holding back overall tax buoyancy because of loss of revenue caused by trade liberalization. This is consistent with cross-country experience. As shown by Baunsgaard and Keen (2010), developing countries tend to struggle in mobilizing domestic tax revenues to compensate for the loss of revenue caused by trade liberalization and tariff rationalization.
Indicators of tax efficiency confirm the limitations of Pakistan’s tax system, due to distortionary policies and difficulties in administration. Tax buoyancy is a useful concept, but it does not help identify whether the tax system is efficient and, more importantly, whether the degree of efficiency is improving over time. Accordingly, tax efficiency—measured as tax revenue as a percentage of GDP, divided by the standard tax rate—is an appropriate gauge of revenue mobilization efforts. The revenue efficiency of the GST showed an improvement from an average of 0.11 in the 1990s increased to an average of 0.23 over the past three years (Figure 5). The rise in GST efficiency, however, was partly a result of the agreement between the provinces and the FBR to collect GST on services on their behalf during the period 2000-2010. Furthermore, the GST efficiency in Pakistan is still significantly below the unweighted average of 0.28 in Africa and 0.44 in Asia Pacific.8 Pakistan’s relatively low GST efficiency partly reflects the pervasive use of exemptions (despite the recent efforts roll them back) and a limited progress in bringing retailers into the tax base. On the other hand, the productivity rates of the CIT and PIT regimes show a sustained improvement over the past decade with greater use of withholding taxes. Fundamentally, however, Pakistan’s performance in CIT and PIT remains below those of other developing countries, owing to still overly generous tax concessions and exemptions, difficulties
8 Alternative measures of tax efficiency, such as the ratio of the change in tax revenues to the change in tax rates, confirm these trends.
Figure 4. Tax Buoyancy
Sources: Ministry of Finance; Federal Board of Revenue; and author's calculations.
-8.0
-6.0
-4.0
-2.0
0.0
2.0
4.0
6.0
8.0
1980 1985 1990 1995 2000 2005 2010 2015
Buoyancy of Total Tax Revenue
5-year average
-8.0
-6.0
-4.0
-2.0
0.0
2.0
4.0
6.0
8.0
1980 1985 1990 1995 2000 2005 2010 2015
Direct taxes
GST
Buoyancy of Direct Taxes and GST(5-year average)

11
in tax administration, and low taxpayer compliance through informal economic activity and underreporting of formal income.
IV. ESTIMATING TAX REVENUE ELASTICITY
The tax revenue elasticity helps understand the behavior of tax revenues over time in the context of economic cycles and tax policy changes. A simple way to illustrate how tax revenues evolve over time in response to growth in the tax base (i.e., GDP) is to estimate the tax revenue elasticity.9 The difference between tax buoyancy and tax elasticity is that the latter takes into account discretionary changes in tax policy. In this case, the tax revenue elasticity is defined as the percent change in tax revenue divided by the percent change in the tax base, controlled for tax policy changes. The responsiveness of tax revenue to macroeconomic developments is critical in analyzing the impact of fiscal policy on economic activity as well as fiscal sustainability over the medium term. Using annual data from 1960 to 2015, the long-run tax revenue elasticity is estimated according to the following equation:
ln ln
where revenue represents tax revenue in real terms at time t; gdp is real GDP; and tax rate is the standard tax rate. Estimates are presented for three main subcategories of tax revenue (CIT, PIT and GST), as well as at an aggregated level of tax revenue in Pakistan. This specification including the tax rate allows controlling for tax policy changes over time as measured by the changes in tax 9 While it is acceptable to utilize GDP as the tax base in estimating the elasticity of total tax revenue, it may cause ambiguity in estimations at a disaggregated level. For example, it is more appropriate to use corporate profits and household income instead of GDP as the tax base in estimating the elasticity rates of CIT and PIT, respectively. Due to data constraints, I use GDP as the tax base for all three subcategories of tax revenue.
Figure 5. Tax Efficiency
Sources: Ministry of Finance; Federal Board of Revenue; and author's calculations.
0.00
0.10
0.20
0.30
0.40
0.50
0.60
0.70
0.80
0.90
1.00
1980 1985 1990 1995 2000 2005 2010 2015
GST
0.00
0.10
0.20
0.30
0.40
0.50
0.60
0.70
0.80
0.90
1.00
1980 1985 1990 1995 2000 2005 2010 2015
CIT
PIT
Direct Taxes

12
rates, but not in other discretionary tax policy parameters. The coefficient measures the tax revenue elasticity with respect to GDP. If the coefficient is greater (lower) than 1, tax revenue grows faster (slower) than GDP and thereby raises the tax-to-GDP ratio. In other words, if the tax system is inelastic to changes in GDP over the long run, frequent changes in tax policy are required to steady tax revenue as a share of GDP in the short term, with adverse effects on resource allocation and distribution.
I apply the IV regression strategy to control for endogeneity and other biases in estimating the tax revenue elasticity. Obtaining consistent and unbiased estimates of the tax revenue elasticity is difficult because of the endogenous reaction of real GDP growth to changes in tax rates and measurement errors in national accounts. As it is highly plausible that tax policy changes affect economic activity, the risk of reverse causality necessitates isolating the direction of causality. In the presence of endogeneity, the ordinary least squares (OLS) regression yields biased and inconsistent parameter estimates. I deal with the potential endogeneity problem by using the IV method via the two-stage least squares (2SLS) approach, which is a widely used estimator for simultaneous equation models.10 Following the empirical literature (Miguel, Satyanath, and Sergenti, 2004; Brückner, 2012), I consider rainfall shocks and international commodity prices (in real terms) as potential IVs.11 In the case of Pakistan, however, while international commodity prices perform better than rainfall variation, these series are not robust instruments for real GDP. Instead, following Acemoglu, Johnson, Robinson, and Yared (2008), I exploit the trade-weighted average real GDP of Pakistan’s trading partners as an instrument that is correlated with Pakistan’s real GDP, but uncontaminated by tax policy changes in Pakistan.12
Using time-series data to estimate relationships such as this requires caution, since non-stationary observations may produce spurious results. Both GDP and tax series contain unit root, and thus are non-stationary in levels.13 Upon first differencing, however, the variables are stationary. Accordingly, the regression model is estimated in first differences, thereby providing the estimates of short-run tax elasticity. Tax data used in this analysis are obtained from the FBR and the Ministry of Finance, while GDP and deflator are taken from the State Bank of Pakistan and the World Bank’s World Development Indicators database. Rainfall, international commodity prices and trade-weighted average real GDP of Pakistan’s trading partners used in constructing IV series are drawn from the Climatic Research Unit of the University of East Anglia, the World
10 For robustness check, I also estimate the models using the IV-Generalized Method of Moments (GMM) and reach similar results.
11 To be valid, the proposed IV must be strongly correlated with the endogenous variable (GDP in this case), but exogenous and unrelated with the error term in the regression equation.
12 Pakistan’s international trade (exports plus imports) amounts to only about 20 percent of GDP, allowing its trading partners’ average GDP per capita to function as an appropriate IV for the country’s own income per capita in the context of estimating tax revenue elasticity.
13 The unit root test results are available upon request.

13
Bank’s Global Economic Monitor Commodities database, and the IMF’s World Economic Outlook database, respectively.
The IV regression results, presented in Table 3, show that the short-run elasticity of CIT and GST revenues to be above 1, while PIT is less responsive. Including a weighted average of tax rates in the regression, I estimate the short-run elasticity of total tax revenue to be 1.16 and statistically significant at the 1 percent level. This implies that total tax revenue increase by about 1.16 percent in response to an increase of 1 percent in GDP, while a change in tax rates appears to have no significant effect on tax revenue in the short run.14 At a disaggregated level, the short-run elasticities of CIT and PIT revenues are estimated to be 1.37 and 0.96, respectively. These coefficients indicate that CIT and PIT revenues increase by about 1.4 percent and 1 percent for every 1 percent increase in GDP. However, it should be noted that the PIT estimates do not capture the prevalence of withholding taxes, a substantial amount of which is treated as a final tax and often not reflected in PIT returns either as adjustable tax or final tax. The GST revenue elasticity, on the other hand, is estimated to be 1.1, slightly higher than that of PIT but significantly less than that of CIT revenue. This implies that the GST revenue increases by around 1.1 percent for every 1 percent increase in GDP. The estimation results at a disaggregated level suggest that tax rates have no statistically significant effect, and its coefficient comes out to be negative in the case of PIT. The estimates obtained by using the IV-2SLS method are found to be larger than the coefficients obtained using the ordinary least squares (OLS) regression for across all three subcategories of tax revenue.
An Error Correction Model (ECM) is developed to derive long-run tax revenue elasticity, which may differ significantly from the short-run elasticity. Short-run (instantaneous) tax elasticities present a partial view of how responsive the tax system to changes in macroeconomic
14 This could be partly due to the fact that total tax revenues include other taxes while the weighted average tax rate is calculated by using only CIT, PIT and GST rates.
Total CIT PIT GST
∆GDP 1.159*** 1.372*** 0.955* 1.095**(0.191) (0.501) (0.558) (0.508)
∆Tax Rate -0.005 -0.006 -0.002 0.001(0.005) (0.008) (0.006) (0.010)
Number of observations 55 55 55 55F-stat 23.08 5.31 2.06 2.57[p -value] 0.000 0.008 0.137 0.086R2 0.50 0.22 0.10 0.13
Sources: Author's calculations.
Table 3. Tax Revenue Elasticity: IV-2SLS Estimates
Note: Robust standard errors are reported in parantheses. ***, **, and * denote significance at the 1, 5, and 10 percent levels. All regressions include a constant term, which is not displayed in the table.
14
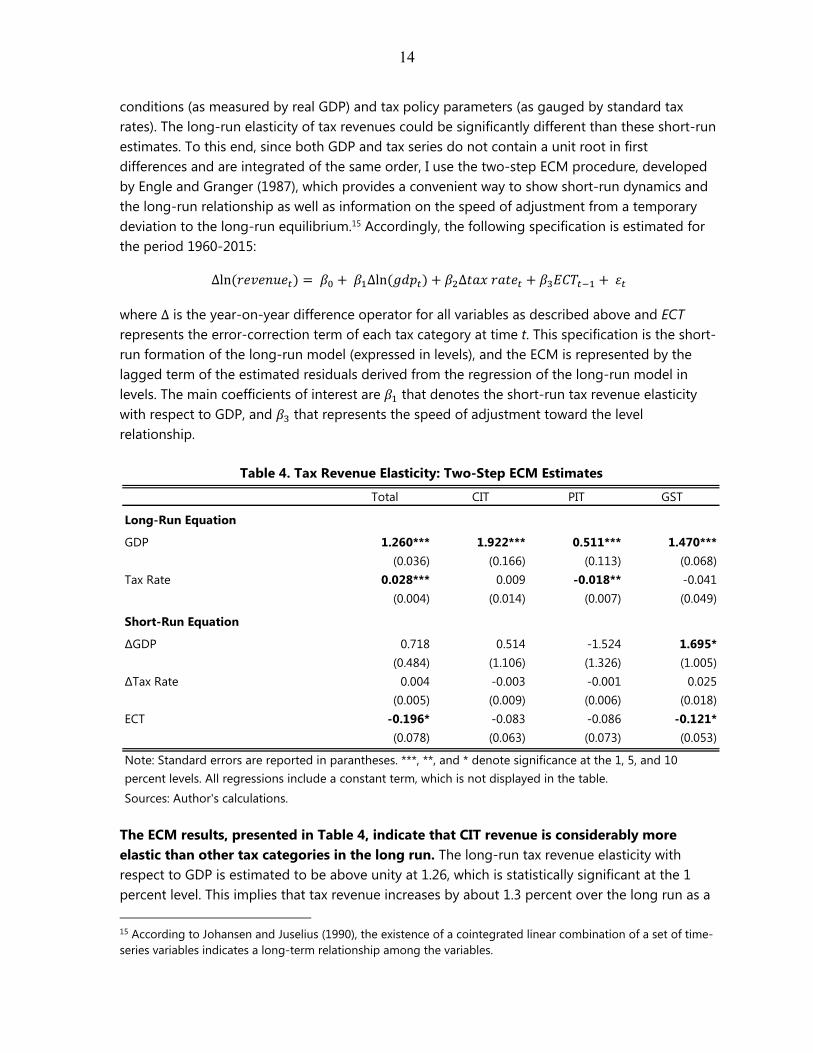
conditions (as measured by real GDP) and tax policy parameters (as gauged by standard tax rates). The long-run elasticity of tax revenues could be significantly different than these short-run estimates. To this end, since both GDP and tax series do not contain a unit root in first differences and are integrated of the same order, I use the two-step ECM procedure, developed by Engle and Granger (1987), which provides a convenient way to show short-run dynamics and the long-run relationship as well as information on the speed of adjustment from a temporary deviation to the long-run equilibrium.15 Accordingly, the following specification is estimated for the period 1960-2015:
∆ln ∆ln ∆
where ∆ is the year-on-year difference operator for all variables as described above and ECT represents the error-correction term of each tax category at time t. This specification is the short-run formation of the long-run model (expressed in levels), and the ECM is represented by the lagged term of the estimated residuals derived from the regression of the long-run model in levels. The main coefficients of interest are that denotes the short-run tax revenue elasticity with respect to GDP, and that represents the speed of adjustment toward the level relationship.
The ECM results, presented in Table 4, indicate that CIT revenue is considerably more elastic than other tax categories in the long run. The long-run tax revenue elasticity with respect to GDP is estimated to be above unity at 1.26, which is statistically significant at the 1 percent level. This implies that tax revenue increases by about 1.3 percent over the long run as a 15 According to Johansen and Juselius (1990), the existence of a cointegrated linear combination of a set of time-series variables indicates a long-term relationship among the variables.
Total CIT PIT GST
Long-Run Equation
GDP 1.260*** 1.922*** 0.511*** 1.470***(0.036) (0.166) (0.113) (0.068)
Tax Rate 0.028*** 0.009 -0.018** -0.041(0.004) (0.014) (0.007) (0.049)
Short-Run Equation
∆GDP 0.718 0.514 -1.524 1.695*(0.484) (1.106) (1.326) (1.005)
∆Tax Rate 0.004 -0.003 -0.001 0.025(0.005) (0.009) (0.006) (0.018)
ECT -0.196* -0.083 -0.086 -0.121*(0.078) (0.063) (0.073) (0.053)
Sources: Author's calculations.
Table 4. Tax Revenue Elasticity: Two-Step ECM Estimates
Note: Standard errors are reported in parantheses. ***, **, and * denote significance at the 1, 5, and 10 percent levels. All regressions include a constant term, which is not displayed in the table.
15
response to an increase of 1 percent in GDP. Contrary to short-run dynamics, the coefficient on tax rates (0.03) is economically more meaningful and statistically significant in the long run. However, this elasticity estimate should be interpreted with caution, as the tax rate used in the regression is a weighted average of CIT, PIT and GST rates excluding other taxes such as customs duties and excises. At a disaggregated level, the long-run elasticities of CIT and PIT are estimated to be 1.92 and 0.51, respectively. These statistically significant coefficients indicate that CIT and PIT revenues increase by about 1.9 percent and 0.5 percent for every 1 percent increase in GDP, highlighting the relative and absolute underperformance of PIT. The long-run elasticity of GST revenue, on the other hand, is estimated to be 1.47, significantly higher than that of PIT but still less than that of CIT revenue. This implies that the GST revenue increases by around 1.5 percent over the long run for every 1 percent increase in GDP.
Only about 8-20 percent of the disequilibrium appears to be corrected in a given year following deviation from the long-run equilibrium. The ECM approach approximates deviation from the long-run equilibrium and estimates the short-run responses necessary for the system to converge to its long-run equilibrium via the error-correction term while allowing short-run dynamics in the system. Accordingly, the error-correction term shows the extent to which the long-run equilibrium drives short-term dynamics. The error-correction term is found to vary between -0.08 for CIT revenue and -0.2 for aggregate tax revenue, indicating that the speed of adjustment is low. This means that only about 8-20 percent of the disequilibrium appears to be corrected in a given year following deviation from the long-run equilibrium. Furthermore, the error-correction term is statically significant—at the 10 percent level—only for aggregate tax revenue and GST revenue at a disaggregated level.
V. ROBUSTNESS CHECK—A CROSS-COUNTRY PERSPECTIVE
A panel data analysis is conducted to put Pakistan’s performance in an international perspective and perform a robustness check. I estimate the IV model of tax revenue elasticity for subcategories of tax revenue (CIT, PIT and VAT) as well as for total tax revenue, using a broad panel of 124 developing countries over the period from 1980 to 2014. As described above, I control for tax policy changes (except for the total tax revenue) and use the trade-weighted average real GDP of a country’s trading partners as an instrument for that country’s own real GDP in fixed-effects regressions. The estimated panel regression model is in the following form:
∆ln , ∆ln , ∆ , ,
where the subscripts i and t denote the country and the time dimension. The coefficients and denote the time-invariant country effects and the time effects controlling for common
aggregate shocks, respectively. , is an idiosyncratic error term that satisfies the standard assumptions of zero mean and constant variance.16 The key coefficient of interest is that measures the tax revenue elasticity with respect to real GDP. Similar to country-specific estimations, if the coefficient is greater (lower) than 1, tax revenue grows faster (slower) than 16 To account for possible heteroskedasticity, robust standard errors are clustered at the country level.

16
national income and thereby raises the tax-to-GDP ratio. The international tax dataset used in the panel data analysis is obtained from the IMF’s World Economic Outlook database and Tax Rate Database maintained by the Fiscal Affairs Department, while GDP and deflator are drawn from the World Bank’s World Development Indicators database and the series on trade-weighted average real GDP of trading partners for each country used as instrument are taken from the IMF’s World Economic Outlook database.17
The panel data regression results, presented in the Table 5, indicate that Pakistan’s tax revenue elasticity is well below the average of developing countries. At an aggregated level, including a weighted-average of tax rates, I estimate the tax revenue elasticity across developing countries in the sample to be 1.89 with respect to real GDP, which is instrumented by trade-weighted average real GDP of trading partners for each country. This implies that Pakistan’s tax revenue elasticity is about 40 percent below the average of developing countries. At a disaggregated level, while the CIT elasticity in Pakistan is marginally higher than the average of other developing countries (1.37 versus 1.26), its PIT and GST elasticities are significantly lower than those in other emerging market economies.18
17 I apply the Im-Pesaran-Shin (2003) procedure to conduct a panel unit root test. As expected, both GDP and tax series are highly persistent, and I cannot reject the hypothesis of a unit root in levels. Upon first differencing, however, the variables are found to be stationary. The panel unit root test results are available upon request.
18 The IV-GMM approach yields similar results, confirming the robustness of the baseline results presented in Table 5.
Total CIT PIT VAT
∆GDP 1.892*** 1.257*** 1.836* 1.724**(0.125) (0.213) (0.270) (0.129)
∆Tax Rate 0.001 0.004 0.002 0.009*(0.003) (0.004) (0.003) (0.005)
Fixed effects Yes Yes Yes YesNumber of observations 689 1101 925 1303Number of groups 62 70 68 92F-stat 7.75 2.36 3.17 6.48[p -value] 0.000 0.000 0.000 0.000R2 0.31 0.10 0.12 0.17
Sources: Author's calculations.
Table 5. Cross-Country Tax Revenue Elasticity: IV-2SLS Estimates
Note: Robust standard errors are reported in parantheses. ***, **, and * denote significance at the 1, 5, and 10 percent levels. All regressions include a constant term, which is not displayed in the table.
17
VI. CONCLUSION—THE WAY FORWARD
The tax revenue-to-GDP ratio increased by 2.4 percentage points over the past three years to 12.4 percent of GDP in 2016, but it still significantly below Pakistan’s tax potential. This reflects a plethora of factors including narrow tax bases, generous tax concessions and exemptions, weak and fragmented revenue administrations, and structural features of the economy. Relative to comparator developing countries, Pakistan’s tax system is complex and fragmented. Although Pakistan’s constitution assigns significant revenue responsibility to the provinces, provincial governments’ own revenues contribute only about 8 percent of total tax revenues. The composition of tax revenues is highly skewed towards indirect taxes, which account for about 63 percent of federal tax revenue, while the extensive use of tax concessions and exemptions results in a distortionary and unfair tax regime. Consequently, while Pakistan’s estimated tax effort—the ratio between actual revenue and tax capacity—improved from 0.43 in 2011 to 0.56 in 2016, it is still significantly below the average of comparator developing countries (0.64) and high-income countries (0.76).
Pakistan’s tax system with low elasticity fails to take advantage of economic growth to a greater extent. To better understand the behavior of tax revenues over time, I obtain robust estimates for short-run (instantaneous) and long-run (equilibrium) elasticities of tax revenue by applying both an IV regression approach and a multivariate cointegration analysis. The empirical results indicate that both short-run and long-run elasticities of tax revenue are slightly above 1 over the period 1960-2015, indicating a relatively small response to economic growth. There is, however, significant variation in short-run and long-run elasticities across subcategories of tax revenue. I find that CIT and GST revenues are more responsive to GDP, with elasticity coefficient well above 1, while PIT revenues appear to be significantly less elastic. I also conduct a panel data analysis to put Pakistan’s performance in an international perspective and find that Pakistan’s tax revenue elasticity is well below the average of developing countries. However, it should be noted that comprehensive reform efforts have led to a significant increase in revenue mobilization and thereby improvements in tax buoyancy and elasticity over the past three years.
Without continued reform efforts, Pakistan cannot realistically raise its tax revenue to around 15 percent of GDP in the foreseeable future.19 The government has implemented a series of reforms aimed at improving tax revenue mobilization by rationalizing tax expenditures, broadening the tax base and strengthening taxpayer compliance. These include reducing tax expenditures and limiting the authorization for tax concessions and exemptions on a temporary basis in a number of exceptional circumstances by the Economic Coordination Committee of the cabinet, introducing self-assessment for filing PIT, introducing the concept of differential taxation between tax filers and non-filers to reward compliance and penalize noncompliance, strengthening valuation and transparency in federal real estate-related taxes, undertaking a campaign of base-broadening measures, integrating the National Tax Number (NTN) system 19 This assumes an average real GDP growth rate of 5 percent and uses the estimated tax revenue elasticity with respect to GDP.
18
with the Computerized National Identity Card (CNIC) database,20 sending notices to more than 300,000 new taxpayers over the last three years, issuing a policy directive requiring all government suppliers to be on the current list of active taxpayers to conduct business with government departments, and adopting a risk-based audit strategy, among others. Going forward, it plans to increase the tax revenue ratio to close to 15 percent of GDP by 2020 to strengthen debt sustainability and resilience to shocks and to increase priority expenditure on infrastructure, education, healthcare, and targeted social assistance. While Pakistan has the potential to double its tax revenue-to-GDP ratio over the long term, the empirical findings presented in this paper indicate that realizing the country’s tax revenue potential requires further concerted and well-defined efforts at the federal and provincial level aimed at broadening tax bases, strengthening tax compliance across all sectors of the economy, and eliminating distortionary tax concessions and exemptions, and addressing structural challenges of fragmented tax administrations. These fundamental changes would not only boost the country’s tax revenue-to-GDP ratio and thereby create resources for growth-enhancing priority spending, but also improve the perceived fairness of the tax system.
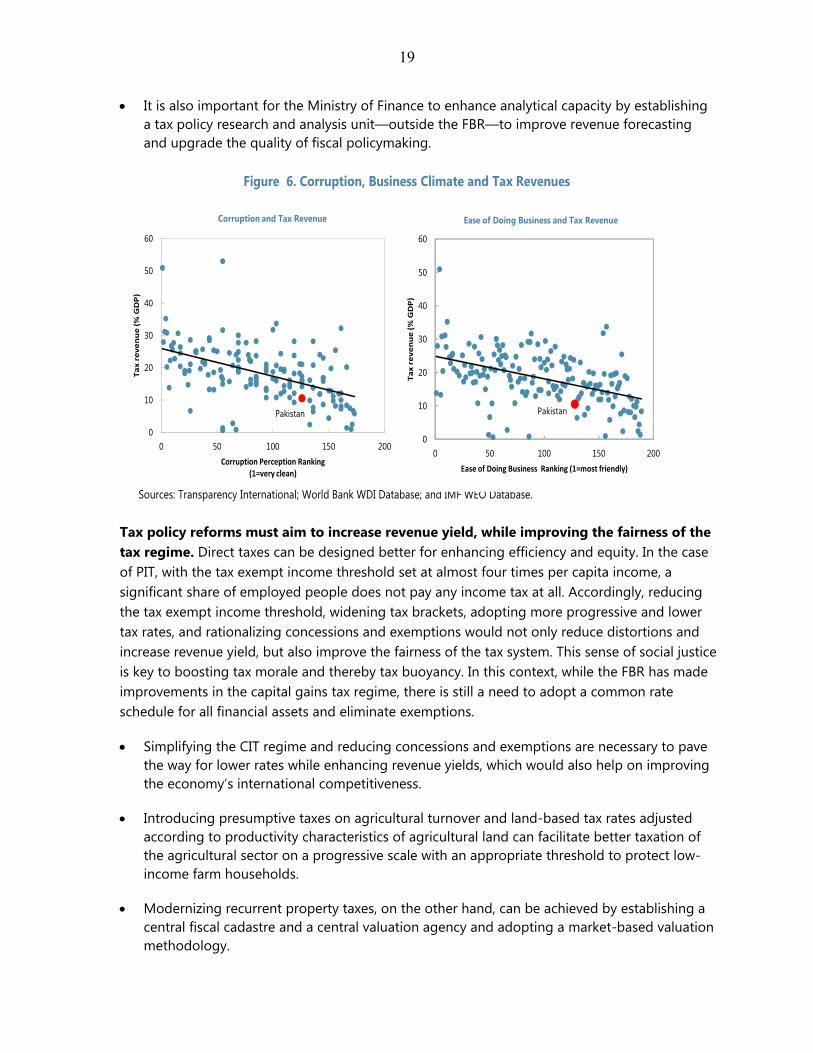
Strengthening tax administrations across all layers of government is key to sustainable revenue mobilization. To improve taxpayer compliance and curb tax avoidance and evasion, reform efforts must aim to modernize and bolster the effectiveness of tax administrations at federal and provincial levels by reorganizing along functional lines, integrating databases and information technology, and requiring a tax identity number in all financial and immovable property transactions. This would also help deal with the potential problem of using remittance transfers as a mean of tax evasion. Cross-country figures indicate that there is also a strong relationship between the tax revenue-to-GDP ratio and business climate and corruption (Figure 6). The FBR has already taken steps to improve information technology and automation of processes and strengthened prosecution of tax offences. In this context, institutional reforms aiming to reduce the incidence of corruption and to improve the country’s business climate will help boost tax revenue collections across all layers of the general government.
The FBR and provincial revenue administrations should fully implement a risk-based auditing system focusing on taxpayer noncompliance risks, defined as the likelihood of yielding large amounts of audit adjustments and penalties, and increase tax fraud penalties and make tax evasion a criminal offense.
Fighting tax evasion should initially focus on a comprehensive list of high-wealth individuals and corporate entities they control and prohibit the so-called “benami” transactions, which are commonly used for tax avoidance and evasion.21
20 The NTN system covers 3.6 million individuals (or less than 2 percent of population) compared to about 150 million people (or about 80 percent of population) covered in the CNIC database.
21 In “benami” transactions, assets are held by or transferred to a person, but have been provided for, or paid by, another person. The government has already submitted a draft bill to the National Assembly to disallow such transactions.
19
It is also important for the Ministry of Finance to enhance analytical capacity by establishing a tax policy research and analysis unit—outside the FBR—to improve revenue forecasting and upgrade the quality of fiscal policymaking.
Tax policy reforms must aim to increase revenue yield, while improving the fairness of the tax regime. Direct taxes can be designed better for enhancing efficiency and equity. In the case of PIT, with the tax exempt income threshold set at almost four times per capita income, a significant share of employed people does not pay any income tax at all. Accordingly, reducing the tax exempt income threshold, widening tax brackets, adopting more progressive and lower tax rates, and rationalizing concessions and exemptions would not only reduce distortions and increase revenue yield, but also improve the fairness of the tax system. This sense of social justice is key to boosting tax morale and thereby tax buoyancy. In this context, while the FBR has made improvements in the capital gains tax regime, there is still a need to adopt a common rate schedule for all financial assets and eliminate exemptions.
Simplifying the CIT regime and reducing concessions and exemptions are necessary to pave the way for lower rates while enhancing revenue yields, which would also help on improving the economy’s international competitiveness.
Introducing presumptive taxes on agricultural turnover and land-based tax rates adjusted according to productivity characteristics of agricultural land can facilitate better taxation of the agricultural sector on a progressive scale with an appropriate threshold to protect low-income farm households.
Modernizing recurrent property taxes, on the other hand, can be achieved by establishing a central fiscal cadastre and a central valuation agency and adopting a market-based valuation methodology.
Figure 6. Corruption, Business Climate and Tax Revenues
Sources: Transparency International; World Bank WDI Database; and IMF WEO Database.
0
10
20
30
40
50
60
0 50 100 150 200
Ta
x r
ev
en
ue
(%
GD
P)
Ease of Doing Business Ranking (1=most friendly)
Ease of Doing Business and Tax Revenue
Pakistan
0
10
20
30
40
50
60
0 50 100 150 200
Ta
x r
ev
en
ue
(%
GD
P)
Corruption Perception Ranking (1=very clean)
Corruption and Tax Revenue
Pakistan

20
Integrating the GST regime (goods and services) with a single statutory rate under one collection agent, and eliminating GST exemptions, zero-ratings, and special schemes to attain greater efficiency in indirect taxes.
Changing the structure of federal and provincial excises to ad valorem rates in a unified manner for domestically produced and imported goods can maximize the revenue yield and better address negative externalities associated with some products such as tobacco and petroleum products.
21
REFERENCES
Acemoglu, D., S. Johnson, J. Robinson, and P. Yared, 2008, “Income and Democracy,” American Economic Review, Vol. 98, pp. 808-842.
Baunsgaard, T., and M. Keen, 2010, “Tax Revenue and (or?) Trade Liberalization,” Journal of Public
Economics, Vol. 94, pp. 563–577. Belinga, V., D. Benedek, R. De Mooji, and J. Norregaard, 2014, “Tax Buoyancy in OECD Countries,”
IMF Working Paper, No. 14/110 (Washington: International Monetary Fund). Brückner, M., 2012, “An Instrumental Variables Approach to Estimating Tax Revenue Elasticities:
Evidence from Sub-Saharan Africa,” Journal of Development Economics, Vol. 98, pp. 220–227.
Engle, R., and C. Granger, 1987, “Cointegration and Error Correction: Representation, Estimation,
and Testing,” Econometrica, Vol. 55, pp. 251-276. Fenochietto, R., and C. Pessino, 2013, “Understanding Countries’ Tax Effort,” IMF Working Paper,
No. 13/244 (Washington: International Monetary Fund). Im, K., M. Pesaran, and Y. Shin, 2003, “Testing for Unit Roots in Heterogeneous Panels,” Journal of
Econometrics, Vol. 115, pp. 53-74. International Monetary Fund, 2011, “Revenue Mobilization in Developing Countries,” IMF Policy
Paper (Washington: International Monetary Fund). International Monetary Fund, 2015, “Options for Low Income Countries' Effective and Efficient
Use of Tax Incentives for Investment,” IMF Background Paper (Washington: International Monetary Fund).
Johansen, S., and K. Juselius, 1990, “Maximum Likelihood Estimation and Inference on
Cointegration with Application to the Demand for Money,” Oxford Bulletin of Economics and Statistics, Vol. 54, pp. 169-210.
Miguel, E., S. Satyanath, and S. Sergenti, 2004, “Economic Shocks and Civil Conflict: An
Instrumental Variables Approach,” Journal of Political Economy, Vol. 112, pp. 725-753. Talvi, E., and C. Vegh, 2005, “Tax Base Variability and Procyclical Fiscal Policy in Developing
Countries,” Journal of Development Economics, Vol. 78, pp. 156–190.