aging cell torc1-mediated sensing of chaperone activity...
TRANSCRIPT

TORC1-mediated sensing of chaperone activity alters glucosemetabolism and extends lifespan
Matea Peri�c,1† Anita Lovri�c,1† Ana �Sari�c,2 Marina Musa,1
Peter Bou Dib,3 Marina Rudan,1 Andrea Nikoli�c,1
Sandra Sobo�canec,2 Ana-Matea Mikecin,2 Sven Dennerlein,3
Ira Milo�sevi�c,4 Kristian Vlahovi�cek,5‡ Nuno Raimundo3
and Anita Kri�sko1
1Mediterranean Institute for Life Sciences, Mestrovicevo setaliste 45, 21000
Split, Croatia2Division of Molecular Medicine, Rudjer Boskovic Institute, Bijenicka 54,
10000 Zagreb, Croatia3Institut f€ur Zellbiochemie, Universit€atsmedizin G€ottingen, Humboldtallee 23,
D-37073 G€ottingen, Germany4European Neuroscience Institute, Grisebachstraße 5, 37077 G€ottingen,
Germany5Bioinformatics Group, Division of Biology, Department of Molecular Biology,
Faculty of Science, University of Zagreb, Zagreb, Croatia
Summary
Protein quality control mechanisms, required for normal cellular
functioning, encompass multiple functions related to protein
production and maintenance. However, the existence of commu-
nication between proteostasis and metabolic networks and its
underlying mechanisms remain elusive. Here, we report that
enhanced chaperone activity and consequent improved proteosta-
sis are sensed by TORC1 via the activity of Hsp82. Chaperone
enrichment decreases the level of Hsp82,which deactivates TORC1
and leads to activation of Snf1/AMPK, regardless of glucose
availability. This mechanism culminates in the extension of yeast
replicative lifespan (RLS) that is fully reliant on both TORC1
deactivation and Snf1/AMPK activation. Specifically, we identify
oxygen consumption increase as the downstream effect of Snf1
activation responsible for the entire RLS extension. Our results set
a novel paradigm for the role of proteostasis in aging: modulation
of themisfoldedprotein level can affect cellularmetabolic features
aswell asmitochondrial activityandconsequentlymodify lifespan.
The described mechanism is expected to open new avenues for
research of aging and age-related diseases.
Key words: ageing; glucose starvation; mitochondria; protein
chaperones; replicative lifespan; Snf1/AMPK; TORC1; yeast.
Introduction
Protein homeostasis (proteostasis) encompasses the equilibrium between
synthesis, conformational maintenance, and degradation of damaged
proteins. While protein synthesis has a critical role in making the
proteome and promoting cell growth, failure to eliminate misfolded
proteins can lead to inactivation of functional proteins as well as cell
degeneration and death. Cellular proteostasis is maintained by a
network of molecular chaperones, protein degradation machineries,
and stress–response pathways, whose coordinated action senses and
counteracts protein misfolding (Wolff et al., 2014). Molecular chaper-
ones, including the heat-shock proteins (HSPs), are ubiquitously present
cellular proteins, which display a wide spectrum of folding-oriented
activities, coping with regular protein folding events, as well as stress-
induced protein misfolding (Morano et al., 1998). The efficiency of
proteostasis may decline, with well-described consequences, especially in
the context of numerous diseases and aging (Labbadia & Morimoto,
2015). As a result of such a decline, proteins cannot maintain their native
fold or perform their function and, consequently, cells promote the
removal of damaged proteins through their degradation, refolding, and/
or aggregation (Brandvold & Morimoto, 2015). On the other hand, the
research on phenotypes related to the alleviation of protein misfolding is
not keeping pace. The improvement of disaggregase activity in yeast was
found to diminish the accumulation of insoluble aggregates during aging
and restored degradation of 26S proteasome substrates in aged cells
(Andersson et al., 2013). Because of extensive interest, the cell-wide
response to the enrichment in chaperone activity has not received any
attention.
Despite the indisputable importance of cellular proteostasis on
multiple levels, the relationships between proteostasis and other cellular
pathways remain poorly understood. While signaling networks have
evolved to convey information on any changes among themselves and
turn them into critical decisions regarding cellular destiny, little is known
about the role of molecular chaperones in the regulation of metabolic
networks (Rowland et al., 2012).
Here, we investigate the cellular response to improved proteostasis
resulting from enhanced chaperone activity and how it communicates
with the metabolic networks, using budding yeast as a model system.
We show that the response to protein misfolding alleviation is a
phenocopy of the glucose starvation response. This outcome relies on
deactivation of TORC1 and consequent activation of the Snf1 kinase, a
yeast ortholog of mammalian AMPK. Further, our results reveal the role
of Tor1 kinase as a sensor of improved chaperone function and protein
folding environment. Remarkably, all mutants characterized by improved
proteostasis display an extension of the replicative lifespan (RLS). We
identify the increase in cellular respiratory activity as the trigger of the
RLS extension, dependent on TORC1 deactivation and Snf1 activation,
thus demonstrating that the observed lifespan extension fully relies on
the metabolic changes originating from proteostasis improvement. The
data presented here demonstrate that, in the context of normal cellular
functioning, as well as aging, the role of protein chaperones goes
beyond the management of misfolded proteins, with downstream
effects on cellular metabolism and mitochondrial network.
Results
Differential gene expression in chaperone-enriched strains
reveals a phenocopy of glucose starvation
To decrease the amount of misfolded proteins, we independently
overexpressed protein chaperones located in different cellular
Correspondence
Anita Kri�sko, Mediterranean Institute for Life Sciences, Mestrovicevo setaliste 45,
21000 Split, Croatia. Tel.:/fax: +385 21 555 604; e-mail: [email protected]†These authors contributed equally to this work.‡Corresponding author for computational biology.
Accepted for publication 27 April 2017
ª 2017 The Authors. Aging Cell published by the Anatomical Society and John Wiley & Sons Ltd.This is an open access article under the terms of the Creative Commons Attribution License, which permits use,distribution and reproduction in any medium, provided the original work is properly cited.
1
Aging Cell (2017) pp1–12 Doi: 10.1111/acel.12623Ag
ing
Cell
compartments—nascent polypeptide-associated complex (NAC, EGD2),
cytosolic T-complex (TCP1), mitochondrial HSP70 (SSC1), and HSP70
family chaperone from the endoplasmic reticulum (LHS1). For brevity, we
termed these mutants chaperone-enriched strains (ChESs). The level of
enrichment with each chaperone was estimated by flow cytometry. We
find the Egd2, Lhs1, and Tcp1 enriched threefold, while Ssc1 is enriched
2.5-fold (Fig. S1A, Supporting information). We next evaluated whether
such enrichment in chaperone function results in decrease in misfolded
protein amount. ChESs display, on average, a 40% decrease in protein
carbonylation (PC) level (Fig. 1A). Even though PC has long been
considered as a marker of oxidative stress, it has been shown that
misfolded proteins and proteins characterized by decreased conforma-
tional stability are more prone to PC (Vidovic et al., 2014), rendering it
an indicator of protein folding quality. Moreover, a strong downregu-
lation of the Hsp90 chaperone is observed, relative to the control
(Figs 1B and S1B, Supporting information). In addition, the level of
Hsp104-dependent protein aggregation is decreased in ChES from ~4%
of cells with aggregates in the control strain to ~1% in ChES (Figs 1C
and S2, Supporting information). Together, these observations suggest
that the chaperone enrichment indeed led to a decrease in the extent of
protein misfolding.
As an additional control, we have enriched the cells with the
inactivated version of each chaperone (iChES, Fig. S3, Supporting
information, for details, see Experimental procedures) and detected a
subtle increase in Hsp104-dependent protein aggregation from 4% of
cells with aggregates to 7–8% (Figs S1C and S2, Supporting informa-
tion). This increase in cellular fraction containing aggregates was
accompanied by an average of 15% increase in protein carbonylation
level (Fig. S1D, Supporting information).
With the aim of uncovering general trends in gene expression in
ChES, we applied RNA sequencing (RNASeq) (results summarized in
Table S1, Supporting information). The most striking results are the
downregulation of key glycolytic and TCA cycle enzymes, strongly
arguing toward the repression of glycolysis and the TCA cycle (Fig. 1D).
The increased expression levels of the respiratory chain subunits suggest
an increase in respiration in ChES (Fig. 1D). Additionally, strong
upregulation of POX1 (encoding fatty-acyl coenzyme A oxidase) and
POT1 (encoding 3-ketoacyl-CoA thiolase) in ChES brings forward fatty
acids as the preferred energy source (Fig. 1D). The results obtained by
RNASeq were confirmed by qPCR, where target genes display similar
trends as observed by RNASeq (Fig. 1E). Clearly, differential gene
expression in ChES displays a glucose starvation-like response (Lin et al.,
2002).
Moreover, several genes typically upregulated during the heat-shock
response (e.g., Hsp90, Hsp150, and Hsp26) are downregulated in ChES,
indicating a decrease in proteotoxic stress to below the basal levels
observed in the control strain (Fig. 1D, Table S1, Supporting informa-
tion). Furthermore, SOD1, cytosolic copper–zinc superoxide dismutase,
and SOD2, mitochondrial manganese superoxide dismutase, are both
significantly downregulated in ChES relative to the control, suggesting
an overall decrease in the reactive oxygen species (ROS) level (Table S1,
Supporting information). To confirm this observation, we monitored
fluorescence that results from the reaction of 20,70-dichlorodihydro-fluorescein (H2DCF) with intracellular ROS, using a FACS-based proce-
dure. ChES mutants showed an average of 40% decrease in ROS levels
compared to the control strain (Fig. S1E, Supporting information).
The iChES strains (Fig. S3, Supporting information), enriched in the
inactivated version of each chaperone, do not exhibit a decrease in
glycolytic and TCA cycle enzymes’ expression level, or an increase in the
respiratory chain component expression (Figs 1F and S1F, Supporting
information). These results suggest that the differential gene expression
pattern detected in ChES is reliant on increased chaperone activity and/
or the beneficial consequences that it has on protein folding environ-
ment. However, strong upregulation of POT1 and POX1, observed also
in iChES (Figs 1F and S1F, Supporting information), suggests that the
increase in the fatty acid oxidation is not related to the increased
chaperone activity in ChES. The mechanism and the role of increased
fatty acid oxidation in ChES and iChES remain unclear based on the
presented data and will be the subject of future research.
ChESs are characterized by increased oxygen consumption
We further explored the glucose starvation-like phenotype suggested by
the ChES transcriptome. We first measured O2 consumption in ChES,
mimicking flask culture conditions (30 °C temperature, with stirring).
The growth curves of studied strains with the labeled point at which we
have harvested the cells are shown in Fig. S4A (Supporting information).
All of the ChESs exhibited, on average, a twofold increase in O2
consumption in comparison with the control strain, with most prominent
change observed in EGD2 overexpression followed by TCP1, LHS1, and
SSC1 (Fig. 2A). Petite strain, which has no functional electron transport
chain, was included as a negative control and showed respiration
deficiency. Moreover, the iChESs, enriched in inactivated version of each
chaperone, display no increase in the oxygen consumption (Fig. S4B,
Supporting information), suggesting that the increase in respiratory
activity in ChES stems from the activity of studied chaperones.
As elevated O2 consumption can be a result of enhancedmitochondrial
capacity, we measured the mitochondrial mass. 10-N-Nonyl acridine
orange (NAO) fluorescence, indicative of cardiolipin content/mitochon-
drialmass, displayedan increase inChES compared to the control (Fig. 2B).
On the other hand, no significant difference in fluorescence intensity was
observed after 3,30-dihexyloxacarbocyanine iodide (DiOC6(3)) staining
betweenany of theChES strains and the control, reportingnodifference in
the inner mitochondrial membrane potential (Fig. 2C). Using MitoLoc
plasmid,where GFP is fused to the fungal mitochondrial localization signal
of the F0-ATPase subunit 9 (preSU9) of Neurospora crassa, we character-
ized the mitochondrial network using spinning disk confocal microscopy.
We found the strains to display a strong increase in mitochondrial volume
(Figs 2D and S4C, Supporting information), in accordance with the
increased NAO fluorescence in ChES (Fig. 2B) and increased oxygen
consumption (Fig. 2A).
To further characterize the respiratory chain (RC) in ChES, mitochon-
dria were solubilized in digitonin and subjected to the blue native PAGE
analysis for the assembly state of the RC complexes, as well as for the
measurement of their in vitro activity. We have found no significant
difference between the strains indicating that the amount of RC
complexes per mitochondrion is similar in ChES and control strains, and
that the increased oxygen consumption results from increased mito-
chondrial mass (Fig. S4D, Supporting information).
Snf1/AMPK activation is responsible for the glucose
starvation phenocopy in ChES
Based on the literature related to the glucose starvation-like phenotype
observed in ChES, we hypothesized that this phenotype could be a result
of the activation of Snf1 kinase, a major regulator of glucose metabolism
in yeast (reviewed in Hedbacker & Carlson, 2009). Therefore, to estimate
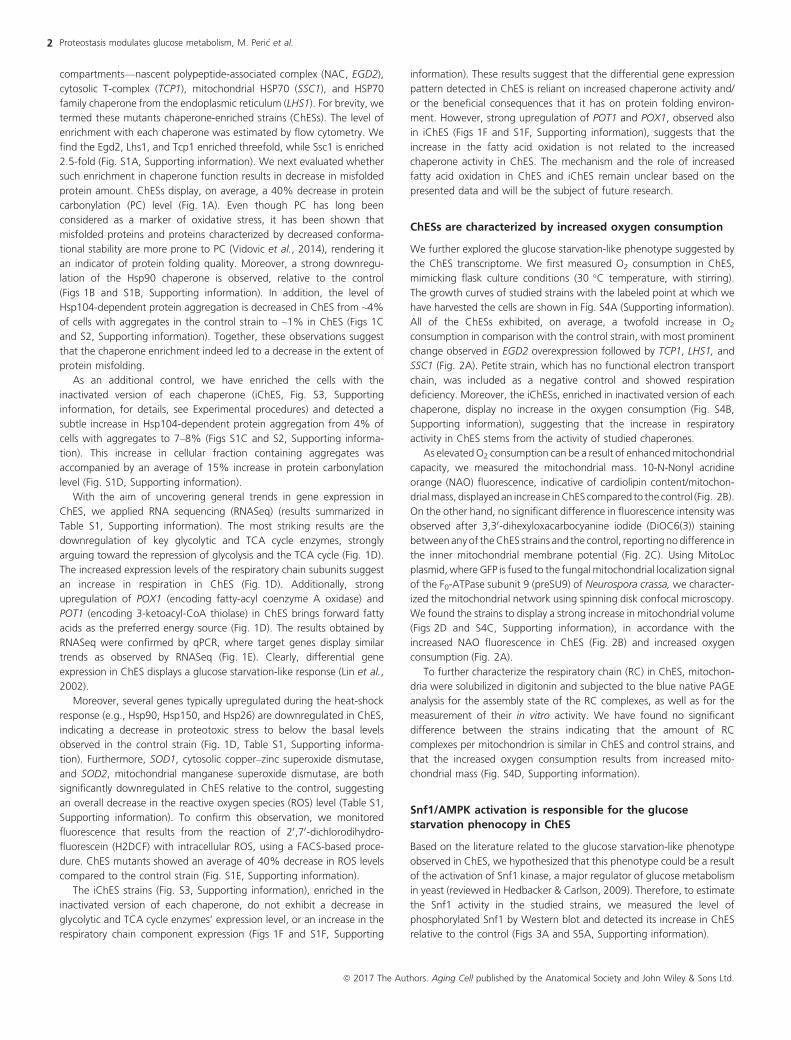
the Snf1 activity in the studied strains, we measured the level of
phosphorylated Snf1 by Western blot and detected its increase in ChES
relative to the control (Figs 3A and S5A, Supporting information).
Proteostasis modulates glucose metabolism, M. Peri�c et al.2
ª 2017 The Authors. Aging Cell published by the Anatomical Society and John Wiley & Sons Ltd.

Further, we have overexpressed each of the four chaperones in the
genetic background of Snf1 deletion and measured the differences in
the related gene expression patterns by qPCR (Figs 3B and S5B,
Supporting information, compared with Fig. 1E). The absence of Snf1
itself yields numerous changes in gene expression: a significant
upregulation of glycolytic and TCA cycle enzymes, as well as OxPhos
complexes (Figs 3C and S5B, Supporting information). The presence of
the empty plasmid in the Snf1-deficient background does not influence
this expression pattern. Upon chaperone enrichment in Snf1-deficient
background, the glucose starvation-like response characteristic of
chaperone enrichment in the WT background is now absent (Figs 3B
and S5B, Supporting information). Consistently, the increase in oxygen
consumption does not occur upon chaperone overexpression in the
absence of Snf1 (Fig. 3C). These results strongly suggest that Snf1 kinase
receives the information about the cellular proteostasis and, via its
canonical activity, modulates metabolism. However, the question
persists: how does the information on alleviation of protein misfolding
reach Snf1 kinase, that is which cellular component is responsible for
sensing the folding environment and relaying the message on to the
metabolic networks?
Tor1 acts as a sensor of folding environment and a negative
regulator of Snf1
Given the known interplay between TOR and Snf1, we hypothesized the
potential involvement of the TORC1 complex as a mediator between the
folding environment and metabolism (Su et al., 2016). Hence, we
measured the amount of newly translated proteins within one gener-
ation time of each studied strain. The results show that the ChESs
perform significantly less translation relative to the control (Figs 4A and
Fig. 1 Enrichment in chaperone activity alleviates protein damage and activates a glucose starvation-like response. (A) Protein carbonylation (PC) is decreased in the ChES.
As a control, wild-type yeast with an empty vector was used. Data on the graph are mean � SD from at least three independent cultures, each performed in technical triplicate.
P values were calculated using ANOVA plus post hoc. ***P < 0.001; **P < 0.01; *P < 0.05. (B) Hsp82 levels are decreased in ChES. Hsp82-specific band intensity was
normalized to the intensity of b-actin (loading control). Control is wild-type yeast with an empty vector. Data on the graph are mean � SD from at least three independent
cultures, each performed in technical triplicate. P values were calculated using ANOVA plus post hoc. ***P < 0.001; **P < 0.01; *P < 0.05. (C) ChESs are characterized by
decreasedprotein aggregationpropensity. Protein aggregation propensity is expressed as the fraction of cellswith at least one aggregate.More than1000 cellswere screened for
aggregates starting from two independent exponential yeast cultures for each strain. Control is wild-type yeast with an empty vector. Data on the graph are mean � SD
from two independent cultures. P values were calculated using ANOVA plus post hoc. ***P < 0.001; **P < 0.01; *P < 0.05. (D) Differential gene expression in ChES reveals a
glucose starvation-like response. Heat map displays RNASeq-derived differential expression (contrasted to control) of selected genes, grouped according to their respective
metabolic pathways. Gray X signs indicate statistically insignificant fold changes. Gene names are indicated on the left of each heat map. (E) qPCR measurement of differential
gene expression confirms a glucose starvation response phenocopy in ChES. Color of the squares on the heat map corresponds to the mean value of the log fold change
from three biological and three technical replicates. UBC6 was used for normalization. Control is wild-type yeast with an empty vector. (F) Enrichment in inactivated versions of
each chaperone (iChES) does not phenocopy glucose starvation response. Color of the squares on the heat map corresponds to the mean value of the log fold change from
three biological and three technical replicates. UBC6 was used for normalization. Control is wild-type yeast with an empty vector.
Proteostasis modulates glucose metabolism, M. Peri�c et al. 3
ª 2017 The Authors. Aging Cell published by the Anatomical Society and John Wiley & Sons Ltd.

S5C, Supporting information), suggesting a decrease in the TORC1
activity. In addition, ChESs display significantly lower levels of Sch9
phosphorylation, confirming TORC1 deactivation (Figs 4B and S5D,
Supporting information). In addition, this result shows that the amount
of newly translated proteins also serves as a proxy for TORC1 activity.
Therefore, deactivation of TORC1 may be a critical part of the response
to the chaperone enrichment, and the related alleviation of protein
misfolding. To test this hypothesis, we introduced I1954V mutation into
Tor1 kinase, rendering it constitutively active and unable to undergo
deactivation (caTor1) (Hardt et al., 2011). The amount of newly
translated proteins has confirmed the increase in the translation activity
in the caTor1 strain (Figs 4A and S5C, Supporting information). We have
further evaluated whether the activity of TORC1 affects the phospho-
rylation level of Snf1. Constitutive activity of Tor1 has resulted in a sharp
decrease in the Snf1 phosphorylation level, reporting on a decline in its
activity (Figs 4C and S5E, Supporting information). On the contrary,
absence of Tor1 resulted in increased phosphorylation/activity of Snf1,
compared to the control strain. While a direct interaction between Tor1
and Snf1 is not implied, these two observations indicate that Tor1
kinase may serve as a negative regulator of Snf1, in agreement with
published data (Orlova et al., 2006). Further, the overexpression of each
of the four chaperones in the caTor1 background does not result in the
activation of Snf1 (Figs 4C and S5E, Supporting information). Oxygen
consumption remains unchanged in strains with chaperone enrichment
in the caTor1 genetic background (Fig. 4D), confirming the absence of
phenotype related to Snf1 activation and identifying Tor1 deactivation
as a central event responsible for Snf1 activation in ChES. This result is
supported by the differential gene expression in caTor1 with chaperone
enrichment showing the lack of response typical for chaperone
enrichment in the control background (Figs 4E and S5F, Supporting
information).
To further elucidate the role of Tor1-Snf1 cross talk in mitochon-
drial activity, we have measured oxygen consumption in DTor1mutant, as well as in DSnf1 mutant treated with 100 nM torin, an
inhibitor of TORC1. It should be noted that treating DSnf1 with torin
is an experiment designed to replace the double deletion mutant
DTor1DSnf1, which has proven difficult to make, presumably due
fitness defects or no viability. Importantly, DTor1 mutant as well as
Fig. 2 Enrichment in chaperone activity is accompanied by increased oxygen consumption and hyperfused mitochondria. (A) Oxygen consumption rates are increased in
ChES. Control is wild-type yeast with an empty vector. Data on the graph are mean � SD from three biological and three technical replicates. P values were calculated using
ANOVA plus post hoc. ***P < 0.001; **P < 0.01; *P < 0.05. (B) Mitochondrial biomass is increased in ChES. Data are mean � SD from at least three independent cultures,
each performed in triplicate. ***P < 0.001; **P < 0.01; *P < 0.05 (ANOVA plus post hoc). (C) Mitochondrial membrane potential-related fluorescence via DiOC6(3) is
unchanged. Data are mean � SD from at least three independent cultures, each performed in triplicate. ***P < 0.001; **P < 0.01; *P < 0.05 (ANOVA plus post hoc). (D)
Mitochondria display an increase in volume. More than 300 cells from two biological replicates were inspected, and the images here display representative examples.
Proteostasis modulates glucose metabolism, M. Peri�c et al.4
ª 2017 The Authors. Aging Cell published by the Anatomical Society and John Wiley & Sons Ltd.
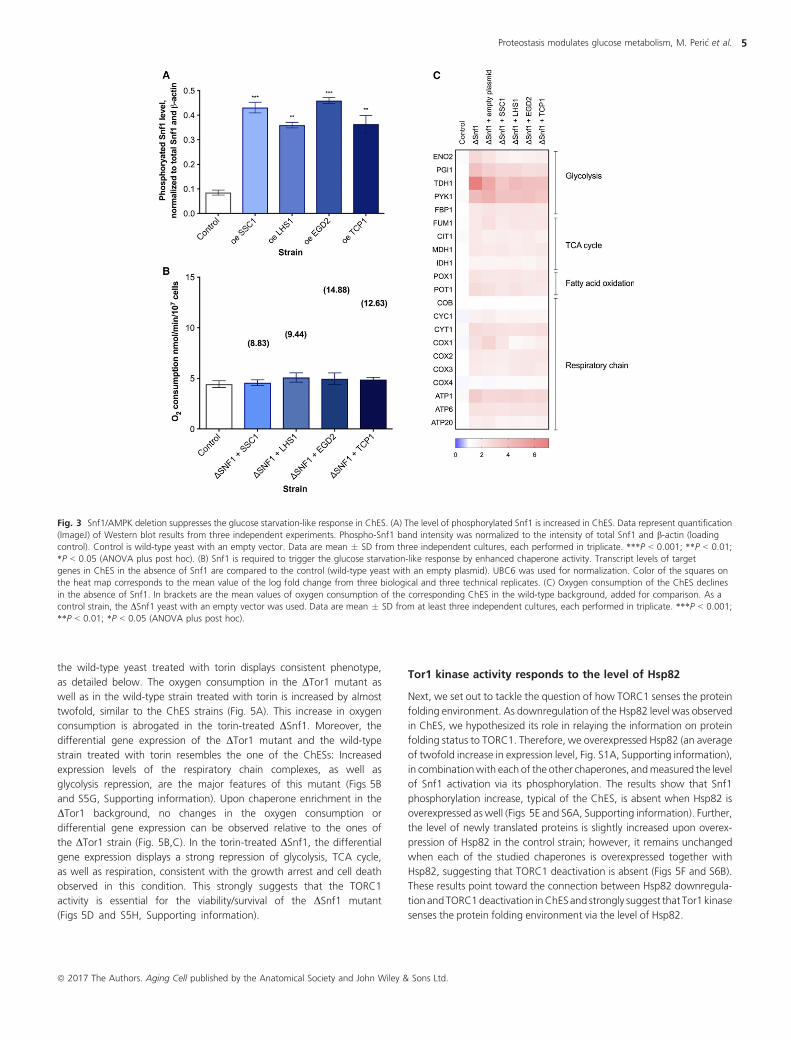
the wild-type yeast treated with torin displays consistent phenotype,
as detailed below. The oxygen consumption in the DTor1 mutant as
well as in the wild-type strain treated with torin is increased by almost
twofold, similar to the ChES strains (Fig. 5A). This increase in oxygen
consumption is abrogated in the torin-treated DSnf1. Moreover, the
differential gene expression of the DTor1 mutant and the wild-type
strain treated with torin resembles the one of the ChESs: Increased
expression levels of the respiratory chain complexes, as well as
glycolysis repression, are the major features of this mutant (Figs 5B
and S5G, Supporting information). Upon chaperone enrichment in the
DTor1 background, no changes in the oxygen consumption or
differential gene expression can be observed relative to the ones of
the DTor1 strain (Fig. 5B,C). In the torin-treated DSnf1, the differential
gene expression displays a strong repression of glycolysis, TCA cycle,
as well as respiration, consistent with the growth arrest and cell death
observed in this condition. This strongly suggests that the TORC1
activity is essential for the viability/survival of the DSnf1 mutant
(Figs 5D and S5H, Supporting information).
Tor1 kinase activity responds to the level of Hsp82
Next, we set out to tackle the question of how TORC1 senses the protein
folding environment. As downregulation of the Hsp82 level was observed
in ChES, we hypothesized its role in relaying the information on protein
folding status to TORC1. Therefore, we overexpressed Hsp82 (an average
of twofold increase in expression level, Fig. S1A, Supporting information),
in combinationwith each of the other chaperones, andmeasured the level
of Snf1 activation via its phosphorylation. The results show that Snf1
phosphorylation increase, typical of the ChES, is absent when Hsp82 is
overexpressed as well (Figs 5E and S6A, Supporting information). Further,
the level of newly translated proteins is slightly increased upon overex-
pression of Hsp82 in the control strain; however, it remains unchanged
when each of the studied chaperones is overexpressed together with
Hsp82, suggesting that TORC1 deactivation is absent (Figs 5F and S6B).
These results point toward the connection between Hsp82 downregula-
tion andTORC1deactivation inChESand strongly suggest that Tor1 kinase
senses the protein folding environment via the level of Hsp82.
Fig. 3 Snf1/AMPK deletion suppresses the glucose starvation-like response in ChES. (A) The level of phosphorylated Snf1 is increased in ChES. Data represent quantification
(ImageJ) of Western blot results from three independent experiments. Phospho-Snf1 band intensity was normalized to the intensity of total Snf1 and b-actin (loading
control). Control is wild-type yeast with an empty vector. Data are mean � SD from three independent cultures, each performed in triplicate. ***P < 0.001; **P < 0.01;
*P < 0.05 (ANOVA plus post hoc). (B) Snf1 is required to trigger the glucose starvation-like response by enhanced chaperone activity. Transcript levels of target
genes in ChES in the absence of Snf1 are compared to the control (wild-type yeast with an empty plasmid). UBC6 was used for normalization. Color of the squares on
the heat map corresponds to the mean value of the log fold change from three biological and three technical replicates. (C) Oxygen consumption of the ChES declines
in the absence of Snf1. In brackets are the mean values of oxygen consumption of the corresponding ChES in the wild-type background, added for comparison. As a
control strain, the DSnf1 yeast with an empty vector was used. Data are mean � SD from at least three independent cultures, each performed in triplicate. ***P < 0.001;
**P < 0.01; *P < 0.05 (ANOVA plus post hoc).
Proteostasis modulates glucose metabolism, M. Peri�c et al. 5
ª 2017 The Authors. Aging Cell published by the Anatomical Society and John Wiley & Sons Ltd.

Crucially, these results demonstrate that TORC1 acts as a ‘messenger’
between the folding environment and metabolism: Itself responsive of
the status of folding environment, TORC1 is able to communicate with
Snf1 kinase via its negative regulation.
To further verify the involvement of Hsp82 in the TORC1-related
chaperone activity sensing, we have used geldanamycin, an Hsp82
inhibitor, and measured the differential gene expression and mito-
chondrial activity under these conditions. We have found that Hsp82
inhibition by geldanamycin results in similar changes in gene expres-
sion as those observed in the ChES (Figs 5G and S6C, Supporting
information), with glycolysis and TCA cycle repression and respiration
activation being the main features. These results demonstrate that
Hsp82 inhibition/downregulation may be one of the most proximal
events of this signaling cascade. Moreover, this scenario is further
corroborated by the increased oxygen consumption in the wild-type
strain treated with geldanamycin (Fig. 5H). Interestingly, fatty acid
oxidation-related POT1 and POX1 display a significant upregulation
upon geldanamycin treatment, contrary to the previous results
showing that FA oxidation increase is not related to enriched
chaperone activity and reduced Hsp82 levels in the wild-type
background (ChES). On the other hand, when treated with gel-
danamycin, the strain exhibiting constitutive Tor1 activity (caTor1)
does not experience the same changes: The differential gene
expression is similar to the one of the caTor1 strain in the absence
of geldanamycin and is characterized by upregulation of glycolytic
enzymes and an overall unchanged expression levels of key compo-
nents of the respiratory chain (Fig. 5G). Moreover, geldanamycin
treatment of the caTor1 strain does not result in increased oxygen
consumption relative to the caTor1 in the absence of geldanamycin
and to the wild-type control strain (Fig. 5H). These results further
demonstrate that Hsp82 inhibition is a trigger event leading to TORC1
deactivation, Snf1 activation, and the consequent glucose starvation-
like phenotype in ChES. Furthermore, these results underscore the
importance of TORC1 deactivation in the observed signaling cascade.
Fig. 4 TORC1 undergoes deactivation upon chaperone enrichment and negatively regulates Snf1/AMPK. (A) The amount of newly translated proteins is decreased in ChES.
Data represent quantification (ImageJ) of Western blot results from three independent experiments (mean with SD). ***P < 0.001; **P < 0.01; *P < 0.05 (ANOVA plus post
hoc). (B) ChESs display a decreased level of phosphorylated Sch9. Sch9 is a downstream target of Tor1 kinase; thus, TOR deactivation is confirmed in ChES. Data represent
quantification (ImageJ) of Western blot results from three independent experiments. Phospho-Sch9 band intensity was normalized to the total level of Sch9 and to the
intensity of b-actin (loading control). Control is wild-type yeast with an empty vector. Data are mean � SD from at least three independent cultures, each performed in
triplicate. ***P < 0.001; **P < 0.01; *P <0.05 (ANOVA plus post hoc). (C) Tor1 acts as a negative regulator of Snf1. The level of phosphorylated Snf1 is measured in the
caTor1 strain and Tor1-null strain and chaperone enrichment in the background of caTor1. Data represent quantification (ImageJ) of Western blot results from three
independent experiments. Phospho-Snf1 band intensity was normalized to the intensity of total Snf1 and b-actin (loading control). Control is wild-type yeast with an empty
vector. Data are mean � SD from at least three independent cultures, each performed in triplicate. ***P < 0.001; **P < 0.01; *P < 0.05 (ANOVA plus post hoc).
(D) Oxygen consumption rates remain unchanged in the case of chaperone enrichment in the caTor1 background. Control is wild-type yeast with an empty vector. Data are
mean � SD from at least three independent cultures, each performed in triplicate. ***P < 0.001; **P < 0.01; *P < 0.05 (ANOVA plus post hoc). (E) The differential
gene expression (by qPCR) characteristic of chaperone enrichment in the caTor1 background does not phenocopy glucose starvation response. Color of the squares on the
heat map corresponds to the mean value of the log fold change from three biological and three technical replicates. UBC6 was used for normalization. Control is
wild-type yeast with an empty vector.
Proteostasis modulates glucose metabolism, M. Peri�c et al.6
ª 2017 The Authors. Aging Cell published by the Anatomical Society and John Wiley & Sons Ltd.
Chaperone enrichment results in RLS extension
Replicative lifespan (RLS) is measured as the maximum number of
divisions mother cells go through before the onset of senescence. The
control strain produced a maximum of 18 buds during its RLS (Fig. 6A).
We acknowledge that this RLS is shorter than reported in the literature
for a related S288C wild-type strain. However, one possible reason for
this is the fact that we have monitored RLS constantly at 30 °C and the
plates with cells were never placed to 4 °C during their lifespans, a
widely used RLS extending practice.
The largest effect on RLS, with a 67% lifespan extension compared to
the empty vector control, was achieved by overexpressing the Egd2, a
subunit of the nascent polypeptide-associated complex (NAC). Overex-
pression of Tcp1, cytosolic T-complex, also had a beneficial effect on
RLS, extending it by 61% compared to the control, as well as Lhs1, an ER
Hsp70 chaperone, which yielded 56% RLS increase. Finally, the
Fig. 5 Downregulation of Hsp82 is required for the TORC1 deactivation and Snf1 activation in ChES. (A) Oxygen consumption is increased in theDTor1 strain; however, TORC1
deactivation of DSnf1 strain causes a strong respiration decline. Control is wild-type yeast with an empty vector. Data are mean � SD from at least three independent
cultures, each performed in triplicate. ***P < 0.001; **P < 0.01; *P < 0.05 (ANOVA plus post hoc). (B) Differential gene expression in DTor1 strain shows a phenocopy of the
glucose starvation response. The detected response is consistent with the one found in ChES and is consistent with increased Snf1 activation. Chaperone enrichment of the
DTor1 background does not lead to any further changes in the gene expression pattern. Color of the squares on the heat map corresponds to the mean value of the log fold
change from three biological and three technical replicates. UBC6 was used for normalization. Control is wild-type yeast with an empty vector. (C) Oxygen consumption
does not change upon chaperone enrichment in the DTor1 background. Control is wild-type yeast with an empty vector. Data are mean � SD from at least three independent
cultures, each performed in triplicate. ***P < 0.001; **P < 0.01; *P < 0.05 (ANOVA plus post hoc). (D) Simultaneous deactivation of the TOR (by 100 nM torin) and
Snf1/AMPK pathways leads to a strong downregulation of almost all metabolic activities. Color of the squares on the heat map corresponds to the mean value of the log fold
change from three biological and three technical replicates. UBC6 was used for normalization. Control is wild-type yeast with an empty vector. (E) The level of Snf1
phosphorylation upon simultaneous enrichment in each studied chaperone and the Hsp82 remains at the level observed in the control strain (Hsp82 enrichment in the wild-type
yeast background) and does not undergo an increase. Data represent quantification (ImageJ) of Western blot results from three independent experiments. Phospho-Snf1 band
intensity was normalized to the intensity of total Snf1 and b-actin (loading control). Data are mean � SD from at least three independent cultures, each performed in
triplicate. ***P < 0.001; **P < 0.01; *P < 0.05 (ANOVA plus post hoc). (F) The amount of newly translated proteins upon simultaneous enrichment in each studied chaperone
and the Hsp82 does not display the characteristic decrease, but rather a slight increase in translation activity. Data represent quantification (ImageJ) of Western blot results
from three independent experiments (mean with SD). ***P < 0.001; **P < 0.01; *P < 0.05 (ANOVA plus post hoc). (G) Inhibition of Hsp82 by geldanamycin in the
wild-type strain (control) leads to the differential gene expression characteristic of ChES. Such gene expression pattern is consistent with TOR deactivation, albeit absent in the
case of geldanamycin treatment of the strain with constitutively active TOR activity. Color of the squares on the heat map corresponds to the mean value of the log fold
change from three biological and three technical replicates. UBC6 was used for normalization. (H) Inhibition of Hsp82 by geldanamycin leads to an increase in the oxygen
consumption in the control strain, however, not in the strain with constitutively active TOR (caTor1). Control is wild-type yeast. Data are mean � SD from at least three
independent cultures, each performed in triplicate. ***P < 0.001; **P < 0.01; *P < 0.05 (ANOVA plus post hoc).
Proteostasis modulates glucose metabolism, M. Peri�c et al. 7
ª 2017 The Authors. Aging Cell published by the Anatomical Society and John Wiley & Sons Ltd.

overexpression of Ssc1, the mitochondrial HSP70, resulted in 33%
lifespan extension relative to the empty vector control. Median RLS is not
affected and is ~12 generations for the studied strains (Fig. 6A).
The observed extension of the RLS in ChES is mainly limited to the
final part of the survival curve. Therefore, to exclude the possibility that
the effect we see is a consequence of several resistant cells refusing to
die, normally present in each population, we have calculated the area
under the curve corresponding to the final lifespan stage (AUClate) (see
Methods for details). The AUClate, normalized to the total AUC under the
entire survival curve (AUCtotal), in the control strain reports that 0.66%
of the studied population reaches the late life stage. On the other hand,
ChESs show an increase in this parameter, with 4–10% of the
population reaching the late life stage in the four ChESs. This result
further speaks in favor of the increased longevity of the ChES, while the
question remains what is its underlying mechanism.
To facilitate the comparison with the literature, we have performed
a subset of RLS measurements at 30 °C with overnight storing of
plates at 4 °C. Our control strain (wild-type with the empty vector)
displays a mean RLS of ~30 generations with a maximum RLS of ~50
generations (Fig. S7A, Supporting information). Compared to the
same strain with continuous monitoring at 30 °C, this represents a
dramatic extension of RLS. Enrichment in Egd2 and Lhs1 further
extends the RLS with mean RLS around 40 generation and maximum
RLS more than 60 generation (Fig. S7A, Supporting information). As
these results clearly demonstrate that overnight refrigeration of plates
yields an effect on yeast RLS, which has yet to be investigated, we
continue to present the RLS measurements with constant monitoring
at 30 °C. Such effect of overnight refrigeration is not surprising: It is
well known that extended periods (4–12 h) at 4 and 10°C in
budding yeast induce the expression of many chaperones (Hsp26,
Hsp42, Hsp104, Hsp70), trehalose synthesis genes, and antioxidant
protection from which the cell can and does benefit immensely
(Aguilera et al., 2007).
Snf1/AMPK activation is essential for the chaperone-
mediated lifespan extension
To test its involvement in the RLS extension, we determined RLS of ChES
in the absence of Snf1 kinase. As all the strains tested so far displayed
similar phenotype, we decided to limit the laborious RLS measurements
to ChES overexpressing Lhs1 and Egd2. The deletion of Snf1 kinase itself
resulted in an extended RLS with the maximum number of generations
of 24 and the median of 15 generations. Although this is not a large RLS
extension, the displayed trend is opposite from the published data that
report on a decreased RLS in the absence of Snf1 (Ashrafi et al., 2000).
One potential reason could be the difference in experimental conditions
of micromanipulation that, in our case, was performed continuously at
30 °C, and not with overnight refrigeration as in Ashrafi et al. However,
in the absence of Snf1, RLS of these two ChES mutants is comparable to
that of the control strain; that is, there is a loss of the chaperone-
mediated RLS extension when compared to the ChES (Fig. 6B, compared
to Fig. 6A). Thus, we conclude that the Snf1 kinase is essential for the
observed RLS extension.
Tor1 deactivation is essential for the chaperone-mediated
lifespan extension
To investigate the role that TOR deactivation has in the RLS extension
observed in ChES, we have overexpressed each chaperone in the
background with constitutively active Tor1 kinase (caTor1) background.
As above, we have limited the RLS measurement to the strains enriched
in Lhs1 and Egd2.
The maximum number of generations that the caTor1 strain goes
through is 20, thereby displaying no significant difference from the
control strain (Fig. 6C). Moreover, enrichment in Lhs1 and Egd2 in the
caTor1 background did not yield any changes in maximum RLS
compared to the control, however, and led to a strong reduction of
RLS compared to the one observed in ChES. The observed maximum
number of generations is 18 for Lhs1 enrichment and 20 for Egd2
enrichment in the background of caTor1 (Fig. 6C). In the case of Lhs1
enrichment, the median RLS has decreased to only nine generations.
Based on these results, we conclude that the deactivation of Tor1 kinase
is an essential part of the mechanism responsible for the observed RLS
extension.
Respiration increase is essential for the chaperone-mediated
lifespan extension
Respiration increase during carbon starvation (CS) has been identified as
the most likely event responsible for the CS-driven RLS extension (Lin
et al., 2002). To investigate whether that is also the case in ChES, we
have overexpressed the chaperones in the respiration-deficient, petite
(q-) strain. While the petite strain itself displays an extended median and
maximum RLS relative to the control strain (16 and 24 generations,
respectively), consistent with previous observations (Woo & Poyton,
2009), the chaperone enrichment in the petite background does not
result in further RLS extension, with only 23 (Lhs1 enrichment) and 24
(Egd2 enrichment) generations (Fig. 6D). This result underscores the
importance of respiration increase during chaperone enrichment in the
RLS extension.
Discussion
The relationship between cellular proteostasis and the metabolic
processes can be considered a central homeostatic mechanism, and
its importance is unequivocal. Yet, almost nothing is known about this
connection and its role in cellular functioning. More specifically, it is
vague which pathway performs the sensing of the folding environment,
as well as if and how such information is relayed to other cellular
networks. Furthermore, while it is rather well described how a cell
responds to proteotoxic stress in the context of stress responses,
nothing is known about cellular response to alleviation of protein
misfolding.
Here, we present a new perspective from which cellular proteostasis is
implicated in basic cellular functioning via its cross talk with metabolism
andmitochondrial function.We demonstrate that protein chaperones are
not only managers of misfolded proteins, but also act as some of the key
determinants of cellular metabolic activity. Although we cannot rule out
thepossibility that the four chaperones employed in this studyhave specific
regulatory roles regarding Hsp82, our results suggest that alleviation of
protein misfolding impacts mitochondrial function and metabolic activity.
The transcriptome analysis reveals that the chaperone-enriched
strains (ChESs) have activated a response that is a phenocopy of the
response to glucose starvation and that relies on their chaperoning
activity. This response is characterized by a reduction in the glycolytic
and the TCA cycle activity accompanied by an increase in oxygen
consumption (Lin et al., 2002).
Our results implicate Snf1 kinase in the integration of signals of
protein folding environment status with carbon metabolism (Fig. 6E).
As evidenced by the differential gene expression characteristic of
Proteostasis modulates glucose metabolism, M. Peri�c et al.8
ª 2017 The Authors. Aging Cell published by the Anatomical Society and John Wiley & Sons Ltd.

chaperone enrichment in the absence of Snf1, Snf1 activation is
responsible for the metabolic reprogramming observed in ChES.
Usually, cell growth in limited glucose availability activates the Snf1
kinase by its phosphorylation (Hong et al., 2003), resulting in
transcriptional activation of genes encoding for enzymes involved in
gluconeogenesis, fatty acid oxidation, and respiration (Busti et al.,
2010), as well as repression of glycolysis. A response reciprocal to this
one was observed in our previous work: Mild proteotoxic stress
resulted in a decline in respiration, activation of the pentose phosphate
pathway as well as induction of antioxidative protection and protein
maintenance machineries (Peri�c et al., 2016).
Furthermore, our results indicate that when the folding environment
is impeccable, the cell reduces the level of new protein synthesis.
Presumably, there are two possible reasons for this: First, the energy is
invested into protein maintenance rather than synthesis, and second, the
damage-induced protein degradation may be decreased, also resulting in
the lower need for new synthesis. In this context, we uncovered a dual
role of the TORC1 complex (Fig. 6E):
1 Tor1 kinase as a messenger delivering the information on the status
of the folding environment as the negative regulator of Snf1 kinase.
2 Tor1 kinase as a sensor of the folding environment improvement,
resulting in its deactivation.
The interplay between the TOR pathway and proteostasis has already
been studied in human cultured cells where a key role of the mTORC1
has been proposed in response to proteotoxic stress (Chou et al., 2012).
Further, it has been demonstrated that reduction in mTORC1 levels by
RNA interference leads to increased sensitivity to heat shock. This effect
was accompanied by a drastic reduction in ability to synthesize heat-
shock proteins (HSPs), including Hsp70, Hsp90, and Hsp110 (Chou et al.,
2012). Another study demonstrated that cells are able to distinguish
between moderate and severe proteotoxicity and that mTORC1 complex
is in charge of sensing the misfolded proteins (Qian et al., 2010).
Levels of TOR pathway activity directly modulate cellular metabolism,
in part by shifting the balance between modes of energy production and
usage. We have shown that chaperone gain of function indeed decreases
TOR activity, thereby decreasing the amount of newly synthesized
Fig. 6 Replicative lifespan extension relies on TOR deactivation and Snf1 activation and is caused by the respiration increase in ChES. (A) Replicative lifespan is extended in
ChES. The number of cells is 103, 120, 112, 129, and 127 for the wild-type with an empty plasmid, oe SSC1, oe LHS1, oe EGD2, and oe TCP1, respectively. The table below
the graph displays the percentage of the studied population that is still alive in the late life stage of the RLS. P values are 0.0009 (LHS1 and EGD2), 0.0004 (TCP1), and 0.0081
(0.0081). (B) Replicative lifespan extension in ChES is abolished in the absence of Snf1. The number of cells is 103 (control, wild-type with an empty plasmid), 95 (DSnf1), 79(DSnf1+LHS1), 95 (DSnf1+EGD2). P value for DSnf1 relative to control RLS is <0.0001. P values for DSnf1+LHS1 and DSnf1+EGD2 relative to the control are >0.05. (C)Replicative lifespan extension in ChES is abolished when the TOR pathway displays constitutive activity. The number of cells is 103 (control, wild-type with an empty plasmid),
94 (caTor1), 89 (caTor1+LHS1), 94 (caTor1+EGD2). P values for the RLS of caTor1, caTor1+LHS1, and caTor1+EGD2 compared to the control are >0.05. (D) Replicativelifespan extension in ChES fully relies on the respiration increase and is absent in the case of chaperone enrichment in the respiration-deficient background petite. The
number of cells is 103 (control, wild-type with an empty plasmid), 100 (petite), 97 (petite+LHS1), 99 (petite+EGD2). P value for the petite strain relative to control is <0.0001.P values for petite+LHS1 and petite+EGD2 relative to control are 0.048 and 0.044, respectively. The data shown are pooled from three independent experiments for each
strain. Oe stands for overexpression. Significance of the results was tested with log-rank (Mantel–Cox) test. (E) The proposed mechanism of enhanced chaperone activity
sensing via Tor1-Snf1 cross talk. Tor1 is in charge of sensing of improved protein folding environment via Hsp82, resulting in its decreased activity. The consequent activation
of Snf1 kinase results in repression of glycolysis and the TCA cycle, as well as activation of respiration. Increased respiratory activity triggers replicative lifespan extension.
Proteostasis modulates glucose metabolism, M. Peri�c et al. 9
ª 2017 The Authors. Aging Cell published by the Anatomical Society and John Wiley & Sons Ltd.

proteins, and, on the other hand, activating Snf1 kinase and a glucose
starvation-like response. Consistent with our observations, previously
obtained immunochemical data in human cell cultures indicate that
nitrogen limitation improves Snf1 phosphorylation, thereby showing that
Snf1 is negatively regulated by the rapamycin-sensitive Tor kinase (Orlova
et al., 2006). As TORC1 deactivation and Snf1 activation are responses to
nitrogen and carbon starvation, respectively, the possibility that TORC1
deactivation may serve as a signal for Snf1 activation is rather expected,
albeit different from their canonical relationship that posits Snf1
upstream of TOR. Moreover, it has been shown that a decreased activity
of Tor1 in yeast results in a greater activity of the mitochondrial
respiratory chain, observed as an increased oxygen consumption, as well
as ROS level (Pan et al., 2011). The authors propose that the observed
increase in chronological lifespan may be a consequence of an adaptive
response of cells to the increased ROS level. However, based on our
results, it is possible that the increased lifespan in the Tor1-deficient strain
is a result of Snf1 activation leading to a response akin to glucose
starvation. Interestingly, our results suggest that simultaneous inactiva-
tion of both TORC1 and Snf1 pathways leads to severe growth defects
and cell death. This result suggests that cells cannot tolerate simultane-
ous repression of both glycolysis (consequence of TORC1 deactivation)
and autophagy (consequence of Snf1 deletion). Details of this cross talk
will be a subject of extensive research in the future.
Dynamic nature of the TORC1 complex, whose assembly is necessary
for signal transduction, could be responsible for the plasticity of
communication between proteostasis and metabolism (Sengupta et al.,
2010). In the context of protein folding sensing, we identify the Hsp82
chaperone as a TOR informant on the folding status, consistently with
multiple functions that this chaperone has been proposed to have in the
context of cellular metabolism (Dezwaan & Freeman, 2008). Simultane-
ous enrichment of cells with Hsp82 together with each studied
chaperone does not result in the response akin to glucose starvation,
suggesting that the decline in Hsp82 activity is required to inactivate
TORC1 and trigger the downstream phenotype. Inhibition of Hsp82 by
geldanamycin confirms such scenario: Upon chemical inactivation of
Hsp82 in the wild-type yeast, a response consistent with one in ChES is
observed. The differential gene expression reveals repression of glycolysis
and increase in the expression of the respiratory chain complexes,
supported by increased oxygen consumption. Importantly, such effect of
Hsp82 inhibition by geldanamycin is absent in the strain with constitutive
Tor1 kinase activity, demonstrating that the inactivation of TORC1 is
essential for relaying the information on Hsp82 deactivation. mTOR and
other regulatory components, such as raptor, are chaperone clients in
mammalian cells, as evidenced by their selective binding to Hsp90 when
not forming a complex (Qian et al., 2010). Such mechanism likely
enables yeast TORC1 to rapidly detect and respond to intracellular
folding environment, while also adjusting the cellular metabolic activity.
The tight linkage between protein quality and quantity control provides a
plausible mechanism coupling protein folding quality with metabolic
activity.
Many conditions that shift cells from states of nutrient utilization and
growth to states of cell maintenance extend lifespan across species
(Lakowski & Hekimi, 1998; Kaeberlein et al., 2006; Grandison et al.,
2009). In yeast, the most common way to invoke dietary restriction
involves reduced glucose or amino acid levels in the medium (Lin et al.,
2000; Fabrizio et al., 2004). In other words, improved proteostasis, TOR
deactivation (typical for amino acid starvation), and Snf1 activation
(typical for glucose starvation response) all could have been responsible
for the observed RLS extension in ChES. We show that the observed RLS
extension relies completely on enhanced respiratory activity of the ChES,
one of the metabolic consequences of improved proteostasis. In the
proposed mechanism (Fig. 6E), enhanced respiration is a downstream
consequence of TORC1 deactivation and Snf1 activation, evidenced by
the loss of the chaperone-mediated RLS extension in the absence of Snf1
and in the background of constitutively active Tor1 kinase. The
involvement of Snf1 in aging has already been described with its
deletion and overexpression shortening and extending the lifespan,
respectively (Ashrafi et al., 2000; Managbanag et al., 2008). Similarly, it
has been shown that the deletion of Snf1 in budding yeast abolishes the
proteasome-mediated lifespan extension (Yao et al., 2015).
The results presented here shift the focus away from the well-known
role of chaperones in protein homeostasis, while highlighting their
downstream effects on cellular metabolic and mitochondrial activity.
Specifically, a persistent theme in the studies of aging is the contribution
of energy intake and expenditure to longevity on one hand, and protein
homeostasis on the other. Our study suggests that these two pathways
are not only separately involved in aging, but that there is a cross talk
between them, promoted by the communication between Tor1 and
Snf1 kinases, resulting in the activation of the latter regardless of glucose
availability. We suggest that protein chaperones should be included
among the molecules that are able to modulate glucose sensing and
hence the energy status of the cell. Although the purpose of activating
an energy-saving response as a consequence of protein misfolding
alleviation remains elusive, the described mechanism may help direct the
search for caloric restriction mimetics and provide novel avenues for
future research of aging and age-related pathologies.
Experimental procedures
Strains and growth conditions
Wild-type Saccharomyces cerevisiae Y258 was used, derived from
S288C. WT Y258 and strains overexpressing Lhs1, Ssc1, Egd2, and
Tcp1 genes were purchased from Thermo Scientific (Dharmacon,
Lafayette, Colorado, USA). The overexpression of each chaperone was
confirmed using the RNASeq data as well as by flow cytometry (details
below). WT Y258 was grown on YPD medium with 2% (w/v) glucose
and chaperone overexpression mutants on –URA medium with 2% (w/v)
glucose, at 30 °C with shaking. Hsp82 (an Hsp90 chaperone, YPL240C)
overexpression was applied from the same plasmid in which the URA3
was replaced by a nourseothricin cassette. The strain with constitutively
active Tor1 kinase was selected on 9 mM caffeine YPD plates and
confirmed by sequencing of the Tor1 locus to have the I1954V mutation.
The sequence of Tor2 locus was confirmed to be unchanged. Deletion of
Snf1 was performed according to the previously described protocol,
using a hygromycin cassette for selection (Rothstein, 1983). Expression
from plasmids was induced by 2% galactose using the following
protocol: Overnight cultures were diluted 1009 and grown until mid-
exponential phase. Then, the cells were pelleted by a 5-min centrifuga-
tion at 4000 g and resuspended in YPD medium without glucose,
supplemented with 2% galactose. The empty vector control is always
treated in the same manner. All experiments were performed on
postdiauxic shift cells, harvested by 5-min centrifugation at 4000 g,
washed, and treated accordingly. In different experiments, the identity
of the control strain is defined in the Results section and in the
corresponding figure caption.
All other methods are described in Appendix S1 (Supporting
information).
Proteostasis modulates glucose metabolism, M. Peri�c et al.10
ª 2017 The Authors. Aging Cell published by the Anatomical Society and John Wiley & Sons Ltd.

Acknowledgments
The authors would like to thank Tea Copi�c and Iva Pe�sun Me�dimorec for
their excellent technical contribution. AK is grateful to Miroslav Radman,
Tobias Warnecke, and Fran Supek for valuable discussions and reading
the manuscript.
Funding
This work was supported by the Fondation Nelia et Amedeo Barletta,
NAOS Group, and the Mediterranean Institute for Life Sciences to AV,
MP, MM, MR, AN, and AK; Croatian Ministry of Science, Education and
Sports, Grant No. 098-0982464-1647 to A�S and SS; European
Commission Seventh Framework Program, Integra-Life; grant 315997
to KV; FP7-REGPOT-2012-2013-1, Grant No. 316289, InnoMol to AMM;
grant 337327 from the European Research Council to NR and PBD; IM is
supported by an Emmy Noether Award from the Deutsche Forschungs-
gemeinschaft.
Author contributions
The study was designed by NR and AK; data were generated and
analyzed by MP, AL, A�S, SS, MR, MM, AN, PBD, AMM, SD, NR, and AK;
consultation on spinning disk imaging was provided by IM; RNA
sequencing data analysis was designed and conducted by KV; the
manuscript was written by NR, KV, and AK.
Conflict of interest
The authors have no conflict of interest to declare.
References
Aguilera J, Randez-Gil F, Prieto JA (2007) Cold response in Saccharomyces
cerevisiae: new functions for old mechanisms. FEMS Microbiol. Rev. 31, 327–341.
Andersson V, Hanzen S, Liu B, Molin M, Nystrom T (2013) Enhancing protein
disaggregation restores proteasome activity in aged cells. Aging 5, 802–812.Ashrafi K, Lin SS, Manchester JK, Gordon JI (2000) Sip2p and its partner Snf1p
kinase affect aging in S. cerevisiae. Genes Dev. 14, 1872–1885.Brandvold KR, Morimoto RI (2015) The chemical biology of molecular chaperones–implications for modulation of proteostasis. J. Mol. Biol. 427, 2931–2947.
Busti S, Coccetti P, Alberghina L, Vanoni M (2010) Glucose signaling-mediated
coordination of cell growth and cell cycle in Saccharomyces cerevisiae. Sensors
10, 6195–6240.Chou SD, Prince T, Gong J, Calderwood SK (2012) mTOR is essential for the
proteotoxic stress response, HSF1 activation and heat shock protein synthesis.
PLoS ONE 7, e39679.Dezwaan DC, Freeman BC (2008) HSP90: the Rosetta stone for cellular protein
dynamics? Cell Cycle 7, 1006–1012.Fabrizio P, Battistella L, Vardavas R, Gattazzo C, Liou LL, Diaspro A, Dossen JW,
Graua EB, Longo VD (2004) Superoxide is a mediator of an altruistic aging
program in Saccharomyces cerevisiae. J. Cell Biol. 166, 1055–1067.Grandison RC, Piper MD, Partridge L (2009) Amino-acid imbalance explains
extension of lifespan by dietary restriction in Drosophila. Nature 462, 1061–1064.
Hardt M, Chantaravisoot N, Tamanoi F (2011) Activating mutations of TOR (target
of rapamycin). Genes Cells 16, 141–151.Hedbacker K, Carlson M (2009) SNF1/AMPK pathways in yeast. Front Biosci. 13,2408–2420.
Hong SP, Leiper FC, Woods A, Carling D, Carlson M (2003) Activation of yeast Snf1
and mammalian AMP-activated protein kinase by upstream kinases. Proc. Natl
Acad. Sci. USA 100, 8839–8843.
Kaeberlein TL, Smith ED, Tsuchiya M, Welton KL, Thomas JH, Fields S, Kennedy BK,
Kaeberlein M (2006) Lifespan extension in Caenorhabditis elegans by complete
removal of food. Aging Cell 5, 487–494.Labbadia J, Morimoto RI (2015) The biology of proteostasis in aging and disease.
Annu. Rev. Biochem. 84, 435–464.Lakowski B, Hekimi S (1998) The genetics of caloric restriction in Caenorhabditis
elegans. Proc. Natl Acad. Sci. USA 95, 13091–13096.Lin SJ, Defossez PA, Guarente L (2000) Requirement of NAD and SIR2 for life-span
extension by calorie restriction in Saccharomyces cerevisiae. Science 289, 2126–2128.
Lin SJ, Kaeberlein M, Andalis AA, Sturtz LA, Defossez PA, Culotta VC, Fink GR,
Guarente L (2002) Calorie restriction extends Saccharomyces cerevisiae lifespan
by increasing respiration. Nature 418, 344–348.Managbanag JR, Witten TM, Bonchev D, Fox LA, Tsuchiya M, Kennedy BK,
Kaeberlein M (2008) Shortest-path network analysis is a useful approach toward
identifying genetic determinants of longevity. PLoS ONE 3, e3802.Morano KA, Liut PCC, Thiele DJ (1998) Protein chaperones and the heat shock
response in Saccharomyces cerevisiae. Curr. Opin. Microbiol. 1, 197–203.Orlova M, Kanter E, Krakovich D, Kuchin S (2006) Nitrogen availability and TOR
regulate the Snf1 protein kinase in Saccharomyces cerevisiae. Eukaryot. Cell 5,1831–1837.
Pan Y, Schroeder EA, Ocampo A, Barrientos A, Shadel GS (2011) Regulation of
yeast chronological life span by TORC1 via adaptive mitochondrial ROS signaling.
Cell Metab. 13, 668–678.Peri�c M, Dib PB, Dennerlein S, Musa M, Rudan M, Lovri�c A, Nikoli�c A, �Sari�c A,
Sobo�canec S, Ma�cak �Z, Raimundo N, Kri�sko A (2016) Crosstalk between cellular
compartments protects against proteotoxicity and extends lifespan. Sci. Rep. 6,28751.
Qian SB, Zhang X, Sun J, Bennink JR, Yewdell JW, Patterson C (2010) mTORC1
links protein quality and quantity control by sensing chaperone availability. J.
Biol. Chem. 285, 27385–27395.Rothstein RJ (1983) One-step gene disruption in yeast. Methods Enzymol. 101,
202–211.Rowland MA, Fontana W, Deeds EJ (2012) Crosstalk and competitions in signalling
network. Biophys. J. 103, 2389–2398.Sengupta S, Peterson TR, Sabatini DM (2010) Regulation of the mTOR complex 1
pathway by nutrients, growth factors and stress. Mol. Cell 40, 310–322.Su KH, Cao J, Tang Z, Dai S, He Y, Sampson SB, Benjamin IJ, Dai C (2016) HSF1
critically attunes proteotoxic stress sensing by mTORC1 to combat stress and
promote growth. Nat. Cell Biol. 18, 527–539.Vidovic A, Supek F, Nikolic A, Krisko A (2014) Signatures of conformational
stability and oxidation resistance in proteomes of pathogenic bacteria. Cell Rep.
7, 1393–1400.Wolff S, Weissman JS, Dillin A (2014) Differential scales of protein quality control.
Cell 157, 52–64.Woo DK, Poyton RO (2009) The absence of a mitochondrial genome in rho0 yeast
cells extends lifespan independently of retrograde regulation. Exp. Gerontol. 44,390–397.
Yao Y, Tsuchiyama S, Yang C, Bulteau AL, He C, Robison B, Tsuchiya M, Miller D,
Briones V, Tar K, Potrero A, Friguet B, Kennedy BK, Schmidt M (2015)
Proteasomes, Sir2, and Hxk2 form an interconnected aging network that
impinges on the AMPK/Snf1-regulated transcriptional repressor Mig1. PLoS
Genet. 11, e1004968.
Supporting Information
Additional Supporting Information may be found online in the supporting
information tab for this article.
Fig. S1 Enrichment in four different chaperones from different cellular
compartments results in alleviation of protein stress.
Fig. S2 Examples of representative images of Hsp104-GFP tagged protein
aggregates.
Fig. S3 The schematic presentation of domain architecture of each studied
chaperone.
Fig. S4 Chaperone activity is critical for the induction of the glucose
starvation-like response.
Proteostasis modulates glucose metabolism, M. Peri�c et al. 11
ª 2017 The Authors. Aging Cell published by the Anatomical Society and John Wiley & Sons Ltd.

Fig. S5 TOR deactivation and consequent Snf1 activation are key events
leading to the glucose starvation-like response in ChES.
Fig. S6 Hsp82 activity reduction results in Tor1 deactivation.
Fig. S7 Replicative lifespan of ChES with overnight storage of plates at 4 °C.Principle component analysis-based filtering of RNASeq replicates.
Table S1 The summary of the RNA Sequencing results with the data for each
strain organized in separate tabs.
Table S2 The list of genes with their transcript levels measured by qPCR in
this study and used primers.
Appendix S1 Experimental procedures.
Proteostasis modulates glucose metabolism, M. Peri�c et al.12
ª 2017 The Authors. Aging Cell published by the Anatomical Society and John Wiley & Sons Ltd.