advanced test equipment rentals€¦ · · 2015-05-19reflection/dtf 1.0 ms/point (typical)...
TRANSCRIPT

WEBSITE: www.jdsu.com/test
COMMUNICATIONS TEST & MEASUREMENT SOLUTIONS
JD785ACellAdvisor™ Base Station Analyzer
Spectrum Analyzer: 9 kHz to 8 GHz
Cable and Antenna Analyzer: 5 MHz to 6 GHz
Power Meter: 10 MHz to 8 GHz
Specification* ConditionsThe JD785A specifications apply under these conditions:• The instrument has been turned on for at least 15 minutes• The instrument is operating within a valid calibration period• Data with no tolerance are considered typical values• Cable and antenna measurements apply after calibration to the OSL standard• Typical and nominal values are defined as:
– Typical: expected performance of the instrument operating under 20° to 30°Cafter being at this temperature for 15 minutes
– Nominal: a general, descriptive term or parameter
Spectrum Analyzer (Standard)
FrequencyFrequency range 9 kHz to 8 GHz
Internal 10 MHz Frequency ReferenceAccuracy ±0.05 ppm + aging (0 to 50°C) Aging ±0.5 ppm/year
Frequency SpanRange 0 Hz (zero span)
10 Hz to 8 GHz Resolution 1 Hz
Resolution Bandwidth (RBW)–3 dB bandwidth 1 Hz to 3 MHz 1-3-10 sequenceAccuracy ±10% (nominal)
Video Bandwidth (VBW)–3 dB bandwidth 1 Hz to 3 MHz 1-3-10 sequenceAccuracy ±10% (nominal)
Single Sideband (SSB) Phase NoiseFc 1 GHz, RBW 10 kHz, VBW 1 kHz, RMS detectorCarrier offset:30 kHz 100 kHz 1 MHz
–100 dBc/Hz (–102 dBc/Hz, typical)–105 dBc/Hz (–112 dBc/Hz, typical)–115 dBc/Hz (–120 dBc/Hz, typical)
Measurement RangeDANL to +25 dBm
Input attenuator range 0 to 55 dB, 5 dB steps
Maximum Input LevelAverage continuous power +25 dBmDC voltage ±50 VDC
Displayed Average Noise Level (DANL)1 Hz RBW, 1 Hz VBW, 50 Ω termination, 0 dB attenuation, RMS detector Preamplifier off: 10 MHz to 3 GHz>3 GHz to 5 GHz >5 GHz to 7 GHz >7 GHz to 8 GHz
–140 dBm (–145 dBm, typical)–138 dBm (–142 dBm, typical) –135 dBm (–138 dBm, typical) –132 dBm (–135 dBm, typical)
Preamplifier on: 10 MHz to 3 GHz >3 GHz to 5 GHz >5 GHz to 7 GHz>7 GHz to 8 GHz
–160 dBm (–165 dBm, typical)–158 dBm (–162 dBm, typical) –155 dBm (–158 dBm, typical) –152 dBm (–155 dBm, typical)
*All specifications are subject to change without notice.
Advanced Test Equipment Rentalswww.atecorp.com 800-404-ATEC (2832)
®
Established 1981

2
JD785A CELLADVISOR BASE STATION ANALYZER
Display RangeLog scale and units (10 divisions displayed)
1 to 20 dB/division in 1 dB steps dBm, dBV, dBmV, dBµV
Linear scale and units (10 divisions displayed)
V, mV, mW, W
Detectors Normal, positive peak, sample, negative peak, RMS
Number of traces 6Trace functions Clear/write, maximum hold,
minimum hold, capture, load view on/off
Total Absolute Amplitude AccuracyPreamplifier off, power level >–50 dBm, auto-coupled 1 MHz to 8 GHz ±1.3 dB (±0.5 dB typical)
Add ±1.0 dB20°C to 30°C –10°C to 55°C after 60-minute warm up
Reference LevelSetting range –120 to +100 dBmSetting resolution Log scale Linear scale
0.1 dB 1% of reference level
MarkersMarker types Normal, delta, delta pair, noise,
frequency count markerNumber of markers 6
Marker functions Peak, next peak, peak left, peak right, minimum search marker to center/start/stop
RF Input VSWR1 MHz to 8 GHz 1.5:1 (typical) Atten >20 dB
Second Harmonic DistortionMixer level = –25 dBm50 MHz to 2.6 GHz <–65 dBc (typical) >2.6 GHz to 8 GHz <–70 dBc (typical)
Third-Order Inter-Modulation (Third-order Intercept: TOI)200 MHz to 3 GHz +10 dBm (typical) >3 GHz to 8 GHz +12 dBm (typical)
SpuriousInherent residual responseInput terminated, 0 dB attenuation, preamplifier off, RBW at 10 kHz –90 dBm (nominal)Exceptions –85 dBm @164.1 MHz, 1.95, 2.57264,
3.2, and 4.5 GHz–80 dBm @4.8/7.8 GHz
Input-related spurious <–70 dBc (nominal)
Dynamic Range2/3 (TOI-DANL) in 1 Hz RBW >104 dB @ 2 GHz
Sweep TimeRange 0.4 ms to 1000 s
24 µs to 200 s Span = 0 Hz (zero span)
Accuracy ±2% Span = 0 Hz (zero span)Mode Continuous, single
Gated SweepTrigger source External, video, and GPSGate length 1 µs to 100 ms Gate delay 0 to 100 ms
TriggerTrigger source Free run, video, external Trigger delay Range Resolution
0 to 200 s 6 µs
Measurements*Channel powerOccupied bandwidthSpectrum emission maskAdjacent channel powerSpurious emissionsField strengthAM/FM audio demodulationRoute map* CW signal generator (Option 003) can be set up simultaneously.
Cable and Antenna Analyzer (Standard)FrequencyRange 5 MHz to 6 GHzResolution 10 kHzAccuracy ±1 ppm
Data Points126, 251, 501, 1001, 2001
Measurement SpeedReflection/DTF 1.0 ms/point (typical)
Measurement AccuracyCorrected directivity 40 dBReflection uncertainty ±(0.3 + |20log (1+10-EP/20)|) (typical)
EP = directivity – measured return loss
3
JD785A CELLADVISOR BASE STATION ANALYZER
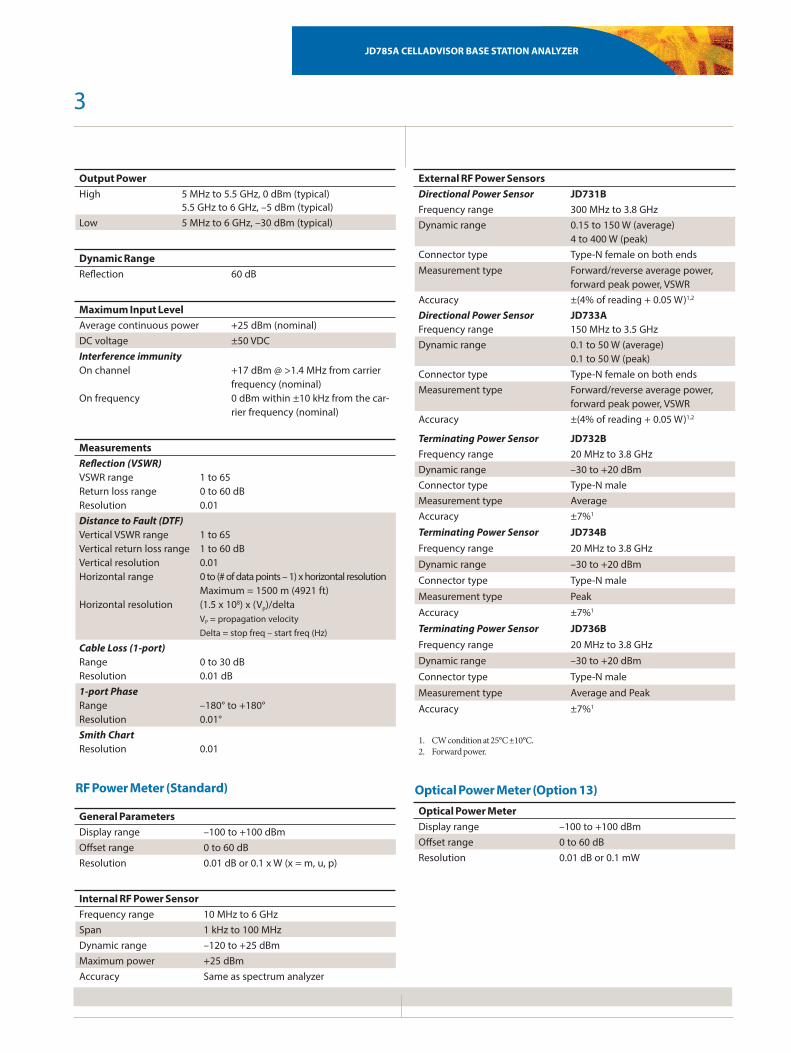
Output PowerHigh 5 MHz to 5.5 GHz, 0 dBm (typical)
5.5 GHz to 6 GHz, –5 dBm (typical)Low 5 MHz to 6 GHz, –30 dBm (typical)
Dynamic RangeReflection 60 dB
Maximum Input LevelAverage continuous power +25 dBm (nominal) DC voltage ±50 VDCInterference immunity On channel On frequency
+17 dBm @ >1.4 MHz from carrier frequency (nominal) 0 dBm within ±10 kHz from the car-rier frequency (nominal)
MeasurementsReflection (VSWR) VSWR range Return loss range Resolution
1 to 65 0 to 60 dB 0.01
Distance to Fault (DTF) Vertical VSWR range Vertical return loss range Vertical resolution Horizontal range Horizontal resolution
1 to 65 1 to 60 dB 0.01 0 to (# of data points – 1) x horizontal resolutionMaximum = 1500 m (4921 ft)(1.5 x 10⁸) x (VP)/delta VP = propagation velocityDelta = stop freq – start freq (Hz)
Cable Loss (1-port) Range Resolution
0 to 30 dB 0.01 dB
1-port Phase Range Resolution
–180° to +180° 0.01°
Smith Chart Resolution
0.01
RF Power Meter (Standard)
General ParametersDisplay range –100 to +100 dBmOffset range 0 to 60 dB Resolution 0.01 dB or 0.1 x W (x = m, u, p)
Internal RF Power SensorFrequency range 10 MHz to 6 GHz Span 1 kHz to 100 MHzDynamic range –120 to +25 dBmMaximum power +25 dBmAccuracy Same as spectrum analyzer
External RF Power SensorsDirectional Power Sensor JD731B Frequency range 300 MHz to 3.8 GHzDynamic range 0.15 to 150 W (average)
4 to 400 W (peak)Connector type Type-N female on both endsMeasurement type Forward/reverse average power,
forward peak power, VSWRAccuracy ±(4% of reading + 0.05 W)1,2
Directional Power SensorFrequency range
JD733A150 MHz to 3.5 GHz
Dynamic range 0.1 to 50 W (average)0.1 to 50 W (peak)
Connector type Type-N female on both endsMeasurement type Forward/reverse average power,
forward peak power, VSWRAccuracy ±(4% of reading + 0.05 W)1,2
Terminating Power Sensor JD732BFrequency range 20 MHz to 3.8 GHz Dynamic range –30 to +20 dBmConnector type Type-N maleMeasurement type AverageAccuracy ±7%1
Terminating Power Sensor JD734BFrequency range 20 MHz to 3.8 GHz
Dynamic range –30 to +20 dBm
Connector type Type-N male
Measurement type Peak
Accuracy ±7%1
Terminating Power Sensor JD736BFrequency range 20 MHz to 3.8 GHz
Dynamic range –30 to +20 dBm
Connector type Type-N male
Measurement type Average and Peak
Accuracy ±7%1
1. CW condition at 25°C ±10°C.2. Forward power.
Optical Power Meter (Option 13)Optical Power MeterDisplay range –100 to +100 dBmOffset range 0 to 60 dBResolution 0.01 dB or 0.1 mW

4
JD785A CELLADVISOR BASE STATION ANALYZER
External Optical Power SensorsOptical Power SensorWavelength range
MP-60780 to 1650 nm
Max permitted input level +10 dBmConnector input Universal 2.5 and 1.25 mmAccuracy ±5%Optical Power SensorWavelength range
MP-80780 to 1650 nm
Max permitted input level +23 dBmConnector input Universal 2.5 and 1.25 mmAccuracy ±5%
2-Port Transmission Measurements (Option 001)FrequencyFrequency range 5 MHz to 6 GHz Frequency resolution 10 kHz
Output PowerHigh 5 MHz to 5.5 GHz, 0 dBm (typical)
5.5 GHz to 6 GHz, –5 dBm (typical)Low 5 MHz to 6 GHz, –30 dBm (typical)
Measurement SpeedVector 1.6 ms/point (typical)Scalar 3.4 ms/point (typical)
Dynamic Range Vector 5 MHz to 3 GHz, 80 dB
>3 GHz to 6 GHz, 75 dB@average 5@average 5
Scalar 5 MHz to 4.5 GHz, >110 dB4.5 GHz to 6 GHz, >105 dB
MeasurementsInsertion Loss/Gain Range Resolution
–120 to 100 dB 0.01 dB
2-Port Phase Range Resolution
–180° to +180° 0.01°
Bias-Tee (Option 002)VoltageVoltage range +12 to +32 VVoltage resolution 0.1 V
Power 8 W Max
CW Signal Generator (Option 003)FrequencyFrequency range 25 MHz to 6 GHzFrequency reference <±1 ppm maximumFrequency resolution 10 kHz
Output PowerRange 5 MHz to 5.5 GHz, –60 to 0 dBm
>5.5 to 6 GHz, –60 to –5 dBm Step 1 dBAccuracy ±1.5 dB (20 to 30 °C)
GPS Receiver and Antenna (Option 010) GPS Indicator
Latitude, longitude, altitude
High-Frequency AccuracySpectrum, interference, and signal analyzerGPS lock ±25 ppbHold over (for 3 days) ±50 ppb (0 to 50°C) 15 minutes after
satellite lockedConnector SMA, female
Interference Analyzer (Option 011)MeasurementsSpectrum analyzer Sound indicator, AM/FM audio demodulation,
interference ID, spectrum recorderSpectrogram Collects up to 72 hours of dataRSSI Collects up to 72 hours of dataInterference finderSpectrum replayer
Channel Scanner (Option 012)Frequency Range
1 MHz to 8 GHz
Measurement Range–110 to +25 dBm
MeasurementsChannel scanner 1 to 20 channelsFrequency scanner 1 to 20 frequenciesCustom scanner 1 to 20 channels or frequencies
5
JD785A CELLADVISOR BASE STATION ANALYZER
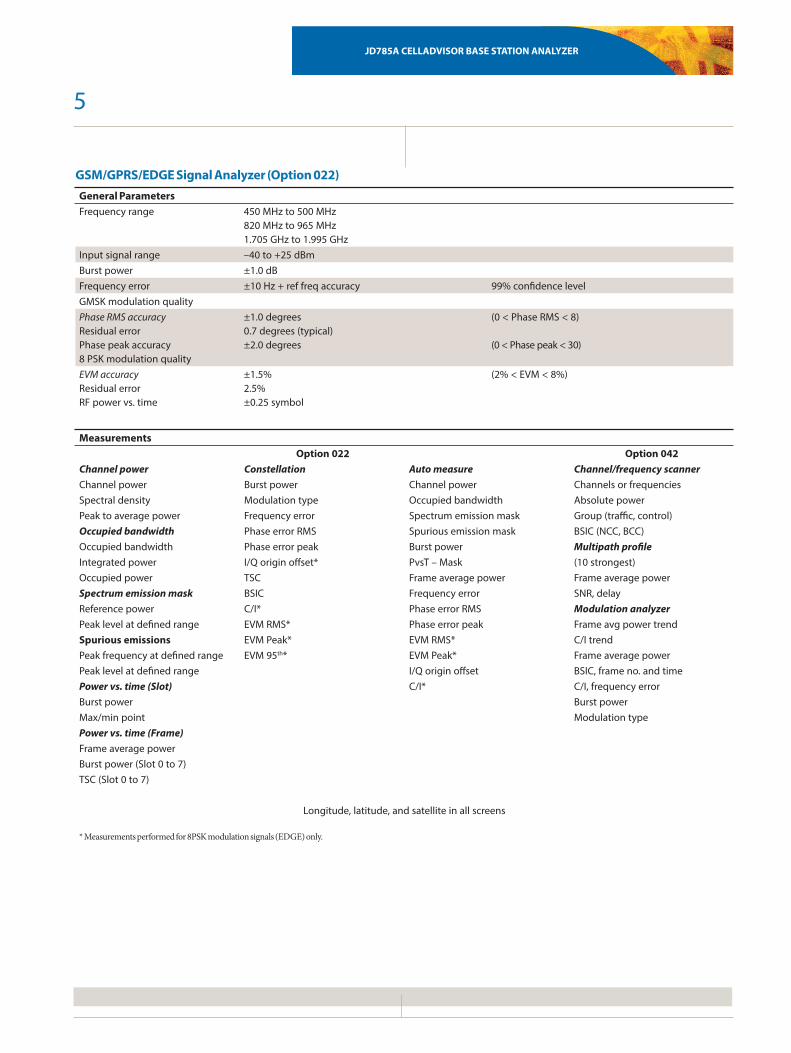
GSM/GPRS/EDGE Signal Analyzer (Option 022)General ParametersFrequency range 450 MHz to 500 MHz
820 MHz to 965 MHz1.705 GHz to 1.995 GHz
Input signal range –40 to +25 dBmBurst power ±1.0 dBFrequency error ±10 Hz + ref freq accuracy 99% confidence levelGMSK modulation qualityPhase RMS accuracy Residual error Phase peak accuracy 8 PSK modulation quality
±1.0 degrees 0.7 degrees (typical) ±2.0 degrees
(0 < Phase RMS < 8) (0 < Phase peak < 30)
EVM accuracy Residual error RF power vs. time
±1.5% 2.5% ±0.25 symbol
(2% < EVM < 8%)
MeasurementsOption 022 Option 042
Channel power Constellation Auto measure Channel/frequency scannerChannel power Burst power Channel power Channels or frequenciesSpectral density Modulation type Occupied bandwidth Absolute powerPeak to average power Frequency error Spectrum emission mask Group (traffic, control)Occupied bandwidth Phase error RMS Spurious emission mask BSIC (NCC, BCC)Occupied bandwidth Phase error peak Burst power Multipath profileIntegrated power I/Q origin offset* PvsT – Mask (10 strongest)Occupied power TSC Frame average power Frame average powerSpectrum emission mask BSIC Frequency error SNR, delayReference power C/I* Phase error RMS Modulation analyzerPeak level at defined range EVM RMS* Phase error peak Frame avg power trendSpurious emissions EVM Peak* EVM RMS* C/I trendPeak frequency at defined range EVM 95th* EVM Peak* Frame average powerPeak level at defined range I/Q origin offset BSIC, frame no. and timePower vs. time (Slot) C/I* C/I, frequency errorBurst power Burst powerMax/min point Modulation typePower vs. time (Frame)Frame average powerBurst power (Slot 0 to 7)TSC (Slot 0 to 7)
Longitude, latitude, and satellite in all screens
* Measurements performed for 8PSK modulation signals (eDge) only.

6
JD785A CELLADVISOR BASE STATION ANALYZER
WCDMA/HSPA+ Signal Analyzer (Option 023)General ParametersFrequency range Band 1 to 14, 19 to 22, 25, 26Input signal range –40 to +25 dBmRF channel power accuracy ±1.0 dB, ±0.7 dB (typical)Occupied bandwidth accuracy ±100 kHzAdjacent channel leakage ratio (ACLR)
<–56 dB, ±0.7 dB at 5 MHz offset <–58 dB, ±0.8 dB at 10 MHz offset
WCDMA modulation QPSKHSPA+ modulations QPSK, 16 QAM, 64 QAMFrequency error ±10 Hz + ref freq accuracy 99% confidence levelEVM accuracy ±2.0% 2% ≤ EVM ≤ 20%Residual EVM 2.5% (typical)Code domain power ±0.5 dB relative power
±1.5 dB absolute powerCode channel power >–25 dBCode channel power >–25 dB
CPICH power accuracy ±0.8 dB (typical)
MeasurementsOption 023 Option 043
Channel power Constellation CDP table Channel scanner (up to 6)Channel power CPICH power Reference power Frequencies or channelsSpectral density Rho, EVM Code utilization Channel power, scramblePeak to average power Peak CDE Code, spreading factor code, CPICH power, Ec/IoOccupied bandwidth Frequency error Allocation (channel type) Scramble scanner (up to 6)Occupied bandwidth Time offset EVM, modulation type Channel powerIntegrated power Carrier feed-through Relative, absolute power CPICH dominanceOccupied power Scramble code Auto measure Scramble codeSpectrum emission mask Code domain power Channel power Ec/Io, CPICH power, delayReference power Abs/Rel code power Occupied bandwidth Multipath profilePeak level at defined range Individual code EVM Spectrum emission mask Channel, multipath powerACLR and its constellation ACLR Ec/Io, delayReference power Channel power Multi-ACLR Code domain powerAbs power at defined range Power bar graph Spurious emission mask Abs/Rel code powerRel power at defined range (Abs/Rel/Delta power) Frequency error Individual code EVMMulti-ACLR CPICH, P-CCPCH, S-CCPCH EVM Channel powerLowest reference power PICH, P-SCH, S-SCH Peak CDE Scramble codeHighest reference power Max, avg active power Carrier feed-through CPICH, P-CCPCH, S-CCPCH,
Abs power at defined range Max, avg inactive power CPICH absolute power PICH, P-SCH, S-SCHRel power at defined range Scramble code CPICH relative power Max, avg active powerSpurious emissions Codogram Max inactive power Max, avg inactive powerPeak frequency at defined range Code utilization Scramble code Frequency errorPeak level at defined range RCSI Power statistics CCDF Time offset, Rho
CPICH, P-CCPCH, S-CCPCH, Carrier feed-throughPICH, P-SCH, S-SCH (Composite) EVM
CPICH EVM, P-CCPCH EVMAmplifier capacityPeak amplifier capacityAverage amplifier capacityCode, peak utilizationAverage utilizationRoute mapCPICH power, Ec/Io
Longitude, latitude, and satellite in all screens
7
JD785A CELLADVISOR BASE STATION ANALYZER
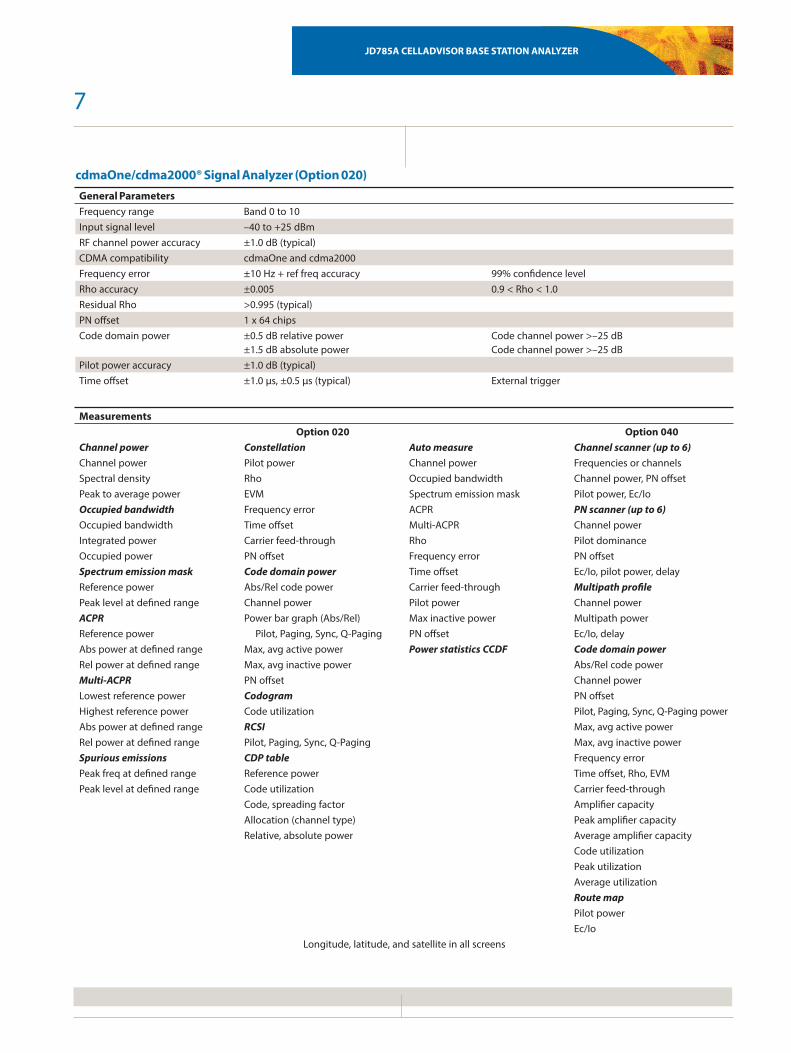
cdmaOne/cdma2000® Signal Analyzer (Option 020)General ParametersFrequency range Band 0 to 10Input signal level –40 to +25 dBmRF channel power accuracy ±1.0 dB (typical)CDMA compatibility cdmaOne and cdma2000Frequency error ±10 Hz + ref freq accuracy 99% confidence levelRho accuracy ±0.005 0.9 < Rho < 1.0Residual Rho >0.995 (typical)PN offset 1 x 64 chipsCode domain power ±0.5 dB relative power
±1.5 dB absolute powerCode channel power >–25 dBCode channel power >–25 dB
Pilot power accuracy ±1.0 dB (typical)Time offset ±1.0 μs, ±0.5 μs (typical) External trigger
MeasurementsOption 020 Option 040
Channel power Constellation Auto measure Channel scanner (up to 6)Channel power Pilot power Channel power Frequencies or channelsSpectral density Rho Occupied bandwidth Channel power, PN offsetPeak to average power EVM Spectrum emission mask Pilot power, Ec/IoOccupied bandwidth Frequency error ACPR PN scanner (up to 6)Occupied bandwidth Time offset Multi-ACPR Channel powerIntegrated power Carrier feed-through Rho Pilot dominanceOccupied power PN offset Frequency error PN offsetSpectrum emission mask Code domain power Time offset Ec/Io, pilot power, delayReference power Abs/Rel code power Carrier feed-through Multipath profilePeak level at defined range Channel power Pilot power Channel powerACPR Power bar graph (Abs/Rel) Max inactive power Multipath powerReference power Pilot, Paging, Sync, Q-Paging PN offset Ec/Io, delayAbs power at defined range Max, avg active power Power statistics CCDF Code domain powerRel power at defined range Max, avg inactive power Abs/Rel code powerMulti-ACPR PN offset Channel powerLowest reference power Codogram PN offsetHighest reference power Code utilization Pilot, Paging, Sync, Q-Paging powerAbs power at defined range RCSI Max, avg active powerRel power at defined range Pilot, Paging, Sync, Q-Paging Max, avg inactive powerSpurious emissions CDP table Frequency errorPeak freq at defined range Reference power Time offset, Rho, EVMPeak level at defined range Code utilization Carrier feed-through
Code, spreading factor Amplifier capacity Allocation (channel type) Peak amplifier capacityRelative, absolute power Average amplifier capacity
Code utilizationPeak utilizationAverage utilizationRoute mapPilot powerEc/Io
Longitude, latitude, and satellite in all screens

8
JD785A CELLADVISOR BASE STATION ANALYZER
EV-DO Signal Analyzer (Option 021)General ParametersFrequency range Band 0 to 10Input signal level –40 to +25 dBmRF channel power accuracy ±1.0 dB (typical)EV-DO compatibility Rev 0, Rev A and Rev BFrequency error ±10 Hz + ref freq accuracy 99% confidence levelRho accuracy ±0.005 0.9 < Rho < 1.0Residual Rho >0.995 (typical)PN offset 1 x 64 chipsCode domain power ±0.5 dB relative power
±1.5 dB absolute powerCode channel power >–25 dBCode channel power >–25 dB
Pilot power accuracy ±1.0 dB (typical)Time offset ±1.0 μs, ±0.5 μs (typical) External trigger
MeasurementsOption 021 Option 041
Channel power Constellation MAC codogram Channel scanner (up to 6)Channel power (Composite 64/128) Code utilization Frequencies or channelsSpectral density Channel power RCSI PN offsetPeak to average power Rho, EVM, Peak CDE Slot, pilot, MAC, data Pilot, MAC, data powerOccupied bandwidth Frequency error MAC CDP table PN scanner (up to 6)Occupied bandwidth Time offset Reference power Channel powerIntegrated power Carrier feed-through Code utilization Pilot dominanceOccupied power PN offset Code, spreading factor PN offsetSpectrum emission mask Pilot, MAC, data power Allocation (channel type) Ec/Io, pilot power, delayReference power Pilot, MAC, data EVM Relative, absolute power Multipath profilePeak level at defined range Constellation Auto measure Channel powerACPR (Pilot, MAC 64/128, and data) Channel power Multipath powerReference power Channel power Occupied bandwidth Ec/Io, delayAbs power at defined range Rho, EVM, peak CDE Spectrum emission mask Code domain powerRel power at defined range Frequency error ACPR Slot average powerMulti-ACPR Time offset Multi-ACPR PN offsetLowest reference power Carrier feed-through Pilot, MAC, data power Pilot, MAC, data powerHighest reference power PN offset On/off ratio Pilot, MAC, data RhoAbs power at defined range Modulation type* PvsT mask (idle slot) or (Composite) EVMRel power at defined range Code Domain Power PvsT mask (active slot) Frequency errorSpurious emissions (Pilot and MAC 64/128) Frequency error Time offsetPeak frequency at defined range Pilot/MAC channel power Time offset Carrier feed-throughPeak level at defined range Slot average power Carrier feed-through Max active I/Q powerPower vs. Time Max active I/Q power Pilot, MAC, data Rho Avg active I/Q power(Idle and Active Slot) Avg active I/Q power Max inactive I/Q power Code utilizationSlot average power Max inactive I/Q power PN offset Peak utilizationOn/off ratio Avg inactive I/Q power Power statistics CCDF Average utilization Idle activity PN offset Route Map Pilot, MAC, data power Code Domain Power (Data) Pilot power
Data channel power Ec/Io Slot average powerMax, avg active powerMax, avg inactive powerPN offset
Longitude, latitude, and satellite in all screens*Measurement is performed in Data Constellation only.
9
JD785A CELLADVISOR BASE STATION ANALYZER
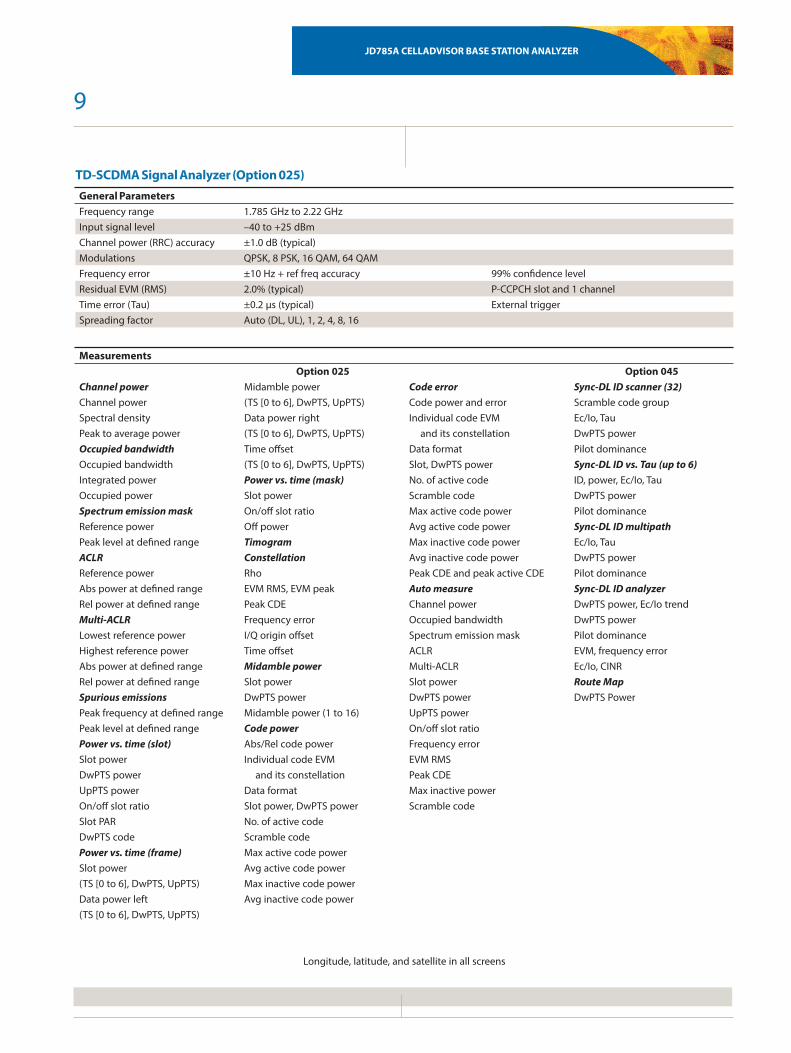
TD-SCDMA Signal Analyzer (Option 025)General ParametersFrequency range 1.785 GHz to 2.22 GHzInput signal level –40 to +25 dBmChannel power (RRC) accuracy ±1.0 dB (typical)Modulations QPSK, 8 PSK, 16 QAM, 64 QAMFrequency error ±10 Hz + ref freq accuracy 99% confidence levelResidual EVM (RMS) 2.0% (typical) P-CCPCH slot and 1 channelTime error (Tau) ±0.2 μs (typical) External triggerSpreading factor Auto (DL, UL), 1, 2, 4, 8, 16
MeasurementsOption 025 Option 045
Channel power Midamble power Code error Sync-DL ID scanner (32)Channel power (TS [0 to 6], DwPTS, UpPTS) Code power and error Scramble code groupSpectral density Data power right Individual code EVM Ec/Io, TauPeak to average power (TS [0 to 6], DwPTS, UpPTS) and its constellation DwPTS powerOccupied bandwidth Time offset Data format Pilot dominanceOccupied bandwidth (TS [0 to 6], DwPTS, UpPTS) Slot, DwPTS power Sync-DL ID vs. Tau (up to 6)Integrated power Power vs. time (mask) No. of active code ID, power, Ec/Io, TauOccupied power Slot power Scramble code DwPTS powerSpectrum emission mask On/off slot ratio Max active code power Pilot dominanceReference power Off power Avg active code power Sync-DL ID multipathPeak level at defined range Timogram Max inactive code power Ec/Io, TauACLR Constellation Avg inactive code power DwPTS powerReference power Rho Peak CDE and peak active CDE Pilot dominanceAbs power at defined range EVM RMS, EVM peak Auto measure Sync-DL ID analyzerRel power at defined range Peak CDE Channel power DwPTS power, Ec/Io trendMulti-ACLR Frequency error Occupied bandwidth DwPTS powerLowest reference power I/Q origin offset Spectrum emission mask Pilot dominanceHighest reference power Time offset ACLR EVM, frequency errorAbs power at defined range Midamble power Multi-ACLR Ec/Io, CINRRel power at defined range Slot power Slot power Route MapSpurious emissions DwPTS power DwPTS power DwPTS PowerPeak frequency at defined range Midamble power (1 to 16) UpPTS powerPeak level at defined range Code power On/off slot ratioPower vs. time (slot) Abs/Rel code power Frequency errorSlot power Individual code EVM EVM RMSDwPTS power and its constellation Peak CDEUpPTS power Data format Max inactive powerOn/off slot ratio Slot power, DwPTS power Scramble codeSlot PAR No. of active codeDwPTS code Scramble codePower vs. time (frame) Max active code powerSlot power Avg active code power(TS [0 to 6], DwPTS, UpPTS) Max inactive code powerData power left Avg inactive code power(TS [0 to 6], DwPTS, UpPTS)
Longitude, latitude, and satellite in all screens
10
JD785A CELLADVISOR BASE STATION ANALYZER
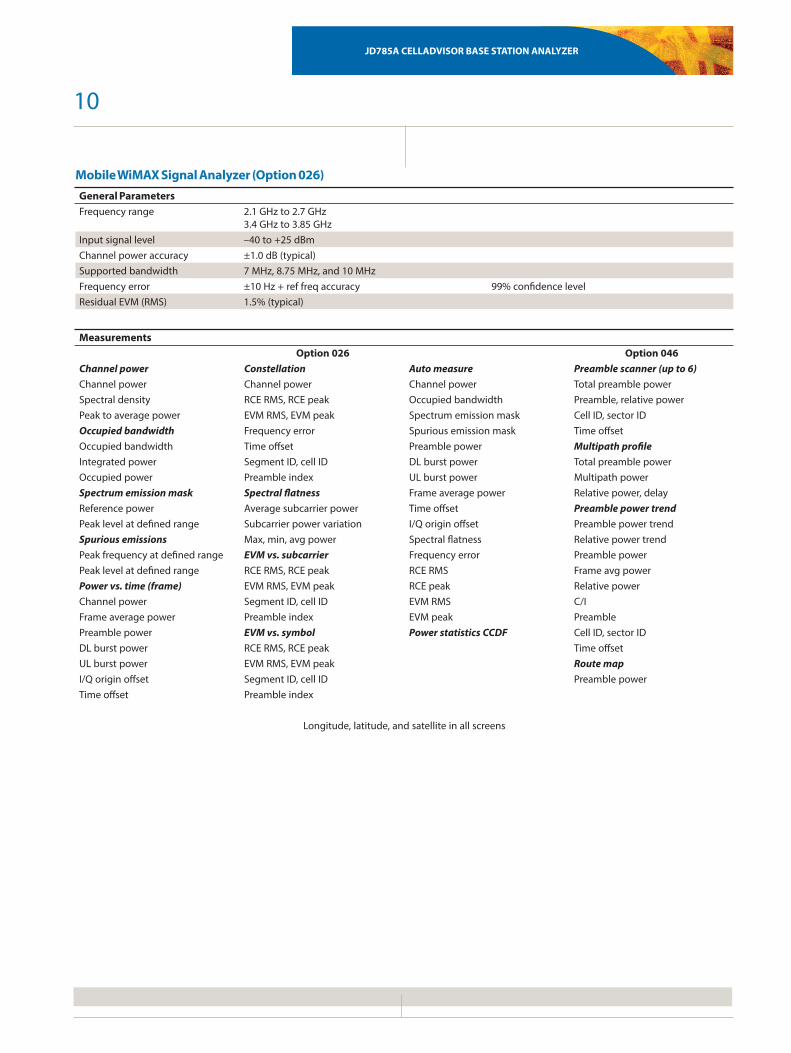
Mobile WiMAX Signal Analyzer (Option 026)General ParametersFrequency range 2.1 GHz to 2.7 GHz
3.4 GHz to 3.85 GHzInput signal level –40 to +25 dBmChannel power accuracy ±1.0 dB (typical)Supported bandwidth 7 MHz, 8.75 MHz, and 10 MHzFrequency error ±10 Hz + ref freq accuracy 99% confidence levelResidual EVM (RMS) 1.5% (typical)
MeasurementsOption 026 Option 046
Channel power Constellation Auto measure Preamble scanner (up to 6)Channel power Channel power Channel power Total preamble powerSpectral density RCE RMS, RCE peak Occupied bandwidth Preamble, relative powerPeak to average power EVM RMS, EVM peak Spectrum emission mask Cell ID, sector IDOccupied bandwidth Frequency error Spurious emission mask Time offsetOccupied bandwidth Time offset Preamble power Multipath profileIntegrated power Segment ID, cell ID DL burst power Total preamble powerOccupied power Preamble index UL burst power Multipath powerSpectrum emission mask Spectral flatness Frame average power Relative power, delayReference power Average subcarrier power Time offset Preamble power trendPeak level at defined range Subcarrier power variation I/Q origin offset Preamble power trendSpurious emissions Max, min, avg power Spectral flatness Relative power trendPeak frequency at defined range EVM vs. subcarrier Frequency error Preamble powerPeak level at defined range RCE RMS, RCE peak RCE RMS Frame avg powerPower vs. time (frame) EVM RMS, EVM peak RCE peak Relative powerChannel power Segment ID, cell ID EVM RMS C/IFrame average power Preamble index EVM peak PreamblePreamble power EVM vs. symbol Power statistics CCDF Cell ID, sector IDDL burst power RCE RMS, RCE peak Time offsetUL burst power EVM RMS, EVM peak Route mapI/Q origin offset Segment ID, cell ID Preamble powerTime offset Preamble index
Longitude, latitude, and satellite in all screens
11
JD785A CELLADVISOR BASE STATION ANALYZER
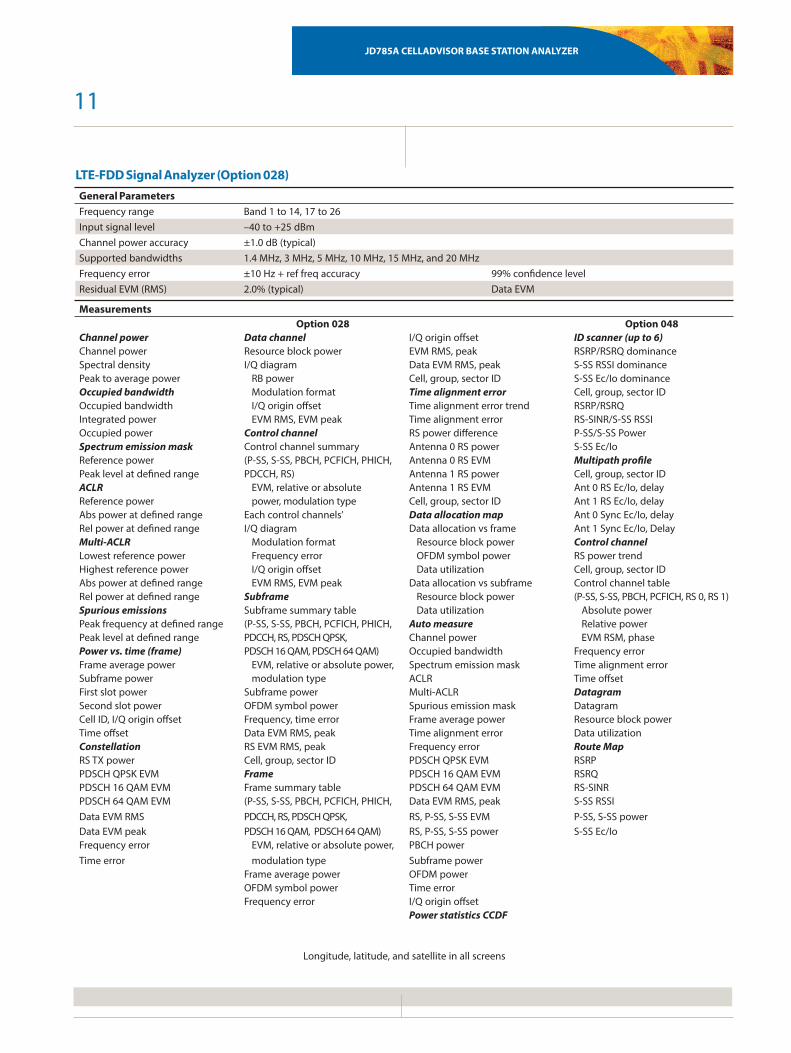
LTE-FDD Signal Analyzer (Option 028)General ParametersFrequency range Band 1 to 14, 17 to 26Input signal level –40 to +25 dBmChannel power accuracy ±1.0 dB (typical)Supported bandwidths 1.4 MHz, 3 MHz, 5 MHz, 10 MHz, 15 MHz, and 20 MHzFrequency error ±10 Hz + ref freq accuracy 99% confidence levelResidual EVM (RMS) 2.0% (typical) Data EVM
MeasurementsOption 028 Option 048
Channel power Data channel I/Q origin offset ID scanner (up to 6)Channel power Resource block power EVM RMS, peak RSRP/RSRQ dominanceSpectral density I/Q diagram Data EVM RMS, peak S-SS RSSI dominancePeak to average power RB power Cell, group, sector ID S-SS Ec/Io dominanceOccupied bandwidth Modulation format Time alignment error Cell, group, sector IDOccupied bandwidth I/Q origin offset Time alignment error trend RSRP/RSRQIntegrated power EVM RMS, EVM peak Time alignment error RS-SINR/S-SS RSSIOccupied power Control channel RS power difference P-SS/S-SS PowerSpectrum emission mask Control channel summary Antenna 0 RS power S-SS Ec/IoReference power (P-SS, S-SS, PBCH, PCFICH, PHICH, Antenna 0 RS EVM Multipath profilePeak level at defined range PDCCH, RS) Antenna 1 RS power Cell, group, sector IDACLR EVM, relative or absolute Antenna 1 RS EVM Ant 0 RS Ec/Io, delayReference power power, modulation type Cell, group, sector ID Ant 1 RS Ec/Io, delayAbs power at defined range Each control channels’ Data allocation map Ant 0 Sync Ec/Io, delayRel power at defined range I/Q diagram Data allocation vs frame Ant 1 Sync Ec/Io, DelayMulti-ACLR Modulation format Resource block power Control channelLowest reference power Frequency error OFDM symbol power RS power trendHighest reference power I/Q origin offset Data utilization Cell, group, sector IDAbs power at defined range EVM RMS, EVM peak Data allocation vs subframe Control channel tableRel power at defined range Subframe Resource block power (P-SS, S-SS, PBCH, PCFICH, RS 0, RS 1)Spurious emissions Subframe summary table Data utilization Absolute powerPeak frequency at defined range (P-SS, S-SS, PBCH, PCFICH, PHICH, Auto measure Relative powerPeak level at defined range PDCCH, RS, PDSCH QPSK, Channel power EVM RSM, phasePower vs. time (frame) PDSCH 16 QAM, PDSCH 64 QAM) Occupied bandwidth Frequency errorFrame average power EVM, relative or absolute power, Spectrum emission mask Time alignment errorSubframe power modulation type ACLR Time offsetFirst slot power Subframe power Multi-ACLR DatagramSecond slot power OFDM symbol power Spurious emission mask DatagramCell ID, I/Q origin offset Frequency, time error Frame average power Resource block powerTime offset Data EVM RMS, peak Time alignment error Data utilizationConstellation RS EVM RMS, peak Frequency error Route MapRS TX power Cell, group, sector ID PDSCH QPSK EVM RSRPPDSCH QPSK EVM Frame PDSCH 16 QAM EVM RSRQPDSCH 16 QAM EVM Frame summary table PDSCH 64 QAM EVM RS-SINRPDSCH 64 QAM EVM (P-SS, S-SS, PBCH, PCFICH, PHICH, Data EVM RMS, peak S-SS RSSIData EVM RMS PDCCH, RS, PDSCH QPSK, RS, P-SS, S-SS EVM P-SS, S-SS powerData EVM peak PDSCH 16 QAM, PDSCH 64 QAM) RS, P-SS, S-SS power S-SS Ec/IoFrequency error EVM, relative or absolute power, PBCH powerTime error modulation type Subframe power
Frame average power OFDM powerOFDM symbol power Time errorFrequency error I/Q origin offset
Power statistics CCDF
Longitude, latitude, and satellite in all screens
12
JD785A CELLADVISOR BASE STATION ANALYZER
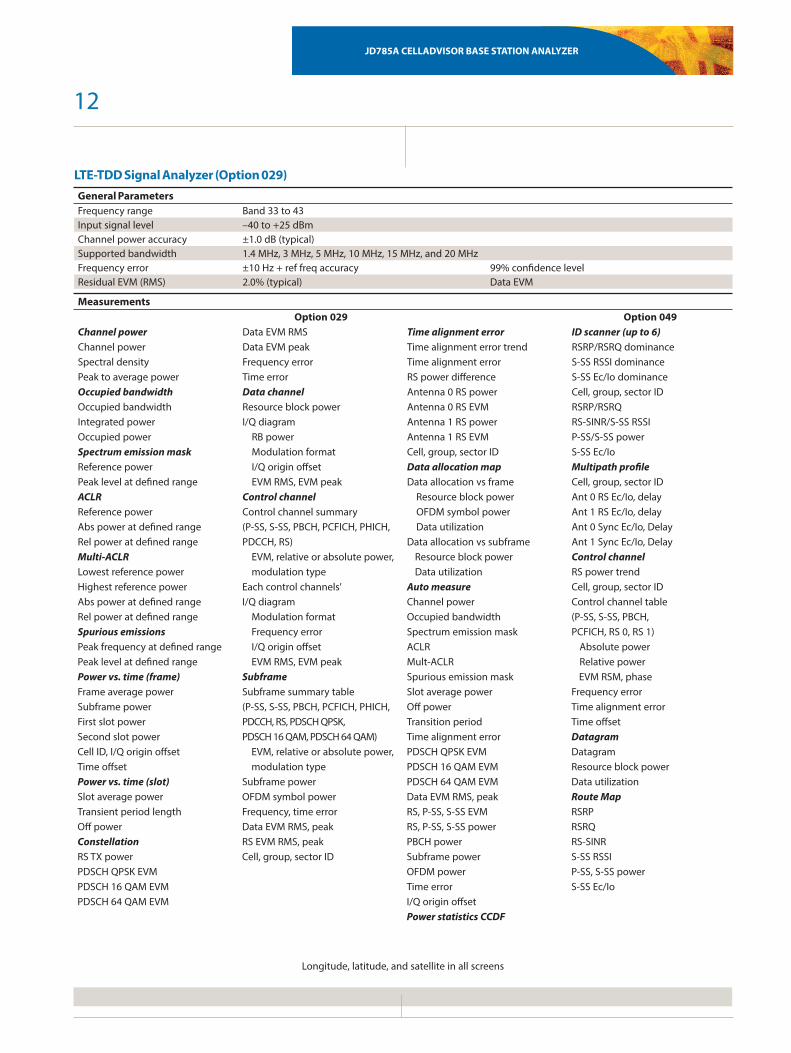
LTE-TDD Signal Analyzer (Option 029)General ParametersFrequency range Band 33 to 43Input signal level –40 to +25 dBmChannel power accuracy ±1.0 dB (typical)Supported bandwidth 1.4 MHz, 3 MHz, 5 MHz, 10 MHz, 15 MHz, and 20 MHzFrequency error ±10 Hz + ref freq accuracy 99% confidence levelResidual EVM (RMS) 2.0% (typical) Data EVM
MeasurementsOption 029 Option 049
Channel power Data EVM RMS Time alignment error ID scanner (up to 6)Channel power Data EVM peak Time alignment error trend RSRP/RSRQ dominanceSpectral density Frequency error Time alignment error S-SS RSSI dominancePeak to average power Time error RS power difference S-SS Ec/Io dominanceOccupied bandwidth Data channel Antenna 0 RS power Cell, group, sector IDOccupied bandwidth Resource block power Antenna 0 RS EVM RSRP/RSRQIntegrated power I/Q diagram Antenna 1 RS power RS-SINR/S-SS RSSIOccupied power RB power Antenna 1 RS EVM P-SS/S-SS powerSpectrum emission mask Modulation format Cell, group, sector ID S-SS Ec/IoReference power I/Q origin offset Data allocation map Multipath profilePeak level at defined range EVM RMS, EVM peak Data allocation vs frame Cell, group, sector IDACLR Control channel Resource block power Ant 0 RS Ec/Io, delayReference power Control channel summary OFDM symbol power Ant 1 RS Ec/Io, delayAbs power at defined range (P-SS, S-SS, PBCH, PCFICH, PHICH, Data utilization Ant 0 Sync Ec/Io, DelayRel power at defined range PDCCH, RS) Data allocation vs subframe Ant 1 Sync Ec/Io, DelayMulti-ACLR EVM, relative or absolute power, Resource block power Control channelLowest reference power modulation type Data utilization RS power trendHighest reference power Each control channels’ Auto measure Cell, group, sector IDAbs power at defined range I/Q diagram Channel power Control channel tableRel power at defined range Modulation format Occupied bandwidth (P-SS, S-SS, PBCH,Spurious emissions Frequency error Spectrum emission mask PCFICH, RS 0, RS 1)Peak frequency at defined range I/Q origin offset ACLR Absolute powerPeak level at defined range EVM RMS, EVM peak Mult-ACLR Relative powerPower vs. time (frame) Subframe Spurious emission mask EVM RSM, phaseFrame average power Subframe summary table Slot average power Frequency errorSubframe power (P-SS, S-SS, PBCH, PCFICH, PHICH, Off power Time alignment errorFirst slot power PDCCH, RS, PDSCH QPSK, Transition period Time offsetSecond slot power PDSCH 16 QAM, PDSCH 64 QAM) Time alignment error DatagramCell ID, I/Q origin offset EVM, relative or absolute power, PDSCH QPSK EVM DatagramTime offset modulation type PDSCH 16 QAM EVM Resource block powerPower vs. time (slot) Subframe power PDSCH 64 QAM EVM Data utilizationSlot average power OFDM symbol power Data EVM RMS, peak Route MapTransient period length Frequency, time error RS, P-SS, S-SS EVM RSRPOff power Data EVM RMS, peak RS, P-SS, S-SS power RSRQConstellation RS EVM RMS, peak PBCH power RS-SINRRS TX power Cell, group, sector ID Subframe power S-SS RSSIPDSCH QPSK EVM OFDM power P-SS, S-SS powerPDSCH 16 QAM EVM Time error S-SS Ec/IoPDSCH 64 QAM EVM I/Q origin offset
Power statistics CCDF
Longitude, latitude, and satellite in all screens
13
JD785A CELLADVISOR BASE STATION ANALYZER
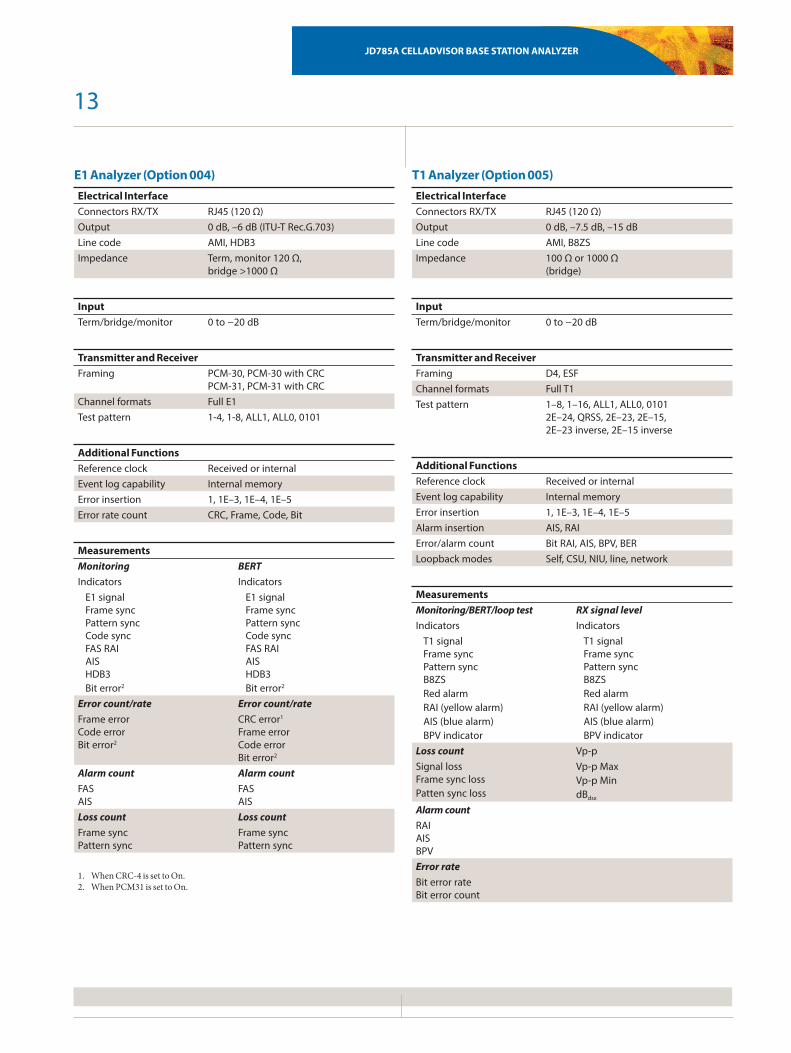
E1 Analyzer (Option 004)Electrical Interface Connectors RX/TX RJ45 (120 Ω)Output 0 dB, –6 dB (ITU-T Rec.G.703)Line code AMI, HDB3Impedance Term, monitor 120 Ω,
bridge >1000 Ω
InputTerm/bridge/monitor 0 to −20 dB
Transmitter and ReceiverFraming PCM-30, PCM-30 with CRC
PCM-31, PCM-31 with CRCChannel formats Full E1Test pattern 1-4, 1-8, ALL1, ALL0, 0101
Additional FunctionsReference clock Received or internalEvent log capability Internal memory Error insertion 1, 1E–3, 1E–4, 1E–5Error rate count CRC, Frame, Code, Bit
Measurements Monitoring BERTIndicators Indicators
E1 signalFrame syncPattern syncCode syncFAS RAIAISHDB3Bit error2
E1 signalFrame syncPattern syncCode syncFAS RAIAISHDB3Bit error2
Error count/rate Error count/rateFrame errorCode errorBit error2
CRC error1
Frame errorCode errorBit error2
Alarm count Alarm countFASAIS
FASAIS
Loss count Loss countFrame syncPattern sync
Frame syncPattern sync
1. When CRC-4 is set to On.2. When PCM31 is set to On.
T1 Analyzer (Option 005)Electrical Interface Connectors RX/TX RJ45 (120 Ω)Output 0 dB, –7.5 dB, –15 dBLine code AMI, B8ZSImpedance 100 Ω or 1000 Ω
(bridge)
InputTerm/bridge/monitor 0 to −20 dB
Transmitter and ReceiverFraming D4, ESFChannel formats Full T1Test pattern 1–8, 1–16, ALL1, ALL0, 0101
2E–24, QRSS, 2E–23, 2E–15,2E–23 inverse, 2E–15 inverse
Additional FunctionsReference clock Received or internalEvent log capability Internal memory Error insertion 1, 1E–3, 1E–4, 1E–5Alarm insertion AIS, RAIError/alarm count Bit RAI, AIS, BPV, BERLoopback modes Self, CSU, NIU, line, network
Measurements Monitoring/BERT/loop test RX signal levelIndicators Indicators
T1 signalFrame syncPattern syncB8ZSRed alarmRAI (yellow alarm)AIS (blue alarm)BPV indicator
T1 signalFrame syncPattern syncB8ZSRed alarmRAI (yellow alarm)AIS (blue alarm)BPV indicator
Loss count Vp-pSignal lossFrame sync lossPatten sync loss
Vp-p MaxVp-p Min dBdsx
Alarm countRAI AIS BPVError rateBit error rate Bit error count

14
JD785A CELLADVISOR BASE STATION ANALYZER
General Information
Inputs and OutputsRF in Spectrum analyzerConnector Impedance Damage level
Type-N, female 50 Ω (nominal) >+33 dBm, ±50 VDC (nominal), 3 min
Reflection/RF out Cable and antenna analyzerConnector Impedance Damage level
Type-N, female 50 Ω (nominal) >+40 dBm, ±50 VDC (nominal), 3 min
RF in Cable and antenna analyzerConnector Impedance Maximum level
Type-N, female 50 Ω (nominal) >+25 dBm, ±50 VDC (nominal)
External trigger, GPSConnector Impedance
SMA, female 50 Ω (nominal)
External refConnector Impedance Input frequency Input range
SMA, female 50 Ω (nominal) 10 MHz, 13 MHz, 15 MHz –5 to +5 dBm
USBUSB host1 USB client2
Type A, 1 port Type B, 1 port
LAN RJ45, 10/100Base-TE1/T1 RJ45Audio jack 3.5 mm headphone jackExternal power 5.5 mm barrel connectorSpeaker Built-in speaker
DisplayType Resistive touch screen Size 8 inch, LED backlight, transflective LCD
with anti-glare coatingResolution 800 x 600
PowerExternal DC input 12 to 19 VDCPower consumption 37 W 49 W maximum
(when charging battery)
BatteryType 10.8 V, 7800 mA/hr (Lithium ion)Operating time >3 hours (typical)Charge time 2.5 hours (80%), 5 hours (100%)Charging temperature 0° to 45°C (32° to 104°F) ≤85% RHDischarging temperature –20° to 55°C (4° to 131°F) ≤85% RHStorage temperature3 0° to 25°C (32° to 77°F)
≤85% RH (non-condensing)
Data StorageInternal4 Maximum 100 MBExternal5 Limited by size of USB flash drive
EnvironmentalOperating temperatureAC Power 0° to 40°C (32° to 104°F) with no deratingBattery 0° to 40°C (32° to 104°F) @charging
–10° to 55°C (14° to 131°F) @dischargingMaximum humidity 85% RH (non-condensing)Shock and vibration MIL-PRF-28800F Class 2Storage temperature6 –55° to 71°C (–67° to 160°F)
EMCIEC/EN 61326-1:2006 (complies with European EMC)CISPR11:2009 +A1:2010
ESDIEC/EN 61000-4-2
Size and Weight (standard configuration)Weight (with battery) <4.3 kg (9.5 lb) Size (W x H x D) 295 x 195 x 82 mm
(11.6 x 7.7 x 3.2 in)
Warranty2 years
Calibration Cycle1 year
1. Connects flash drive and power sensor.2. Connects to PC for data transfer.3. 20 to 85% RH, store battery pack in low-humidity environment. extended exposure to temperature above 45°C could significantly degrade battery
performance and life.4. Up to 3800 traces.5. Supports USB 2.0 compatible memory devices.6. With the battery pack removed.

15
Ordering Information
JD785A CELLADVISOR BASE STATION ANALYZER
Standard AccessoriesG710550326 AC/DC power adapter7
G710550335 Cross LAN cable (1.5 m)7
GC73050515 USB A to B cable (1.8 m)7
GC72450518 >1 GB USB memory7
G710550325 Rechargeable lithium ion battery7
G710550323 Automotive cigarette lighter 12 VDC adapter7
G710550316 Stylus pen7
JD780A361 JD780A Series user’s manual and applicationsoftware — CD
1. Requires calibration kit.2. Requires dual-port calibration kit.3. Requires test cable.4. Highly recommend adding JD785A010.5. Highly recommend adding g70005035x and/or g70005036x.6. Requires MP-60 or MP-80.7. Standard accessories can be purchased separately.
Optional Calibration KitsJD78050509 Y-Calibration Kit, Type-N(m), DC to 6 GHz, 50 ΩJD78050507 Dual-port Type-N calibration kit, 50 Ω
• Y-calibration kit, Type-N(m), DC to 6 GHz, 50 Ω• Two adapters Type-N(f) to Type-N(f), DC to 6 GHz, 50 Ω• Two 1 m RF test cables, Type-N(m) to Type-N(m),
DC to 18 GHz, 50 Ω
Optional RF CablesG710050530 1.0 m (3.28 ft) RF cable, DC to 18 GHz, Type-N(m) to
Type-N(m), 50 ΩG710050531 1.5 m (4.92 ft) RF cable, DC to 18 GHz, Type-N(m) to
Type-N(f), 50 ΩG710050532 3.0 m (9.84 ft) RF cable, DC to 18 GHz, Type-N(m) to
Type-N(f ), 50 ΩG710050533 1.5 m (4.92 ft) RF cable, DC to 18 GHz, Type-N(m) to
SMA(m), 50 ΩG710050534 1.5 m (4.92 ft) RF cable, DC to 18 GHz, Type-N(m) to
QMA(m), 50 ΩG710050535 1.5 m (4.92 ft) RF cable, DC to 18 GHz, Type-N(m) to
SMB(m), 50 Ω
StandardJD785A 9 kHz to 8 GHz spectrum analyzer
5 MHz to 6 GHz cable and antenna analyzer1 10 MHz to 8 GHz RF power meter (internal mode)
OptionsNOTE: Upgrade options for the JD785A use the designation JD785AU before the respective last three-digit option number.JD785A001 2-Port Transmission Measurement2
JD785A002 Bias-Tee (requires option 01)JD785A003 CW Signal GeneratorJD785A004 E1 Analyzer3
JD785A005 T1 Analyzer3
JD785A010 GPS Receiver and AntennaJD785A011 Interference Analyzer 4,5
JD785A012 Channel ScannerJD785A013 Optical Power Meter6
JD785A020 cdmaOne/cdma2000 Signal Analyzer
JD785A021 EV-DO Signal Analyzer (requires option 20)JD785A022 GSM/GPRS/EDGE Signal AnalyzerJD785A023 WCDMA/HSPA+ Signal AnalyzerJD785A025 TD-SCDMA Signal AnalyzerJD785A026 Mobile WiMAX Signal AnalyzerJD785A028 LTE-FDD Signal AnalyzerJD785A029 LTE-TDD Signal AnalyzerJD785A040 cdmaOne/cdma2000 OTA
Analyzer5
(requires option 10)
JD785A041 EV-DO OTA Analyzer5 (requires option 10)JD785A042 GSM/GPRS/EDGE OTA Analyzer5 (requires option 10)JD785A043 WCDMA/HSPA+ OTA Analyzer5 (requires option 10)
JD785A045 TD-SCDMA OTA Analyzer5 (requires option 10)JD785A046 Mobile WiMAX OTA Analyzer5 (requires option 10)JD785A048 LTE-FDD OTA Analyzer5 (requires option 10)JD785A049 LTE-TDD OTA Analyzer5 (requires option 10)

Product specifications and descriptions in this document subject to change without notice. © 2013 JDS Uniphase Corporation 30173443 001 0613 JD785ABSA.DS.CPO.TM.AE June 2013
Ordering Information (cont'd)
JD785A CELLADVISOR BASE STATION ANALYZER
Optional Omni AntennasG700050351 RF omni antenna Type-N(m), 400 MHz to 450 MHzG700050352 RF omni antenna Type-N(m), 450 MHz to 500 MHzG700050353 RF omni antenna Type-N(m), 806 MHz to 896 MHzG700050354 RF omni antenna Type-N(m), 870 MHz to 960 MHzG700050355 RF omni antenna Type-N(m), 1.71 GHz to 2.17 GHzG700050356 RF omni antenna Type-N(m), 720 MHz to 800 MHzG700050357 RF omni antenna Type-N(m), 2.3 GHz to 2.7 GHz
Optional Yagi AntennasG700050364 RF Yagi antenna Type-N(f), 806 MHz to 896 MHz, 10.2 dBdG700050365 RF Yagi antenna Type-N(f), 866 MHz to 960 MHz, 10.2 dBdG700050363 RF Yagi antenna Type-N(f), 1.75 GHz to 2.39 GHz, 9.8 dBdG700050366 RF Yagi antenna Type-SMA(f), 700 MHz to 4 GHz, 1.85 dBd
Optional RF Power SensorsJD731B Directional Power Sensor (peak and average power)
Frequency: 300 MHz to 3.8 GHzPower: average 0.15 to 150 W, peak 4 to 400 W
JD733A Directional Power Sensor (peak and average power)Frequency: 150 MHz to 3.5 GHzPower: average/peak 0.1 to 50 W
JD732B Terminating Power Sensor (average power)Frequency: 20 MHz to 3.8 GHzPower: –30 to +20 dBm
JD734B Terminating Power Sensor (peak power)Frequency: 20 MHz to 3.8 GHzPower: –30 to +20 dBm
JD736B Terminating Power Sensor (peak and average power)Frequency: 20 MHz to 3.8 GHzPower: –30 to +20 dBm
Optional Optical Power SensorsMP-60 Miniature USB 2.0 Optical Power Sensor
Wavelength Range: 780 to 1650 nm1300, 1310, 1490, 1550 nm: –50 to +10 dBm850 nm: –45 to +10 dBm
MP-80 Miniature USB 2.0 Optical Power SensorWavelength range: 780 to 1650 nm1300, 1550 nm: –35 to +23 dBm850 nm: –30 to +23 dBm
Optional RF AdaptersG710050570 Adapter Type-N(f ) to Type-N(f ), DC to 6 GHz, 50 ΩG710050571 Adapter Type-N(m) to DIN(f ), DC to 4 GHz, 50 ΩG710050572 Adapter DIN(m) to DIN(m), DC to 4 GHz, 50 ΩG710050573 Adapter Type-N(m) to SMA(f ), DC to 18 GHz, 50 ΩG710050574 Adapter Type-N(m) to BNC(f ), DC to 1.5 GHz, 50 ΩG710050576 Adapter Type-N(m) to DIN(m), DC to 4 GHz, 50 ΩG710050577 Adapter Type-N(f ) to DIN(f ), DC to 4 GHz, 50 ΩG710050578 Adapter Type-N(f ) to DIN(m), DC to 4 GHz, 50 ΩG710050579 Adapter DIN(f ) to DIN(f ), DC to 4 GHz, 50 Ω
Optional E1/T1 Test CablesG710050317 RJ45 to Y bantam cableG710050318 RJ45 to Y BNC cableG710050319 RJ45 to 4 alligator clips
Optional MiscellaneousG710050581 Attenuator 40 dB, 100 W, DC to 4 GHz
(unidirectional)JD74050341 Soft carrying caseJD71050342 Hard carrying caseJD74050343 Backpack carrying caseG710050585 RF directional coupler, 700 MHz to 4 GHz, 30 dB,
input/output; Type-N(m) to Type-N(f ), tap off; Type-N(f )8
G710050586 RF Combiner, 700 MHz to 4 GHz, Type-N(f ) to Type-N(m)8
G710550324 External battery chargerJD780A362 JD780A series user’s manual – printed version
8. Highly recommended for LTe testing.
Test & Measurement Regional Sales
LATIN AMERICATEL: +1 954 688-5660FAX: +1 954 3454668
ASIA PACIFICTEL:+852 2892 0990FAX:+852 2892 0770
EMEATEL:+49 7121 86 2222FAX:+49 7121 86 1222
www.jdsu.com/testNORTH AMERICAToLL FrEE: 1 855 ASK-JDSU 1 855 275-5378