accessory dwelling units in portland, oregon: evaluation ... · pdf...
TRANSCRIPT

Accessory dwelling units in Portland, Oregon: evaluation and interpretation of a survey of ADU owners
Materials Management
Environmental SolutionsMaterials Management Jordan Palmeri
811 SW 6th Avenue Portland, OR 97204 Phone: (503) 229-5696 (800) 452-4011 Fax: (503) 229-6762
Contact: Jordan Palmeri
www.oregon.gov/DEQ
DEQ is a leader in restoring, maintaining and enhancing the quality of Oregon’s air, land and water.
Last Updated: 06/01/14 By: Jordan Palmeri

Alternative formats (Braille, large type) of this document can be made available. Contact DEQ’s Office of Communications & Outreach, Portland, at (503) 229-5696, or toll-free in Oregon at 1-800-452-4011, ext. 5696.

1
Accessory dwelling units in Portland, Oregon: evaluation and interpretation of a survey of ADU owners By
Martin J. Brown http://martinjohnbrown.net [email protected]
With
Jordan Palmeri Oregon Department of Environmental Quality Green Building Program [email protected] http://www.deq.state.or.us/lq/sw/wasteprevention/greenbuilding.htm

2
Summary We interpreted the results of a survey of accessory dwelling unit (ADU) owners in Portland, Oregon. By comparing survey responses to Census summaries and other data, we made an initial investigation into some common claims and questions about the effects of ADUs. This analysis finds that in Portland:
1. ADUs do provide housing. At any one time about 80% of ADUs are in use as long-term residences. The remaining 20% have alternative uses, but can be converted to housing with no further construction or permitting. Changing uses is part of the attraction for owners.
2. Most properties with ADUs (64%) are occupied by their owner, even though Portland has no requirement they do so.
3. ADUs seem to be at least as attractive to renters as apartments in multifamily buildings, and may be preferred by them.
4. ADUs are likely to have a low environmental impact compared to other dwellings. Their median area per resident is 44% lower than newly constructed single family residences, and some ADUs have a notable number of above-code green features.
5. ADUs are associated with an average of 0.93 cars per dwelling, lower than the Portland average of 1.31 for all new rentals. Of those 0.93, an average of 0.46 are parked on the street. Since ADUs are also extremely rare, ADUs have had negligible impact on parking conditions citywide. ADUs may be as effective in reducing vehicles owned per household as transit-oriented developments.
6. ADUs do serve older persons, both as places to live and assets to own, but not to a greater extent than other forms of housing. However, many Portland ADUs are owned by 55-64 year-olds, who will be 65+ in a decade. The beneficial effect of ADUs for older persons will likely be larger then.
7. ADUs support the community economically through one-time construction costs, averaging $78,760 per unit, and ongoing property taxes, estimated to average $1134/yr (using recent tax levy rates).
8. The claim that ADUs provide affordable rental housing is a complex one to evaluate. Housing affordability has been defined in many ways, and ADUs have unusual properties as rentals. 18% of Portland ADUs are occupied for free or extremely low cost. This unregulated, “volunteer” affordable housing has been created with little subsidy or intervention from the government. Meanwhile, about 80% of ADUs rent for market rates, or a slight premium, compared to apartments of similar size and location.
9. Financial gain through rental income is the most common motivation for the homeowner-developers who create ADUs, followed by housing for a family member or helper. Construction costs, design constraints and financing are the most common barriers to ADU development.
Overall, ADUs seem to differ from other housing in the individualistic ways they are created, owned, and managed by typical homeowners rather than developers and investors. In Portland, this “grassroots,” nonprofessionalized kind of development appears to be providing a variety of benefits to owners and community.

3
Contents
Summary ....................................................................................................................................................... 2
Introduction ................................................................................................................................................... 4
Important characteristics of ADUs ............................................................................................................... 5
The Portland survey and our approach to interpreting it ............................................................................... 6
Comparative and supplemental data sources ................................................................................................ 7
Downloadable data package.......................................................................................................................... 7
Notes on limitations, uncertainty and statistics ............................................................................................. 8
Topics, Results & Discussion ....................................................................................................................... 9
Are ADUs providing housing at all? ......................................................................................................... 9
Is ADU housing in demand? ................................................................................................................... 12
Do ADUs have a low environmental impact? ........................................................................................ 14
Do ADUs contribute to neighborhood parking problems? ..................................................................... 22
Do ADUs serve older persons? ............................................................................................................... 26
How much do ADUs support the community economically? ................................................................ 29
Do ADUs provide affordable housing? .................................................................................................. 34
What are the barriers to ADU development? .......................................................................................... 39
Conclusions and directions for further research.......................................................................................... 43
Sources ........................................................................................................................................................ 44
4
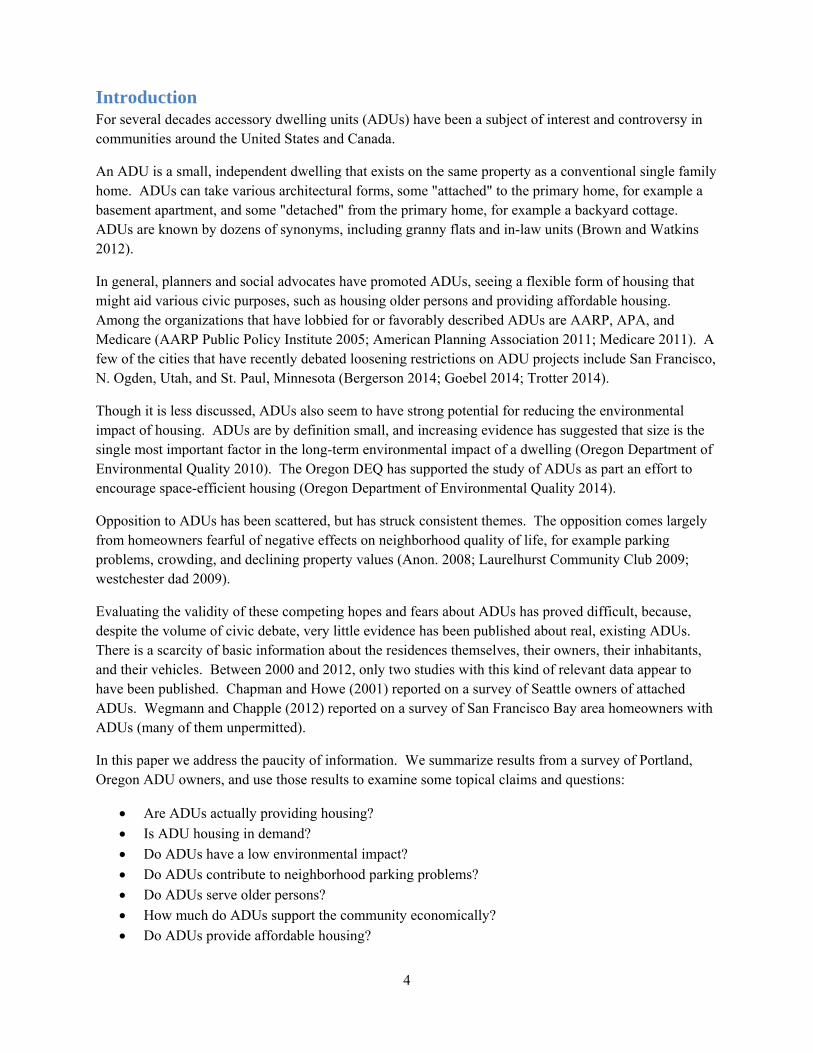
Introduction For several decades accessory dwelling units (ADUs) have been a subject of interest and controversy in communities around the United States and Canada.
An ADU is a small, independent dwelling that exists on the same property as a conventional single family home. ADUs can take various architectural forms, some "attached" to the primary home, for example a basement apartment, and some "detached" from the primary home, for example a backyard cottage. ADUs are known by dozens of synonyms, including granny flats and in-law units (Brown and Watkins 2012).
In general, planners and social advocates have promoted ADUs, seeing a flexible form of housing that might aid various civic purposes, such as housing older persons and providing affordable housing. Among the organizations that have lobbied for or favorably described ADUs are AARP, APA, and Medicare (AARP Public Policy Institute 2005; American Planning Association 2011; Medicare 2011). A few of the cities that have recently debated loosening restrictions on ADU projects include San Francisco, N. Ogden, Utah, and St. Paul, Minnesota (Bergerson 2014; Goebel 2014; Trotter 2014).
Though it is less discussed, ADUs also seem to have strong potential for reducing the environmental impact of housing. ADUs are by definition small, and increasing evidence has suggested that size is the single most important factor in the long-term environmental impact of a dwelling (Oregon Department of Environmental Quality 2010). The Oregon DEQ has supported the study of ADUs as part an effort to encourage space-efficient housing (Oregon Department of Environmental Quality 2014).
Opposition to ADUs has been scattered, but has struck consistent themes. The opposition comes largely from homeowners fearful of negative effects on neighborhood quality of life, for example parking problems, crowding, and declining property values (Anon. 2008; Laurelhurst Community Club 2009; westchester dad 2009).
Evaluating the validity of these competing hopes and fears about ADUs has proved difficult, because, despite the volume of civic debate, very little evidence has been published about real, existing ADUs. There is a scarcity of basic information about the residences themselves, their owners, their inhabitants, and their vehicles. Between 2000 and 2012, only two studies with this kind of relevant data appear to have been published. Chapman and Howe (2001) reported on a survey of Seattle owners of attached ADUs. Wegmann and Chapple (2012) reported on a survey of San Francisco Bay area homeowners with ADUs (many of them unpermitted).
In this paper we address the paucity of information. We summarize results from a survey of Portland, Oregon ADU owners, and use those results to examine some topical claims and questions:
Are ADUs actually providing housing?
Is ADU housing in demand?
Do ADUs have a low environmental impact?
Do ADUs contribute to neighborhood parking problems?
Do ADUs serve older persons?
How much do ADUs support the community economically?
Do ADUs provide affordable housing?

5
What are the barriers to ADU development?
This report is one of the first data-based investigations of issues around ADU development. As such, it cannot provide a definitive resolution to any open controversy about ADUs, but hopefully can begin an objective discussion.
Important characteristics of ADUs Before reviewing claims and controversies about ADUs, it is important to recall the characteristics which make them unlike other kinds of real estate development.
Two dwellings, one owner: An ADU is a small, independent dwelling on the same grounds as an otherwise conventional single family residence. Regardless of its architectural form (backyard cottage, basement apartment, etc.), legally it is part of the same property as the primary home. It cannot be bought or sold separately, as a condominium or a dwelling on wheels might be. The owner of the ADU is the owner of the primary dwelling (Brown and Watkins 2012).
Homeowners as developers: The typical ADU is not created by a professional real estate developer. Rather, it is created by a homeowner who starts with a conventional single family property and does the work of a developer: contracting with designers and builders, paying for permits, wrangling with plans examiners, and taking on financial risk (Hickey 2010). These homeowner-developers may not have the same goals, and rarely have the same experience and resources, as professional developers.
Patchwork of regulations: States may require local governments to allow ADUs, but local governments often set their own terms and procedures (Antoninetti 2008). This creates a wide variety in regulations and conditions. Many local governments allow ADUs only when certain conditions have been met, such as owner occupancy of the property (e.g. Seattle Department of Planning and Development 2011) and the addition of extra off-street parking (e.g. Seattle Department of Planning and Development 2014). Fulfilling these conditions can be challenging; several writers have argued that they substantially mute, or sometimes even completely block, ADUs from being constructed (Brinig and Gamett 2013; Stege 2009).
Locally permitted, nationally mislabeled: Building a permitted ADU creates an apparent contradiction: a 2-unit dwelling in a neighborhood that is likely zoned for single-family homes. Though the property and its ADU are completely legal by local standards, national institutions such as lenders and Fannie Mae may struggle to fit the property into the categories used in their programs. They may lump such a property together with duplexes, with conventional single family residences, or with other things. They may use proxy measures (such as the number of electric meters) to give "support" for their classification. This creates considerable confusion among real estate professionals (real estate agents, lending agents, appraisers, etc), and probably suppresses the value of ADUs in real estate appraisals and transactions (Brown and Watkins 2012).
Rarity. Perhaps because of the confused state of regulations and categorization mentioned above, permitted ADUs are rare. For example, Portland is widely considered to be a leader in ADU development, but has about 800 ADUs (Palmeri 2014) out of approximately 148,000 properties where they could be permitted (Cunningham 2011) – a penetration rate of 0.5%. Accordingly, most discussion about the effects of ADUs is prospective – it voices benefits or fears that might be realized in the future,

6
not observations about the effects of ADUs that currently exist. Permitted ADUs are simply too rare to have been studied much.
Illegal units confuse the picture. Unpermitted ADUs appear to be plentiful, especially in areas with high rental demand (such as Boston and the San Francisco Bay area). There are tens or perhaps hundreds of thousands of illegal ADUs in the United States. In some densely occupied East and West Coast communities, illegal ADUs might compose 2% - 10% of housing stock (Wegmann and Nemirow 2011). One San Francisco study estimated more than 20% of residential buildings contained an illegal secondary unit (San Francisco Planning and Urban Research Association 2001). These ADUs are hard to characterize because they are "off the record," but certainly some of them are substandard and unsafe (Goebel 2013).
The Portland survey and our approach to interpreting it In summer 2013 the Oregon Department of Environmental Quality's Green Building program sponsored a survey of the owners of permitted ADUs in the Oregon cities of Portland, Eugene and Ashland. The survey was executed by the Survey Research Lab of Portland State University, and their report (Survey Research Lab 2013) contains a detailed survey methodology, along with some basic results.
Of the three cities studied, the Portland results stood out as being worthy of further examination. Portland has seen a boom in ADU building in recent years (Palmeri 2014), and the city provided more than 200 responses. This made it possible to characterize Portland's ADUs, their owners, and their inhabitants in some detail. For categorical questions about Portland ADUs the Survey Research Lab projected a sampling error of ±4.4%, smaller than the other cities surveyed.
Portland's experience should be interesting to residents of other cities, because Portland's restrictions on ADUs are relatively mild. ADUs are permissible on the great majority of single-family lots, given some conditions for square footage, placement on the lot, and other factors (City of Portland 2011). Unlike many other cities which allow ADUs, Portland has no requirement for owner occupancy in either the primary dwelling or the ADU (City of Portland Bureau of Development Services 2008), and no requirement to provide off-street parking (City of Portland 2011). If loosely regulated ADUs have consequences for the community, either good or bad, Portland should be a logical place to look for them.
We decided to use the Portland survey data to directly address eight questions (listed in the Introduction) raised in civic debate about ADUs around the country. For each one, we take a simple but formal approach.
We report relevant results from the survey.
We look for perspective in some comparable data from a credible outside source – for example, the Census.
When possible, we phrase a simple hypothesis about the relationship of the survey result(s) and the outside data, and test the hypothesis statistically.
For example, consider the question, "Do ADUs serve older adults?"
The survey gives us the proportion of Portland ADU residents in several age categories, including 55+ years old.

7
Resident ages for a wider group of Portland households are available in the Census' American Housing Survey.
We might then hypothesize: if ADUs preferentially serve older adults as places to live, we would expect the proportion of residents in ADUs who are 55+ to be greater than the proportion of residents in the general pool of all Portland rentals who are 55+. We could then test the hypothesis with a binomial test of proportions.
The Survey Research Lab (2013) data set contains the answers to 37 questions, which, upon examination, amount to several hundred independent variables. In the interests of space and clarity, we will not report results for every single variable. Rather, we will restrict our analysis to the eight topics previously listed, choosing the most relevant variables from the survey to address each topic. Readers looking for more detail can read the methodological report (Survey Research Lab 2013), which has some initial results for every variable, or download the survey data package (see below).
Comparative and supplemental data sources Our primary comparative source of data is the American Housing Survey (AHS). The AHS is the US Census Bureau's periodic study of housing units and associated information, such as household size and income. A general description of the AHS can be found at US Census Bureau (2014a). The most recent summary of nationwide results, representing conditions in 2011, can be found in US Census Bureau (2013a).
For our work, we used a file with the same format as US Census Bureau (2013a), but custom generated to represent AHS results within current Portland city limits. This file, which we will refer to as US Census Bureau (2013b) was provided to us by Charles Rynerson of Portland State University's Population Research Center. A copy is available in the downloadable data package (see below).
We also draw on a survey of rents and vacancies in Portland apartments published by Multifamily NW (2013), and a study of parking conditions around certain Portland developments (David Evans & Associates 2012).
For a few topics we obtained some additional information about the respondents’ properties. A special request to the Multnomah County assessor’s office, keyed by the address of the ADU, gave us this information: the tax levy code associated with the property, the square footage of living area at the ADU’s address (including the area of the primary dwelling), and the owner’s address.
Downloadable data package Readers can obtain a copy of the Portland survey data we used, along with a data dictionary, and additional survey responses from Eugene and Ashland. The downloadable package is available at http://www.deq.state.or.us/lq/sw/wasteprevention/greenbuilding.htm and http://accessorydwellings.org/sidd/.

8
Notes on limitations, uncertainty and statistics As with any piece of research, the reliability and utility of this analysis are limited by the nature of the source data and the analysis design – as well as the reader’s purposes in using the analysis. While it would be exhausting to catalog every potential source of error or misinterpretation, several concerns seem most substantial to us:
Representativeness of the subject time and place. Our primary data set comes from Portland, Oregon, in the summer of 2013 – that is, it is a snapshot of responses in a single city, in a single year. While we believe the survey does a credible job of characterizing ADU owners in that time and place (see Survey Research Lab 2013 for full details), we do not know how well Portland results can be extended to other cities, or how typical 2013 is of future years.
Use of published summaries in lieu of control groups. In order to test a range of hypotheses with limited time and resources, this paper presents a “post-hoc” analysis, comparing existing survey results to published summary statistics (for example, averages taken from a Census table), rather than comparing experimental and “control” samples measured with identical methods. Such comparisons will never be perfect, since the “outside” datasets were created for different purposes, and have their own associated limitations. We treat summary statistics from the Census and other outside sources as parameters and do not attempt to incorporate their associated error.
Several statistical details are not errors, but may be of interest to readers.
Our work frequently refers to medians rather than means. Our primary source of comparable data, the American Housing Survey (US Census Bureau 2013b) typically summarizes magnitude using the median instead of the mean. Accordingly, our statistical tests usually compare medians. We will often report the mean even if it cannot be used in statistical tests. Mean and median tend to be similar in this dataset.
Results in this report may differ from results in Survey Research Lab (2013). Often we are interested in only a subset of the available data, for example only attached ADUs, whereas the Survey Research Lab report treats all responses en masse. Also, we treat missing values as missing (i.e. noninformative), whereas the Survey Research Lab report often lists them as categorical responses.
These imperfections and quirks are typical limitations given the subject matter, and similar concerns could be expressed about the few comparable publications (Chapman and Howe 2001; Wegmann and Chapple 2012; Rudel 1984). Given the poor state of prior knowledge about the reality of ADU developments (see the Introduction), we believe this paper makes an interesting contribution to the field despite its shortcomings.

9
Exhibit A. Current uses of Portland ADUs.
OtherNo current use
Work or living space
Short-term housing
Long-term residence
Perc
ent o
f A
DU
s
100
80
60
40
20
0
Notes: The dotted line marks the estimated proportion of all Portland housing units used as long-term residences, from the AHS.
Topics, Results & Discussion
Are ADUs providing housing at all?
Background It may seem odd to question whether a housing form actually provides housing, but it is an essential premise influencing policy discussions. Writing about ADUs often implies that 100% of the units will be used for long-term housing, but in most cases there is little to stop owners from using them as offices, art studios, short-term rentals, extra living space for the owner, etc.
Such alternative uses have entered civic discussion. A news piece from Davis, California (Sakash 2013) reports that in a debate about ADU policies, an affordable housing advocate said, “A large percentage of them [ADUs] are used as home offices.” (The article does not include the basis for this statement.)
Relevant survey results The uses of Portland ADUs, as found in the survey, can be seen in Exhibit A. 80% are in use or on the market as long-term “primary residences”, while 20% have an alternative use. The survey defined “primary residence” as the place a person usually lives, sleeps, eats, and receives mail. The most common alternative use is work or living space (11%), followed by short-term (<30 days) housing (5%).

10
These results are similar to Wegmann and Chapple's (2012) findings for (largely unpermitted) San Francisco Bay Area ADUs. They found that 86% of ADUs were in use or on the market as housing, and 14% had an alternative use.
Perspective and hypothesis ADUs are not unique in this capability. Alternative uses are possible for any housing form. If ADUs are especially likely to have alternative uses, the proportion of Portland ADUs actually used for housing should be lower than the proportion of all Portland housing units actually used for housing.
The AHS file for Portland (US Census Bureau 2013b Table C-00-SV-M) relates that in 2011, of all 255.5 thousand housing units in Portland, 96.6% were in use as housing or available as housing through sale or rental.1 This is significantly more than the 80% rate for Portland ADUs (binomial test with Z approximation, p<0.001).
Discussion and additional results While Portland ADUs are more likely to have alternative uses than other housing forms, the great majority (80%) are nonetheless used as long-term residences.
The 20% of ADUs that are not used as housing might be a kind of latent resource, an untapped reservoir of housing. These dwellings are already built and permitted, and can be turned from offices, workshops, etc, into long-term rentals immediately if owners become motivated to do so.
Such scenarios have already been contemplated by many ADU owners. Exhibit B indicates that 33% of those currently using their ADU for an alternative purpose plan to use it as a long-term residence in the future. Similarly, 10% of those currently using their ADU as a long-term residence plan to use it for something else in the future.2
1 Specifically, there are 255.5 thousand housing units. 229.8 are occupied, and so are used as housing. Of the 24.5 thousand units vacant, 6.1 are for rent, 2.7 are for sale, and 7.1 are rented or sold. 4.8 are “occasional use/URE” and 3.9 thousand are “other vacant.” The only ones that are conceivably not residences are the last two categories, which represent 3.4% of all housing units. Therefore 96.6% are used as residences. 2 Percentages in the relevant part of Exhibit B add to >10% because this survey question allowed multiple responses.

11
The awareness of ADU owners to the many potential uses of their dwellings may be increased by proximity. Even though Portland does not require owner occupancy of properties with ADUs, we estimate that 64% of ADU owners occupy their properties nonetheless3.
"Our ADU really gives us added flexibility," wrote one respondent in the open comments of the survey, "from guest space for friends to long term use by neighbors reconstructing their own house nearby (lived in the ADU for 2.5 years) to its current use for supplemental income [as] a vacation rental."
3 In preparation for the survey, one of us (JP) compared the addresses of Portland ADUs to the mailing addresses of their owners. In 447 out of 701 cases (64%) the addresses were the same, indicating owner occupancy.
Exhibit B. Current, past and future uses of Portland ADUs.
ADU currently used as long-term residence
ADU currently has alternative use
All finished ADUs
Past uses
Long-term residence 93% 31% 80%
Short-term housing 5% 43% 13%
Extra room or workspace 12% 69% 23%
Other 4% 11% 5%
Anticipated future uses
Long-term residence 95% 33% 82%
Short-term housing 7% 43% 15%
Extra room or workspace 8% 65% 20%
Other 3% 15% 5%
Notes: Respondents were asked how their ADU is currently used, how it has been used in the past, and how they anticipate using it in the future. For example: 12% of respondents currently using their ADU as a residence have used it as extra room or workspace in the past. Sums may not equal 100 because respondents could choose multiple answers.
12
Is ADU housing in demand?
Background ADUs are a relatively unusual type of housing in Portland. It is reasonable to ask if they are a kind of housing tenants want. A basic indication of their desirability to tenants should be vacancy rate.
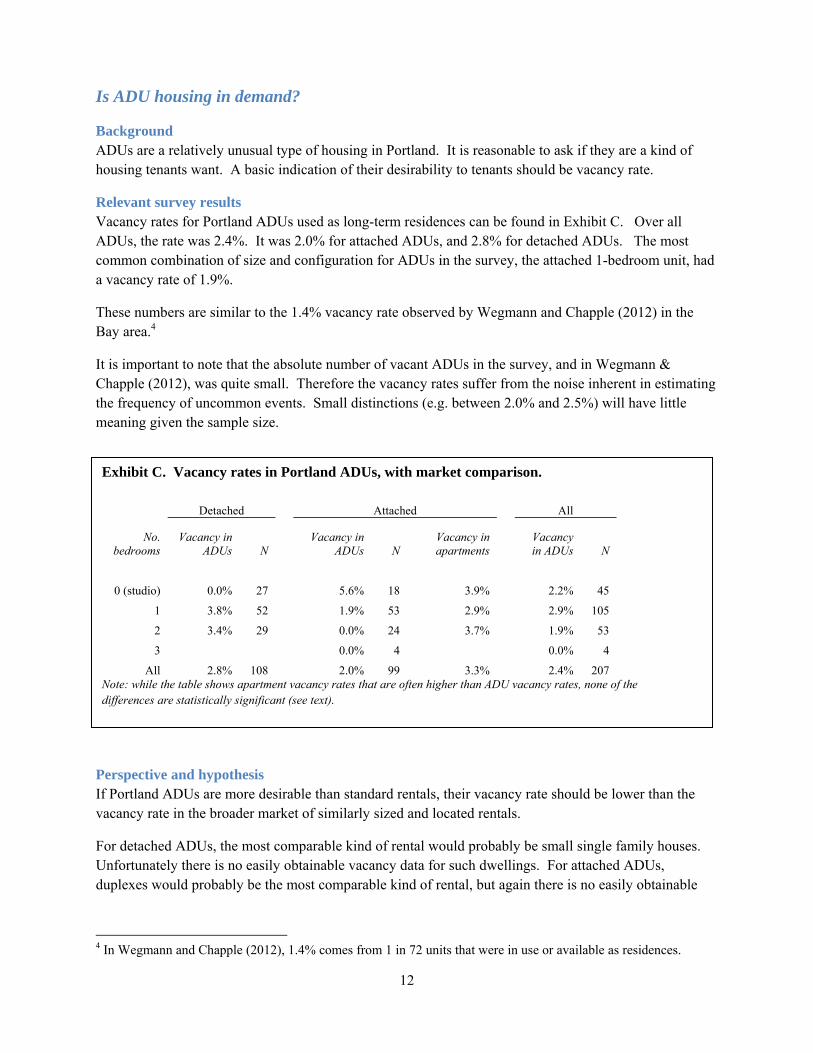
Relevant survey results Vacancy rates for Portland ADUs used as long-term residences can be found in Exhibit C. Over all ADUs, the rate was 2.4%. It was 2.0% for attached ADUs, and 2.8% for detached ADUs. The most common combination of size and configuration for ADUs in the survey, the attached 1-bedroom unit, had a vacancy rate of 1.9%.
These numbers are similar to the 1.4% vacancy rate observed by Wegmann and Chapple (2012) in the Bay area.4
It is important to note that the absolute number of vacant ADUs in the survey, and in Wegmann & Chapple (2012), was quite small. Therefore the vacancy rates suffer from the noise inherent in estimating the frequency of uncommon events. Small distinctions (e.g. between 2.0% and 2.5%) will have little meaning given the sample size.
Perspective and hypothesis If Portland ADUs are more desirable than standard rentals, their vacancy rate should be lower than the vacancy rate in the broader market of similarly sized and located rentals.
For detached ADUs, the most comparable kind of rental would probably be small single family houses. Unfortunately there is no easily obtainable vacancy data for such dwellings. For attached ADUs, duplexes would probably be the most comparable kind of rental, but again there is no easily obtainable
4 In Wegmann and Chapple (2012), 1.4% comes from 1 in 72 units that were in use or available as residences.
Exhibit C. Vacancy rates in Portland ADUs, with market comparison.
Detached Attached All
No. bedrooms
Vacancy in ADUs N
Vacancy in ADUs N
Vacancy in apartments
Vacancy in ADUs N
0 (studio) 0.0% 27 5.6% 18 3.9% 2.2% 45
1 3.8% 52 1.9% 53 2.9% 2.9% 105
2 3.4% 29 0.0% 24 3.7% 1.9% 53
3 0.0% 4 0.0% 4
All 2.8% 108 2.0% 99 3.3% 2.4% 207 Note: while the table shows apartment vacancy rates that are often higher than ADU vacancy rates, none of the differences are statistically significant (see text).

13
vacancy information. Data is available, however, for apartments. Multifamily NW (2013) gives vacancy rates for various sizes of apartments in various sectors of the city.
We compared Multifamily NW (2013)’s vacancy rates to the rates observed in attached ADUs. To make the two data sources comparable, we weighted Multifamily NW (2013)’s rates by the number of comparably located, comparably sized, and attached ADUs in the survey.5
Exhibit C shows that over all attached ADUs, the vacancy rate was 2.0%, while it was 3.3% in the comparable apartments. This difference is not significant (binomial test, z approximation, p>0.3). In studio sized (0-bedroom) attached ADUs the vacancy rate was 5.6%, compared to 3.9% for the comparable apartments. This difference is not significant (p>0.4). In 1-bedroom ADUs the vacancy rate was 1.9%, while it was 2.9% in the comparable apartments. This difference is not significant (p>0.4).
Discussion Portland in 2013 was a tight rental market with low vacancies (Njus 2013). In that market, ADUs seemed to be similar to apartments in their attractiveness to renters. There is currently no indication that ADUs are less preferred by tenants. An examination of rents (see the section on "Do ADUs provide affordable housing?") suggests that attached ADUs may actually be preferred to standard apartments.
It seems likely that ADU owners will be able to find tenants as easily as conventional landlords – a fact that may influence their financial planning. One respondent to the survey commented, "The ADU is one of the best investments I ever made. It has been continuously rented since completion providing important income to us."
5 The weighting was necessary because the apartments in the Multifamily NW (2013) survey did not have the same geographic distribution as attached ADUs. Without an adjustment, a high concentration of apartments in a part of the city with few ADUs could dominate the apartment vacancy rate in a way that is irrelevant to the comparison with ADUs.

14
Do ADUs have a low environmental impact?
Background Though it is not widely discussed, one of the strongest policy arguments for promoting ADU development may be environmental impact. ADUs are typically "infill" development, increasing density in existing neighborhoods. Increased density is arguably connected to higher transit use and lower energy use (Brownstone and Golob 2009).
ADUs also appear to offer a solution to the current mismatch between housing stock and demographic trends. For decades, average US household size has been declining… from 3.7 persons/household in 1940 to 2.6 in 2011 (US Census Bureau 2011b). At the same time, the median size of new single family houses has been increasing, from around 1000 square feet in 1950 (Harris et al. 2006) to 2306 sf in 2012 (US Census Bureau 2013c). Accordingly, median square footage per person in new construction has been increasing, from 676 sf per person in 1993 (US Census Bureau 1995) to 850 in 2011 (US Census Bureau 2013a).
As houses have grown, evidence has accumulated that size is likely the single largest factor in the environmental effect of a dwelling, in terms of both energy and materials. The Oregon DEQ has conducted detailed modeling of the long-term effects of various green housing technologies, comparing about 25 green building practices such as better insulation and windows, increased air tightness, advanced framing, and reducing home size. This study (Oregon Department of Environmental Quality 2010) found that, of all the practices studied, reducing home size was the most beneficial practice for reducing both material and energy related environmental impacts. Comparing a "medium" house of 2262 square feet (which is similar to the median size in new construction) to an "extra small" house of 1149 sf, it found the extra small house reduced numerous measurements of environmental impact by 20-40%, while the climate change impact was reduced by 36%.
Relevant survey results The size distribution of Portland ADUs is shown in Exhibit D. 85% of ADUs were less than or equal to 800 square feet in area, probably because 800 is the maximum allowed under Portland rules without a variance. The range was 200 to 1500, and medians were 700 square feet over all ADUs, 728 for attached ADUs, and 700 for detached ADUs. The overall mean was 689 square feet, which is slightly larger than the ADUs Wegmann & Chapple (2012, Table 9) described in the Bay Area, which had a mean of 559 square feet.
The household sizes found in Portland ADUs are shown in Exhibit E. 60% of Portland ADUs were occupied by 1 person, 35% by 2 people, and only 5% by 3 or more. The mean household size was 1.45 over all ADUs, 1.39 in detached ADUs, and 1.52 in attached ADUs.
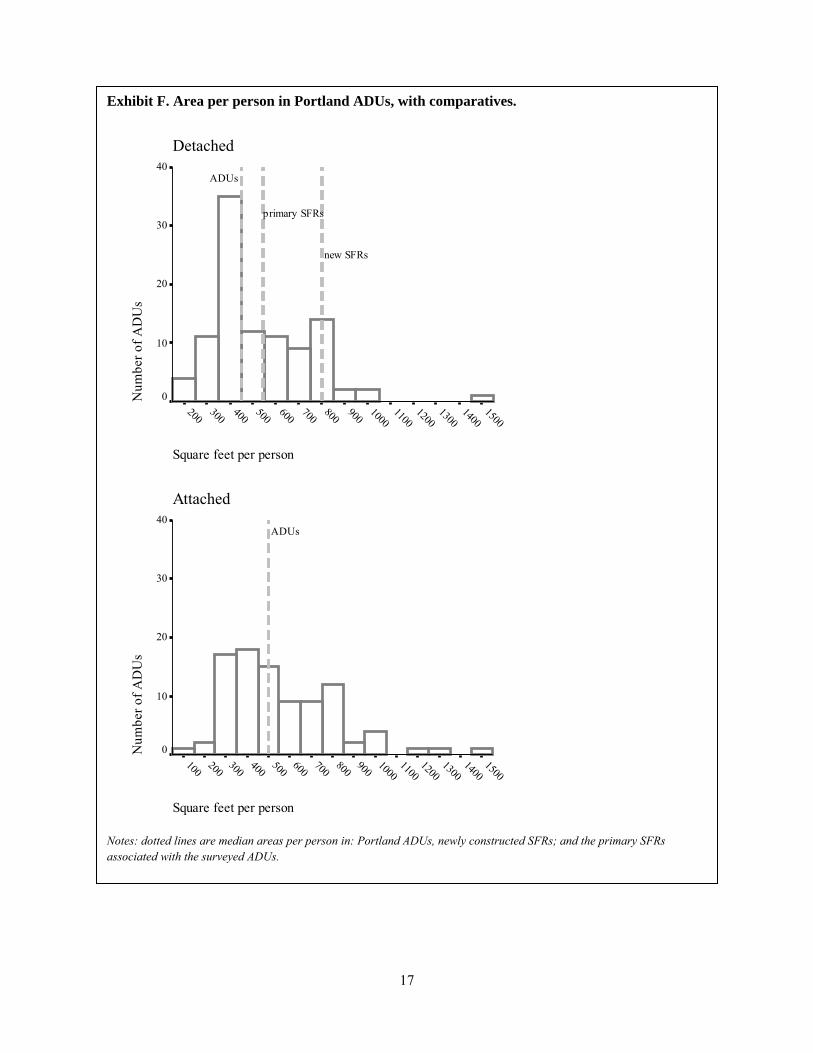
The distribution of square footage per person in Portland ADUs is shown in Exhibit F. The median over all ADUs was 470 sf/person, and the medians for attached and detached were 500 and 450 respectively. Though the range reached from 100 to 1500 sf/person, 93% of values were 800 sf/person or lower. The means were 533 sf/person overall, 547 sf/person for attached, and 520 sf/person for detached.

15
Exhibit D. Size of Portland ADUs, with comparatives.
Area (square feet)
17001600
15001400
13001200
11001000
900800
700600
500400
300200
DetachedN
umbe
r of
AD
Us
40
30
20
10
0
ADUs primary SFRs new SFRs
Area (square feet)
17001600
15001400
13001200
11001000
900800
700600
500400
300200
Attached
Num
ber
of A
DU
s
30
20
10
0
ADUs
Notes: Dotted lines are median sizes of: detached Portland ADUs, newly constructed SFRs, and the "primary" SFRs associated with the surveyed ADUs.

16
Exhibit E. Household size in Portland ADUs, with comparatives.
No. people in household
54321
DetachedN
umbe
r of
AD
Us
70
60
50
40
30
20
10
0
a n p
No. people in household
54321
Attached
Num
ber
of A
DU
s
70
60
50
40
30
20
10
0
a
Notes: Dotted lines are mean household sizes for: (a) Portland ADUs, (n) newly constructed SFRs, and (p) the "primary" SFRs associated with the surveyed ADUs.
17
Exhibit F. Area per person in Portland ADUs, with comparatives.
Square feet per person
15001400
13001200
11001000
900800
700600
500400
300200
DetachedN
umbe
r of
AD
Us
40
30
20
10
0
ADUs
primary SFRs
new SFRs
Square feet per person
15001400
13001200
11001000
900800
700600
500400
300200
100
Attached
Num
ber
of A
DU
s
40
30
20
10
0
ADUs
Notes: dotted lines are median areas per person in: Portland ADUs, newly constructed SFRs; and the primary SFRs associated with the surveyed ADUs.

18
Perspective and hypotheses If ADUs are lighter on the environment, they should have smaller areas per dwelling, and smaller areas per occupant, than other new residences. We focus our initial formal comparison on newer residences because most ADUs in the survey were recently built. 54% of Portland ADUs in the survey were built in the 4 years preceding the survey (i.e. 2009 or after), and all of them after 1994. In contrast, existing Portland housing stock in the study neighborhoods is typically 50-100 years old.
The AHS contains information about the area, household size, and area per person of “new” construction (built within the four years before its survey). Since this particular information is only available for detached single family residences (SFRs), we will compare the AHS information to the survey's detached Portland ADUs. Since most ADUs are rented out as long-term residences (Exhibit A), we will use the version of the AHS results that refers to rented units.
As the reference lines in Exhibit D show, newly constructed SFRs in Portland are significantly larger than ADUs - the median square footage is 1600 (US Census Bureau 2013b Table C-02-RO-M), compared to 700 sf for Portland detached ADUs (p<0.001, one-sample median test).
Household sizes diverge as well, but not as dramatically (Exhibit E). The mean household size in Portland's detached ADUs is 1.39, whereas in newly constructed, rented SFRs we estimate it is 2.26 (calculated from US Census Bureau 2013b Table C-08-RO-M).
As a consequence living area per person is significantly lower (p<0.001, one-sample median test) in detached Portland ADUs. Exhibit F shows a median of 450 sf/person, compared to 800 sf/person in newly constructed, rented SFRs.
Discussion and further results These results suggest new detached ADUs should have significant environmental benefits over new SFRs, even if the ADUs have no above-code green features. Detached ADUs have a median size that is 56% smaller than newly constructed rental SFRs. More significantly, detached ADUs have a median living area per person (the most exacting proxy for environmental impact available with this survey data) that is 44% smaller than new rented SFRs.
That particular comparison (detached ADUs vs. new rented SFRs) is narrowly drawn, because it tries to match housing forms, age, and uses. Does the living area "advantage" for ADUs hold up when broader groups of homes are compared? Exhibit F2 provides some information.
Exhibit F2. Comparisons of living area per person in Portland ADUs and SFRs.
Survey study group Median living area/ person (ft2)
Comparative group Median living area per person (ft2)
p-value a
Detached ADUs 450 Newer rented SFRs 800 <0.001 All ADUs 470 All SFRs 700 <0.001 All ADUs 470 “Primary” SFRsb 574b <0.01c All ADUs 470 All rented SFRs 404 <0.001 Notes: a One-sample median tests unless otherwise noted. b “Primary” SFRs are the SFRs associated with the surveyed ADUs. For this group of dwellings, the living area per person statistic should be considered a first estimation only. It relies on county records that are of mixed accuracy. c Wilcoxon signed ranks test on paired observations.

19
Exhibit F2 shows Portland ADUs have lower living area per person than new rented SFRs, than primary SFRs (i.e. the ones that accompany the ADUs in this study), and than the general collection of all Portland SFRs, both owner-occupied and renter-occupied.
There is one exception to the trend. ADUs have a larger, not smaller, median living area per person when they are compared to renter-occupied SFRs of any age. This contrasting result probably arises from a large number of 3+-person households living in houses built 50-100 years ago, which generally were smaller than today's construction. The median size of these rental SFRs is 1200 sf, whereas for newly constructed ones it is 1600 (US Census Bureau 2013b). This result may not be a serious blow to the environmental argument for ADUs. Housing policy is mostly concerned with the kind of units that will be built in the future, and for those, recent construction seems a better indicator than construction 5-10 decades old. Moreover, most older SFRs were built to environmental standards below today's codes, and new ADUs are sometimes built well above code.
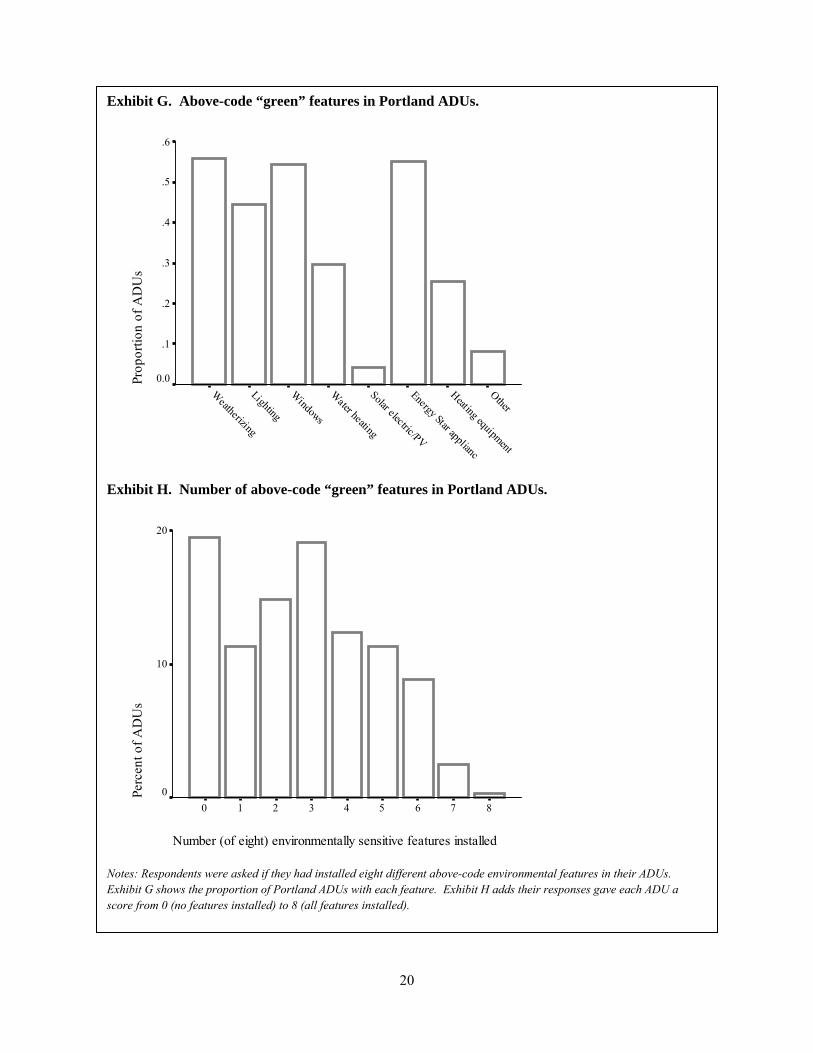
Green features in Portland ADUs The survey asked ADU owner-developers about the presence of eight different above-code green features in their ADUs. The most commonly applied (>50% of ADUs) were above-code insulation and weatherizing, high efficiency windows, and Energy Star appliances (Exhibit G). More than half the ADUs had at least three of the eight features, and 23% of the ADUs had five or more (Exhibit H).
Unfortunately the data available to us do not allow us to make a clear test of whether such features are more frequent in ADUs than in other new dwellings in Portland. The most comparable statistic comes from the Energy Trust of Oregon, which tracks the percentage of new dwellings in the state for which it has granted financial incentives for above-code work achieving certain targets. In 2010 they credited 13% of new dwellings, and in 2011 they credited 20% (Leonard 2014). It is unclear how many ADUs would have met Energy Trust standards, but the fact that 23% of ADUs had five or more above-code features suggests that Portland ADUs are at least as "green" as other new construction, even before the size advantage of ADUs is taken into account.
While ADUs are significant construction projects, they may be small enough that homeowner-developers feel able to experiment with green features.
"In our attempt to reduce our environmental impact," commented one respondent, "we repurposed and reused a large amount of materials including lumber we had recertified, doors, finish materials, tile, granite, appliances and more. Other significant items include 1/3 to 1/2 FSC certified lumber, straw bale construction, natural earthen floors and lime/sand wall plaster finishes."
20
Exhibit G. Above-code “green” features in Portland ADUs.
OtherHeating equipment
Energy Star applianc
Solar electric/PV
Water heating
Windows
Lighting
Weatherizing
Prop
ortio
n of
AD
Us
.6
.5
.4
.3
.2
.1
0.0
Exhibit H. Number of above-code “green” features in Portland ADUs.
Number (of eight) environmentally sensitive features installed
876543210
Perc
ent o
f A
DU
s
20
10
0
Notes: Respondents were asked if they had installed eight different above-code environmental features in their ADUs. Exhibit G shows the proportion of Portland ADUs with each feature. Exhibit H adds their responses gave each ADU a score from 0 (no features installed) to 8 (all features installed).

21
Final thoughts These results clearly suggest ADUs could have significant environmental benefits. Assuming that living area per person is an informative proxy for environmental impact, ADUs should use less materials and create less ongoing energy demand per person than the SFRs typical of residential neighborhoods. Moreover, ADUs seem better matched to the 1- and 2-person households that are common today than large SFRs.
Of course, ADUs and SFRs are not the only development options for a growing city like Portland. Multifamily developments (e.g. apartment blocks) also seem likely to feature a low living area per person (though we could find no statistics on this topic for Portland). However, it may be difficult or impossible to place multifamily developments (especially larger ones) in or near existing residential neighborhoods. Meanwhile, ADUs can fit into such neighborhoods without much disruption, and sometimes with hardly any notice at all (Spevak 2013). ADUs and multifamily developments may complement each other in a long-term housing strategy.
22
Do ADUs contribute to neighborhood parking problems?
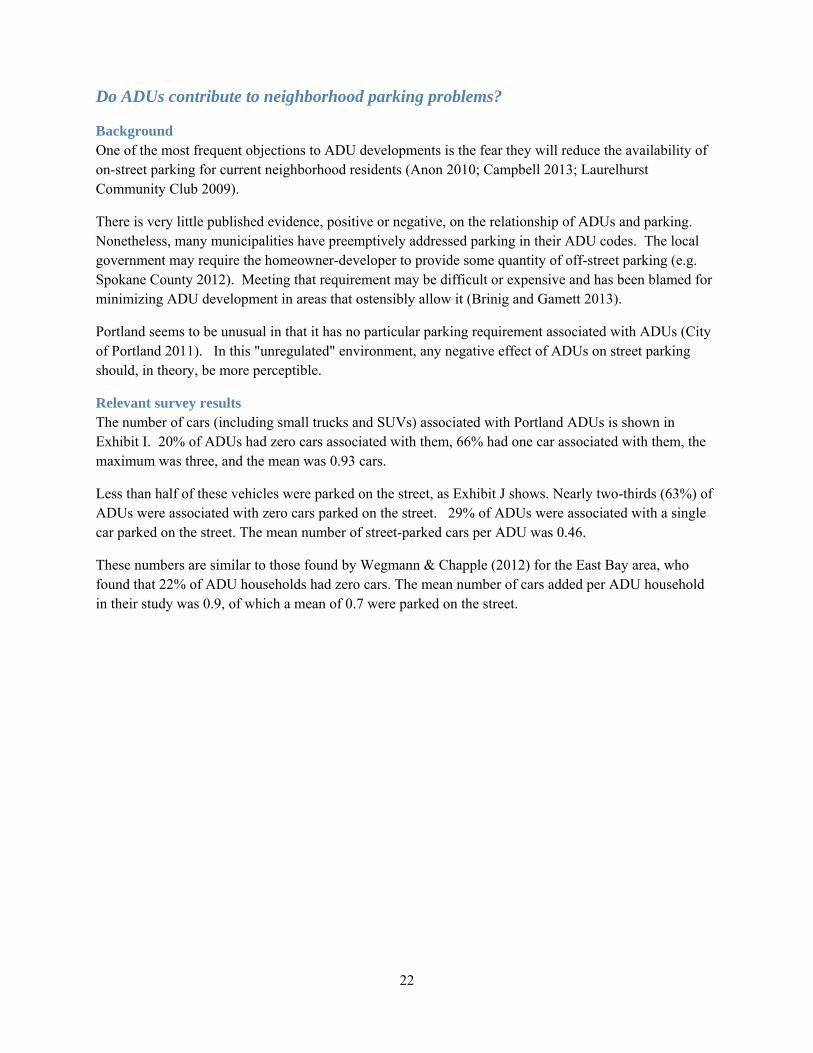
Background One of the most frequent objections to ADU developments is the fear they will reduce the availability of on-street parking for current neighborhood residents (Anon 2010; Campbell 2013; Laurelhurst Community Club 2009).
There is very little published evidence, positive or negative, on the relationship of ADUs and parking. Nonetheless, many municipalities have preemptively addressed parking in their ADU codes. The local government may require the homeowner-developer to provide some quantity of off-street parking (e.g. Spokane County 2012). Meeting that requirement may be difficult or expensive and has been blamed for minimizing ADU development in areas that ostensibly allow it (Brinig and Gamett 2013).
Portland seems to be unusual in that it has no particular parking requirement associated with ADUs (City of Portland 2011). In this "unregulated" environment, any negative effect of ADUs on street parking should, in theory, be more perceptible.
Relevant survey results The number of cars (including small trucks and SUVs) associated with Portland ADUs is shown in Exhibit I. 20% of ADUs had zero cars associated with them, 66% had one car associated with them, the maximum was three, and the mean was 0.93 cars.
Less than half of these vehicles were parked on the street, as Exhibit J shows. Nearly two-thirds (63%) of ADUs were associated with zero cars parked on the street. 29% of ADUs were associated with a single car parked on the street. The mean number of street-parked cars per ADU was 0.46.
These numbers are similar to those found by Wegmann & Chapple (2012) for the East Bay area, who found that 22% of ADU households had zero cars. The mean number of cars added per ADU household in their study was 0.9, of which a mean of 0.7 were parked on the street.

23
Exhibit I. Cars associated with Portland ADUs, with comparatives.
Total cars per dwelling
3210
Num
ber
of A
DU
s140
120
100
80
60
40
20
0
TODs
ADUs
All rentals
Exhibit J. Number of street-parked cars associated with Portland ADUs, with comparative.
Cars parked on street per dwelling
3210
Num
ber
of A
DU
s
140
120
100
80
60
40
20
0
ADUs
TODs
Notes: Dotted lines are the mean number of cars (top panel) or number of street-parked cars (bottom panel) associated with: Portland ADUs, transit-oriented developments, and all Portland rentals.

24
Perspective and hypotheses The task of composing hypotheses about ADUs and parking immediately raises the question "Compared to what?"
That is, should the number of cars contributed by ADU developments to SFR neighborhoods be compared to zero change (i.e. no additional housing and no change in household size)? Or, is the alternative to ADU development some different kind of development? In that case, the most relevant question is not if development will affect cars and parking, but how much does each housing form affect it?
We can investigate the "zero change" scenario with a simple retrospective calculation: how many cars have ADUs already added to Portland single family neighborhoods? The average household in Portland is associated with approximately 1.53 vehicles, according to the AHS (calculated from US Census Bureau 2013b Table C-02-AO-M). There are approximately 148,000 single family properties in Portland where ADUs would be allowed (Cunningham 2011), for an estimated total of 1.53x148,000=226,440 vehicles associated with SFRs. There were approximately 800 permitted ADUs in Portland by the end of 2013 (Palmeri 2014), each of which the survey shows is associated with an average of 0.93 cars. The estimated total number of cars associated with permitted ADUs is 0.93x800=744 cars. Overall, ADUs have added 0.33 % to the cars associated with SFR neighborhoods, and less than half of them have been parked on the street. It seems unlikely that, on a city-wide basis, ADUs have yet had any noticeable effect on parking.
Zero change is not a likely scenario in Portland (Metro 2010). The city is attracting new residents while it is geographically constrained by the Metro urban growth boundary and natural features such as rivers. Accordingly, we would like to compare the vehicles associated with ADUs with those associated with other forms of development that might provide future housing. If ADUs are particularly responsible for increasing the number of vehicles in neighborhoods or parked on the street, then cars per dwelling and street-parked cars per dwelling should be higher for ADUs than other types of development.
Some comparable data about vehicles is available for two classes of housing:
All newly constructed rental housing in Portland, in the AHS (US Census Bureau 2013b Table C-02-RO-M). Building type is not specified in this table but newly constructed rental housing in Portland is predominantly “multifamily” with 20+ units per development. (US Census Bureau 2013b Table C-01-RO-M).
"Transit-oriented development." Generally this phrase, and the abbreviation TOD, refers to a theme or technique in planning that intensifies development near transit resources (Cervero, Ferrell, and Murphy 2002). However in this paper we specifically refer to a set of large apartment buildings in Portland that were built along transit corridors on the edges of SFR neighborhoods, and permitted with a smaller number of parking spaces than might be expected elsewhere (Mesh 2012). These developments have caused neighborhood protest about possible loss of parking (Beaven 2012). In response, the city commissioned a report (David Evans & Associates 2012) that includes data on vehicles per household and parking spaces in these buildings. We summarized the figures in Table 2 of that report to get the numbers we use here.

25
As the reference lines on Exhibit I illustrate, newly constructed rental housing in Portland is associated with a mean of 1.31 cars per dwelling (calculated from US Census Bureau 2013b Table C-02-RO-M). This is significantly more than 0.93, the mean for ADUs (p<0.001, one-sample t-test). Transit-oriented developments are associated with 0.83 cars/dwelling, which is less than the 0.95 for ADUs (p=0.01, one-sample t-test).
Unfortunately the AHS data does not have specific numbers about cars parked on the street. But ADUs can be compared with transit-oriented developments. Summarizing numbers from David Evans & Associates (2012), Table 2, there is an average of 0.34 parking spaces per unit. Since there are 0.83 cars per unit, an average of 0.49 (i.e., 0.83-0.34) must be parked on the street. As shown in Exhibit J, this is slightly more than, but not significantly different from, the average of 0.46 street-parked vehicles for each ADU (p=0.4, one-sample t-test).
Discussion Any kind of new development is likely to add some cars to the urban landscape. Our results indicate that ADUs are associated with fewer cars than the general set of new Portland rentals -- an average of 0.93 vehicles per unit, compared to 1.31. If the goal of planning is to reduce vehicles per household, ADUs seem like a relatively good option.
ADUs do not appear to be quite as effective at reducing vehicles per household as “transit-oriented developments,” with means of 0.93 and 0.83 vehicles per dwelling respectively. However, experience in Portland suggests ADUs can be less controversial than TODs.
Looking at the quantity of vehicles parked on the street, ADUs and TODs seem quite similar (0.46 and 0.49 street-parked vehicles per unit in our estimation). But public reaction to them has been very different. Transit-oriented developments have caused a vigorous protest in Southeast Portland over their possible effect on parking (Beaven 2012). Meanwhile, we have observed no organized protest in Portland over ADUs and parking.
It seems possible the resistance to Portland’s recent transit-oriented developments arises from their concentrated nature. TODs add a high number of living units to a small area, so any increase in vehicles will be more noticeable. In contrast, ADUs are dispersed through neighborhoods, and each additional dwelling creates only a small incremental change (Spevak 2013).
Future parking conditions in Portland seem likely to be influenced more by general development patterns than requirements for parking at ADUs, or lack thereof. City permit records indicate that over the 5-year span of 2008-2012 inclusive, only 405 new ADUs were created, while 6237 units were created in new multifamily buildings (Wood 2013). Assuming this trend continues, choices made in the multifamily field will be crucial. Will the thousands of new dwellings be typical, contributing 1.31 cars per unit, or more like TODs, contributing 0.83 cars per unit?
The effect of ADUs on parking in Portland has been negligible, to date, for a number of reasons. ADUs are associated with a modest number of vehicles per dwelling; some of these cars are parked off the street; ADUs are dispersed throughout neighborhoods; ADUs are generally rare; and other forms of development have far more impact. Until those factors change substantially, the fear that ADUs harm parking conditions will have little rational basis.

26
Do ADUs serve older persons?
Background Three decades ago the needs of older persons were the primary rationales for promoting ADU development. Programs like "Double Unit Occupancy" (San Francisco Development Fund 1988) reasoned that a retiring person who builds an ADU might then have two kinds of resources:
a place to live suited to their needs, possibly with family nearby;
a place to rent out, providing much-needed income;
or possibly both.
This concept was supported by an opinion poll showing that most aging people wanted to stay in their homes as they aged (AARP Public Policy Institute 2005). AARP supported ADUs with the writing of a model code (Cobb and Dvorak 2000).
Relevant survey results Exhibit K shows the age of Portland ADU resident "heads of household," as observed in the survey.6 Because the survey recorded ADU resident ages only in broad categories, we must characterize "older" ADU residents as those 55+ years old. 22% of residents in ADUs were in the 55+ category. The approximate median age of ADU residents (estimated from the categorical results) is 36 years old.
In comparison, in the Bay area, Wegmann & Chapple (2012) found that the mean age of residents of (largely unpermitted) ADUs was 38.6, and that 4% of those residents were 65+. In attached Seattle ADUs, Chapman & Howe (2001) found that approximately 12% of tenants were 55+.
Switching to the topic of ADU owners rather than tenants, Exhibit L shows owner ages for Portland ADUs. For these subjects, we have ages to the nearest year. 46% of ADU owners in Portland are 55+, and 18% are 65+. The mean age of Portland ADU owners is 52.2 and the median 53.
For comparison, Wegmann & Chapple (2012) found that the mean age of Bay Area ADU owners was 49.6. Chapman & Howe (2001) found a similar mean for owners, 50, and noted 13% were 65+.
When we look at ADU resident and owner as a pair for each property, we can estimate that 72% of the time, Portland ADU owners were older than their tenants.
6 In 60% of cases there was only one person inhabiting the ADU, so they were the head of household. If there was more than one person in the ADU, we took the one with the highest age category as the head of household.

27
Exhibit K. Ages of occupants of Portland ADUs, with comparative.
Tenant age class
55+35-5425-34<25
Perc
ent o
f te
nant
s (h
ouse
hold
ers)
50
40
30
20
10
0
ADU tenants
All Portland tenants
Exhibit L. Ages of owners of Portland ADUs, with comparative.
Owner age class
75+65-74
55-6445-54
35-4425-34
<25
Perc
ent o
f ow
ners
30
20
10
0
ADU owners
All homeowners

28
Perspective and hypotheses For perspective we need to compare these distributions to the wider population.
If Portland ADUs are preferentially supporting older persons with living space, we would expect ADUs to have a higher proportion of residents 55+ than the general collection of Portland rentals.
If Portland ADUs are preferentially supporting older persons with rent money or other benefits of ownership, we would expect a higher proportion of owners 55+ or 65+ for Portland ADUs than for general Portland SFRs.
Exhibit K compares the ages of householders in all Portland rentals with those in ADUs. The distributions are similar in shape. The median age of a Portland renter-householder, according to the AHS, is 35, nearly identical to the estimated median for ADU renters, 36. The two data sets show similar proportions of renter-householders who are 55+ years old: 22% for ADUs vs. 20% for the general pool of Portland residents. This difference is not significant (p>0.3, binomial test with z approximation). The most notable difference is in the 25-34 year-old age class, where ADUs have 44% of their tenants, 10% more than Portland rentals in general.
Exhibit L compares the ages of all Portland homeowners with the ages of Portland ADU owners. The age distributions are similar, except in the highest age classes. The median age of Portland ADU owners, 53, is not significantly different than the median for all Portland homeowners in the AHS, which is 51 (p>0.1, one sample median test). ADU owners are equally as likely as the typical Portland homeowner to be 55 or more: 47% of ADU owners are in that age class, vs. 44% in the AHS, a difference that is not significant (p>0.2, binomial test with z approximation). ADU owners are slightly less likely than the typical Portland homeowner to be 65 or more: 18% of ADU owners are in that age class, vs. 22% of Portland homeowners (p=0.06, binomial test with z approximation).
Discussion ADUs in Portland do house and support older persons, but apparently no more than other forms of housing. The distribution of renter and owner ages in ADUs and the general Portland population are generally similar.
However, there are indications ADUs may support Portland's older citizens in a more substantial way in future years. The top age classes among ADU owners (Exhibit L) show an interesting trend. 55-64 year olds, and 65-74 year olds, are more common among ADU owners than all Portland homeowners. Meanwhile there are very few ADU owners in the highest age class (75+). This may be because the retired people are less likely to build ADUs than middle-aged people (Chapman and Howe 2001; San Francisco Development Fund 1988).
In ten years, the clump of Portland owners currently 55-64 will be of retirement age, and those 65-74 will likely be well into retirement. If these people still own the properties, they will have the kind of resources that ADU advocates imagined three decades ago.
Some comments in the survey showed owners can have such a fallback plan in mind. One respondent wrote:
"We rent [our ADU] to a young family member and might live in the little house when we retire, renting the main house to supplement our income."

29
How much do ADUs support the community economically?
Background ADUs are significant construction projects that produce permanent dwellings. They should have an impact on the local economy in at least two ways.
In the short term, construction redistributes money held in personal savings or bank reserves, transferring it to parties such as contractors, suppliers, city permitting agencies, architects, and lending agents. The total benefit should be a function of the construction cost.
In the longer term, permitted ADUs become part of the property tax base. Assessors increase the assessed value of the property to reflect the presence of the new ADU, and the owner's property taxes rise accordingly.
We worked to quantify the magnitude of these effects for ADUs. Because we found it difficult to easily obtain construction cost and property tax data for other housing forms that seemed comparable to the surveyed ADUs, we will skip hypothesis-testing and keep our results descriptive.
Construction costs and benefits The construction cost of the ADUs in the survey is given in Exhibit M.7 We considered only respondents who were the developers of their ADUs, since their involvement should make figures more reliable. Over all ADUs, self-reported construction costs ranged from $3500 to $300,000, the mean was $78,760, and the median was $65,000.
There was a noticeable cost difference between attached and detached ADUs, with attached units significantly cheaper than detached; the medians were $45,500 and $90,000 respectively (p<0.001, Mann-Whitney U test). Presumably, attached units gain economy by utilizing pre-existing structures and systems. A few detached units were extremely expensive, and comments on the survey suggest this may have been because of special green features.
Expressing costs on a square-foot basis (Exhibit N), the range was $6 to $438, the mean $121 and the median $108.8 Attached units were cheaper than detached in this view as well, with medians of $65 and $145 respectively (p<0.001, Mann-Whitney U test).
Where does the construction money go? Among the most common recipients of this money were paid contractors, used by 85% of homeowner-developers, and paid architects and designers, used by 41%.
The National Association of Home Builders has a model (National Association of Home Builders 2013) that estimates local benefits from construction costs. We applied that model, but changed the inputs to reflect the average cost of a Portland ADU (about $78,000), and the current fee structure related to ADUs. The output estimated each ADU led to $63,104 in local gross income and 0.94 local jobs in the first year.
7 Since most ADUs were constructed recently we have made no attempt to correct for inflation. 8 One ADU's apparent cost per square foot was $1000; we ignored this.

30
Exhibit M. Construction cost of Portland ADUs.
Cost of ADU construction ($)
300,000
280,000
260,000
240,000
220,000
200,000
180,000
160,000
140,000
120,000
100,000
80,000
60,000
40,000
20,000
0
DetachedN
umbe
r of
AD
Us
25
20
15
10
5
0
median mean
Cost of ADU construction ($)
300,000
280,000
260,000
240,000
220,000
200,000
180,000
160,000
140,000
120,000
100,000
80,000
60,000
40,000
20,000
0
Attached
Num
ber
of A
DU
s
25
20
15
10
5
0
median mean

31
Exhibit N. Construction cost of Portland ADUs (per square foot).
ADU construction cost per square foot ($)
450425
400375
350325
300275
250225
200175
150125
1007550250
DetachedN
umbe
r of
AD
Us
25
20
15
10
5
0
median mean
ADU construction cost per square foot ($)
450425
400375
350325
300275
250225
200175
150125
1007550250
Attached
Num
ber
of A
DU
s
25
20
15
10
5
0
median mean

32
Tax contribution estimation Unlike construction costs, tax contributions continue after the first year of an ADU's existence. We would have preferred to get the ADU portion of property tax directly from the county assessor, but for various reasons (changing tax formulae and county record-keeping) this was not possible. Instead, we calculated each ADU’s tax contribution from the basic formula applied by the assessor, using the respondent's reported construction cost as a key datum.
According to a duty appraiser at the Multnomah County Assessor's office (Sanders 2014), the property tax increase an SFR owner will experience when improving their property (for example, by adding an ADU) can be calculated as:
PROPERTY TAX INCREASE= RMV x CPR x LEVY
In this formula, RMV is the real market value of the improvement (i.e. the best estimate of what the improvement would fetch in an open market sale), in thousands; CPR is the "changed property ratio" set by the assessor; and LEVY is the amount of tax per thousand dollars of RMV which differs by exact geographic zone in the city, and is available at the assessor's web site.
We were able to obtain LEVY for each property in the survey with a special request to the assessor's office. CPR is the same across the entire county; we used the assessor's value for the year of ADU construction. The only remaining factor is RMV, which we estimated from the construction cost reported by the ADU owner as a reasonable first approximation (Sanders 2014).
Some construction costs (Exhibit M) seemed extraordinarily high or low. We were not confident these prices would be reflected in returns in open market sales (a premise of RMV), so we eliminated from consideration properties with the top 5% and bottom 5% of ADU construction costs.
Exhibit O shows the results. Estimated yearly tax contributions per ADU ranged from $244 to $2927 with a mean of $1134 and a median of $1004. Expressed in dollars per square foot of ADU, the range is $0.22 to $7.69, the mean $1.85 and the median $1.75.
ADUs appear to be a way of delivering substantial tax dollars to the community without adding highly visible developments to neighborhoods. We cannot determine if they are more or less effective at delivering tax dollars than other forms of housing, but this could be pursued with further analysis.

33
Exhibit O. Estimated yearly property tax contributions from Portland ADUs, using 2013 levy rates.
Estimated yearly property tax contribution ($)
28002600
24002200
20001800
16001400
12001000
800600
400200
Num
ber
of A
DU
s
20
10
0
median

34
Do ADUs provide affordable housing?
Background The notion that ADUs can create affordable housing is one of the oldest and most common hopes for this form of development, appearing in most discussions of the subject. Some sources seem to assume that creation of ADUs will directly lead to affordable housing. At least one local government (Davis, California) has decided that a portion of ADUs automatically qualify as contributions towards regional affordable housing goals (Sakash 2013).
Is this assumption appropriate? It is not simple to determine. In addition to a basic lack of data, discussions of ADUs have used many definitions of "affordable." We will review a few of them here.
Government housing programs in the US usually define "affordable" with a 30% standard: housing costs that are more than 30% of income are considered burdensome (US Department of Housing and Urban Development 2014). Calculating ratios of income and housing expense, on a household or a community basis, are central to these programs. Though the policy value of the 30% standard can be critiqued (Pivo 2013), this numerical dividing line is at least clear and calculable.
Meanwhile, advocacy for ADUs often speaks of affordability in a less precise way. For example, the web site of the Puget Sound Regional Council writes, "In expensive single family dominated areas, accessory dwelling units can also provide affordable housing choices. Most communities require an ADU to be smaller than the primary home on the property, and the smaller size can reduce the rental price of the unit. Monthly rent of the unit would likely be lower than a mortgage payment for a house in the same neighborhood… For homeowners, an ADU can be an additional source of income for property owners, offsetting the cost of home ownership." (Puget Sound Regional Council 2014)
This quote presents two different ideas of affordability common in discourse about ADUs. First, affordability is defined from the renter's perspective, as a small dwelling that costs less to occupy than a single family residence in the same neighborhood. Second, affordability is defined from the homeowner-developer's perspective, as a property that (through income generation) lowers the cost of ownership. Neither definition specifies a magnitude of cost or savings which might meaningfully affect finances. There also is little acknowledgement that affordability for the renter and owner could conflict.9
Finally, the very few pieces of research which have actually looked at ADU rents have used a more pragmatic, relative assessment of affordability. They compared ADU rents to competing rentals in the same area. Wegmann & Chapple (2012, Table 9) found that ADUs in the Bay Area rented for $250, or 19%, less per month, than non-ADU alternatives (though ADUs were smaller). Three decades ago, Rudel (1984) found that attached ADUs in Babylon, NY were 35% cheaper than apartments, and also suggested one reason was that ADUs were smaller than the competition.
For the Portland survey data, we adopt this method of comparative rents, because it is simple, descriptive, and does not require information about tenant income. We cannot address affordability from the homeowner perspective because the survey has no information about homeowner housing costs. 9 There are four possibilities: the presence of the ADU lowers costs for both the tenant and owner, for the tenant only, the owner only, or for neither. The homeowner-developer's situation is not automatically advantageous. ADUs require money to develop, and loans the homeowner takes might increase their housing costs and thereby the rent they charge.

35
Relevant survey results Exhibit P summarizes the rents observed in Portland ADUs. The mean rent over all ADUs is $765, the median $800, and the maximum $1800. Larger bedroom counts are associated with higher rents, ranging from a mean of $674 for (0-bedroom) studios to a mean of $1133 for (rare) 3-bedroom ADUs. Curiously, attached and detached ADUs rent for virtually identical amounts – the median is $800 for each.
Exhibit P. Rents in Portland ADUs, with comparative.
Detached Attached All
No. bedrooms
ADU rent ($)
ADU rent, zeros
omitted ($)
ADU rent ($)
ADU rent, zeros
omitted ($)
Comparable apartment
rent ($)
ADU rent ($)
ADU rent, zeros
omitted ($)
Mean 0 698 737 646 795 651 674 761
1 788 880 750 849 783 768 864
2 824 1041 790 938 851 809 994
3 1133 1133 1133 1133
All 777 887 753 872 778 765 879
Minimum 0 0 500 0 385 0 385
1 0 400 0 550 0 400
2 0 500 0 775 0 500
3 1000 1000 1000 1000
All 0 400 0 385 0 385
Median 0 750 750 765 799 626 750 770
1 800 838 800 800 791 800 813
2 925 970 900 950 873 900 950
3 1000 1000 1000 1000
All 800 850 800 885 778 800 850
Maximum 0 950 950 1195 1195 1195 1195
1 1500 1500 1200 1200 1500 1500
2 1800 1800 1200 1200 1800 1800
3 1400 1400 1400 1400
All 1800 1800 1400 1400 1800 1800
N 0 19 18 16 13 16 35 31
1 38 34 43 38 53 81 72
2 24 19 19 16 24 43 35
3 3 3 3 3
All 81 71 81 70 93 162 141

36
An important pattern becomes visible when the actual distribution of rents is graphed, as in Exhibit Q. A substantial number of ADUs (13%) are occupied for zero cash rent. In addition, another 5% are occupied for <=$500/month, extremely low rents for Portland in our experience (Brown and Watkins 2012). The remaining rents in Exhibit Q follow something like a normal curve, with a peak around the median of $800.
Our mean of $765 differs from the mean of $880 reported in Survey Research Lab (2013) based on the same survey responses. This is because Survey Research Lab (2013)’s calculation does not include zero rents.
Perspective and hypotheses The free and ultra-low rents are surprising, but not totally unprecedented. In the Bay Area, Wegmann & Chapple (2012) also found a large fraction of ADUs (17%) were occupied for no cash rent at all.
This is a key finding. It suggests some unique phenomenon is occurring in ADU developments. While zero-rent housing is conceivable for any housing type, professional landlords do not generally give lodgings away for free.
If ADUs are special in this way, their proportion of zero-cash-rent units should be much higher than other housing forms. Calculating from the AHS (US Census Bureau 2013b Table C-10-RO-M) shows that only
Exhibit Q. Rents in Portland ADUs, summer 2013.
ADU rent ($)
1,8001,700
1,6001,500
1,4001,300
1,2001,100
1,000900
800700
600500
400300
200100
0
Num
ber
of A
DU
s
35
30
25
20
15
10
5
0
ab
c
Notes: Histogram represents rents for all ADUs (attached and detached). Dotted lines represent (a) mean of attached ADU rents; (b) mean of estimated rents for apartments comparable to the attached ADUs (see text for method); (c) mean rent of attached Portland ADUs when zero rents are omitted.

37
4% of all Portland rental units are occupied for zero cash rent – a significantly smaller fraction than the 13% for Portland ADUs (p<0.001, binomial test).
Combining the zero- and very-low-rent units, 18% of Portland ADUs are <=$500/month, which are affordable rentals in Portland by many definitions. Not surprisingly, the survey also indicates that 85% of the tenants of these free-or-clearly-below-market rentals are family members or friends of the owner.
Considering all Portland ADUs, not just this special subset of very-low-cost rentals, are ADUs more affordable than the market competition? If they are, ADU rents should be lower than those of similarly sized and located alternatives.
There is no easily accessible rent data about single family houses in Portland, especially for tiny single family houses that would be most comparable to detached ADUs. Accordingly, we limited our formal rent comparison to attached ADUs. These seemed similar in size and configuration to apartments, for which there is a good source of rent data. Multifamily Northwest, an association of Portland-area landlords, publishes an Apartment Report with vacancy rates and rents specified by sector of Portland and unit size. To generate a comparable rent for each of our ADUs, we queried Multifamily NW (2013) and took the mean rent of a comparably sized (studio, 1 or 2 bedroom) apartment in the same sector of the city.
The statistical comparison of ADU and market rents depends greatly on whether the zero-cash-rent units are included in the analysis. When they are, there is no significant difference (p>0.5, Wilcoxon signed ranks test) between observed ADU rents, which had a mean of $753 for attached ADUs, and the comparable rents from the Multifamily Northwest survey, which had a mean of $778. If the zero-cash-rent units are omitted, attached Portland ADUs have a mean rent of $872, which is significantly higher than the Multifamily NW (2013) comparables (p=0.001, Wilcoxon signed ranks test).
These numbers contrast with the experience of Wegmann & Chapple (2012), and Rudel (1984), who found that ADUs were cheaper than comparable rentals. However, there are some differences between the analyses. Both Wegmann & Chapple and Rudel noted that ADUs tended to be smaller than the rentals they used as comparables, whereas we attempted to equalize sizes as much as possible through bedroom count. In addition, Wegmann & Chapple's ADUs were often unpermitted, while all the Portland ADUs we studied were permitted.
In Portland, ADUs appear to be offering some value to renters that conventional apartments do not. We can only speculate about the motivation of renters, because they were not the survey respondents. However, location may be a factor – ADUs are dispersed within neighborhoods, while apartments tend to be on busier streets. ADUs might also provide access to private yards and other amenities usually associated with single family homes. Finally, there were pre-existing relationships: owners reported that 26% of ADU tenants were family or friends when they moved in.
Further Discussion These results suggest ADUs are a unique resource in terms of affordable housing: a form of development that produces some undeniably economical units, which nonetheless do not fit conventional expectations of "affordable housing."

38
The observed ADU rents (Exhibit Q) show two kinds of rentals. About 80% of ADUs are going for market rates, or can even charge a premium. Portland ADUs are, on average, no more or less affordable than comparable apartments in multifamily developments.
However, 13-18% of homeowner developers have literally gone off the normal curve by voluntarily charging rents that are far below what the market shows they could receive. Units inhabited for free or <=$500/month are affordable by many definitions, and they are being provided without any of the requirements or subsidies associated with governmental programs. As an additional point of economy, the average construction cost of a Portland ADU ($78,760) looks considerably cheaper than the reported costs of units in institutional affordable housing ($200,000 and above, see Korn 2014).
This "grassroots" style of affordable housing does come with a trade-off. ADUs are less regulated than institutional affordable housing. Most properties with ADUs would not be required to follow Fair Housing rules (Fair Housing Council of Suburban Philadelphia 2014), and obviously, rents of zero are very unlikely to be made available to strangers. Nonetheless, the affordability experienced by tenants of low-rent ADUs can be concrete. In our anecdotal experience, some ADUs are housing individuals that might otherwise need government assistance – for example, a grandmother on a fixed income.
One respondent to the survey commented, "This ADU has given us the opportunity to help our parents stay in their own home longer and for our family to reap the benefits of having grandparents around."
ADUs seem unlikely to be a complete solution to the need for affordable housing. But if 13-18% of ADUs are affordable merely through the owner's choice, that should be a significant community asset.
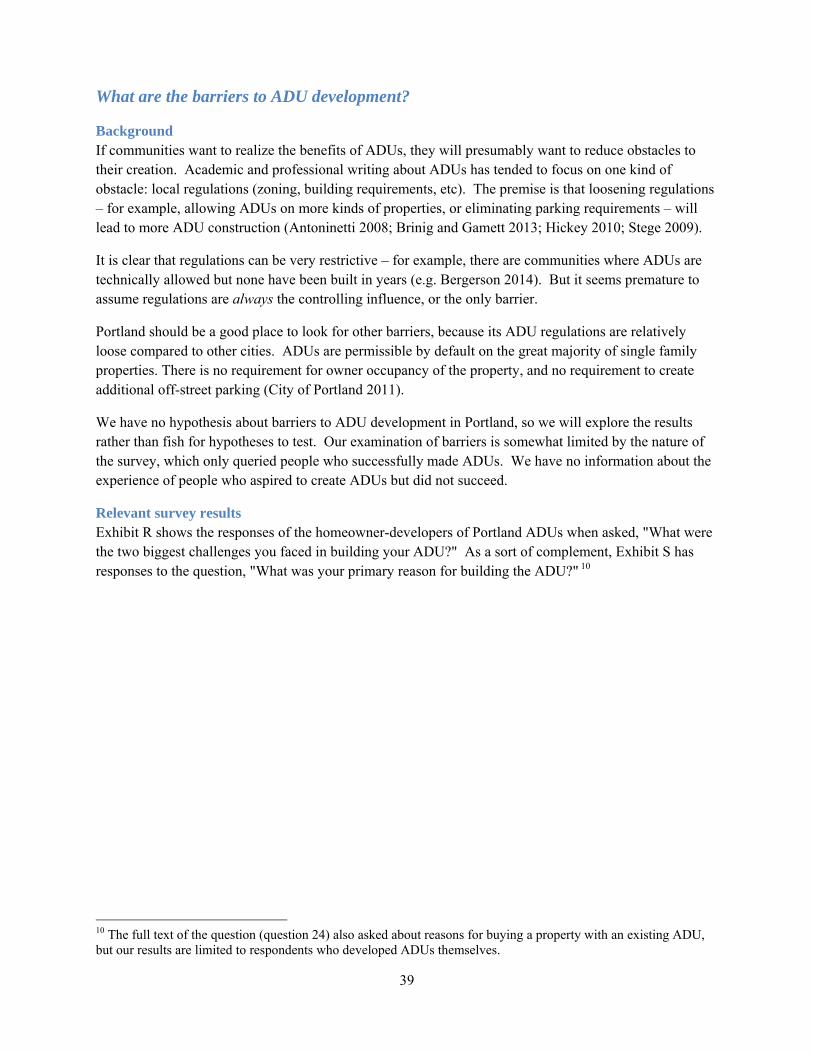
39
What are the barriers to ADU development?
Background If communities want to realize the benefits of ADUs, they will presumably want to reduce obstacles to their creation. Academic and professional writing about ADUs has tended to focus on one kind of obstacle: local regulations (zoning, building requirements, etc). The premise is that loosening regulations – for example, allowing ADUs on more kinds of properties, or eliminating parking requirements – will lead to more ADU construction (Antoninetti 2008; Brinig and Gamett 2013; Hickey 2010; Stege 2009).
It is clear that regulations can be very restrictive – for example, there are communities where ADUs are technically allowed but none have been built in years (e.g. Bergerson 2014). But it seems premature to assume regulations are always the controlling influence, or the only barrier.
Portland should be a good place to look for other barriers, because its ADU regulations are relatively loose compared to other cities. ADUs are permissible by default on the great majority of single family properties. There is no requirement for owner occupancy of the property, and no requirement to create additional off-street parking (City of Portland 2011).
We have no hypothesis about barriers to ADU development in Portland, so we will explore the results rather than fish for hypotheses to test. Our examination of barriers is somewhat limited by the nature of the survey, which only queried people who successfully made ADUs. We have no information about the experience of people who aspired to create ADUs but did not succeed.
Relevant survey results Exhibit R shows the responses of the homeowner-developers of Portland ADUs when asked, "What were the two biggest challenges you faced in building your ADU?" As a sort of complement, Exhibit S has responses to the question, "What was your primary reason for building the ADU?" 10
10 The full text of the question (question 24) also asked about reasons for buying a property with an existing ADU, but our results are limited to respondents who developed ADUs themselves.
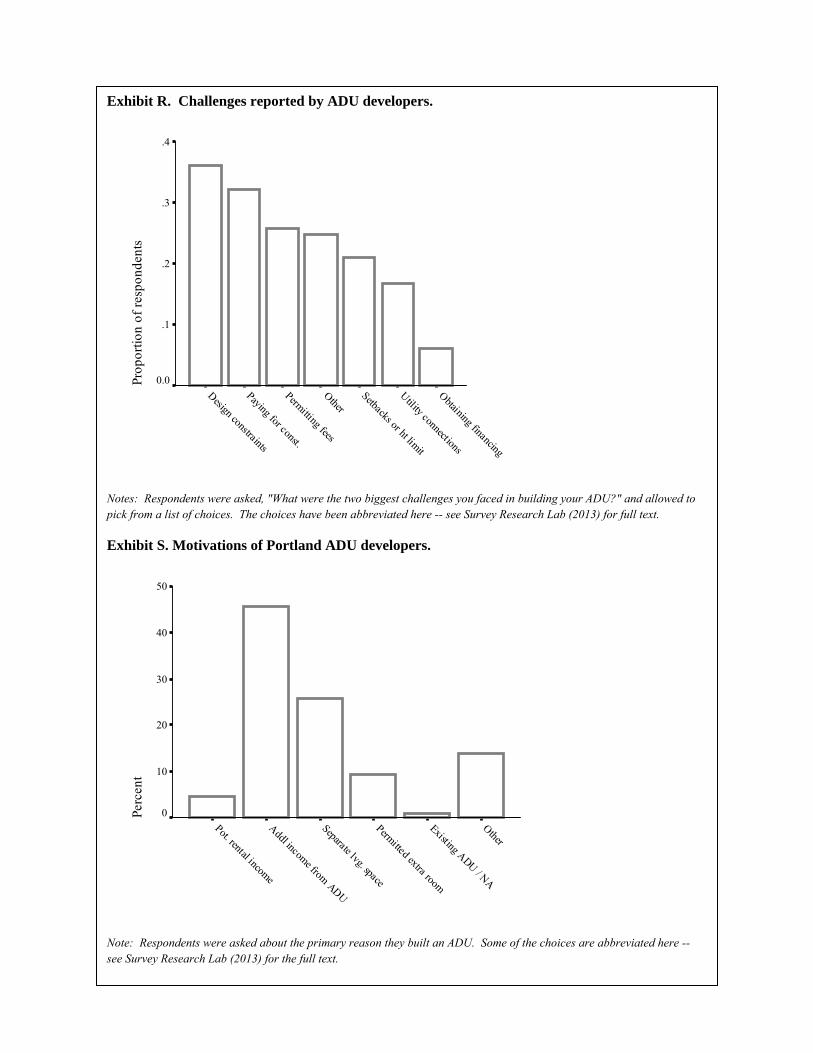
40
Exhibit R. Challenges reported by ADU developers.
Obtaining financing
Utility connections
Setbacks or ht limit
OtherPermitting fees
Paying for const.
Design constraints
Prop
ortio
n of
res
pond
ents
.4
.3
.2
.1
0.0
Notes: Respondents were asked, "What were the two biggest challenges you faced in building your ADU?" and allowed to pick from a list of choices. The choices have been abbreviated here -- see Survey Research Lab (2013) for full text.
Exhibit S. Motivations of Portland ADU developers.
OtherExisting ADU / NA
Permitted extra room
Separate lvg. space
Addl income from ADU
Pot. rental income
Perc
ent
50
40
30
20
10
0
Note: Respondents were asked about the primary reason they built an ADU. Some of the choices are abbreviated here -- see Survey Research Lab (2013) for the full text.

41
The single most common barrier is "Design constraints or challenges," mentioned by 36% of respondents. Typical issues here, according to comments on the survey, were meeting requirements for setbacks from property lines, and making the exterior of the ADU match the primary dwelling in appearance.
However, a closer look at the results suggests the biggest barrier is financial. The survey allowed respondents to name two challenges from a list. Three items on the list were related to money ("paying for construction," "permitting fees," and "obtaining financing"), and at least one of them is mentioned by 56% of respondents.
The financial theme is reflected in the timeline of ADU permits issued by the City of Portland. After the city waived systems development charges (SDCs, frequently $8,000 or more per unit) and increased allowable sizes for ADUs, permit applications increased dramatically (Palmeri 2014). Several survey comments specifically mentioned the SDC waiver.
Money is also prominent in the survey question about motivations. (For this question, only one choice was allowed per respondent.) The biggest single motivation was "Income from ADU rent" (46% of respondents), followed by "Separate living space for family member or helper" (26%).
Given that money is both a motivation and a challenge, it seems relevant to look at how Portland homeowner-developers paid for their ADUs. Respondents were allowed to give multiple responses to the survey question on this subject. Exhibit T shows that "cash" was the most frequently used option, mentioned by 62% of respondents, followed by a home equity line of credit (HELOC, 29%), and loan from family (13%). Respondents reported using up to 5 simultaneous financing methods, with an average of 1.5 methods. Of those who used only one financing method, cash again led the responses (52% of those respondents), followed by HELOC (17%).
The frequent used of cash suggests several possible explanations, none of which are necessarily exclusive. First, bank financing opportunities are probably limited (Bjork 2011; Brown and Watkins 2012). Second, given that ADUs are expensive ($78,760 on average), homeowner-developers of ADUs might simply have or make more money than other Portland homeowners. The frequent use of multiple financing
Exhibit T. Financing methods used by Portland developers of ADUs.
Percent ofrespondents
Paid with cash 62
Paid with home equity line of credit 29Paid with cash-out refinancing based on main home value 12
Paid with cash-out refinancing based on future value of home and ADU 1Purchased primary home and constructed ADU with cash out option based on future value 0
Paid with loan from family 13Paid with credit card(s) 11
Paid with construction loan from bank 2
Paid with personal loan from bank 5Paid with trade of services 4
Paid with other method 10Note: respondents could choose more than one answer.

42
methods could indicate high motivation on the part of homeowner-developers, who might need to creatively assemble financing rather than simply purchasing a single bank product.
We would like to test the notion that homeowner-developers have higher incomes than other homeowners, but unfortunately the survey data makes testing difficult. The survey contains a question about household income, but its categories do not match well with the income categories in the AHS file about Portland homeowners. The best comparison we can make11 suggests that, before their ADUs were created, Portland's homeowner-developers were very similar in income to other Portland homeowners.
While we cannot objectively test the notion that ADU developers are strongly motivated, the survey suggests that strong motivation can be necessary to complete an ADU project. On the survey question about challenges to development, more than a quarter of respondents chose the "Other" category (Exhibit R) and wrote in difficulties not expressed by the survey’s suggested options.
Though the comments ranged widely, the clearest theme of the write-ins was interaction with building officials and inspectors, who were seen as inconsistent or arbitrary. The biggest challenge was "never getting the same answer twice while applying for permits," wrote one respondent. "We received conflicting advice from people within the permitting office," wrote another. "Inspector from BDS made up nonexistent rules," wrote another.
In the case of these respondents, the projects were completed despite financial challenges and the frustrations with city staff. The survey can't tell if lack of money or such frustrations stopped other projects before they were completed, but it seems a reasonable possibility.
If local governments want to encourage ADU development, they may need to recognize that there are barriers besides regulations and codes. They may want to encourage bank financing, and they might want to create an easier process for the ADU developers – who tend to be homeowners, not real estate or construction specialists. For many of them, building an ADU is a major project, one that involves taking on financial risk and working through an unfamiliar process.
One respondent wrote, "the economy largely prompted our decision to convert the garage into an ADU. My partner was laid off from an architecture job, and we anticipated a long stretch of unemployment… Also our home had lost value so we were unable to sell it after several months on the market. It was a big risk at the time to build the ADU but it has been well worth it. We now have a child and the rental income has allowed us to get by as a single income earning family, so one of us can stay home full time with our child."
11 The comparison: The median, or 50th percentile, household income of Portland's homeowner-developers of ADUs is around $77,000. This follows from the survey result that 48% of respondents have an income of <$75,000, while the remaining 52% have incomes of >=$75,000. The median household income for all Portland homeowners, according to the AHS (US Census Bureau 2013b), is $70,000. However, homeowner-developer income includes rent. The average homeowner-developer with an ADU reports receiving $758/month, or $9096/yr, in rent. Removing the rent from the estimated median income ($77,000-$9000=$68,000) produces an income very similar to Portland homeowner household median of $70,000.

43
Conclusions and directions for further research This tour through issues and questions associated with ADUs suggests that, in Portland, ADUs are providing many of the benefits long claimed for them. This study finds, that, in Portland:
ADUs provide housing;
ADU housing is desirable to renters;
ADUs generally have owners living on the property;
ADUs support the local economy with construction work and property taxes;
A portion of ADUs are highly affordable rentals;
ADUs are likely to have a low environmental impact compared to standard single-family residences.
ADUs have had little effect on parking conditions on a city wide basis.
ADUs do not currently house a notably high proportion of older people (55+), nor are ADU owners particularly likely to be older people. However, as current owners age this may change.
The most commons motivations of homeowners who develop ADUs are financial and family-related.
The most common barriers to ADU development are finances and design constraints.
Any of these findings could be improved and refined with better methods. In particular, our technique of using published averages and medians as "control" or "comparative" parameters could be replaced with full research designs. For example, the affordability of ADU rents compared to other forms of housing could be studied with a formal, appraisal-style rent survey, where each ADU of interest would be assigned a comparable non-ADU rent based on the ADU’s particular features.
Such studies would produce more convincing results, but they would inevitably consume more time and resources. Several lines of investigation seem worth the extra effort:
Environmental impact of new dwellings. Our analysis of living area per person suggests ADUs are potentially a powerful way of reducing the environmental impact of new housing – given that detached ADUs have a median size that is 56% smaller and a median living area per person that is 44% smaller than new SFRs. However, no information on living area per person was available to us for another important development option – multifamily housing (i.e. apartment buildings). A future study might compare ADU living area per person with apartments, and translate those dwellings' characteristics into actual metrics of environmental footprint. Attached ADUs, by virtue of their shared walls, might have high potential for environmental benefits through reduced material and energy use.
Barriers to ADU development. For those who want to encourage ADUs, a more concerted effort could be made to identify barriers to development. In particular, it would be useful to locate homeowners who wanted to create ADUs, but did not succeed or follow through, and to compare their experience with those who did succeed.
Volunteer production of affordable housing. The finding that 18% of ADUs have free or very cheap rents – even while owners list financial gain as their single biggest motivation – is extremely interesting. Affordable housing is a widely acknowledged need in communities across the country, and ADUs appear to be producing a quantity of it outside of formal channels of government subsidy and regulation. What is happening in the ADUs that have zero or very low

44
rents? Who lives there, and what is the motivation of the owner? A study that takes a special, detailed look at the finances of both ADU tenants and owners might help policymakers cultivate a volunteer surge in affordable housing.
The production of “volunteer” affordable housing is an example of one of the more fascinating qualities of ADUs. ADUs are unusual developments in that they are largely “grassroots” and “nonprofessional” in the way they are created and used. They are not generally created by full-time developers, nor subsidized greatly by government agencies. ADU developers are mostly homeowners with personal financial and family goals. Curiously, these owners do not always choose to maximize their returns in a business sense. Some charge little or no rent even when market rents are easily obtainable; some spend significantly on green features; some house older relatives. In short, ADUs provide some community benefits even as owners pursue their own personal interests. Of all the positive features long imagined for ADU developments, this may be the most encouraging.
Sources AARP Public Policy Institute. 2005. “Beyond50.05: A Report to the Nation on Livable Communities:
Creating Environments for Successful Aging.” http://assets.aarp.org/rgcenter/il/beyond_50_communities.pdf.
American Planning Association. 2011. “Using Smart Growth and Universal Design to Link the Needs of Children and the Aging Population.” Family-Friendly Briefing Papers 02. http://www.planning.org/research/family/briefingpapers/pdf/multigenerational.pdf.
Anon. 2010. “No to Accessory Dwellings in Arlington, Virginia Petition.” May 7. http://www.petitiononline.com/pupi1031/petition.html.
Anon. 2008. “AARP Doesn’t Represent All Seniors on Accessory Units.” Sun Gazette [Arlington], June 23. http://www.sungazette.net/editorial/arlington/aarp-doesn-t-represent-all-seniors-on-accessory-units/article_0de7b1f7-86ac-56cc-a4ee-5adbc8539e4e.html#.TsrK3Yamcu0.
Antoninetti, Maurizio. 2008. “The Difficult History of Ancillary Units: The Obstacles and Potential Opportunities to Increase the Heterogeneity of Neighborhoods and the Flexibility of Households in the United States.” Journal of Housing For the Elderly 22 (4): 348–75.
Beaven, Steve. 2012. “New Portland Apartment Buildings with No Parking Have Neighbors Worried about Congested Streets.” The Oregonian - OregonLive.com. July 24. http://www.oregonlive.com/portland/index.ssf/2012/07/new_portland_apartment_buildin.html.
Bergerson, Roger. 2014. “City, District 12 Continue to Study Accessory Dwelling Units.” Park Bugle. January 28. http://www.parkbugle.org/city-district-12-continue-to-study-accessory-dwelling-units/.
Bjork, Nick. 2011. “Portland ADUs Booming, but Financing Stinks.” Daily Journal of Commerce (Portland, OR), January 11. http://findarticles.com/p/articles/mi_qn4184/is_20110111/ai_n56676354/.
Brinig, Margaret F., and Nicole Stelle Gamett. 2013. “A Room of One’s Own? Accessory Dwelling Unit Reforms and Local Parochialism.” The Urban Lawyer.
Brown, Martin J., and Taylor Watkins. 2012. “Understanding and Appraising Properties with Accessory Dwelling Units.” Appraisal Journal 80: 297–309.
Brownstone, David, and Thomas F. Golob. 2009. “The Impact of Residential Density on Vehicle Usage and Energy Consumption.” Journal of Urban Economics 65 (1): 91–98. doi:16/j.jue.2008.09.002.
Campbell, Colin. 2013. “Raleigh Council Nixes Backyard Cottages from City’s Growth Plan.” February 13. http://www.newsobserver.com/2013/02/13/2673255/raleigh-council-nixes-backyard.html.

45
Cervero, R., C. Ferrell, and S. Murphy. 2002. “TRANSIT-ORIENTED DEVELOPMENT AND JOINT DEVELOPMENT IN THE UNITED STATES: A LITERATURE REVIEW.” TCRP Research Results Digest, no. 52 (October). http://trid.trb.org/view.aspx?id=726711.
Chapman, N.J., and D.A. Howe. 2001. “Accessory Apartments: Are They a Realistic Alternative for Ageing in Place?” Housing Studies 16 (5): 637–50.
City of Portland. 2011. “Accessory Dwelling Units (ADUs).” Accessed July 12. http://www.portlandonline.com/bds/index.cfm?c=36676.
City of Portland Bureau of Development Services. 2008. “Notice of a Type II Decision in Your Neighborhood; Case File Number LU 08-156155 AD.” http://www.portlandonline.com/bds/index.cfm?a=214639&c=49783.
Cobb, Rodney L., and Scott Dvorak. 2000. “Accessory Dwelling Units: Model State Act and Local Ordinance”. Public Policy Institute [of the AARP]. http://accessorydwellings.files.wordpress.com/2011/10/d17158_dwell.pdf.
Cunningham, Bill. 2011. “[phone Interview with Bill Cunningham, City of Portland, 8/30/2011].” David Evans & Associates. 2012. “City of Portland Parking Impacts for New TOD along Portland Inner
Corridors: Parking Study.” https://www.portlandoregon.gov/bps/article/420059. Fair Housing Council of Suburban Philadelphia. 2014. “FHCSP: Fair Housing Laws.” Accessed March
22. http://www.fhcsp.com/Laws/. Goebel, Bryan. 2013. “San Francisco’s In-Law Units Home to Most Vulnerable Tenants.” KQED.
December 17. http://blogs.kqed.org/newsfix/2013/12/16/120916/in-law-units-San-Francisco. ———. 2014. “Supervisors Consider Legalizing San Francisco in-Law Units.” The Ocean Beach
Bulletin. http://oceanbeachbulletin.com/2014/03/31/supervisors-will-consider-legalizing-san-francisco-in-law-units/.
Harris, Jeffrey, Rick Diamond, Maithili Iyer, Chris Payne, and Carl Blumstein. 2006. “Don’t Supersize Me! Toward a Policy of Consumption-Based Energy Efficiency.”
Hickey, Nathaniel. 2010. Urban Consolidation : An Analysis of Accessory Dwelling Units and Backyard Cottages in Seattle.
Korn, Peter. 2014. “High Cost of ‘Affordable.’” Portland Tribune. February 6. http://www.pamplinmedia.com/pt/9-news/209817-66668-high-cost-of-affordable.
Laurelhurst Community Club. 2009. “[letter to Seattle City Council].” September 15. http://www.laurelhurstcc.com/issues/Housing/DADUs.htm.
Leonard, Scott. 2014. “[email from Scott Leonard of Energy Trust Oregon to Jordan Palmeri]”, March 12. Medicare. 2011. “Medicare.gov - Types of Long-Term Care.” Accessed July 3.
http://www.medicare.gov/longtermcare/static/AccessoryDwelling.asp. Mesh, Aaron. 2012. “Block Busters: The Urban Density Charlie Hales Championed Has Arrived on
Division Street. Why Isn’t He Celebrating?” September 19. http://www.wweek.com/portland/article-19687-block_busters.html.
Metro. 2010. “Urban Growth Report 2009-2030: Employment and Residential.” http://library.oregonmetro.gov/files/ugr.pdf.
Multifamily NW. 2013. “The Apartment Report”. Volume 18 (spring 2013). National Association of Home Builders. 2013. “The Metro Area Impact of Home Building in Portland,
Oregon: Income, Jobs, and Taxes Generated.” Njus, Elliot. 2013. “Apartment Rents Rising as Units, despite New Construction, Remain Hard to Find.”
OregonLive.com. October 16. http://www.oregonlive.com/front-porch/index.ssf/2013/10/rents_rising_as_apartments_des.html.
Oregon Department of Environmental Quality. 2010. “A Life Cycle Approach to Prioritizing Methods of Preventing Waste from the Residential Construction Sector in the State of Oregon: Phase 2 Report, Version 1.4.” http://www.deq.state.or.us/lq/pubs/docs/sw/ResidentialBldgLCA.pdf.
———. 2014. “Space Efficient Housing Workgroup.” Accessed April 2. http://www.deq.state.or.us/lq/sw/wasteprevention/SpaceEfficientWorkgroup.htm.

46
Palmeri, Jordan. 2014. “City of Portland ADU Permit Trends | Accessory Dwellings.” March 12. http://accessorydwellings.org/2014/03/12/city-of-portland-adu-permit-trends/.
Pivo, Gary. 2013. “The Definition of Affordable Housing: Concerns and Related Evidence.” http://architecture.arizona.edu/sites/default/files/faculty_papers/The%20Definition%20of%20Affordable%20Housing,%202013.pdf.
Puget Sound Regional Council. 2014. “Featured Tool: Accessory Dwelling Units (ADU)*.” Accessed March 12. http://www.psrc.org/growth/hip/alltools/adu/.
Rudel, Thomas K. 1984. “Household Change, Accessory Apartments, and Low Income Housing in Suburbs*.” The Professional Geographer 36 (2): 174–81. doi:10.1111/j.0033-0124.1984.00174.x.
Sakash, Tom. 2013. “Granny Flats to Contribute to City Affordable Housing Count, Thanks to Split Council Vote.” Davis Enterprise. http://www.davisenterprise.com/local-news/city/granny-flats-to-contribute-to-city-affordable-housing-count-thanks-to-split-council-vote/.
San Francisco Development Fund. 1988. Small Solutions: Second Units as Affordable Housing: The Evaluation of the Double Unit Opportunity Program of the San Francisco Development Fund, 1985-1988. San Francisco, Calif.
San Francisco Planning and Urban Research Association. 2001. “Secondary Units: A Painless Way to Increase the Supply of Housing.” http://www.spur.org/documents/secondaryunits.pdf.
Sanders, Jeff E. 2014. “[Phone Conversation and Email with Jeff E. Sanders, Multnomah County Assessor’s Office].”
Seattle Department of Planning and Development. 2011. “Establlishing a Backyard Cottage (detached Accessory Dwelling Unit).” http://www.seattle.gov/DPD/Publications/CAM/cam116b.pdf.
———. 2014. “Accessory Dwelling Unit.” Accessed April 2. http://www.seattle.gov/dpd/permits/commonprojects/motherinlawunits/default.htm.
Spevak, Eli. 2013. “Discreet Density.” Accessory Dwellings. http://accessorydwellings.org/2013/05/04/discrete-density/.
Spokane County. 2012. “Detached Accessory Dwelling Unit.” http://www.spokanecounty.org/data/buildingandplanning/cpi/brochures/bp75_DetachedAccessDwellUnit.pdf.
Stege, Elinor Hope. 2009. “What next for Accessory Dwellings? : Getting from Bylaws to Buildings”. Thesis, Massachusetts Institute of Technology. http://dspace.mit.edu/handle/1721.1/50124.
Survey Research Lab. 2013. “Accessory Dwelling Unit Survey for Portland, Eugene, and Ashland, Oregon: Final Methodology and Data Report, September, 2013.” http://www.deq.state.or.us/lq/sw/docs/ADUReportFRev.pdf.
Trotter, Rachel. 2014. “N. Ogden Looks at Allowing Accessory Dwellings in Large Zones.” Standard-Examiner. January 28. http://www.standard.net/stories/2014/01/28/n-ogden-looks-allowing-accessory-dwellings-large-zones.
US Census Bureau. 1995. “American Housing Survey for the United States in 1993.” http://www.census.gov/content/dam/Census/library/publications/1995/demo/h150_93.pdf.
———. 2013a. “2011 American Housing Survey for the United States - Complete Set of Tables.” www.census.gov/housing/ahs/files/ahs11/National2011.xls.
———. 2013b. “2011 American Housing Survey (special Tabulation for Portland City Limits).” http://accessorydwellings.files.wordpress.com/2014/04/portlandcity2011.xlsx.
———. 2013c. “Median and Average Square Feet of Floor Area in New Single-Family Houses Completed by Location.” http://www.census.gov/construction/chars/pdf/medavgsqft.pdf.
———. 2014a. “American Housing Survey.” American Housing Survey. Accessed April 23. http://www.census.gov/programs-surveys/ahs/.
———. 2011b. “Average Population per Household and Family: 1940 to Present [Table HH-6].” Accessed July 12. http://www.census.gov/population/socdemo/hh-fam/hh6.xls.

47
US Department of Housing and Urban Development. 2014. “Affordable Housing - CPD - HUD.” Accessed February 17. http://portal.hud.gov/hudportal/HUD?src=/program_offices/comm_planning/affordablehousing/.
Wegmann, Jake, and Karen Chapple. 2012. “Understanding the Market for Secondary Units in the East Bay”, October. http://escholarship.org/uc/item/9932417c.pdf.
Wegmann, Jake, and Alison Nemirow. 2011. “Secondary Units and Urban Infill: A Literature Review”. Berkeley Institute of Urban and Regional Development Working Paper 2011-02. Berkeley Institute of Urban and Regional Development Working Paper. University of California. http://iurd.berkeley.edu/publications/wp/2011-02.pdf.
westchester dad. 2009. “The Case against Accessory Dwelling Units and Other Growth Tools.” WestchesterParents. http://westchesterparents.org/?p=2325.
Wood, Shawn. 2013. “Building Permits 1995 to 2012 [Microsoft Excel File].”