abundance and genetic diversity of aerobic anoxygenic ...aem.asm.org/content/78/8/2858.full.pdf ·...
TRANSCRIPT

Abundance and Genetic Diversity of Aerobic Anoxygenic PhototrophicBacteria of Coastal Regions of the Pacific Ocean
Anna E. Ritchiea* and Zackary I. Johnsonb
University of Hawaii, Department of Oceanography, Honolulu, Hawaii, USA,a and Marine Laboratory, Nicholas School of the Environment, Duke University, Beaufort, NorthCarolina, USAb
Aerobic anoxygenic phototrophic (AAP) bacteria are photoheterotrophic microbes that are found in a broad range of aquaticenvironments. Although potentially significant to the microbial ecology and biogeochemistry of marine ecosystems, their abun-dance and genetic diversity and the environmental variables that regulate these properties are poorly understood. Using samplesalong nearshore/offshore transects from five disparate islands in the Pacific Ocean (Oahu, Molokai, Futuna, Aniwa, and LordHowe) and off California, we show that AAP bacteria, as quantified by the pufM gene biomarker, are most abundant near shoreand in areas with high chlorophyll or Synechococcus abundance. These AAP bacterial populations are genetically diverse, withmost members belonging to the alpha- or gammaproteobacterial groups and with subclades that are associated with specific en-vironmental variables. The genetic diversity of AAP bacteria is structured along the nearshore/offshore transects in relation toenvironmental variables, and uncultured pufM gene libraries suggest that nearshore communities are distinct from those off-shore. AAP bacterial communities are also genetically distinct between islands, such that the stations that are most distantly sep-arated are the most genetically distinct. Together, these results demonstrate that environmental variables regulate both theabundance and diversity of AAP bacteria but that endemism may also be a contributing factor in structuring these communities.
Aerobic anoxygenic phototrophic (AAP) bacteria are photo-heterotrophic microbes, a group whose members use both
organic substrates and light energy for their carbon and energyrequirements, and they are found in a diverse range of aquaticenvironments. AAP bacteria harvest light with the pigment bacte-riochlorophyll a (BChl a), a distinct form of chlorophyll a notfound in oxygenic photosynthetic microbes and also not readilyquantified. Therefore, although potentially important, theirabundance, ecology, and contribution to the carbon cycle are notwell understood (24, 25, 43). Genomic evidence and physiologicalcharacterization have shown AAP bacteria to have diverse physi-ologies and metabolic potentials, including nitrification, carbondioxide fixation, utilization of low-molecular-weight organic car-bon, growth optimization on complex organic carbon sources,light-enhanced cellular growth, a preference for suboxic environ-ments, and large amounts of carotenoids (12–14, 32). These char-acteristics may confer an advantage in inhabiting a wide variety ofhabitats with great environmental variability.
AAP bacteria have been found in a range of aquatic environ-ments, including freshwater environments, marine environ-ments, soil, hot springs, Antarctic lakes, and hydrothermal vents(11, 28, 43, 59). In the marine environment, they typically accountfor �1 to 3% of the total prokaryotic abundance (49) and havebeen found in both coastal and open ocean environments, includ-ing brackish waters (7, 8, 50). However, the abundance of AAPbacteria can range more dramatically (15, 27), and in some coastalmesotrophic estuaries, the abundance of AAP bacteria often ex-ceeds 10% (49, 54). These high abundances may be driven by theassociation of AAP bacteria with particles that are often numerousin these environments (9, 30), but AAP bacteria are positivelycorrelated with chlorophyll a in a variety of environments, sug-gesting that productivity may also drive their abundance (21, 63).In two eutrophic estuaries, light attenuation, nitrate, and ammo-nium are also positively correlated with AAP bacteria, further sup-porting a link with productivity or its associated particles (55).
However, AAP bacteria account for nearly 25% of the total pro-karyotic population in the hyperoligotrophic South Pacific Ocean(29), suggesting that other environmental variables may also beimportant and that there is a broad range of potential ecologicalniches for these microbes.
AAP bacteria are members of the Proteobacteria phylum ofbacteria, and based on genomic and other single-locus evi-dence, they are closely related to anaerobic photosynthetic bac-teria that also contain BChl (5, 58). Evidence from culture-dependent and -independent studies has shown AAP bacteriato be broadly genetically diverse, with members in the Alpha-,Beta-, and Gammaproteobacteria subclasses (4, 46). Phyloge-netic relationships among small-subunit (SSU) rRNA genesand core photosynthetic marker genes, including the pufMgene, are incongruent, suggesting that lateral transfer of thephotosynthesis superoperon has produced a highly diversepopulation of organisms with the same photosynthetic systemand pigments (39, 59). Both targeted (21, 55, 61) and nontar-geted (62) metagenomic studies have shown that depending onthe location and environment, members of either the Alpha- orGammaproteobacteria subclass typically dominate the AAPbacterial community. For example, in the Baltic Sea, most AAPbacteria were gammaproteobacteria (37), while in the GlobalOcean Sampling (GOS) expedition, the Roseobacter-like groupof alphaproteobacteria dominated the oligotrophic AAP bacte-
Received 21 July 2011 Accepted 23 January 2012
Published ahead of print 3 February 2012
Address correspondence to Zackary I. Johnson, [email protected].
* Present address: Synthetic Genomics, La Jolla, California, USA.
Supplemental material for this article may be found at http://aem.asm.org/.
Copyright © 2012, American Society for Microbiology. All Rights Reserved.
doi:10.1128/AEM.06268-11
2858 aem.asm.org 0099-2240/12/$12.00 Applied and Environmental Microbiology p. 2858–2866
on October 31, 2018 by guest
http://aem.asm
.org/D
ownloaded from
rial community (62). In addition, the GOS expedition revealedadditional groups throughout the Atlantic and Pacific Oceansthat have not been cultured. Thus, AAP bacteria are nowknown to be far more genetically diverse than originallythought (26).
Evidence from observations throughout the Atlantic and Pa-cific Oceans suggests that the abundance and diversity of AAPbacteria are structured along environmental gradients. For exam-ple, coastal and brackish waters appear to have unique clades ofAAP bacteria not found in the open ocean (62). Similarly, waterswith higher productivity, as indicated by high chlorophyll a con-centrations, have lower AAP bacterial diversity than more oligo-trophic waters (21). Conversely, there are no significant differ-ences between free-living and particle-attached AAP bacteria for agiven sampling location in some major estuaries, but among sam-pling locations, there are significant differences in genetic diver-sity (9). There is also substantial genetic variability among AAPbacterial samples from different locations in the Baltic Sea, includ-ing both fresh- and saltwater clades (37, 46), further suggestingthat AAP bacteria are genetically diverse and that this diversity hasbiogeographic and potentially phylogeographic patterns related toenvironmental variables. These prior results show that while en-vironmental variation may be important, there may also be ende-mism of AAP bacteria consistent with some of the original hy-potheses of island biogeography (35), suggesting that geographicdistance may play an important role in the ecological structuringof these microbial populations even though there are no apparentlimitations to planktonic dispersal in the oceans.
To test these hypotheses, we measured the abundance of AAPbacteria by quantitative PCR (qPCR) amplification of the pufMmarker gene along coastal environmental gradients at several lo-cations throughout the Pacific Ocean and over time at one loca-tion to assess the variability of this photoheterotrophic bacterialpopulation and to examine some of the environmental variablesthat may be controlling it. The genetic biodiversity of AAP bacte-ria, as assessed by the genetic diversity of the pufM gene, was com-pared along these gradients and between locations to explore therichness (alpha genetic diversity) and level of endemism (betagenetic diversity) of AAP bacterial populations. Like the SSUrRNA gene, the pufM gene is found in all AAP bacteria and hasboth conserved and variable regions, making it an excellent mo-lecular marker for quantifying the abundance and assessing thegenetic diversity of AAP bacteria (1, 49). We show that AAP bac-teria are most abundant near shore and that this is strongly corre-lated with chlorophyll and Synechococcus abundance. AAP bacte-rial populations are genetically diverse, and this diversity is alsocorrelated with environmental variables and location, suggestingthat both population abundance and genetic diversity are regu-lated by a combination of environmental variables and endemism.
MATERIALS AND METHODSSampling. Sampling of eight nearshore/offshore transects was conductedin the Pacific Ocean at the following locations: California (28.60°N,125.07°W), Aniwa (18.17°S, 169.25°E), Lord Howe (31.55°S, 159.08°E),Futuna (19.53°S, 170.22°E), Oahu (21.47°N, 157.98°W), Molokai(21.13°N, 157.03°W), and two locations in Kaneohe Bay, located on theisland of Oahu (21.46°N, 157.80°W). Surface water samples were collectedin opaque amber bottles for measurements of chlorophyll, salinity, nutri-ents, and DNA and for flow cytometry. Two of the nearshore/offshoretransects, located in Kaneohe Bay, were sampled three times (13 June2006, 4 August 2006, and 21 June 2007) (Fig. 1). In addition to surface
samples, two depth profiles were measured using samples collected withNiskin bottles mounted to a conductivity-temperature-depth (CTD)-equipped oceanographic rosette.
Environmental data and DNA. Temperature was recorded using ahandheld digital thermometer for Aniwa, Futuna, and Kaneohe Bay tran-sects. Kaneohe Bay salinity measurements were made in duplicate using arefractometer. Temperature and salinity measurements for California,Oahu, and Molokai transects were made using a calibrated CTD device.Size-fractionated (0.22 or 2.0 �m) chlorophyll concentrations were mea-sured by vacuum (�100 mm Hg) filtering 100-ml samples through poly-carbonate filters, with extraction in 100% methanol (MeOH) at �20°C inthe dark for �24 h (18). Fluorescence was measured using a Turner De-signs 10-AU fluorometer (56) that was calibrated with a standard chloro-phyll solution (45). Major macronutrients (level of detection, 1 �M) weremeasured as previously described (44). DNA was collected and extractedfollowing a commercial protocol (Qiagen, Valencia, CA), with the excep-tion of adding a 1-min bead beating step at 4,800 rpm with �0.25 g ofsterile 0.1-mm zirconium beads (Biospec, Bartlesville, OK) at the begin-ning of the protocol (65).
Quantitative PCR. Primers for pufM, which encodes the M subunit ofthe photosynthetic reaction center complex that is unique to BChl-con-taining bacteria, were pufM-557F (5=-TACGGSAACCTGTWCTAC-3=)and pufM_WAWR (5=-GCRAACCACCANGCCCA-3=) and were used toamplify an �240-bp fragment of the pufM gene (55, 60). The reactionmixture consisted of 2.5 �l of DNA, 1� SYBR iTaq supermix (Bio-Rad),and 0.1 �M (each) primers in a 25-�l volume, and the PCR protocol was95°C for 10 min and then 40 cycles of 95°C for 15 s, 56°C for 45 s, and 72°Cfor 45 s (55). Duplicate analytical replicates for duplicate DNA extractswere performed for all samples, and the initial concentration of templatewas determined based on qPCR standards. qPCR standards were madefrom cultures of Erythrobacter longus strain NJ3Y (23) cultivated in richmedium (F/2 medium [16], 0.5 g peptone liter�1, and 0.1 g yeast extractliter�1) at 30 �mol quanta m�2 s�1 on a 12-h–12-h light-dark cycle at25°C. Cultures were grown until the late log growth phase and were har-vested at �1 � 109 cells ml�1. Extracted DNA was serially diluted toproduce DNA standards equivalent to 10�1 to 107 cells ml�1. The averager2 value for standard curves from all qPCR runs was 0.99, and the ampli-fication efficiency was �100%. The mean standard detection limit was 37pufM copies ml�1. Sterilized water and DNAs from AlteromonasUH00601 (38) and Prochlorococcus MIT9312, both equivalent to 106 cellsml�1, were used as negative controls.
Flow cytometry. Subsamples for flow cytometry were collected andfrozen with 0.125% glutaraldehyde at �80°C (53) for later analysis ofprokaryotic phytoplankton (Prochlorococcus and Synechococcus) (22).Samples stained with 1� SYBR green I (Invitrogen, Carlsbad, CA) for 30min in the dark before processing were used to measure the total bacte-rioplankton or “bacteria” (36).
Diversity of pufM genes. Six clone libraries were constructed usingthe pufM-557F and pufM_WAW primers and the following PCR condi-tions: 95°C for 10 min and then 40 cycles of 95°C for 15 s, 56°C for 45 s,and 72°C for 45 s. Twenty-five-microliter PCR mixtures contained 1�buffer, 15 mM MgCl2, 0.1 �M (each) primers, 6.3 units of Jump Start Taq(Sigma), and 2.5 �l of DNA. For each library, triplicate PCR mixtureswere pooled, and bands were gel extracted (Qiagen) and sequenced on anABI 3730XL capillary sequencer after being ligated to the TOPO-TA vec-tor (Invitrogen) and cloned into Escherichia coli following the manufac-turer’s recommended protocol. Sequences were manually curated usingSequencher (GeneCodes) and aligned in ARB (34), and library sizesranged from 43 to 47 sequences.
Dissociation curves. Dissociation curves for pufM amplicons fromqPCR were drawn by quantifying the change in amplicon concentration(fluorescence) as the temperature increased from 56 to 95°C at 0.2°C pers. The change in fluorescence with temperature was calculated using themanufacturer’s software (Applied Biosystems) and exported for furtheranalysis. Replicate dissociation curves were averaged and normalized to
Coastal Pacific AAP Bacterial Abundance and Diversity
April 2012 Volume 78 Number 8 aem.asm.org 2859
on October 31, 2018 by guest
http://aem.asm
.org/D
ownloaded from

maximum abundance, and major peaks were identified by the locationswhere the slope of the curve was zero. In addition to dissociation curvesfor environmental DNA, dissociation curves were also made for 10 clonesfrom each pufM clone library to determine the phylogenetic association ofmajor dissociation curve peaks.
Data handling and analyses. Means and standard deviations arereported for all replicated data. Environmental variables were consid-ered “high” when they were �1 standard deviation above the mean.Correlations and Spearman rank values were calculated using Minitab.Gene fragment libraries were analyzed with MOTHUR (48) to com-pare numbers of shared operational taxonomic units (OTUs) amongvarious environments, Shannon diversity indices, and Chao1 estima-tor values. Phylogenetic associations with environmental variables andlocation were determined using the UniFrac significance test and byimplementing the Bonferroni correction as well as using the environ-mental clustering option to cluster the environments based on phylo-genetic lineages that they contain (33). Each AAP bacterium was as-sumed to have 1 copy of the pufM gene (49, 64), and % AAP bacteria inthe total bacterial community was calculated by dividing the numberof AAP bacteria ml�1 (or pufM copies ml�1) by the total number ofbacteria ml�1 as enumerated by flow cytometry. Phylogenetic treeswere plotted using iTOL v2 (31).
Nucleotide sequence accession numbers. Nucleotide sequences weredeposited in GenBank under accession numbers JQ340498 to JQ340769.
RESULTS
Environmental variability. With the exception of California, allof the stations along the sampled transects are within 60 km ofshore. However, freshwater inputs are minimal for each of theseregions, and salinity varies only from 31 to 38. Temperatureranged between 17°C (California) and 28°C (Futuna and Aniwa)but varied little along the nearshore/offshore transects, with theexception of the Kaneohe Bay transects (sampled on 13 June2006), where temperatures were between 22°C and 27°C. For amajority of transects, the highest salinity and lowest temperatureswere observed offshore, but overall these gradients were notstrong. All of the stations sampled are oligotrophic, with PO4 andNO2 concentrations below the limit of detection (1 �M). How-ever, nitrate was detectable in 25 of 59 locations and varied from 1to 3.3 �M NO3, but this was not correlated with distance fromshore.
Total chlorophyll a was highest in Kaneohe Bay (some stationshad �3 �g Chl a liter�1) but was low (�0.5 �g Chl a liter�1) forother transects, and for all transects, the concentration decreasedwith distance from shore. Total bacterial concentrations rangedfrom 1.3 � 105 to 3.2 � 106 cells ml�1 and averaged (9.4 � 5.3) �
FIG 1 Locations of sampling stations. (A) Islands of Oahu and Molokai (HI), with an expanded view of Kaneohe Bay (inset); (B) California; (C) Island of Futuna;(D) Island of Aniwa; (E) Lord Howe Island.
Ritchie and Johnson
2860 aem.asm.org Applied and Environmental Microbiology
on October 31, 2018 by guest
http://aem.asm
.org/D
ownloaded from
105 cells ml�1. The abundance of Prochlorococcus, which rangedfrom 2.4 � 103 to 1.2 � 105 cells ml�1, comprised �1 to 28% ofthe total bacterial community. The abundance of Synechococcusvaried from 70 to 6.7 � 105 cells ml�1 and comprised �1 to 22%of the total bacterial community. Synechococcus was most abun-dant in Kaneohe Bay and least abundant near the oligotrophicwaters of Futuna, Aniwa, Oahu, and Molokai. Due to the differenthorizontal (length) scales of environmental variability for the var-ious transects, the abundances of Prochlorococcus, Synechococcus,and total bacteria were not correlated with the distance from shoreor with NO3 concentrations.
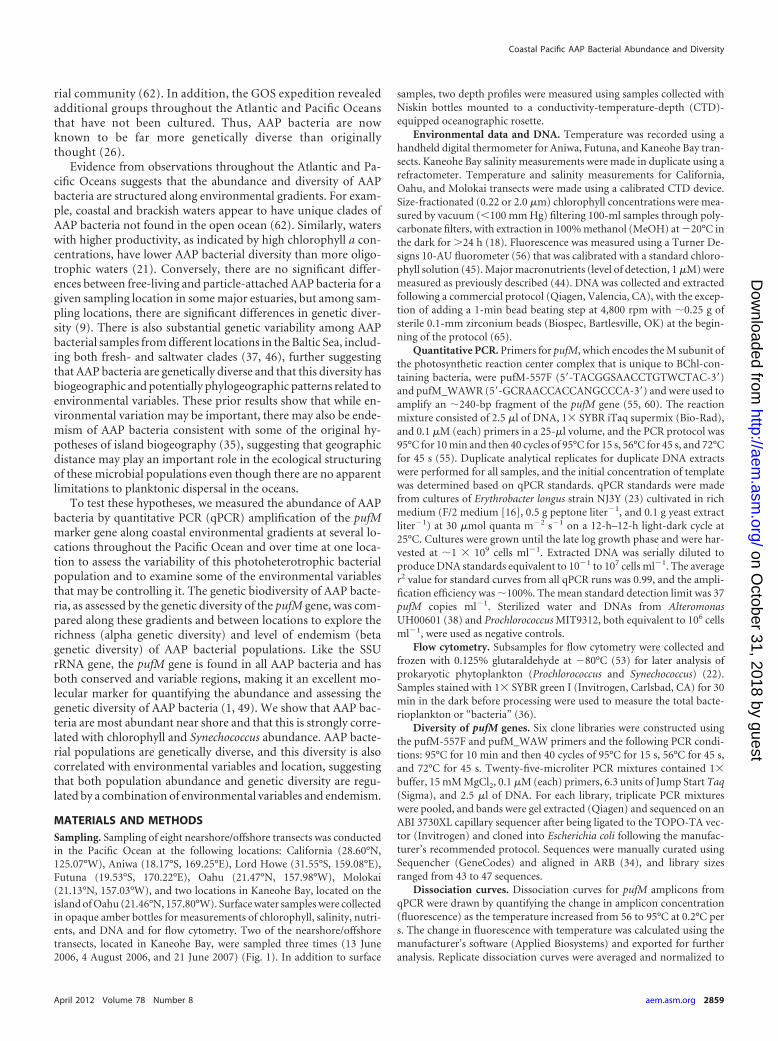
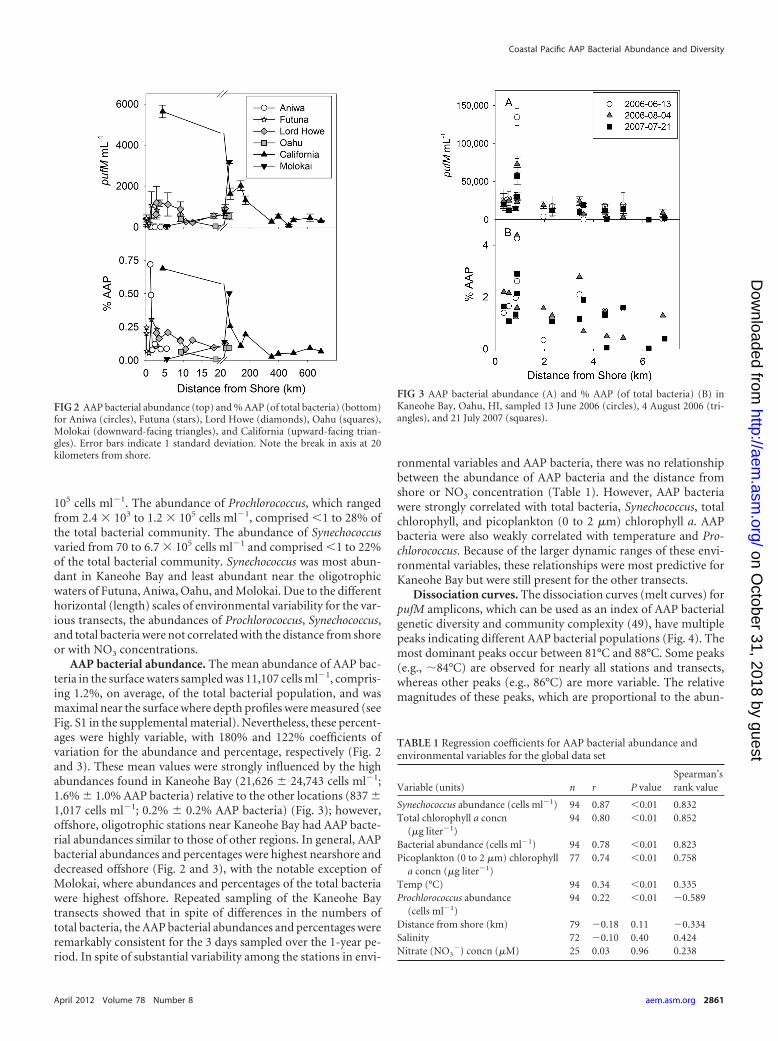
AAP bacterial abundance. The mean abundance of AAP bac-teria in the surface waters sampled was 11,107 cells ml�1, compris-ing 1.2%, on average, of the total bacterial population, and wasmaximal near the surface where depth profiles were measured (seeFig. S1 in the supplemental material). Nevertheless, these percent-ages were highly variable, with 180% and 122% coefficients ofvariation for the abundance and percentage, respectively (Fig. 2and 3). These mean values were strongly influenced by the highabundances found in Kaneohe Bay (21,626 � 24,743 cells ml�1;1.6% � 1.0% AAP bacteria) relative to the other locations (837 �1,017 cells ml�1; 0.2% � 0.2% AAP bacteria) (Fig. 3); however,offshore, oligotrophic stations near Kaneohe Bay had AAP bacte-rial abundances similar to those of other regions. In general, AAPbacterial abundances and percentages were highest nearshore anddecreased offshore (Fig. 2 and 3), with the notable exception ofMolokai, where abundances and percentages of the total bacteriawere highest offshore. Repeated sampling of the Kaneohe Baytransects showed that in spite of differences in the numbers oftotal bacteria, the AAP bacterial abundances and percentages wereremarkably consistent for the 3 days sampled over the 1-year pe-riod. In spite of substantial variability among the stations in envi-
ronmental variables and AAP bacteria, there was no relationshipbetween the abundance of AAP bacteria and the distance fromshore or NO3 concentration (Table 1). However, AAP bacteriawere strongly correlated with total bacteria, Synechococcus, totalchlorophyll, and picoplankton (0 to 2 �m) chlorophyll a. AAPbacteria were also weakly correlated with temperature and Pro-chlorococcus. Because of the larger dynamic ranges of these envi-ronmental variables, these relationships were most predictive forKaneohe Bay but were still present for the other transects.
Dissociation curves. The dissociation curves (melt curves) forpufM amplicons, which can be used as an index of AAP bacterialgenetic diversity and community complexity (49), have multiplepeaks indicating different AAP bacterial populations (Fig. 4). Themost dominant peaks occur between 81°C and 88°C. Some peaks(e.g., �84°C) are observed for nearly all stations and transects,whereas other peaks (e.g., 86°C) are more variable. The relativemagnitudes of these peaks, which are proportional to the abun-
FIG 2 AAP bacterial abundance (top) and % AAP (of total bacteria) (bottom)for Aniwa (circles), Futuna (stars), Lord Howe (diamonds), Oahu (squares),Molokai (downward-facing triangles), and California (upward-facing trian-gles). Error bars indicate 1 standard deviation. Note the break in axis at 20kilometers from shore.
FIG 3 AAP bacterial abundance (A) and % AAP (of total bacteria) (B) inKaneohe Bay, Oahu, HI, sampled 13 June 2006 (circles), 4 August 2006 (tri-angles), and 21 July 2007 (squares).
TABLE 1 Regression coefficients for AAP bacterial abundance andenvironmental variables for the global data set
Variable (units) n r P valueSpearman’srank value
Synechococcus abundance (cells ml�1) 94 0.87 �0.01 0.832Total chlorophyll a concn
(�g liter�1)94 0.80 �0.01 0.852
Bacterial abundance (cells ml�1) 94 0.78 �0.01 0.823Picoplankton (0 to 2 �m) chlorophyll
a concn (�g liter�1)77 0.74 �0.01 0.758
Temp (°C) 94 0.34 �0.01 0.335Prochlorococcus abundance
(cells ml�1)94 0.22 �0.01 �0.589
Distance from shore (km) 79 �0.18 0.11 �0.334Salinity 72 �0.10 0.40 0.424Nitrate (NO3
�) concn (�M) 25 0.03 0.96 0.238
Coastal Pacific AAP Bacterial Abundance and Diversity
April 2012 Volume 78 Number 8 aem.asm.org 2861
on October 31, 2018 by guest
http://aem.asm
.org/D
ownloaded from

dances of the populations they represent, change among transectsand along transects. Some transects, such as the California tran-sect, have increasing numbers of dissociation curve peaks andassociated AAP bacterial community complexity with distancefrom shore. Other transects, such as the Lord Howe, Oahu, andMolokai transects, have clusters that dominate specific regionsalong the transect, with no clear trends in the complexity of thecommunity. Nearshore transects with a finer spatial scale gener-ally have similar patterns to those of the larger-scale transects (seeFig. S2 in the supplemental material), and overall, these dissocia-tion curves suggest a complex AAP bacterial community whichmay be structured along environmental gradients.
pufM diversity. Community complexity was examined furtherusing clone libraries from nearshore and offshore stations fromselected transects. Specifically, representative samples from Aniwa(AN1 and AN6), California (CA2 and CA5), and Oahu (OA1 andOA3) were selected because of the geographic distance betweensampling sites and because their dissociation curves have uniquecommunity profiles among nearshore and offshore stations bothwithin a transect and between transects (see Fig. S3 in the supple-mental material). For Oahu and California, the vast majority(�95%) of sequences identified through BLAST (BLASTn)searches (3) using the NCBI nr/nt database were most similar to
uncultured representatives, whereas for Aniwa, 32% of the se-quences were most similar to pufM sequences from cultured rep-resentative members of the Rhodobacter, Roseobacter, and Eryth-robacter genera. Clones were highly diverse, and the distancebetween major clades ranged from 80% to �94% sequence iden-tity (Fig. 5; see Fig. S4 in the supplemental material). Most of thetop hits for sequences that were BLAST searched against the ref-seq_genomic NCBI database were either gammaproteobacterial(95 sequences) or alphaproteobacterial (109 sequences) se-quences, and only 5 sequences were most similar to betaproteo-bacterial sequences. Another 46 sequences, mostly from the Cali-fornia libraries, were not similar to any cultured representative inthis database but were similar to other environmental pufM se-quences found in the NCBI nr/nt database. Phylogenetic assign-ments based on similarity to cultured representatives are incon-gruent with the pufM phylogeny.
Regardless of the sequence similarity level used for comparison,Aniwa, California, and Oahu have comparable levels of alpha diver-sity (richness). For example, in comparing unique sequences, therewere 227 � 165, 252 � 234, and 314 � 274 OTUs, respectively,determined by the Chao1 richness estimator. However, much of thisbiodiversity is at the fine genetic scale (i.e., microdiversity), and at the97% similarity level, Aniwa, California, and Oahu had many fewer
FIG 4 Dissociation curves as a function of distance from shore for California, Lord Howe, Oahu, and Molokai. Multiple curves in a given plot indicate thatmultiple stations were sampled within the distance bin.
Ritchie and Johnson
2862 aem.asm.org Applied and Environmental Microbiology
on October 31, 2018 by guest
http://aem.asm
.org/D
ownloaded from

OTUs (56 � 62, 27 � 22, and 29 � 31, respectively). Nevertheless,because the rarefaction curves for these clone libraries did not fullysaturate (Good’s coverage of 82%, 92%, and 90%, respectively, at97% similarity), the precise number of OTUs remains unconstrainedfor these locations. Among the island locations, there was only oneunique sequence (OTU) shared between California and Oahu. How-ever, at the 97% similarity level, 29% of the OTUs found in Californiawere also found in Oahu. Twenty-nine percent of the OTUs found inOahu were also found in Aniwa, but only 1 OTU was shared betweenAniwa and California. Thus, from the Eastern to Western Pacific,there may be some overlap in the genetic biodiversity of AAP bacteriabetween “adjacent” locations, but this does not appear to extend tothe stations separated by the most distance. Similarly, only 3 se-quences were shared between the offshore and nearshore stations ofOahu, 1 between the offshore and nearshore stations of Aniwa, andnone between the stations of California, and at 97% similarity, 2OTUs were shared between the offshore and nearshore stations ofAniwa, 1 between the stations of California, and 6 between the sta-tions of Oahu. Comparing offshore and nearshore stations collec-tively among islands, 5 of the sequences were shared between all sites(�3% of the total), whereas at the 97% similarity level, 30% of theOTUs found nearshore were also found offshore. The nearshore andoffshore environments had significantly different (P � 0.01) phylo-genetic distributions of AAP bacteria as well as reduced Shannon
diversity at the 97% similarity level offshore (unique level, 4.6 � 0.2versus 4.6�0.2; 97% level, 3.4�0.2 versus 2.7�0.2). These patternswere also apparent in OTUs or phylogenies (P � 0.01) for nearshoreor offshore samples for an individual island (Fig. 5; see Fig. S4 in thesupplemental material). Thus, in comparing the AAP bacterialcommunities (57) among the nearshore and offshore stationsat different locations, it is clear that the communities differbroadly and that there is relatively high beta diversity (ende-mism) among the locations (Fig. 5).
Community structure and environmental variability. In ad-dition to significant clustering among nearshore and offshorepufM gene fragments, there were also associations among otherenvironmental variables and pufM phylogeny (Fig. 5). Among theenvironmental variables measured, Synechococcus, total bacteria,and chlorophyll a were the variables most strongly correlated withAAP bacterial abundances, and these variables were used to ex-plore the relationships with pufM phylogeny. Specific clades ofpufM were significantly (P � 0.01) associated with high abun-dances of Synechococcus, total bacteria, and chlorophyll. However,there was no statistical difference in the number of unique or 97%similar OTUs present for high or normal levels of Synechococcus,total bacteria, and chlorophyll. Yet the Shannon diversity indicesfor unique and 97% similar OTUs were reduced in areas with highSynechococcus (unique level, 3.1 � 0.3 versus 5.1 � 0.1; 97% level,
FIG 5 Phylogenetic relationships (neighbor joining) of pufM gene fragments (240 bp) with associated environmental data. The outside red ring shows relativeSynechococcus abundances, the gold ring shows relative total bacterial abundances, the cyan ring shows relative chlorophyll a concentrations, the multicolorlocation ring indicates the island where each clone was found (blue, Aniwa; green, California; red, Oahu), and the nearshore/offshore ring indicates the proximityof the sample location to shore (light gray, nearshore; dark gray, offshore).
Coastal Pacific AAP Bacterial Abundance and Diversity
April 2012 Volume 78 Number 8 aem.asm.org 2863
on October 31, 2018 by guest
http://aem.asm
.org/D
ownloaded from

1.5 � 0.3 versus 3.3 � 0.2) or chlorophyll (unique level, 3.5 � 0.2versus 5.1 � 0.1; 97% level, 1.5 � 0.2 versus 3.5 � 0.1) concen-trations. A high abundance of total bacteria also reduced the Shan-non diversity indices of AAP bacteria, but less dramatically(unique level, 4.0 � 0.2 versus 4.9 � 0.1; 97% level, 2.6 � 0.2versus 3.1 � 0.2).
Dissociation curves for selected clone library sequences. Dis-sociation curves were measured for selected pufM clones to iden-tify the major clades that contributed to the original dissociationcurve temperature peaks (Fig. 4) and to verify that the patternsobserved for the dissociation curves are representative of the ge-netic diversity of pufM in the community. Most clusters had dis-tinct temperature ranges that represented one of the major peaksfound in the dissociation curve from the original community (seeFig. S4 in the supplemental material). However, some clades hadmultiple temperature peaks or a range of temperature peaks, anda few clades had dissociation curve peaks that were not repre-sented in the original dissociation curve. For example, gene frag-ment libraries from the nearshore station from California (CA2)had four phylogenetic clusters, and dissociation curves for theseclusters had temperature peaks from 84 to 86°C (see Fig. S4). Thisis consistent with the major broad peak at �85.5°C in the originaldissociation curve. However, two nearshore peaks (82 and 83°C)from the original dissociation curve were not present for the pufMclones sampled. The offshore station from California (CA5) hadone phylogenetic cluster with temperatures representing the ma-jor dissociation peak at �83°C for the community curve. Otherpeaks, found at �86°C and associated with sequences from off-shore California sequences, were also consistent with the se-quence-based community profile. Dissociation curves generatedfrom clones from major clades found in Aniwa and Oahu weresimilarly consistent with the whole-community dissociation curveprofiles generated from these locations. Comparisons between theislands indicate that the dissociation curve temperature peaks can-not be assigned to a specific taxonomic group or clade but areindicative of unique groups of pufM sequences and, therefore,AAP bacterial populations.
DISCUSSION
AAP bacterial abundance was generally greatest nearshore, partic-ularly in Kaneohe Bay, Oahu, HI. Among the sites sampled,Kaneohe Bay is unique, with two river inputs (southern and cen-tral bay) which do not significantly affect the local salinity but dosubstantially affect the turbidity (10). AAP bacteria have been re-ported to be influenced by river inputs due to increased particleloads, decreased light attenuation, potential freshwater reservoirsof AAP bacteria, and changes in salinity (55). For example, in theDelaware and Chesapeake Estuaries, the highest AAP bacterialabundance was associated with turbidity maxima and AAP bacte-rial abundance was correlated with light attenuation and particles(55). However, in addition to levels of turbidity, other aspects ofhabitat type are also important: grouping island habitats into la-goons protected by barrier reefs (Kaneohe Bay, Lord Howe, andAniwa) and comparing those to islands with steep cliffs and fring-ing reefs (Futuna and Molokai) confirmed that the abundance ofAAP bacteria decreases with distance from shore for islands withbarrier reefs, in contrast to islands with steep cliffs, which have nodistinct patterns (or the highest abundance furthest from shore).Similarly, distributions of AAP bacteria near Kaneohe Bay’s riverinputs may be associated with benthic habitats that influence the
residence time of coastal waters or resuspension of particles. Theabundance of AAP bacteria and their contribution to the totalbacterioplankton reported here are consistent with results re-ported by others for a wide variety of environments (49). Ournumbers are from a pufM qPCR-based approach; thus, any inef-ficiencies in DNA extraction or limitations of the oligonucleotideprimers in capturing the suite of diversity of AAP bacteria couldlead to an underestimation of the true abundance. Therefore, ournumbers should be viewed as lower estimates of the actual contri-bution of AAP bacteria to the total microbial community.
While there were some relationships between AAP bacteriaand physical variables or distance to shore, the strongest correla-tions were observed for the biological variables measured, includ-ing chlorophyll, Synechococcus, and total bacteria (Table 1). Asso-ciations with chlorophyll have been well documented since theinitial discovery of AAP bacteria in the open ocean (15, 27); how-ever, the mechanism underlying this association is still not known.Since AAP bacteria are mixotrophic, this tight coupling could bedriven by their dependence on dissolved organic matter (DOM)derived from leaky or lysed phytoplankton cells (59). AlthoughAAP bacterial abundance was also strongly correlated with totalbacterial abundance (Table 1) and the broader bacterioplanktoncommunity increased with phytoplankton abundance, the per-cent contribution of AAP bacteria to the total bacterioplanktoncommunity also increased near shore (Fig. 2), suggesting that thisstimulation disproportionately favors AAP bacteria.
DOM derived from phytoplankton is complex, and biologicalcommunities that utilize freshly produced DOM vary dependingon the constituents of the DOM pool produced (17, 47, 52). Dif-ferent taxa of phytoplankton can alter bacterioplankton commu-nity composition due to the production of preferred DOM (42).For this study, Kaneohe Bay was the most eutrophic site sampled,and its phytoplankton community is dominated by Synechococcus(10); AAP bacteria were most abundant at that location. For theother locations, phytoplankton communities were dominated byProchlorococcus and AAP bacteria were less abundant, suggestingthat AAP bacteria may be stimulated specifically by DOM pro-duced by Synechococcus. Alternatively, AAP bacteria may have asimilar (or overlapping) ecological niche to that of Synechococcus.Globally, Synechococcus bacteria are most abundant near coastalupwelling regions and other dynamic mesotrophic environments(51, 66, 67). Similar patterns have been described for AAP bacte-ria, suggesting that similar mechanisms may control these twobacterial groups (49). Genomic analyses revealed that some cladesof Synechococcus are capable of using phototrophic and hetero-trophic metabolisms (41), further suggesting that they may utilizesimilar resources to those of AAP bacteria. These two hypothesesare not mutually exclusive.
In addition to varying in abundance, the AAP bacterial popu-lation was genetically diverse as characterized by both gene frag-ment libraries and qPCR dissociation curves, and this diversitywas structured geographically and along environmental gradients(Fig. 4 and 5). For example, the presence/absence and magnitudeof specific peaks of dissociation curves changed along with dis-tance from shore along environmental gradients both within anisland transect and between island locations (Fig. 4). Also, pufMfragment libraries from select locations showed that specific cladesof AAP bacteria were associated with specific environmental con-ditions. Together, these results demonstrate that the changes ob-served for abundance also had associated changes in AAP bacterial
Ritchie and Johnson
2864 aem.asm.org Applied and Environmental Microbiology
on October 31, 2018 by guest
http://aem.asm
.org/D
ownloaded from

population genetic diversity. Similar to previous studies of otheroceanographic regions, most of the AAP bacteria sampled herebelonged to the alpha- and gammaproteobacterial subclasses (37,60, 62), although �20% could not be assigned definitively. Inaddition, because it is likely that the photosynthetic genes can betransferred laterally (39), we cannot exclude the possibility ofsome misassignments of AAP bacteria to subclasses, althoughthese were likely rare in the context of this ecological study.Among the assigned subclasses, there is substantial genetic vari-ability in both coastal and open ocean environments (6, 19, 40,62). Like the case for other marine bacteria, much of this geneticdiversity is found at the microscale (2), as only 27 (California) to56 (Aniwa) OTUs are predicted at the 97% level, whereas there are�200 OTUs predicted at the 100% identity level for all of thelocations. However, even at 97% similarity, there is biogeo-graphic partitioning among populations, with Oahu sharingOTUs with both Aniwa and California but with no substantialoverlap for the more distant Aniwa and California sites. Simi-larly, open ocean AAP bacterial communities are distinct fromthose from nearshore sites, both within an island transect andbetween islands. These results are consistent with phylogeo-graphic partitioning of OTUs and general island biogeographytheory (35). Yet this genetic diversity of AAP bacteria is struc-tured along environmental gradients (Fig. 5), and similar to thecase with other model bacteria, specific clades of AAP bacteriaare associated with environmental variables (20, 21). In partic-ular, some clades of AAP bacteria that are associated with high(or low) levels of bacterioplankton, chlorophyll, or Synechoc-occus may be regulated by associations with DOM or otherrelated environmental variables. Together, these results dem-onstrate that environmental variables regulate both the abun-dance and diversity of AAP bacteria but that endemism mayalso be a contributing factor in structuring the genetic diversityof these communities. Exhaustive sampling of the AAP bacte-rial community diversity at geographically discrete locationswould distinguish between the relative contributions of thesedistinct but important processes in regulating the abundanceand diversity of AAP bacterial communities in marine environ-ments.
ACKNOWLEDGMENTS
This work was supported by funds from the U.S. National Science Foun-dation (OCE05-26462, OCE05-50798, and OCE10-31064).
We acknowledge Susan Brown and Mathew Church for critical read-ings of prior versions of this work, Jerome Aucan for Kaneohe Bay ba-thymetry data, and Kevin Bartlett for help with quantitative analysis. Wealso acknowledge helpful comments from the anonymous reviewers.
REFERENCES1. Achenbach LA, Carey J, Madigan MT. 2001. Photosynthetic and phylo-
genetic primers for detection of anoxygenic phototrophs in natural envi-ronments. Appl. Environ. Microbiol. 67:2922–2926.
2. Acinas SG, et al. 2004. Fine-scale phylogenetic architecture of a complexbacterial community. Nature 430:551–554.
3. Altschul SF, et al. 1997. Gapped BLAST and PSI-BLAST: a new genera-tion of protein database search programs. Nucleic Acids Res. 25:3389 –3402.
4. Beja O, et al. 2002. Unsuspected diversity among marine aerobic anoxy-genic phototrophs. Nature 415:630 – 633.
5. Bryant DA, Frigaard N-U. 2006. Prokaryotic photosynthesis and phot-otrophy illuminated. Trends Microbiol. 14:488 – 496.
6. Cho JC, et al. 2007. Polyphyletic photosynthetic reaction centre genes in
oligotrophic marine gammaproteobacteria. Environ. Microbiol. 9:1456 –1463.
7. Cottrell MT, Kirchman DL. 2009. Photoheterotrophic microbes in theArctic Ocean in summer and winter. Appl. Environ. Microbiol. 75:4958 –4966.
8. Cottrell MT, Mannino A, Kirchman DL. 2006. Aerobic anoxygenicphototrophic bacteria in the Mid-Atlantic Bight and the North PacificGyre. Appl. Environ. Microbiol. 72:557–564.
9. Cottrell MT, Ras J, Kirchman DL. 2010. Bacteriochlorophyll and com-munity structure of aerobic anoxygenic phototrophic bacteria in a parti-cle-rich estuary. ISME J. 4:945–954.
10. Cox EF, et al. 2006. Temporal and spatial scaling of planktonic responsesto nutrient inputs into a subtropical embayment. Mar. Ecol. Prog. Ser.324:19 –35.
11. Csotonyi JT, Swiderski J, Stackebrandt E, Yurkov V. 2010. A newenvironment for aerobic anoxygenic phototrophic bacteria: biological soilcrusts. Adv. Exp. Med. Biol. 675:3–14.
12. Denner EBM, et al. 2002. Erythrobacter citreus sp. nov., a yellow-pigmented bacterium that lacks bacteriochlorophyll a, isolated from thewestern Mediterranean Sea. Int. J. Syst. Evol. Microbiol. 52:1655–1661.
13. Fuchs BM, et al. 2007. Characterization of a marine gammaproteobacte-rium capable of aerobic anoxygenic photosynthesis. Proc. Natl. Acad. Sci.U. S. A. 104:2891–2896.
14. Gich F, Overmann J. 2006. Sandarakinorhabdus limnophila gen. nov., sp.nov., a novel bacteriochlorophyll a-containing, obligately aerobic bacte-rium isolated from freshwater lakes. Int. J. Syst. Evol. Microbiol. 56:847–854.
15. Goericke R. 2002. Bacteriochlorophyll a in the ocean: is anoxygenic bac-terial photosynthesis important? Limnol. Oceanogr. 47:290 –295.
16. Guillard RRL, Ryther JH. 1962. Studies of marine planktonic diatoms. I.Cyclotella nana Hustedt, and Detonula confervacea (Cleve) Gran. Can. J.Microbiol. 8:229 –239.
17. Hold GL, et al. 2001. Characterisation of bacterial communities associ-ated with toxic and non-toxic dinoflagellates: Alexandrium spp. andScrippsiella trochoidea. FEMS Microbiol. Ecol. 37:161–173.
18. Holm-Hansen O, Riemann B. 1978. Chlorophyll a determination: im-provements in methodology. Oikos 30:438 – 447.
19. Hu Y, Du H, Jiao N, Zeng Y. 2006. Abundant presence of the �-likeproteobacterial pufM gene in oxic seawater. FEMS Microbiol. Lett. 263:200 –206.
20. Hunt DE, et al. 2008. Resource partitioning and sympatric differentiationamong closely related bacterioplankton. Science 320:1081–1085.
21. Jiao N, et al. 2007. Distinct distribution pattern of abundance and diver-sity of aerobic anoxygenic phototrophic bacteria in the global ocean. En-viron. Microbiol. 9:3091–3099.
22. Johnson ZI, et al. 2010. The effects of iron- and light-limitation onphytoplankton communities of deep chlorophyll maxima of the WesternPacific Ocean. J. Mar. Res. 68:1–26.
23. Koblizek M, et al. 2003. Isolation and characterization of Erythrobactersp strains from the upper ocean. Arch. Microbiol. 180:327–338.
24. Koblizek M, Masin M, Ras J, Poulton AJ, Prasil O. 2007. Rapid growthrates of aerobic anoxygenic phototrophs in the ocean. Environ. Microbiol.9:2401–2406.
25. Kolber Z. 2007. Energy cycle in the ocean: powering the microbial world.Oceanography 20:79 – 88.
26. Kolber ZS, et al. 2001. Contribution of aerobic photoheterotrophic bac-teria to the carbon cycle in the ocean. Science 292:2492–2495.
27. Kolber ZS, Van Dover CL, Niederman RA, Falkowski PG. 2000. Bacte-rial photosynthesis in surface waters of the open ocean. Nature 407:177–179.
28. Labrenz M, Lawson PA, Tindal BJ, Collins MD, Hirsch P. 2005. Rosei-salinus antarcticus gen. nov., sp. nov., a novel aerobic bacteriochlorophylla-producing alpha-proteobacterium isolated from hypersaline Ekho Lake,Antarctica. Int. J. Syst. Evol. Microbiol. 55:41– 47.
29. Lami R, et al. 2007. High abundances of aerobic anoxygenic photosyn-thetic bacteria in the South Pacific Ocean. Appl. Environ. Microbiol. 73:4198 – 4205.
30. Lami R, Cuperova Z, Ras J, Lebaron P, Koblãzek M. 2009. Distributionof free-living and particle-attached aerobic anoxygenic phototrophic bac-teria in marine environments. Aquat. Microb. Ecol. 55:31–38.
31. Letunic I, Bork P. 2011. Interactive Tree Of Life v2: online annotation anddisplay of phylogenetic trees made easy. Nucleic Acids Res. 39:W475–W478.
Coastal Pacific AAP Bacterial Abundance and Diversity
April 2012 Volume 78 Number 8 aem.asm.org 2865
on October 31, 2018 by guest
http://aem.asm
.org/D
ownloaded from

32. Li Q, Jiao N, Peng Z. 2006. Environmental control of growth and BChl aexpression in an aerobic anoxygenic phototrophic bacterium, Erythrobac-ter longus (DSMZ6997). Acta Oceanol. Sin. 25:138 –144.
33. Lozupone C, Knight R. 2005. UniFrac: a new phylogenetic method forcomparing microbial communities. Appl. Environ. Microbiol. 71:8228 –8235.
34. Ludwig W, et al. 2004. ARB: a software environment for sequence data.Nucleic Acids Res. 32:1363–1371.
35. MacArthur RH, Wilson EO, Whittaker RH. 1967. The theory of islandbiogeography. Princeton University Press, Princeton, NJ.
36. Marie D, Partensky F, Jacquet S, Vaulot D. 1997. Enumeration and cellcycle analysis of natural populations of marine picoplankton by flow cy-tometry using the nucleic acid stain SYBR green I. Appl. Environ. Micro-biol. 63:186 –193.
37. Masín M, et al. 2006. Seasonal changes and diversity of aerobic anoxy-genic phototrophs in the Baltic Sea. Aquat. Microb. Ecol. 45:247–254.
38. Morris JJ, Kirkegaard R, Szul MJ, Johnson ZI, Zinser ER. 2008. Facil-itation of robust growth of Prochlorococcus colonies and dilute liquid cul-tures by “helper” heterotrophic bacteria. Appl. Environ. Microbiol. 74:4530 – 4534.
39. Nagashima K, Hiraishi A, Shimada K, Matsuura K. 1997. Horizontaltransfer of genes coding for the photosynthetic reaction centers of purplebacteria. J. Mol. Evol. 45:131–136.
40. Oz A, Sabehi G, Koblizek M, Massana R, Beja O. 2005. Roseobacter-likebacteria in Red and Mediterranean Sea aerobic anoxygenic photosyntheticpopulations. Appl. Environ. Microbiol. 71:344 –353.
41. Palenik B, et al. 2006. Genome sequence of Synechococcus CC9311: in-sights into adaptation to a coastal environment. Proc. Natl. Acad. Sci.U. S. A. 103:13555–13559.
42. Pinhassi J, et al. 2004. Changes in bacterioplankton composition underdifferent phytoplankton regimens. Appl. Environ. Microbiol. 70:6753–6766.
43. Rathgeber C, Beatty JT, Yurkov V. 2004. Aerobic phototrophic bacteria:new evidence for the diversity, ecological importance and applied poten-tial of this previously overlooked group. Photosynth. Res. 81:113–128.
44. Ringuet S, Sassano L, Johnson ZI. 2011. A suite of microplate reader-based colorimetric methods to quantify ammonium, nitrate, orthophos-phate and silicate concentrations for aquatic nutrient monitoring. J. En-viron. Monit. 13:370 –376.
45. Ritchie R. 2006. Consistent sets of spectrophotometric chlorophyllequations for acetone, methanol and ethanol solvents. Photosynth.Res. 89:27– 41.
46. Salka I, et al. 2008. Abundance, depth distribution, and composition ofaerobic bacteriochlorophyll a-producing bacteria in four basins of thecentral Baltic Sea. Appl. Environ. Microbiol. 74:4398 – 4404.
47. Schäfer H, Abbas B, Witte H, Muyzer G. 2002. Genetic diversity of‘satellite’ bacteria present in cultures of marine diatoms. FEMS Microbiol.Ecol. 42:25–35.
48. Schloss PD, et al. 2009. Introducing mothur: open-source, platform-independent, community-supported software for describing and compar-ing microbial communities. Appl. Environ. Microbiol. 75:7537–7541.
49. Schwalbach MS, Fuhrman JA. 2005. Wide-ranging abundances of aero-bic anoxygenic phototrophic bacteria in the world ocean revealed by epi-
fluorescence microscopy and quantitative PCR. Limnol. Oceanogr. 50:620 – 628.
50. Sieracki ME, Gilg IC, Thier EC, Poulton NJ, Goericke R. 2006. Distri-bution of planktonic aerobic anoxygenic photoheterotrophic bacteria inthe northwest Atlantic. Limnol. Oceanogr. 51:38 – 46.
51. Tai V, Palenik B. 2009. Temporal variation of Synechococcus clades at acoastal Pacific Ocean monitoring site. ISME J. 3:903–915.
52. Teira E, et al. 2008. Linkages between bacterioplankton community com-position, heterotrophic carbon cycling and environmental conditions in ahighly dynamic coastal ecosystem. Environ. Microbiol. 10:906 –917.
53. Vaulot D, Courties C, Partensky F. 1989. A simple method to preserveoceanic phytoplankton for flow cytometric analyses. Cytometry 10:629 –635.
54. Waidner LA, Kirchman DL. 2005. Aerobic anoxygenic photosynthesisgenes and operons in uncultured bacteria in the Delaware River. Environ.Microbiol. 7:1896 –1908.
55. Waidner LA, Kirchman DL. 2007. Aerobic anoxygenic phototrophicbacteria attached to particles in turbid waters of the Delaware and Chesa-peake estuaries. Appl. Environ. Microbiol. 73:3936 –3944.
56. Welschmeyer NA. 1994. Fluorometric analysis of chlorophyll a in thepresence of chlorophyll b and pheopigments. Limnol. Oceanogr. 39:1985–1992.
57. Yue JC, Clayton MK. 2005. A similarity measure based on species pro-portions. Commun. Stat. Theory Methods 34:2123–2131.
58. Yurkov V, Beatty JT. 1998. Isolation of aerobic anoxygenic photosyn-thetic bacteria from black smoker plume waters of the Juan de Fuca Ridgein the Pacific Ocean. Appl. Environ. Microbiol. 64:337–341.
59. Yurkov VV, Beatty JT. 1998. Aerobic anoxygenic phototrophic bacteria.Microbiol. Mol. Biol. Rev. 62:695–724.
60. Yutin N, Beja O. 2005. Putative novel photosynthetic reaction centreorganizations in marine aerobic anoxygenic photosynthetic bacteria: in-sights from metagenomics and environmental genomics. Environ. Micro-biol. 7:2027–2033.
61. Yutin N, et al. 2009. BchY-based degenerate primers target all types ofanoxygenic photosynthetic bacteria in a single PCR. Appl. Environ. Mi-crobiol. 75:7556 –7559.
62. Yutin N, et al. 2007. Assessing diversity and biogeography of aerobicanoxygenic phototrophic bacteria in surface waters of the Atlantic andPacific Oceans using the Global Ocean Sampling expedition meta-genomes. Environ. Microbiol. 9:1464 –1475.
63. Zhang Y, Jiao N. 2007. Dynamics of aerobic anoxygenic phototrophicbacteria in the East China Sea. FEMS Microbiol. Ecol. 61:459 – 469.
64. Zheng Q, et al. 2011. Diverse arrangement of photosynthetic gene clustersin aerobic anoxygenic phototrophic bacteria. PLoS One 6:e25050.
65. Zinser ER, et al. 2006. Prochlorococcus ecotype abundances in the NorthAtlantic Ocean revealed by an improved quantitative PCR method. Appl.Environ. Microbiol. 72:723–732.
66. Zwirglmaier K, et al. 2007. Basin-scale distribution patterns of picocya-nobacterial lineages in the Atlantic Ocean. Environ. Microbiol. 9:1278 –1290.
67. Zwirglmaier K, et al. 2008. Global phylogeography of marine Synecho-coccus and Prochlorococcus reveals a distinct partitioning of lineages amongoceanic biomes. Environ. Microbiol. 10:147–161.
Ritchie and Johnson
2866 aem.asm.org Applied and Environmental Microbiology
on October 31, 2018 by guest
http://aem.asm
.org/D
ownloaded from