about yuva parliamentary watch report
TRANSCRIPT

An analysis of questions asked on urban issues in the Indian Parliament in 2017
YUVA (Youth for Unity and Voluntary Action)www.yuvaindia.org
YUVA Centre Sector 7, Plot 23, Kharghar, Navi Mumbai – 410210 (India)
2017
Cityâð
Parliamentary Watch Report
About YUVA
Youth for Unity and Voluntary Action (YUVA) is a non-profit development organisation committed to enabling vulner-able groups to access their rights and address human rights violations. YUVA supports the formation of people’s collec-tives that engage in the discourse on development, thereby ensuring self-determined and sustained collective action in communities. This work is complemented with advocacy and policy recommendations on issues.

Suggested Citation:
Parliamentary Watch Report: An analysis of questions answered on urban issues in the Indian Parliament in 2017. City Say.
Youth for Unity and Voluntary Action (2018) Mumbai, India.
Published by:
YUVA (Youth for Unity and Voluntary Action)
YUVA Centre Sector 7, Plot 23, Kharghar
Navi Mumbai – 410210 (INDIA)

Parliamentary Watch Report
An analysis of questions asked on urban issues in the Indian Parliament in 2017

Youth for Unity and Voluntary Action (YUVA) is a non-profit development organisation that helps vulner-able groups access their rights. YUVA encourages the formation of people’s collectives to engage them in the development discourse. This work is complemented with advocacy and policy recommendations. Set up in Mumbai in 1984, currently YUVA operates in 5 Indian states.
Contributors: Shaguna Kanwar, Brishti Banerjee, Ankit Jha, Marina Joseph, Raju Bhise
Copy editing: Doel Jaikishen
Website: www.yuvaindia.org
Email: [email protected]
Twitter: @OfficialYUVA
Facebook: Youth for Unity and Voluntary Action - YUVA
Instagram: @OfficialYUVA
Blog: medium.com/@yuvaonline
Published by: YUVA (Youth for Unity and Voluntary Action)
YUVA Centre, Sector 7, Plot 23, Kharghar, Navi Mumbai – 410210 (INDIA)
Design: Mrityunjay Chatterjee
January 2018
CONTENTS
ABBREVIATIONS iv
LIST OF TABLES vi
FOREWORD vii
EXECUTIVE SUMMARY viii
INTRODUCTION xiii
CHAPTER 1 Smart Cities Mission 2
CHAPTER 2 Pradhan Mantri Awas Yojana (Urban) 10
CHAPTER 3 Swachh Bharat Mission 18
CHAPTER 4 Deendayal Antyodaya Yojana-National Urban Livelihoods Mission 24
CHAPTER 5 National Heritage City Development and Augmentation Yojana 30
CHAPTER 6 Deendayal Antyodaya Yojana-National Urban Livelihoods Mission 34
CHAPTER 7 Informal Workers - Analysis of Answers of the Ministry of Labour and Employment 42
REFERENCES 47
ANNEXURES 49

iv | YUVA
ABBREVIATIONSA&OE Administrative and Office Expenses
AABY Aam Aadmi Bima Yojana
ABD Area Based Development
AHP Affordable Housing in Partnership
AMRUT Atal Mission for Rejuvenation and Urban Transformation
BLS Beneficiary-led Households Scheme
CBUD Capacity Building in Urban Development
CEO Chief Executive Officer
CLS Credit Linked Subsidy
CSMC Central Sanctioning and Monitoring Committee
CSR Corporate Social Responsibility
DAY-NULM Deendayal Antyodaya Yojana-National Urban Livelihoods Mission
DDA Delhi Development Authority
DDU-GKY Deen Dayal Upadhyaya Grameen Kaushalya Yojana
DISHA District Development Coordination and Monitoring Committee
DLAMC District Level Legal Advisory and Monitoring Committee
DPRs Detailed Project Reports
EST&P Employment through Skills Training and Placement
EWS Economically Weaker Section
FAR: Floor Area Ratio
FDI Foreign Direct Investment
FSI Floor Space Index
GDP Gross Domestic Product
GST Goods and Services Tax
HRIDAY National Heritage City Development and Augmentation Yojana
HUA Housing and Urban Affairs
IAY Indira Awas Yojana
IEC Information, Education and Communication
IHHL Individual Household Latrine
IPDS Integrated Power Development Scheme
ISSR In-situ Slum Rehabilitation
JNNURM Jawaharlal Nehru National Urban Renewal Mission
LIG Lower Income Group
MGNREGA Mahatma Gandhi National Rural Employment Guarantee Scheme
MLA Member of Legislative Assembly
MoHUA Ministry of Housing and Urban Affairs
MoHUPA Ministry of Housing and Urban Poverty Alleviation
MoLE Ministry of Labour and Employment
MoRD Ministry of Rural Development,
MoU Memorandum of Understanding
MoUD Ministry of Urban Development
MP Member of Parliament
NAC National Advisory Council
NSSO National Sample Survey Organisation
NUA New Urban Agenda
ODF Open Defecation Free
PFMS Public Financial Management System
PM Prime Minister
PMAY (U) Pradhan Mantri Awas Yojana (Urban)
PMEGP Prime Minister’s Employment Generation Programme
PMJJBY Pradhan Mantri Jeevan Jyoti Bima Yojana
PMSBY Pradhan Mantri Suraksha Bima Yojana
PPP Public Private Partnership
PT Public Toilet
RAY Rajiv Awas Yojana
RFP Request for Proposal
RTI Right to Information
SAAP State Annual Action Plan
SBM Swachh Bharat Mission
SCAF Smart City Advisory Forum
SCM Smart Cities Mission
SCP Smart City Proposal
SHG Self Help Group
SHPSC State Level High Powered Steering Committee
SLB Service Level Benchmark
SPV Special Purpose Vehicle
SUH Shelter for Urban Homeless
TDR Transferable Development Rights
TVC Town Vending Committee
ULB Urban Local Bodies
USAID United States Agency for International Development
UT Union Territory
WTE Waste-to-Energy
PARLIAMENTARY WATCH REPORT 2017 | v

LIST OF TABLESTable i) Number of questions raised under each scheme
Table ii) Total questions asked in Parliament in 2017
Table iii) Total questions raised to Ministry of Housing and Urban Affairs
Table iv) Number of questions raised by Opposition and Ruling Alliance Members of Parliament
Table v) Gender-wise representation of the Parliament
Table vi) Comparison between most funded and most addressed Ministries in 2017
1.1 Selection of Smart Cities
1.2 Details of FDI in the Mission at a glance
1.3 Funds released under the Smart City Mission as on 2 August 2017
1.4 Status of projects and fund allocation under the mission as on 28 December 2017
1.5 Details of total number of projects sanctioned State-wise, percentage of State’s share in the total cost and comparison between percentage of work completed to percentage of cost utilised
2.1 Target, houses sanctioned and completed under PMAY (U)
2.2 Houses constructed under different housing schemes
2.3 Progress of PMAY (U) as on 30 November 2017
3.1 Number of toilets constructed in last 4 years, target, revised targets and success rates.
3.2 Funds allotted and expenditure incurred for toilet construction under SBM
4.1 Structure of the Monitoring Mechanism under AMRUT
4.2 Central assistance against SAAPs under AMRUT mission
5.1 Funds released and sanctioned under selected cities updated till 30 November 2017
6.1 Number of women shelters state-wise
6.2 State-wise details of shelters sanctioned and operational under DAY-NULM
6.3 Details of skill training and placement under DAY- NULM during the last 3 years and the current year (upto November 2017)
6.4 Achievements of the EST&P component and social mobilisation and institution development
6.5 Details of funds allocated, utilised and unspent balance for the last three years (2014–15 to 2016-–17) under DAY-NULM
7.1 Beneficiaries listed under various social security schemes of the government
vi | YUVA

PARLIAMENTARY WATCH REPORT 2017 | vii
FOREWORD
I congratulate Youth for Unity and Voluntary Action for bringing out the ‘Parliamentary Watch Report 2017’ that highlights the status of implementation of urban schemes through data analysis of questions raised in the Parliament in the year 2017.
This is a crucial time for this analysis as most schemes launched in 2015 are nearing completion. This report presents an opportunity for legislators, bureaucrats and civil society to reflect and understand the current gaps in implementation and design ways of addressing it.
From the report’s analysis one can gather that the questions raised in the Parliament are focused only on a few components of each scheme, particularly on investments. Through the analysis of answers, the report throws light on glaring facts regarding the financial status; with most schemes facing a common challenge - low percentage of release and utilisation of funds. Along with schemes, mechanisms for ensuring efficient implementation need to the strengthened. In all major schemes, the role of private players and foreign in-vestment is promoted; many of which are old schemes that have been repackaged and introduced. However, if this will yield balanced and inclusive development or will cater to only certain sections of the society re-mains a question. The social impact of these schemes, especially on minorities and other vulnerable groups has not been adequately addressed in Parliament. Ground realities vis-à-vis data presented need to gather momentum in the Parliament.
The report presents these schemes by linking one to the other - housing, basic services and livelihood and the issues of informal labour. There is an interconnectedness between these schemes. For example, the suc-cess of the Swachh Bharat Mission will depend on the success of Atal Mission for Rejuvenation and Urban Transformation. Poverty alleviation programs cannot be analysed in isolation without addressing the issues of housing and informality of labour. This report gives a comprehensive picture of the Parliamentary discus-sions on urban issues which is a commendable initiative.
Dated, 2018New Delhi
Chief Justice (Retd.) High Court of Delhi
Chairperson, Prime Minister’s High Level Committee (Ex.)
UN Special Rapporteur on Housing (Ex.)
President, People Union for Civil Liberties (PUCL) India (Ex.)
viii | YUVA
EXECUTIVE SUMMARYThis report presents an analysis of the parliamentary questions (starred and unstarred) addressed to the Ministry of Urban Develepment (MoUD), Ministry of Housing and Urban Poverty Alleviation (MoHUPA) and Ministry of Housing and Urban Affairs (MoHUA). The questions were raised in the 11th, 12th and 13th session of the 16th Lok Sabha and the 242nd, 243rd and 244th session of the Rajya Sabha, from 31 January 2017 to 5 January 2018. During these sessions, a total of 26,081 questions were raised in both the houses of parliament. Maximum number of questions were addressed to the Ministry of Finance, Ministry of Railways and Ministry of Health and Family Welfare.
Out of the total questions, 750 questions (2.9%) were addressed to MoHUA (earlier MoHUPA and MoUD). Of these 750 questions, 356 were raised in Lok Sabha and 394 were raised in Rajya Sabha. A majority of these questions were related to centrally sponsored urban schemes. The report has analysed the questions and answers scheme-wise. Each chapter thus represents a particular scheme—the Smart Cities Mission (SCM), Pradhan Mantri Awas Yojana (Urban) [PMAY(U)], Swachh Bharat Mission (SBM), Atal Mission for Rejuve-nation and Urban Transformation (AMRUT), National Heritage City Development and Augmentation Yo-jana (HRIDAY), and Deendayal Antyodaya Yojana-National Urban Livelihood Mission (DAY-NULM). An analysis of questions raised to the Ministry of Labour and Employment (MoLE) (during the same parliamen-tary sessions) regarding informal and migrant workers is presented as a chapter. It is crucial to understand the issues of informal workers and migrant workers while engaging on urban schemes aimed at benefiting the urban poor.
Through this report we aim to throw light on the implementation of urban schemes, as most near their date of completion. All schemes were launched in 2015 except the SBM, which was launched in 2014. A few gen-eral trends that all schemes displayed include—slow rate of implementation, under-utilisation of funds and only a small percentage of committed central assistance released under each scheme.
The PMAY(U) was the scheme that saw the highest number of questions. The Shelter for Urban Homeless (SUH) under the DAY-NULM was also extensively questioned. Overall, among the six schemes, PMAY (U) received the highest central assistance. However in terms of implementation, PMAY(U) has the lowest level of implementation.
Only a small percentage of central grant was released compared to the central grant allocated to each scheme. SBM received the highest percentage (33%) and AMRUT received the lowest percentage (19.2%) of the grant allotted to these schemes.
This report also briefly highlights the bills introduced in the Parliament related to urban issues in the year 2017. It includes all three kinds of Bills—Ordinary, Constitution Amendments, and Money Bills introduced by Private Members as well as the Government. These are—The Constitution Amendment Bill, 2017 (Amend-ment of Article 51A); The Constitution Amendment Bill, 2017 (Insertion of New Article 21B); The Requisi-tioning and Acquisition of Immovable Properties (Amendment) Act, 2017; The Regulation of Private Hostels and Paying Guests Accomodation Centres Bill, 2017; The Public Premises (Eviction of Unauthorised Oc-cupants) Amendment Bill, 2017; The National Capital Territory of Delhi Laws (Special Provisions) Second (Amendment) Bill, 2017; The Right to Adequate Housing Bill, 2017; and The Removal of Homelessness Bill, 2017. These Bills are discussed briefly in the following chapter.
A challenge faced during analysis stemmed from the answers provided by the Ministry. Often, it did not pro-vide the information sought by Parliamentarians. In a few questions where quantitative data was asked, the Ministry simply reiterated scheme guidelines. These examples have been highlighted in each chapter.
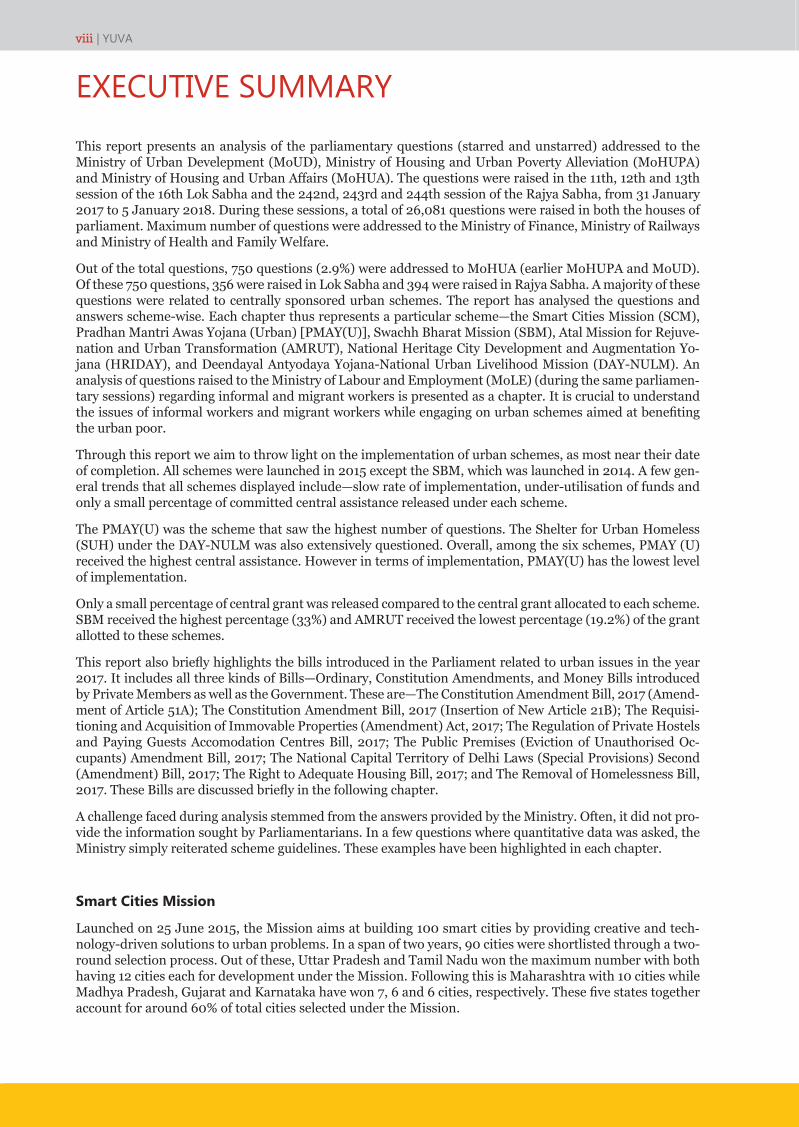
Smart Cities Mission
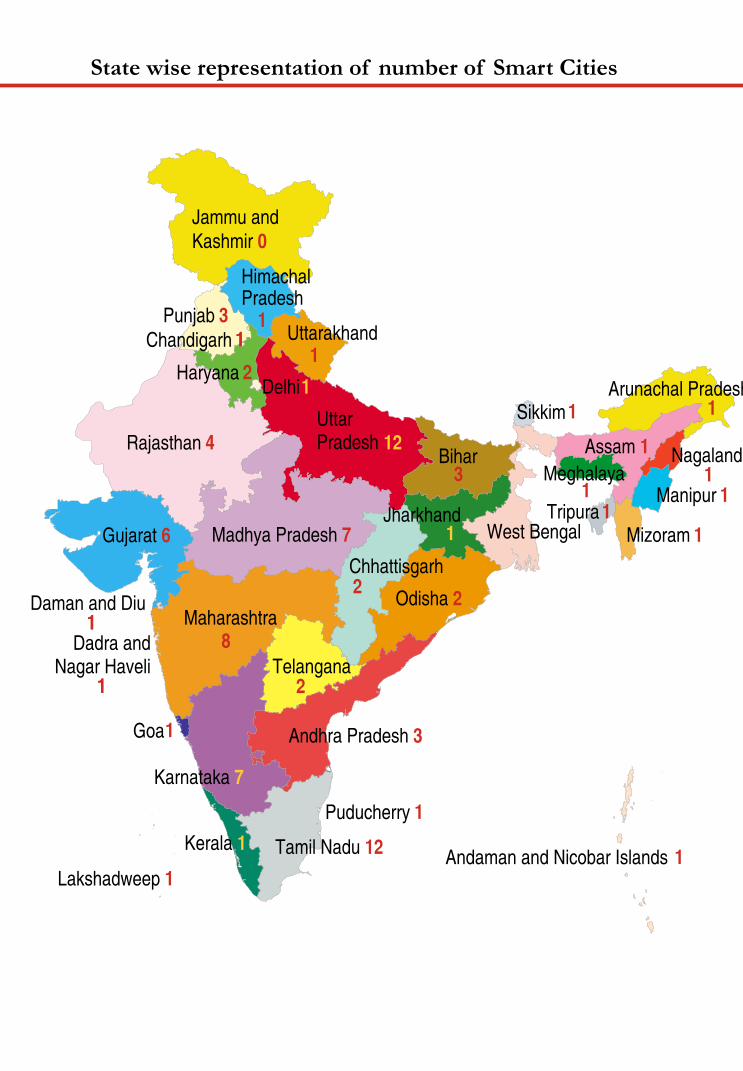
Launched on 25 June 2015, the Mission aims at building 100 smart cities by providing creative and tech-nology-driven solutions to urban problems. In a span of two years, 90 cities were shortlisted through a two-round selection process. Out of these, Uttar Pradesh and Tamil Nadu won the maximum number with both having 12 cities each for development under the Mission. Following this is Maharashtra with 10 cities while Madhya Pradesh, Gujarat and Karnataka have won 7, 6 and 6 cities, respectively. These five states together account for around 60% of total cities selected under the Mission.
PARLIAMENTARY WATCH REPORT 2017 | ix
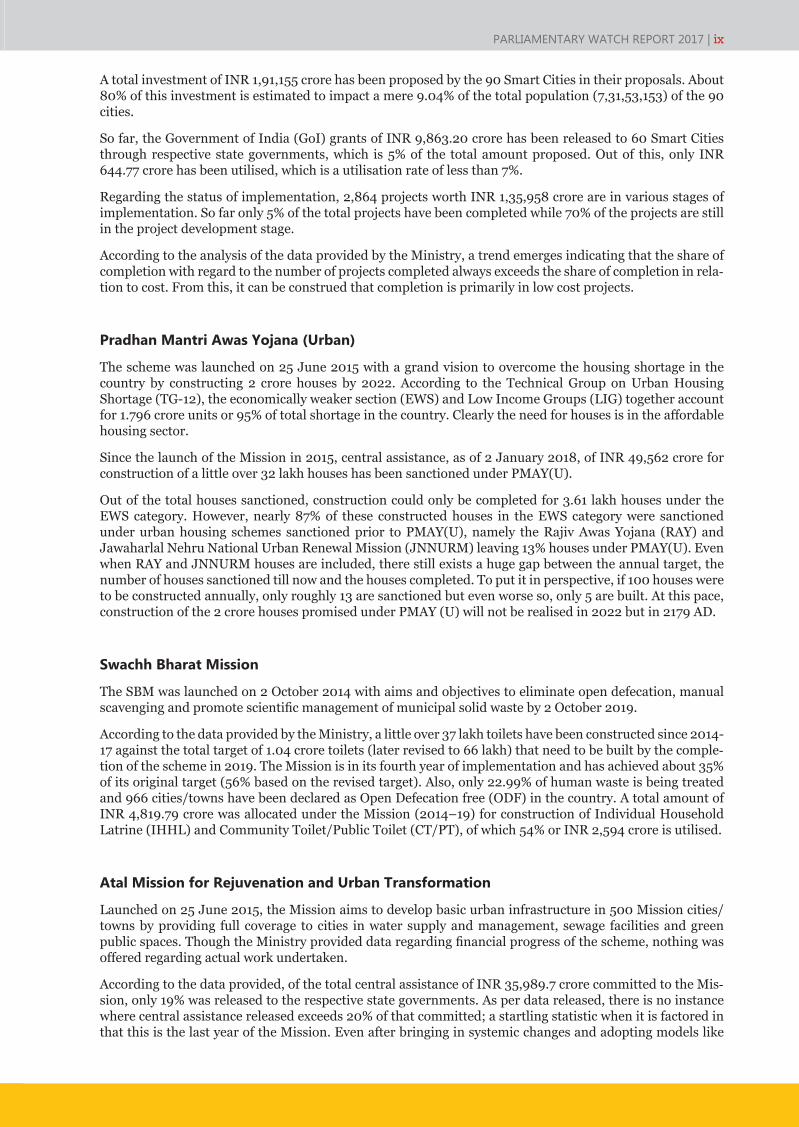
A total investment of INR 1,91,155 crore has been proposed by the 90 Smart Cities in their proposals. About 80% of this investment is estimated to impact a mere 9.04% of the total population (7,31,53,153) of the 90 cities.
So far, the Government of India (GoI) grants of INR 9,863.20 crore has been released to 60 Smart Cities through respective state governments, which is 5% of the total amount proposed. Out of this, only INR 644.77 crore has been utilised, which is a utilisation rate of less than 7%.
Regarding the status of implementation, 2,864 projects worth INR 1,35,958 crore are in various stages of implementation. So far only 5% of the total projects have been completed while 70% of the projects are still in the project development stage.
According to the analysis of the data provided by the Ministry, a trend emerges indicating that the share of completion with regard to the number of projects completed always exceeds the share of completion in rela-tion to cost. From this, it can be construed that completion is primarily in low cost projects.
Pradhan Mantri Awas Yojana (Urban)
The scheme was launched on 25 June 2015 with a grand vision to overcome the housing shortage in the country by constructing 2 crore houses by 2022. According to the Technical Group on Urban Housing Shortage (TG-12), the economically weaker section (EWS) and Low Income Groups (LIG) together account for 1.796 crore units or 95% of total shortage in the country. Clearly the need for houses is in the affordable housing sector.
Since the launch of the Mission in 2015, central assistance, as of 2 January 2018, of INR 49,562 crore for construction of a little over 32 lakh houses has been sanctioned under PMAY(U).
Out of the total houses sanctioned, construction could only be completed for 3.61 lakh houses under the EWS category. However, nearly 87% of these constructed houses in the EWS category were sanctioned under urban housing schemes sanctioned prior to PMAY(U), namely the Rajiv Awas Yojana (RAY) and Jawaharlal Nehru National Urban Renewal Mission (JNNURM) leaving 13% houses under PMAY(U). Even when RAY and JNNURM houses are included, there still exists a huge gap between the annual target, the number of houses sanctioned till now and the houses completed. To put it in perspective, if 100 houses were to be constructed annually, only roughly 13 are sanctioned but even worse so, only 5 are built. At this pace, construction of the 2 crore houses promised under PMAY (U) will not be realised in 2022 but in 2179 AD.
Swachh Bharat Mission
The SBM was launched on 2 October 2014 with aims and objectives to eliminate open defecation, manual scavenging and promote scientific management of municipal solid waste by 2 October 2019.
According to the data provided by the Ministry, a little over 37 lakh toilets have been constructed since 2014-17 against the total target of 1.04 crore toilets (later revised to 66 lakh) that need to be built by the comple-tion of the scheme in 2019. The Mission is in its fourth year of implementation and has achieved about 35% of its original target (56% based on the revised target). Also, only 22.99% of human waste is being treated and 966 cities/towns have been declared as Open Defecation free (ODF) in the country. A total amount of INR 4,819.79 crore was allocated under the Mission (2014–19) for construction of Individual Household Latrine (IHHL) and Community Toilet/Public Toilet (CT/PT), of which 54% or INR 2,594 crore is utilised.
Atal Mission for Rejuvenation and Urban Transformation
Launched on 25 June 2015, the Mission aims to develop basic urban infrastructure in 500 Mission cities/towns by providing full coverage to cities in water supply and management, sewage facilities and green public spaces. Though the Ministry provided data regarding financial progress of the scheme, nothing was offered regarding actual work undertaken.
According to the data provided, of the total central assistance of INR 35,989.7 crore committed to the Mis-sion, only 19% was released to the respective state governments. As per data released, there is no instance where central assistance released exceeds 20% of that committed; a startling statistic when it is factored in that this is the last year of the Mission. Even after bringing in systemic changes and adopting models like

x | YUVA
cooperative federalism to ensure effective implementation of schemes, little has changed with regards to implementation.
National Heritage City Development and Augmentation Yojana
Launched on 21 January 2015, with a focus on holistic development of heritage cities, the HRIDAY has 12 identified cities—Ajmer, Amaravati, Amritsar, Badami, Dwarka, Gaya, Kanchipuram, Mathura, Puri, Vara-nasi, Velankanni and Warangal.
Only 31% of the total 65 approved projects have been completed so far. Out of the 12 cities selected, only 6 cities have barely been able to complete 10% of the projects. Only 3 cities, Amritsar, Varanasi and Amravati have been able to complete a little over 50% of the projects.
As of July 2017, a total of INR 363.28 crores was sanctioned for the Scheme of which INR 189.12 crore (52%) was released. However, only INR 23.60 crore funds have been utilised so far, which is merely 6.5% of the total funds sanctioned under the scheme.
Deendayal Antyodaya Yojana-National Urban Livelihoods Mission
Launched on 13 February 2015, this Mission aims to reduce poverty and vulnerability of the urban poor households by enabling them to access gainful self-employment and skilled wage employment opportuni-ties. The scheme also aims to provide shelters for the homeless.
A total of INR 4,00,106.9 lakhs was allocated for the Scheme, of which only 42.9% was utilised from 2014–17. More than 50% of the allocated budget remains unspent. Allocation of budget for each successive year has included unspent balance of the previous years.
As per the data released by the Ministry, the total number of shelters sanctioned so far in the country is 1,331. Out of the shelters sanctioned, 789 (59%) are operational with the remaining under construction/refurbishment. Out of the total operational shelters sanctioned, 50% are in three states—Delhi, Madhya Pradesh and Tamil Nadu. The Scheme guidelines refer to a provision of one shelter for a minimum of 100 persons per lakh urban population. Yet there are only 789 functional shelters for the urban homeless that provide respite to 4.5% of the homeless population. There is a glaring gap of 16,939 shelters!
Informal Labour - Analysis of Answers of the Ministry of Labour and Employment
This chapter analysed questions and answers that were posed to the MoLE with a focus on informal work-ers. Specifically, the analysis focussed on construction workers, domestic workers, migrant workers and welfare schemes and social security for workers in the unorganised sector.
With regard to construction workers, questions were raised regarding cess. Total cess collected by Welfare Boards for Construction Workers by the States/UTs upto 31 December 2016, at the rate of 1% of the cost of construction is INR 31,733.76 crore, of which only INR 6,872.51 crore has been spent. Around 80% of the cess collected is lying unutilised.
With regard to domestic workers, questions were raised about the total number of registered and unregis-tered domestic workers. The Ministry admitted that data was not maintained. A question was also raised regarding the National Policy for Domestic Workers with the Ministry replying that the draft is under con-sideration of the Government.
All schemes display an overwhelming level of under-utilisation. Not only that, but targets met under pre-ceding schemes are often included to inflate achievements, which despite this remain meagre. Attempts by parliamentarians to obtain specific or detailed information regarding schemes, which could help establish some degree of accountability, are very often not answered accurately. There exists a greater need for rigor-ous civil society engagement and monitoring as a means to ensure the benefits of urban development are equitably distributed and public money is accounted for.

PARLIAMENTARY WATCH REPORT 2017 | xi
Bills Introduced in the Parliament in 2017:
The following Bills were introduced in the Parliament related to urban issues. It includes all three kinds of Bills—Ordinary, Constitution Amendments, and Money Bills introduced by Private Members as well as the government.
1. The Constitution Amendment Bill, 2017 (Amendment of Article 51A)
The Bill was introduced by Shri Prabhat Jha on 24 March 2017 in Rajya Sabha. It aims to amend the Consti-tution by inserting the (l) clause in Article 51A, stating that “(l) to participate in mass movement for cleanli-ness and propagate the message of Clean India through his words and deeds.”
2. The Constitution (Amendment) Bill, 2017 (Insertion of New Article 21B)
This Private Member’s Bill in the nature of the Constitution Amendment Bill was introduced by Shri K. K. Ragesh on 21 July 2017 in Rajya Sabha. It aims to amend the Constitution by inserting Article 21B, which will also be said as Right to Housing. “The State shall provide affordable adequate housing to all citizens in such manner as the State may, by law, determine.”
3. The Requisitioning and Acquisition of Immovable Properties (Amendment) Act, 2017
The bill was introduced in the Lok Sabha, on 11 April 2017 by M. Venkaiah Naidu, Minister of Urban Devel-opment, Housing and Urban Poverty Alleviation and Information and Broadcasting. It aimed to serve as an amendment bill for the the Requisitioning and Acquisition of Immovable Property Act, 1952. It states the re-issuance of a notice under this subsection and shall be applicable only in the cases of land being acquired for national security and defence purpose.
4. The Regulation of Private Hostels and Paying Guests Accomodation Centres Bill, 2017
This Private Member’s Bill was introduced by Shri Mahesh Giri in Lok Sabha on 21 July 2017. It aims to provide for the constitution of a Board for regulation of private hostels and paying guest accommodation centres and for matters connected therewith. It also defines Paying Guests and Private Hostels.
5. The Public Premises (Eviction of Unauthorised Occupants) Amendment Bill, 2017
The Bill was introduced by the Government under the MoHUA on 31 July 2017. The bill proposes to amend The Public Premises (Eviction of Unauthorised Occupants) Act, 1971. This Act provides for eviction of un-authorised occupants from public premises and for certain incidental matters. The proposed amendment aims to insert Section 3b to the aforesaid Act, which directs of giving a show cause notice to the occupants of unauthorised settlements to reply within 3 days citing reasons why should they not be evicted. It also proposes to insert 3b(b) which says the notice is to be served by having it affixed on the outer door or some other conspicuous part of the said residential accommodation.
6. The National Capital Territory of Delhi Laws (Special Provisions) Second (Amendment) Bill, 2017
It was introduced by the Central Government on 22 December 2017 to bring amendment in the National Capital Territory of Delhi Laws (Special Provisions) Second Act, 2011. This bill gives immunity to slums and some unauthorised constructions from 31 December 2017 to 31 December 2020. This bill was passed by Lok Sabha on 27 December 2017.
In House Discussions
As The National Capital Territory of Delhi Laws (Special Provisions) Second (Amendment) Bill, 2017 was introduced in Lok Sabha, a discussion was held for the Bill where Members of Parliament (MPs) from Delhi as well as several other Members put their views regarding the need of the Bill and suggestions to it.
Ms Meenakshi Lekhi, MP Lok Sabha from New Delhi Constituency, in her speech in-troducing The National Capital Territory of Delhi Laws (Special Provisions) Second (Amendment) Bill, 2017 on 27 December 2017 said that due to the livelihood crisis in other states, people migrate to Delhi in search of livelihood opportunities. This is the main reason of growth in population and increase in the unauthorised squatters all around the city. She also emphasised the lack of provisions for all the facilities and services due to this abundant increase in the population. Hisar MP Dushyant Chautala quite bravely put the issue of evictons in Delhi in regard to this bill and said, can the Government assure relief to the poor who are suffering due to failures of the Central

xii | YUVA
Government? He also spoke about the demolition of the Hostel for Blind by the Delhi Development Authority (DDA) and said that whenever there’s a demolition or discus-sion of irregularities or unauthorised constructions, no one talks about the government structures or construction by big industrialists or powerful people.
The Minister of State for Housing and Urban Affairs said that in Delhi we are witnessing phenomenal popu-lation growth. This growth has consequences. These consequences are reflected in encroachment of public land, in the growth of slums, in unauthorised constructions, large scale commercialisation of residential areas and inadequacy of housing.
7. The Right to Adequate Housing Bill, 2017
It is a Private Member’s Bill introduced in Lok Sabha on 29 December 2017 by Shri Om Prakash Yadav. The Bill aims to provide for adequate dwelling to the families living below poverty line or falling under low income group in the country by providing one free of cost or at a reasonable cost and providing interest free loans to families in low income group for purchase of house and for matter connected therewith or inciden-tal thereto.
8. The Removal of Homelessness Bill, 2017
It is a Private Member’s Bill introduced in Lok Sabha on 29 December 2017 by Dr Udit Raj. The Bill aims to remove homelessness in the country by providing for framing of a housing scheme aimed at providing dwelling units with all basic facilities at an affordable cost to every homeless family.
PARLIAMENTARY WATCH REPORT 2017 | xiii
INTRODUCTIONAbout the Parliamentary Watch Report
Cities are seen as engines of economic growth and innovation. It has been estimated that more than half of the world’s population lives in urban pockets. In India, the situation is no different. Urban Indians now form about one-third of the population and they produce more than three-fifths of the country’s gross do-mestic product (GDP) (UN News, 2014).
Despite being the seventh largest economy in the world, development in India is challenged by a widening socio-economic gap. This poses serious questions about structural flaws in developmental schemes. Re-cent manifestations of this include the slump in India’s GDP growth, the shrinking job market with larger number of layoffs, impacts of demonetisation and the Goods and Services Tax (GST), and destruction of informal settlements in the name of development projects. Urban exclusion, which entails developmental projects not addressing the needs of the most marginalised or even, in some cases, dispossessing them of their meagre possessions, can be addressed by fostering public discourse at the project’s conceptual level. Planning and policy making stand as key indicators to inclusive urban development. Elected representatives are best suited to make this possible as they hold power and the responsibility to ensure that policy and projects are tailored to meet the needs of their constituencies.
According to Census 2011, India ranks second in the world with urban population of 37.71 crore after China. As cities are expanding and facing myriad challenges to sustainable development, the government is focus-ing on fostering urban development. This was evident by the increase in budgetary allocation in 2017–18, alterations in policies and implementation of multicity schemes to address urban issues.
The budget estimates for Ministry of Housing and Urban Affairs (MoHUA) was increased by 10% from INR 36,946 crore in 2016–17 to INR 40,618 crore in 2017–18. This was later revised with a slight increase to INR 40,754 crore in 2017–18.
Changes were also introduced at the policy level to induce investments. In the Budget 2017 presentation by the Finance Minister on 1 February, the affordable housing sector was given infrastructure status. Accord-ing to DNA report (Shah, 2017), this change was expected to ‘ensure easier access to institutional credit and help in reducing developers’ cost of borrowing for affordable projects. The approval process for affordable projects was also expected to be simplified; create clear guidelines and increase transparency in the seg-ment.’
The Government introduced various schemes to address urban poverty and gaps in urban infrastructure. Some flagship schemes include the Smart Cities Mission (SCM), Pradhan Mantri Awas Yojana Urban [PMAY(U)], Swachh Bharat Mission (SBM), Atal Mission for Rejuvenation and Urban Transformation (AMRUT), Heritage City Development and Augmentation Yojana (HRIDAY), Deendayal Antyodaya Yoja-na-National Urban Livelihoods Mission (DAY-NULM).
This report traces the status of implementation of these urban schemes, through the starred and unstarred questions addressed to the MoHUA in the 11th, 12th and 13th sessions of the 16th Lok Sabha and the 242nd, 243rd and 244th session of the Rajya Sabha from 31 January 2017 to 5 January 2018.
During this period, a total of 26,041 questions were raised in both the houses. Of these, 750 questions (2.9%) were addressed to the MoHUA (earlier MoHUPA and MoUD). Out of these 750 questions, 356 were raised in the Lok Sabha and 394 were raised in the Rajya Sabha. All these questions were categorised under six flagship schemes and questions which were outside the purview of these schemes were not analysed further. Majority of the questions raised to MoHUA in both the houses pertained to PMAY (U) followed by DAY-NULM and SCM.
The table below shows the number of questions raised under each scheme.

xiv | YUVA
Scheme Questions raised in Lok Sabha
Questions raised in Rajya Sabha
Total in both houses
% of scheme specific questions to total questions
Smart Cities Mission 9 41 50 6.7
Pradhan Mantri Awas Yojana 98 99 197 26.3
Swachh Bharat Mission 28 27 55 7.3
Atal Mission for Rejuvenation and Urban Transformation
35 37 72 9.6
National Heritage City Development and Augmentation Yajana
7 13 1.7
Deendayal Antodaya Yojana - National Urban Livelihood Mission
25 23 48 6.4
Miscellaneous 136 127 263 35.1
Metro Rail 9 23 32 4.3
Delhi Development Authority 10 10 20 2.7
Total 356 394 750 100
Table i) Number of questions raised under each scheme
A significant change that took place this year was that the Ministry of Urban Development (MoUD) and the Ministry of Housing and Urban Poverty Alleviation (MoHUPA) were merged to form the MoHUA, which now stands as the apex authority of the Government of India to formulate policies, sponsor and support programmes, coordinate activities of various central ministries, state governments, and other nodal author-ities and monitor all issues of urban employment, poverty and housing in the country. A question raised in the parliament also inquired about the rationale and impact of this merger. The Ministry informed that this was done with a view that the problem of poverty and housing for low-income groups should be addressed within an integrated framework of planning for urban development and hence it was recommended that a single Ministry of Urban Affairs and Housing will be better equipped to deal with the pace and complexity of urbanisation in the future.For this report, the questions addressed to erstwhile ministries were clubbed together and considered as the total number of questions addressed to the MoHUA.
A change that was observed in the government’s approach with respect to the implementation of the urban schemes, especially the SCM and AMRUT is that it seems to push for municipal reforms and even em-panelled angencies for the same. There is a clear push for public-private partnership (PPP) models and a change in municipal financing means. These schemes, while being centrally sponsored, are also pushing for changes in the local governments, questioning the devolution of powers to the urban local bodies (ULB) as promised by the 74th amendment. The Ministry in a reply to a question mentioned, ‘The Ministry has also

PARLIAMENTARY WATCH REPORT 2017 | xvxv | YUVA
empanelled agencies to help cities implement reforms in the areas of property tax, advertisement tax, value capture financing (recovery of incomes accrued to private property owners from publicly financed projects), reduction of non-revenue water, credit rating of ULBs and municipal bond financing (raising debt in the name of the ULBs). Model request for proposals (RFPs) have been issued to the States for procuring agen-cies in the above mentioned areas’.
Similarly, other reforms introduced by the government present a confusing picture. The analysis of the questions reflected a common trend depicting an overwhelming level of underutilisation and slow physical progress in all flagship schemes in urban areas. It is ironical that on the one hand the Swachh Bharat Cess is being collected while there is underutilisation in the funds allocated under the scheme. How the cess is being utilised is unknown. These issues are raised separately under each section.
An inflow of Foreign Direct Investments (FDI) to the tune of 2,500 million USD was also observed in two schemes, the SCM and the SBM, through the World Bank and the Asian Development Bank.
The last section of the report concerns informal workers, with a special focus on construction workers and domestic workers. In total, 18 questions from the Lok Sabha and 19 questions from the Rajya Sabha related to informal workers were placed before the Ministry of Labour and Employment (MoLE).
Questions were analysed on parameters of performance and financial progress made under each scheme. Other issues related to these schemes, raised by parliamentarians, such as private participation, foreign funding, implementing and monitoring agencies have also been addressed. With a larger aim to improve the efficacy of each scheme, the scope for civil society engagement has also been explored. Through this report we aim to build public understanding on parliamentary discussions on urban schemes, monitor progress and suggest scope for participatory governance and active citizen participation.
Parliament at a Glance
A total number of 26,081 questions were raised in the Parliament in 2017. Out of this, 15,208 questions were raised in the Lok Sabha and 10,833 questions were raised in the Rajya Sabha.
About 3% of total questions raised in the Parliament were addressed to the MoHUA.
Out of total questions which were raised in all three sessions of Parliament in 2017, about 30.9% were only raised by Members of Parliament (MPs) in Opposition whereas MPs from the Ruling Alliance raised nearly 70% of the questions.
Table ii) Total questions asked in Parliament in 2017
Session Lok Sabha Rajya Sabha
Budget session 6,999 5,064
Monsoon session 4,735 3,325
Winter session 3,474 2,444
Total 15,208 10,833
xvi | YUVA
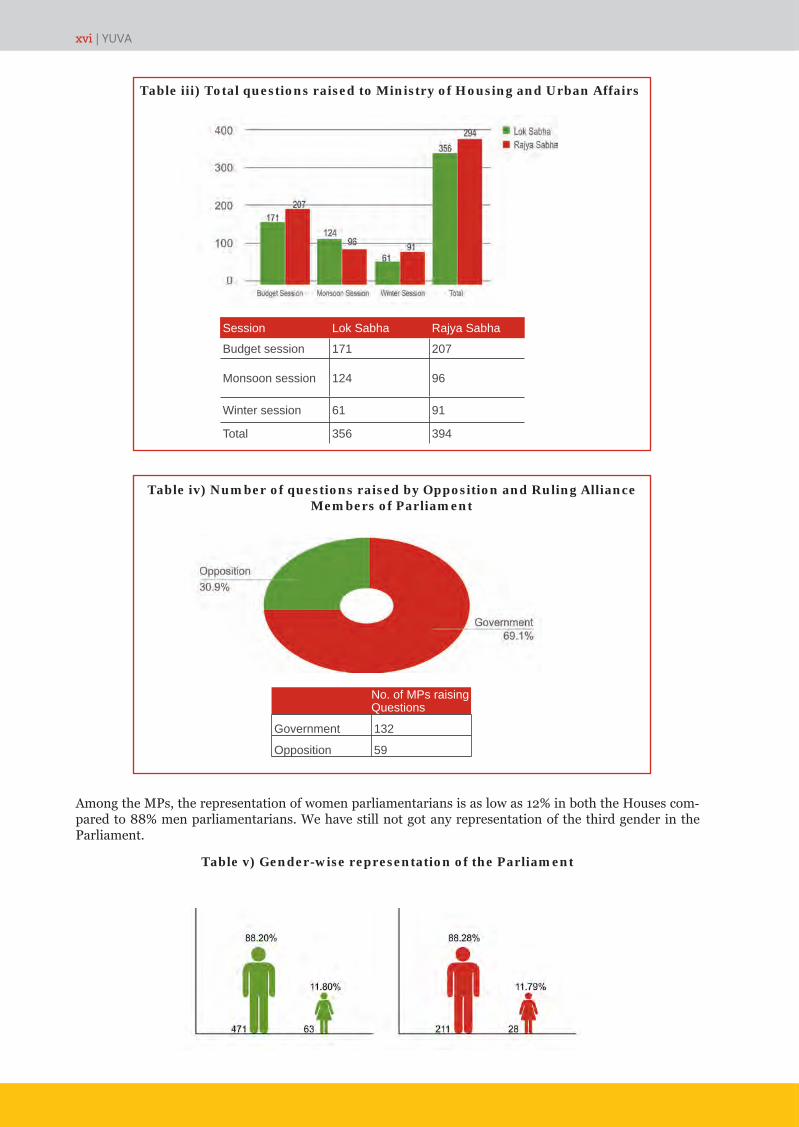
Session Lok Sabha Rajya Sabha
Budget session 171 207
Monsoon session 124 96
Winter session 61 91
Total 356 394
No. of MPs raising Questions
Government 132
Opposition 59
Among the MPs, the representation of women parliamentarians is as low as 12% in both the Houses com-pared to 88% men parliamentarians. We have still not got any representation of the third gender in the Parliament.
Table v) Gender-wise representation of the Parliament
Table iii) Total questions raised to Ministry of Housing and Urban Affairs
Table iv) Number of questions raised by Opposition and Ruling Alliance Members of Parliament

PARLIAMENTARY WATCH REPORT 2017 | xvii
Table vi) Comparison between Most Funded and Most Addressed Ministries in 2017 (in INR Crore)
Rank Ministry Fund Received Rank Ministry Question
Asked
1 Defence 3,51,550 1 Finance 1,909
2
Consumer Affairs, Food and Public Distribution (Includes Food Subsidy)
1,22,399 2 Railways 1,524
3 Rural Development 96,728 3 Health and Family Welfare 1,477
4 Human Resource Development 72,016 4 Human Resource
Development 1,380
5 Road Transport and Highways 52,232 5 Agriculture and
Farmers Welfare 1,341
6 Agriculture and Farmers Welfare 44,500 6 Home Affairs 1,300
7 Health and Family Welfare 40,241 7
Environment, Forests and Climate Change
935
8 Housing and Urban Affairs 36,946 8 Defence 765
9 Women and Child Development 16,874 9 Housing and Urban
Affairs 750
10 Drinking Water and Sanitation 16,476 10 Civil Aviation 743
Table (v) shows the correlation between funds received by Ministries and questions addressed to them. The Ministries have been ranked in order of the funds received and the questions addressed. The Ministry of Defence received the maximum funds. However, the Ministry of Finance was the most addressed Ministry
Methodology
This report is based on secondary data from the websites of Parliament (Lok Sabha and Rajya Sabha ques-tions). The questions were segregated on the basis of emerging themes, within the following schemes, the SCM, PMAY (U), SBM, AMRUT, HRIDAY and DAY-NULM. Owing to the close relation between informal workers and urban spaces, questions asked to the MoLE related to the informal workers were also analysed for all sessions.
These questions were then grouped scheme-wise and analysed, along with an examination of the nature of questions. The statistics provided by the Government in the answers were verified and cross-checked (whether the data represented are constant for similar answers to different questions). Furthermore, with each scheme and question, the scope of civil society engagement was also explored. Through the informa-tion provided by the Ministry in response to questions raised by parliamentarians, the report tracks the targets achieved against the objectives of each scheme.

Launch25 June 2015
Duration5 years, ending in May 2020
Total Investment Proposed:INR 1,91,155 crores
Fact
s
Smart Cities Mission
Chapter 01
Status of Implementation
No. of projects
Funds allocated
Status Stage% of total projects
in each stage% of funds
allocated of total
148 1,872 Completed Stage 5 5.2 1.4
407 15,600Implementation
commencedStage 4 14.2 11.5
237 13,514Tendering
startedStage 3 8.3 9.9
47 2,712 DPRs approved Stage 2 1.6 2.0
2,025 1,02,260DPRs being
preparedStage 1 70.7 75.2
2,864 1,35,958 Total 100.0 100
80% of total investmentimpacting 9.04% of total population of 90 cities
Percentage of projects completed and fund allocation under the mission as on 28 December 2017 (in INR Crores)
Tamil Nadu 12
Andhra Pradesh 3
Telangana
Odisha 2
West Bengal
Chhattisgarh
Madhya Pradesh 7
Uttar Pradesh
BiharRajasthan
Gujarat 6
Maharashtra
Karnataka 7
Goa
Kerala 1
Punjab
Haryana
Assam 1
HimachalPradesh
Uttarakhand
Jharkhand
Sikkim
Manipur
Andaman and Nicobar Islands
Arunachal Pradesh
Chandigarh
Dadra and Nagar Haveli
Daman and Diu
Delhi
Lakshadweep
Meghalaya
Mizoram
Nagaland
Tripura
Puducherry
Jammu and Kashmir 0
2
8
124
3
3
2
1
1
1
1
1
1
1
11
1
1
11
11
11
2
11
1
1
State wise representation of number of Smart Cities

CHAPTER 1 SMART CITIES MISSION (SCM) 1.1 Mission at a glance
There is no universally accepted definition of a Smart City. It means different things to different people. The conceptualisation of a Smart City, therefore, varies from city to city and country to country, depending on the level of development, willingness to undergo reform and resources available. Launched in June 2015, the Smart Cities Mission (SCM) was called a ‘bold, new initiative’ of this Government, where pilot cities will act as a lighthouse to other aspiring cities (Ministry of Housing and Urban Affairs, 2017).
Core infrastructure elements of a smart city include:
o Adequate water supply,
o Assured electricity supply,
o Sanitation, including solid waste management,
o Efficient urban mobility and public transport,
o Affordable housing, especially for the poor,
o Robust IT connectivity and digitalisation,
o Good governance, especially e-governance and citizen participation,
o Sustainable environment,
o Safety and security of citizens, particularly women, children and the elderly, and
o Health and education.
1.2 Analysis of questions asked
In the budget and monsoon session, 9 questions were raised in the Lok Sabha and 30 in the Rajya Sabha with respect to the SCM. But in the winter session, SCM did not garner much attention in the Lok Sabha, with no direct question raised. Only a part of a question raised by Member of Parliament (MP) Sakshi Ma-haraj inquired about the total infrastructure expenditure under the Mission. However, in the Rajya Sabha’s winter session, 11 questions were raised.
The questions primarily centred around the status of implementation and progress made under the Mis-sion, fund allocations and the involvement of foreign investments. Though the nature of questions raised in the Rajya Sabha were similar to those in the Lok Sabha, the difference between the two lay in the degree of detail sought in the answers.
1.3 Analysis of answers
This section is broadly divided into five subsections, according to the themes of questions raised in Parlia-ment—the selection process, role of the implementing agency, monitoring, funding and status of imple-mentation.
i. Selection process
According to the information provided in the answers, the Ministry of Housing and Urban Affairs (MoHUA) used a two-stage challenge/competition method to select Smart Cities. In stage one, an intra-state competition was conducted by the state governments. In this stage, 98 potential Smart Cities were selected on the basis of the criteria set by MoHUA and 12 cities were later added on the basis of requests received from the States. In stage two, each potential Smart City submitted its Smart City Proposal (SCP) and was evaluated by a team of national and international experts at the city level and according to its proposal level. The scheme was an-nounced in June 2015 and by June 2017 90 cities were selected in various rounds (see Table 1.1).

PARLIAMENTARY WATCH REPORT 2017 | 5
Uttar Pradesh and Tamil Nadu have won the maximum number of cities. Both the states have 12 cities each for development under the Mission. Following this is Maharashtra with 10 cities. Madhya Pradesh, Gujarat and Karnataka have won 7, 6 and 6 cities, respectively. These five states together account for around 60 percent of total cities selected under the Mission.
ii. Implementing agency
Parliamentarians enquired about the nature of the implementing agency, its function and its current status. The Ministry informed that Special Purpose Vehicles (SPVs) are the implementing body of the SCM and have been formed in 77 out of the 90 selected cities.
Furthermore, it was also questioned whether these SPVs will fall under the purview of the Right to Informa-tion (RTI) Act. The MoHUA answered that since the State/Union Territory (UT) and the urban local bodies (ULB) will be the promoters having 50:50 equity shareholding and control of the SPV, the admissibility of RTI on SPV will be governed by the RTI Act, 2005, and provisions under the Companies Act, 2013.
iii. Funding
The Ministry stated that the Central Government will provide financial support of INR 500 crores to each selected Smart City. An equal contribution would be provided by the State Government. The remaining funds required are expected to be mobilised by the States/ULBs through other sources like collection of user fees, beneficiary charges and impact fees, land monetisation, borrowings from financial institutions (including bilateral and multilateral institutions, both domestic and external sources), from the private sec-tor through public private partnerships (PPPs) and convergence with other missions, etc.
To bridge the gap between Government assistance (both at the Centre and the State) and requirement of cities, MoHUA is taking the following steps:
• Assisting cities to maximise internal sources of revenue such as property tax, advertisement tax, etc.
• Facilitating implementation of various projects under convergence with other schemes on solar roof-tops and the Integrated Power Development Scheme (IPDS), among others.
• Facilitating access to the bond markets and preparing PPP projects to access private funds, etc.
• Extending support for multilateral and bilateral assistance.
Questions regarding the involvement of foreign funds and investment were raised. The Ministry informed that based on its mutual understanding with States/UTs and foreign agencies, the Ministry is facilitating execution of Memoranda of Understanding (MoU)/agreements between foreign agencies and States/UTs for financial assistance under the Mission. A proposal for loan assistance of USD 500 million each from the World Bank and the Asian Development Bank has been approved by the Ministry of Finance. This loan is likely to be released in the financial year 2017–18.
To see the MoUs/agreements executed so far between foreign agencies and States/UTs . In addition, vari-ous other countries namely, Spain, Canada, China, Singapore, the United Kingdom, South Korea and Japan
Round No. of cities selected Date
Round 1 20 January 2016
Fast track round 13 May 2016
Round 2 27 September 2016
Round 3 30 June 2017
Total 90
Table 1.1: Selection of Smart Cities
Source: Unstarred Question No. 663, Lok Sabha,19 July 2017

6 | YUVA
have shown interest to participate in the development of Smart Cities. Though the Ministry did provide details about the foreign companies and countries interested in funding the Mission, the amount of funds invested by them, as asked in the question, was not mentioned.
S.No Name of foreign agency State/UT CityDate of MoU/
Agreement
1 US Trade and Development Agency (USTDA)
Andhra Pradesh
Uttar Pradesh
Rajasthan
Vishakhapatnam
Allahabad
Ajmer
25.01.2015
2 French Agency for Development (AFD)
Maharashtra
Chandigarh
Puducherry
Nagpur
Chandigarh
Oulgaret
24.01.2016
Table 1.2: Details of FDI in the Mission at a glance
Source: Unstarred Question No-1974, Rajya Sabha, 04 January 2018
iv. Monitoring
Questions were raised regarding the monitoring mechanism for the Mission. It was informed that, as per the SCM guidelines, at the city-level Smart City Advisory Forums (SCAFs) are being formed to engage and enable collaboration among multiple stakeholders, including citizens, and ensure timely progress. The SCAF will include the MP, Member of Legislative Assembly (MLA), Mayor, District Collector, Chief Execu-tive Officer (CEO) SPV, local youths, etc. However, information regarding the constitution of these Advisory Forums, as sought in the question, was not provided.
Apart from this, the progress of implementation is being reviewed regularly through video conference re-view meetings chaired by the Secretary, Housing and Urban Affairs (HUA) every month. Besides, the Mo-HUA Nominee Directors on the Boards of SPVs are also monitoring the progress in their respective cities on a regular basis.
For monitoring of funds, SPVs have been requested to register with the Public Financial Management Sys-tem (PFMS) to integrate their accounts, for online monitoring of fund transfer from States to SPVs.
v. Role of the Central Government
The role of the Ministry of Urban Development (MoUD) in the Mission was raised in both the Houses. It was stated that the MoHUA (then the MoUD) is providing technical support to the cities to implement their Smart City Plans, right from establishing the SPV to implementation of projects and reforms. The Ministry has also empanelled agencies to help cities implement reforms in the areas of property tax, advertisement tax, value capture financing (recovery of incomes accrued to private property owners from publicly financed projects), reduction of non-revenue water, credit rating of ULBs and municipal bond financing (raising debt in the name of the ULBs). Model request for proposals (RFPs) have been issued to the States for procuring agencies in the above mentioned areas.
The Ministry also offers individual capacity building workshops to train municipal employees in all Atal Mission for Rejuvenation and Urban Transformation (AMRUT) cities, including Smart Cities. For this, 27 training entities have been empanelled by the Ministry under the Capacity Building in Urban Development (CBUD) Project. Till now, 10,000 municipal functionaries have been trained in the areas of finance, rev-enue, engineering, public health, town planning and administration. Additionally, specialised workshops were also organised to periodically disseminate best practices and for knowledge sharing among cities.

PARLIAMENTARY WATCH REPORT 2017 | 7
vi. People, socio economic development and the SCM
A pertinent question was raised in the Rajya Sabha with regard to Area Based Development (ABD) under the SCM and the estimated number of people expected to be benefited from these projects. To this, the Min-istry responded that the total population benefited in the ABD of 90 cities is 66,13,129. This is mere 9.04% of the total population (7,31,53,153) of the 90 cities. The Ministry further emphasised that the projects in the ABD areas are expected to have much wider benefit for the city as a whole, beyond the ABD areas. Addition-ally, a substantial proportion of the investments planned under the Mission will provide city-wide benefits. The total investment proposed in ABD is INR 1,52,500 crore, which is almost 80% of the total investment proposed under the Mission.
Another question enquired about the socio-economic status and per capita gross domestic product (GDP) of the residents chosen for ABD. The Ministry informed that this data is not maintained.
An interesting question was raised about whether affordable housing projects, new schools, hospitals and roads are proposed in the selected cities. The Ministry answered that the city has to formulate its own con-cept, vision, mission and a plan for a Smart City that is appropriate given its local context, resources and level of ambition. Even though a particular model is not being prescribed, it is expected that the SCPs will include a large number of infrastructure services and smart solutions, as highlighted in the Mission guide-lines. Affordable housing projects, new schools, hospitals and the development of roads can be included in the SCPs but are not mandatory.
Regarding housing, a question was raised about the Government’s plans to accommodate those people who would be displaced under these projects. The Ministry replied that most of the SCPs envisage retrofitting as an ABD strategy. All redevelopment projects also envisage in-situ rehabilitation of existing population. However, in affected cases, it is for the State Government to decide the issue of displacement of people as per their State laws.
vii. Status of implementation
A total investment of INR 1,91,155 crore has been proposed by the 90 Smart Cities in their proposals. Sub-sequent to the selection and setting up of SPVs, a Government of India grant of INR 9,863.20 crore has been released to 60 Smart Cities through respective State Governments, which is 5% of the total amount proposed (see Table 1.3). Out of this, INR 644.77 crore has been utilised, which is a utilisation rate of less than 7%. While the total amount released by the Centre was provided, the status of implementation and funds utilised was not adequately answered.
Year 2015–16 2016–17 2017–18 Total
Funds released 1469.2 4492.5 3901.5 9863.20
Table 1.3: Funds released under the Smart City Mission as on 2 August 2017 (in INR Crores)
So far, 2,864 projects worth INR 1,35,958 crore are in various stages of implementation. While 148 projects worth INR 1,872 crore have been reported as completed, implementation has commenced for 407 projects worth INR 15,600 crore. Tendering has started for 237 projects with a cost of INR 13,514 crore. Detailed Project Reports (DPRs) have been approved for 47 projects worth INR 2,712 crore and are being prepared for 2,025 projects worth INR 1,02,260 crore. So far, only 5% of the total projects have been completed while 70% of the projects are still in the project development stage (see Table 1.4).

8 | YUVA
Table 1.4: Status of projects and fund allocation under the mission as on 28 December 2017 (in INR Crores)
No of projects
Funds allocated Status Stage
% of total projects in each stage
% of funds allocated of total allocation
148 1,872 Completed Stage 5 5.2 1.4
407 15,600 Implementation commenced Stage 4 14.2 11.5
237 13,514 Tendering started Stage 3 8.3 9.9
47 2,712 DPRs approved Stage 2 1.6 2.0
2025 1,02,260 DPRs being prepared Stage 1 70.7 75.2
2864 1,35,958 Total 100.0 100
Source: Unstarred Question-1162, Rajya Sabha, 28 December 2017
Table 1.5: Details of total number of projects sanctioned State-wise, percentage of State’s share in the total cost and comparison between percentage of work completed to
percentage of cost utilised (in INR Crores)
If one were to view the last two columns of Table 1.5, a trend emerges indicating that the share of completion with regard to the number of projects completed always exceeds the share of completion in relation to cost. From this, it can be construed that completion is primarily in low cost projects.
1.4 Scope for civil society engagement
While the SCM was widely discussed in Parliament this year, qualitative questions that help assess the im-pact of the development on various groups in society, including the urban poor, have not been asked. SCPs should focus on improvement in the Human Development Index with investments in sectors like affordable housing, health, education, employment generation and promoting sustainable environment.
It was observed that when the achievements of the Mission were questioned, quantitative information was provided by the Ministry regarding the number of projects completed and the funds released by the Central

PARLIAMENTARY WATCH REPORT 2017 | 9
Government, sidestepping the qualitative impact of the Mission, especially for the urban poor. Since there is also a provision of third-party review to be conducted by SPVs, it’s important to assess the actions taken by the Government on these external review reports.
Civil society groups can engage with the SPV at the city-level, and the Apex Committee at the national-level and various stakeholders like the District Collector, MP, MLA, Mayor, CEO of the SPV, local youths, techni-cal experts, etc so that smart solutions developed are inclusive in nature. Civil society can regularly engage with the government and elected representatives to provide suggestions to modify the guidelines/criteria for different schemes according to the ground realities. This will keep the government abreast of the misuse of funds and violation of human rights, if any.

Launch25 June 2015 25 June 2022
Fact
Pradhan Mantri Awas Yojana (Urban) [PMAY(U)]
Chapter 02
Houses sanctioned
Houses completed
Total 100%
12.80%
4.80%
2014-2015 2015-2016 2016-2017 Total% share of total houses constructed (approx.)
JNNURM 1,13,951 94,358 64,433 2,72,742 76
RAY 2,506 12,161 26,681 41,348 11
PMAY(U) 0 6,545 40,304 46,849 13
Total 1,16,457 1,13,064 1,31,418 3,60,939
If 100 houses were to be constructed annually, only roughly 13 are sanctioned but even worse so, only 5 are built.
At the current pace of implementation, construction of the 2 crore houses promised under PMAY(U) will not be realised in 2022 but in 2179 AD.
Houses constructed under different housing schemes
Status of Implementation
End
Tamil Nadu 12.3%
Andhra Pradesh 2.8%
Telangana
Odisha 1.4%
West Bengal
Chhattisgarh
Madhya Pradesh 5%
Uttar Pradesh Bihar
Rajasthan
Gujarat 12.9%
Maharashtra
Karnataka 5.5%
Goa
Kerala 1.2%
Punjab
Haryana
Assam 0.3%
HimachalPradesh
Uttarakhand
Jharkhand
Sikkim
Manipur
Andaman and Nicobar Islands
Arunachal Pradesh
Chandigarh
Dadra and Nagar Haveli
Daman and Diu
Delhi
Lakshadweep
Meghalaya
Mizoram
Nagaland
Tripura
Puducherry
Jammu and Kashmir 0.4%
1.5%
15%
6.6%7.2%
0.9%
4.8%
0.6%
0.1%
0.6%
2.2%
0%
0.2%
0%
0.1%
0.7%0.2%
0.2%
0%
0%
0%
1.4%
2.8%
0.1%0.2%
4.7%
0%
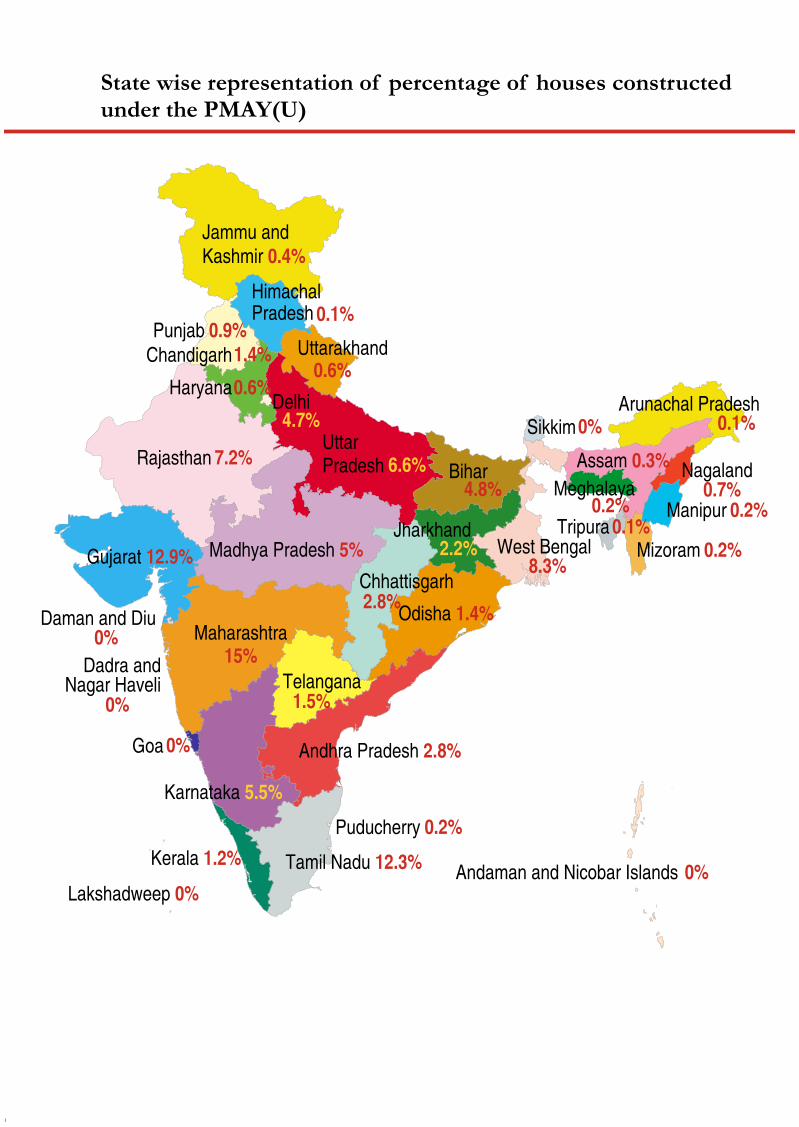
State wise representation of percentage of houses constructed under the PMAY(U)
8.3%
Launch25 June 2015 25 June 2022
Fact
Pradhan Mantri Awas Yojana (Urban) [PMAY(U)]
Chapter 02
Houses sanctioned
Houses completed
Total 100%
12.80%
4.80%
2014-2015 2015-2016 2016-2017 Total% share of total houses constructed (approx.)
JNNURM 1,13,951 94,358 64,433 2,72,742 76
RAY 2,506 12,161 26,681 41,348 11
PMAY(U) 0 6,545 40,304 46,849 13
Total 1,16,457 1,13,064 1,31,418 3,60,939
If 100 houses were to be constructed annually, only roughly 13 are sanctioned but even worse so, only 5 are built.
At the current pace of implementation, construction of the 2 crore houses promised under PMAY(U) will not be realised in 2022 but in 2179 AD.
Houses constructed under different housing schemes
Status of Implementation
End
Tamil Nadu 12.3%
Andhra Pradesh 2.8%
Telangana
Odisha 1.4%
West Bengal
Chhattisgarh
Madhya Pradesh 5%
Uttar Pradesh Bihar
Rajasthan
Gujarat 12.9%
Maharashtra
Karnataka 5.5%
Goa
Kerala 1.2%
Punjab
Haryana
Assam 0.3%
HimachalPradesh
Uttarakhand
Jharkhand
Sikkim
Manipur
Andaman and Nicobar Islands
Arunachal Pradesh
Chandigarh
Dadra and Nagar Haveli
Daman and Diu
Delhi
Lakshadweep
Meghalaya
Mizoram
Nagaland
Tripura
Puducherry
Jammu and Kashmir 0.4%
1.5%
15%
6.6%7.2%
0.9%
4.8%
0.6%
0.1%
0.6%
2.2%
0%
0.2%
0%
0.1%
0.7%0.2%
0.2%
0%
0%
0%
1.4%
2.8%
0.1%0.2%
4.7%
0%
State wise representation of percentage of houses constructed under the PMAY(U)
8.3%
12 | YUVA
CHAPTER 2 PRADHAN MANTRI AWAS YOJANA (URBAN)2.1 Mission at a glance
It has been increasingly realised across the globe that sustainable housing and urban development have a crucial bearing on the quality of life and social and economic well being of the people. The need for afford-able and sustainable housing is being increasingly discussed and explored internationally. Housing was placed at the centre of the New Urban Agenda (NUA) of Habitat III, 2016.
The impact and commitment to the NUA was seen at the national level too when the Prime Minister (PM) envisioned Housing for All by 2022. With separate programmes for urban housing and rural housing, this mission was launched on 25 June 2015 with the aim to provide housing to all ‘eligible’ families by 2022. This is being considered the biggest and the most significant initiative taken by the Central Government for the prevention of slums and creation of affordable housing, as this would involve the construction of 2 crore houses over a period of seven years, averaging at roughly 30 lakh houses a year.
2.2 Analysis of questions
A total of 98 questions in Lok Sabha and 99 questions in Rajya Sabha were raised regarding various aspects of PMAY (U). These include the status of implementation, funds released, targets achieved and reasons for lapses. Of all the urban schemes, majority of the questions addressed to the Ministry in all the sessions were related to PMAY(U), which shows the importance of this Scheme. PMAY (U) has four main components namely, In-situ Slum Rehabilitation (ISSR), Affordable Housing in Partnership (AHP), Credit Linked Subsidy (CLS) and Subsidy for Beneficiary-led Households Scheme (BLS). Questions were mainly raised related to two components, i.e., ISSR and AHP components and the other two components were hardly addressed in the questions.
2.3 Analysis of answers
Answers have been analysed based on themes such as the overall housing scenario in India as stated by the Ministry, achievements of the Mission so far with a focus on ISSR and AHP, status of the demand survey and unoccupied houses, role of the central government, rental housing and forced eviction of slums.
A mismatch was observed in the questions raised and answers provided by the Ministry. For example, data was asked for the number of houses ‘allotted’ to the urban poor under the Mission whereas the Ministry mentioned the number of houses ‘sanctioned’.
In some answers, the data included the backlog completed under Rajiv Awas Yojana (RAY) and Indira Awas Yojana (IAY) as well. It was thus difficult to arrive at clear figures with respect to the specific achievements of the scheme.
i. Housing scenario in India
In 2012, the Technical Group on Urban Housing Shortage (TG-12), constituted by the erstwhile Ministry of Housing and Urban Poverty Alleviation (MoHUPA) stated that there would be a shortage of 18.78 million housing units over the period 2012–2017. Of these, the economically weaker section (EWS) alone accounts for 10.55 million units or 56% of the total shortage. The Low Income Groups (LIGs) require 7.41 million housing units or 39.4% whereas middle and above income groups have deficit of 0.82 million or 4.4%. Evi-dently, the gap is mostly in the affordable sector, i.e EWS and LIG segments. This shortage was found in states with high density of population. Ten states contribute to 76% of urban housing shortage. These states are Uttar Pradesh, Maharashtra, West Bengal, Andhra Pradesh, Tamil Nadu, Bihar, Rajasthan, Madhya Pradesh, Karnataka and Gujarat (Technical Group Report, 2017)
As per the survey conducted by the National Sample Survey Organisation (NSSO) in December 2012, the estimated number of slums and houses in such slums in urban areas were 33,510 and 80,520,700 respec-tively. In addition, as per the Census figures, the slum population in the country has increased from 5.23
PARLIAMENTARY WATCH REPORT 2017 | 13
crore in 2001 to 6.55 crore in 2011. The reasons cited by the Ministry for this rise are - increased urbanisa-tion, natural increase in the population of urban poor, migration, and constraints on supply of land for mass affordable housing.
Lack of decent affordable housing models in cities is leading to rise in the number of slums with high density of population. The living conditions in these slums is only getting worse as many slums lack access to basic services like water, sanitation and electricity. The National Advisory Council (NAC) had also stressed that slum dwellers should be resettled at their current place of residence.
ii. Achievements of the Mission
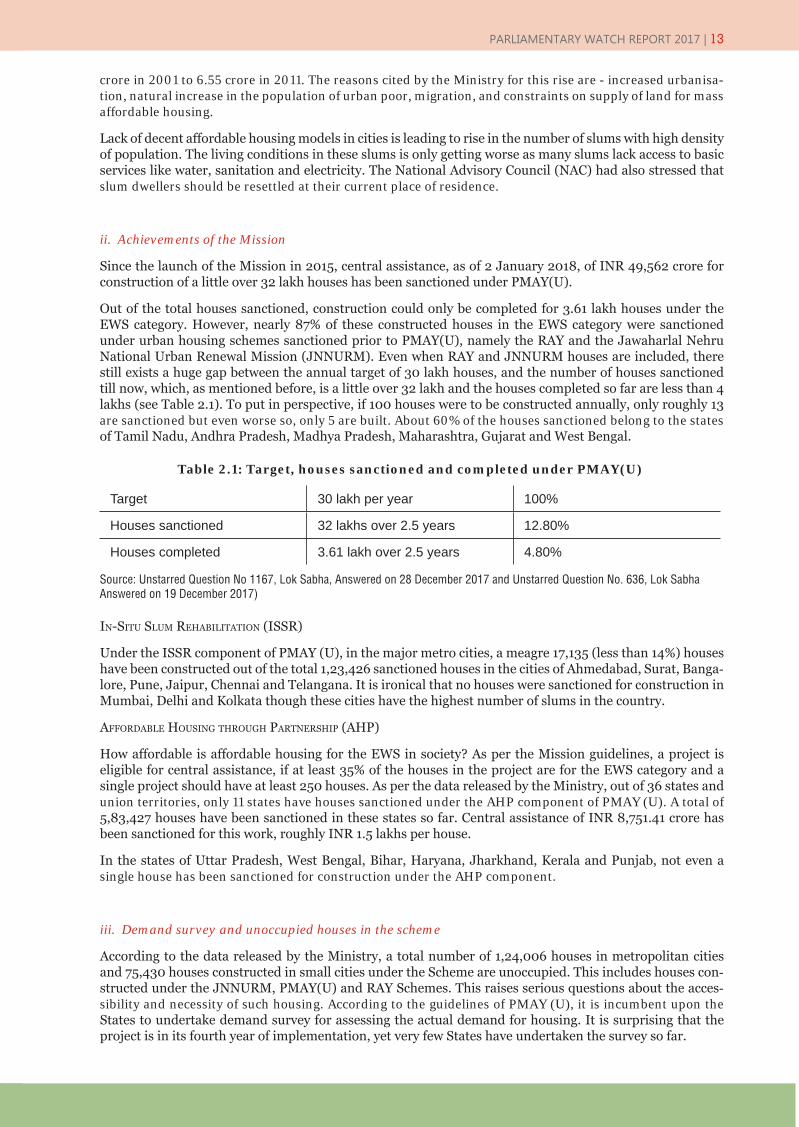
Since the launch of the Mission in 2015, central assistance, as of 2 January 2018, of INR 49,562 crore for construction of a little over 32 lakh houses has been sanctioned under PMAY(U).
Out of the total houses sanctioned, construction could only be completed for 3.61 lakh houses under the EWS category. However, nearly 87% of these constructed houses in the EWS category were sanctioned under urban housing schemes sanctioned prior to PMAY(U), namely the RAY and the Jawaharlal Nehru National Urban Renewal Mission (JNNURM). Even when RAY and JNNURM houses are included, there still exists a huge gap between the annual target of 30 lakh houses, and the number of houses sanctioned till now, which, as mentioned before, is a little over 32 lakh and the houses completed so far are less than 4 lakhs (see Table 2.1). To put in perspective, if 100 houses were to be constructed annually, only roughly 13 are sanctioned but even worse so, only 5 are built. About 60% of the houses sanctioned belong to the states of Tamil Nadu, Andhra Pradesh, Madhya Pradesh, Maharashtra, Gujarat and West Bengal.
Target 30 lakh per year 100%
Houses sanctioned 32 lakhs over 2.5 years 12.80%
Houses completed 3.61 lakh over 2.5 years 4.80%
Table 2.1: Target, houses sanctioned and completed under PMAY(U)
Source: Unstarred Question No 1167, Lok Sabha, Answered on 28 December 2017 and Unstarred Question No. 636, Lok Sabha Answered on 19 December 2017)
In-SItu Slum RehabIlItatIon (ISSR)
Under the ISSR component of PMAY (U), in the major metro cities, a meagre 17,135 (less than 14%) houses have been constructed out of the total 1,23,426 sanctioned houses in the cities of Ahmedabad, Surat, Banga-lore, Pune, Jaipur, Chennai and Telangana. It is ironical that no houses were sanctioned for construction in Mumbai, Delhi and Kolkata though these cities have the highest number of slums in the country.
affoRdable houSIng thRough PaRtneRShIP (ahP)
How affordable is affordable housing for the EWS in society? As per the Mission guidelines, a project is eligible for central assistance, if at least 35% of the houses in the project are for the EWS category and a single project should have at least 250 houses. As per the data released by the Ministry, out of 36 states and union territories, only 11 states have houses sanctioned under the AHP component of PMAY (U). A total of 5,83,427 houses have been sanctioned in these states so far. Central assistance of INR 8,751.41 crore has been sanctioned for this work, roughly INR 1.5 lakhs per house.
In the states of Uttar Pradesh, West Bengal, Bihar, Haryana, Jharkhand, Kerala and Punjab, not even a single house has been sanctioned for construction under the AHP component.
iii. Demand survey and unoccupied houses in the scheme
According to the data released by the Ministry, a total number of 1,24,006 houses in metropolitan cities and 75,430 houses constructed in small cities under the Scheme are unoccupied. This includes houses con-structed under the JNNURM, PMAY(U) and RAY Schemes. This raises serious questions about the acces-sibility and necessity of such housing. According to the guidelines of PMAY (U), it is incumbent upon the States to undertake demand survey for assessing the actual demand for housing. It is surprising that the project is in its fourth year of implementation, yet very few States have undertaken the survey so far.
14 | YUVA
iv. Scheme targets
When the target set by the Central Government for construction of dwelling units was questioned, the Min-istry just resorted to mentioning the number of houses approved under the Mission. A total of around 32 lakhs houses have been approved for central assistance by the Ministry since the launch of the PMAY (U) Mission, which is around 16% of the target of 2 crore houses
v. Role of the Central Government
When questions are raised about slow implementation of schemes, the Ministry passes on the responsibility to the States, stating housing to be a State subject and hence the responsibility lies with the State Govern-ment or the urban local body (ULB) concerned. The Ministry stated that ‘during State level review meetings, video conferences and interactions with the State level representatives, the States/UTs are invariably urged to ensure that the construction of houses sanctioned under the projects is completed on time’.
vi. Rental housing
A few questions were raised about the National Rental Housing Policy. The Ministry simply replied that the policy has not been announced yet. According to a newspaper report published on 20 April 2017 in the Economic Times, the former Union Minister Venkaiah Naidu said, ‘We have formulated a National Urban Rental Housing Policy 2017 which will come up soon before the Union Cabinet for approval. The consulta-tion process is over and the draft is ready’.But there was no mention of any such draft or timeline for imple-mentation in the answers provided.
vii. Forced eviction of slums
A question was also raised inquiring about the number of slums demolished during the last 3 years and the amount of compensation disbursed, state-wise and year-wise. The Ministry simply answered that Housing, Land and Colonisation are State subjects and the demolition of slums comes under the purview of State Governments. Evictions of slums on Central Government land were not mentioned.
viii. Check on allocation of houses
A question was raised ‘whether the Government has constituted any committee to check the loot in the name of allocation of houses in cities/metro cities of the country’. The Ministry informed that no committee has been constituted to check malpractices in the name of allocation of houses in cities/metro cities of the country, since land and colonisation are State subjects and it is the responsibility of State/UT Governments through its implementing agencies to provide housing to its citizens. Identification of beneficiaries and al-location of houses to the beneficiaries is the responsibility of the State/UT Governments.
ix. Financial expenditure and funding
Since the launch of the Mission in 2015, central assistance, as of 2 January 2018, of INR 49,562 crore for construction of a little over 32 lakh houses has been sanctioned under PMAY(U). Evaluation of financial performance under PMAY(U) highlights issues such as insufficiency of funds, significant gaps between al-location and releases, and underutilisation of the released amount in the last few years. For example, 4 states have utilised less than 50% of the central grant released during the last 3 years. They are Jharkhand, Tripura, Orissa and Uttrakhand. The reasons given for the underutilisation are non-availability of encum-brance free land, reluctance of slum dwellers’ beneficiaries to shift temporarily in case of in-situ redevelop-ment projects, etc.
tax exemPtIonS and RelaxatIon of fdI noRmS to Induce InveStmentS
In order to keep the prices of the houses low, the Ministry of Housing and Urban Affairs (MoHUA) has recommended the Ministry of Finance to provide tax exemption to houses constructed under the ISSR and AHP components of PMAY(U) under the Goods and Services Tax (GST). A request has also been made to States /Unions Territories (UTs) to consider waiver of stamp duty for affordable housing projects.

PARLIAMENTARY WATCH REPORT 2017 | 15
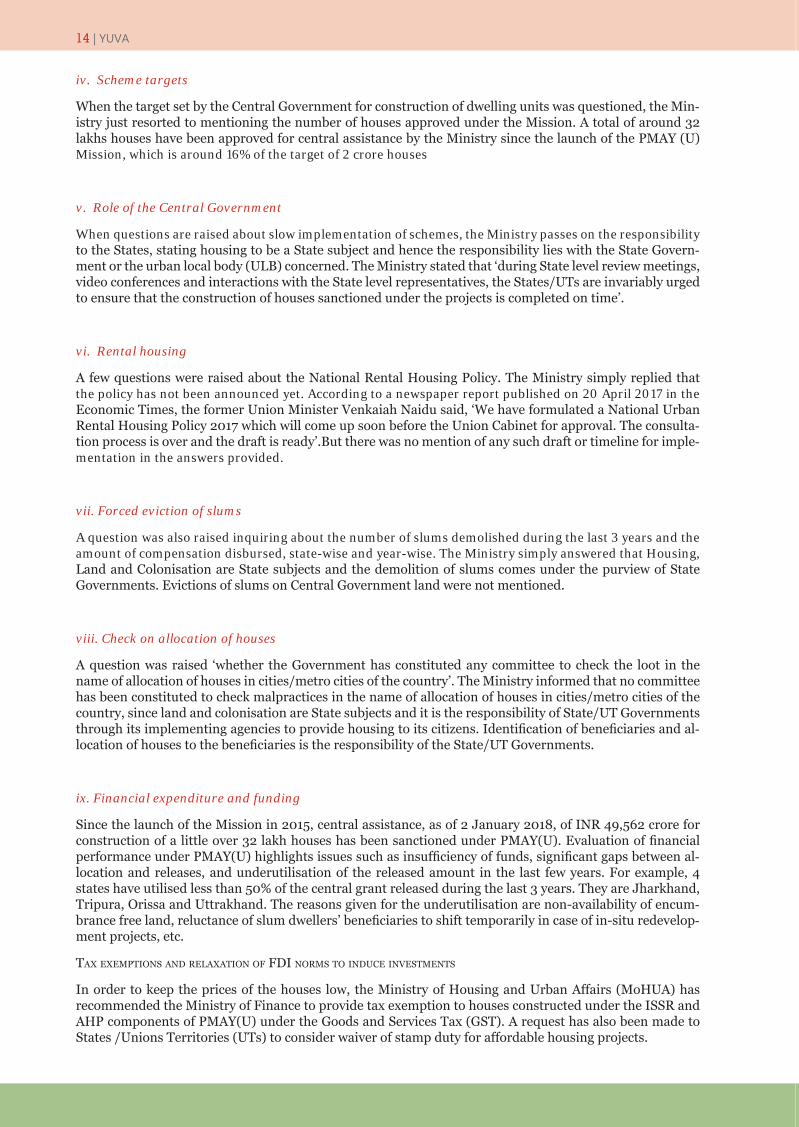
Table 2.3: Progress of PMAY(U) as on 30 November 2017
2014-2015 2015-2016 2016-2017 Total% share of total houses constructed (approx.)
JNNURM 113,951 94,358 64,433 272,742 76
RAY 2,506 12,161 26,681 41,348 11
PMAY 0 6,545 40,304 46,849 13Total 116,457 113,064 131,418 360,939
Table 2.2: Houses constructed under different housing schemes
Source: Unstarred Question No. 1167, Rajya Sabha, Answered on 28 December 2017
The Government also reviewed the Foreign Direct Investment (FDI) Policy and has liberalised its policy to attract investments. This change is expected to result in enhanced inflows into the construction develop-ment sector consequent to easing of sectoral conditions and clarification of terms used in the Policy. It is likely to attract investments in new areas and encourage development of plots for several housing given the shortage of land in and around urban agglomerations as well as the high cost of land. The measure is also expected to result in creation of much needed low cost affordable housing in the country.
x. Status of implementation
According to the data provided by the Ministry in reply to a question seeking information about the details of houses constructed, it was informed that under various schemes and programmes like JNNURM, RAY, IAY, PMAY(U), etc. a total of 3,60,939 have been constructed for the poor and people below poverty line during the last 3 years. Around 87% houses were constructed under subsumed projects of JNNURM and RAY and 13% houses were constructed under PMAY(U) (see Table 2.2). While maximum number of houses were constructed in the states of Maharashtra, Gujarat and Tamil Nadu, the state of Arunachal Pradesh, Assam, Haryana and Himachal Pradesh showed grim performance. State/UT wise details of houses con-structed for the urban poor, including people below the poverty line during each of the last 3 years under various schemes of JNNURM, RAY, and PMAY(U) are provided in Table 2.3.
16 | YUVA
Despite the attention given to PMAY(U) as the premier housing scheme, it is clear that from an implementa-tion perspective, the bulk of housing constructed is under the JNNURM and RAY Schemes propagated by the previous dispensation. Furthermore, even when subsuming JNNURM and RAY figures within PMAY’s ambit, the shortfall in houses constructed over the two years post PMAY’s announcement (2015–16 and 2016–17) remains severe. Out of the total annual requirement of 30 lakh houses, only 4% have actually been constructed. At this pace, the construction of the 2 crore houses promised under PMAY(U) will not be realised in 2022 but in 2182 AD1.
2.4 Scope for civil society engagement
There is a huge gap between planning and delivery. The PMAY (U) envisages building about 30 lakh houses per year, while only 2.44 lakh houses have been built since the announcement of the Scheme in 2015 (in-cluding houses constructed under the earlier JNNURM and RAY Schemes). This requires removing various barriers, such as the availability of finances, delays in approval of plans and lack of willingness to provide for housing upgradation. Reforms in development control regulations, building bye-laws and financing rules and regulations are other essential prerequisites. A state-wise demand survey needs to be conducted and targets need to be set for achieving targets. The proposals to meet the targets need to be studied to find cre-ative and affordable solutions to housing.
The housing shortage vis-a-vis the huge influx of people into urban areas should be examined by the Govern-ment and civil society. The proportion of migrants in the urban population is 35% as per the 2007–08 National Sample Survey. According to Census data on migration in 2001, the rural to urban migration was 21.74 million, up from 10.98 million in the decade up to 1971. The proliferation of slums in cities is a direct fallout of the ab-solute lack of affordable rental housing to cater to the huge influx of migrants, seasonal or otherwise. The focus of the Mission towards home-ownership is unlikely to solve the housing shortage in urban India, keeping in
Source: Starred Question No. 106 Rajya Sabha, 28 December 2017
1 Requirement - 2 crore houses in 7 years (2015 to 2022)Annual Target - 2 crore/7 = 28.57 lakhHouses completed in 3 years - 3.6 lakhHouses completed p.a. - 1.2 lakhCompletion rate (houses completed p.a./annual target) = 1.2 lakh/28.57 lakh = 4.2%Hence, effective time needed to meet target = total time/completion rate = 7/4.2%= 167 yearsHence, completion date = 2015+167 = 2182.

PARLIAMENTARY WATCH REPORT 2017 | 17
view that majority of the urban housing shortage pertains to EWS and LIG categories, to which most migrants belong. Even Budget incentives on home ownership by providing greater tax deduction on interest paid do not cater to the needs of migrants. On the rental side, there is no explicit incentive for growth of an affordable rental market on a pan-India basis. This gap needs to be filled. The draft National Urban Rental Housing Policy 2017 makes an attempt to address this. Pressure should be created to pass and implement this policy.
To accomplish the goal of building 2 crore houses by the year 2022, it is necessary to change the strategy from mass housing and re-housing to housing tailored for people’s needs. This involves beneficiary participation in action planning with a focus on upgradation, rental housing, rigorous project monitoring and accountability.
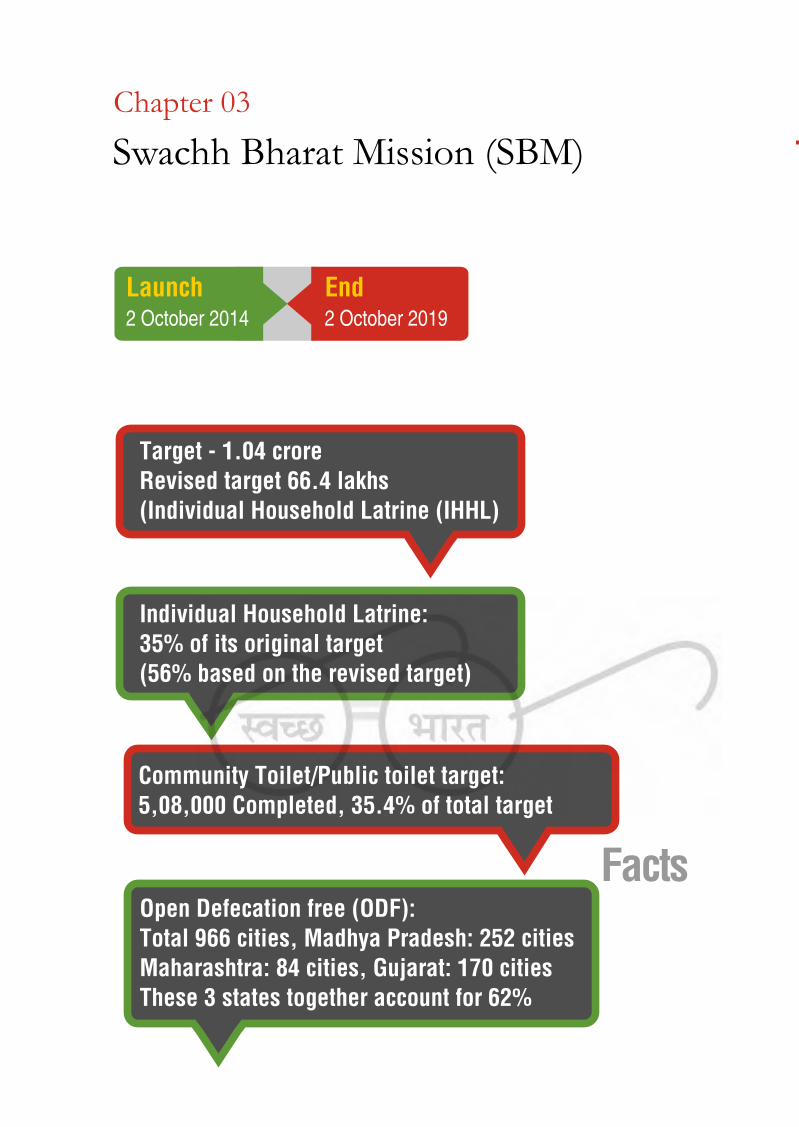
Launch2 October 2014
End2 October 2019
Target - 1.04 crore Revised target 66.4 lakhs (Individual Household Latrine (IHHL)
Swachh Bharat Mission (SBM)
Chapter 03
Individual Household Latrine: 35% of its original target (56% based on the revised target)
Community Toilet/Public toilet target: 5,08,000 Completed, 35.4% of total target
Open Defecation free (ODF): Total 966 cities, Madhya Pradesh: 252 cities Maharashtra: 84 cities, Gujarat: 170 citiesThese 3 states together account for 62%
Facts
City wise ranking of top 10 cities as per the Swachh Surverkshan 2017
10 Chandigarh
1 Indore
2 Bhopal
3 Visakhapatnam
4 Surat
5 Mysuru6 Tiruchirapally
7 New Delhi Municipal Council
8 Navi Mumbai
9 Vadodara

City wise ranking of top 10 cities as per the Swachh Surverkshan 2017
10 Chandigarh
1 Indore
2 Bhopal
3 Visakhapatnam
4 Surat
5 Mysuru6 Tiruchirapally
7 New Delhi Municipal Council
8 Navi Mumbai
9 Vadodara
20 | YUVA
CHAPTER 3 SWACHH BHARAT MISSION (SBM)3.1 Mission at a glance
The Government of India launched the Swachh Bharat Mission (SBM) for urban areas on 2 October 2014 with the aim to eliminate open defecation, manual scavenging, promote scientific management of municipal solid waste, promote behavioural change regarding healthy sanitation practices and generate awareness about sanitation and its linkage with public health by 2 October 2019. The Mission components are:
o Household toilets, including conversion of insanitary latrines into pour-flush latrines
o Community toilets
o Public toilets and urinals
o Solid waste management
o Information, education and communication (IEC) and public awareness
o Capacity building and administrative and office expenses (A&OE)
3.2 Analysis of questions
In the last 3 sessions of the Parliament, a total of 28 questions in the Lok Sabha and 27 questions in the Rajya Sabha were asked in relation to the SBM. In the budget and monsoon session, most of the questions focused on the construction and fund allocations of individual household latrines (IHHL), community toilets (CT) and public toilets (PT). In the winter session, most of the questions raised in both the Houses inquired about the survey conducted by the Government to accord rankings to the cities according to the status of sanitation.
The other two components of the Mission, i.e, solid waste management and public awareness, did not catch much attention of the parliamentarians.
It is rather surprising that in a country where the disposal of waste and defecation perpetuates the caste sys-tem, no questions were raised regarding manual scavengers or the inclusion of ragpickers in the SBM.
3.3 Analysis of answers
This section has been analysed based on the components of the SBM that were discussed in Parliament. Of the 6 components of the SBM, only 4 were discussed. These include—IHHL, CT, PT and urinals and solid waste management. The other two components—IEC and public awareness and capacity building did not garner much attention of the parliamentarians. The data provided by the Ministry was analysed against the set target and the fund utilised for the work done so far. Initiatives taken by the Ministry to improve the ef-ficacy of the Mission, like the Swachh Sarvekshan 2017 and Swachhata-MoHUA have also been discussed.
i. Implementation
ConstruCtion of toilets
According to the data provided by the Ministry, a little over 37 lakh toilets have been constructed since 2014–17 against the total target of 1.04 crore toilets (later revised to 66 lakh) that need to be built by the completion of the scheme in 2019. The mission is in its fourth year of implementation and has achieved about 35% of its original target (56% based on the revised target). It is not clear how the target of 1.04 crore or 66 lakh toilets will be met.
According to the data provided by the Ministry, a total number of 37,66,664 toilets have been constructed under the Mission (including both IHHL, CT and PT). (see table 3.1)
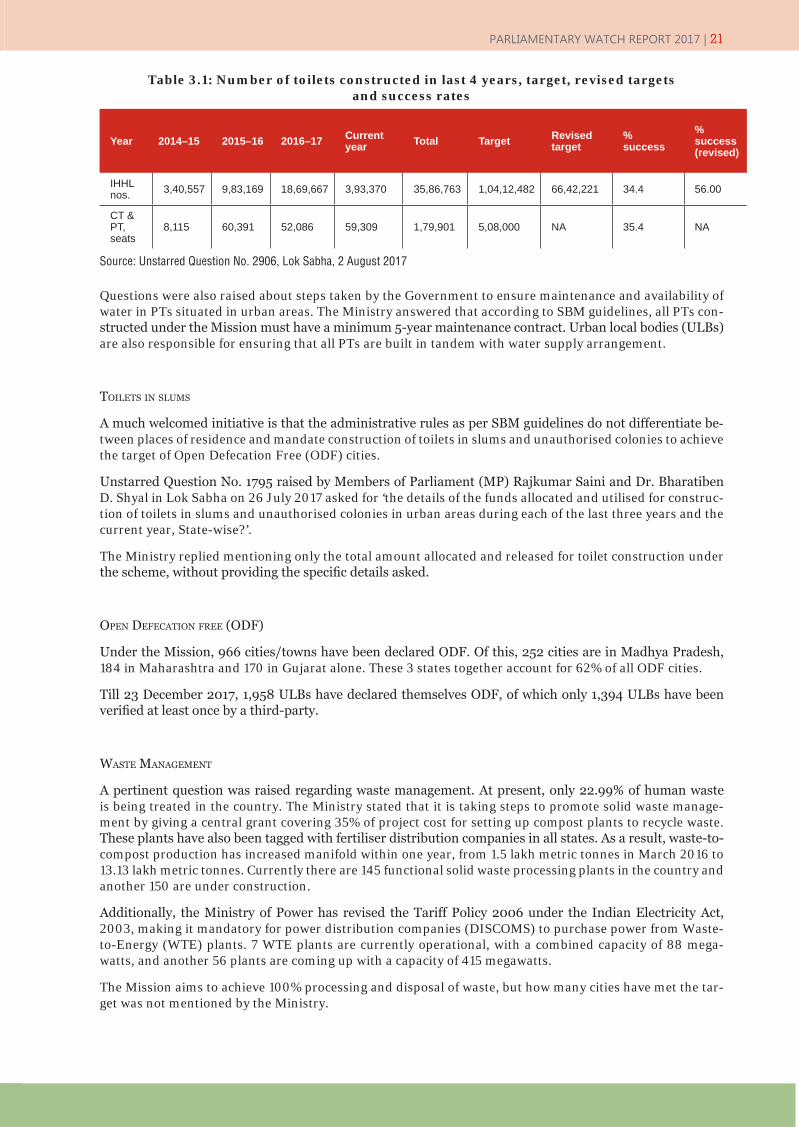
PARLIAMENTARY WATCH REPORT 2017 | 21
Questions were also raised about steps taken by the Government to ensure maintenance and availability of water in PTs situated in urban areas. The Ministry answered that according to SBM guidelines, all PTs con-structed under the Mission must have a minimum 5-year maintenance contract. Urban local bodies (ULBs) are also responsible for ensuring that all PTs are built in tandem with water supply arrangement.
toilets in slums
A much welcomed initiative is that the administrative rules as per SBM guidelines do not differentiate be-tween places of residence and mandate construction of toilets in slums and unauthorised colonies to achieve the target of Open Defecation Free (ODF) cities.
Unstarred Question No. 1795 raised by Members of Parliament (MP) Rajkumar Saini and Dr. Bharatiben D. Shyal in Lok Sabha on 26 July 2017 asked for ‘the details of the funds allocated and utilised for construc-tion of toilets in slums and unauthorised colonies in urban areas during each of the last three years and the current year, State-wise?’.
The Ministry replied mentioning only the total amount allocated and released for toilet construction under the scheme, without providing the specific details asked.
open DefeCation free (oDf)
Under the Mission, 966 cities/towns have been declared ODF. Of this, 252 cities are in Madhya Pradesh, 184 in Maharashtra and 170 in Gujarat alone. These 3 states together account for 62% of all ODF cities.
Till 23 December 2017, 1,958 ULBs have declared themselves ODF, of which only 1,394 ULBs have been verified at least once by a third-party.
Waste management
A pertinent question was raised regarding waste management. At present, only 22.99% of human waste is being treated in the country. The Ministry stated that it is taking steps to promote solid waste manage-ment by giving a central grant covering 35% of project cost for setting up compost plants to recycle waste. These plants have also been tagged with fertiliser distribution companies in all states. As a result, waste-to-compost production has increased manifold within one year, from 1.5 lakh metric tonnes in March 2016 to 13.13 lakh metric tonnes. Currently there are 145 functional solid waste processing plants in the country and another 150 are under construction.
Additionally, the Ministry of Power has revised the Tariff Policy 2006 under the Indian Electricity Act, 2003, making it mandatory for power distribution companies (DISCOMS) to purchase power from Waste-to-Energy (WTE) plants. 7 WTE plants are currently operational, with a combined capacity of 88 mega-watts, and another 56 plants are coming up with a capacity of 415 megawatts.
The Mission aims to achieve 100% processing and disposal of waste, but how many cities have met the tar-get was not mentioned by the Ministry.
Year 2014–15 2015–16 2016–17 Current year Total Target Revised
target% success
% success (revised)
IHHL nos. 3,40,557 9,83,169 18,69,667 3,93,370 35,86,763 1,04,12,482 66,42,221 34.4 56.00
CT & PT, seats
8,115 60,391 52,086 59,309 1,79,901 5,08,000 NA 35.4 NA
Table 3.1: Number of toilets constructed in last 4 years, target, revised targets and success rates
Source: Unstarred Question No. 2906, Lok Sabha, 2 August 2017

22 | YUVA
ii. Monitoring
sWaChh survekshan 2017
Questions regarding Swachh Survekshan 2017 were raised in both the Houses. While other MPs asked about the parameters set for the Survekshan and the details of the rankings awarded to these cities, Rajya Sabha MP K.R. Arjuman questioned the funding involved in the whole exercise. The MP stated, ‘whether false claims about sanitation infrastructure and their usage to improve rankings of the Swachhta Index would cost municipal bodies dear’. The Ministry restricted its reply to explaining the parameters fixed for the Survekshan, than answering this specific question raised.
For the purpose of monitoring the status of sanitation in cities, the Ministry has developed a survey process called Swachh Survekshan. The methodology for Swachh Survekshan comprises assessing the sanitation level and cleanliness attained by ULBs through (i) physical verification of service level progress with weight-age of 35%; (ii) direct observation at randomly selected public places with weightage of 30%; and (iii) citi-zens feedback with weightage of 35%.
The first such Swachh Survekshan in 2016 ranked 73 cities with a 10 lakh-plus population and all the State/Union Territory (UT) capitals. The Swachh Survekshan in 2017 was expanded to cover 434 cities with a population of more than 1 lakh and State/UT capitals. The third Swachh Survekshan in 2018 which begins on 4 January 2018, will rank 4,041 cities.
According to the Survekshan 2017, Indore was declared India’s cleanest city, followed by Bhopal, Visakhapat-nam, Surat, Mysuru, Tiruchirapally, New Delhi Municipal Council, Navi Mumbai, Vadodara and Chandigarh.
According to the data provided by the Ministry with respect to Swachh Survekshan 2017, 80% citizens felt that overall cleanliness levels in their cities were better than in the past. The other major findings from this survey are:
o In 404 cities, more than 75% residential areas were found to be substantially clean;
o 297 cities have 100% door-to-door garbage collection
o In 226 cities, twice a day sweeping is carried out in more than 75% of commercial areas
o In 190 cities, 75% of CTs/PTs were well maintained
o In 85 cities, waste segregation at source is being practised.
iii. Funding
A total amount of INR 4,819.79 crores was allocated under the Mission (2014–19) for construction of IHHL and CT/PT, of which 54% or INR 2,594 crores is utilised. (see Table 3.2)
Table 3.2: Funds allotted and expenditure incurred for toilet construction under SBM (in INR Crore)
Source: Unstarred Question No. 2906, Lok Sabha, 2 August 2017
Category Amount allocated Expenditure incurred % funds utilised
IHHL 4,165.03 2,169.88 52%
CT/PT 654.76 425.80 65%
The table 3.2 clearly indicates an under-utilisation of funds allotted under the Mission. However the government collected INR 3,901.78 crore during fiscal year 2015-16 from the 0.5% Swachh Bharat cess which is imposed on all taxable services. According to a leading newspaper report (Arun and Kota, 2016) ‘It’s truly disconcerting that the levy takes the form of a cess, allowing it to be entirely retained by the Central government, unlike most taxes which have to be shared with the states under Article 270 of the Constitution. To add to this, there is no separate fund in which the proceeds of the cess will be placed to make its use transparent. There is also no timeline for its use. Finally, the use mandated under the new law is so vaguely worded that it could extend to activities that won’t really help the cause of a Clean India. For instance, “promotion of Swachh Bharat initiatives” and “other purposes related thereto” could easily cover travel, quasi-political hoardings and whatever else an imaginative bureaucrat or politician could think up.
With the existing Swachh Bharat Kosh and a World Bank loan of Rs 10,000 crore for Swachh Bharat Abhiyaan, the question is: did the government really need to levy the cess?’

PARLIAMENTARY WATCH REPORT 2017 | 23
The involvement of the World Bank in the SBM was questioned, to which the Ministry replied that the Cabinet has approved the proposal of the Ministry of Drinking Water and Sanitation for implementation of the SBM (Rural), namely ‘World Bank Support Swachh Bharat Mission’. The role is to incentivise the States on the basis of their performance. Under this project, a loan from the World Bank, amounting to USD 1,500 million has been provided, of which USD 1,475 million has been allocated for disbursement to States and UTs. USD 25 million has been provided for strengthening the capacity of the Ministry of Drinking Water and Sanitation. So far, INR 2.92 lakhs has been utilised by the concerned ministry, i.e., Ministry of Drinking Water and Sanitation.With respect to the SBM (Urban) there two development partners—the United States Agency for International Development (USAID) and the Bill & Melinda Gates Foundation.
iv. Use of information technology in the missionThe Ministry of Housing and Urban Affairs (MoHUA) has launched an IT-based grievance redressal solu-tion (Swachhata-MoHUA) for citizens and municipal bodies of 4,041 statutory towns to improve sanitation with citizens’ engagement. The application provides an interface to citizens to report complaints with re-spect to cleanliness.Currently, the App is being actively used by 1,700 ULBs, and 11.91 lakh citizens have downloaded it across the country. Since August 2016, 11,24,411 complaints have been lodged on the App, of which 10,48,560 have been resolved.The Ministry has also developed an SBM Dashboard and a monitoring tool which are available on the SBM Urban website.A helpline also exists to register complaints and provide information to citizens under SBM (Urban). The helpline number is 1969. All in all, on an average 57,938 complaints get registered on the Swachhata App per month.A question was raised regarding Google’s commitment in the SBM. The Ministry replied that Google is a technology partner supporting it in creating awareness about the content of the Mission through their chan-nels. The presence of a toilet locator feature in Google helps cities geo-tag their toilets on the Google Maps platform, so that cities can become ODF.Though IT greatly enhances the effective provision of services and utilities, it must be noted that in a coun-try like India, with low levels of digital connectivity and e-literacy, exclusive usage of IT enabled complaint and redressal mechanisms tend to be exclusionary.
3.4 Scope for civil society engagementSynergy between all components of the Mission—construction of IHHL, CTs and PTs; improved solid waste management; IEC; public awareness and capacity building—is essential to achieve its aims. However, civil society has a crucial role to play regarding implementation, maintenance and monitoring.Duplicate entries, ghost beneficiaries and missing households were the first stumbling blocks that research-ers from the Accountability Initiative of the Centre for Policy Research faced while tracking beneficiaries of the Government’s sanitation interventions across 7,500 households in 10 districts and 5 states in a Decem-ber 2015 study. Further, the study stated that 40% of those who had applied for money from the Govern-ment to build toilets reported not receiving it. The Government states that the Mission’s ‘funding gap’ will be bridged through a number of initiatives, such as imposing a special Swachh Bharat Cess, activating the Swachh Bharat Kosh to tap corporate social responsibility (CSR) funds and getting states to contribute from the increasing share of taxes and duties. Consumers are paying a 0.5% cess on tax paid, and it is important to quantify how much money the Gov-ernment is collecting as Swachh Bharat cess annually. Civil society should be able to monitor whether the government is unable to meet targets, if majority funds are lying underutilised, how much money is being mobilised and how it is being managed.With regard to implementation, advocacy initiatives with local governments can help ensure that the con-struction of toilets is inclusive, with provisions for people with disability and the third gender. The SBM Guidelines do not differentiate between residing places, thereby negating the scope for exclusion between notified and non-notified settlements. Civil society can collaborate with the local government to map the number of toilets constructed in slums and unauthorised colonies and their operational status.The aim and process of the Swachh Surverkshan must be reviewed. Local governments are competing with one another to earn top positions, often at the cost of human well being. There have been multiple cases recorded of informal settlements in Indore being forcibly evicted and rendered homeless to earn the first rank in 2016. In other cities, cases of arrests and punishments have been recorded for those defecating in the open when there are no or few toilets in their areas (Shantha, 2017)The implication of the SBM on informal livelihoods, especially those of waste recyclers and manual scaven-gers must be analysed. Alternate livelihood options, vocational training, opportunities for education must be provided to individuals and families of such traditional caste-based occupation workers whose only source of income is affected owing to mechanisation or banning.

LaunchJune 25, 2015
Duration5 years, ending in May 2020
Total SAAP - 77640, Central Assistance committed: 46% of total SAAP, % released: 19%
Facts
Atal Mission For Rejuvenation And Urban Transformation (AMRUT)
Chapter 04
Status of Implementation
Not even a single state received morethan 20% of the committed central assistance.
Total SAAP size
Committed central assistance
Central assistance released so far against approved
SAAPs
% of total central assistance released to central assistance
committed
77640.03 35989.7 6,917.52 19.20%
Central assistance released against SAAPs under AMRUT mission (in INR Crore) and SAAP*
Source: Unstarred Questions No. 602, Lok Sabha, 19 July 2017

Tamil Nadu 33
Andhra Pradesh 33
Telangana
Odisha 9
West Bengal
Chhattisgarh
Madhya Pradesh 34
Uttar Pradesh
BiharRajasthan
Gujarat 31
Maharashtra
Karnataka 27
Goa
Kerala 9
Punjab
Haryana
Assam 4
HimachalPradesh
Uttarakhand
Jharkhand
Sikkim
Manipur
Andaman and Nicobar Islands
Arunachal Pradesh
Chandigarh
Dadra and Nagar Haveli
Daman and Diu
Delhi
Lakshadweep
Meghalaya
Mizoram
Nagaland
Tripura
Puducherry
Jammu and Kashmir 5
12
44
6129
16
27
20
2
7
7
1
1
1
1
21
3
1
11
11
11
9
11
4
1
Number of Cities under AMRUT
60
26 | YUVA
CHAPTER 4 ATAL MISSION FOR REJUVENATION AND URBAN TRANSFORMATION (AMRUT)4.1 Mission at a glance
The government launched the Atal Mission for Rejuvenation and Urban Transformation (AMRUT) on 25 June 2015 to develop basic urban infrastructure in 500 Mission cities/towns.
The Mission focuses on the following areas:
o Water supply,
o Sewage facilities and septic management,
o Storm water drains to reduce flooding,
o Pedestrian, non-motorised and public transport facilities, parking spaces, and
o Enhancing amenity value of cities by creating and upgrading green spaces, parks and recreation centres, especially for children.
4.2 Analysis of questions
In the last 3 sessions, around 35 questions were addressed to the Ministry of Housing and Urban Affairs (Mo-HUA) by the Lok Sabha and 37 questions were raised by the Rajya Sabha concerning AMRUT. It is surprising to see that even in the third and final phase of implementation of the Scheme, some questions sought basic information, like parameters determined for the selection of cities, the numbers of cities selected and mecha-nisms for monitoring. Whenever detailed questions were asked regarding the status of implementation and fund utilisation, the answers could not provide any comprehensive data.
A majority of questions raised in both the Houses were related to sewage treatment plants. Unstarred Ques-tion No. 1751, part (e) on 26 July 2017 asked by Member of Parliament (MP) Malyadri Sriram in Lok Sabha inquired ‘whether the Government proposes to increase the capacity of existing sewage treatment plants or install more sewage treatment plants to meet the gap in demand and supply’. And if ‘the Government pro-poses to decentralize more sewage treatment plants’. The Ministry, in its answer, provided data on funds proposed by States in the State Annual Action Plan (SAAP) for sewerage projects under AMRUT, without addressing the subject raised in the question. A clear answer was not provided.
In the same question, other details such as ‘the plans of the Government to tackle the issue of underutilisa-tion of the existing sewage treatment plants?’ were asked. The Ministry in its reply stated, ‘One focus area of AMRUT is to provide sewerage connections to households. This will result in maximizing capacity utilisation, wherever surplus capacity is available’. This answer too did not provide information sought.
Similar gaps and a mismatch between questions and answers were observed in other questions as well. In an answer to a couple of questions regarding implementation, the Ministry just limited its replies to the amount of funds released by the Centre. The nature of projects undertaken, the percentage of projects completed and the amount of funds utilised were not adequately addressed in these sessions. For example, the percentage of households that have access to a tap with assured supply of water and a sewerage connection in the 500 cities was asked by MP Manish Gupta in the Rajya Sabha. The Ministry restricted information to financial progress under the Scheme. Data regarding the material achievements of the Scheme was not provided.
In Unstarred Question No. 602, ‘the details of proposals received under AMRUT so far and the number of them cleared, city and State-wise;’ were asked. The Ministry in its reply stated, ‘The Centre has already approved 1st & 2nd SAAP of all 36 States/UTs and full mission period (2019-20) to 18 States/UTs’. The details of projects asked, however, were missing. This question further inquired about ‘the details of funds sanctioned/released so far and works undertaken or likely to be undertaken, year, city and State-wise’. The Ministry provided the figure for Central assistance released to the States but did not answer the works un-dertaken or likely to be undertaken.

PARLIAMENTARY WATCH REPORT 2017 | 27
4.3 Analysis of answers
Answers have been analysed and categorised based on themes such as selection procedure, financial alloca-tion and funding, monitoring and status of implementation.
i. Selection process
Names of cities selected under the Mission were cited state-wise. Uttar Pradesh and West Bengal got the maximum share of cities under the Mission. Uttar Pradesh had won 61 cities and West Bengal 60 cities, fol-lowed by Maharashtra, Madhya Pradesh and Andhra Pradesh with 44, 34 and 33 cities, respectively. Also, 31 cities were selected for the state of Gujarat. It was asked whether the Government had plans to increase the number of cities and funds under AMRUT, to which the Ministry answered that the Mission had a total out-lay of INR 50,000 crores and there was no proposal to increase the number of cities or outlay of the Mission. It must be noted that out of INR 50,000 crores, only 60% has actually been spent so far.
ii. Financial allocation and funding
Since the announcement of the Mission in 2015, a total of INR 6,917.52 crore has been released to States/Union Territories (UTs), which accounts for almost 20% of the total funds allocated for 5 years. The delays in fund release has been a consistent trend under the scheme. In the last phase, out of 36 states and UTs, 21 states did not receive any funds for the last SAAP as of 19 July 2017. The reasons for this underutilisation were not cited.
Information was also sought regarding the involvement of private partnership under AMRUT, but without any state- or city-specific details. The Ministry mentioned that AMRUT mandates the States/UTs to explore the possibility of using public private partnership (PPP) for funding, execution, operation/maintenance of projects. Further information regarding city- or state-specific private investments and the nature of projects undertaken was not given.
iii. Monitoring
Questions were also raised about steps taken by the Ministry to review the performance of AMRUT. Detailed information was sought for the target set and achieved city- and state-wise. Though the monitoring mecha-nisms at the state and national levels were explained (see Table 4.1), information on targets set and achieved was not released. Such ambiguous and incomplete answers raise doubts about the efficacy of the Scheme and tend to minimise the scope for participation and improvement.
Table 4.1: Structure of the Monitoring Mechanism under AMRUT
Source: Unstarred Question No. 1702, Lok Sabha, 26 July 2017
Monitoring Mechanism: Monitoring Committee at different levels at a glance
National Level Apex Committee
State Level State Level High Powered Steering Committee (SHPSC)
District Level (Urban) District Level Legal Advisory and Monitoring Committee (DLAMC)
District Level (Rural) District Development Coordination and Monitoring Committee (DISHA)
iv. Capacity building of ULBs
Few MPs raised the issue of the measures taken by the Ministry for capacity building of urban local bodies (ULBs) of various States. The Ministry replied that capacity building of ULBs in States and UTs is being sup-ported by the Mission and the programme is funded through the Mission too. With the Mission funds, the Ministry is also supporting capacity building through an externally aided project and a total of 27 training entities have been empaneled for the purpose. The States have signed MoUs with these training entities as per their requirement and capacity building activities are being conducted by them.
v. Status of implementation
AMRUT was launched in June 2015 and was envisaged to be completed in 2020. Since the Scheme is nearing completion, the data given by the Ministry provides a comprehensive picture about its achievements.
Regarding implementation, information about only one of these four main components was asked in detail, i.e., sewage treatment plants. The Scheme focuses on creating infrastructure that has a direct link to provid-

28 | YUVA
ing better services to people, such as water supply, sewage management, transportation and green spaces. Only a miniscule number of questions were raised regarding water supply, belying the Scheme’s primary aim to provide every household access to a tap with assured supply of water and a sewerage connection by 2020.
An interesting question was raised regarding the capacity of municipalities in implementing the Mission in the cities selected, and whether they lag in basic urban reforms. The Ministry responded that the municipali-ties do not lag, as all municipalities received reform incentives for implementation of second year reforms. The efficacy of these incentives remained unexplored.
According to the data provided, of the total central assistance of INR 35,989.7 crore committed to the Mis-sion, only 19% was released to the respective state governments. As depicted by Table 4.2, there is no instance where Central assistance released exceeds 20% of that committed—this is surprising given that this is the last year of the Scheme. Even after bringing in systemic changes and adopting models like cooperative federalism to ensure effective implementation of schemes, little has changed with regards to implementation.
An interesting question was raised regarding the capacity of municipalities in implementing the Mission in the cities selected, and whether they lag in basic urban reforms. The Ministry responded that the municipali-ties do not lag, as all municipalities received reform incentives for implementation of second year reforms. The efficacy of these incentives remained unexplored.
According to the data provided, of the total central assistance of INR 35,989.7 crores committed to the Mis-sion, only 19% was released to the respective state governments. As depicted by Table 4.2, there is no instance where Central assistance released exceeds 20% of that committed—this is surprising given that this is the last year of the scheme. Even after bringing in systemic changes and adopting models like cooperative federalism to ensure effective implementation of schemes, little has changed with regards to implementation.
4.4 Scope for civil society engagement
Table 4.2: Central assistance against SAAPs under AMRUT mission (in INR Crore)
Sl. No. Name of state/UT Total SAAP
sizeCommitted Central assistance
Central assistance released so far against approved SAAPs
% of total Central assistance released to Central assistance committed
1 Andaman & Nicobar Island 10.82 10.82 1.36 12.56
2 Andhra Pradesh 2890.17 1056.62 211.32 19.99
3 Arunachal Pradesh 140.25 126.22 15.77 12.49
4 Assam 657.14 591.42 73.23 12.38
5 Bihar 2469.77 1164.8 232.96 20.00
6 Chandigarh 95.07 54.09 10.82 20.00
7 Chhattisgarh 2192.76 1009.74 201.95 20.00
8 Dadra & Nagar Haveli 10.82 10.82 1.4 12.93
9 Daman & Diu 18.03 18.03 2.06 11.42
10 Delhi 802.31 802.31 160.46 19.99
11 Goa 209.18 104.58 20.91 19.99
12 Gujarat 4884.42 2069.96 414 20.00
13 Haryana 2565.74 764.51 152.9 19.99
14 Himachal Pradesh 304.52 274.07 54.81 19.99
15 Jammu & Kashmir 593.05 533.72 106.74 19.9916 Jharkhand 1245.74 566.17 113.23 19.99
17 Karnataka 4952.87 2318.79 463.76 20.00
18 Kerala 2359.38 1161.2 134.88 11.61
19 Lakshadweep 3.61 3.61 0.73 20.22
20 Madhya Pradesh 6200.67 2592.86 518.58 20.00
21 Maharashtra 7759.32 3534.08 706.81 19.99

PARLIAMENTARY WATCH REPORT 2017 | 29
Civil society should regularly seek information from municipalities regarding the rate of progress, revenue generation models and fund allocation and utilisation. More avenues for active citizen participation can be explored and initiated along with the municipalities to ensure that local needs are addressed in a timely manner. Civil society can/should partner/engage with municipalities in creating Service Level Benchmarks (SLBs), organise workshops educating citizens about their responsibilities in taking care of public infrastruc-ture and methods to utilise such to the fullest.
Additional urban reforms as proposed under AMRUT, such as e-governance, constitution of professional municipal cadre, devolving funds and functions to ULBs, review of building bye-laws, improvement in as-sessment and collection of municipal taxes, credit rating of ULBs, energy and water audit, and citizen-centric urban planning also need to be monitored and studied by parliamentarians and civil society.
Sl. No. Name of state/UT Total SAAP
sizeCommitted Central assistance
Central assistance released so far against approved SAAPs
% of total Central assistance released to Central assistance committed
22 Manipur 180.31 162.28 20.06 12.36
23 Meghalaya 80.14 72.12 8.91 12.35
24 Mizoram 140.25 126.22 25.24 19.99
25 Nagaland 120.22 108.19 13.49 12.46
26 Odisha 1598.96 796.97 159.4 20.00
27 Puducherry 64.91 64.91 12.98 19.99
28 Punjab 2766.62 1204.47 143.93 11.94
29 Rajasthan 3223.94 1541.95 308.39 20
30 Sikkim 40.06 36.06 4.82 13.36
31 Tamil Nadu 11194.78 4756.58 951.31 19.99
32 Telangana 1666.26 832.6 166.52 20.00
33 Tripura 148.25 133.43 26.68 19.99
34 Uttar Pradesh 11421.67 4922.46 984.49 19.99
35 Uttarakhand 593.02 533.72 106.75 20.00
36 West Bengal 4035 1929.32 385.87 20.00
Total 77640.03 35989.7 6917.52 19.22
Source: Unstarred Questions No. 602, Lok Sabha, 19 July 2017

LaunchJune 25, 2015
EndJune 25, 2022
Status of Implementation
National Heritage City Development and Augmentation Yojana (HRIDAY)
Chapter 05
CityNumber of Projects
ApprovedContracts Awarded
% Physical Completion City Wise
Varanasi 11 11 58%
Amritsar 10 8 58%
Ajmer 5 5 36%
Warangal 6 4 18%
Gaya 4 2 1%
Mathura 4 2 10%
Dwarka 6 5 8%
Puri 6 6 10%
Velankanni 3 2 10%
Kancheepuram 3 2 18%
Amravati 3 2 53%
31% of the total 65 approved projects have been completed under the scheme so far. Out of the total 12 cities selected, 6 cities have barely been able to complete 10% of the projects.
Fund sanctioned - INR 363.28 crores% released - 52%% fund utilised - 6.5%
Facts
Source: Starred Question No. 106, Rajya Sabha, 28 December 2017
Amritsar 58%
18%
Representation of percentage of HRIDAY project completed in the 12 selected cities
Ajmer 36%Mathura
Gaya
Kancheepuram
10%Vellankanni
Varanasi 58%
Badami 6% Amravati
Warangal
Puri
Dwarka
10%
1%
53%
18%
10%
8%

32 | YUVA
CHAPTER 5 NATIONAL HERITAGE CITY DEVELOPMENT AND AUGMENTATION YOJANA (HRIDAY)5.1 Mission at a glance
The National Heritage City Development and Augmentation Yojana (HRIDAY) Scheme was launched on 21 January 2015, with a focus on holistic development of heritage cities. The Scheme aims to preserve and revit-alise the soul of heritage cities, to reflect the unique character of cities. It envisages a paradigm shift in India’s approach to city development, bringing together urban planning, economic growth and heritage conserva-tion in an inclusive and integrated manner with a focus on livelihoods, skills, cleanliness, security, accessi-bility and service delivery. With a duration of 4 years (ending in November 2018) and a proposed outlay of INR 500 crore, the Scheme is being implemented in 12 identified cities namely, Ajmer, Amaravati, Amritsar, Badami, Dwarka, Gaya, Kanchipuram, Mathura, Puri, Varanasi, Velankanni and Warangal.
5.2 Analysis of questions
Only 6 questions in Lok Sabha and 7 questions in Rajya Sabha were asked related to the HRIDAY Scheme in all the 3 sessions of Parliament. Information regarding the nature of projects undertaken in each heritage city and the funds sanctioned, released and utilised so far was sought. The reasons for not including cities in the North-East was also questioned. No questions were raised on the displacement of farmers or informal workers due to developmental projects sanctioned under the Scheme.
5.3 Analysis of answers
Questions raised were primarily related to the cities selected under the Scheme and the physical and financial progress made in the 12 cities selected. Answers have been analysed based on the status of implementation and financial utilisation.
i. Status of implementation
Starred Question No. 106 in Rajya Sabha raised by Member of Parliament (MP) Rajani Patil inquired details of the progress and implementation of the Scheme. The Ministry informed that only 31%of the total 65 ap-proved projects have been completed so far. Out of the 12 cities selected, only 6 cities have barely been able to complete 10% of the projects. Only 3 cities, Amritsar, Varanasi and Amravati have been able to complete a little over 50% of the project.
ii. Financial utilisation and funds
As of July 2017, a total of INR 363.28 crore was sanctioned for the Scheme and INR 189.12 crore (52%) of these funds was released. However, only INR 23.60 crore funds have been utilised so far, which is merely 6.5% of the total funds sanctioned under the Scheme. The details of the funds sanctioned and released under the selected cities were provided in the questions raised in the Rajya Sabha. (see Table 5.1)

PARLIAMENTARY WATCH REPORT 2017 | 33
5.4 Scope for civil society engagement
Since the Scheme also focuses on promotion and protection of livelihoods and some cities also have plans for revitalisation of the historic bazaars in their Development Plan Reports, civil society should ensure that a proper survey is conducted and a Town Vending Committee (TVC) is constituted for the inclusion of street vendors in the area, according to the provisions of the Street Vendors Act, 2014. The project reports should also focus on environment sustainability and promotion of livelihood. Civil society must keep watch to en-sure proper resettlement and rehabilitation of people affected by any project undertaken under the Scheme.
Table 5.1: Funds released and sanctioned under selected cities updated till 30 November 2017 (In INR Crores)
CityCost of Approved Projects (In Rs Crore)
Number of Projects Approved
Fund Released to Cities for Implementation
Contracts Awarded
% Physical Completion City Wise
Varanasi (UP) 91.14 11 62.23 11 58%
Amritsar (Punjab) 61.47 10 42.82 8 58%
Ajmer (Rajasthan) 35.42 5 25.94 5 36%Warangal (Telangana) 35 6 18.15 4 18%
Gaya (Bihar) 34.67 4 12.7 2 1%
Mathura (UP) 33.35 4 11.22 2 10%
Dwarka (Gujarat) 32.37 6 11.14 5 8%
Puri (Odisha) 20.4 6 7.41 6 10%Velankanni (Tamil nadu) 20 3 8.37 2 10%
Kancheepuram (TN) 19.99 3 14.14 2 18%
Amravati (A.P.) 18.74 3 13.59 2 53%Source: Starred Question No. 106, Rajya Sabha, 28 December 2017

Launch2015
End
Status of Implementation
Deendayal Antyodaya Yojana-National Urban Livelihood Mission (DAY-NULM)
Chapter 06
Shelters for the Urban Homeless789 shelters providing shelter to 4.5% of the homelessShelters for women: 67 Capacity: 347Gap of 16,939 shelters
Number of People Skilled and Placed:Since the inception of the scheme in 2014-15, a total of 10,15,039 beneficiaries have been provided with skill training out of which only 30% were given placement.
NULM
Facts
Shelters Sanctioned
Shelters Functional
% of shelters functional of the number of shelters sanctioned
in the country
1331 789 59%
Details of total shelters sanctioned and functional in the country under DAY-NULM
2022
* NULM was a UPA scheme
* This is only for SUH, 1 component of DAY-NULM
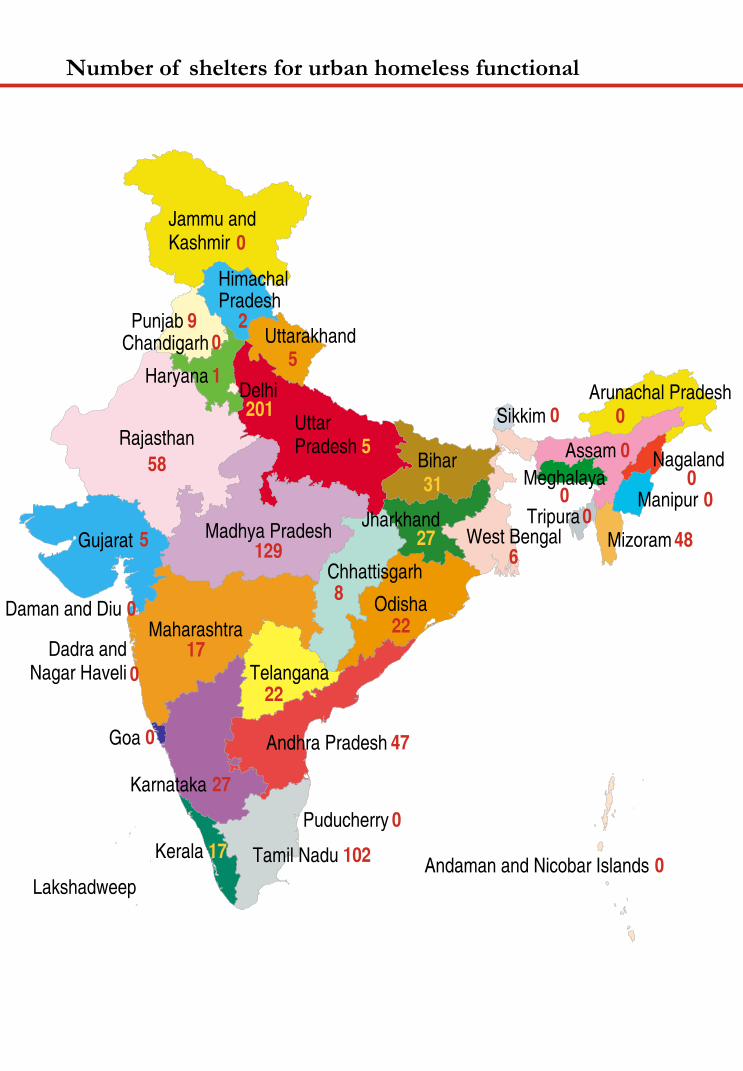
Tamil Nadu
Andhra Pradesh
Telangana
Odisha
West Bengal
Chhattisgarh
Madhya Pradesh
Uttar Pradesh
BiharRajasthan
Gujarat
Maharashtra
Karnataka
Goa
Kerala 17
Punjab
Haryana
Assam
HimachalPradesh
Uttarakhand
Jharkhand
Sikkim
Manipur
Andaman and Nicobar Islands
Arunachal Pradesh
Chandigarh
Dadra and Nagar Haveli
Daman and Diu
Delhi
Lakshadweep
Meghalaya
Mizoram
Nagaland
Tripura
Puducherry
Jammu and Kashmir
Number of shelters for urban homeless functional
47
31
8
0
5
1
2
0
27
27
129
17
201
22
9
58
102
22
5
5
6
0
0
0 00
48
0
0
0
0
0
0
0
36 | YUVA
CHAPTER 6 DEENDAYAL ANTYODAYA YOJANA- NATIONAL URBAN LIVELIHOODS MISSION (DAY-NULM)6.1 Mission at a glance
The Deendayal Antyodaya Yojana - National Urban Livelihood Mission (DAY- NULM) aims to reduce pov-erty and vulnerability of urban poor households by enabling them to access gainful self-employment and skilled wage employment opportunities, resulting in improvement in their livelihoods on a sustainable basis, by building strong grassroots level institutions of the poor.
The Mission aims to provide shelter, equipped with essential services to the urban homeless in a phased manner. In addition, the Mission also addresses livelihood concerns of the urban street vendors by facilitat-ing access to suitable spaces, institutional credit, social security and skills to the urban street vendors for accessing emerging market opportunities. The Scheme explores multiple models to build capacities of the urban poor, aiming at generating meaningful and sustainable livelihoods.
6.2 Analysis of questions
A total of 25 questions were asked about the implementation of the DAY-NULM in the Lok Sabha and 23 questions were raised in the Rajya Sabha. A few questions were also raised regarding rural to urban migra-tion, which reveals that rising unemployment and poverty in urban areas is gaining the attention of the ministers.
Unstarred Question No. 668 raised in the Lok Sabha inquired about issues of urban employment. The Mem-bers of Parliament (MPs) asked, ‘whether migration of a large number of people to urban areas from rural areas is one of the major reasons of urban unemployment’. The question further asked, ‘whether growth of economic opportunities in urban areas is not in conformity with volume of migration’. The Ministry re-sponded that it ‘does not have any data which supports the contention that migration to urban areas from rural areas is the main reason for urban unemployment’ but did not answer the latter part which inquired about the growth of economic opportunities in urban areas.
Another question inquired about the similar issue, ‘whether the Government has undertaken any study on the status of unemployment in urban areas of the country during the last three years’. The Ministry of Hous-ing and Urban Poverty Alleviation (MoHUPA) said that it has not undertaken any study on the status of unemployment in urban areas of the country.
The details of proposals received on various schemes for poverty alleviation and employment generation during the last 3 years was also asked. The Ministry provided that ‘the individual projects/proposals are approved at the State/Union Territory (UT) level and no approval of the Ministry is required for their imple-mentation in the State/UT’. The role of the Ministry is limited to the allocation and release of funds.
The replies suggest a lack of government data and studies on migration. How the government is planning to address this rising concern regarding migration and resulting unemployment remains unclear.
6.3 Analysis of answers
This section has been analysed based on the components of the DAY-NULM programme that were discussed in Parliament. Of the 7 components of the DAY-NULM, only 4 were discussed. These include—shelters for the urban homeless, support to urban street vendors, employment through skills training and placement (EST&P), and social mobilisation and institution development. Since the component on shelters for urban homeless was discussed in detail, subsections based on issues discussed have been outlined.

PARLIAMENTARY WATCH REPORT 2017 | 37
i. Implementation
ShelterS for urban homeleSS
As per Census 2011, the total homeless population in India is 17,72,889.
Funds
In Lok Sabha, a question was raised by MP R. Gopalkrishnan inquiring ‘whether the Government provides funds to the States under the scheme “Shelter for Urban Homeless (SUH)”’. The Ministry, in its reply, stated that ‘Under DAY-NULM funds are allocated to states in a consolidated manner out of which appropriate amount is apportioned by States/UTs for SUH, as per their requirements. As on 28.07.2017 a total of INR 1,45,922.92 lakh has been released under DAY-NULM during the last three years and the current year’. In 2016-17, INR 1,02,962.19 was allocated for the Scheme, of which only 57% was utilised. The reasons for un-spent allocations were left unexplained by the Ministry.
Land for homes for homeless
A question was raised in the Lok Sabha by Union Minister and MP Anant Kumar Hegde on 5 April 2017 asking the ‘details of land demanded by the Government from each State Government for constructing houses (for the homeless) in the States’. Possibly because this question asked about ‘houses’ and not ‘shel-ters’, the Ministry referred to the Pradhan Mantri Awas Yojana (Urban) {PMAY(U)} mission. It mentioned that ‘Land’ and ‘Colonization’ being State subjects, it is the responsibility of the State/UT Governments to provide encumbrance free land for projects under the PMAY(U) mission. The Scheme guidelines, inter-alia, stipulate States/UTs to prepare/amend their Master Plans earmarking land for affordable housing. The guidelines also provide that States/UTs shall provide additional floor area ratio (FAR)/floor space index (FSI)/transferable development rights (TDR) and relaxed density norms for slum redevelopment and low cost housing, if required.
Provision of entitlements in shelters
‘The progress of issuing entitlements to the urban homeless as mentioned in the guidelines of the scheme’ was raised. The Ministry reiterated the guideline without providing any facts about implementation. It stated that, ‘The shelters will serve as a space for convergence and provisions of various entitlements of social se-curity, food, education and health care systems. The shelter management agencies which are appointed by the State Governments/urban local bodies (ULBs) are responsible to ensure the entitlements to homeless’. Whether this is being implemented in the homeless shelters was not addressed.
Deaths of the homeless and court orders
When data regarding homeless deaths and the steps taken by the government to address this issue was asked, the Ministry did not give a clear answer. After the Supreme Court’s order dated 11 November 2016, a committee for assessment of shelters was constituted. This committee was supposed to verify whether the shelters are in compliance with the operational guidelines of the scheme for shelters for the urban homeless. No information was provided by the Ministry regarding the findings of this committee.
Lack of shelters and shelters for women
The concerns over the lack of shelters for urban homeless was observed in both the Houses of Parliament by MPs such as K.C. Ramamurthy, Jaya Bachchan, and Rama Devi. MP Derek O’Brien also inquired about the steps taken by the Government to address the housing needs of the urban homeless, particularly women.
As per the information provided by the Ministry, a total of 67 women shelters (including the shelters being supported by sources other than the DAY-NULM), having capacity of 3,471 residents, were operational as on 20 December 2017. A statement showing the status of women shelters, State-wise, is given in Table 6.1. Out of the 36 states and UTs, only 13 states and UTs have shelters for homeless women with an overall capacity of 3,471 women.
Only a marginal increase of 61 shelters took place between January 2017–June 2017. As per the data released by the Ministry, the total number of shelters sanctioned so far in the country is 1,331. Out of the shelters sanctioned, 789 are operational and remaining are under construction /refurbishment.
As per Table 6.2 of the total shelters sanctioned, only 59% are operational in the country. 50% of the opera-tional shelters are in 3 states—Delhi, Madhya Pradesh and Tamil Nadu alone. In Maharashtra, out of the 53 shelters sanctioned only 17 shelters are operational. For a country with a high number of urban homeless, these numbers are seriously inadequate.

38 | YUVA
Reasons for slow progress and steps to overcome this
The reasons cited by the Ministry for slow progress in providing shelters includes—lack of will of the State/UT administrations, non-availability as well as high price of land at places required for construction of shelters, reluctance to conduct legitimate survey of urban homeless, poor management of shelters, non-availability of address proof, sub-optimal utilisation of DAY-NULM funds, lack of institutional preparedness at the level of ULBs and lack of coordination amongst planning agencies.
To fill the current gap between demand and supply of homeless shelters, the Ministry of Housing and Urban Affairs (MoHUA) constantly pursues States/UTs to reduce the gap between number of shelters sanctioned and made operational. Other steps taken include, amendment of guidelines to enable taking buildings on rent for shelters, as an interim arrangement, and directing the State/UT Governments to conduct third-party systematic surveys to identify the urban homeless.
Table 6.1: No. of women shelters state wise
Source:RS Unstarred Question 1174, 28 December 2017
S.No Name of the states No. of women shelters Capacity
1 Andhra Pradesh 4 2002 Assam 2 1003 Jharkhand 2 364 Karnataka 4 1685 Kerala 2 1006 Madhya Pradesh 3 2307 Maharashtra 1 178 NCT of Delhi 20 12949 Sikkim 1 2510 Tamil Nadu 11 54011 Telangana 14 56512 Uttarakhand 1 10013 West Bengal 2 96 Total 67 3,471
Table 6.2: State-wise details of shelters sanctioned and operational under DAY-NULM
S.No State name Shelters sanctioned
Shelters functional
% of shelters
sanctioned
% of shelters functional of the
number of shelters sanctioned in that state
1 Andhra Pradesh 78 47 5.9 60.32 Bihar 114 31 8.6 27.23 Chhattisgarh 37 8 2.8 21.64 Goa 0 0 0.0 0.05 Gujarat 16 5 1.2 31.36 Haryana 1 1 0.1 100.07 Himachal Pradesh 10 2 0.8 20.08 Jammu & Kashmir 5 0 0.4 0.09 Jharkhand 45 27 3.4 60.010 Karnataka 42 27 3.2 64.311 Kerala 26 17 2.0 65.412 Madhya Pradesh 133 129 10.0 97.013 Maharashtra 53 17 4.0 32.114 NCT of Delhi 216 201 16.2 93.115 Odisha 34 22 2.6 64.7

PARLIAMENTARY WATCH REPORT 2017 | 39
Support to urban Street vendorS
Important and informative questions were asked regarding street vendors. These include, the details of vend-ing zones, rent received from each zone, process for granting license and techniques to monitor the number of street vendors. None of these questions were addressed by the Ministry.
Questions were also asked for the details of the current status of surveys conducted on street vendors and the number of certificates issued to street vendors upon completion of their survey. The Ministry informed that so far, 11,06,929 street vendors have been identified in 1,211 cities and identity cards have been issued to 2,63,524 street vendors.
employment through SkillS training and placement (eSt&p)
The EST&P component under DAY-NULM is designed to provide skills to the unskilled urban poor and to upgrade their existing skills. The programme will provide skill training to the urban poor to help them set up self-employment ventures and ensure their eligibility for salaried jobs in the private sector. The EST&P programme intends to fill the gap between demand and availability of local skills by providing skill training programmes as required by the market.
According to data released by the Ministry, upto November 2017 a little over 8 lakh urban poor have been provided skill training under the Mission. Of this, only 30% could get placement. As evident from Table 3, the scheme did comparatively better in 2016–17. Though 50% of total beneficiaries got trained in this year alone, not much difference was observed with respect to the rate of placement.
Source: Unstarred Question No. 2896, Lok Sabha, 02 August 2017
S.No State name Shelters sanctioned
Shelters functional
% of shelters
sanctioned
% of shelters functional of the
number of shelters sanctioned in that state
16 Punjab 27 9 2.0 33.317 Rajasthan 98 58 7.4 59.218 Tamil Nadu 141 102 10.6 72.319 Telangana 47 22 3.5 46.820 Uttar Pradesh 92 5 6.9 5.421 Uttarakhand 12 5 0.9 41.722 West Bengal 35 6 2.6 17.1
23 Arunachal Pradesh 0 0 0.0 0.0
24 Assam 0 0 0.0 0.025 Manipur 0 0 0.0 0.026 Meghalaya 3 0 0.2 0.027 Mizoram 59 48 4.4 81.428 Nagaland 2 0 0.2 0.029 Sikkim 0 0 0.0 0.030 Tripura 5 0 0.4 0.0
31 Andaman & Nicobar Islands 0 0 0.0 0.0
32 Chandigarh 0 0 0.0 0.0
33 Dadra & Nagar Haveli 0 0 0.0 0.0
34 Daman & Diu 0 0 0.0 0.035 Puducherry 0 0 0.0 0.0 Total 1,331 789 100.0

40 | YUVA
Social mobiliSation and inStitution development
A total of 1,90,266 self-help groups (SHGs) have been formed and 1,78,361 persons have been assisted with subsidised loans for setting up individual and group-micro enterprises.
Table 6.3 : Details of skill training and placement under DAY- NULM during the last 3 years and the current year (upto November 2017)
Source: Unstarred Question No. 1163, Rajya Sabha, Answered on 28 December 2017
2015–16 2016–17 2017–18 Total (2014–18)
No. of urban poor skill-trained
No. of skill trained people given placement
No. of urban poor skill-trained
No. of skill trained people given placement
No. of urban poor skill-trained
No. of skill trained people given placement
No. of urban poor skill-trained
No. of skill trained people given placement
%of urban poor given placement
2,54,073 33,664 4,01,654 1,51,901 1,77,275 69,255 8,33,002 2,54,820 31.3
Table 6.4: Achievements of the (EST&P) component and social mobilisation and institution development
Source: Unstarred Question No. 1163, Rajya Sabha, Answered on 28 December 2017 and Unstarred Question NO. 1778, Lok Sabha, 26 July 2017
Achievements of the Scheme
No. of people provided skill training 10,15,039
No. of people given placement 3,17,935
No. of people who received subsidised loan for micro-enterprises 1,78,361
No. of SHGs formed 1,90,266
No. of SHGs that received revolving fund 1,26,620
ii. Financial progress
A total of INR 4,00,106.9 lakhs was allocated for the Scheme, of which only 42.9% was utilised from 2014–17. More than 50% of the allocated budget remains unspent. Allocation of the subsequent years included the unspent balance of the previous years. As shown in Table 6.5, a drop in new allocations was noticed due to the carrying forward of balances of the previous years.
Table 6.5: Details of funds allocated, utilised and unspent balance for the last three years (2014–15 to 2016–17) under DAY- NULM (In INR Lakhs)
*Allocation includes unspent balance of previous yearsSource: Unstarred Question No. 659, Lok sabha 19 December 2017
2014–15
% of fund utilised/
unspent of total fund
allocated for the year
2015–16
% of fund utilised/unspent
of total fund allocated for the
year
2016–17
% of fund utilised/unspent
of total fund allocated for the
year
Allocation* 1,48,281.3 1,48,863.41 1,02,962.2
New Allocation 41,653 36,186
Utilised 34,030.34 22.9 64,867.29 43.6 72,813.86 70.7
Unspent 1,07,210.13 72.3 66,775.65 44.9 31,786.6 30.9
PARLIAMENTARY WATCH REPORT 2017 | 41
6.4 Scope for civil society engagement
The role of civil society in monitoring the DAY-NULM is crucial. Monitoring begins at the time of surveys done at the local level that determine the Scheme’s implementation. The Census Survey of 2011 estimated the homeless population of the country to be 17,72,889. The actual numbers as per civil society estimates are much higher. The same is the case for street vendors who are grossly undercounted at 11,06,929 street vendors in 1,211 cities . Civil society should ensure that accurate surveys are conducted in cities by the local governments to ensure accurate enumeration and participation in the scheme.
On 8 November 2017, the Times of India reported that the Supreme Court had slammed state governments for their apathy towards the homeless. More than 90 percent of urban homeless had no roof over their heads as state governments had pathetically failed in setting up shelters despite the Centre giving INR 2,000 crore under the DAY-NULM since 2013. The Bench even suggested the Centre scrap the Scheme as the welfare funds were being siphoned off by state governments (Chaudhury, 2017). The Scheme guidelines refer to a provision of one shelter for a minimum of 100 persons per lakh urban population. Yet there are only 789 functional shelters for the urban homeless that provide respite to 4.5% of the homeless population. There is a glaring gap of 16,939 shelters! It is also crucial to monitor these expenses and underutilisation as it is public money that is remaining unutilised while the homeless live without human dignity.
Civil society should engage with the government to include needs and challenges for the most vulnerable among this already vulnerable group. Dependent children, women, the elderly, different abled, mentally ill, and recovering patients, etc require specialised all-weather shelters and the definition of homelessness must incorporate these multiple needs.

42 | YUVA
CHAPTER 7 INFORMAL WORKERS - ANALYSIS OF ANSWERS OF THE MINISTRY OF LABOUR AND EMPLOYMENT7.1 Analysis of Questions
According to the Report of the Committee on Unorganised Sector Statistics, 93% of India works in the in-formal sector (Sengupta, 2007). The NSS Report (2012) found 67% working in the informal sector in urban India. Among them, construction workers account for the highest number while domestic workers are a large force of women in the urban unorganised sector who are not legally protected. It is crucial to understand the issues of informal workers and migrant workers while engaging on urban schemes aimed at benefiting the ur-ban poor. This chapter has briefly analysed questions and answers that were posed to the Ministry of Labour and Employment (MoLE) with a focus on informal workers. Specifically the analysis focussed on construc-tion workers, domestic workers, migrant workers and welfare schemes and social security for workers in the unorganised sector.
7.2 Analysis of Questions
Questions addressed to the MoLE in both the houses of the parliament were studied. Out of the total ques-tions raised, questions pertaining to construction workers, domestic workers, migrant workers and social security benefits for workers in unorganised sector were considered for further analysis.
Construction Workers: The questions centred around the fund deposited under the Building and Construc-tion Workers Act 1996. The status of cess collection and the Government’s accountability with respect to underutilisation of funds was also questioned. The other question was about the impact of demonetisation on construction workers and what are the concerns regarding protection and safety of construction workers. The questions raised in the Rajya Sabha were similar to that of the Lok Sabha. These were also related to cess collection and utilisation and whether the Government has issued Universal Account Number (UAN) num-bers to the construction workers for the scope of their provident funds.
Domestic Workers: Questions asked dealt mainly with the status of the policy for domestic workers and social security schemes
Migrant Workers: Questions asked included which state has maximum number of migrant labourers and social security and welfare schemes for this population group
Welfare schemes and social security for workers in the unorganised sector: Questions asked included im-plementation and monitoring of welfare and social security schemes and whether rules had been formulated for fixing the working hours of labourers in the unorganised sector.
7.3 Analysis of Answers
i. Construction workers:
According to the the information provided by the ministry, Building and Other Construction Workers (Regulation of Employment and Conditions of Services) Act, 1996 –a cess is being collected at the rate of 1% of the cost of construction as notified by the Central Government. The cess of the above rate is col-lected by the State Government and the Union Territory Administrations and utilised for the welfare of the building and other construction workers. The cumulative total of the amount of cess collected by the States/UTs upto 31.12.2016, at the rate of 1% of the cost of construction is INR 31,733.76 crore of which INR 6,872.51 crore has been spent. Around 80% of the cess collected is lying unutilised. State-wise details of cess collected and expenditure thereof is annexed. The reasons for delay in working out utilisation and disbursement mechanism for the funds collected under the said Act were also questioned. The Ministry did not respond to this aspect of the question.

PARLIAMENTARY WATCH REPORT 2017 | 43
However regarding monitoring, the Ministry mentioned that the Central Government has constituted a Monitoring Committee on 09.09.2015 under the Chairmanship of Secretary (Labour and Employment) to monitor the implementation of directions issued under Section 60 of the Act, specifically with reference to utilisation of Cess Fund for Welfare Schemes by the State Building and Other Construction Workers’ Welfare Boards. The Committee has been holding regular meetings with the Principal Secretary/Secre-tary/Labour Commissioners of all the States/UTs to monitor the progress.
In the answer to the impacts of demonetisation and safety of the construction workers, the Government replied that it has taken several steps for enhancing financial inclusion and reinforcing minimum wages to workers along with associated social security benefits. It has organised several camps for opening of bank accounts of labourers for payment of wages. The number of camps organised by the Ministry is around 1.51 lakhs and over 49.67 lakh bank accounts of labourers have been opened.
To the question related to UAN numbers it was mentioned that under section 22 of the Building and Oth-ers Construction Workers (Regulation of Employment and Conditions of Services) Act, 1996 –immediate assistance to the beneficiary is provided in the case of accident, pension is paid to the beneficiaries who have completed the age of sixty years, financial assistance for the education of their children is also pre-scribed, medical expenses for treatment of major ailments are also met along with other similar employ-ment security provisions.
ii. Domestic workers:
In both the houses, questions were raised with respect to total number of registered and unregistered domes-tic workers and the steps taken by the Government for skill development of domestic workers and statistics. According to the NSSO statistics (2011–12), estimated 3.9 million workers are employed by private house-holds of which 1.3 million are male and 2.6 million are female workers. The Ministry mentioned that data on registered/unregistered domestic workers is not maintained at the central level.
A question was raised in the Lok Sabha “whether the Government proposes to frame a national policy to ensure security for domestic workers or household helpers and to improve their working conditions;” The ministry said that “a draft National Policy for Domestic workers is under consideration of the Government.”
‘The steps taken by Government to bring all the unorganised sector workers under the social security schemes’ was also raised. In order to provide social security benefits to the workers in the unorganised sector including domestic workers, the Government has enacted the Unorganised Workers’ Social Security Act, 2008. The 2008 Act stipulates formulation of suitable welfare schemes for unorganised workers on matters relating to: (i) life and disability cover, (ii) health and maternity benefits, (iii) old age protection and (iv) any other ben-efit as may be determined by the Central Government through the National Social Security Board. Various Schemes, formulated by the Government to provide social security cover to the unorganised workers, listed in Schedule I of the above Act are as under:
i. Indira Gandhi National Old Age Pension Scheme (Ministry of Rural Development)
ii. National Family Benefit Scheme (Ministry of Rural Development)
iii. Janani Suraksha Yojana (Ministry of Health and Family Welfare)
iv. Handloom Weavers’ Comprehensive Welfare Scheme (Ministry of Textiles)
v. Handicraft Artisans’ Comprehensive Welfare Scheme (Ministry of Textiles)
vi. Pension to Master Craft Persons (Ministry of Textiles)
vii. National Scheme for Welfare of Fishermen and Training and Extension (Department of Animal Husbandry, Dairying & Fisheries)
viii. Aam Admi Bima Yojana (Department of Financial Services)
ix. Rashtriya Swasthya Bima Yojana (Ministry of Health and Family Welfare).
Central Government has also launched the Atal Pension Yojana, Pradhan Mantri Jeevan Jyoti Bima Yojana and Pradhan Mantri Suraksha Bima Yojana for all citizens, especially targeting unorganised workers to pro-vide them comprehensive social security.
With respect to regulation of placement agencies to safeguard the interest of domestic workers, this is done

44 | YUVA
by the states and it was mentioned that the Ministry of Skill Development and Entrepreneurship supports the Industry-led body Domestic Workers Sector Skill Council (DWSSC) through National Skill Development Corporation (NSDC) for skill development of domestic workers. As of now, DWSSC has trained the 1996 domestic workers.
With respect to the National Policy on Domestic Workers, it was mentioned that a draft National Policy for Domestic Workers is under consideration of the Government and salient features of the draft policy involves inclusion of domestic workers in existing legislations, their right to form their own associations, trade unions, minimum wages for domestic workers, domestic workers protection from abuse and exploitation, courts, tribunals and mechanisms of placement agencies. For the social security of the domestic workers, there are schemes like the Unorganized Workers Social Security Act 2008, Jyoti Bima Yojana, Pradhan Mantri Surak-sha Bima Yojana governing all citizens and specifically the unorganised sector.
In the winter session a MP asked whether the Government has or proposes to form a committee to review and present a report on the status of domestic workers in the country before formulating the policy. The ministry said that ‘No such committee is required as a number of stakeholders workshops/meetings have been conducted’.
iii. Migrant workers
Unstarred Question No. 396 by MP Krupal Balaji Tumane raised issues related to migrant labourers. The MP asked for the data for the state which has maximum number of migrant labourers at present. The Ministry responded that no data of workers is maintained at the Central level regarding migrant workers. However, the Ministry mentioned that as per 2011 census, Maharashtra has the maximum number of migrant workers.
Furthermore, the MP inquired about the projects undertaken by the Union Government and State Govern-ments to impart education and to ensure better living conditions and medical facilities to migrant labour-ers. The Ministry replied that the Union Government has enacted the Inter-State Migrant Workmen Act, (Regulation of Employment and Conditions of Service) Act, 1979, which aims to protect the interests of the Inter-State migrant workers. The Act provides for provision of medical facilities to the migrant workmen and their dependents including crèche and maternity benefits. Children of migrant workers are also eligible for compulsory education up-to 14 years of age under the Right to Education Act. The Act also provides for safety and other facilities such as canteen urinals etc. for migrant workers. Besides, States have their own schemes for migrant workers.
In the same question the MP asked if the Union Government proposes to provide assistance to the State Governments, such as Kerala, to implement complete health insurance to the migrant labourers on the lines of the National Health Insurance Scheme. The Ministry responded that ‘No such proposal is under consid-eration’ by them.
iv. Welfare schemes for workers in the unorganised sector
Starred Question No. 182 raised by MP Ajay Nishad in the Lok Sabha asked for the details of welfare schemes for labourers proposed by the Government. The Ministry of Labour & Employment replied that it imple-ments welfare schemes through Labour Welfare Organisations across the country. These schemes are relat-ing to housing, education and health for beedi workers, mica mine workers, limestone and dolomite mine workers, iron ore manganese, chrome ore mine workers and cine workers. Earlier these schemes were ad-ministered through 5 Welfare Cess and Welfare Funds under various Cess Acts of Parliament. But now, these cesses have been abolished/subsumed in the GST and the welfare schemes have been retained with funding from the Consolidated Fund of India.
Salient features of these welfare schemes are as follows:
(i) Revised Integrated Housing Scheme-2016: Subsidy of INR 1,50,000 for construction of a new house is provided to the workers in three instalments in the ratio of 25:60:15.
(ii) Education Scheme: Financial assistance, varying from INR 250 to INR 15,000 per year is provided to the wards of the workers studying in classes I to XII or pursuing non-professional and professional degree/graduate/postgraduate courses.
(iii) Health Scheme: Health care facilities are provided to the workers and their dependents through 12 hospitals and 286 dispensaries under Labour Welfare Organizations all over the country. In addition,

PARLIAMENTARY WATCH REPORT 2017 | 45
reimbursement of expenditure for specialised treatment taken in Government recognised hospitals is also provided.
In addition to the above welfare schemes, the the ministry informed that the Central Government has re-cently converged the social security schemes of Aam Aadmi Bima Yojana (AABY) with Pradhan Mantri Je-evan Jyoti Bima Yojana (PMJJBY) and Pradhan Mantri Suraksha Bima Yojana (PMSBY) to provide life and disability coverage to the unorganised workers depending upon their eligibility.
PMJJBY gives coverage of INR 2 lakhs on death at premium of INR 330 per annum for an age span from 18 to 50 years. PMSBY gives coverage of INR 2 lakhs on accidental death and disability at premium of INR 12 per annum covering an age span from 18 years to 70 years. These converged schemes are being implemented by the Life Insurance Corporation of India. The annual premium is shared on 50:50 basis by the Central Government and the State Governments.
Wherever issues of social security were raised in the Parliament, the ministry provided the same reply, even though questions asked for different information.
Part (e) of the the same question asked about ‘mechanism put in/likely to be put in place for implementation and monitoring of the said schemes’. The Ministry did not respond about the monitoring mechanisms in function for the said schemes as asked in the question. This question also asked if the Government proposes to regularise the services of casual labourers/daily wagers. The Ministry just responded ‘No Madam’.
Similarly, questions were also raised if rules have been formulated for fixing the working hours of labourers in the unorganised sector. The Ministry mentioned that working conditions of casual workers/daily wagers depend upon the labour laws applicable on the establishment they are engaged in.
CreChe ServiCeS
Unstarred Question No. 2248. Raised by MP Ramesh Chander Kaushik in Lok Sabha asked to provide de-tails “if the Government maintains data on provision of mandatory crèche services at establishments as per The Maternity Benefit (Amendment) Act, 2017” The question further sought details of the number of creche within the premises of the establishment and those at a distance from the establishment, State/UT-wise; A part of the same question raised a very pertinent question regarding government’s proposal to share the cost burden of providing creche facility with the employers to encourage potential employers to hire women.
The Ministry replied that it does not maintain data on provision of mandatory crèche services at establish-ments. Referring to other issues raised in the question the ministry said that it is the responsibility of the employer to provide creche facility to their employees under the Act. There is no Government proposal to share the cost burden of providing crèche facility with the employers.
v. Social Security for workers engaged in the unorganised sector
Questions regarding social security for workers engaged in the unorganised sector were raised in both the houses. Lok Sabha MP K. Parasuraman asked for the ‘the total number of labourers belonging to the unor-ganised sectors who are covered under the social welfare schemes for labourers of unorganized sectors in the country’. Similarly, in the Rajya Sabha, Unstarred Question No. 271 by MP K. Ashok Kumar enquired ‘whether the Government proposes to cover 40 crore workers from unorganized sector under social security schemes such as Employees’ State Insurance and Employees’ Provident Fund’ and ‘whether the Govern-ment proposes to implement reforms and new ways and means for employment generation’. The Ministry, in response to the question, stated that it is a constant endeavour of the Government that the workers in the unorganised sector get social security coverage and the Unorganised Workers’ Social Security Act, 2008 is a major initiative in this direction. It further reiterated features of the Act but did not mention the number of beneficiaries it proposes to cover under the schemes as required in the questions.
The salient features of the Unorganized Workers’ Social Security Act, 2008 as mentioned in the answer are as follows:
1. Formulation of schemes by the Central Government for different sections of unorganised workers on matters relating to (a) life and disability cover; (b) health and maternity benefits; (c) old age protection (d) any other benefit as may be determined by the Central Government.
2. Formulation of schemes by the State Governments relating to provident fund, employment injury benefits, housing, educational schemes for children, skill upgradation, funeral assistance and old age homes.

46 | YUVA
The ministry informed that these Social Security Schemes are being implemented by various Ministries/De-partments for unorganised workers including the Indira Gandhi National Old Age Pension Scheme (by Min-istry of Rural Development), National Family Benefit Scheme (by Ministry of Rural Development), Janani Suraksha Yojana (by Ministry of Health and Family Welfare), Pradhan Mantri Jeevan Jyoti Bima Yojana, Pradhan Mantri Suraksha Bima Yojana, Atal Pension Yojana (by Department of Financial Services), Rash-triya Swasthya Bima Yojana (by Ministry of Health & Family Welfare) etc.
For enhancement of livelihood security and employment generation all over the country including rural ar-eas, the Government is implementing schemes like Prime Minister’s Employment Generation Programme (PMEGP) by Ministry of Micro, Small & Medium Enterprises, Mahatma Gandhi National Rural Employment Guarantee Scheme (MGNREGA) by Ministry of Rural Development, Pt. Deen Dayal Upadhyaya Grameen Kaushalya Yojana (DDU-GKY) scheme by Ministry of Skill Development and National Urban Livelihoods Mission (NULM) by Ministry of Housing & Urban Poverty Alleviation. The Government is also promoting labour intensive manufacturing and increasing employment opportunities by promoting tourism and agro-based industries.
Another question regarding social security asked whether several States have not constituted State Social Se-curity Boards for unorganized sector workers; and the reasons for this delay. The ministry stated that all the States except the States of Arunachal Pradesh, Punjab, Sikkim, Telangana and Uttar Pradesh have set up State Social Security Board under the Unorganised Workers’ Social Security Act, 2008, in their respective States.
Table 7.1: Beneficiaries listed under various social security schemes of the government
S. No. Name of the Scheme Number of Beneficiaries
1.National Social Assistance Programme including Indira Gandhi National Old Age pension Scheme and National Family Benefit Scheme (as on 28.02.2017)
3,27,81,329
2. Janani Suraksha Yojana (as on 31.03. 2017) 1,04,59,547
3. Aam Admi Bima Yojana (as on 31.03. 2017) 4,37, 00,000
4. Rashtriya Swasthya Bima Yojana (as on 31.03. 2017) 3,63,32,626
vi. Shram Suvidha Portal for effective compliance and ease of doing business
Ministry of Labour & Employment, Government of India and the State Governments enforce more than 44 labour laws in their respective spheres. There have been requests from various stakeholders for ensuring simplification of formats, ease of compliance, transparency in inspections and speedy redressal of griev-ances. In order to address these concerns Ministry of Labour & Employment developed a single unified Web Portal for reporting of inspections and submissions of Annual Returns to facilitate ease of reporting at one place of various labour laws, consolidated information of Labour Inspections and its enforcement, and to foster transparency and accountability in inspections. The web portal contributes proactively to achieve the objective of simplifying business regulations, effective compliance and ease of doing business.
PARLIAMENTARY WATCH REPORT 2017 | 47
REFERENCES
1. Arun, R., & Kota, A. P. (2016, January 7). Swachh Bharat Cess has many problems -for starters its name. Scroll.in. Retrieved December 12, 2017, from https://scroll.in/article/777443/swachh-bharat-cess-has-many-problems-for-starters-its-name
2. Census (2011). The Census of India. Published by Government of India. Retrieved on 12 August 2017, from http://www.Censusindia.gov.in/2011-Common/CensusData2011.html
3. Chaudhury, A. Amit (2017 Nov 8) Show some compassion for homeless, construct shelter homes for them: Supreme Court to states. Times of India. Retrieved from https://timesofindia.indiatimes.com/india/show-some-compassion-for-homeless-construct-shel-ter-homes-for-them-supreme-court-to-states/articleshow/61565212.cms
4. Kumar, A. (2017, March 31). AMRUT: A Mission in Making. The Times of India. Retrieved on 25 August 2017, from http://timesofindia.indiatimes.com/city/thiruvananthapuram/amrut-a-mis-sion-impossible-in-the-making/articleshow/57933815.cms
5. Lok Sabha (2017). Parliament of India: Starred and Unstarred Questions, Lok Sabha. Ministry of Housing and Urban Affairs. Published by the Government of India. Retrieved on 17 August 2017, from http://164.100.47.194/Loksabha/Questions/Qtextsearch.aspx
6. Mishra (2017). Affordable Housing in Urban Areas, Yojana, published by Ministry of Informa-tion and Broadcasting
7. MoHUA (2015). Atal Mission for Rejuvenation and Urban Transformation (AMRUT). Published by Government of India. Updated on 31 July 2017. Retrieved on 24 August 2017, from http://moud.gov.in/cms/amrut.php
8. MoHUA (2015). Smart Cities Mission (SCM). Published by Government of India. Updated on 31 July 2017. Retrieved on 20 August 2017, from http://moud.gov.in/cms/smart-cities.php
9. MoHUA (2015). Swachh Bharat Mission (SBM). Published by Government of India. Updated on 31st July 2017. Retrieved on 20th August 2017. http://moud.gov.in/cms/swachh-bharat-mission.php
10. MoHUA (2015). Pradhan Mantri Awas Yojana (PMAY). Published by Government of India. Updated on 31 July 2017. Retrieved on 5 September 2017, from http://moud.gov.in/cms/pradhan-mantri-awas-yojana.php
11. MoHUA (2015). National Heritage City Development and Augmentation Yojana (HRIDAY). Published by Government of India. Updated on 31t July 2017. Retrieved on 3 September 2017, from http://moud.gov.in/cms/hariday.php
12. MoHUA (2015). Deendayal Antyodaya Yojana-National Urban Livelihood Mission (DAY-NULM). Published by Government of India. Updated on 19 July 2017. Retrieved on 22 August 2017, from http://moud.gov.in/cms/deendayal-antyodaya-yojana-national-urban-livelihoods-mission-nulm.php

48 | YUVA
13. MoHUA (2017). Report of the Technical Group on Urban Housing Shortage 2012-2017. New Delhi: Ministry of Housing and Urban Poverty Alleviation . Retrieved December 17, 2017, from https://smartnet.niua.org/sites/default/files/resources/urban-housing-shortage.pdf.
14. Rajya Sabha (2017). Parliament of India: Starred and Unstarred Questions, Rajya Sabha. Minis-try of Housing and Urban Affairs. Published by the Government of India. Retrieved on 17 August 2017, from http://164.100.47.5/qsearch/qsearch.aspx.
15. Shantha, S. (2017, October 2). Demolitions, Evictions and Toilets for Show: How Indore Won Swachh Bharat’s Top Rank. The Wire. Retrieved November 15, 2017, from https://thewire.in/183503/indore-swachh-bharat-abhiyan/
16. Shah, R. (2017, February 2). What will ‘infrastructure’ do for affordable housing? Expert, in-dustry explain. DNA. Retrieved October 21, 2017, from www.dnaindia.com/money/report-what-will-infrastructure-status-do-for-affordable-housing-experts-industry-explains-2307885
17. UN News (2014) World’s population increasingly urban with more than half living in urban areas. Retrieved August 3, 2017, from http://www.un.org/en/development/desa/news/population/world-urbanization-prospects-2014.html
18. YUVA (2017). Unequal Realities: Identity, Housing and Basic Services in Four Cities, 2016. Published by Youth for Unity and Voluntary Action, July 2017.

Suggested Citation:
Parliamentary Watch Report: An analysis of questions answered on urban issues in the Indian Parliament in 2017. City Say.
Youth for Unity and Voluntary Action (2018) Mumbai, India.
Published by:
YUVA (Youth for Unity and Voluntary Action)
YUVA Centre Sector 7, Plot 23, Kharghar
Navi Mumbai – 410210 (INDIA)

An analysis of questions asked on urban issues in the Indian Parliament in 2017
YUVA (Youth for Unity and Voluntary Action)www.yuvaindia.org
YUVA Centre Sector 7, Plot 23, Kharghar, Navi Mumbai – 410210 (India)
2017
Cityâð
Parliamentary Watch Report
About YUVA
Youth for Unity and Voluntary Action (YUVA) is a non-profit development organisation committed to enabling vulner-able groups to access their rights and address human rights violations. YUVA supports the formation of people’s collec-tives that engage in the discourse on development, thereby ensuring self-determined and sustained collective action in communities. This work is complemented with advocacy and policy recommendations on issues.