a state-by-state look at public health...
TRANSCRIPT

Investing in America’s Health:
ISSUE
RE
PO
RT
AP
RIL
2015
2015A STATE-BY-STATE LOOK AT PUBLIC HEALTH FUNDING AND KEY HEALTH FACTS

2 TFAH • healthyamericans.org
AcknowledgementsTrust for America’s Health is a non-profit, non-partisan organization dedicated to saving lives by protecting the health of every community and working to make disease prevention a national priority.
For more than 40 years the Robert Wood Johnson Foundation has worked to improve the health and health care of all Americans. We are striving to build a national Culture of Health that will enable all Americans to live longer, healthier lives now and for generations to come. For more information, visit www.rwjf.org. Follow the Foundation on Twitter at www.rwjf.org/twitter or on Facebook at www.rwjf.org/facebook.
TFAH would like to thank RWJF for their generous support of this report.
TFAH BOARD OF DIRECTORS
Gail Christopher, DNPresident of the Board, TFAHVice President for Policy and Senior AdvisorWK Kellogg Foundation
Cynthia M. Harris, PhD, DABTVice President of the Board, TFAHDirector and ProfessorInstitute of Public Health, Florida A&M University
Theodore SpencerSecretary of the Board, TFAHSenior Advocate, Climate CenterNatural Resources Defense Council
Robert T. Harris, MDTreasurer of the Board, TFAHMedical DirectorNorth Carolina Medicaid Support Services CSC, Inc.
David Fleming, MDVice PresidentPATH
Arthur Garson, Jr., MD, MPHDirector, Health Policy Institute Texas Medical Center
John Gates, JDFounder, Operator and ManagerNashoba Brook Bakery
Octavio N. Martinez, Jr., MD, DPH, MBA, FAPAExecutive DirectorHogg Foundation for Mental Health at the University of Texas at Austin
Tom MasonPresidentAlliance for a Healthier Minnesota
C. Kent McGuire, PHDPresident and CEOSouthern Education Foundation
Eduardo Sanchez, MD, MPHChief Medical Officer for PreventionAmerican Heart Association
REPORT AUTHORS
Jeffrey Levi, PhD.Executive DirectorTrust for America’s Healthand Professor of Health PolicyMilken Institute School of Public Health at the George Washington University
Laura M. Segal, MADirector of Public AffairsTrust for America’s Health
Robyn GougeletGovernment Relations RepresentativeTrust for America’s Health
Rebecca St. Laurent, JDConsultant

Investing in America’s
Health Public Health
Report series
INT
RO
DU
CT
ION
AP
RIL
2015
For too long, the country has focused on treating people after they become sick instead of preventing diseases before they occur.
Investing in disease prevention is the most effective, common-sense way to improve health — helping to spare millions of Americans from developing preventable illnesses, reduce healthcare costs, and improve the productivity of the American workforce so we can be competitive with the rest of the world.
Tens of millions of Americans are currently suffering from preventable diseases such as cancer, heart disease and diabetes. And, today’s children are in danger of becoming the first generation in American history to live shorter, less healthy lives than their parents.
Americans across the country deserve and should expect basic health protections, no matter where they live. Yet, disease rates vary significantly from city-to-city and region-to-region. And, fundamental pub-lic health services intended to protect our health and the funding of these programs often vary dramatically from state-to-state and among communities within states. Currently, there is no systematic rationale for ensuring a minimum level of health services for all Americans, or that the money spent on public health programs is being used in the most effective ways to reduce and prevent disease and injury.
Public health departments have the unique role and responsibility as chief health strategist for communities – work-ing to improve health in schools, work-places and neighborhoods. This involves identifying the top health problems and developing strategies for how to address them. To be effective, public health of-ficials must have the capabilities to define the scope of health problems, set goals to improve health and recruit whoever can help make change happen.
But, the public health system has been chronically underfunded for decades. Analyses from the Institute of Medicine (IOM), The New York Academy of Medicine (NYAM), the U.S. Centers for Disease Control and Prevention (CDC), and a range of other experts have found that federal, state and local public health departments have been hampered due to limited funds and have not been able to adequately carry out many core functions, including programs to prevent disease and prepare for health emergencies.1
In this report, the Trust for America’s Health (TFAH) examines public health funding in combination with key health facts in each state to further the discussion about how to ensure public health is funded sufficiently and structured as effectively as possible to have real impact on improving health. The report:
l Provides the public, policymakers and a broad and diverse set of groups involved in public health with an objective, nonpartisan, independent analysis of the status of public health funding policies;
l Encourages greater transparency and accountability of the system; and
l Recommends ways to assure the public health system meets today’s needs and works across boundaries to accomplish its goals.
Overall, Investing in America’s Health con-cludes that the public health system must be modernized — and that a sustained and sufficient level of investment in preven-tion is needed at all levels of government to improve health in the United States. Improvements and closing the gaps in dif-ferences in disease rates will not be accom-plished unless an adequate level of funding is provided to support public health.
Introduction

4 TFAH • healthyamericans.org
$300
$250
$200
$150
$100
$50
$0
10%
8%
6%
4%
2%
0%
-2%
-4%
-6%
-8%2003 2004 2005 2006 2007 2008 2009 2010 2011 2012 2013
–––- Per capita –––- $–––- Per capita real $- - - - Annual growth rate, per capita nominal $- - - - Annual growth rate, per capita real $- - - - Percent of national health expenditures
Governmental Public Health Expenditures 2003-13
Source: Author’s analysis of National Health Expenditure Accounts dataSource: Public Health Economics
$7.00
$5.25
$200
$3.50
$1.752008 2009** 2010 2011 2012 2013 2014 2015
*This chart does not account for inflation, numbers are rounded**FY2009 includes from the 2009 Recovery Act
■ CDC Funding from the Prevention and Public Health Fund ■ CDC Program level (Without the PPHF)
CDC Program Levels — Fiscal Year 2008 to Fiscal Year 2015*
$6.05
(Bill
ions
)
$6.92 $6.75
$0.19
$6.23
$0.61
Fiscal Year
$6.06
$0.81
$5.83
$0.46
$6.02
$0.83
$6.04
$0.89
MAIN FINDINGSl National Public Health Funding: Combined
federal, state and local public health spend-
ing is below pre-recession levels — at
$75.4 billion total in 2013 — or $239 per
person ($218 adjusted for inflation) com-
pared to $241 per person in 2009. Adjust-
ing for inflation, public health spending was
10 percent lower in 2013 than in 2009.2
l Flat Federal Funding: Federal fund-
ing for public health has remained at a
relatively flat level for years. The budget
for CDC has decreased from a high of
$7.07 billion in FY 2005 to $6.93 billion
in FY 2015.3 Spending through CDC
averaged to only $20.01 per person in
FY 2015. And the amount of federal
funding spent to prevent disease and
improve health in communities ranged
significantly from state to state, with a
per capita low of $15.14 in Indiana to a
high of $50.09 in Alaska.
5 TFAH • healthyamericans.org
l Public Health Emergency
Preparedness Cuts:
• Public Health Emergency Preparedness
(PHEP) Cooperative Agreement Funding
— which provides support for states
and localities to prepare for and re-
spond to all types of disasters — has
dropped from a high of $919 million in
FY 2005 to $643 million in FY 2015
• The Hospital Preparedness Program
(HPP) has been cut from a high of
$515 million in fiscal year 2004 to just
$255 million in FY 2015 a cut of more
than 50 percent, including a more than
$100 million cut in FY 2014. The HPP
provides grants and leadership to de-
velop coalitions of healthcare facilities
to improve medical surge capacity and
enhance community and hospital pre-
paredness for health emergencies.
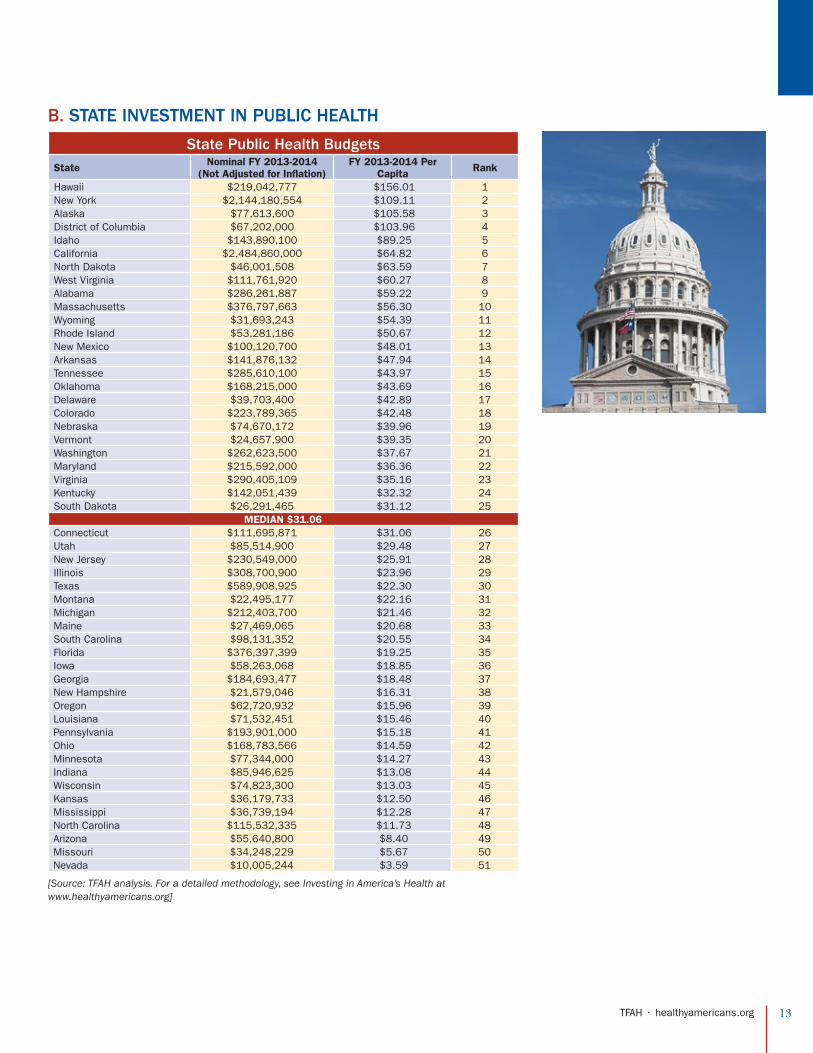
l Cuts in State and Local Funding: At
the state and local levels, public health
budgets have been cut at drastic rates
in recent years. According to a TFAH
analysis, 22 states and Washington,
D.C. decreased their public health
budgets from FY 2012-13 to FY 2013-
14. Budgets in 17 states decreased for
two or more years in a row, and budgets
in nine states decreased for three or
more years in a row. In FY 2013-14, the
median state funding for public health
was $31.06 per person, ranging from
a high of $156.01 in Hawaii to a low
of $3.59 in Nevada. From FY 2008 to
FY 2014, the median per capita state
spending decreased from $33.71 to
$31.06. This represents a cut of more
than $1.3 billion adjusted for inflation.
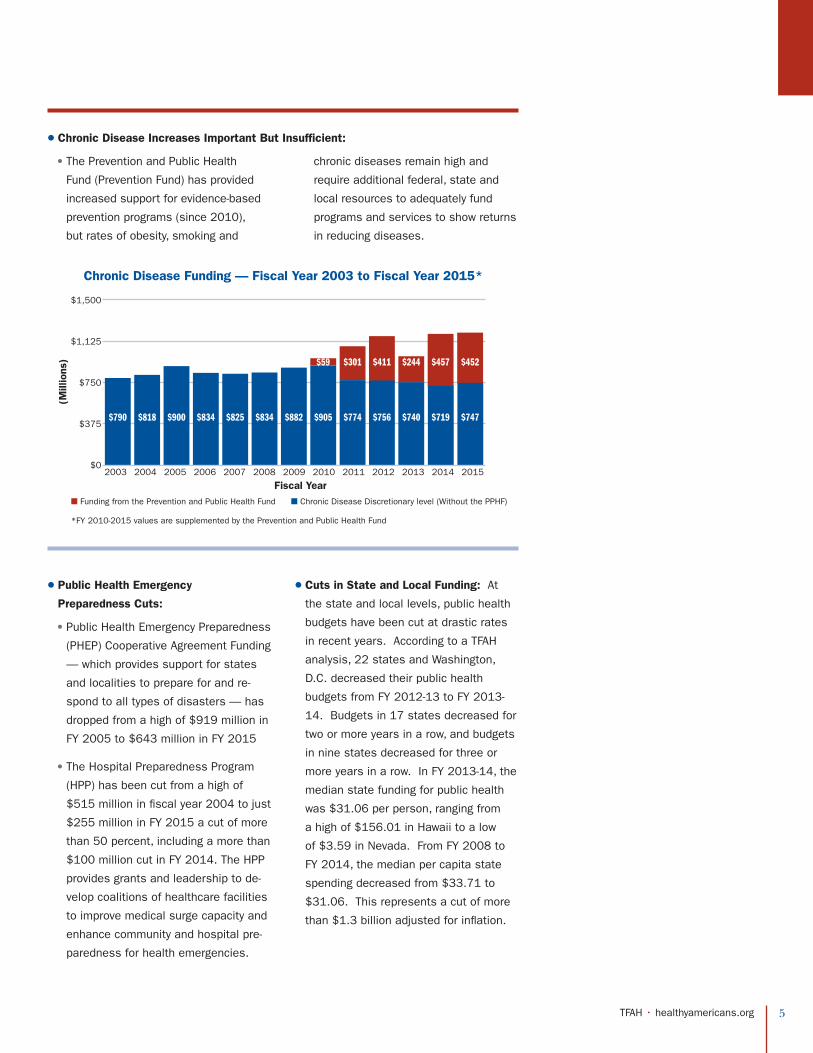
l Chronic Disease Increases Important But Insufficient:
• The Prevention and Public Health
Fund (Prevention Fund) has provided
increased support for evidence-based
prevention programs (since 2010),
but rates of obesity, smoking and
chronic diseases remain high and
require additional federal, state and
local resources to adequately fund
programs and services to show returns
in reducing diseases.
$1,500
$1,125
$750
$375
$02003 2004 2005 2006 2007 2008 2009 2010 2011 2012 2013 2014 2015
*FY 2010-2015 values are supplemented by the Prevention and Public Health Fund
■ Funding from the Prevention and Public Health Fund ■ Chronic Disease Discretionary level (Without the PPHF)
Chronic Disease Funding — Fiscal Year 2003 to Fiscal Year 2015*
(Mill
ions
)
Fiscal Year
$740
$244
$756
$411
$774
$301
$882$834$834$900$790 $818 $825 $905
$59 $452
$747
$457
$719
6 TFAH • healthyamericans.org
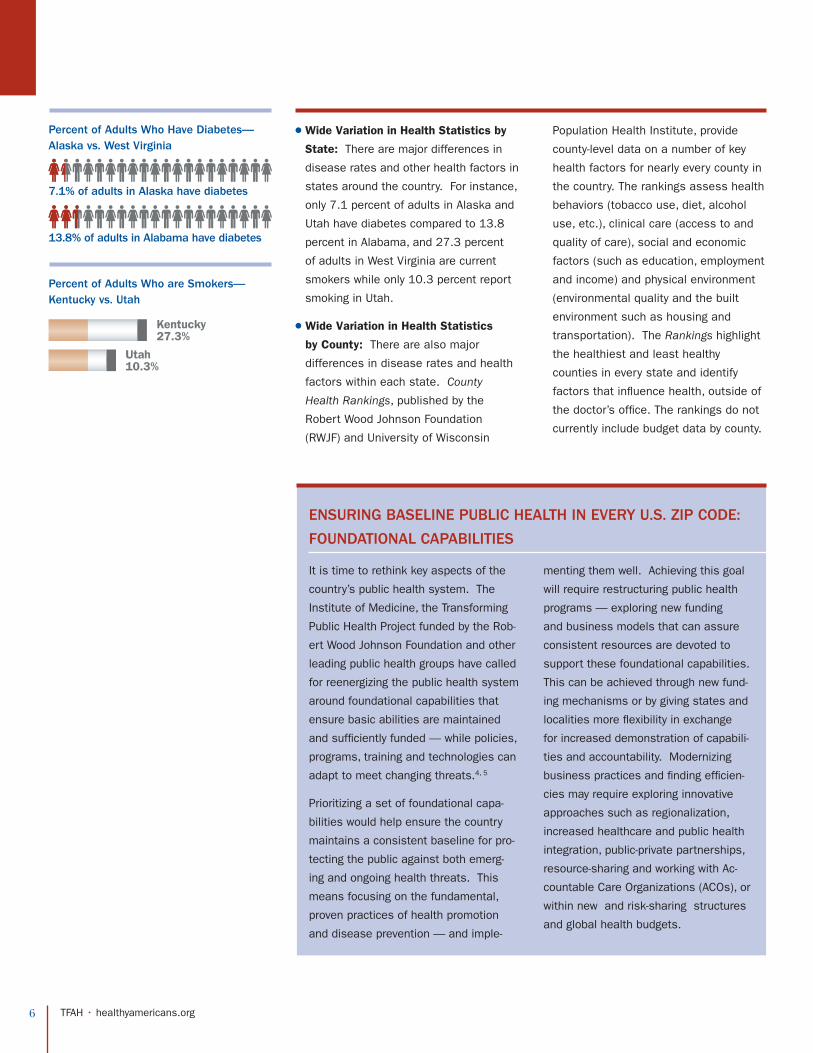
l Wide Variation in Health Statistics by
State: There are major differences in
disease rates and other health factors in
states around the country. For instance,
only 7.1 percent of adults in Alaska and
Utah have diabetes compared to 13.8
percent in Alabama, and 27.3 percent
of adults in West Virginia are current
smokers while only 10.3 percent report
smoking in Utah.
l Wide Variation in Health Statistics
by County: There are also major
differences in disease rates and health
factors within each state. County
Health Rankings, published by the
Robert Wood Johnson Foundation
(RWJF) and University of Wisconsin
Population Health Institute, provide
county-level data on a number of key
health factors for nearly every county in
the country. The rankings assess health
behaviors (tobacco use, diet, alcohol
use, etc.), clinical care (access to and
quality of care), social and economic
factors (such as education, employment
and income) and physical environment
(environmental quality and the built
environment such as housing and
transportation). The Rankings highlight
the healthiest and least healthy
counties in every state and identify
factors that influence health, outside of
the doctor’s office. The rankings do not
currently include budget data by county.
ENSURING BASELINE PUBLIC HEALTH IN EVERY U.S. ZIP CODE:
FOUNDATIONAL CAPABILITIES
It is time to rethink key aspects of the
country’s public health system. The
Institute of Medicine, the Transforming
Public Health Project funded by the Rob-
ert Wood Johnson Foundation and other
leading public health groups have called
for reenergizing the public health system
around foundational capabilities that
ensure basic abilities are maintained
and sufficiently funded — while policies,
programs, training and technologies can
adapt to meet changing threats.4, 5
Prioritizing a set of foundational capa-
bilities would help ensure the country
maintains a consistent baseline for pro-
tecting the public against both emerg-
ing and ongoing health threats. This
means focusing on the fundamental,
proven practices of health promotion
and disease prevention — and imple-
menting them well. Achieving this goal
will require restructuring public health
programs — exploring new funding
and business models that can assure
consistent resources are devoted to
support these foundational capabilities.
This can be achieved through new fund-
ing mechanisms or by giving states and
localities more flexibility in exchange
for increased demonstration of capabili-
ties and accountability. Modernizing
business practices and finding efficien-
cies may require exploring innovative
approaches such as regionalization,
increased healthcare and public health
integration, public-private partnerships,
resource-sharing and working with Ac-
countable Care Organizations (ACOs), or
within new and risk-sharing structures
and global health budgets.
7.1% of adults in Alaska have diabetes
13.8% of adults in Alabama have diabetes
Kentucky 27.3%
Utah 10.3%
Percent of Adults Who Have Diabetes—Alaska vs. West Virginia
Percent of Adults Who are Smokers—Kentucky vs. Utah

State Rates and Trends
SEC
TIO
N 1: FU
ND
ING
FOR
PUB
LIC
HE
ALT
H
SECTION 1:
Funding for Public HealthPublic health programs are funded through a combination of federal, state and local dollars.
Each level of government has different, but important responsibilities for protecting the public’s health. While this report focuses primarily on federal funding to states, it also provides information about state funding.
TFAH analyzes federal and state funding for public health based on the most complete financial data currently available. There is a
significant delay from the time a President proposes a fiscal year budget to when appropriations legislation is signed into law to the time when the funds are disbursed. Thus in looking at federal public health funds that go to the states, TFAH uses FY 2014 data for this analysis, which is the most recent budget year for which the data is most complete and accurate.
A. FEDERAL INVESTMENTS IN PUBLIC HEALTHFEDERAL FUNDING FOR STATES FROM THE U.S. CENTERS FOR DISEASE CONTROL AND PREVENTION
Approximately 75 percent of CDC’s budget is distributed to states, localities, and other public and private partners to support services and programs.
These funds support a wide range of essential public health programs — to improve health, prevent diseases and injuries and to prepare for major health emergencies. However, the current federal public health funding structure does not actively promote a set of baseline, consistent capabilities that every community across the country should be able to achieve.
Most of the federal funding from CDC is distributed by categories — for important, but often siloed, health concerns. Federal funding is based on a mixture of population-based formula grant programs (often based on disease rates or other incidence formulas) and a series of competitive grants - where some states receive funding and others do not due to insufficient funds. Because of federal funding limitations, many states submit competitive grants that are “approved but unfunded” due to limited funds.
AP
RIL
2015K
athe
rine
Wel
les
/ Shu
tter
stoc
k.co
m
a ka
tz /
Shu
tter
stoc
k.co
m

8 TFAH • healthyamericans.org
CDC FUNDING BY STATE 2014
State
Agency for Toxic Substances and Disease Registry
(ATSDR)
Birth Defects, Developmental
Disabilities, Disability and
Health
CDC-Wide Activities
and Program Support
Chronic Disease Prevention and Health Promotion
Emerging and Zoonotic
Infectious Diseases
Environmental Health
Health Reform - Chronic Disease
Prevention and Health Promotion
Health Reform - Toxic Substances & Environmental Public Health
HIV/AIDS, Viral Hepatitis,
STI and TB Prevention
State
Immunization and
Respiratory Diseases
Injury Prevention and
Control
National Institute for
Occupational Safety and
Health
Public Health Preparedness and Response
Public Health Scientific Services (PHSS)
Vaccines for Children
World Trade Center Health
Programs (WTC)
Grand Total CDC Per Capita 2014
CDC Per Capita
Ranking
Alabama 1,669,697 2,679,308 12,902,069 855,765 24,000 9,835,523 Alabama 3,646,671 598,333 1,608,821 9,275,797 321,771 57,386,155 100,803,910 $20.79 26Alaska 357,639 806,933 840,617 12,455,377 1,117,503 2,255,366 Alaska 2,805,090 779,576 115,302 4,373,966 239,747 10,758,940 36,906,056 $50.09 1Arizona 298,981 620,431 1,844,968 13,032,152 1,600,420 572,880 9,081,193 Arizona 5,790,241 1,164,497 885,511 12,208,367 587,091 80,382,894 128,069,626 $19.03 34Arkansas 374,054 1,469,141 1,379,539 9,809,207 1,008,688 3,991,922 Arkansas 2,652,201 423,510 724,909 6,654,114 350,454 46,880,238 75,717,977 $25.53 14California 789,040 3,732,277 11,164,599 61,471,451 7,394,091 4,203,255 1,255,000 99,468,487 California 27,827,270 6,159,589 9,457,267 62,473,892 1,196,775 423,344,051 719,937,044 $18.55 38Colorado 336,764 2,549,568 2,201,582 13,302,749 3,606,329 1,240,339 9,224,433 Colorado 6,029,473 3,032,862 5,140,176 9,998,933 360,088 44,409,953 101,433,249 $18.94 36Connecticut 498,307 188,327 2,525,907 8,060,851 4,090,586 1,802,416 7,355,728 Connecticut 4,203,412 670,731 994,650 7,760,623 247,691 32,385,298 70,784,527 $19.68 31Delaware 394,477 286,674 8,717,616 658,012 102,113 2,651,101 Delaware 2,498,238 578,888 4,389,690 224,246 9,909,588 30,410,643 $32.50 4D.C. 723,835 5,738,806 1,572,934 20,261,908 2,156,848 2,201,536 22,367,237 D.C. 7,584,317 1,557,610 1,701,665 8,507,863 8,187,906 9,554,122 92,116,587 $139.81 N/AFlorida 443,878 624,430 4,599,330 23,719,764 2,137,848 2,281,677 56,812,029 Florida 11,093,837 3,043,539 1,759,027 29,139,373 417,234 209,260,534 345,332,500 $17.36 43Georgia 375,802 1,609,947 7,197,605 32,991,404 5,444,031 2,179,065 26,969,865 Georgia 15,377,359 2,779,086 1,190,979 16,324,723 8,652,581 118,975,080 240,067,527 $23.78 17Hawaii 220,901 1,214,074 8,294,064 777,984 515,000 3,339,494 Hawaii 2,305,386 540,825 4,886,947 466,741 14,677,105 37,238,521 $26.23 12Idaho 201,477 57,019 574,164 6,840,838 522,874 1,542,556 Idaho 2,284,328 707,037 5,028,347 302,135 16,223,549 34,284,324 $20.98 25Illinois 1,680,405 5,904,145 3,845,374 27,090,756 3,908,895 1,727,015 29,398,022 Illinois 12,548,405 3,486,024 2,493,580 27,212,373 596,315 126,411,429 246,302,738 $19.12 33Indiana 212,131 2,513,080 7,701,696 926,179 901,800 6,573,245 Indiana 4,162,862 1,402,464 297,801 11,593,046 363,627 63,249,685 99,897,616 $15.14 50Iowa 2,269,999 1,696,511 9,223,864 1,769,137 1,149,864 2,575,322 Iowa 5,975,943 1,377,787 5,201,984 7,061,211 477,607 26,888,950 65,668,179 $21.13 24Kansas 1,727,666 12,664,094 949,933 639,717 2,428,708 Kansas 5,259,419 950,238 6,921,859 427,128 23,184,027 55,152,789 $18.99 35Kentucky 341,301 2,255,394 10,952,047 851,846 1,031,146 3,475,145 Kentucky 4,973,038 1,397,073 3,189,481 8,698,334 166,302 44,147,114 81,478,221 $18.46 40Louisiana 347,446 5,242,512 9,610,182 934,179 1,876,009 13,368,650 Louisiana 2,211,097 924,742 175,615 9,142,513 1,019,008 64,026,582 108,878,535 $23.42 19Maine 122,924 1,648,757 8,687,075 851,224 1,876,701 1,904,915 Maine 2,060,714 468,946 4,925,847 215,523 12,314,954 35,077,580 $26.37 11Maryland 3,858,540 3,148,027 22,508,449 4,670,672 2,599,055 23,699,185 Maryland 9,277,330 3,680,893 8,338,391 13,682,174 7,925,332 65,498,244 168,886,292 $28.26 10Massachusetts 402,138 1,884,544 4,468,531 19,262,806 3,581,480 3,253,984 1,255,000 17,112,267 Massachusetts 5,462,701 1,885,128 9,986,301 13,440,931 399,486 55,991,048 138,386,345 $20.52 27Michigan 440,581 1,524,500 6,810,122 29,805,746 2,123,566 1,876,371 13,970,238 Michigan 12,260,236 4,832,960 4,232,631 16,783,122 407,927 85,344,445 180,412,445 $18.21 42Minnesota 451,912 356,399 4,204,729 18,615,370 6,023,124 2,573,577 7,220,704 Minnesota 8,940,671 1,260,380 5,167,158 11,398,228 312,741 41,881,679 108,406,672 $19.86 29Mississippi 116,032 2,253,384 10,874,985 829,889 183,148 7,976,671 Mississippi 4,725,742 428,329 67,455 6,615,533 336,720 38,719,729 73,127,617 $24.42 16Missouri 331,895 370,947 3,856,458 9,359,812 1,371,333 2,036,341 9,845,408 Missouri 4,629,252 584,338 11,140,524 272,070 53,237,409 97,035,787 $16.00 45Montana 454,182 1,299,540 8,097,752 767,062 508,000 2,499,839 1,564,097 Montana 1,090,888 302,806 98,824 4,142,346 209,312 8,381,542 29,416,190 $28.74 9Nebraska 107,104 2,596,738 13,033,098 966,059 6,900 2,425,447 Nebraska 3,703,019 621,001 2,210,061 5,526,426 486,494 17,466,815 49,149,162 $26.12 13Nevada 473,425 606,639 8,930,803 709,964 10,000 4,133,316 Nevada 3,568,362 403,308 7,017,456 376,863 29,871,029 56,101,165 $19.76 30New Hampshire 354,584 842,231 2,223,566 7,463,545 1,035,005 2,782,651 1,525,995 New Hampshire 1,433,389 830,079 120,000 4,980,300 463,106 8,984,174 33,038,625 $24.90 15New Jersey 578,728 478,803 4,455,712 9,156,614 1,232,382 2,001,472 29,514,178 New Jersey 7,801,247 1,271,580 632,573 15,845,833 497,218 64,737,388 999,675 139,203,403 $15.57 48New Mexico 1,000,000 106,111 2,183,615 9,450,335 2,312,607 2,113,999 3,641,496 New Mexico 4,003,630 524,822 856,908 6,808,065 373,497 34,200,681 67,575,766 $32.40 5New York 826,102 4,556,975 11,165,935 40,650,466 7,865,195 4,845,641 96,943,339 New York 22,144,209 6,265,931 5,032,199 39,047,788 1,975,332 206,563,313 20,114,304 467,996,729 $23.70 18North Carolina 320,138 3,454,560 4,447,090 19,450,241 1,482,105 512,522 16,499,007 North Carolina 6,107,469 4,646,443 2,951,278 15,219,724 239,971 106,830,269 182,160,817 $18.32 41North Dakota 455,703 394,511 4,845,488 667,138 5,000 1,317,948 North Dakota 3,274,460 278,089 4,107,079 373,851 6,034,246 21,753,513 $29.42 8Ohio 149,998 569,151 6,990,280 19,427,776 4,594,209 1,278,707 12,078,697 Ohio 7,467,030 3,482,664 3,111,233 18,408,295 432,496 103,840,251 181,830,787 $15.68 47Oklahoma 477,750 1,444,677 12,534,902 829,726 582,266 4,258,909 Oklahoma 2,958,363 1,393,588 563,348 8,084,077 944,121 54,458,397 88,530,124 $22.83 21Oregon 586,950 542,447 1,107,390 13,732,031 3,146,957 2,266,273 5,423,548 Oregon 7,659,747 2,053,155 1,748,287 8,051,668 519,844 30,704,262 77,542,559 $19.53 32Pennsylvania 455,685 1,403,523 7,366,098 19,514,863 2,431,211 1,871,773 26,160,359 Pennsylvania 10,076,334 4,957,435 1,858,564 19,603,017 598,675 102,749,567 199,047,104 $15.57 48Rhode Island 637,169 733,643 9,459,691 1,017,094 1,291,717 2,934,746 Rhode Island 2,856,453 1,643,392 4,512,116 383,791 10,123,715 35,593,527 $33.73 3South Carolina 150,000 4,387,272 1,900,192 15,918,459 1,242,040 750,390 10,585,334 South Carolina 3,556,132 819,853 9,730,185 435,504 55,799,476 105,274,837 $21.78 22South Dakota 138,550 358,699 7,682,784 715,531 10,000 1,354,233 South Dakota 1,161,373 286,369 4,150,932 278,294 9,284,479 25,421,244 $29.80 7Tennessee 277,550 2,408,219 2,505,510 9,043,732 5,084,128 645,939 10,506,281 Tennessee 6,536,511 1,855,942 162,638 11,044,268 521,947 70,363,950 120,956,615 $18.47 39Texas 542,173 740,553 6,268,434 17,632,688 2,047,231 310,669 2,500,997 50,058,883 Texas 19,842,231 3,248,622 4,364,128 37,940,151 494,505 364,044,963 510,036,228 $18.92 37Utah 222,845 750,021 1,494,846 13,147,945 1,540,649 2,362,697 2,494,410 Utah 2,582,349 1,868,259 1,582,920 7,010,496 521,396 24,153,950 59,732,783 $20.30 28Vermont 150,000 422,077 3,506,388 974,772 1,879,200 2,208,866 Vermont 1,565,401 197,379 4,024,418 422,210 5,998,085 21,348,796 $34.07 2Virginia 351,292 106,650 3,372,805 18,569,701 1,697,306 1,788,088 13,698,484 Virginia 7,625,285 2,194,317 83,271 17,457,338 7,199,549 59,792,631 133,936,717 $16.09 44Washington 533,600 243,107 1,544,578 21,623,561 1,770,574 1,427,733 15,989,581 Washington 9,709,796 2,129,272 7,166,768 12,594,537 648,251 75,620,063 151,001,421 $21.38 23West Virginia 1,388,611 9,528,710 926,821 210,480 1,994,971 West Virginia 1,609,719 1,640,306 323,000 5,428,268 303,291 19,963,685 43,317,862 $23.41 20Wisconsin 445,246 1,046,092 3,021,064 11,158,694 2,273,553 2,327,783 5,232,970 Wisconsin 9,978,578 919,432 1,995,984 11,440,453 685,515 41,610,736 92,136,100 $16.00 45Wyoming 141,924 352,509 3,464,267 701,426 1,374,756 Wyoming 1,551,170 202,865 4,099,542 250,412 5,627,196 17,766,067 $30.41 6Grand Total 14,501,599 61,662,384 151,396,605 755,240,866 108,193,181 68,636,909 5,010,997 2,499,839 718,363,265 U.S. TOTAL 326,448,378 88,752,294 97,590,688 615,913,108 54,109,691 3,292,247,666 21,113,979 6,381,681,449 $20.01
[Source: CDC. For a detailed list of references, see Investing in America’s Health at www.healthyamericans.org]

9 TFAH • healthyamericans.org
CDC FUNDING BY STATE 2014
State
Agency for Toxic Substances and Disease Registry
(ATSDR)
Birth Defects, Developmental
Disabilities, Disability and
Health
CDC-Wide Activities
and Program Support
Chronic Disease Prevention and Health Promotion
Emerging and Zoonotic
Infectious Diseases
Environmental Health
Health Reform - Chronic Disease
Prevention and Health Promotion
Health Reform - Toxic Substances & Environmental Public Health
HIV/AIDS, Viral Hepatitis,
STI and TB Prevention
State
Immunization and
Respiratory Diseases
Injury Prevention and
Control
National Institute for
Occupational Safety and
Health
Public Health Preparedness and Response
Public Health Scientific Services (PHSS)
Vaccines for Children
World Trade Center Health
Programs (WTC)
Grand Total CDC Per Capita 2014
CDC Per Capita
Ranking
Alabama 1,669,697 2,679,308 12,902,069 855,765 24,000 9,835,523 Alabama 3,646,671 598,333 1,608,821 9,275,797 321,771 57,386,155 100,803,910 $20.79 26Alaska 357,639 806,933 840,617 12,455,377 1,117,503 2,255,366 Alaska 2,805,090 779,576 115,302 4,373,966 239,747 10,758,940 36,906,056 $50.09 1Arizona 298,981 620,431 1,844,968 13,032,152 1,600,420 572,880 9,081,193 Arizona 5,790,241 1,164,497 885,511 12,208,367 587,091 80,382,894 128,069,626 $19.03 34Arkansas 374,054 1,469,141 1,379,539 9,809,207 1,008,688 3,991,922 Arkansas 2,652,201 423,510 724,909 6,654,114 350,454 46,880,238 75,717,977 $25.53 14California 789,040 3,732,277 11,164,599 61,471,451 7,394,091 4,203,255 1,255,000 99,468,487 California 27,827,270 6,159,589 9,457,267 62,473,892 1,196,775 423,344,051 719,937,044 $18.55 38Colorado 336,764 2,549,568 2,201,582 13,302,749 3,606,329 1,240,339 9,224,433 Colorado 6,029,473 3,032,862 5,140,176 9,998,933 360,088 44,409,953 101,433,249 $18.94 36Connecticut 498,307 188,327 2,525,907 8,060,851 4,090,586 1,802,416 7,355,728 Connecticut 4,203,412 670,731 994,650 7,760,623 247,691 32,385,298 70,784,527 $19.68 31Delaware 394,477 286,674 8,717,616 658,012 102,113 2,651,101 Delaware 2,498,238 578,888 4,389,690 224,246 9,909,588 30,410,643 $32.50 4D.C. 723,835 5,738,806 1,572,934 20,261,908 2,156,848 2,201,536 22,367,237 D.C. 7,584,317 1,557,610 1,701,665 8,507,863 8,187,906 9,554,122 92,116,587 $139.81 N/AFlorida 443,878 624,430 4,599,330 23,719,764 2,137,848 2,281,677 56,812,029 Florida 11,093,837 3,043,539 1,759,027 29,139,373 417,234 209,260,534 345,332,500 $17.36 43Georgia 375,802 1,609,947 7,197,605 32,991,404 5,444,031 2,179,065 26,969,865 Georgia 15,377,359 2,779,086 1,190,979 16,324,723 8,652,581 118,975,080 240,067,527 $23.78 17Hawaii 220,901 1,214,074 8,294,064 777,984 515,000 3,339,494 Hawaii 2,305,386 540,825 4,886,947 466,741 14,677,105 37,238,521 $26.23 12Idaho 201,477 57,019 574,164 6,840,838 522,874 1,542,556 Idaho 2,284,328 707,037 5,028,347 302,135 16,223,549 34,284,324 $20.98 25Illinois 1,680,405 5,904,145 3,845,374 27,090,756 3,908,895 1,727,015 29,398,022 Illinois 12,548,405 3,486,024 2,493,580 27,212,373 596,315 126,411,429 246,302,738 $19.12 33Indiana 212,131 2,513,080 7,701,696 926,179 901,800 6,573,245 Indiana 4,162,862 1,402,464 297,801 11,593,046 363,627 63,249,685 99,897,616 $15.14 50Iowa 2,269,999 1,696,511 9,223,864 1,769,137 1,149,864 2,575,322 Iowa 5,975,943 1,377,787 5,201,984 7,061,211 477,607 26,888,950 65,668,179 $21.13 24Kansas 1,727,666 12,664,094 949,933 639,717 2,428,708 Kansas 5,259,419 950,238 6,921,859 427,128 23,184,027 55,152,789 $18.99 35Kentucky 341,301 2,255,394 10,952,047 851,846 1,031,146 3,475,145 Kentucky 4,973,038 1,397,073 3,189,481 8,698,334 166,302 44,147,114 81,478,221 $18.46 40Louisiana 347,446 5,242,512 9,610,182 934,179 1,876,009 13,368,650 Louisiana 2,211,097 924,742 175,615 9,142,513 1,019,008 64,026,582 108,878,535 $23.42 19Maine 122,924 1,648,757 8,687,075 851,224 1,876,701 1,904,915 Maine 2,060,714 468,946 4,925,847 215,523 12,314,954 35,077,580 $26.37 11Maryland 3,858,540 3,148,027 22,508,449 4,670,672 2,599,055 23,699,185 Maryland 9,277,330 3,680,893 8,338,391 13,682,174 7,925,332 65,498,244 168,886,292 $28.26 10Massachusetts 402,138 1,884,544 4,468,531 19,262,806 3,581,480 3,253,984 1,255,000 17,112,267 Massachusetts 5,462,701 1,885,128 9,986,301 13,440,931 399,486 55,991,048 138,386,345 $20.52 27Michigan 440,581 1,524,500 6,810,122 29,805,746 2,123,566 1,876,371 13,970,238 Michigan 12,260,236 4,832,960 4,232,631 16,783,122 407,927 85,344,445 180,412,445 $18.21 42Minnesota 451,912 356,399 4,204,729 18,615,370 6,023,124 2,573,577 7,220,704 Minnesota 8,940,671 1,260,380 5,167,158 11,398,228 312,741 41,881,679 108,406,672 $19.86 29Mississippi 116,032 2,253,384 10,874,985 829,889 183,148 7,976,671 Mississippi 4,725,742 428,329 67,455 6,615,533 336,720 38,719,729 73,127,617 $24.42 16Missouri 331,895 370,947 3,856,458 9,359,812 1,371,333 2,036,341 9,845,408 Missouri 4,629,252 584,338 11,140,524 272,070 53,237,409 97,035,787 $16.00 45Montana 454,182 1,299,540 8,097,752 767,062 508,000 2,499,839 1,564,097 Montana 1,090,888 302,806 98,824 4,142,346 209,312 8,381,542 29,416,190 $28.74 9Nebraska 107,104 2,596,738 13,033,098 966,059 6,900 2,425,447 Nebraska 3,703,019 621,001 2,210,061 5,526,426 486,494 17,466,815 49,149,162 $26.12 13Nevada 473,425 606,639 8,930,803 709,964 10,000 4,133,316 Nevada 3,568,362 403,308 7,017,456 376,863 29,871,029 56,101,165 $19.76 30New Hampshire 354,584 842,231 2,223,566 7,463,545 1,035,005 2,782,651 1,525,995 New Hampshire 1,433,389 830,079 120,000 4,980,300 463,106 8,984,174 33,038,625 $24.90 15New Jersey 578,728 478,803 4,455,712 9,156,614 1,232,382 2,001,472 29,514,178 New Jersey 7,801,247 1,271,580 632,573 15,845,833 497,218 64,737,388 999,675 139,203,403 $15.57 48New Mexico 1,000,000 106,111 2,183,615 9,450,335 2,312,607 2,113,999 3,641,496 New Mexico 4,003,630 524,822 856,908 6,808,065 373,497 34,200,681 67,575,766 $32.40 5New York 826,102 4,556,975 11,165,935 40,650,466 7,865,195 4,845,641 96,943,339 New York 22,144,209 6,265,931 5,032,199 39,047,788 1,975,332 206,563,313 20,114,304 467,996,729 $23.70 18North Carolina 320,138 3,454,560 4,447,090 19,450,241 1,482,105 512,522 16,499,007 North Carolina 6,107,469 4,646,443 2,951,278 15,219,724 239,971 106,830,269 182,160,817 $18.32 41North Dakota 455,703 394,511 4,845,488 667,138 5,000 1,317,948 North Dakota 3,274,460 278,089 4,107,079 373,851 6,034,246 21,753,513 $29.42 8Ohio 149,998 569,151 6,990,280 19,427,776 4,594,209 1,278,707 12,078,697 Ohio 7,467,030 3,482,664 3,111,233 18,408,295 432,496 103,840,251 181,830,787 $15.68 47Oklahoma 477,750 1,444,677 12,534,902 829,726 582,266 4,258,909 Oklahoma 2,958,363 1,393,588 563,348 8,084,077 944,121 54,458,397 88,530,124 $22.83 21Oregon 586,950 542,447 1,107,390 13,732,031 3,146,957 2,266,273 5,423,548 Oregon 7,659,747 2,053,155 1,748,287 8,051,668 519,844 30,704,262 77,542,559 $19.53 32Pennsylvania 455,685 1,403,523 7,366,098 19,514,863 2,431,211 1,871,773 26,160,359 Pennsylvania 10,076,334 4,957,435 1,858,564 19,603,017 598,675 102,749,567 199,047,104 $15.57 48Rhode Island 637,169 733,643 9,459,691 1,017,094 1,291,717 2,934,746 Rhode Island 2,856,453 1,643,392 4,512,116 383,791 10,123,715 35,593,527 $33.73 3South Carolina 150,000 4,387,272 1,900,192 15,918,459 1,242,040 750,390 10,585,334 South Carolina 3,556,132 819,853 9,730,185 435,504 55,799,476 105,274,837 $21.78 22South Dakota 138,550 358,699 7,682,784 715,531 10,000 1,354,233 South Dakota 1,161,373 286,369 4,150,932 278,294 9,284,479 25,421,244 $29.80 7Tennessee 277,550 2,408,219 2,505,510 9,043,732 5,084,128 645,939 10,506,281 Tennessee 6,536,511 1,855,942 162,638 11,044,268 521,947 70,363,950 120,956,615 $18.47 39Texas 542,173 740,553 6,268,434 17,632,688 2,047,231 310,669 2,500,997 50,058,883 Texas 19,842,231 3,248,622 4,364,128 37,940,151 494,505 364,044,963 510,036,228 $18.92 37Utah 222,845 750,021 1,494,846 13,147,945 1,540,649 2,362,697 2,494,410 Utah 2,582,349 1,868,259 1,582,920 7,010,496 521,396 24,153,950 59,732,783 $20.30 28Vermont 150,000 422,077 3,506,388 974,772 1,879,200 2,208,866 Vermont 1,565,401 197,379 4,024,418 422,210 5,998,085 21,348,796 $34.07 2Virginia 351,292 106,650 3,372,805 18,569,701 1,697,306 1,788,088 13,698,484 Virginia 7,625,285 2,194,317 83,271 17,457,338 7,199,549 59,792,631 133,936,717 $16.09 44Washington 533,600 243,107 1,544,578 21,623,561 1,770,574 1,427,733 15,989,581 Washington 9,709,796 2,129,272 7,166,768 12,594,537 648,251 75,620,063 151,001,421 $21.38 23West Virginia 1,388,611 9,528,710 926,821 210,480 1,994,971 West Virginia 1,609,719 1,640,306 323,000 5,428,268 303,291 19,963,685 43,317,862 $23.41 20Wisconsin 445,246 1,046,092 3,021,064 11,158,694 2,273,553 2,327,783 5,232,970 Wisconsin 9,978,578 919,432 1,995,984 11,440,453 685,515 41,610,736 92,136,100 $16.00 45Wyoming 141,924 352,509 3,464,267 701,426 1,374,756 Wyoming 1,551,170 202,865 4,099,542 250,412 5,627,196 17,766,067 $30.41 6Grand Total 14,501,599 61,662,384 151,396,605 755,240,866 108,193,181 68,636,909 5,010,997 2,499,839 718,363,265 U.S. TOTAL 326,448,378 88,752,294 97,590,688 615,913,108 54,109,691 3,292,247,666 21,113,979 6,381,681,449 $20.01

10 TFAH • healthyamericans.org
FY 2014 HRSA Grants to States by Key Program Area (Selected Programs)
State Primary Health Care Health Professions Maternal & Child Health HIV/AIDS HRSA Total
(All Programs)
HRSA Per Capita Total
(All Programs)
HRSA Per Capita Ranking
Alabama $65,389,587 $21,434,165 $24,894,605 $30,755,777 $145,353,257 $29.97 16Alaska $53,025,593 $1,292,505 $4,261,804 $2,758,178 $64,380,629 $87.39 1Arizona $60,458,194 $11,261,206 $23,356,638 $26,621,768 $125,190,281 $18.60 43Arkansas $39,493,547 $9,490,664 $16,509,391 $9,838,327 $78,552,343 $26.48 21California $426,569,877 $77,295,438 $76,353,192 $286,978,798 $876,823,829 $22.60 32Colorado $80,527,319 $12,393,081 $20,863,443 $27,010,201 $146,577,293 $27.37 18Connecticut $39,220,809 $8,714,479 $17,005,938 $27,186,170 $92,705,342 $25.78 22Delaware $10,696,918 $3,628,820 $7,961,352 $6,354,647 $29,565,685 $31.60 13D.C. $16,639,949 $22,340,992 $23,011,644 $56,113,832 $120,015,099 N/A* N/A*Florida $174,888,478 $23,228,613 $32,591,560 $240,115,388 $473,892,558 $23.82 29Georgia $81,995,511 $16,514,574 $26,649,444 $89,982,711 $219,686,152 $21.76 33Hawaii $34,436,613 $7,273,108 $5,495,754 $2,954,956 $52,560,558 $37.03 7Idaho $31,006,886 $1,380,917 $8,437,747 $3,285,209 $45,944,064 $28.11 17Illinois $145,969,147 $25,324,774 $42,170,327 $90,742,688 $309,544,271 $24.03 26Indiana $44,951,137 $7,899,946 $27,768,202 $17,221,765 $101,668,568 $15.41 47Iowa $29,351,080 $5,087,281 $16,866,808 $5,755,304 $61,088,420 $19.66 38Kansas $27,176,136 $3,885,586 $9,236,304 $4,988,136 $50,635,370 $17.44 45Kentucky $51,531,617 $7,010,717 $23,115,114 $13,083,143 $101,007,687 $22.89 30Louisiana $65,045,375 $14,142,889 $26,299,820 $50,458,532 $159,930,514 $34.40 8Maine $29,783,110 $3,010,729 $14,103,948 $2,938,454 $53,814,050 $40.46 3Maryland $49,528,333 $6,308,889 $31,511,386 $54,363,043 $143,257,287 $23.97 27Massachusetts $89,191,598 $32,112,845 $39,490,427 $44,624,872 $207,601,413 $30.78 15Michigan $86,543,844 $29,539,604 $38,392,943 $30,900,165 $194,266,891 $19.60 39Minnesota $30,274,286 $8,849,552 $22,132,494 $15,297,302 $83,800,725 $15.36 48Mississippi $58,723,210 $2,738,360 $17,783,895 $17,433,647 $99,229,216 $33.14 11Missouri $73,865,808 $20,401,342 $27,978,561 $28,582,364 $155,248,877 $25.60 23Montana $29,845,891 $3,776,082 $9,672,125 $1,862,028 $50,167,502 $49.01 2Nebraska $15,849,182 $4,972,982 $8,132,220 $3,514,725 $35,312,073 $18.77 42Nevada $13,582,454 $2,521,085 $5,781,591 $16,035,676 $39,907,179 $14.06 50New Hampshire $17,753,733 $2,062,229 $7,748,972 $1,813,595 $32,013,121 $24.13 25New Jersey $60,067,107 $5,969,034 $27,916,631 $85,823,163 $180,760,498 $20.22 35New Mexico $56,675,744 $5,277,325 $12,511,620 $5,791,182 $82,855,412 $39.73 5New York $185,711,009 $38,896,521 $57,196,096 $331,733,144 $617,852,877 $31.29 14North Carolina $90,887,434 $17,623,919 $29,244,369 $57,846,038 $200,852,555 $20.20 36North Dakota $6,459,500 $2,611,645 $3,490,408 $700,222 $18,085,886 $24.46 24Ohio $92,806,132 $37,927,403 $34,832,158 $36,931,468 $206,883,631 $17.84 44Oklahoma $38,347,845 $7,894,063 $18,835,334 $10,329,109 $77,610,174 $20.01 37Oregon $68,673,355 $4,392,480 $18,846,937 $12,980,428 $108,364,262 $27.29 19Pennsylvania $90,252,859 $66,770,835 $47,750,428 $82,280,913 $291,976,507 $22.83 31Rhode Island $18,991,506 $2,197,351 $9,230,262 $5,351,992 $36,279,514 $34.38 9South Carolina $67,016,210 $3,621,427 $24,344,718 $32,725,475 $130,295,411 $26.96 20South Dakota $15,132,492 $2,084,804 $5,796,409 $1,300,515 $27,178,813 $31.86 12Tennessee $61,893,934 $20,982,133 $26,064,746 $44,852,049 $156,541,772 $23.90 28Texas $196,093,378 $42,053,859 $59,102,544 $156,731,241 $457,929,116 $16.99 46Utah $25,319,784 $7,147,895 $21,311,442 $6,761,683 $62,144,852 $21.12 34Vermont $14,745,565 $1,734,027 $4,245,163 $1,422,201 $23,561,826 $37.60 6Virginia $64,587,425 $11,808,093 $24,467,383 $51,033,629 $156,386,451 $18.78 41Washington $93,645,035 $21,082,592 $23,042,886 $95,128,776 $237,896,869 $33.69 10West Virginia $48,370,888 $3,452,880 $15,849,330 $3,369,860 $74,116,062 $40.06 4Wisconsin $30,900,969 $13,463,832 $22,860,706 $13,812,641 $85,225,434 $14.80 49Wyoming $6,735,601 $483,341 $1,911,958 $974,362 $11,305,762 $19.35 40U.S. TOTAL $3,306,628,994 $713,368,913 $1,144,429,177 $2,247,451,492 $7,593,843,938 $23.44 N/A**D.C. was not included in the per capita rankings because total funding for D.C. includes funds for a number of national organizations. **The US total reflects HRSA grants to all states and D.C. [Source: HRSA. For a detailed list of references, see Investing in America’s Health at www.healthyamericans.org]
FEDERAL FUNDING FOR STATES FROM THE HEALTH RESOURCES AND SERVICES ADMINISTRATIONThe Health Resources and Services Administration (HRSA) distributes approximately 90 percent of its funding in grants to states and territories, public and private healthcare providers, health professions training programs and other organizations.6 HRSA’s funding is not distributed on a strictly per capita basis.
The bulk of HRSA funds are in its two largest programs, the community and migrant health centers and the Ryan White Act HIV programs, and these dollars are awarded on a competitive basis and/or based on disease burden.
11 TFAH • healthyamericans.org
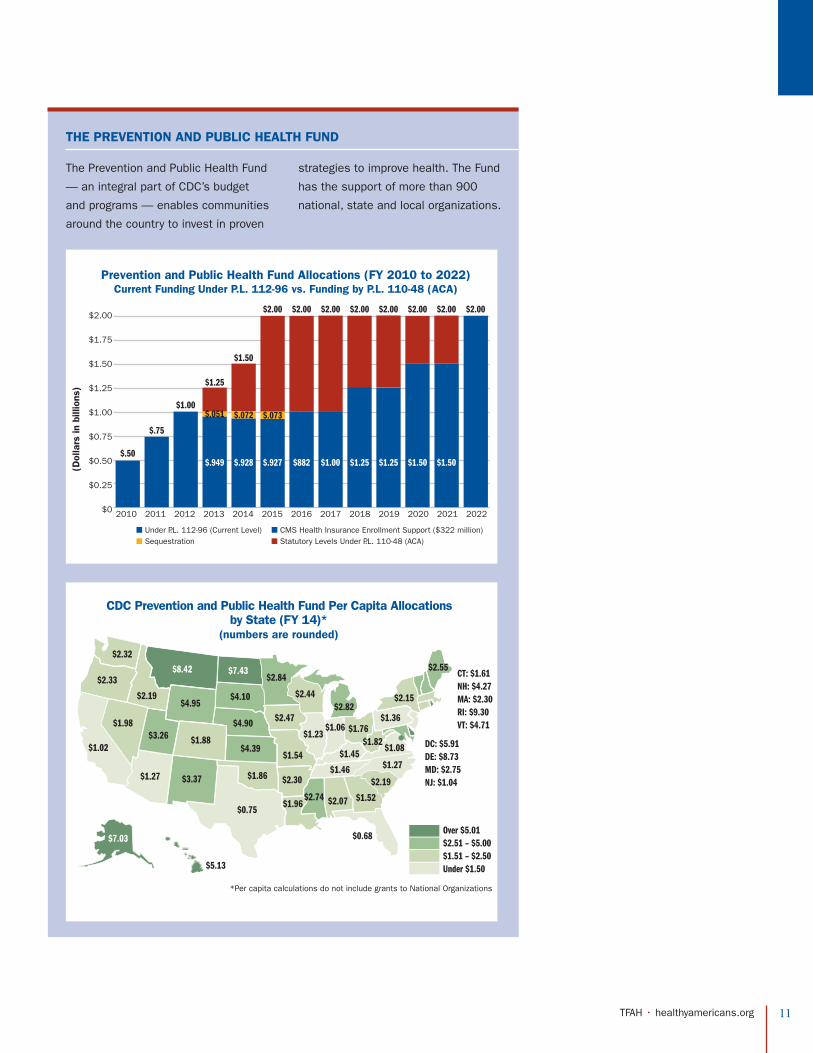
THE PREVENTION AND PUBLIC HEALTH FUND
The Prevention and Public Health Fund
— an integral part of CDC’s budget
and programs — enables communities
around the country to invest in proven
strategies to improve health. The Fund
has the support of more than 900
national, state and local organizations.
$2.00
$1.75
$1.50
$1.25
$1.00
$0.75
$0.50
$0.25
$0 2010 2011 2012 2013 2014 2015 2016 2017 2018 2019 2020 2021 2022
■ Under P.L. 112-96 (Current Level) ■ CMS Health Insurance Enrollment Support ($322 million)■ Sequestration ■ Statutory Levels Under P.L. 110-48 (ACA)
Prevention and Public Health Fund Allocations (FY 2010 to 2022)Current Funding Under P.L. 112-96 vs. Funding by P.L. 110-48 (ACA)
(Dol
lars
in b
illio
ns)
$1.50$1.25$1.25$882$.927
$.073
$.949
$.051
$1.25
$1.00
$.50
$.75
$.928
$.072
$1.50
$2.00
$1.50
$2.00$2.00$2.00$2.00$2.00 $2.00$2.00
$1.00
*Per capita calculations do not include grants to National Organizations
CDC Prevention and Public Health Fund Per Capita Allocations by State (FY 14)*
(numbers are rounded)
$2.32
$2.33
$1.02
$1.98
$2.19
$8.42
$4.95
$3.26
$1.27 $3.37
$0.75
$1.86
$1.88$4.39
$4.90
$4.10
$7.43$2.84
$2.47
$1.54
$2.30
$1.96$2.74 $2.07 $1.52
$2.19$1.46
$1.45
$1.23
$2.44$2.82
$1.06 $1.76$1.82
$1.08
$1.27
$1.36
$2.15
$2.55CT: $1.61NH: $4.27MA: $2.30RI: $9.30VT: $4.71
DC: $5.91DE: $8.73MD: $2.75NJ: $1.04
Over $5.01$2.51 – $5.00$1.51 – $2.50Under $1.50
$0.68
$5.13
$7.03

12 TFAH • healthyamericans.org
PREVENTION FUND: SNAPSHOT OF SOME KEY PROGRAMS
Preventive Health and Health Services Block Grantl Provides every state with flexible support to address what
they determine to be their most important health needs.
l Block grant funds have doubled from $80 million in fiscal year 2013 to $160 million in fiscal years 2014 and 2015 under the Prevention Fund.
Tips from Former Smokers Campaignl Evidence-based tobacco education campaign — has helped 1.6
million Americans attempt to quit and 100,000 to successfully quit immediately. It has led to a 12 percent increase in quit attempts and prevented more than 17,000 premature deaths.
l ROI: $480 spent per quitter with a $2,800 return in premature death averted.
Childhood Immunization Grant Program (Section 317)l $210 million of funding from Prevention Fund provides support for
children to receive all recommended vaccinations on schedule.
l Supports registries, surveillance, outreach and vaccine services.
National Breast and Cervical Cancer Early Detection Program l $104 million from the Fund to help provide support in all 50
states to support screening for uninsured or underinsured women and help provide follow-up services as needed.
State Public Health Actions to Prevent and Control Diabetes, Heart Disease, Obesity and Related Risk Factors and Promote School Health (“1305” awards)l Provides $33 million in funds to enhance key chronic disease
prevention programs in states.
l Supports cross-cutting approaches to prevent risk factors that contribute to chronic diseases.
State and Local Public Health Actions to Prevent Obesity, Diabetes, and Heart Disease and Stroke (1422 awards)l Four-year project to create community strategies to promote
health and integrate with health care systems.
l $69.5 million given to 17 states and four large cities.
State Healthcare-Associated Infection (HAI) Prevention Programl $12 million from Fund supports coordination between public
health and healthcare systems to reduce HAIs — helping to identify problem areas and improve prevention efforts.
Epidemiology and Laboratory Capacity (ELC) Grantsl $40 million from Fund supports improving a state’s ability to
detect, diagnose and contain disease outbreaks.
l Supports 460 full- and part-time highly expert jobs, and mod-ern scientific equipment.
Million Hearts Campaignl $4 million from Fund supports national initiative aimed at pre-
venting 1 million heart attacks and strokes by 2017.
Workplace Wellnessl $10 million from Fund providing support to help employers
implement practice-based strategies to support health in the workplace and surrounding communities to lead to measurable health improvements.
Fall Prevention Grantsl $5 million from Fund aimed at evidence-based community
programs to reduce falls, the leading cause of fatal and non-fatal injuries in seniors.
l Awards to 14 states and localities.
Garrett Lee Smith Youth Suicide Prevention Grantsl $12 million to expand program to 12 additional grantees for
education, training, screening, hotlines and support services to prevent youth suicides.
Racial and Ethnic Approaches to Community Health (REACH)l $30 million from Fund — $50.05 million total — supports
39 grants for culturally-tailored, evidence-based strategies to reduce health disparities at the community level.
Good Health and Wellness in Indian Countryl $11 million from Fund for 22 grants to prevent and manage
heart disease, diabetes and associated risk factors in Ameri-can Indian tribes and Alaskan Native villages.
13 TFAH • healthyamericans.org
State Public Health BudgetsState Nominal FY 2013-2014
(Not Adjusted for Inflation)FY 2013-2014 Per
Capita Rank
Hawaii $219,042,777 $156.01 1New York $2,144,180,554 $109.11 2Alaska $77,613,600 $105.58 3District of Columbia $67,202,000 $103.96 4Idaho $143,890,100 $89.25 5California $2,484,860,000 $64.82 6North Dakota $46,001,508 $63.59 7West Virginia $111,761,920 $60.27 8Alabama $286,261,887 $59.22 9Massachusetts $376,797,663 $56.30 10Wyoming $31,693,243 $54.39 11Rhode Island $53,281,186 $50.67 12New Mexico $100,120,700 $48.01 13Arkansas $141,876,132 $47.94 14Tennessee $285,610,100 $43.97 15Oklahoma $168,215,000 $43.69 16Delaware $39,703,400 $42.89 17Colorado $223,789,365 $42.48 18Nebraska $74,670,172 $39.96 19Vermont $24,657,900 $39.35 20Washington $262,623,500 $37.67 21Maryland $215,592,000 $36.36 22Virginia $290,405,109 $35.16 23Kentucky $142,051,439 $32.32 24South Dakota $26,291,465 $31.12 25
MEDIAN $31.06Connecticut $111,695,871 $31.06 26Utah $85,514,900 $29.48 27New Jersey $230,549,000 $25.91 28Illinois $308,700,900 $23.96 29Texas $589,908,925 $22.30 30Montana $22,495,177 $22.16 31Michigan $212,403,700 $21.46 32Maine $27,469,065 $20.68 33South Carolina $98,131,352 $20.55 34Florida $376,397,399 $19.25 35Iowa $58,263,068 $18.85 36Georgia $184,693,477 $18.48 37New Hampshire $21,579,046 $16.31 38Oregon $62,720,932 $15.96 39Louisiana $71,532,451 $15.46 40Pennsylvania $193,901,000 $15.18 41Ohio $168,783,566 $14.59 42Minnesota $77,344,000 $14.27 43Indiana $85,946,625 $13.08 44Wisconsin $74,823,300 $13.03 45Kansas $36,179,733 $12.50 46Mississippi $36,739,194 $12.28 47North Carolina $115,532,335 $11.73 48Arizona $55,640,800 $8.40 49Missouri $34,248,229 $5.67 50Nevada $10,005,244 $3.59 51
B. STATE INVESTMENT IN PUBLIC HEALTH
[Source: TFAH analysis. For a detailed methodology, see Investing in America’s Health at www.healthyamericans.org]

14 TFAH • healthyamericans.org
Every state allocates and reports its budget in different ways. States also vary widely in the budget details they provide. This makes comparisons across states difficult. For this analysis, TFAH examined state budgets and appropriations bills for the agency, department, or division in charge of public health services for FY 2012-13 and FY 2013-14, using a definition as consistent as possible across the two years, based on how each state reports data. TFAH defined “public health services” broadly, including most state-level health funding.
State funding ranges dramatically, often related to the different structures of a state’s public health department. Some departments are centralized, while others are decentralized wherein responsibilities rest more on local departments than at the state level. However, states and localities also place different priorities on public health, which also accounts for differences in funding. The state-by-state comparisons included in this report’s budget analysis do not include county or city revenues that are generated to support local health departments, which are also quite variable.
C. LOCAL INVESTMENT IN PUBLIC HEALTH There are approximately 2,800 local health departments in the United States serving a diverse assortment of populations ranging from less than 1,000 residents in some rural jurisdictions to around eight million people, as in the case of the New York City Department of Health.7 Local health departments (LHDs) are structured differently in each state and may be centralized, decentralized or have a mixed function. Therefore, the level of responsibility and services provided by LHDs varies dramatically,
and, correspondingly, the way resources are determined and allocated differs significantly. A 2008 study found that median local public health spending was $29.57 per capita in 2005, while funding ranged from an average of $8 per person in the lowest 20 percent of communities to nearly $102 per person in the top 20 percent of communities.8 A July 2011 study in Health Affairs found that increased spending by local public health departments can save lives currently lost to preventable illnesses.9

Key Health Facts
SEC
TIO
N 2: K
EY H
EA
LTH
FAC
TS
SECTION 2:
Key Health Facts
AP
RIL
2015
ADULT HEALTH INDICATORS U.S. Total State with Highest/Worst
State with Lowest/Best
% Uninsured, All Ages (2013) 14.5% Texas (22.1%) Massachusetts (3.7%)
AIDS Cumulative Cases Aged 13 and Older (2012 Yr End) 1,161,609 New York
(199,548)North Dakota
(187)
Alzheimer’s Estimated Cases among 65+ (2025) 6,479,700 California (660,000) Alaska (7,700)
% Asthma Prevalence (2010) 13.5% Hawaii (17.6%) Tennessee (9.3%)
Cancer Estimated New Cases (2014) 1,665,540 California (171,730) D.C. (2,840)
Chlamydia Rates per 100,000 Population (201) 446.6 D.C. (1,014.4) New Hampshire (236.2)
Diabetes, % Adults (2013) N/A Alabama (13.8%)
Colorado (6.5%)
Fruits and Vegetables Intake, % who consume fruit and vegetables 5+ times daily (2011) N/A West Virginia
(7.9%) D.C. (25.6%)
Human West Nile Virus Cases (as of 12/16/14) 2,085 California (780)AK, DE, HI, ME, NH, NC, RI, VT,
WV (0)
Hypertension, % Adults (2013) N/A West Virginia (41.0%) Utah (24.2%)
Obesity, % Adults (2013) N/A MS and WV (35.1%)
Colorado (21.3%)
Physical Inactivity, % Adults (2013) N/A Mississippi (38.1%)
Colorado (17.9%)
% Pneumococcal Vaccination Rates 65 and Over (2013) 69.5% New Jersey
(61.9%) Oregon (75.6%)
% Seasonal Flu Vaccination Rates 65 and Over (2013) 65.0% Nevada (53.6%) West Virginia (75.4%)
Syphilis Rates per 100,000 Population (2013) 5.5 D.C. (26.6) Wyoming (0.2)
% Tobacco Use – Current Smokers (2013) 19.0% West Virginia (27.3%) Utah (10.3%)
Tuberculosis Number of Cases (2013) 9,582 California (2,171) Wyoming (0)
CHILD HEALTH INDICATORS
% Uninsured, under 18 (2013) 7.1% Nevada (14.9%) Massachusetts (1.5%)
AIDS Cumulative Cases Under Age 13 (2012 Yr End) 9,377 New York (2,431) ND and WY (2)
% Asthma – High School Students (2012) N/A Hawaii (30.1%) Nebraska (16.9%)
Fruit Indicator - % High School Students (2013) N/A Alabama (24.0%) Utah (34.3%)
High School Dropout Rate (2011-2012) 3.3% Alaska (7.0%)New
Hampshire (1.3%)
Immunization Gap, % Children Aged 19-35 Months Without All Immunizations (2013) 27.4% Arkansas
(39.4%)Rhode Island
(15.5%)
Infant Mortality – Per 1,000 Live Births (2010 Final Data) 6.2 Mississippi
(9.7) Alaska (3.8)
% Low Birthweight Babies (2013 Final Data) 8.0% Mississippi (11.5%) Alaska (5.8%)
Obesity, % High School Students (2013) N/A Kentucky (18.0%) Utah (6.4%)
Obesity, % 10 to 17 Year Olds (2011) N/A Mississippi (21.7%) Oregon (9.9%)
Pre-Term Births % of lie births (2013 Final Data) 11.4% Mississippi (16.6%) Vermont (8.1%)
Tobacco: % Current Smokers High School Students (2013) N/A West Virginia
(19.6%) Utah (4.4%)
Vegetable Indicator - % High School Students (2013) N/A South Carolina (9.7%)
New Mexico (17.5%)
Source: CDC. For a detailed list of references, see Investing in America’s Health at www.healthyamericans.org

Recommendations
SEC
TIO
N 3: R
EC
OM
ME
ND
AT
ION
S
SECTION 3:
AP
RIL
2015
RecommendationsAmerica’s future economic well-being is inextricably tied to our health. High rates of preventable diseases are one of the biggest drivers of healthcare costs in the country. And, right now, Americans are not as healthy and productive as they could or should be to compete in the global economy.
The nation’s public health system is responsible for keeping Americans healthy and safe. Public health is devoted to preventing disease and injury. If we kept Americans healthier, we could significantly drive down trips to the doctor’s office or emergency room, reduce healthcare costs and improve productivity.
In addition to shoring up the core ongoing funds for public health, we need to ensure the Prevention and
Public Health Fund is used to build upon — and expand not supplant — existing efforts. The Prevention Fund is the nation’s largest single investment in prevention, using evidence-based and innovative partnership approaches to improve the health of Americans. Without a strong investment in prevention, we will never advance in the fight to prevent diseases, curb the obesity epidemic or reduce smoking rates.

17 TFAH • healthyamericans.org
TFAH recommends that:l Core funding for public health — at
the federal, state and local levels — be increased.
l The first dollars of core funding should be used to assure that all Americans are protected by a set of foundational public health capabilities and services no matter where they live. For this to be accomplished, these capabilities must be fully funded, and funding should be tied to achieving and maintaining these capabilities.
l Funding be considered strategically — so funds are used efficiently to maximize effectiveness in lowering disease rates and improving health.
l The Prevention Fund should be fully allocated to support evidence-based and innovative approaches to improve the public health system and reduce disease rates.
l Stable, sufficient, dedicated funding is needed to support public health emergencies and major disease outbreaks — so the country is not caught unprepared for threats ranging from Ebola to an act of bioterror — and is better equipped to reduce ongoing threats such as the flu, foodborne illness and the measles. Currently, inadequate and fluctuating resources have left gaps in the ability to quickly detect, diagnose, treat and contain the spread of illnesses.
l Accountability must be at the cornerstone of public health funding. Americans deserve to know how effectively their tax dollars are used, and the government’s use of funds should be transparent and clearly communicated with the public.
18 TFAH • healthyamericans.org
1 Institute of Medicine. The Future of the Public’s Health in the 21st Century. Wash-ington, D.C, 2003. U.S. Centers for Disease Control and Prevention. Public Health’s Infrastructure — A Status Report. Atlanta, Georgia, 2001. Trust for America’s Health. Blueprint for a Healthier America: Modernizing the Federal Public Health System to Focus on Pre-vention and Preparedness. 2008.
2 Mays, G. “National Public Health Spend-ing: Still Waiting for Recovery.” In Public Health Economics. January 6, 2015. http://publichealtheconomics.org/2015/01/06/national-public-health-spending-still-wait-ing-for-recovery/ (accessed March 2015).
3 Adjusted for inflation.
4 Institute of Medicine. For the Public’s Health: Investing in a Healthier Future. Washington, D.C.: National Academies Press, April 2012.
5 RESOLVE. Transforming Public Health: Emerging Concepts for Decision Making in a Changing Public Health World. 2012.
6 Health Resources and Services Administra-tion. “About HRSA.” U.S. Department of Health and Human Services. http://www.hrsa.gov/about/default.htm. (accessed January 23, 2008).
7 Meyer J. and Weiselberg L. “County and City Health Departments: The Need for Sus-tainable Funding and the Potential Effect of Healthcare Reform on their Operations.” Health Management Associates, A Report for the Robert Wood Johnson Foundation and the National Association of County & City Health Officials. December 2009.
8 Mays GP and Smith SA. “Geographic Vari-ation in Public Health Spending,” 2009.
9 Mays GP and Smith SA. Evidence Links Increases in Public Health Spending to De-clines in Preventable Deaths. Health Affairs, 30(8): 1585-1593, 2011.
Endnotes

19 TFAH • healthyamericans.org

1730 M Street, NW, Suite 900Washington, DC 20036
(t) 202-223-9870(f) 202-223-9871