a presentation by dr. colin novak nvh-sq group university ... s2014/lecture 20 2014 92-455.pdf · a...
TRANSCRIPT

Introduction to Psychoacoustics and its Metrics
A presentation by Dr. Colin Novak – NVH-SQ Group
University of Windsor
Noise, Vibration, Harshness –Sound Quality Research Group
Copyright 2014 by Colin Novak. All rights reserved no part of this publication may be reproduced or distributed in any form or by any means, or stored in a data
base or retrieval, without the prior written permission of the author.
Copyright ©2014, Colin Novak

OUTLINE
2
Noise, Vibration, Harshness – Sound Quality Research Group
• What is Sound Quality?
• Why improve the Quality of Sound?
• Noise vs. Sound
• Sound Quality Metrics
• Jury Testing or Subjective Tests
• Sound Quality Analysis Process
Lecture 20

Sound Quality
3
Noise, Vibration, Harshness – Sound Quality Research Group
I like the
colour
200 HP!
It sounds
cool!
Lecture 20

Noise vs Sound
4
Noise, Vibration, Harshness – Sound Quality Research Group
Noise
Measured:
to avoid hearing damage
to fulfill regulations
Measured as:
dBA
Sound Power
Sound
Perceived as:
pleasant sound
unpleasant sound
informative sound
Measured as:
“Sound Quality”
it sounds
bad
Power: 0.01 Watt
Lp = 88.5 dBA
LW = 100 dBA
Lecture 20

Why Improve Sound Quality
5
Noise, Vibration, Harshness – Sound Quality Research Group
L = 63 dBA L = 63 dBA
Good Sound Quality signals proper operation of the product
Sound Quality is a parameter that sells the product
A-weighted noise levels and sound power are fine to characterize noise, but useless for sound
Sound Quality is not static, but changes over time like fashion
L = 63 dBA
Lecture 20

Click to Play
Example
Sound Quality Example
6
Noise, Vibration, Harshness – Sound Quality Research Group
You will hear 5 refrigerator signals, all presented at the same time-averaged A-weighted sound pressure level.
Question: Would you find all of these refrigerator sounds equally desirable in your kitchen?
Lecture 20
Sound Quality Example
7
Noise, Vibration, Harshness – Sound Quality Research Group
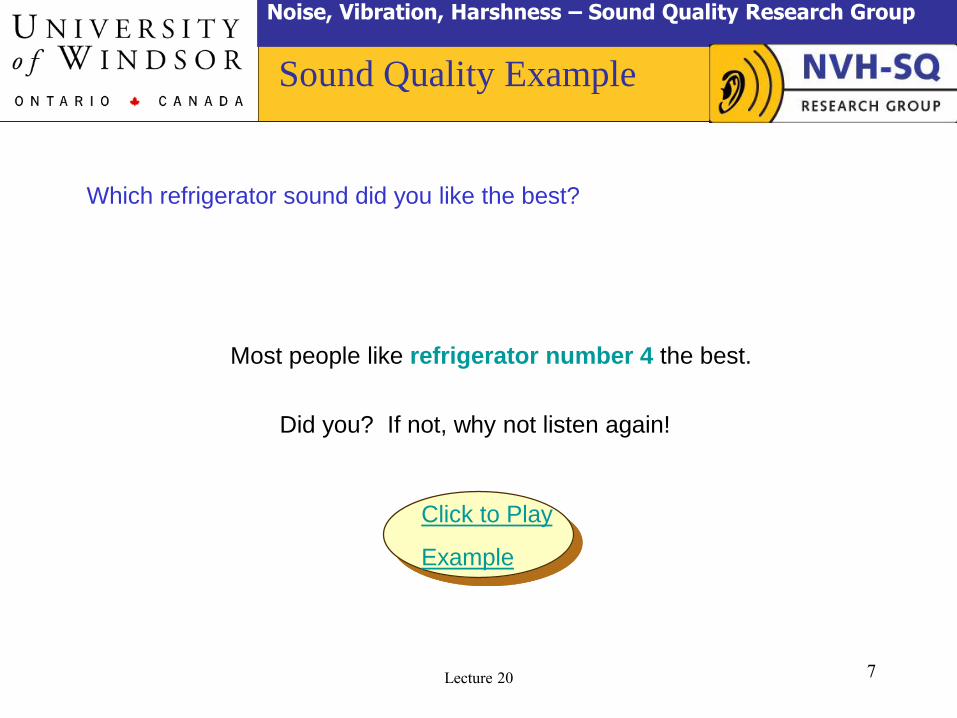
Which refrigerator sound did you like the best?
Most people like refrigerator number 4 the best.
Did you? If not, why not listen again!
Click to Play
Example
Lecture 20

Sound Quality Example
8
Noise, Vibration, Harshness – Sound Quality Research Group
Using traditional SPL measurements for these signals, you can’t really see much relationship to your preferences.
SPL in dB(A) for Each Refrigerator
20
25
30
35
40
1 2 3 4 5
Refrigerator Number
SP
L in
d
B(A
)
Unweighted SPL for Each Refrigerator
20
25
30
35
40
45
50
55
60
1 2 3 4 5
Refrigerator Number
SP
L in
d
B
Lecture 20

Sound Quality Example
9
Noise, Vibration, Harshness – Sound Quality Research Group
Using Sound Quality metrics, it IS possible to measure differences in these signals which relate to your preferences! Here are just 4 such measures:
Max. Total Loudness
0
1
2
3
1 2 3 4 5
Refrigerator Number
Lo
ud
ness i
n s
on
es
Mean Total Loudness
0
1
2
3
1 2 3 4 5
Refrigerator Number
Lo
ud
ness i
n s
on
es
Percentile (N1) Instantaneous Loudness
0
1
2
3
1 2 3 4 5
Refrigerator Number
Lo
ud
ness i
n s
on
es
Refrigerator Number
Mean Zwicker Sharpness
0
1
2
3
1 2 3 4 5
Sh
arp
nes
s in
a
cu
m
Lecture 20
What is Sound Quality?
10
Noise, Vibration, Harshness – Sound Quality Research Group
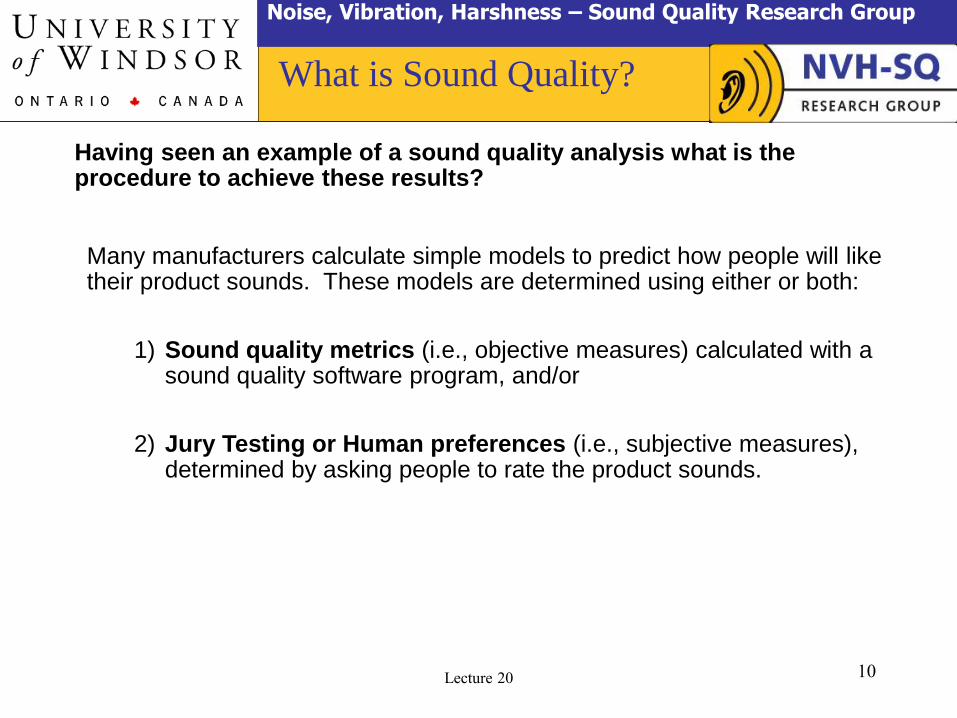
Having seen an example of a sound quality analysis what is the procedure to achieve these results?
Many manufacturers calculate simple models to predict how people will like their product sounds. These models are determined using either or both:
1) Sound quality metrics (i.e., objective measures) calculated with a sound quality software program, and/or
2) Jury Testing or Human preferences (i.e., subjective measures), determined by asking people to rate the product sounds.
Lecture 20

Sound Quality Metrics
11
Noise, Vibration, Harshness – Sound Quality Research Group
“Zwicker Loudness”
Loudness is a measure of how “strong” a sound is to humans. That is, it
is a way of measuring a sound that corresponds to the subjective
perception of humans. This is very different than sound pressure, sound
intensity or sound power, which are physical quantities (remember the
refrigerator demo).
There are several methods or algorithms for determining loudness. The
Zwicker loudness method has been shown to have the highest
correlation to human perceived loudness. Zwicker loudness is a very
sophisticated algorithm and is used by most sound quality programs.
Lecture 20
Sound Quality Metrics
12
Noise, Vibration, Harshness – Sound Quality Research Group
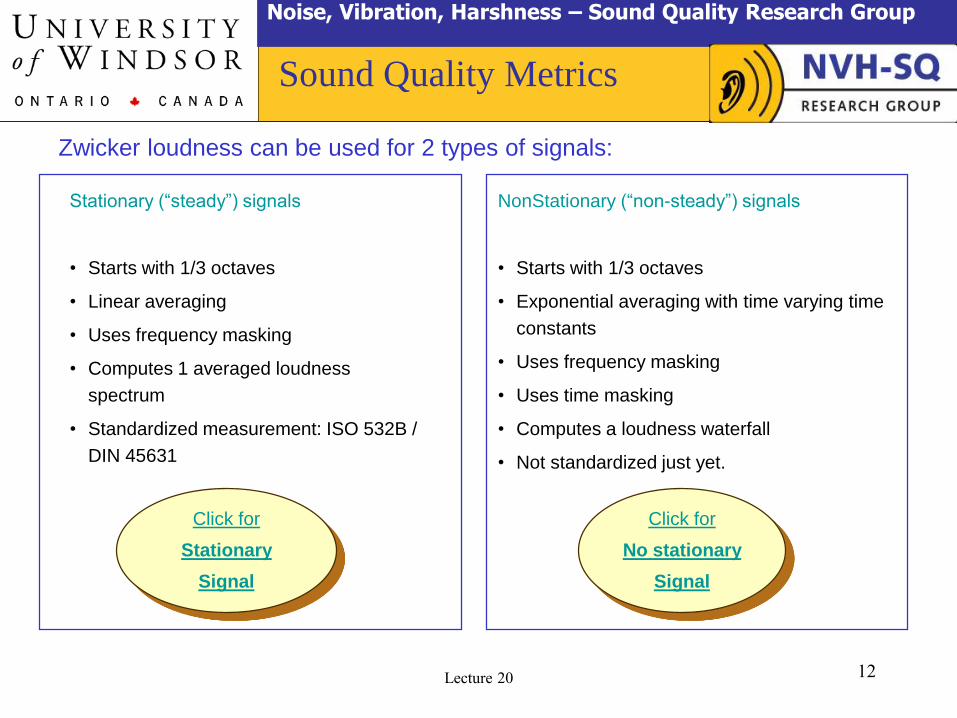
Zwicker loudness can be used for 2 types of signals:
Stationary (“steady”) signals
• Starts with 1/3 octaves
• Linear averaging
• Uses frequency masking
• Computes 1 averaged loudness
spectrum
• Standardized measurement: ISO 532B /
DIN 45631
NonStationary (“non-steady”) signals
• Starts with 1/3 octaves
• Exponential averaging with time varying time
constants
• Uses frequency masking
• Uses time masking
• Computes a loudness waterfall
• Not standardized just yet.
Click for
Stationary
Signal
Click for
No stationary
Signal
Lecture 20

Sound Quality Metrics
13
Noise, Vibration, Harshness – Sound Quality Research Group
Typical stationary Zwicker loudness spectrum (ISO 532B):Curved line representsfrequency masking
Zwicker loudness is the
area under the curve.
(about 45 sones)
SpecificLoudnessaxis
Lecture 20

Sound Quality Metrics
14
Noise, Vibration, Harshness – Sound Quality Research Group
Typical Zwicker loudness waterfall plot of a nonstationary signal (a bell ringing after one hit): You get many loudness spectra, each spaced 2 msec apart!
Loudness non stationary spectrum
Original Signal
2 4 6 8 10 12 14 16 18 20 22 24
0
4
500m
1
1.5
2
2.5
3
3.5
[Bark]
[sone/Bark]
[s]
Loudness non stationary spectrum
Original Signal
2 4 6 8 10 12 14 16 18 20 22 24
0
4
500m
1
1.5
2
2.5
3
3.5
[Bark]
[sone/Bark]
[s]
Time
Lecture 20

Sound Quality Metrics
15
Noise, Vibration, Harshness – Sound Quality Research Group
Pleasantness
Annoyance
Tone-to-Noise Ratio
Prominence Ratio
Tonality, Pitch Strength
Speech Interference Levels (SIL)
Intelligibility, Articulation Index (AI)
Speech Transmission Index (STI)
Kurtosis
User Defined Metrics
etc.
Lecture 20

Jury Testing
16
Noise, Vibration, Harshness – Sound Quality Research Group
Recording Analysis and Editing Playback
section section section
Lecture 20

Jury Testing
17
Noise, Vibration, Harshness – Sound Quality Research Group
1. Original sound
2. Edited sound
3. Competitor’s
sounds
1 Play 2Subjective
Tests
Lecture 20
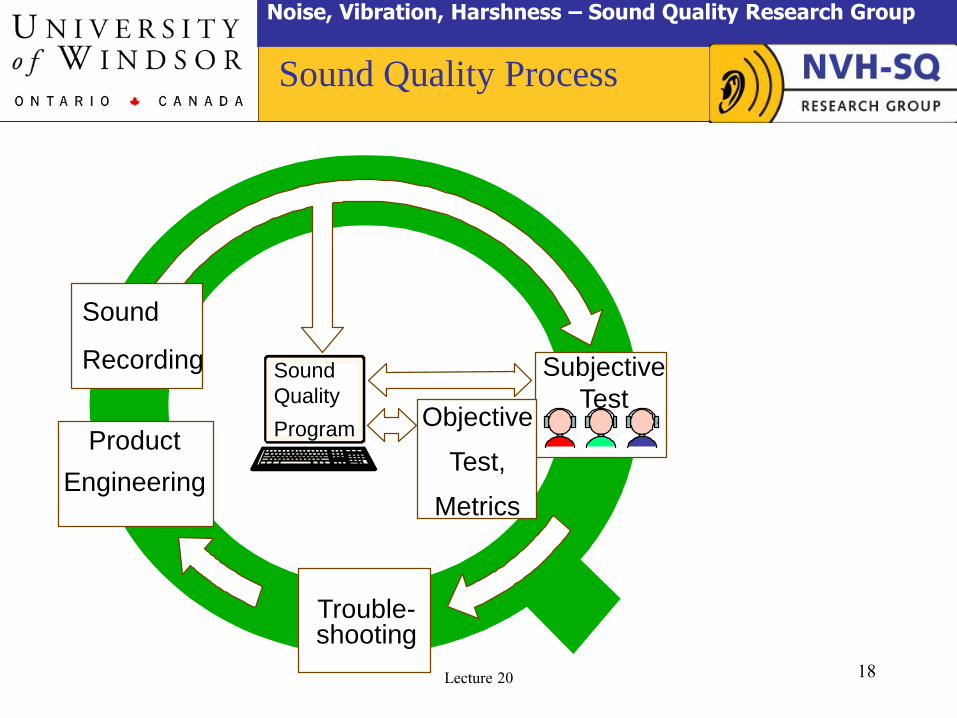
Objective
Test,
Metrics
Sound
Recording Subjective
Test
Product
Engineering
Trouble-shooting
Sound Quality Process
18
Noise, Vibration, Harshness – Sound Quality Research Group
Sound
Quality
Program
Lecture 20

Sound Quality Process
19
Noise, Vibration, Harshness – Sound Quality Research Group
What is Sound Quality?
Why improve the Quality of Sound?
Noise vs. Sound
Sound Quality Metrics
Jury Testing or Subjective Tests
Sound Quality Analysis Process
Lecture 20