sae 2007 sb nvh workshop web...1 sae sb nvh sae 2005 nvh conference structure borne nvh workshop...
TRANSCRIPT

1SAE SB NVH
www.AutoAnalytics.com
SAE 2005 NVH ConferenceStructure Borne NVH Workshop
Presenters:
Alan DuncanAlan Duncan Material Sciences Corp.
Greg Greg GoetchiusGoetchius Material Sciences Corp.
SachinSachin GogateGogate DaimlerChrysler Corp.
Greg Greg HoptonHopton LMS North America

2SAE SB NVH
www.AutoAnalytics.com
Structure Borne NVH Outline• Introduction• Ride Balance in the Ride Range• NVH Load Conditions• Low Frequency Basics• Live Noise Attenuation Demo• Mid Frequency Basics• Utilization of the NVH Toolbox• Closing Remarks

3SAE SB NVH
www.AutoAnalytics.com
The Fundamental Secret ofStructure Borne
NVH Performance
The Fundamental Secret ofStructure Borne
NVH Performance
Revealed here today !
1st Corollary

4SAE SB NVH
www.AutoAnalytics.com
Primary References (Workshop Basis: 4 Papers)
1. A. E. Duncan, et. al., “Understanding NVH Basics”, IBEC, 1996
2. A. E. Duncan, et. al., “MSC/NVH_Manager Helps Chrysler Make Quieter Vibration-free Vehicles”, Chrysler PR Article, March 1998.
3. B. Dong, et. al., “Process to Achieve NVH Goals: Subsystem Targets via ‘Digital Prototype’ Simulations”, SAE 1999-01-1692, NVH Conference Proceedings, May 1999.
4. S. D. Gogate, et. al., “’Digital Prototype’ Simulations to Achieve Vehicle Level NVH Targets in the Presence of Uncertainties’”,
SAE 2001-01-1529, NVH Conference Proceedings, May 2001
Structure Borne NVH References
WS + Refs. at www.AutoAnalytics.com/papers.html
Structure Borne NVH Workshop - on InternetAt SAE www.sae.org/events/nvc/specialevents.htm

5SAE SB NVH
www.AutoAnalytics.com
Supplemental Reference Recommendations
5. T.D. Gillespie, Fundamentals of Vehicle Dynamics, SAE 1992(Also see SAE Video Lectures Series, same topic and author)
6. D. E. Cole, Elementary Vehicle Dynamics, Dept. of Mechanical Engineering, University of Michigan, Ann Arbor, Michigan, Sept. 1972
7. J. Y. Wong, Theory of Ground Vehicles, John Wiley & Sons, New York, 1978
8. N. Takata, et.al. (1986), “An Analysis of Ride Harshness” Int. Journal of Vehicle Design, Special Issue on Vehicle Safety, pp. 291-303.
9. T. Ushijima, et.al. “Objective Harshness Evaluation” SAE Paper No. 951374, (1995).
Structure Borne NVH References

6SAE SB NVH
www.AutoAnalytics.com
Structure Borne NVH Outline• Introduction
• Ride Balance in the Ride Range
• NVH Load Conditions
• Low Frequency Basics

7SAE SB NVH
www.AutoAnalytics.com
Rideand
Handling
NVH Durability
ImpactCrashWorthiness
Competing Vehicle Design Disciplines

8SAE SB NVH
www.AutoAnalytics.com
Structure Borne NoiseAirborne Noise
Res
pons
e
Log Frequency
“Low”Global Stiffness
“Mid”
Local Stiffness+
Damping“High”
Absorption+
Mass+
Sealing
~ 150 Hz ~ 1000 Hz ~ 10,000 Hz
Automotive NVH Frequency Range

9SAE SB NVH
www.AutoAnalytics.com
Structure Borne NVH Outline• Introduction
• Ride Balance in the Ride Range
• NVH Load Conditions
• Low Frequency Basics

10SAE SB NVH
www.AutoAnalytics.com
Study of Ride Balance
• Demonstrate the First Order Vehicle Modes
• Demonstrate Transient Response in Time Domain
• Derive Transition into the Frequency Domain

11SAE SB NVH
www.AutoAnalytics.com
Ride Balance StudyVehicle Traversing a Bump
Impact at Front Suspension Followed by Impact at Rear Suspension
Response at Rear
Rear Suspension is in-phase with FrontAfter one cycle of ride motion, thusminimizing pitch motion.
Response at Front
See Ref. 5, Gillespie

12SAE SB NVH
www.AutoAnalytics.com
Total 2178.2 Kg (4800LBS)Mass Sprung 1996.7 Kg
Unsprung 181.5 Kg (8.33% of Total)Powertrain 181.5 Kg
Tires 350.3 N/mmKF 43.8 N/mmKR 63.1 N /mmBeam mass lumped on grids like a beam M2,3,4 =2 * M1,5
31
8
2
6
4
7
5
NVH Model of Unibody Passenger CarSymbolic Outline
From Reference 6

13SAE SB NVH
www.AutoAnalytics.com
Excitation Bum p Profile
0.0
5.0
10.0
15.0
20.0
0 100 200 300 400 500
Distance (mm)
Pro
file
Hei
ght
(mm
) Profile
On to 100,380

14SAE SB NVH
www.AutoAnalytics.com
Pitch at Mid-Car DOF3
-1.0E-04
-8.0E-05
-6.0E-05
-4.0E-05
-2.0E-05
0.0E+00
2.0E-05
4.0E-05
6.0E-05
8.0E-05
1.0E-04
0 1 2 3Time (sec.)
Ro
tati
on
- R
adia
ns Base Model

15SAE SB NVH
www.AutoAnalytics.com
Pitch Response - Baseline Model
1.E-08
1.E-07
1.E-06
1.E-05
1.E-04
0.0 5.0 10.0 15.0 20.0Frequency Hz
Ro
tati
on
Rad
ian
s
Base Model

16SAE SB NVH
www.AutoAnalytics.com
X ( f ) = Fourier Transform of X ( t ){X ( f ) } = [ H ( f ) ] ∗∗∗∗ { F ( f ) }{
Fourier transformof the input forces,vector of all inputpossibilities
Fourier transformof the outputfor unit input forcessystem OUT / IN FRF(Known Load = Unity)
Spring Analogy ( C = 1 / K ) X = C * F
{
CaveatCaveat X ( t ) must be PeriodicLinear System 5 sec
F(t) is Periodic

17SAE SB NVH
www.AutoAnalytics.com
FFT of the Input Bump
1.E-06
1.E-05
1.E-04
1.E-03
1.E-02
1.E-01
0.E+00 4.E-03 8.E-03 1.E-02 2.E-02 2.E-02
Cycles / mm
Ampl
itude
mm
Bump FFT
Transform Input Force to F(f)
20 Hz @ 45 MPH

18SAE SB NVH
www.AutoAnalytics.com
FFT of the Input Bump
1.E-06
1.E-05
1.E-04
1.E-03
1.E-02
1.E-01
0.E+00 4.E-03 8.E-03 1.E-02 2.E-02 2.E-02
Cycles / mm
Ampl
itude
mm
Bump FFT
Transform Input Force to F(f)
20 Hz @ 45 MPH
0.0 20.0 Hz
Amplitude is ApproximatelyConstant over theFrequency Range
Constant Displacement

19SAE SB NVH
www.AutoAnalytics.com
P itch a t M id -C ar D O F 3
1 .0 E-0 8
1 .0 E-0 7
1 .0 E-0 6
1 .0 E-0 5
1 .0 E-0 4
0 5 1 0 1 5 2 0F req u en cy H z
Ro
tati
on
Rad
ian
s Tim e D om a in F F T
F F T o f Inpu t
20SAE SB NVH
www.AutoAnalytics.com
Ride Balance Study Summary
• Demonstrated the Fundamental Bounce and Pitch Modes in the Ride Range
• Demonstrated Transient Response in Time Domain then Obtained the FRF
• Derived Direct Computation of FRF in the Frequency Domain

21SAE SB NVH
www.AutoAnalytics.com
Structure Borne NVH Outline• Introduction
• Ride Balance in the Ride Range
• NVH Load Conditions
• Low Frequency Basics

22SAE SB NVH
www.AutoAnalytics.com
Two Main Sources
Noise and Vibration Sources
Suspension Powertrain

23SAE SB NVH
www.AutoAnalytics.com
Typical NVH Pathways to the Passenger
PATHS FOR
STRUCTURE BORNE
NVH

24SAE SB NVH
www.AutoAnalytics.com

25SAE SB NVH
www.AutoAnalytics.com
Structure Borne NVH Outline• Introduction
• Ride Balance in the Ride Range
• NVH Load Conditions
• Low Frequency BasicsNew: Harshness Discussion

26SAE SB NVH
www.AutoAnalytics.com
StructureBorneN (Noise)V (Vibration)H (Harshness)

27SAE SB NVH
www.AutoAnalytics.com
Harshness Definition
Excitation:Transient event transmitted through the tires due to
road irregularities such as tar strip impacts or similar discrete inputs.
Response:An unpleasant ride experience characterized by:1) A short duration For/Aft tactile spike (Shock)2) A short duration Noise spike (Impact Boom)3) Extended post-event oscillatory vibration
(After Shake)4) A combination of the above ! ! ! ! ! ! !

28SAE SB NVH
www.AutoAnalytics.com
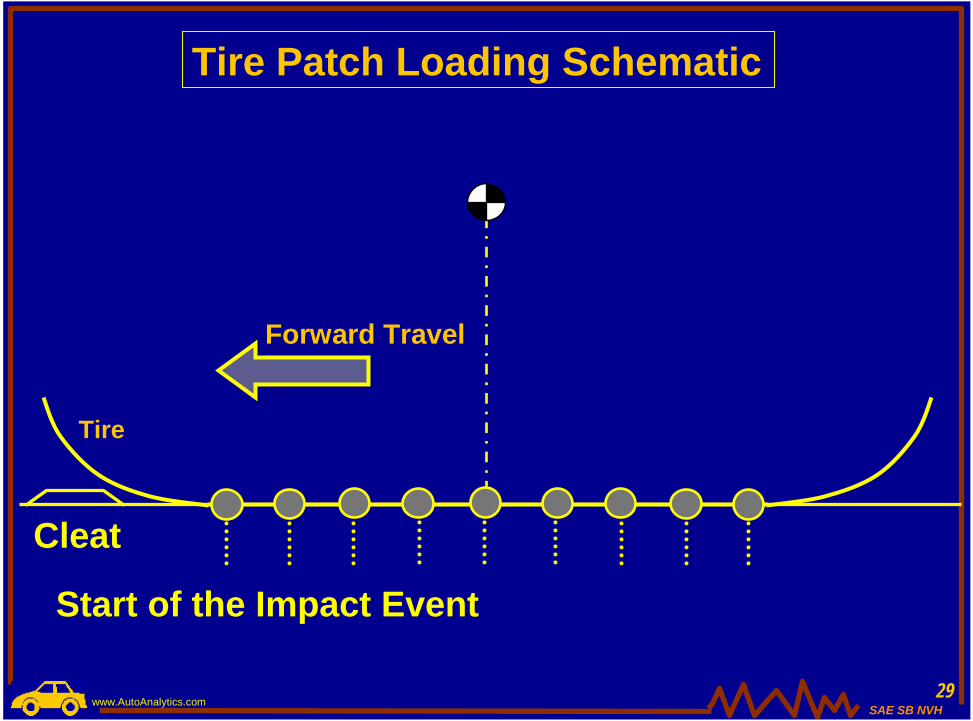
Tire Patch Loading Schematic
TireTire Patch Points
Tire Patch
29SAE SB NVH
www.AutoAnalytics.com
Tire Patch Loading Schematic
Tire
Cleat
Start of the Impact Event
Forward Travel

30SAE SB NVH
www.AutoAnalytics.com
Tire Patch Loading Schematic
Tire
Net Aft Reaction‘Tractive Force’
Net Reaction
DifferentialVerticalForce

31SAE SB NVH
www.AutoAnalytics.com
Tire Patch Loading Schematic
Tire

32SAE SB NVH
www.AutoAnalytics.com
Tire Patch Loading Schematic
Tire
Net Fwd Reaction‘Tractive Force’
Net Reaction

33SAE SB NVH
www.AutoAnalytics.com
Tire Patch Loading Schematic
Tire
End of the Impact Event

34SAE SB NVH
www.AutoAnalytics.com
Factors Leading to Increased For/Aft Response
Ride Spring Rate
• Sign Reversal in For/Aft Direction
• Recession Rate is Higher than Ride Rate
Recession Rate

35SAE SB NVH
www.AutoAnalytics.com
Vehicle Response to a Cleat Impact Event
Short Duration ResponsePeak Overshoot (Shock)Observed in time Domain
Logarithmic Decrement Indicates the Performance for Post-Event Oscillation
(After Shake)Ref. 9

36SAE SB NVH
www.AutoAnalytics.com
FrequencyDomain(Resonance Content)
Time Domain(Peak Overshoot)
NoiseResponse
TactileResponse
HarshnessParameters
Harshness Criteria : Tactile and Noise Response
Pitch Response - Baseline Model
1.E-08
1.E-07
1.E-06
1.E-05
1.E-04
0.0 5.0 10.0 15.0 20.0Frequency Hz
Ro
tati
on
Rad
ian
s
Base Model
Pitch Response - Baseline Model
1.E-08
1.E-07
1.E-06
1.E-05
1.E-04
0.0 5.0 10.0 15.0 20.0Frequency Hz
Ro
tati
on
Rad
ian
s
Base Model
Ref. 8
Ref. 9

37SAE SB NVH
www.AutoAnalytics.com
NVH Workshop Topic Outline• Introduction
• Ride Balance in the Ride Range
• NVH Load Conditions
• Low Frequency Basics

38SAE SB NVH
www.AutoAnalytics.com
Low Frequency NVH Basics
• Subjective to Objective Relationships
• Single Degree of Freedom Vibration
• Vibration and Noise Attenuation Strategies

39SAE SB NVH
www.AutoAnalytics.com
RECEIVER
PATH
SOURCE
Low Frequency NVH Fundamentals

40SAE SB NVH
www.AutoAnalytics.com
Subjective to Objective Conversions
Subjective NVH Ratings are typically based on a 10 Point Scale resulting from Ride Testing
A 2 ≈≈≈≈ 1/2 A 1Represents 1.0 Rating Change
TACTILE: 50% reduction in motion
SOUND : 6.dB reduction in sound pressure level ( long standing rule of thumb )
Receiver Sensitivity is a Key Consideration

41SAE SB NVH
www.AutoAnalytics.com
m
APPLIED FORCE
F = FO sin 2 π f t
k c FT
TR = FT / F
TransmittedForce
Single Degree of Freedom Vibration
=√ f 2fn
2) 2
ffn
( 2 d ) 21 +1 + ffn
( 2 d ) 21 +
( 1- ffn
( 2 d ) 2+
d = fraction of critical damping
fn = natural frequency √(k/m)
f = operating frequency

42SAE SB NVH
www.AutoAnalytics.com
0 1 2 3 4 50
1
2
3
4Tr
ansm
issi
bilit
y R
atio
1.414
0.5
0.1
0.15
0.375
1.0
0.25
Frequency Ratio (f / fn)
Vibration Isolation Principle
m
APPLIED FORCEF = FO sin 2 π f t
k c FT
TR = FT / F
TransmittedForce
Isolation RegionIsolation Region

43SAE SB NVH
www.AutoAnalytics.com
Body on Suspension Single DOF ModelIsolation from Base Excitation
Xin
Xout
Transmissibility Ratio is Xout / Xin
Example: Vertical Ride Mode at 1.3 Hz provides isolation starting at 1.8 Hz. This provides isolation for the first order Hop and Tramp modes.

44SAE SB NVH
www.AutoAnalytics.com
Simplified Models from 1 to 8 DOF’s
1 DOF 2 DOF
fYO
x
YO
x
4 DOF 8 DOF
YO
x
Enforced Base Motion
YO
x
XYO
Isolation Region

45SAE SB NVH
www.AutoAnalytics.com
8 Degree of Freedom Vehicle NVH Model
1 2 4 5
6 7
8
3
TiresWheels
SuspensionSprings
Engine Mass
EngineIsolator
Flexible Beam for Body
46SAE SB NVH
www.AutoAnalytics.com
Vibration and Noise Attenuation Methods
Main Attenuation Strategies• Reduce the Input Forces from the Source
• Provide Isolation
• Mode Management
• Nodal Point Mounting
• Dynamic Absorbers

47SAE SB NVH
www.AutoAnalytics.com
Vibration and Noise Attenuation Methods
Main Attenuation Strategies• Reduce the Input Forces from the Source
• Provide Isolation
• Mode Management
• Nodal Point Mounting
• Dynamic Absorbers

48SAE SB NVH
www.AutoAnalytics.com
Reduction of Input Forces from the Source
Road Load Excitation• Use Bigger / Softer Tires• Reduce Tire Force Variation• Drive on Smoother Roads
Powertrain Excitation• Reduce Driveshaft Unbalance Tolerance• Use a Smaller Output Engine• Move Idle Speed to Avoid Excitation Alignment• Modify Reciprocating Imbalance to alter Amplitude or
Plane of Action of the Force.

49SAE SB NVH
www.AutoAnalytics.com
Vibration and Noise Attenuation Methods
Main Attenuation Strategies• Reduce the Input Forces from the Source
• Provide Improved Isolation
• Mode Management
• Nodal Point Mounting
• Dynamic Absorbers

50SAE SB NVH
www.AutoAnalytics.com
8 Degree of Freedom Vehicle NVH ModelForce Applied to Powertrain Assembly
Forces at Powertrain could represent a First OrderRotating Imbalance
1 2 4 5
6 7
8
3
Feng

51SAE SB NVH
www.AutoAnalytics.com
Engine Isolation Example
Response at Mid Car
0.0001
0.0010
0.0100
0.1000
1.0000
5.0 10.0 15.0 20.0Frequency Hz
Velo
city
(mm
/sec
)
Constant Force Load; F ~ A 15.9 Hz8.5 Hz7.0 Hz
700 Min. RPM First Order UnbalanceOperation Range of Interest

52SAE SB NVH
www.AutoAnalytics.com
Concepts for Increased Isolation“Double” isolation is the typical strategy for further improving isolation of a given vehicle design.
Subframe is Intermediate Structure
Suspension Bushing is first level
Second Level of Isolation is at Subframe
to Body Mount

53SAE SB NVH
www.AutoAnalytics.com
8 Degree of Freedom Vehicle NVH ModelRemoved Double Isolation Effect
1 2 4 5
6 7
8
3
WheelMass
Removed

54SAE SB NVH
www.AutoAnalytics.com
Double Isolation ExampleVertical Response at DOF3
0.0E+00
1.0E+00
2.0E+00
3.0E+00
4.0E+00
5.0E+00
6.0E+00
5.0 10.0 15.0 20.0Frequency Hz
Velo
city
(m
m/s
ec)
Base Model
Without Double_ISO
1.414*fn

55SAE SB NVH
www.AutoAnalytics.com
Vibration and Noise Attenuation Methods
Main Attenuation Strategies• Reduce the Input Forces from the Source
• Provide Isolation
• Mode Management
• Nodal Point Mounting
• Dynamic Absorbers

56SAE SB NVH
www.AutoAnalytics.com
Mode Management Chart
0 5 10 15 20 25 30 35 40 45 50HzFirst Order Wheel/Tire Unbalance V8 Idle
Hot - Cold
EXCITATION SOURCESInherent Excitations (General Road Spectrum, Reciprocating Unbalance, Gas Torque, etc.)Process Variation Excitations (Engine, Driveline, Accessory, Wheel/Tire Unbalances)
Hz
Hz0 5 10 15 20 25 30 35 40 45 50
0 5 10 15 20 25 30 35 40 45 50
CHASSIS/POWERTRAIN MODES
Ride ModesPowertrain Modes
Suspension Hop and Tramp ModesSuspension Longitudinal Modes
Exhaust Modes
BODY/ACOUSTIC MODES
Body First Bending First Acoustic Mode
Steering Column First Vertical BendingBody First Torsion
(See Ref. 1)

57SAE SB NVH
www.AutoAnalytics.com
8 Degree of Freedom Vehicle NVH ModelBending Mode Frequency Separation
1 2 4 5
6 7
8
3
Beam Stiffness was adjusted to align Bending
Frequency with Suspension Modes and then
progressively separated back to Baseline.

58SAE SB NVH
www.AutoAnalytics.com
Response at Mid Car
0.10
1.00
10.00
100.00
5 10 15 20Frequency Hz
Velo
city
(mm
/sec
)
18.2 Hz Bending13.Hz Bending10.6 Bending
8 DOF Mode Separation Example
18.2 Hz13.0 Hz
10.6 Hz

59SAE SB NVH
www.AutoAnalytics.com
Vibration and Noise Attenuation Methods
Main Attenuation Strategies• Reduce the Input Forces from the Source
• Provide Isolation
• Mode Management
• Nodal Point Mounting
• Dynamic Absorbers

60SAE SB NVH
www.AutoAnalytics.com
Front input forces Rear input forces
First Bending: Nodal Point Mounting ExampleMount at Nodal Point
Locate wheel centers at node points of the first bending modeshapeto prevent excitation coming from suspension input motion.

61SAE SB NVH
www.AutoAnalytics.com
Passenger sits at node point for First Torsion.
Side View
First Torsion: Nodal Point Mounting ExamplesMount at Nodal Point
Transmission Mount of a3 Mount N-S P/T is nearthe Torsion Node.
Rear View
Engine

62SAE SB NVH
www.AutoAnalytics.com
Powertrain Bending Mode Nodal Mounting
1 2 4 5
6 7
3
Mount system is placed to support Powertrain at the Nodal Locations of the First order Bending Mode. Best compromise with Plan View nodes should also be considered.

63SAE SB NVH
www.AutoAnalytics.com
8 Degree of Freedom Vehicle NVH ModelBending Node Alignment with Wheel Centers
1 2 4 5
6 7
8
3
Redistribute Beam Masses to move Node Points to
Align with points 2 and 4

64SAE SB NVH
www.AutoAnalytics.com
Response at Mid-Car
0.0E+00
1.0E+00
2.0E+00
3.0E+00
4.0E+00
5.0 10.0 15.0 20.0Frequency Hz
Velo
city
(m
m/s
ec)
Node ShiftedBase Model
First Bending Nodal Point Alignment

65SAE SB NVH
www.AutoAnalytics.com
Vibration and Noise Attenuation Methods
Main Attenuation Strategies• Reduce the Input Forces from the Source
• Provide Isolation
• Mode Management
• Nodal Point Mounting
• Dynamic Absorbers

66SAE SB NVH
www.AutoAnalytics.com
YO
xSDOF
Dynamic Absorber Concept
MYO
x
Auxiliary Spring-Mass-Damperm = M / 10
2DOFM

67SAE SB NVH
www.AutoAnalytics.com
Powertrain Example of Dynamic Absorber
Anti-Node Identifiedat end of Powerplant
k c
Absorber attached at anti-node acting in the Vertical and Lateral plane.
Tuning Frequency = √√√√ k/m
m
[Figure Courtesy of DaimlerChrysler Corporation]

68SAE SB NVH
www.AutoAnalytics.com
Baseline Sound Level63 Hz Dynamic Absorber63 + 110 Hz Absorbers
Baseline Sound Level63 Hz Dynamic Absorber63 + 110 Hz Absorbers
[Figure Courtesy of DaimlerChrysler Corporation]
10 dB

69SAE SB NVH
www.AutoAnalytics.com
Vibration and Noise Attenuation Methods
Main Attenuation Strategies• Reduce the Input Forces from the Source
• Provide Isolation
• Mode Management
• Nodal Point Mounting
• Dynamic Absorbers

70SAE SB NVH
www.AutoAnalytics.com
Structure Borne NVH Outline• Introduction• Ride Balance in the Ride Range• NVH Load Conditions• Low Frequency Basics• Live Noise Attenuation Demo• Mid Frequency Basics• Utilization of the NVH Toolbox• Closing Remarks
Greg Goetchius
71SAE SB NVH
www.AutoAnalytics.com
Structure Borne NVH Outline• Introduction• Ride Balance in the Ride Range• NVH Load Conditions• Low Frequency Basics• Live Noise Attenuation Demo• Mid Frequency Basics• Utilization of the NVH Toolbox• Closing Remarks
Sachin Gogate

72SAE SB NVH
www.AutoAnalytics.com
RECEIVER
PATH
SOURCE
Mid Frequency NVH Fundamentals
This looks familiar!Frequency Range of Interest has changed to
150 Hz to 500 Hz

73SAE SB NVH
www.AutoAnalytics.com
Typical NVH Pathways to the Passenger
PATHS FOR
STRUCTURE BORNE
NVH
Noise Paths are thesame as Low
Frequency Region
Noise Paths are thesame as Low
Frequency Region

74SAE SB NVH
www.AutoAnalytics.com
Mid-Frequency Analysis CharacterStructure Borne Noise
Airborne Noise
Res
pons
e
Log Frequency“Low”
Global Stiffness“Mid”
Local Stiffness+
Damping
“High”
Absorption+
Mass+
Sealing
~ 150 Hz ~ 1000 Hz ~ 10,000 Hz
High modal densityand coupling in
source, path andreceiver
• Mode separation is less practical inmid-frequency
• New Strategy is Effective Isolation:Achieved by reducing energy transferlocally between source and receiver atkey paths.
•• Mode separation is less practical inMode separation is less practical inmidmid--frequencyfrequency
•• New Strategy is Effective Isolation:New Strategy is Effective Isolation:Achieved by reducing energy transferAchieved by reducing energy transferlocally between source and receiver atlocally between source and receiver atkey paths.key paths.

75SAE SB NVH
www.AutoAnalytics.com
Mid-Frequency Analysis Character
• Important characteristics of mid frequency analysis
&
Identifying Key Noise Paths
Effective Isolation

77SAE SB NVH
www.AutoAnalytics.com
Mid-Frequency Analysis Character
&
• Important characteristics of mid frequency analysis
Identifying Key Noise Paths
Effective IsolationEffective Isolation

80SAE SB NVH
www.AutoAnalytics.com
Classical SDOF: Rigid Source and Receiver
T ran
smis
s ibi
l ity
Ra t
io
1.0 1.414 10.0
f / f n
“Real Structure”Flexible (Mobile)Source and Receiver
Isolation Effectiveness
Effectiveness deviates from the classical development as resonances occur in the receiver structure and in the foundation of the source.
Isolation RegionIsolation Region
1.0

76SAE SB NVH
www.AutoAnalytics.com
Mobility• Mobility is the ratio of velocity response at the excitation point on structure
where point force is applied
Mobility =Velocity
Force
• Mobility, related to Admittance, characterizes Dynamic Stiffness of the structure at load application point
Mobility =Frequency * Displacement
Force
=Frequency
Dynamic Stiffness

NVH Workshop
• The isolation effectiveness can be quantified by a theoretical model based on analysis of mobilities of receiver, isolator and source
• Transmissibility ratio is used to objectively define measure of isolation
TR =Force from source without isolator
Force from source with isolator
Isolation
V r
V ir
V is
F r
F ir
Receiver
Source
F is
Fs V s
Isolator
VF s=
Y i + Y r + Y s
V r
F r
Receiver
Source
F s V s
VF s=
Y r + Y s
VV
2003, 2005 ERRATA

NVH Workshop
• The isolation effectiveness can be quantified by a theoretical model based on analysis of mobilities of receiver, isolator and source
• Transmissibility ratio is used to objectively define measure of isolation
TR =Force from source without isolator
Force from source with isolator
Isolation
V r
V ir
V is
F r
F ir
Receiver
Source
F is
Fs V s
Isolator
VF s=
Y i + Y r + Y s
V r
F r
Receiver
Source
F s V s
VF s=
Y r + Y s
VV

NVH Workshop
Isolation
TR = ⏐ ( Y r + Y s ) / ( Y i + Y r + Y s ) ⏐
• For Effective Isolation (Low TR) the Isolator Mobility must exceed the sum of the Source and Receiver Mobilities.
Y r : Receiver mobility
Y s : Source mobility
Y i : Isolator mobility
V m
V im
V if
F m
F im
Receiver
Source
F if
F f V f
Isolator
TR = Force from source without an isolator Force from source with an isolator

81SAE SB NVH
www.AutoAnalytics.com
Mid-Frequency Analysis Character
Effective Isolation
&
• Important characteristics of mid frequency analysis
Identifying Key Noise PathsIdentifying Key Noise Paths

82SAE SB NVH
www.AutoAnalytics.com
Identifying Key NVH PathsKey NVH paths are identified by Transfer Path Analysis (TPA)
Fi
TactileTransferTactile
TransferAcousticTransfer
AcousticTransfer
Operating loads Operating loads
• TPA is a technique to perform phased summation of partial responses through all NVH paths to give total tactile or acoustic response under operating loads at a given frequency
• TPA is applicable in both testing and simulation scenarios to identify key paths
Break the system at the points where the forces enter the body (Receiver)

83SAE SB NVH
www.AutoAnalytics.com
Noise Path Analysis
Fi
• Total Acoustic Response is summation of partial responses over all noise paths
Pt = ΣΣΣΣ paths [Pi ] = ΣΣΣΣ paths [ (P/F) i * Fi ]
Acoustic Transfer (P/F)iAcoustic Transfer (P/F)i
Pi : Partial contribution of path i due to operating force
Operating loads createForces (Fi) into body atAll noise paths
(P/F) i : Acoustic Transfer Function of the ith Path

84SAE SB NVH
www.AutoAnalytics.com
Transfer Path Analysis
( contributors + )
( reducers - )
…
FrontUpperControlArm
FrontShockAbsorber Rear
ShockAbsorber
RearUpperArm
TotalNoise
(((( AllPaths))))
FrontStabilizer
FrontSpring
• TPA allows path rankings based on contribution to total response of noise paths at a given frequency
• TPA thus helps identify key noise paths
• TPA is mainly used for acoustic response in mid frequency range

85SAE SB NVH
www.AutoAnalytics.com
Designing for Mid Frequency
• Important characteristics of mid frequency analysis
Effective Isolation
&
Identifying Key Noise Paths

86SAE SB NVH
www.AutoAnalytics.com
Designing for Mid Frequency
When designing a new vehicle, the first phase is to satisfy generic targets for key parameters along all noise paths in order to achieve effective isolation.
What are these generic targets andkey parameters ?
What are these generic targets andkey parameters ?
87SAE SB NVH
www.AutoAnalytics.com
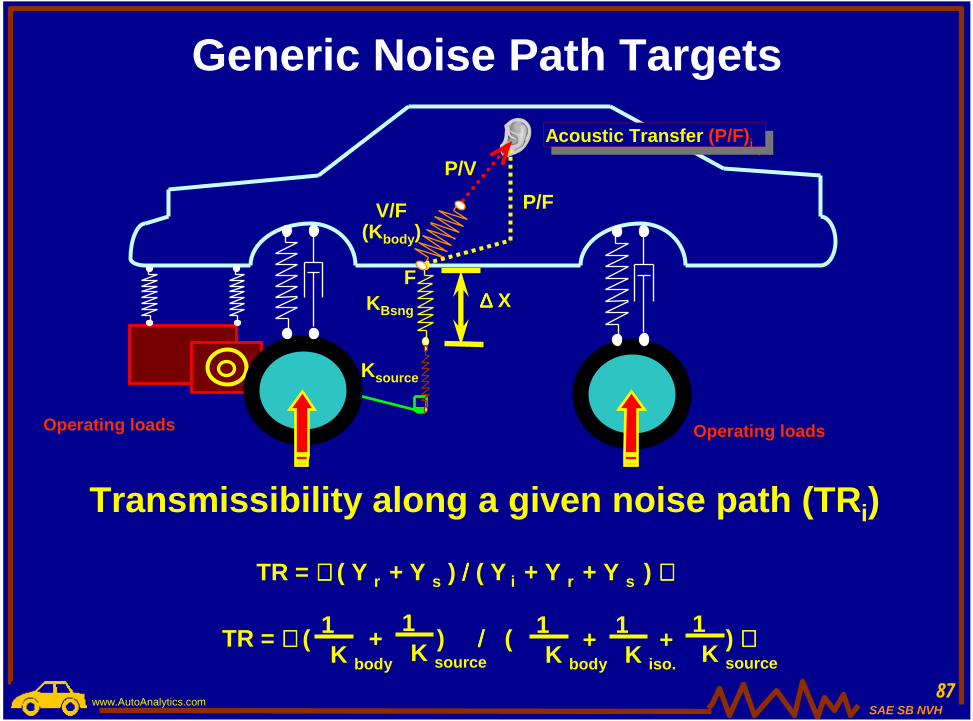
Generic Noise Path Targets
Operating loads Operating loads
Acoustic Transfer (P/F)iAcoustic Transfer (P/F)i
∆∆∆∆ XKBsng
V/F
P/VP/F
F
Ksource
(Kbody)
Transmissibility along a given noise path (TRi)
TR = ( Y r + Y s ) //// ( Y i + Y r + Y s )
TR = ( ) //// ( ) K body
1K source
1+ K body
1 + K iso.
1K source
1+

88SAE SB NVH
www.AutoAnalytics.com
Generic Noise Path TargetsTR = ( ) //// ( ) K body
1K source
1+ K body
1 + K iso.
1K source
1+
K iso
K sourceK body
K iso1.0 5.0 Infinite
1.0
5.0
Infinite
0.67 0.54 0.50
0.54 0.28 0.17
0.50 0.17 0.00
As a generic target, body to bushing stiffness ratio of at least 5.0 and very high source to bushing stiffness ratio (~ infinite) is desired to achieve “good” TR of 0.17

89SAE SB NVH
www.AutoAnalytics.com
0
0.1
0.2
0.3
0.4
0.5
1 1.5 2 2.5 3 3.5 4 4.5 5 5.5 6 6.5 7 7.5 8 8.5 9 9.5 10
Series2
0.0
0.1
0.2
0.3
0.4
0.5
1 2 3 4 5 6 7 8 9 10
Stiffness Ratio; K body / K bsg
Tran
smis
sibi
lity
Rat
io
TR = ( K bsg ) //// ( K bsg + K body )
For a very stiff source
Target Min. = 5 gives TR = .17
Relationship of Body-to-Bushing Stiffness Ratio to Transmissibility

90SAE SB NVH
www.AutoAnalytics.com
Fi
Operating loads Operating loads
Acoustic Transfer (P/F)iAcoustic Transfer (P/F)i
Operating loads createForces (Fi) into body atAll noise paths
Pt = ΣΣΣΣ paths [Pi ] = ΣΣΣΣ paths [ Fi * (P/F) i ] = ΣΣΣΣ paths [ Fi * (P/V) i * (V/F)i]
Generic Noise Path Targets
(P/F) Acoustic Sensitivity(V/F) Structural Point Mobility (Receiver)

91SAE SB NVH
www.AutoAnalytics.com
Generic Noise Path Targets
• For a given force generated at a source attachment to body, lowering sensitivities (P/F) or (V/F) along a pathwould reduce total response
• Typical generic targets,
- Acoustic Sensitivity (P/F) in 50 - 60 dBL/N range
- Structural Mobility (V/F) less than 0.312 mm/sec/N
For example, for Acoustic Response Pt
Pt = ΣΣΣΣ paths [Pi ] = ΣΣΣΣ paths [ Fi * (P/F) i ] = ΣΣΣΣ paths [ Fi * (P/V) i * (V/F)i]

92SAE SB NVH
www.AutoAnalytics.com
Generic Noise Path Targets
K iso
K body >= 5.0K iso
K source ~ very high
AcousticSensitivity < 50 - 60
dBL/N
StructuralMobility < 0.312 mm/sec/N
How does one achieve these generic targets ?

93SAE SB NVH
www.AutoAnalytics.com
Generic Noise Path TargetsHow does one achieve
• Increase local body attachment stiffness (Kbody) through structural modifications
K iso
K body >= 5.0
• Reduce attachment isolator stiffness (Kiso) while balancing the conflicting requirement of other functionalities such as Ride & Handling
StructuralMobility < 0.312

94SAE SB NVH
www.AutoAnalytics.com
How does one achieve
• Increase source side attachment stiffness (Ksource)
• Reduce attachment isolator stiffness (Kiso)
K iso
K source ~ very high
In Automotive Structures, it is realistic to expect that the Source to isolator stiffness ratio is high since Source usually corresponds to a stiff structure (such as powertrain or axle).
Generic Noise Path Targets

95SAE SB NVH
www.AutoAnalytics.com
How does one achieve
• At a given frequency, Acoustic Sensitivity (P/F) is
P/F = (P/V) X FrequencyBody stiffness
• Based on the above equation, increasing body stiffness usually reduces Acoustic Sensitivity.
Generic Noise Path Targets
AcousticSensitivity < 50 - 60
dBL/N

96SAE SB NVH
www.AutoAnalytics.com
How does one achieve:
• In such cases, the Acoustic Sensitivity can be reduced by reducing the overall body panel velocity through application of damping treatments
• There are situations when increasing body stiffness does not reduce Acoustic Sensitivity
AcousticSensitivity < 50 - 60
dBL/N
Generic Noise Path Targets

97SAE SB NVH
www.AutoAnalytics.com
Application of Damping TreatmentEffect on sound response of damping treatment
applied on key identified contributing panels
[Figure Courtesy of DaimlerChrysler Corporation]
12.5dBA Reduction
Floor without damping treatment
Floor with damping treatment
Frequency (Hz)
5.0 dBA
SPL
(dB
A)

98SAE SB NVH
www.AutoAnalytics.com
Designing for Mid Frequency
While designing a new vehicle, generic targets are set for key parameters along all noise paths in order to achieve effective isolation.
Is it really necessary to achieve generic targets forall noise paths ?
Is it really necessary to achieve generic targets forall noise paths ?
Probably Not !!Probably Not !!

99SAE SB NVH
www.AutoAnalytics.com
Designing for Mid FrequencyDriver’s Ear Noise
Vehicle Level Response
Original Noise Path Contributions
Transfer Path Analysis
Some noise paths are more dominant than others
Impose more strict requirements for these dominant paths and relax requirements for other paths to achieve more “rebalanced”noise
Improved Noise Path Contributions
Driver’s Ear Noise
Vehicle Response to Meet NVH Targets
Original NoiseReduced Noise

100SAE SB NVH
www.AutoAnalytics.com
Yesor
Time Out
No
Re-DesignSub-System
Evaluate Sub-SystemPerformance
Evaluate Sub-SystemPerformance
No
Meet VehicleGoals?
RebalanceTrade-OffRebalanceTrade-Off
Meet Sub-System
Goals? Evaluate Vehicle GoalsEvaluate Vehicle Goals
Mid Frequency NVH Goal Achievement Process
Initial Sub-System Targets
Yesor
Time Out

101SAE SB NVH
www.AutoAnalytics.com
Designing for Mid Frequency
Principles to follow
• At the beginning of program, work towards generic targets for all noise paths in order to achieve effective isolation.
• As the design is firmed out, shift focus to key contributing noise paths using Transfer Path Analysis in order to meet target for all NVH operating load conditions.• Perform path “rebalancing” to arrive at revised path targets if Sub-System goal achievement is not possible due to architectural constraints.

102SAE SB NVH
www.AutoAnalytics.com
Final Remarks on Mid Frequency Analysis
• Effective isolation at dominant noise paths is critical• Effective isolation at dominant noise paths is critical
• Reduced mobilities at body & source and softenedbushing are key for effective isolation
• Reduced mobilities at body & source and softenedbushing are key for effective isolation
• It is important to balance NVH requirements againstother functionalities (Ride and Handling, Impact)
• It is important to balance NVH requirements againstother functionalities (Ride and Handling, Impact)
• It is important to understand the robustness ofdesign recommendations
• It is important to understand the robustness ofdesign recommendations
• Other means of dealing high levels of source inputsuch as damping treatments are also effective
• Other means of dealing high levels of source inputsuch as damping treatments are also effective

103SAE SB NVH
www.AutoAnalytics.com
Structure Borne NVH Outline• Introduction• Ride Balance in the Ride Range• NVH Load Conditions• Low Frequency Basics• Live Noise Attenuation Demo• Mid Frequency Basics• Utilization of the NVH Toolbox• Closing Remarks Greg Hopton

104SAE SB NVH
www.AutoAnalytics.com
Utilization of the NVH Toolbox
DashboardDashboard
Air treatmentAir treatment
EngineEngine
AuxiliariesAuxiliaries
TiresTires
GearboxGearbox Drive lineDrive lineSteering SystemSteering System
Wheel SuspensionsWheel Suspensions
Body TrimBody Trim
Body StructureBody StructureSeatsSeats

105SAE SB NVH
www.AutoAnalytics.com
ExperimentalExperimentalAssessmentAssessment
ExperimentalExperimentalModelingModeling
NumericalNumericalModelingModeling
Spectral AnalysisSpectral Analysis
SSignatureignature
IntensityIntensityHolographyHolographyOperational DeflectionOperational Deflection
SSoundound QQualityuality
ModalModal AnalysisAnalysis
TPA TPA (structure(structure--borne)borne)
FRF BasedFRF Based ModelingModeling
ASQ ASQ (air(air--borne)borne)
BEMBEM
Ray TracingRay Tracing
VibroVibro--acoustic Modalacoustic Modal AnalysisAnalysis
EESEASEA
Technologies for NVHInputInput TransferTransfer ResponseResponse
Acoustical Acoustical MechanicalMechanical
MediumMediumStructure Surface Structure Surface AirBorneAirBorne
Acoustic Acoustic VibrationVibration
Spectral AnalysisSpectral Analysis
FFRF AnalysisRF Analysis
Acoustical FEMAcoustical FEMStructural FEMStructural FEM
SSignatureignature
MBSMBS
SEASEA

106SAE SB NVH
www.AutoAnalytics.com
Various TechniquesLow Frequency Mid Frequency High Frequency
Modal Structuring
PCA Acoustic holography
SEA
Modal analysisTPA, ASQ
Inverse BEMODS
Vibro-acoustic
Spectral AnalysisSound Quality
Intensity
Ray tracingFEMBEM
Time domain BEM
ExperimentalExperimentalModelingModeling
NumericalNumericalModelingModeling
HybridHybridModelingModeling
CATCAT
CAECAE
FRF Structuring Experimental SEA

107SAE SB NVH
www.AutoAnalytics.com
Hybrid Modeling
•• A A ““HybridHybrid”” model is a full system performance model is a full system performance model composed of both numerical and model composed of both numerical and experimental based modelsexperimental based models
•• TestTest--based models are used for existing / carryover based models are used for existing / carryover subsub--systemssystems•• Faster than building numerical modelsFaster than building numerical models•• More accurately match hardwareMore accurately match hardware
•• Numerical models are used for subNumerical models are used for sub--systems of systems of design interestdesign interest•• Automatic optimizationAutomatic optimization•• Design Space StudiesDesign Space Studies
•• Performance is evaluated at system levelPerformance is evaluated at system level•• More accurate, faster runMore accurate, faster run--times than fulltimes than full
numerical modelsnumerical models•• More flexibility than full testMore flexibility than full test--based modelsbased models

108SAE SB NVH
www.AutoAnalytics.com
When to Use These Methods
Experimental ModelingExperimental Modeling• Utilize previous generation hardware• Utilize prototype builds• Numerical models are not available
Numerical ModelingNumerical Modeling• Physical hardware is not available• Evaluate a variety of analysis cases quickly• Understand variability
Hybrid ModelingHybrid Modeling• Both numerical and experimental models are available• Fast run times• Evaluate variety of sub-assemblies or components quickly

109SAE SB NVH
www.AutoAnalytics.com
Structure Borne NVH Outline• Introduction• Ride Balance in the Ride Range• NVH Load Conditions• Low Frequency Basics• Live Noise Attenuation Demo• Mid Frequency Basics• Utilization of the NVH Toolbox• Closing Remarks Alan Duncan

110SAE SB NVH
www.AutoAnalytics.com
Rideand
Handling
NVH Durability
ImpactCrashWorthiness
Competing Vehicle Design Disciplines

111SAE SB NVH
www.AutoAnalytics.com
The Fundamental Secret ofStructure Borne
NVH Performance
The Fundamental Secret ofStructure Borne
NVH Performance
Revealed here today !

112SAE SB NVH
www.AutoAnalytics.com
The Fundamental Secret of Structure Borne NVH Performance
The Fundamental Secret of Structure The Fundamental Secret of Structure Borne NVH PerformanceBorne NVH Performance
To Minimize Structure Borne NVH, connect between Source and Receiver Sub-Systems at Locations where the Motion is at a Minimum.
First Best Principle for NVH Improvement is Minimization /
Understanding of the Source Excitation.
Ist Corollary

113SAE SB NVH
www.AutoAnalytics.com
First Best Principle for NVH Improvement is Minimization /
Understanding of the Source Excitation.
IstCorollary
The Fundamental Secret of Structure Borne NVH Performance
The Fundamental Secret of Structure The Fundamental Secret of Structure Borne NVH PerformanceBorne NVH Performance
Meets Conditions of the Attenuations Strategies
Thank You for Attending theStructure Borne NVH Workshop
Your Presenters today were:
Alan Duncan, Material Sciences Corp.Contact: [email protected] or [email protected]
Greg Goetchius, Material Sciences Corp.Contact: [email protected]
Sachin Gogate, DaimlerChrysler Corp.Contact: [email protected]
Visit: SAE at www.sae.org/events/nvc/specialevents.htmAlso with Ref.s at: www.AutoAnalytics.com/papers.html
to download the Structure Borne NVH Workshops
To Minimize Structure Borne NVH, connect between Source and Receiver Sub-Systems at Locations where the Motion is at a Minimum.
Greg Hopton, LMS North AmericaContact: [email protected]