a nextgen target generation facility (tgf) … nextgen target generation facility (tgf) viewpoint of...
TRANSCRIPT
A NextGen Target Generation Facility (TGF) Viewpoint of
National Airspace System (NAS) Weather Processing
Prepared By:
Glenn R. Smythe Titan Systems Corporation
Prepared for:
Dan Warburton ACT-510
NAS Simulation Branch Federal Aviation Administration
William J. Hughes Technical Center Atlantic City, NJ 08405
Under:
System Resources Corporation 5218 Atlantic Avenue
Mays Landing, NJ 08330 FAA Prime Contract No. DTFA03-94-C-00042
June 24, 2002
TABLE OF CONTENTS 1.0 Overview
1.1 Simulating Weather 1.2 Effect of Weather on Cockpit Simulators 1.3 Role of Forecast Model Data in NAS Systems
1.3.1 RUC-2 Forecast Model Data 1.3.2 AVN Forecast Model Data
2.0 Rapid Update Cycle (RUC-2) Forecast Model Data 2.1 RUC-2 Grid Architecture 2.2 RUC-2 Inputs and Outputs 3.0 GRIdded Binary (GRIB) Format 3.1 GRIB Documentation 3.2 RUC-2 Data in GRIB Format 3.3 GRIB Software Utility 4.0 Current ATC Systems 4.1 User Request Evaluation Tool/Core Capability Limited Deployment (URET/CCLD) 4.1.1 URET Prototype 4.1.2 URET/CCLD Deployment 4.1.3 URET/CCLD Uses RUC-2 Forecast Model Data 4.2 Weather and Radar Processor (WARP) 4.2.1 Data Transfer From WINS to URET/CCLD 4.2.2 Data Transfer From WINS to Other NAS Systems 5.0 Planned ATC Systems 5.1 Center-TRACON Automation System (CTAS) 5.2 Display System Replacement (DSR) 5.2.1 DSR Fielding 5.2.2 WARP to DSR Interface 5.3 Integrated Terminal Weather System (ITWS) 5.3.1 ITWS Inputs 5.3.2 ITWS Fielding 5.3.3 ITWS Hardware 5.3.4 ITWS Grid Analysis 5.3.4.1 ITWS Coarse Grid Analysis 5.3.4.2 ITWS Fine Grid Analysis 5.4 Dynamic Ocean Track System (DOTS) 5.4.1 DOTS Function 5.4.2 DOTS Fielding 5.4.3 DOTS Inputs 5.5 Enhanced Traffic Management System (ETMS)

6.0 Flow of Weather Data 6.1 Data Flow From the NWS to and through FAA NAS Subsystems 6.2 NWS Data Flow to and From ITWS 6.3 NWS Data Flow to WARP and ITWS 6.4 Flow of NWS Data and FAA Products to and from WARP 7.0 NextGen Atmospheric JAVA Classes 7.1 NextGen AtmModel 7.2 NextGen WindModel 8.0 Aircraft Dynamics Model (ADM) and the Standard Day Atmosphere 9.0 RUC-2 and ITWS Interfaces to TGF 10.0 NexGen TGF WeatherServer Architecture 10.1 Synchronizing TGF and URET Methodologies 10.2 URET Implementation 10.2.1 Horizontal Transformation 10.2.1.1 Construction Horizontal Grid 10.2.1.2 Transfer from Lambert to Spherical 10.2.1.3 Wind Rotation 10.2.1.4 Vertical Shift from Pressure Levels to Flight Levels 10.3 Target Generation Facility (TGF) Implementation 10.3.1 Data Structure Generation 10.3.1.1 Horizontal Component 10.3.1.2 Vertical Component 10.3.1.3 Vertical Indexing Component 10.4 Interpolation and Scaling Methodology
10.4.1 The TGF procedure for obtaining weather from the RUC236
11.0 Figures 12.0 References 13.0 Contacts 14.0 Acronyms
LIST OF FIGURES Figure 1. Flow of NWS Data to FAA NAS Subsystems Figure 2. Flow of Data to and from ITWS Figure 3. Flow of NWS Data to WARP and ITWS Figure 4. Flow of NWS Data and FAA Products to and from WARP and Other NAS Subsystems Figure 5. Two Dimension Bilinear Interpolation Figure 6. Three Dimension Bilinear Interpolations .
1.0 Overview Using and integrating weather in the NextGen Target Generation Facility (NextGen TGF) simulated airspace does not require a deep knowledge of meteorology. The key to understanding the simulation of weather for Air Traffic Control (ATC) airspace studies and Operational Test and Evaluation (OT&E) using NextGen TGF is the knowledge of what data flows between NextGen TGF and current and planned ATC systems in the National Airspace System (NAS) and the formats of these data. 1.1 Simulating Weather The role of simulated weather in NextGen TGF is twofold in terms of aircraft modeling:
1) The injection of weather data into the aircraft dynamics model (ADM) will affect the dynamics and movement of aircraft through the simulated airspace.
2) Weather data are used to introduce weather effects, especially winds at different
altitudes and precipitation, to add realism to airspace studies. 1.2 Effect of Weather on Cockpit Simulators The cockpit simulators at the WJHTC currently do not use weather information in their simulation models. Weather data may be used in the future; however, there are not any plans to incorporate it. 1.3 Role of Forecast Model Data in National Airspace System (NAS) Systems The National Weather Service (NWS) National Centers for Environmental Prediction (NCEP), Air Force Global Weather Central (AFGWC) and the meteorological services of other countries generate weather forecasts based on several different forecast models. These models vary in their spatial coverage, and temporal and spatial resolution. Two such models, the Rapid Update Cycle (RUC-2) and Aviation (AVN) forecast models are of interest here. 1.3.1 RUC-2 Forecast Model Data The TGF presently injects weather data generated with a standard day atmosphere model into the ADM. Several NAS systems are using or are planning to use data from the RUC-2 forecast model generated by the (NWS) as the primary source of weather data. To be consistent with these systems and provide realism to simulated airspace studies, the NextGen TGF may also use RUC-2 data in the future. This paper describes the NAS systems currently using the RUC-2 and those that will use RUC-2 in the future. RUC-2 covers only the 48 conterminous states. Those systems that cover other parts of the world
(land and ocean) would use data from other forecast models, such as the Aviation Model (AVN). The paper also describes the RUC-2 model and its input and output data, the AVN and its input and output data, and the standard atmosphere model. 1.3.2 AVN Forecast Model Data Since the RUC-2 model covers only the 48 conterminous states, systems that cover ocean routes and landmasses other than the 48 states need another source of weather data. The Dynamic Ocean Track System (DOTS) uses the AVN model since the model covers the oceans. The Integrated Terminal Weather System (ITWS) for San Juan, Puerto Rico uses AVN model data since the RUC-2 does not cover the Caribbean. 2.0 Rapid Update Cycle (RUC-2) Forecast Model Data The RUC-2 forecast model is generated by the NWS at its National Centers for Environmental Prediction (NCEP). 2.1 RUC-2 Grid Architecture The RUC-2 forecast model presently covers the 48 conterminous states. It has a three-dimensional grid with 40-kilometer (km) horizontal resolution (The NWS is currently testing a new version of RUC-2 with 20 km horizontal resolution. However, there are not presently any NAS requirements for this increased resolution.) In the vertical, the RUC-2 has 40 levels measured in pressure coordinates in 25 millibar (mb) increments from near the surface (1000 mb) to the top of the atmosphere (0 mb). This covers from the surface to approximately 60,000 feet. Twelve-hour forecasts are produced every three hours and a three-hour forecast is produced every hour. Of the NWS forecast models, RUC-2 has the highest update frequency. This makes RUC-2 the best choice for use with the TGF models applied to the 48 conterminous states. In general, the term winds aloft refers to winds at 3000 feet or higher. The horizontal and vertical grid points mapped to the RUC-2 inputs and outputs provide a methodology to build a NextGen TGF wind simulator. 2.2 RUC-2 Inputs and Outputs Inputs to the RUC-2 model are data from rawinsondes (instruments carried by weather balloons), data collected on commercial aircraft (from the Meteorological Data Collection and Reporting System (MDCRS)), surface station data (from the Automated Surface Observing System (ASOS) and Automated Weather Observing System (AWOS)) and Doppler wind profiler data. Outputs from the RUC-2 model are pressure, pressure surface height (i.e., the altitude at which a particular pressure level is located), temperature, relative humidity, horizontal velocity components (u/v), vertical velocity, dew point, and precipitation. RUC-2 output data are provided in GRIdded Binary (GRIB) format.

3.0 GRIdded Binary (GRIB) Format GRIB is the World Meteorological Organization (WMO) format for GRIdded Binary data. It is widely used in the international meteorological community, the NWS and Air Force Global Weather Central (AFGWC), for the interchange of gridded data fields. 3.1 GRIB Documentation The GRIB format is specified in an NWS NCEP report entitled: GRIB: “The WMO Format for the Storage of Weather Product Information and the Exchange of Weather Product Messages in Gridded Binary Form as Used by NCEP Central Operations.” (Reference 1) The report is available on this server: http://www.nco.ncep.noaa.gov/pmb/docs/on388/download The server provides the document in either Word Perfect 6 or pdf format for Acrobat reader. 3.2 RUC-2 data in GRIB Format RUC-2 data in GRIB format are available on this server: ftp://tgftp.nws.noaa.gov 3.3 GRIB Software Utility There is a program called “wgrib” for reading and decoding GRIB data files. “wgrib” is highly recommended by NCEP and others. It is discussed on this web page: http://wesley.wwb.noaa.gov/wgrib.html The web page contains links to downloadable documentation, source code and compiled versions of “wgrib.” 3.4 GRIB Files RUC–2 GRIB data are stored in files that are named according to conventions that are specified in the NWS document titled “Directory and File Naming Standards for FTP servers,” Version November 2001. (Reference 2) 4.0 Current ATC Systems 4.1 User Request Evaluation Tool/Core Capability Limited Deployment (URET/CCLD) The User Request Evaluation Tool/Core Capability Limited Deployment (URET/CCLD) is a functionality of and is integrated with the Display System Replacement (DSR). It is
a software tool that is also known as a “conflict probe.” It provides a visual representation of aircraft in flight and gives controllers a 20-minute look-ahead capability to detect potential conflicts when considering pilots' requests for altitude and route changes. URET/CCLD uses RUC-2 forecast data to realistically induce the effects of weather on the predicted motion of aircraft. 4.1.1 URET Prototype The URET prototype uses coarse grid (RUC 211 format files) RUC-2 data since WARP did not exist when the prototype was being developed. 4.1.2 URET/CCLD Deployment URET/CCLD will initially be deployed in 2002 at seven ARTCCs: Atlanta, Cleveland, Indianapolis, Memphis, Chicago, Kansas City and Washington, DC. 4.1.3 URET/CCLD Uses RUC-2 Forecast Model Data URET/CCLD receives RUC-2 forecast model data from the Weather and Radar Processor (WARP) Weather Information Network Server (WINS). The transferred data elements are RUC forecast weather data files scaled to an Air Route Traffic Control Center (ARTCC) region. Five files containing the most recent five hours of gridded data available to WARP WINS are sent to URET/CCLD each hour at 50 minutes past the hour. These files contain fine scale grid data in RUC 236 format. The format for these files and the file naming convention may be found in (Reference 3). 4.2 Weather and Radar Processor (WARP) The Weather and Radar Processor (WARP) is a NAS subsystem that integrates data from WSR-88Ds throughout the country and generates regional and national mosaics of radar reflectivity and precipitation for the enroute area. These products are provided to the DSR. WARP also receives and distributes NWS forecast model data (RUC-2) as well as surface data from ASOS via the AWOS Data Acquisition System (ADAS), satellite, and long-range radar data. WARP also provides Center Weather Service Unit (CWSU) meteorologists with processing tools and a single, integrated workstation to receive and consolidate weather data from multiple sources into a single database. WARP enables the meteorologists to analyze the data and generate specialized aviation weather products that are displayed to air traffic controllers. 4.2.1 Data Transfer from WINS to URET/CCLD The Weather Information Network Server (WINS) is a part of WARP. WINS provides RUC-2 data to URET/CCLD. According to the Interface Design (IDD) Document, WINS to URET/CCLD (Reference 3), WARP provides URET/CCLD with a file for each

RUC forecast period. The URET/CCLD interface receives five ARTCC-specific RUC-2 forecast data files. Data extend an additional 400 nm from the ARTCC boundary. Each file contains a series of GRIB messages. The GRIB format is described in (Reference 1). Files are transferred using the Network File Services over 10BaseT or 100BaseT Ethernet. The TCP/IP protocol is used. The WINS to URET/CCLD IDD specifies the convention by which these ARTCC-specific RUC-2 data files are named. Each file is given a unique name identifying the originating forecast model, the three-letter ARTCC identifier, generation time of the forecast, and the valid time of the data. (Section 3.2.1.1 of the IDD describes the details of the naming convention.) 4.2.2 Data Transfer from WINS to Other NAS Systems The WINS may provide RUC-2 data to the Center-TRACON Automation System (CTAS), Enhanced Traffic Management System (ETMS) and NextGen TGF. IDDs for CTAS and ETMS are not yet available. 5.0 Planned ATC Systems 5.1 Center-TRACON Automation System (CTAS)
The Center-TRACON Automation System (CTAS) is a set of tools for managing air traffic flows at large airports. CTAS generates air traffic advisories designed to increase fuel efficiency, reduce delays, and provide automation assistance to air traffic controllers in achieving acceptable aircraft sequencing and separation as well as improved airport capacity. CTAS consists of the Traffic Management Advisor (TMA), Descent Advisor (DA) and Final Approach Spacing Tool (FAST).
5.1.1 CTAS Function
The TMA helps a Center's Traffic Management Coordinator (TMC) optimize the arrival traffic flow and create a plan. At the same time, the DA assists the air traffic controllers of each sector by probing for and resolving conflicts between aircraft, and providing air traffic control advisories to carry out the TMC's plan.
CTAS also assists controllers handling arrival air traffic in an area within 40 miles of a major airport. Within these areas, known as Terminal Radar Approach Controls (TRACONs), FAST assists approach controllers to assign aircraft to runways as well as sequence and schedule aircraft onto the final approach to the runway. CTAS integrates these functions and thereby provides assistance to air traffic coordinators and controllers in both Centers and TRACONs.

5.1.2 CTAS Weather Inputs
CTAS requires up-to-date weather information in order to generate accurate aircraft trajectories. Currently these data are provided by the NWS NCEP, in the form of a three-dimensional grid of wind, temperature, and pressure data based on a one- or three-hour forecast from the RUC-2 forecast model.
5.2 Display System Replacement (DSR) The Display System Replacement (DSR) receives WSR-88D mosaics from the local WARP. It displays radar reflectivity mosaics directly to controllers. The DSR also receives and displays data from the long-range radar. Using its URET/CCLD functionality, the DSR provides a visual representation of aircraft in flight. URET/CCLD uses RUC-2 data to affect the predicted motion of aircraft. 5.2.1 DSR Fielding The DSR will be installed at all 20 ARTCCs, the FAA Technical Center in Atlantic City, New Jersey, and the FAA Academy in Oklahoma City, Oklahoma. 5.2.2 WARP to DSR Interface and Transferred Products The WARP/DSR ICD contains a description of NEXRAD-derived products that are transferred across the interface. These products are the NEXRAD coverage map, Layer Composite Reflectivity Mosaic (Low Layer), Layer Composite Reflectivity Mosaic (High Layer), Layer Composite Reflectivity Mosaic (Super High Layer) and Composite Reflectivity Mosaic. The NEXRAD Coverage Map defines which grid cells within each block in the NAS plane are covered by one or more NEXRADs that provide coverage to an area fail. The Composite Reflectivity Mosaic is a mosaic of the NEXRAD’s composite reflectivity product. The composite reflectivity product includes all reflectivity data detected between 0 and 60000 feet. The Layer Composite Reflectivity Mosaic is a mosaic of the NEXRAD’s layer composite reflectivity product. There are three layer composite reflectivity mosaics; one for each layer composite reflectivity product. The low layer product includes reflectivity data detected between 0 and 24000 feet. The high layer product includes reflectivity detected between 24000 and 33000 feet. The super high layer product includes reflectivity data detected between 33000 and 60000 feet. 5.3 Integrated Terminal Weather System (ITWS) The Integrated Terminal Weather System (ITWS) provides information on weather hazards such as microbursts, wind shear, lightning and tornadoes to local controllers in
the tower cab and controllers at the TRACON, ARTCC and ATCSCC. ITWS also provides terminal area precipitation and winds to aid in spacing aircraft. 5.3.1 ITWS Inputs ITWS has a standalone graphics display and alphanumeric ribbon display and uses data from the RUC-2, MDCRS (winds measured on commercial aircraft in flight), TDWR, WSR-88D, ASR-9, Low Level Windshear Alert System (LLWAS), National Lightning Detection Network (NLDN), Automated Surface Observing System (ASOS) and Automated Weather Observing System (AWOS). ASOS, AWOS and NLDN data are collected by and received from the AWOS Data Acquisition System (ADAS). The ITWS is presently being tested operationally. 5.3.2 ITWS Fielding Currently, there are four prototype ITWSs in operation. These are located at New York City, Dallas/Ft. Worth, Orlando and Memphis. The first production system is scheduled to be operational in 2002. Eventually, thirty-four systems will be operational at sites where TDWRs are in use. 5.3.3 ITWS Hardware ITWS prototypes presently display their weather information on Sun workstations. In the future (> 2 years), ITWS information will appear unchanged on Standard Terminal Automation Replacement System (STARS) workstations. ITWS has two external users ports. Only one of these ports provides the ITWS Fine Analysis Grid Product and Coarse Analysis Grid Product. These grid products are products of the ITWS Terminal Winds product. CTAS will likely interface with the ITWS and use these grids in the future. 5.3.4 ITWS Grid Analysis 5.3.4.1 ITWS Coarse Grid Analysis The ITWS Coarse Analysis Grid Product is derived from the current 40-km resolution RUC-2 one-hour forecast. It is updated approximately once every 30 minutes using Doppler radar (WSR-88D, TDWR) radial velocities along with aircraft wind data from (MDCRS) and ground anemometer data (LLWAS, ASOS and AWOS). The Coarse Analysis Grid Product covers a region TRACON + 30 nm in the horizontal and extends vertically to 100 mb (approximately 50,000 feet). The vertical resolution is 25 mb. 5.3.4.2 ITWS Fine Grid Analysis The Fine Analysis Grid Product is derived from the Coarse Analysis Grid Product. It is updated approximately once every five minutes with radial velocity data from the WSR-88D and TDWR. It is also updated with ASOS, AWOS and LLWAS winds, and aircraft measured winds from the MDCRS. The Fine Analysis Grid Product has a resolution of
two-km. This resolution is possible since the radar radial velocities are collected at a resolution of 150-250 meters (m) in range and about one degree in azimuth. The Fine Analysis Grid Product covers the TRACON in the horizontal and extends upward to 400 mb (approximately 23,000 feet). The vertical resolution is 25 mb. 5.4 Dynamic Ocean Track System (DOTS) 5.4.1 DOTS Function The Dynamic Ocean Track System (DOTS) provides an oceanic traffic management system that uses automated information gathering, and route development and analysis tools. DOTS uses workstation technology to generate flexible tracks, provide traffic advisories, and display aircraft positions using high resolution graphics to emphasize parameters affecting airspace management. Its goal is to provide oceanic traffic managers with the capability to improve fuel and time efficiencies in oceanic airspace. The DOTS approach is to compute and distribute oceanic tracks twice a day that flex with changing wind patterns while reflecting separation standards. In addition, airspace availability advisories are provided to each aircraft, with consideration of current and projected traffic congestion and updated winds. Tracks generated by DOTS provide the laterally separated route structure required to reduce controller workload. DOTS provides two functionalities, Track Generation and Traffic Display. Track Generation function uses forecast aviation weather, user operation, and site specific Air Traffic Control (ATC) flow requirements to compute a structured system of routes that allow the most efficient use of oceanic airspace. The resulting tracks take into consideration the varying separation requirements found in oceanic airspace. Traffic Management Unit specialist may interact with the track generation system to include specialized traffic requirements. A Traffic Display function accepts data from various aircraft flight data sources, as it monitors and projects aircraft progress entering and proceeding through oceanic airspace. The display of current and projected aircraft positions provides traffic management with the ability to plan the flow of oceanic traffic hours in advance. A key element is the validation and verification of aircraft position data. The system updates wind and temperature forecasts automatically by including current pilot reports (PIREP). These are then used in combination with flight plan data to project aircraft positions. All positions calculated from these data are compared with reported estimates to identify and automatically report differences. 5.4.2 DOTS Fielding DOTS was implemented at the Oakland, New York and Anchorage Air Route Traffic Control Centers (ARTCCs), which control oceanic air traffic in international airspace. DOTS is also installed at the Air Traffic Control System Command Center (ATCSCC).

5.4.3 DOTS Inputs The Dynamic Ocean Track System (DOTS) currently receives NCEP’s Aviation forecast model (AVN). AVN data flow from NCEP to the NWSTG to the FAATSAT. A vendor, Kavourus, takes the data from the satellite and provides it to DOTS. In the interim, DOTS will receive data from WARP. WARP will replace the vendor as a supplier of AVN data. Eventually, DOTS will take the data directly from FAATSAT. DOTS also receives pilot reports (PIREP). 5.4 Enhanced Traffic Management System (ETMS) The Enhanced Traffic Management System (ETMS) is used to predict, on national and local scales, traffic surges, gaps, and volume based on current and anticipated airborne aircraft. Traffic Management Specialists evaluate the projected flow of traffic into airports and sectors, and implement the least restrictive action necessary to ensure that traffic demand does not exceed system capacity. Monitor Alert, a part of ETMS, analyzes traffic demand for all airports, sectors, and airborne reporting fixes in the continental United States, then automatically displays an alert when demand is predicted to exceed capacity in a particular area. 6.0 Flow of Weather Data 6.1 Data Flow from the NWS to and through FAA NAS Subsystems Figure 1 shows the flow of NWS data (RUC-2 and MDCRS) to and through the FAA NAS subsystems. The figure includes currently operational systems (WARP, ASR-9, NEXRAD, Terminal Doppler Weather Radar (TDWR), National Weather Service Telecommunications Gateway (NWSTG) and FAA Bulk Weather Telecommunications Gateway (FBWTG)) and future systems (Integrated Terminal Weather System (ITWS), FAA Telecommunications Satellite (FAATSAT) and Center-TRACON Automation System (CTAS)). Also shown is the proposed flow of data to the NexGen TGF. The FBWTG receives data from the NWSTG. ITWS will interface directly with FBWTG, whereas WARP receives data via the FAATSAT. NextGen TGF may receive data from WARP WINS for the enroute area and the Fine Analysis Grid Product and Coarse Analysis Grid Product from ITWS for the terminal area. CTAS will receive data from WARP WINS for the enroute area and may also receive the Fine Analysis Grid Product and Coarse Analysis Grid Product for the terminal area from ITWS. URET/CCLD receives data from WARP WINS. 6.2 NWS Data Flow to and from ITWS Figure 2 depicts ITWS and its associated systems and the weather data flow to and from these systems. ITWS receives data directly from three radars: NEXRAD, ASR-9 and TDWR. It also receives aircraft data from MDCRS and the RUC-2 forecast model. The MDCRS data and RUC-2 data are received from the NWS through the FBWTG. ITWS also obtains surface winds from ASOS, AWOS and LLWAS via ADAS.

6.3 NWS Data Flow to WARP and ITWS Figure 3 shows the flow of MDCRS and RUC-2 data from the NWSTG to FBWTG. ITWS obtains MDCRS and RUC-2 data from the FBWTG. WARP receives RUC-2 data via the FAATSAT. 6.4 Flow of NWS Data and FAA Products to and from WARP Figure 4 depicts the flow of NWS RUC-2 and MDCRS data to WARP. WARP receives NEXRAD Products directly from the NEXRAD. The Next Gen TGF and CTAS may receive RUC-2 data for the enroute region from WARP and ITWS for the terminal area. URET/CCLD currently receives RUC-2 data for the enroute region. DSR obtains NEXRAD mosaics from WARP. 7.0 NextGen Atmospheric JAVA Classes The NextGen JAVA Atmosphere Model incorporates two submodels. These are: AtmModel (pressure/temperature) and WindModel. 7.1 NextGen AtmModel The AtmModel has a concrete implementation, StndDayAtm (additional types such as RUC-2 can be developed and added). The Atm Models provide LocalAtm (local air pressure and temperature) for a specific position so an aircraft can determine its drag, speed and other performance characteristics. 7.2 NextGen WindModel WindModel types are NoWind and UniformWind (again, additional types can be developed and added). The WindModels provide LocalWind (local windspeed for a specific position so an aircraft can determine ground speed. Given current wind requirements for the WindModel, the JAVA classes may only require minor modifications in order to include RUC-2 and other model types. 8.0 Aircraft Dynamics Model (ADM) and the Standard Day Atmosphere The Aircraft Dynamics Model (ADM) for NextGen uses a model of the atmosphere to compute the dynamics of the aircraft and to propagate the aircraft over the earth. The ADM is independent of the atmosphere model used. (NextGen may use a model of the standard atmosphere or more complex models involving real time data such as the RUC-2 model, AVN model or ITWS terminal winds). The aircraft state vector within the ADM consists of the true airspeed, the flight path angle and the altitude. The ADM passes the position of the aircraft (i.e., latitude,
9.0 RUC-2 and ITWS Interfaces to TGF
longitude and altitude) to the atmosphere and gets the local temperature, density, pressure and winds. These are used to compute the time derivative of the state vector (airspeed rate, flight path angle rate and altitude rate). The time derivative of the state vector is used to calculate the state vector in the next time step. The ADM now knows the motion of the aircraft through the airmass. The motion of the airmass over the earth is the local winds already obtained and so the motion of the aircraft over the earth is known. The ADM calculates the position of the aircraft in the new time step and the process repeats.
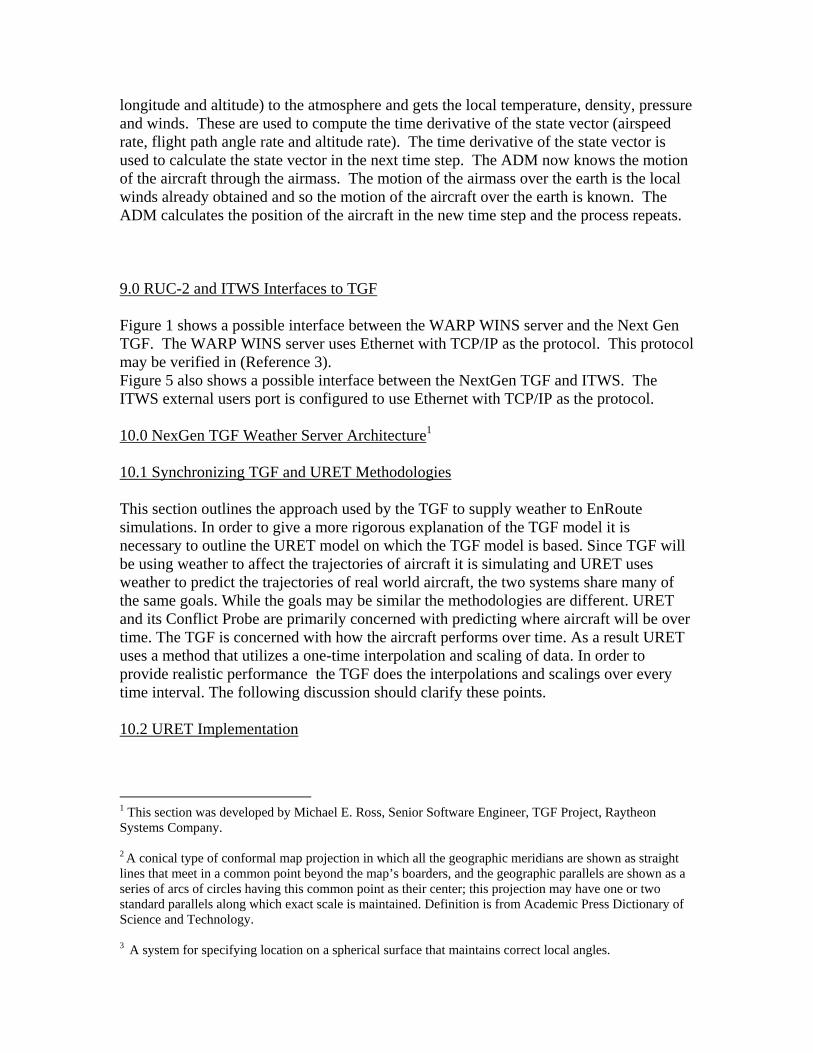
Figure 1 shows a possible interface between the WARP WINS server and the Next Gen TGF. The WARP WINS server uses Ethernet with TCP/IP as the protocol. This protocol may be verified in (Reference 3). Figure 5 also shows a possible interface between the NextGen TGF and ITWS. The ITWS external users port is configured to use Ethernet with TCP/IP as the protocol. 10.0 NexGen TGF Weather Server Architecture1
10.1 Synchronizing TGF and URET Methodologies This section outlines the approach used by the TGF to supply weather to EnRoute simulations. In order to give a more rigorous explanation of the TGF model it is necessary to outline the URET model on which the TGF model is based. Since TGF will be using weather to affect the trajectories of aircraft it is simulating and URET uses weather to predict the trajectories of real world aircraft, the two systems share many of the same goals. While the goals may be similar the methodologies are different. URET and its Conflict Probe are primarily concerned with predicting where aircraft will be over time. The TGF is concerned with how the aircraft performs over time. As a result URET uses a method that utilizes a one-time interpolation and scaling of data. In order to provide realistic performance the TGF does the interpolations and scalings over every time interval. The following discussion should clarify these points. 10.2 URET Implementation
1 This section was developed by Michael E. Ross, Senior Software Engineer, TGF Project, Raytheon Systems Company. 2 A conical type of conformal map projection in which all the geographic meridians are shown as straight lines that meet in a common point beyond the map’s boarders, and the geographic parallels are shown as a series of arcs of circles having this common point as their center; this projection may have one or two standard parallels along which exact scale is maintained. Definition is from Academic Press Dictionary of Science and Technology. 3 A system for specifying location on a spherical surface that maintains correct local angles.

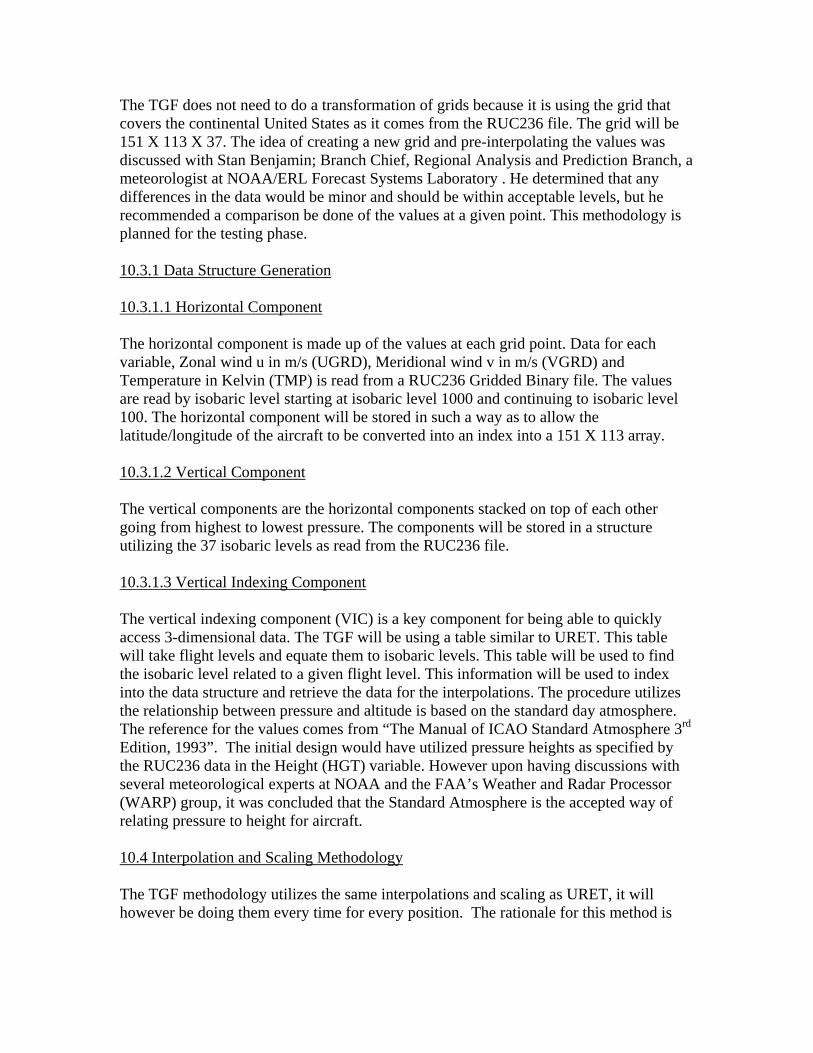
This is a brief synopsis of how the URET tool uses the RUC236 data. It is being presented to serve as a comparison as to how the TGF uses the RUC236 data. For the full explanation see “USER REQUEST EVALUATION TOOL (URET) CORE CAPABILITY LIMITED DEPLOYEMENT (CCLD)” by Lockheed Martin Corporation. 10.2.1 Horizontal transformation 10.2.1.1 Construct horizontal grid The RUC236 is a Lambert Conformal2 grid with a 40km grid mesh. This grid is to be projected onto a uniform mesh Conformal Spherical3 grid. The process is to build a grid that covers the desired area. This will usually be an Air Route Traffic Control Center (ARTCC) boundary as defined by NAS adaptation information plus a 400 nm buffer. As a result of the transformation from Lambert Conformal to Spherical Coordinates the new grid’s latitude/longitude points will not be of a uniform mesh. In order for URET’s trajectory generation software to work properly, the grid must be of a uniform mesh. Therefore the grid must go through another conversion process to make it of uniform mesh. At this point a new grid with a uniform mesh has been built for the desired area. The next step will be to use these new points as indices into the Lambert grid and extract the data. 10.2.1.2 Transfer from Lambert to Spherical Now that the grid points are know then the latitude/longitude of these points are used to index into the Lambert grid. This will result in a point that is not directly in the grid. A bilinear interpolation of the surrounding four points (figure 1) is performed to arrive at the data point. This point is then inserted into the new grid. If the data point is a vector such as wind, it must be scaled after each interpolation. This method is followed for each grid point and for each of the 37 isobaric levels. 10.2.1.3 Wind rotation The wind directions are then rotated from their Lambert Conformal Conic X and Y direction to local north and east. 10.2.1.4 Vertical shift from Pressure Levels to Flight Levels URET then does a one-dimensional linear interpolation to shift values from 37 isobaric levels to 60 flight levels. To do the shift a table based on the Standard Day Atmosphere as specified in “The Manual Of ICAO Standard Atmosphere 3rd Edition 1992” is used. This table relates pressure levels to flight levels and specifies interpolation values. For further details reference the URET document. 10.3 Target Generation Facility (TGF) Implementation
The TGF does not need to do a transformation of grids because it is using the grid that covers the continental United States as it comes from the RUC236 file. The grid will be 151 X 113 X 37. The idea of creating a new grid and pre-interpolating the values was discussed with Stan Benjamin; Branch Chief, Regional Analysis and Prediction Branch, a meteorologist at NOAA/ERL Forecast Systems Laboratory . He determined that any differences in the data would be minor and should be within acceptable levels, but he recommended a comparison be done of the values at a given point. This methodology is planned for the testing phase.
10.3.1 Data Structure Generation 10.3.1.1 Horizontal Component The horizontal component is made up of the values at each grid point. Data for each variable, Zonal wind u in m/s (UGRD), Meridional wind v in m/s (VGRD) and Temperature in Kelvin (TMP) is read from a RUC236 Gridded Binary file. The values are read by isobaric level starting at isobaric level 1000 and continuing to isobaric level 100. The horizontal component will be stored in such a way as to allow the latitude/longitude of the aircraft to be converted into an index into a 151 X 113 array. 10.3.1.2 Vertical Component The vertical components are the horizontal components stacked on top of each other going from highest to lowest pressure. The components will be stored in a structure utilizing the 37 isobaric levels as read from the RUC236 file. 10.3.1.3 Vertical Indexing Component The vertical indexing component (VIC) is a key component for being able to quickly access 3-dimensional data. The TGF will be using a table similar to URET. This table will take flight levels and equate them to isobaric levels. This table will be used to find the isobaric level related to a given flight level. This information will be used to index into the data structure and retrieve the data for the interpolations. The procedure utilizes the relationship between pressure and altitude is based on the standard day atmosphere. The reference for the values comes from “The Manual of ICAO Standard Atmosphere 3rd Edition, 1993”. The initial design would have utilized pressure heights as specified by the RUC236 data in the Height (HGT) variable. However upon having discussions with several meteorological experts at NOAA and the FAA’s Weather and Radar Processor (WARP) group, it was concluded that the Standard Atmosphere is the accepted way of relating pressure to height for aircraft. 10.4 Interpolation and Scaling Methodology The TGF methodology utilizes the same interpolations and scaling as URET, it will however be doing them every time for every position. The rationale for this method is

based on the desire to have gradual transition between grid points rather then and abrupt change. 10.4.1 The TGF procedure for obtaining weather from the RUC236 Gridded Binary weather data is imported into the TGF’s Ruc236 data structure from a National Weather Service supplied RUC236 weather file. Weather is requested based on Position; latitude, longitude and altitude. Position is used to build an index for the desired weather. This index is used to obtain eight other indices for a bilinear interpolation The first four indices are for grid points that encompass the requested Position.
The next four indices are for grid points of the isobaric level immediately above the desired one. For example; if the VIC determined that the altitude of the desired position converts to a pressure of 675 hPa, then the level immediately above would be 700 hPa. See figure 6. Use the indices to obtain the required data from the structure. Do a bilinear interpolation for the returned data. Note if the data item is a wind component it will have to be scaled after each interpolation. The bilinear interpolations result in two separate horizontal components, one at desired pressure level and one immediately above it. These two horizontal components must now be interpolated vertically. A one-dimensional linear interpolation is used for this. The VIC can be used to obtain a interpolation factor. Note, again if this is a vector component it will have to be scaled. The weather data is returned to its requester. It should be noted that for every variable there will be a total of three interpolations, if the variable is a vector, such as wind, then after each interpolation the interpolated value must be scaled. 11.0 Figures The figures( 1-4 ) in this section show the flow of weather data from the National Weather Service to NAS Subsystems that use weather data

ITWS
FAATSAT WARP SERVER WINS
URET/CCLD
FBWTGNWSTG
WSR-88D(NEXRAD)
TDWR
RUC,MDCRS
RUC,MDCRS
RUC(Enroute)
WSR-88D(NEXRAD)
WARP
NEXTGENTGF
(Terminal &Enroute)
DSRCTAS
ASR-9
Fine Analysis Grid Product, Coarse Analysis Grid Product (Terminal)
WSR-88DMOSAICS
FIG. 1 FLOW OF NWS DATA TO FAA NAS SUBSYSTEMS
RUC(Enroute)
To NEXTGEN TGF
FromITWS
RUC RUC RUC
ASR-9 data
TDWR Products
NEXRAD Products NEXRAD
Products
ETMSDOTS
RUC
ASOS,AWOS,LLWAS
Surface data

ITW SW SR -88D
(N E X RA D )
TD W R R U C ,M D C R S
A S R -9
F ine A nalysis G rid P roduct, C o ar se A nalysis G rid P roduct (T er minal)
To N E X TGE N TGF , C TAS
F rom F BW TG
FIG . 2 FLO W O F D A T A T O A N D FR O M IT W S
T D W R Pro du cts
N E X R AD Pro du cts
ASR -9 D ata
A S OS,A W O S,LLW A S
Surface d ata

FAATSATFBWTGNWSTG
RUC,MDCRS
RUC,MDCRS
To WARP
FIG. 3 FLOW OF NWS DATA TO WARP AND ITWS
To ITWS
RUC RUC

WARP SERVER WINS
URET/CCLD
RUC,MDCRS
RUC(Enroute)
WSR-88D(NEXRAD)
WARP
NEXTGENTGF
(Terminal &Enroute)
DSRCTAS
WSR-88DMOSAICS
FIG. 4 FLOW OF NWS DATA AND FAA PRODUCTS TO AND FROM WARP AND OTHER NAS SUBSYSTEMS
RUC(Enroute)
From FAATSAT
FromITWS
From ITWS
NEXRAD Products
RUC
ETMS
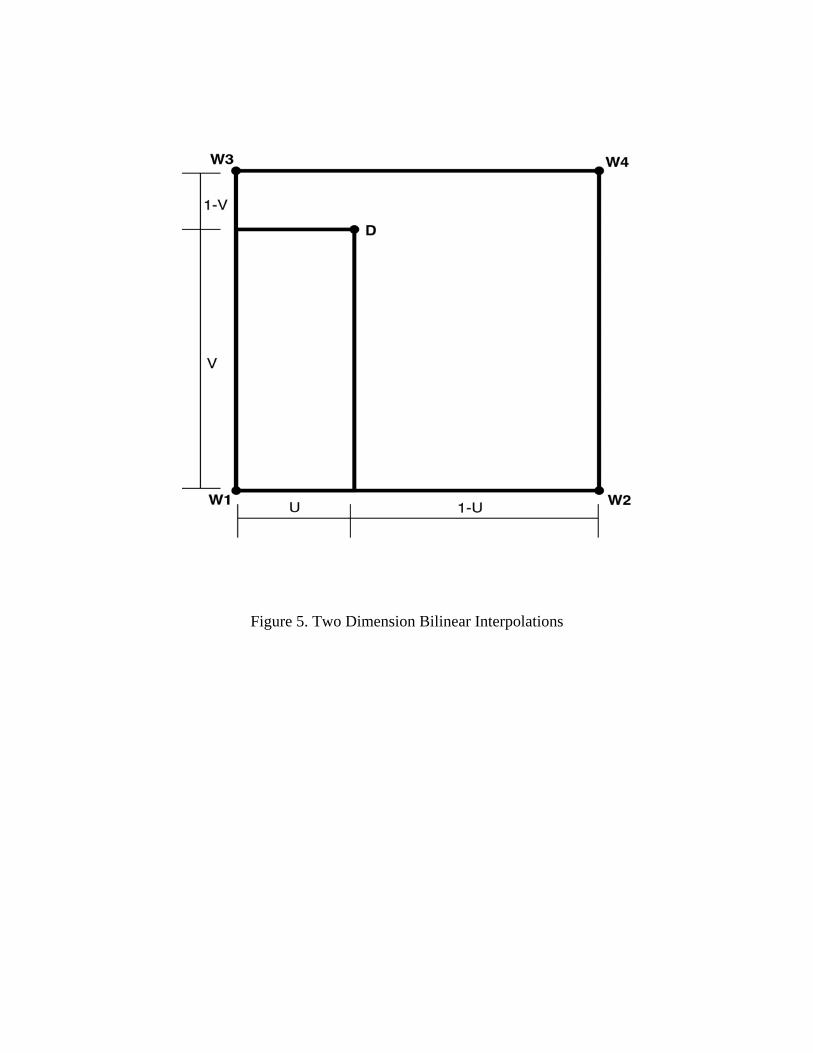
Figure 5. Two Dimension Bilinear Interpolations
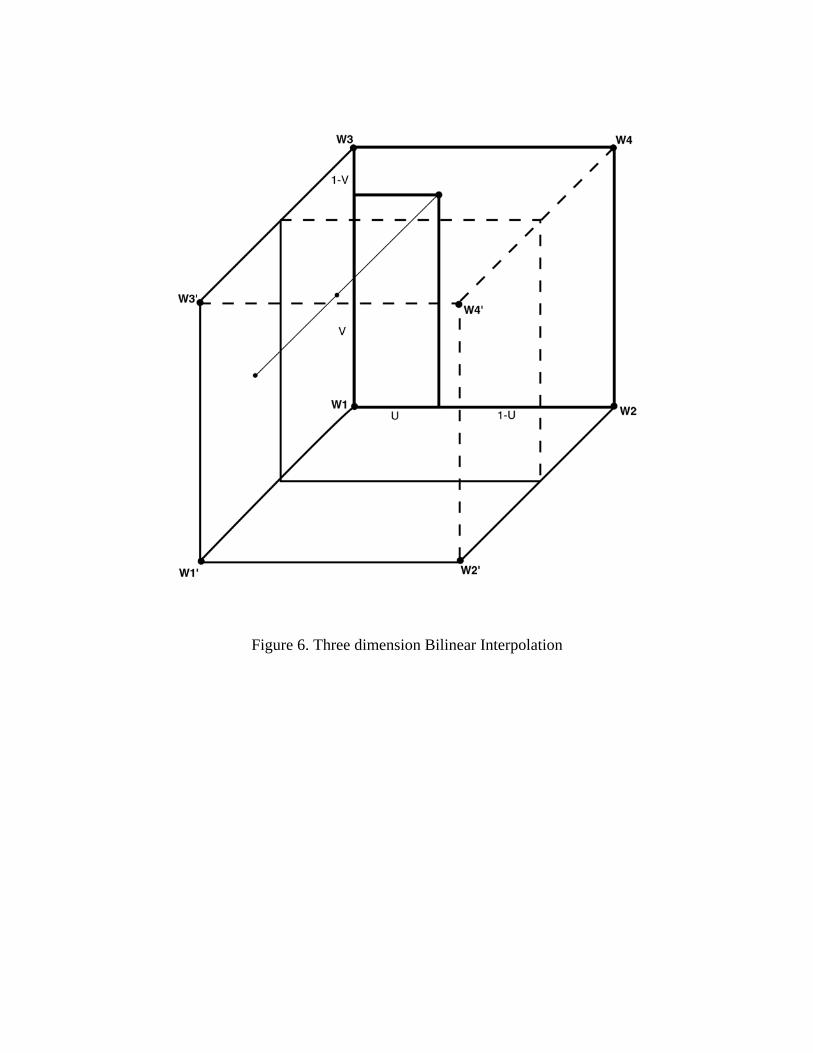
Figure 6. Three dimension Bilinear Interpolation

12.0 References 1. GRIB: The WMO Format for the Storage of Weather Product Information and the Exchange of Weather Product Messages in Gridded Binary Form as Used by NCEP Central Operations. National Weather Service, National Centers for Environmental Prediction, Office Note 388, October 12, 2001. This document is available on this server: ftp://ftp.ncep.noaa.gov/pub/nws/nmc/docs/gribed1 2. Directory and File Naming Standards for FTP Servers. National Weather Service, Version November 2001. 3. Weather and Radar Processor (WARP) Interface Design Document (IDD) WINS to URET/CCLD. Harris Corporation, FAA Contract Number DTFA01-96-C00036, Document Number 7007548, 10 April 2000. 4. User Request Evaluation Tool (URET) Core Capability Limited Deployment (CCLD), By Lockheed Martian Corporation. 13.0 Contacts RUC-2 - Stan Benjamin, Forecast Systems Laboratory (FSL), Boulder, CO Steve Gilbert, National Weather Service, National Centers for Environmental Prediction, (301) 763-8000 x7585 GRIB - Steve Gilbert, National Weather Service, National Centers for Environmental Prediction, (301) 763-8000 x7585 URET/CCLD - Hollis Ryan, Signal Corporation, x6743 Robert Oaks, FAA ACB-330, x6175 Cockpit Simulation - George Bollenbach, FAA ACB-860 x6061 CTAS - Michael Paglione, FAA ACB-330, x7926 DOTS – Steve Holiday, FAA, (202) 493-0479 ETMS - ITWS - Thomas Weiss, FAA ACB-630, x6898 Steve Vivieros, FAA ACB-630, x7101 RCS - Pochelo Bravo, FAA ACB-860 x6760

The ADAS collects weather data from AWOS systems, processes the data, and disseminates it to the WARP and externally into the FAA and NWS weather networks. ADAS is located at the 23 ACFs. A single ADAS can collect current weather data in AWOS format from a maximum of 137 AWOS sites. The AWOS systems include the non-federal and federally funded commercial AWOS systems, ASOS, NWS, and the Department of Defense's Automated Observation System.
WARP- Matthew Printy, UAL (ACB-630), x4698
ACRONYMS
ADAS- Automated Weather Observing System Data Acquisition System (ADAS)
ADM- Aircraft Dynamics Model AFGWC- Air Force Global Weather Central ASOS- Automated Surface Observing System An FAA automated system that collects meteorological data (surface winds, pressure, temperature, rainfall, etc). ATC- Air Traffic Control ATCSCC- Air Traffic Control System Command Center AVN- Aviation Forecast Model A forecast model generated by the NWS NCEP. AWOS- Automated Weather Observing System An NWS automated system that collects meteorological data (surface winds, pressure, temperature, rainfall, etc). CTAS – Center-TRACON Automation System Set of tools for managing air traffic flows at large airports. Consists of Traffic Management Advisor (TMA), Descent Advisor (DA) and Final Approach Spacing Tool (FAST). DOTS – Dynamic Ocean Track System The Dynamic Ocean Track System (DOTS) currently receives NCEP’s Aviation forecast model (AVN). AVN data flow from NCEP to the NWSTG to the FAATSAT. Presently, a vendor, Kavourus, takes the data from the satellite, processes it, and provides it to

FBWTG – FAA Bulk Weather Telecommunications Gateway
DOTS. It is planned that DOTS will receive data directly from WARP (WARP will replace the vendor). Eventually, DOTS will take the data directly from FAATSAT. DSR – Display System Replacement Receives WSR-88D mosaics from the local WARP. Displays radar reflectivity mosaics directly to controllers. Also receives data from the long-range radar. Provides a visual representation of aircraft location with URET/CCLD functionality. FAATSAT – FAA Telecommunications Satellite
Receives data files from the NWSTG and disseminates these files via FAATSAT to individual WARPs and ITWSs. The files contain RUC-2 data in GRIB format, and MDCRS data. GRIB – Gridded Binary (Format) Format for RUC-2 forecast model data and other data from the NWS. ICD – Interface Control Document IDD – Interface Design Document ITWS – Integrated Terminal Weather System Provides information on weather hazards such as microbursts and wind shear to local controllers in the tower cab and controllers in the TRACON, ARTCC and ATCSCC. ITWS also provides precipitation and terminal winds to aid in spacing aircraft. Has a standalone graphics display and alphanumeric ribbon display. Uses data from the TDWR, WSR-88D, ASR-9, RUC-2, LLWAS, and ASOS and AWOS (via ADAS). This information appears on Sun workstations, Currently, there are four prototype ITWSs in operation at New York City, Dallas/Ft. Worth, Orlando and Memphis. The first production system is schedule to be operational in September 2001. Eventually, thirty-four systems will be operational at sites where there are TDWRs. In the future (> 2 years), ITWS information will appear on STARS workstations. ITWS has an external users port that may provide its Fine Analysis Grid Product and Coarse Analysis Grid Product to CTAS. LLWAS- Low Level Windshear Alert System System of anemometers sited at airports to measure winds and detect wind shear. MDCRS- Meteorological Data Collection and Reporting System Collects and provides metrological data (pressure, temperature, wind) measured by aircraft in flight. Provides fine scale information the ITWS needs to generate the Fine Analysis Grid Product. mb- millibar Metric unit of atmospheric pressure.

NAS –National Airspace System NCEP- National Centers for Environmental Prediction A division of the National Weather Service. Provides national and international guidance and forecast products domestically and internationally. nm – nautical mile NEXRAD – Next Generation Weather Radar Same as WSR-88D. NextGen TGF- Next Generation Target Generation Facility NLDN – National Lightning Detection Network NWS – National Weather Service NWSTG – National Weather Service Telecommunications Gateway Acquires and processes weather data (MDCRS, profiler). Provides data files of forecast model products (RUC-2 and AVN) to the FBWTG. OT&E- Operational Test and Evaluation RCS- Reconfigured Cockpit Simulator RUC-2 – Rapid Update Cycle A forecast model generated by the NWS. Presently covers the 48 states. Has a three-dimensional grid with 40 km horizontal resolution. Vertical resolution has 40 levels measured in pressure coordinates in 25mb increments. Inputs to the model are rawinsonde, aircraft (MDCRS), profiler and surface data. STARS- Standard Terminal Automation Replacement System TDWR- Terminal Doppler Weather Radar Provides microburst, wind shear and precipitation information for the terminal area on a standalone display. Display will be replaced with the ITWS display when ITWS is deployed. ITWS uses the TDWR and its display as a backup when ITWS is unavailable. Provides fine scale information the ITWS needs to generate the Fine Analysis Grid Product. TRACON- Terminal Radar Approach Control URET/CCLD – User Request Evaluation Tool/Core Capability Limited Deployment The User Request Evaluation Tool/Core Capability Limited Deployment (URET/CCLD) is a functionality of the DSR. URET/CCLD is a software tool that provides a visual representation of aircraft in flight and gives controllers a 20-minute look-ahead capability

WINS – Weather Information Network Server
to detect potential conflicts with aircraft and airspace. URET/CCLD uses RUC-2 data to affect the predicted motion of aircraft. Will initially be deployed at seven ARTCCs: Cleveland, Indianapolis, Memphis, Chicago, Kansas City and Washington, DC. WARP – Weather and Radar Processor WARP is a NAS subsystem that integrates data from WSR-88Ds throughout the country and generates regional and national mosaics of radar reflectivity and precipitation for the enroute area. These products are provided to the DSR. Also receives and distributes NWS forecasts model data as well as satellite and long-range radar data.
WINS is a part of WARP that provides RUC-2 data to URET/CCLD. May also provide RUC-2 data to CTAS, ETMS and NextGen TGF. May provide AVN data to DOTS. WMO- World Meteorological Organization WSR-88D – Weather Surveillance Radar-88 Doppler Also known as Next Generation Weather Radar (NEXRAD). This is the primary NWS radar for observation of weather. There are approximately 180 WSR-88Ds in use throughout the United States. The WSR-88D has three basic types of data: reflectivity, radial velocity and spectrum width. Precipitation products including radar mosaics are derived from reflectivity data. These mosaics are generated by WARP and displayed on the DSR. ITWS also generates displays from WSR-88D data for the terminal and TRACON areas. Radial velocity data can be combined with the RUC-2 and MDCRS data to generate a much finer scale grid (2km) as is done on the ITWS terminal winds product.

Evans, J. E., 1999: Achieving Higher Integrity in NEXRAD Products Through Multi-Sensor Integration. Preprints, American Meteorological Society, Dallas, pp. .
BIBLIOGRAPHY
Cole, R. E., 1999: The Use of the Gauss-Markov Theorem in Winds Analysis. Preprints, American Meteorological Society, Dallas, pp. . NASA paper on CTAS study using terminal winds data.
Cole, R. E. and F. W. Wilson, 1994: The Integrated Terminal Weather System Terminal Winds Product. The Lincoln Laboratory Journal, Volume 7, Number 2. Luenberger, D. G., 1969: Optimization by Vector Space Methods.