a comparison of land use and land cover · pdf filedifferent land use and land cover change...
TRANSCRIPT

2002 ASPRS-ACSM Annual Conference and FIG XXII Congress April 22-26, 2002
A COMPARISON OF LAND USE AND LAND COVER CHANGE DETECTION METHODS
Daniel L. Civco1, James D. Hurd2, Emily H. Wilson3, Mingjun Song4, Zhenkui Zhang5
Laboratory for Earth Resources Information Systems
Department of Natural Resources Management & Engineering The University of Connecticut
U-4087, Room 308, 1376 Storrs Road Storrs, CT 06269-4087 860-486-2840 (phone)
860-486-5408 (fax)
ABSTRACT
The principal objective of this project was to compare the results of different land use and land cover change detection approaches: traditional post-classification cross-tabulation, cross-correlation analysis, neural networks, knowledge-based expert systems, and image segmentation and object-oriented classification. A combination of both direct T1 to T2 change detection as well as post-classification analysis was employed. The test sites, located in the Stony Brook Millstone River Watershed in New Jersey, consisted of two 5122 image blocks representative of the range of cover types and changes in the watershed. Nine land use and land cover classes were selected for analysis: Dense Urban, Residential, Turf & Grass, Agriculture, Deciduous Forest, Coniferous Forest, Water, Wetland, and Barren Land. Twenty-three possible change and no-change classes were identified. Landsat Thematic Mapper data from March 27, 1989 and September 3, 1989 represented conditions at T1 , and Landsat Enhanced Thematic Mapper data from May 4, 2000 and September 23, 1999 were used for T2. It was observed that there are merits to each of the four methods examined, and that, at this point of this research, no single approach can solve the land use change detection problem. This paper overviews the procedures used and presents some of the results of the change detection experiment.
INTRODUCTION
Advances in remote sensing science, and in our ability to analyze temporal changes in our landscape, hold great promise for putting to rest any questions of the relevancy of remote sensing to local land use decisions. This assumption was the foundation for the formation of the “NAUTILUS” (Northeast Applications of Useable Technology In Land planning for Urban Sprawl) Regional Earth Sciences Application Center (RESAC) at UConn, one of nine RESACs designated by NASA in 1999. The RESAC system was created with the goal of applying remote sensing research to pressing regional problems. In the case of the Northeast RESAC, this translated to a variety of landscape characterization techniques focused on providing information on the Northeast’s urbanizing landscape to local decision makers.
Previous and on-going efforts of NAUTILUS and NEMO (Nonpoint Education for Municipal
Officials) investigators have demonstrated that 30-meter pixel land cover data derived from Landsat
1 Associate Professor and Director, [email protected] 2 Research Assistant, [email protected] 3 Research Assistant, [email protected] 4 Graduate Research Assistant, [email protected] 5 Graduate Research Assistant, [email protected]
2002 ASPRS-ACSM Annual Conference and FIG XXII Congress April 22-26, 2002
Thematic Mapper (TM) imagery can be used for educational and planning applications at the local level. But more accurate land cover information is needed if we are to move beyond first generation impacts of educational programs and provide local end-users with information and products that can be easily and directly incorporated into land use plans and policies. These considerations are at the core of the NAUTILUS Project's research. Since a focus of this program is urban growth, it is clear that accurate land use and land cover change data are required.
Land use and land cover mapping has long been an area of research focus for UConn investigators,
having explored a wide range of alternative approaches including expert systems (Civco, 1989), neural networks (Civco, 1993; Wang and Civco, 1996), evidential reasoning (Wang and Civco, 1992), and other techniques with roots in the field of artificial intelligence (AI). Area-wide land use and land cover mapping projects (Civco and Hurd, 1999) have utilized multitemporal and multiresolution remote sensing data (Zhou and Civco, 1998). Recent efforts have addressed improved methods for LULC change detection (Hurd et al., 2001), and hierarchical image segmentation and object-oriented LULC classification. Several techniques for determining land cover change have been evaluated by NAUTILUS investigators. These have included post classification change detection (Hurd et al., 1992), multidate classification change detection, cross-correlation analysis (Hurd et al., 2001), multidate principal components analysis and RGB-NDVI color composite change detection (Hoffhine, 2000).
Computer-assisted production of spatially-detailed and thematically-accurate land use and land cover
information from satellite image data continues to be a challenge for the remote sensing research community. The problems and limitations associated with single -date land cover information extraction are compounded when attempting to produce land use change information using multitemporal data.
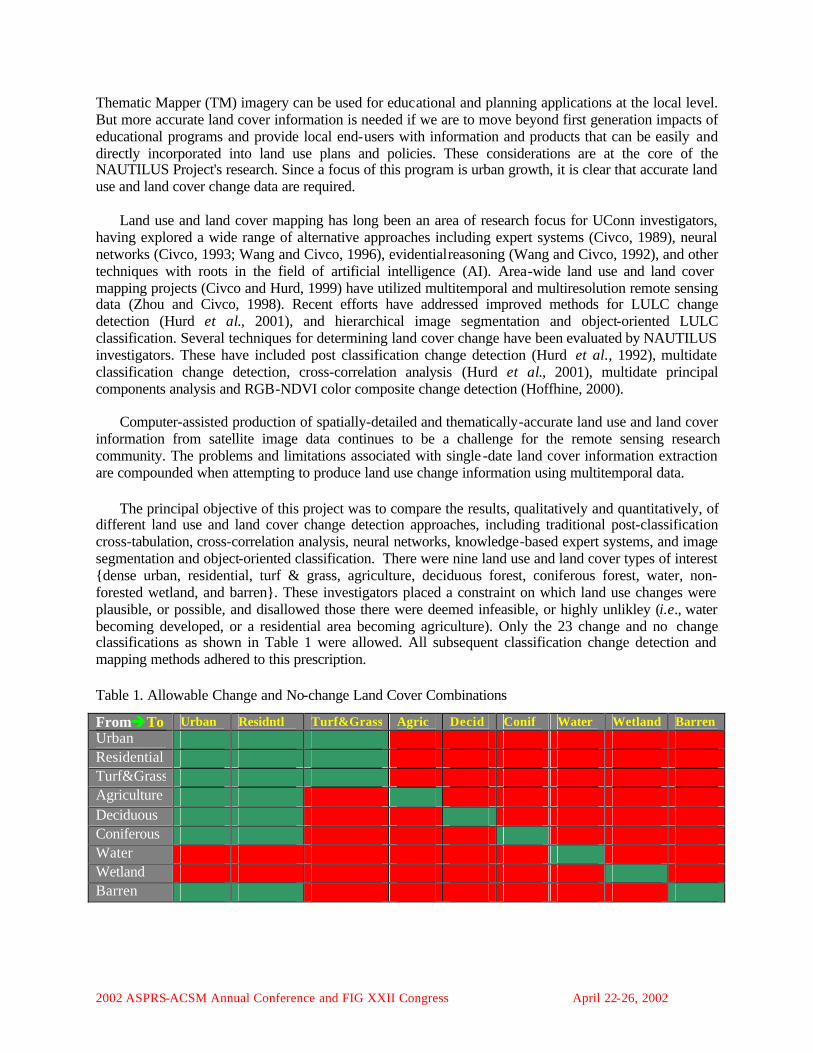
The principal objective of this project was to compare the results, qualitatively and quantitatively, of different land use and land cover change detection approaches, including traditional post-classification cross-tabulation, cross-correlation analysis, neural networks, knowledge-based expert systems, and image segmentation and object-oriented classification. There were nine land use and land cover types of interest {dense urban, residential, turf & grass, agriculture, deciduous forest, coniferous forest, water, non-forested wetland, and barren}. These investigators placed a constraint on which land use changes were plausible, or possible, and disallowed those there were deemed infeasible, or highly unlikley (i.e., water becoming developed, or a residential area becoming agriculture). Only the 23 change and no change classifications as shown in Table 1 were allowed. All subsequent classification change detection and mapping methods adhered to this prescription.
Table 1. Allowable Change and No-change Land Cover Combinations
FromèTo Urban Residntl Turf&Grass Agric Decid Conif Water Wetland Barren Urban Residential Turf&Grass Agriculture Deciduous Coniferous Water Wetland Barren
2002 ASPRS-ACSM Annual Conference and FIG XXII Congress April 22-26, 2002
METHODS
Study Area
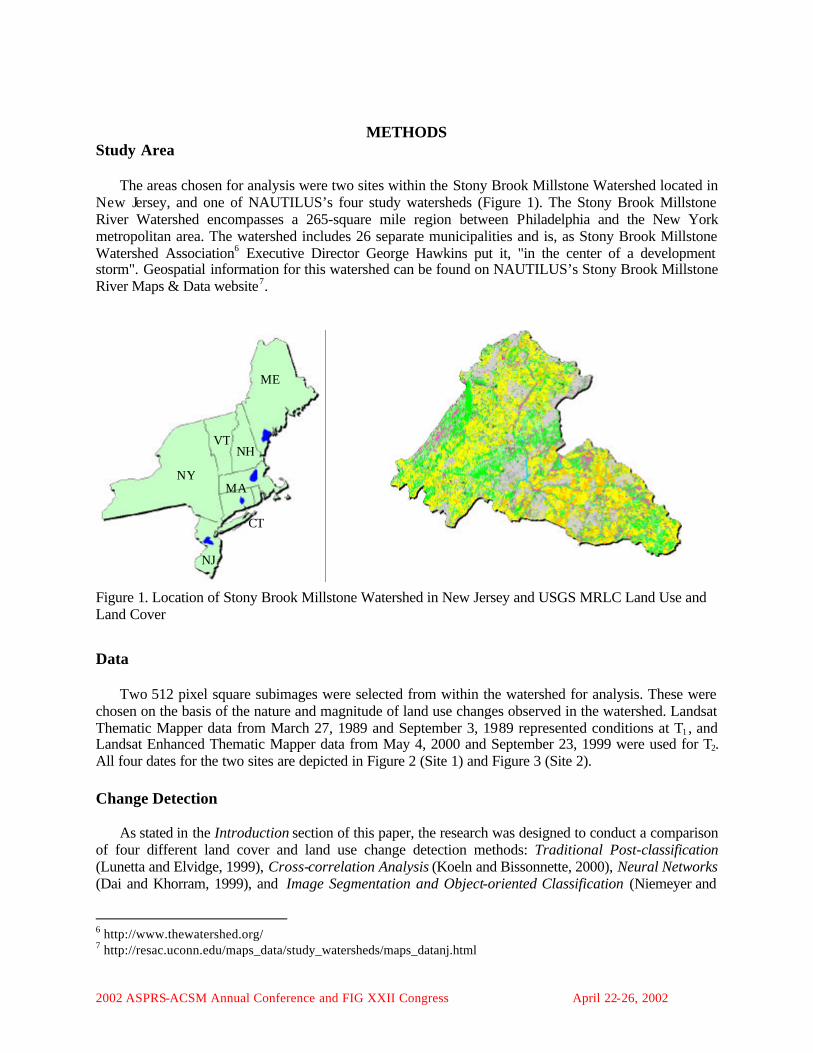
The areas chosen for analysis were two sites within the Stony Brook Millstone Watershed located in New Jersey, and one of NAUTILUS’s four study watersheds (Figure 1). The Stony Brook Millstone River Watershed encompasses a 265-square mile region between Philadelphia and the New York metropolitan area. The watershed includes 26 separate municipalities and is, as Stony Brook Millstone Watershed Association6 Executive Director George Hawkins put it, "in the center of a development storm". Geospatial information for this watershed can be found on NAUTILUS’s Stony Brook Millstone River Maps & Data website7.
Figure 1. Location of Stony Brook Millstone Watershed in New Jersey and USGS MRLC Land Use and Land Cover
Data
Two 512 pixel square subimages were selected from within the watershed for analysis. These were chosen on the basis of the nature and magnitude of land use changes observed in the watershed. Landsat Thematic Mapper data from March 27, 1989 and September 3, 1989 represented conditions at T1 , and Landsat Enhanced Thematic Mapper data from May 4, 2000 and September 23, 1999 were used for T2. All four dates for the two sites are depicted in Figure 2 (Site 1) and Figure 3 (Site 2). Change Detection
As stated in the Introduction section of this paper, the research was designed to conduct a comparison of four different land cover and land use change detection methods: Traditional Post-classification (Lunetta and Elvidge, 1999), Cross-correlation Analysis (Koeln and Bissonnette, 2000), Neural Networks (Dai and Khorram, 1999), and Image Segmentation and Object-oriented Classification (Niemeyer and
6 http://www.thewatershed.org/ 7 http://resac.uconn.edu/maps_data/study_watersheds/maps_datanj.html
NJ
NY
VT
MA
CT
NH
ME
2002 ASPRS-ACSM Annual Conference and FIG XXII Congress April 22-26, 2002
Canty, 2001). The research design attempted to standardize, as much as each method would permit, the procedures so that results would enable a systematic, objective comparison among the methods. Due to the inherent differences among the four approaches, however, some variation in each of the methodologies was necessary. This became evident as the research progressed. Traditional Post-classification. A 14-band multiseasonal composite was created from the March 27, 1989 and September 3, 1989 Landsat TM data. Unsupervised classification using the ISODATA algorithm was applied, and 75 spectral clusters were generated, of which 47 were labeled into land cover classes and 28 were labeled as unknown. The image pixels of unknown class membership were extracted for subsequent unsupervised classification into 58 clusters, of which 33 were labeled into known classes and 25 were labeled as unknown. This process of cluster busting was iterated a third time until all areas (classes) of the image could be accounted for satisfactorily. The separate clustering and labeling results were overlain to form a single composite classification map for T1 consisting of the nine classes of interest. The same repeated clustering procedure was applied to the May 4, 2000 and September 23, 1999 ETM+ imagery to produce a final land cover classification map for T2. Cross-correlation Analysis Cross-correlation Analysis (CCA) overcomes many of the limitations of conventional change detection methods. Cross-correlation Analysis is a change detection method developed by Earthsat, Inc. and measures the differences between an existing land cover image and a recent single date multispectral image (Koeln and Bissonnette, 2000). The benefit of this technique is that it eliminates the problems associated with radiometric and phenological differences that are so readily experienced when performing change detection.
Cross-correlation works by using the class boundaries from the base land cover image to derive an expected class average spectral response. This information is used to derive a Z-statistic for each pixel falling within a given land cover type. The Z-statistic describes how close a pixel's response is to the expected spectral response of its corresponding class value in the land cover image. Pixels that have undergone change between the T1 land cover image and the T2 multispectral image will produce high Z-statistic values while pixels that have not changed will produce low Z-statistic values. The equation is:
2
1∑=
−
=n
ijkic
jkicijkr
jkZσ
µ
where,
Zjk is the Z score for a pixel of a given class i is the band number in the multispectral image n is the number of bands cjk is the thematic class being analyzed rijk is the reflectance in band i for pixels in a given class µic is the mean reflectance value in band i of all pixels in a given class σic is the standard deviation of the reflectance value in band i of all pixels in a given class

2002 ASPRS-ACSM Annual Conference and FIG XXII Congress April 22-26, 2002
Spring Summer
Figure 2. Landsat TM Imagery for Site 1. Bands 4, 5, and 3 {R, G, B, respectively}
Figure 3. Landsat ETM+ Imagery for Site 2 Bands 4, 5, and 3 {R, G, B, respectively}
1989 1989
2000 1999
Site 1
1989 1989
2000 1999
Site 2
2002 ASPRS-ACSM Annual Conference and FIG XXII Congress April 22-26, 2002
In this experiment, the classification produced from the March 27, 1989 and September 3, 1989
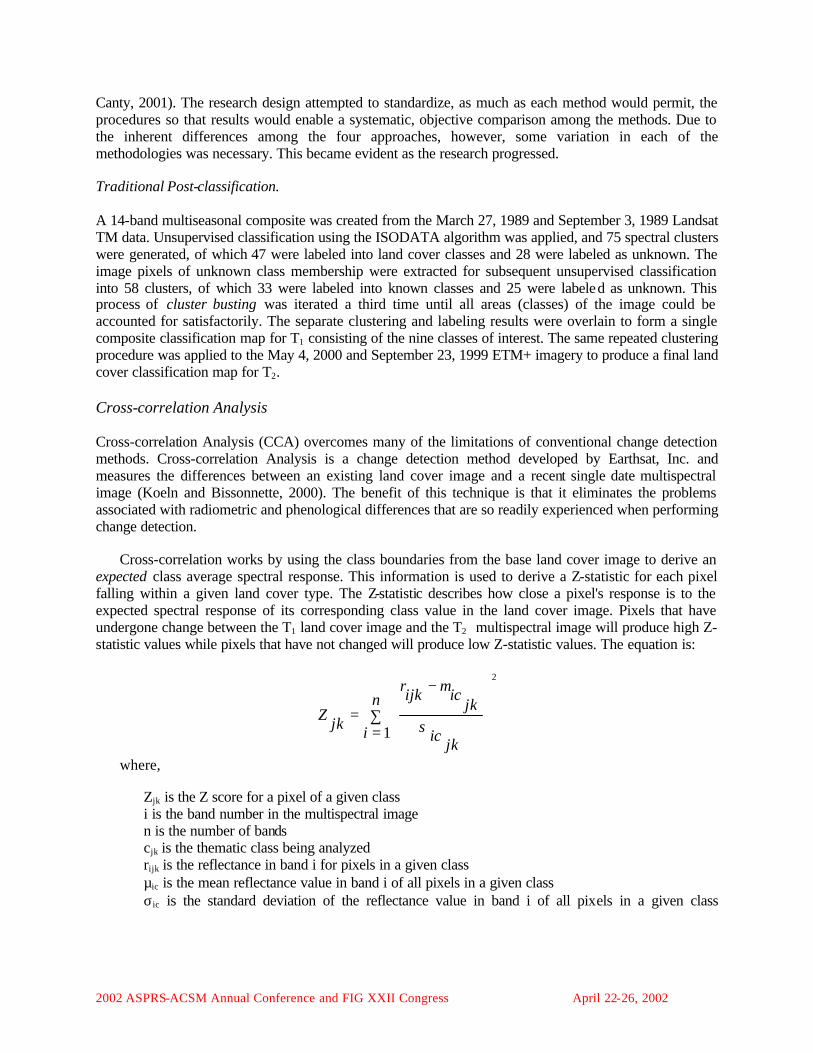
Landsat TM data served as the baseline (T1) for determining areas of change in the T2 ETM data (May 4, 2000 and September 23, 1999). Graphical models created with ERDAS Spatial Modeler were developed to perform CCA. Figure 4 is an illustration of the nature of CCA change detection. Additional detail on cross-correlation analysis is provided in Koeln and Bissonnette (2000) and Hurd et al. (2001).
(a) T1 land cover (b) T1 TM
(c) Changed forest
(d) T2 ETM (e) T2 land cover
Figure 4. Example of residential growth detection using cross-correlation analysis (from Hurd et al., 2001). Deciduous forest area in T1 (a) was used to extract the class’ spectral properties (b) and CCA applied to T2 image data (d) to detect areas of significant difference (c), which were determined through a user-defined threshold. These areas (c) were extracted and land cover for T2 was determined.
Neural Networks
Change detection was performed using a combination of tools, principally the NAUTILUS Image Processing System (NIPS) and NeuralSIM8. The former is a program developed by two of this paper’s authors and consists of a suite of tools for performing supervised training site selection, conducting classification using backpropagating neural networks, support vector machines, as well as the maximum likelihood algorithm, deriving texture metrics from Haralick’s gray level co-occurrence matrix, and several other specialized image processing functions. The latter, now known as NeuralWorks Predict® is an integrated tool for creating and deploying prediction and classification neural network applications, and operates within a Microsoft® Excel environment. NIPS was used to select training sites for each of the nine land cover classes, doing so on a pixel-by-pixel basis for each of the four dates on Landsat data. Training was performed independently for T1 and T2 imagery. The data for Sites 1 and 2 were pooled into a combined dataset, one for each time period of Landsat data. A routine in NIPS permitted the cross-combination of selected from-to change classes, as well as no change classes. Preliminary analyses revealed that the spectral heterogeneity of static and change classes was compounded by different appearances of the same land use type in different years but in the same season (e.g., a field covered by grass in spring T1 but bare soil in spring T2, causing a difference in reflectance due to phenology rather than real change). Therefore, subsequent analyses were restricted to the summertime Landsat imagery only. A total of 133 pixels was selected for the nine classes of interest from the September 3, 1989 TM imagery and 133 from the September 23, 1999 ETM imagery. NIPS cross-combined the two independent training data sets into one in which every T1 pixel’s brightness vector was paired with every T2 pixel’s brightness vector producing a dataset of 13,140 observations, each with the brightness values for summer 1989 and summer 1999. This dataset was imported into Excel and processed with NeuralSIM. The C++ code containing the parameters for the final network was compiled and executed with NIPS to produce the final classification maps in an ERDAS Imagine format. 8 NeuralWare, 230 East Main Street, Suite 200, Carnegie, PA 15106-2700, USA

2002 ASPRS-ACSM Annual Conference and FIG XXII Congress April 22-26, 2002
Image Segmentation and Object-oriented Classification
The software system named eCognition9 is based object-oriented processing and classification of remote sensing imagery. As opposed to most other pattern recognition algorithms which operate on a pixel-by-pixel basis, eCognition segments a multispectral image into homogeneous objects, or regions, based on neighboring pixels’ spectral and spatial properties. Image segmentation can be performed at different levels of resolution, or granularity. A knowledge-based approach is used to classify objects into information categories, using Fuzzy Logic based on attributes of image objects and their mutual relations. This classification can be performed at different levels of the classification hierarchy.
Numerous trials (and errors) for image segmentation and classification on T1 and T2 Landsat data
were attempted. In the final model, TM/ETM+ Bands 3, 4, and 5 from both the spring and summer T1 TM data were used for segmentation, as were they for segmentation of the T2 ETM+ data. Four hierarchical levels of segmentation were performed using different settings for scale (resolution), spectral homogeneity, and shape (smoothness and compactness). Further, vegetation indices were calculated and added to the image layer stack, and were used in the knowledge-base classifier to assist in removing some of the erroneous change detected between differing field conditions of agriculture and residential.
After each date of imagery was satisfactorily segmented and classified with eCognition, the results
were combined into a T1 è T2 change image using ERDAS Imagine’s Knowledge-based Engineer classification procedure.
RESULTS AND DISCUSSION
Figures 5 and 6 depict the classification results for the four methods for Sites 1 and 2, respectively.
Even a casual inspection of the results reveals some similarities as well as some extreme differences. Traditional post classification change determination and cross-correlation analysis produced comparable results overall. In both these cases, the T1 classifications were the same. For traditional post classification, an independent T2 land cover map is cross-tabulated with T1 to identify change. For cross-correlation, areas of change to be classified are based on spectral departure of class means defined by land cover areas in the T1 classification. Accordingly, some similarities are expected.
Whereas the neural networks produced acceptably high accuracy for land cover change detection for
the training and test data sets (approximately 92% each), the final area-wide results were less satisfactory overall. Many areas of omission and commission are evident. The problem is not with the neural network approach itself, but how results of the trained network are turned into mapped information. In this experiment, the three neurons (classes) with the highest output values were saved as image files, as were the corresponding weighted non-linear sums, ranging from 0.0 to 1.0. In some instances, a pixel clearly belonged to the winning (1st) class, having an output value of 0.99, for instance, while 2nd and 3rd class values were substantially lower. In other instances, the highest ranked class (output neuron) may not have had differed at that much from the output values of competing classes (for example, 0.92 versus 0.91 versus 0.89). And in other instances, the magnitude of the winning output neuron was not very high, sometimes lower than 0.5. The original intent of outputting the three highest classes, either change or no-change, was to enable the possibility of performing mixed pixel analysis. At this point in the research, however, that has not been done. In this experiment, only the class value from the highest output neuron was used, only if that value exceeded 0.95. If it did not, then the classification from the T1 land cover maps developed for traditional post classification and cross-correlation analysis was used. Clearly, this rule is suboptimal, resulting in a number of land cover change omissions. A better way in which to
9 Definiens AG, Trappentreustr. 1, 80339 München, Germany
2002 ASPRS-ACSM Annual Conference and FIG XXII Congress April 22-26, 2002
perform the change classification would be to use rules that vary by class and that take into consideration the classes and their output neuron value for the 2nd and 3rd output neurons. Nonetheless, given the fundamental logic behind this approach to discover changes automatically, neural networks deserve further examination.
The image segmentation and object-oriented classification method for change detection holds much
promise. Initially, an attempt was made to perform a multitemporal segmentation, in which change objects (regions) would have emerged somewhat automatically. However, given the spectral heterogeneity of the Landsat scenes used, coupled with differences that are more phonologically-related rather than real change, the resulting segmented image is nearly impossible to interpret. The knowledge-base that would have to be developed would be infinitely complex. These and other investigators have observed a similar level of complexity with the results from multitemporal cluster analysis. The approach then resorted to one of performing multiresolution image segmentation for T1 and T2 image data independently, and to develop a rule -base for determining regions (objects) of change. In one sense, this is somewhat analogous to the traditional post-classification change detection. A major difference, however, is the classification and change detection of objects, rather than simply pixels. This is evident from the less-pixelated appearance of the change maps in Figures 5 and 6 compared with those of the other three methods.
Figure 7 shows the results for a small portion of Site 2, in which development has occurred, along
with the corresponding Landsat images for summer T1 and summer T2. Several noteworthy observations can be made. There is substantial agreement among three of the methods, neural networks being the one most dissimilar. Whereas traditional post-classification and cross-correlation analysis revealed the residential growth in the center of the image (the agricultural field), they at the same time falsely-committed already-built areas, just below center, an area that seemed to be under development at the time of the T1 Landsat data. In the object-oriented classification, these two areas were correctly classified, as agriculture è urban and pre-existing urban, respectively. Much of this change area was not detected using the neural network, but again, it is believed to be a problem in establishing appropriate thresholds rather than with the process itself. In this small area, however, there are a couple instances in which the neural network did out-perform the other two methods. In the upper left-hand corner of the image, there is clearly an area having undergone a barren è urban change (purple) between T1 and T2. The neural network correctly identified this area and type of change. Whereas the traditional post-classification and cross-correlation analysis methods classified this area as change, as well, it was falsely labeled as agriculture è urban. In the case of object-oriented classification, the area was labeled as urban in T1. Also, in the middle -left of the image, the object-oriented classification identified urban growth in an area that had already been developed in T1. For the most part, however, the image segmentation and object-oriented classification and change detection appeared to have produced better overall results, especially in terms not only detecting and characterizing the nature of change, but also in minimizing the salt-and-pepper effect caused by isolated and non-contiguous pixels.

2002 ASPRS-ACSM Annual Conference and FIG XXII Congress April 22-26, 2002
(a) Traditional Post-classification (b) Cross-correlation Analysis
(c) Neural Networks (d) Object-oriented Classification
Figure 5. Change Detection Results for Site 1
Urban Agriculture Forest Water Barren Agr to Urban
Forest to Urban
Barren to Urban

2002 ASPRS-ACSM Annual Conference and FIG XXII Congress April 22-26, 2002
(a) Traditional Post-classification (b) Cross-correlation Analysis
(c) Neural Networks (d) Object-oriented Classification
Figure 6. Change Detection Results for Site 2
Urban Agriculture Forest Water Barren Agr to Urban
Forest to Urban
Barren to Urban

2002 ASPRS-ACSM Annual Conference and FIG XXII Congress April 22-26, 2002
Traditional Post-classification September 3, 1989 Cross-correlation Analysis
Neural Networks
September 23, 1999
Object-oriented Classification
Figure 7. Detail of Change Detection for Portion of Site 2
CONCLUSIONS
The results of this research reveal that there is merit to each of the several land use change detection methods studied, and that there appears to be no single best way in which to perform change analysis. It is apparent that, for any method using T1 and T2 land cover maps to determine change, the accuracy of those methods can be no better than that of each of the input maps, and is often quite lower. Methods such as multidate clustering, image differencing, multidate principal components analysis, or RGB-NDVI color composite change detection obviate the need for a high degree of a priori knowledge, but require substantial a posteriori interpretation. The methods addressed in this research each explicitly identify a priori the types and natures of land use change to be expected to occur within multitemporal remote sensing data. The most significant conclusion of this study is that much research remains to be done to improve upon the results of land use and land cover change detection. These investigators firmly believe that an approach based on image-segmentation and rule -based classification is potentially such an improved methodology, and accordingly intend on pursuing the avenues of neural network and object-oriented classification change detection, perhaps in an integrated approach.

2002 ASPRS-ACSM Annual Conference and FIG XXII Congress April 22-26, 2002
ACKNOWLEDGMENTS
This material is based upon work supported by the National Aeronautics and Space Administration under Grant NAG13-99001/NRA-98-OES-08 RESAC-NAUTILUS, “Better Land Use Planning for the Urbanizing Northeast:Creating a Network of Value-Added Geospatial Information, Tools, and Education for Land Use Decision Makers". CLEAR Publication Number 020115.1 SAES Scientific Contribution Number 2079.
LITERATURE CITED Civco, D.L. (1989). Knowledge-based land use and land cover mapping. in Proc. of the 1989 Annual Meeting of the American Society for Photogrammetry and Remote Sensing, Baltimore, MD. pp. 276-291. Civco, D.L. (1993). Artificial neural networks for land cover classification and mapping. International Journal of Geographic Information Systems 7(2):173-186. Civco, D.L. and J.D. Hurd. (1999). A hierarchical approach to land use and land cover mapping using multiple image types. Proc. 1999 ASPRS Annual Convention, Portland, OR. pp. 687-698. Dai, X and S. Khorram. (1999). Remotely Sensed Change Detection Based on Artificial Neural Networks Photogrammetric Engineering and Remote Sensing 65(10):1187-1194. Hoffhine, E. (2000). Forest Change Detection, Harvest and Cover Type Distinction Using Multiple Dates of Landsat Thematic Mapper. M.S.-degree Thesis, University of Maine, Orono. Hurd, J.D., D.L. Civco, C. LaBash, and P. August. (1992). Coastal wetland mapping and change detection in the northeast United States. in Proc. 1992 ASPRS/ACSM/RT'92 Convention, Washington, D.C. 1:130-139 Hurd, J.D., E.H. Wilson, S. Lammey and D.L. Civco. (2001). Characterization of Forest Fragmentation and Urban Sprawl using Time Sequential Landsat Imagery . Proc. 2001 ASPRS Annual Convention, St. Louis, MO. 13 p. Koeln, G. and J. Bissonnette. (2000). Cross-correlation analysis: mapping landcover change with a historic landcover database and a recent, single-date multispectral image. in Proc. 2000 ASPRS Annual Convention, Washington, D.C. 8 p. Lunetta, R. and C. Elvidge. (1999). Remote Sensing Change Detection. Taylor & Francis, 320 p. Niemeyer, I. and M.J. Canty. (2001): Object-Oriented Post-Classification of Change Images. In: Proceedings of SPIE’s International Symposium on Remote Sensing, Toulouse, France, 17-21 September 2001, SPIE Vol. 4545. 9 p. Wang, Y. and D.L. Civco (1992). Evidential reasoning and post-classification of misclassified pixels: a GIS approach for improving the classification accuracy of remotely sensed data. in Proc. 1992 ASPRS/ACSM/RT'92 Convention, Washington, D.C. 4:160-170. Zhou, J. and D.L. Civco. (1998). A wavelet transform method to merge Landsat TM and SPOT Panchromatic Data. International Journal of Remote Sensing 19(4):743-757. Wang, Y. and D.L. Civco. (1996). Three artificial neural network paradigms in high dimensional multisource spatial data classification. The Association of Chinese Professionals in GIS Geographic Information Science 1(2):73-87