9th international conference of the school of economics ... conference proceedings... · trg...
TRANSCRIPT

9th International Conference of the
School of Economics and Business
Conference
Proceedings
October 12, 2018
Sarajevo, Bosnia and Herzegovina

2

9th
International Conference of the School of
Economics and Business
CONFERENCE
PROCEEDINGS
October 12, 2018
Sarajevo, Bosnia and Herzegovina
Title
9th International Conference of the School of Economics and Business
Conference Proceedings
Type
Conference Proceedings
Year
2018
Publisher
University of Sarajevo, School of Economics and Business
Trg oslobodjenja – Alija Izetbegovic 1, Sarajevo, Bosnia and Herzegovina
For the Publisher
Jasmina Selimovic
Editor
Eldin Mehic
DTP
Anesa Vilic
School of Economics and Business
Trg oslobodjenja – Alija Izetbegovic 1
71000 Sarajevo
Bosnia and Herzegovina
www.efsa.unsa.ba
ISSN: 2490-3620
The papers have not been proof-read and the authors assume sole responsibility for any errors.

i
FOREWORD
Following earlier conferences with participants from nearly all over the CEE region as well as from
many other countries, the School of Economics and Business in Sarajevo is proud to host the 9th
International Conference. This conference aims to bring together academics as well as practitioners
to discuss diverse issues in the fields of economics and business with a focus on transition
economies. The purpose of this conference is to disseminate high quality research and to promote
scientific information interchange between researchers, developers, students, and practitioners.
This conference offers a variety of research perspectives from a number of Central and Eastern
European countries. This wide-ranging research context forms the basis for studies in different
fields: economic development, international economics, business administration, marketing,
information technology, insurance and etc.
As was the case in earlier ICES conference it is our pleasure to inform conference participants that
selected papers presented at this conference will be considered for publication in a special issue of
the South East European Journal of Economics and Business published by the School of Economics
and Business.
Also, we would like to invite you to submit your paper for publication in this journal in the future.
We strongly believe that the discussions between prominent and experienced researchers at the
conference will serve as a solid bases for improving your paper and enriching your further research
focusing on transition countries.
We would like to thank all the authors who prepared and submitted their papers to ICES2018.
A special thank is addressed to keynote speaker, Maks Tajnikar, Faculty of Economics, University
of Ljubljana. We are certainly aware that it has taken time and effort to take part in this Conference,
and this is much appreciated.
We would also like to express our gratitude to all participants for their expertise and for sharing
their views and ideas which present the most important contribution to the sucess of this
Conference.
It was with great pleasure that my colleagues and I had this opportunity to host such a conference.
Sarajevo, October 2018 Eldin Mehic
Editor
ii
CONTENT
Author(s) Paper Title Page
Amra Alagic, Lejla Turulja, Nijaz
Bajgoric
IT AUDIT QUALITY FACTORS IDENTIFICATION IN THE FUNCTION OF
BUSINESS CONTINUITY: A SYSTEMATIC LITERATURE REVIEW 1
Adi Alic, Diala Hubijer Zukic, Maja
Arslanagic-Kalajdzic
MODERN TRADE AND CSR: THE CASE OF COSMETIC CHAINS IN
BOSNIA AND HERZEGOVINA 31
Adi Alic, Merima Cinjarevic, Emir
Agic
ALL YOU NEED IS LOVE! THE ROLE OF BRAND PERSONALITY IN
GENERATING FEELINGS OF LOVE TOWARD A BRAND 46
Vesna Babic-Hodovic, Maja
Arslanagic-Kalajdzic, Amna Jazic
TO WHOM ARE YOU LOYAL, TO GLOBAL OR LOCAL BRANDS –
EXPERIENCE BEFORE LOYALTY 59
Anton Florijan Barisic, Mirjana
Pejic Bach, József Poór
HUMAN RESOURCES INFORMATION SYSTEMS AND ITS IMPACT ON
ORGANISATIONAL PERFORMANCE 81
Merima Cinjarevic, Amra Kozo,
Denis Berberovic
SHARING IS CARING, AND MILLENNIALS DO CARE:
COLLABORATIVE CONSUMPTION THROUGH THE EYES OF INTERNET
GENERATION
97
Velid Efendic, Nejra
Hadziahmetovic
PRODUCTIVITY CHANGE OF MICROFINANCE INSTITUTIONS IN
BOSNIA AND HERZEGOVINA 112
Svetlana Gercheva THE EVOLUTION OF FARMLAND REITS IN BULGARIA: THE INCOME
TAX PERSPECTIVE 128
Elvedin Grabovica, Lejla Turulja E-CRM DIMENSIONS AND PERCEIVED INNOVATIVENESS OF BANK’S
SERVICES 143
Sabina Hodzic, Adis Muharemovic,
Ema Cankovic
A REVIEW OF FISCAL INCENTIVES FOR RENEWABLE ENERGY IN
EUROPEAN UNION MEMBER STATES 151
Sabina Hodzic, Hana Paleka THE FINANCIAL EFFECTS OF HEALTH TOURISM IN EUROPEAN
UNION 162
Jasna Kovacevic, Zijada Rahimic MANIPULATIVE LEADERSHIP, GENDER AND ETHICAL DECISION-
MAKING IN ORGANIZATIONS 175
Fatima Mahmutcehajic, Vedad
Silajdzic
BETTER REGULATION IN BOSNIA AND HERZEGOVINA: A CENTRAL
PLANK FOR THE RULE OF LAW 192
Zeljko Mateljak, Stanko Sapunar
LEVEL OF IMPLEMENTATION STRATEGY DEVELOPMENT OF SMALL
HYDROELECTRIC SECTOR IN A FUNCTION OF INTENSITY
EXPLOITATION RENEWABLE ENERGY AND DEVELOPMENT ENERGY
MARKET IN THE REPUBLIC OF CROATIA
205
Vedad Mulalic, Eldin Mehic,
Sabina Silajdzic
THE EFFECTS OF ENERGY PRODUCED FROM RENEWABLE SOURCES
ON CARBON DIOXIDE EMISSIONS: AN EMPIRICAL ANALYSIS OF
EUROPEAN UNION MEMBER COUNTRIES
224
Adnan Muslija, Elma Satrovic,
Cansu Unver Erbas, Saliha Cabro
THE RELATIONSHIP BETWEEN TOURISM AND ECONOMIC GROWTH:
A PANEL GRANGER CAUSALITY METHOD 237
Azra Pasic Mesihovic, Mirza
Kulenovic, Ljiljan Veselinovic
WHAT DOES ENTREPRENEURSHIP HAVE IN COMMON WITH
GAMBLING? 246
Edin Pasovic, Adnan Efendic INFORMAL ECONOMY IN BOSNIA AND HERZEGOVINA – AN
EMPIRICAL INVESTIGATION USING MIMIC APPROACH 265
Maja Rimac-Bjelobrk SWOT ANALYSIS OF THE BIH’S ECONOMIC REGULATORS 283
Amra Salihovic THE USEFULNESS OF REPORTING OF LEGAL ENTITIES IN THE
FEDERATION OF BOSNIA AND HERZEGOVINA 293
Jasmina Selimovic, Dzana Hurko
THE EFFECTS OF RELIGION ON CONSUMER BEHAVIOUR IN
INSURANCE 308
Sabina Silajdzic
THE ROLE OF INNOVATION POLICY IN PROMOTING
COMPETITIVENESS: THE CASE OF BOSNIA AND HERZEGOVINA 323
Sabina Silajdzic, Eldin Mehic
DO ENVIRONENT TAXES PAY OFF? THE IMPACT OF ENERGY AND
TRANSPORT TAX ON CO2 EMISSIONS IN TRANSITION ECONOMIES 341
Vedad Silajdzic, Fatima
Mahmutcehajic
REGULATORY IMPACT ASSESSMENT AND REDUCTION OF
ADMINISTRATIVE BARRIERS AS A CORNERSTONE FOR
COMPETITIVENESS: CASE OF FEDERATION OF BOSNIA AND
HERZEGOVINA
361
Emina Terzic, Amna Ascic
LINKING STUDENTS' SATISFACTION WITH COMMUNICATION AND
THEIR OVERALL SATISFACTION: STUDENT AS A CUSTOMER
APPROACH
371
Lejla Turulja, Nijaz Bajgoric GOOD COMMUNICATION – THE ANTECEDENT OF ORGANIZATIONAL
IDENTIFICATION AND JOB SATISFACTION 385
Tarik Zaimovic, Mirano
Galijasevic, Amina Efendic LIFE AFTER SCRUM – WHERE NEXT IN FRAMEWORK DEVELOPMENT 395
Kemal Kačapor, Amra Kapo, Emir
Hadžić ACCEPTANCE OF CLOUD COMPUTING IN EDUCATION 406
1
IT AUDIT QUALITY FACTORS IDENTIFICATION IN THE
FUNCTION OF BUSINESS CONTINUITY: A SYSTEMATIC
LITERATURE REVIEW
Amra Alagic
Banking Agency of the Federation of B&H
Zmaja od Bosne 47b, 71 000 Sarajevo
Phone: ++ 387 61 897 267; Fax: ++ 387 33 668 811
E-mail: [email protected]
Lejla Turulja
School of Economics and Business Sarajevo
Trg oslobodjenja – Alija Izetbegovic 1, 71 000 Sarajevo
Phone: ++ 387 33 275 970; Fax: ++ 387 33 275 900
E-mail: [email protected]
Nijaz Bajgoric
School of Economics and Business Sarajevo
Trg oslobodjenja – Alija Izetbegovic 1, 71 000 Sarajevo
Phone: ++ 387 33 275 950; Fax: ++ 387 33 275 900
E-mail: [email protected]
Abstract
The security of information technologies (IT) and related IT risks have been a significant issue
in the audit of organizations. Vulnerability and the risks that organizations face through
potential failures in IT security are jeopardizing the overall system of internal controls. The
environment is now becoming more and more complex; businesses are becoming more and
more dependent on information technology. New types of risks are constantly emerging, while
at the same time the tolerance for a system or business failure is reducing, i.e., the requirement
for the business continuity is evident. Business continuity management is a business
management approach that identifies the potential impacts of threats on businesses and provides
a framework for effective response and recovery. The demanding, turbulent and dynamic ICT
market needs to be regulated with the goal of protecting both resources and customers or
consumers. In order to verify that organizations in such a dynamic ICT market operate in
accordance with the standards and whether they comply with the regulations, laws, and by-
laws, it is necessary to implement the control and audit of information systems continuously.
In this regard, rapid technological development and challenges in the IT audit profession, how
the audit can more quickly review the risks in the digital transformation environment, how to
develop skills in terms of market challenges, how to adapt to global industry standards,
especially in cyberspace, contributed to the development of the idea for writing this work.
Therefore, the principal objectives of this paper are the identification of the quality factors of
the audit of an information system, i.e., how the quality audit can contribute to ensuring the
continuity of the organization's operations. Besides, this study aims to identify how the
information system audit adds value to the organization and to analyze the benefits of the
information system audit quality in order to maintain and preserve business continuity.
Keywords: information system, information system audit, IT audit, IT regulations, business
continuity management
JEL Classification: M15
2
1. Introduction
Nowadays, business operations cannot be imagined without an information system. IT
departments of individual organizations are no longer just business support, but also strategic
partners of the management. Information technology (IT) value has been measured at various
levels of analysis (Davern & Kauffman, 2010). In today’s world, rules, standards, expectations,
values, and risks are profoundly affected by the information technologies. Information is the
most prominent assets while change, flexibility, speed and innovative thinking are sidekicks of
it (Kayrak, 2014). The use of IT in making business decisions is expected to result in accurate,
timely, precise and highly reliable information, the contents, and form of which is geared to the
needs of management (Sacer & Oluic, 2013).
According to the newest Cisco VNI Report (CISCO, 2017), mobile data traffic has
grown 18-fold over the past five years, which was primarily influenced by the explosive growth
of on-demand mobile video traffic. No industry branch has undergone so many dynamic and
comprehensive changes as information and communication technologies. According to that, the
management of the organizations faces a new challenge: structural redefinition of the IT
component in order to create plus value and to minimize IT risks through efficient management
of all IT resources of the organization (Gheorghe, 2010).
Such a demanding, turbulent and dynamic ICT market needs to be regulated with the
goal of protecting both resources and customers or consumers. Organizational information
technology (IT) standards have become increasingly important for companies (Dittes, Urbach,
Ahlemann, Smolnik, & Mueller, 2015). However, insights from practice indicate that
employees tend to violate these standards, generating a need for governance and management
mechanisms for the successful implementation in the organization. Standardization has become
an established approach for organizations to coordinate and organize their resources and
processes in order to ensure product and service quality and to raise work efficiency. Companies
operating worldwide rely particularly heavily on standards to leverage economies of scale
through uniform business processes. The importance of organizational standards for IT
departments has increased steadily over time, due to the growth, complexity, and increasing
costs of the organizational IT in almost all departments in large organizations.
The operation of information systems – as well as all systems – should be monitored,
controlled and revised (Panian, 2001). In this regard, the question arises who will review it,
how and what benefits a quality information system audit can bring to the organization. How
will cloud solutions be revised? Who and how will blockchain be audited? No matter how
dynamic the information technology market is, the requirements imposed on IT auditors are
continually changing as well.
No data center is immune to incidents or disasters. Business continuity and disaster
recovery were not topics most companies wanted to focus on. There was a lot of organizational
resistance to spending the time and money necessary to develop a thorough and actionable plan
(Snedaker & Rima, 2014). In recent years, awareness has been raised in organizations and
understand that BCP / DRP is a business necessity. Organizations that have experienced certain
unforeseen situations, incidents or catastrophes in their business have become more severe in
terms of BCP / DRP. Financial services firms, which are now fully electronic, have relatively
robust failover systems, backup scenarios, and the ability to run their business from any one of
a number of worldwide locations (Snedaker & Rima, 2014).
The purpose of this paper is to identify the factors that influence the quality of the
information system audit, in other words, how a quality audit of the information system can
contribute to maintaining and preserving business continuity. The importance of IT audit
quality is increasing over the years, as organizations continuously increase their IT investments,
3
and thus impose new requirements through different legal regulations. The goal of this paper,
above all, is to identify the relevant factors of the quality of the information system audit. In
this regard, the following research questions have been defined: i) What are the critical factors
for quality of information system audit?; ii) How does the information system audit add value
to the organization?; and iii) What are the benefits of the information system audit quality in
order to maintain and preserve business continuity? In order to answer previously mentioned
questions, a systematic literature review will be applied.
This paper is structured in a way that the first part presents the information system audit,
followed by an overview of IT regulations, and then an overview of the area of business
continuity management. In the second part, the methodology of a systematic literature review
is given. Finally, results are provided using the narrative method.
2. Literature review
2.1. IT regulations
For many years and a decade, IT profession has been searching for the appropriate, world-
recognized, specific, and at the same time sufficient general professional standards to describe
and prescribe the best practices for the use of information technology (Spremic, 2017). Today's
most commonly used standards and norms in informatics (CobiT, ITIL, ISO 27000 standards,
PCI DSS, NIST, SANS, CMMI, etc.) are in line with the benefits that information systems can
bring in business and according to the achievement of appropriate measurable goals of IT and
business alignment. Most of these standards are complementary to each other, each has its
advantages in distinct areas, so integrated approach is often used.
2.2. Information system audit
In order to verify that organizations in such a dynamic ICT market operate in accordance with
the standards and whether they comply with the regulations, laws, and bylaws, it is necessary
to undertake control continuously (Panian, 2001). No matter how dynamic the information
technology market is, the requirements imposed on IT auditors are continually changing.
Starting from the adequate management of IT projects, the obligations of assessment and
management of IT risks, clear rules for procurement, management and contracting of IT
resources, to adequate management of changes and upgrades, IT audits can contribute to
ensuring more careful money spending, as well as ensuring the adequate system of internal
control within the organization's information system.
The audit profession has changed over the years because inevitably it was necessary to
monitor changes in the market (ISACA, 2017). Due to the dynamic modern environment, this
profession must continue to develop at an even faster pace. IT auditors are expected to be
innovative, to think about the future and not to be afraid of change. It is essential to understand
that future leaders in IT audits must be open to developing skills beyond traditional IT risk
management, as technology continues to synergize with emerging business expectations.
This is the reason why new technologies must be able to adapt and need to be actively
managed. In this case, we should not forget about human resources, because only with human
inputs all these technologies will not be a threat, but an advantage for technological
advancement and development in the future.
On the basis of the above mentioned, it is evident that the rapid technological
development and challenges in the IT audit profession to educate IT auditors about the latest
technologies, how audit can become even agiler and quicker in order to review the risks in the
digital transformation environment, how to develop skills in terms of market challenges, how

4
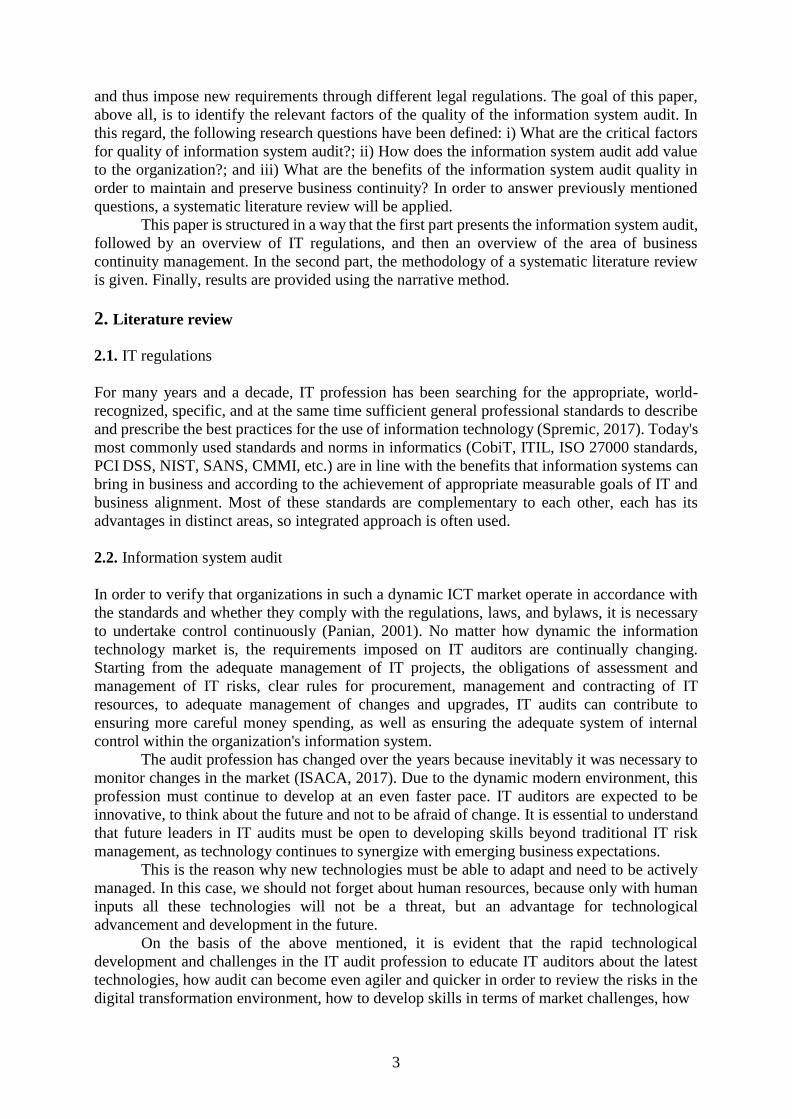
Figure 1. The lifecycle of BCM (BS
2599:1, 2006).
to adapt to global standards in industry, especially in the cyberspace, have contributed to the
development of the idea for writing this paper, i.e. the desire to identify the factors of the IT
audit quality with the aim of preserving the business continuity of the organization.
2.3. Business Continuity Management
Regardless of how simple or complex IT environment is, companies need to plan for business
disruptions, which can range from a local power outage to a massive, regional event such as a
tornado, hurricane, or earthquake. Some natural disasters can be predicted and even tracked, as
was the case with Hurricane Katrina and Super Storm Sandy (among others), but other events
are completely unexpected (Snedaker & Rima, 2014). The purpose of business
continuity/disaster recovery is to enable a business to continue offering critical services in the
event of a disruption and to survive a disastrous interruption to activities. Rigorous planning
and commitment of resources are necessary to adequately plan for such an event (ISACA,
2015). Technological development, from virtualization to cloud services, has allowed
organizations to spend their money more efficiently and to establish optimum backup recovery
sites, with the aim of ensuring continuity of operations.
Business Continuity Management (BCM) is a management process which identifies
possible internal and external threats/risks and their impact on business processes and provides
a framework for organizational resilience (ISO 22301, 2012). Ensuring business continuity has
become more difficult because of increasing threats, supply chain integration and dependency
on complex information systems. BCM addresses operational continuity by concentrating on
mission-critical business processes (Randeree,
Mahal, & Narwani, 2012).
According to the international organization
for standards (IS), BCM life cycle involves six
elements including the business continuity program
management, embedding competence an awareness
in the culture of organization, understanding the
organization, selecting business continuity options,
developing and implementing a business continuity
response, and exercising and testing the developed
plans as shown in Figure 1. A comprehensive
understanding of an organization and its
fundamental processes ensures that the BCM's
program is established according to the organization
objectives (Torabi, Soufi, & Sahebjamnia, 2014).
BCM has recently been defined as: holistic
management process that identifies potential threats
to an organization and the impacts to business
operations that those threats, if realized, might
cause, and which provides a framework for building organizational resilience with the
capability for an effective response that safeguards the interests of its key stakeholders,
reputation, brand and value-creating activities (Herbane, 2010).
Source: (Torabi, Soufi, & Sahebjamnia,
2014)

5
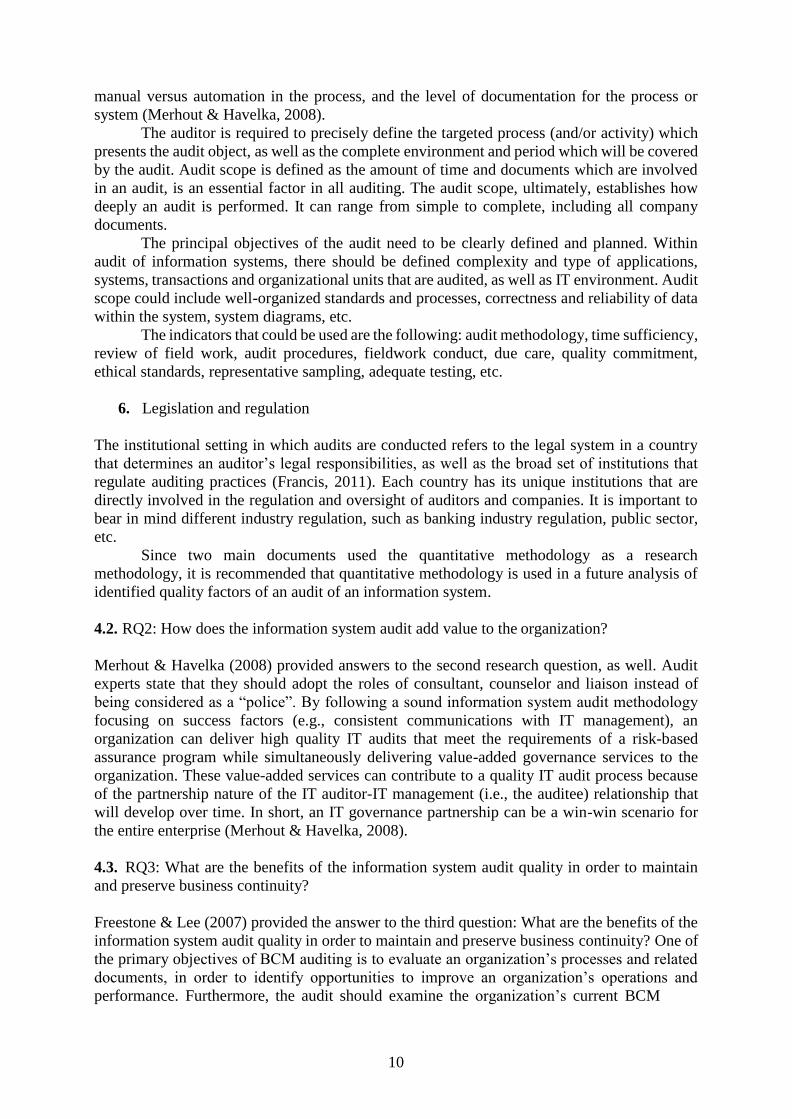
Figure 2. A Systematic Guide to
Literature Review Development
3. Systematic Literature Review Methodology
This chapter employs a systematic literature review (SLR) in order to address the research topic.
According to Ridley (2008), the multiple purposes of the literature review can be categorized
as follows:
it provides a historical background for research,
it gives an overview of the current context in which research is situated by referring
to contemporary debates, issues, and questions in the field,
it includes a discussion of relevant theories and concepts which underpin research,
it introduces relevant terminology and provides definitions to clarify how terms are
being used in the context of own work,
it describes related research in the field and shows how work extends or challenges
this, or addresses a gap in work in the field and
it provides supporting evidence for a practical problem or issue which research is
addressing, thereby underlining its
significance.
A systematic literature review is
conducted in accordance with the steps adopted
from Okoli (2015) and depicted in Figure 2. The
steps of the systematic literature review are
conducted through four phases: planning,
selection, extraction, and execution. At the very
beginning, the purposes for a systematic review
are identified.
After identification of the purposes
concerning the quality factors of information
system audit, the draft protocol was developed.
First, research questions are identified. After
that, a search strategy is developed as well as the
process of papers selection. Research questions
that are identified are:
RQ1: What are the critical factors for
quality of information system audit?
RQ2: How does the information
system audit add value to the
organization?
RQ3: What are the benefits of the
information system audit quality in
order to maintain and preserve
business continuity?
Search strategy refers to the databases as
well as search strings that will be used for publications search. To address research questions
and with the aim of identification of information system audit quality factors, ISI Web of
Science has been chosen for the search.
The first attempt to search the Web of science database did not result in the
corresponding number of articles. The search included the strings “„factors“ and „information
system* audit“” to be found in the Title. Certain authors used the term „factors“ and other
authors used the term „determinants“, but specific authors have published papers in general
Source: Okoli, 2015

6
what impacts the quality of the information system audit, but they did not call them factors.
Therefore, it was decided that the string should be expanded, and then the analysis of all the
obtained articles was made, with the aim of searching for factors.
In relation to that, in order to summarize the published papers related to the audit of
information systems, a search of the Web of science – Core collection database was carried out.
The search included the strings “"information system * audit" OR "audit of information system
* "OR" IT audit"” to be found in the Title. The search was conducted on March 7, 2018. The
result showed documents classified according to the following categories:
44 articles,
11 editorial materials,
2 proceedings papers and
2 reviews.
This analysis will cover 44 articles because they are scientific papers (2 proceedings
papers are at articles category as well).
4. SLR Results Discussion
All 44 articles are reviewed in terms of objectives, methodology, and findings. For some of
them, only abstract was available, so the conclusion is made based on it. The review is presented
in the table which is given in Appendix 1 of this paper. The main conclusions of the literature
review can be presented as follows:
Based on the review of available scientific and academic databases, it has been
concluded that very few studies and research have been conducted with this topic.
The papers that dealt with the topic of the information system audit mostly used the
qualitative research methodology.
By literature review, in the context of the audit and control of information systems,
the following items were analyzed: a) certification and audit process (Leem & Lee,
2004; Julisch et al., 2011); b) description of specific standard (Carlin & Gallegos,
2007): c) an influence of IT on audit process (Moorthy et al., 2010); d) approaches
to assessing IT risk (Friedhoff & Mansouri, 2015), etc.
According to the above mentioned, and given that the primary goal was to identify the
quality factors of the information system audit, it can be concluded that there were no papers
that could help identify the critical factors of the information system audit. Bearing in mind the
fact that within the first key initial search of the Web of Science database there were not
identified articles related to the identification of the quality factors of information system audit,
search of other databases was carried out, and five primary articles were identified that could
help identify the quality factors of the information system audit: Havelka & Merhout (2007),
Merhout & Havelka (2008), Pham et al. (2014), Francis (2011) and Freestone & Lee (2007).
By searching other sources, a small number of articles have been identified for
researching this topic. By reviewing the literature, in the context of the audit and control of
information systems, mostly there was analyzed the following:
how the information system audit adds value to the organization,
which attributes influence the quality of the information system audit,
which factors are related to the IT audit carried out by internal auditors,

7
how to improve the auditor's understanding of the quality of the audit, the
competence of the auditor, and the independence of the auditor,
perception of the quality of the audit from the perspective of the audit client and
auditor, and others.
The term audit quality needs to be explained before proceeding. Audit standards imply
that audit quality is achieved by the issuance of the ‘‘appropriate’’ audit report on the client’s
compliance with generally accepted accounting principles (Francis, 2011). It is important to
keep in mind that the quality of the audit is perceived, and not directly observed. It is considered
that this topic is not sufficiently theoretically and empirically explored, especially if we have in
mind the complexity of the audit quality concept, or that there is no unique measure scale of
indicators for measuring the quality of the audit.
As a first approximation of audit quality, we can think of audits as either meeting or not
meeting minimum legal and professional requirements. Audit quality is inversely related to
audit failures: the higher the failure rate, the lower the quality of auditing (Francis, 2004).
4.1. RQ1: What are the critical factors for quality of information system audit?
According to the analysis of primary documents, the following six key quality factors
of an information system audit are selected:
1. Client (Auditee),
2. Audit Company (Auditor),
3. Audit Process and Methodology,
4. Audit Team Factors,
5. Target Process and Audit Scope,
6. Legislation and regulation.
1. Client (Auditee)
The client category included any factors that were characteristics of or dependent on the client
(or auditee). Examples of factors in this category: expectations of the client, client support of
the audit, and responsiveness of the client (Havelka & Merhout, 2007). The organizational
factors of client, client-controlled category include any factors that were characteristics of or
dependent on the client (or auditee), including management's support and adequacy of
documentation. This category is where partnerships are critical for the ability of IT audit to
influence how the client (i.e., auditee) cooperates during an audit (Merhout & Havelka, 2008).
Indicators which could be used are the following: client size, client motivation, client
expertise and style, customer relations, quality and responsiveness, honesty and openness,
quantity of organizational changes, organizational restructuring, organizational ability to
manage changes, client's understanding of the audit process (and the purpose of the audit), the
completeness, timeliness and accuracy of data and information from the client (for example,
through a database or query), etc.
2. Audit Company (Auditor)
A series of accounting scandals in the early 2000s, such as those at Enron and WorldCom in
the United States have raised public concerns about audit quality. The auditors' responsibility
is not exclusively to satisfy the needs of an individual client or employer. Decision makers,
both within and outside an organization, use audited financial information with the confidence

8
that there are no material misstatements in the financial statements. Therefore, the auditors’
responsibility is also to act in the public interest (Pham, Amaria, Bui, & Tran, 2014).
Factors influencing audit quality are still debated among researchers, regulators, and
practitioners. Many different studies indicated that the key factors that affect competence and
independence of the audit consist of audit firm size, audit firm factors (human resources
management), industry expertise, having employment with audit client, competitive audit
market, audit price, economic dependence, audit tenure, and provisions of non-audit services
(Pham et al., 2014).
There are many classifications of an audit, such as external and internal audit, state and
commercial audit, financial and IT audit, etc. In order to compete with each other,
auditors/auditing companies seek to differentiate their services. As four biggest auditing
companies proved that they provide the best audit services, they differentiated themselves and
are called “big four” (Deloitte, KPMG, PWC and Ernst & Young). With the aim to select the
best quality audit services comparing to the prices, clients usually check the audit firm size and
the fact of the audit firm belongs to a worldwide network. Also, when choosing the auditing
company, it is recommended to check audit company’s industry expertise in the specific
country, then competence of audit team, etc.
Indicators which could be used are the following: audit size, firm experience with client,
industry expertise, computer-assisted auditing tools, audit company maturity, auditor tenure,
resources, etc.
3. Audit Process and Methodology
The audit process represents the implementation of audit inputs, i.e., the testing procedures that
are applied by the engagement team. These are the decisions and judgments made by auditors
with respect to the planning, collection, and interpretation of evidence in order to meet the broad
requirement of audit standards to collect sufficient competent evidence in support of the audit
report (Francis, 2011).
The auditing organization or auditor must be fully aware of the conditions, challenges,
and issues prevailing in the country, region and industry where the audit is to be conducted.
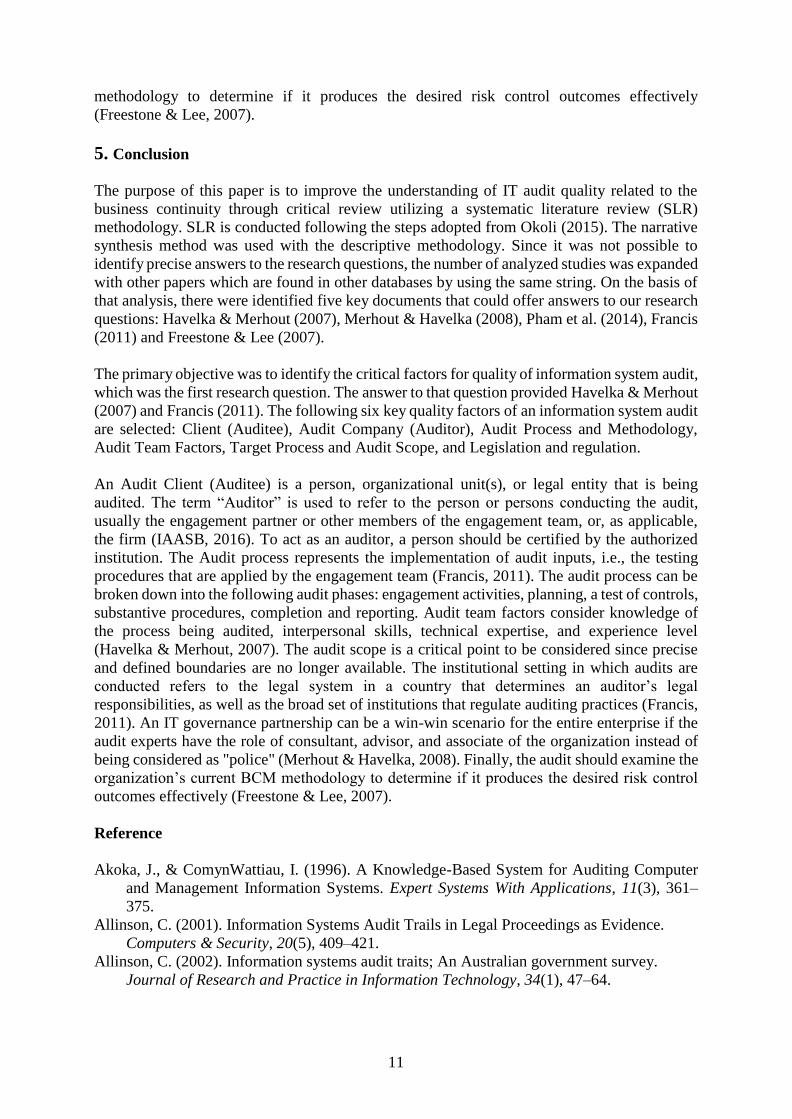
The audit process can be broken down into
the following audit phases: engagement
activities, planning, a test of controls,
substantive procedures, completion and
reporting (Figure 3). While the figure
suggests that these phases are sequential,
they are actually quite iterative and
interrelated in nature.
There are many different audit
methodologies, such as knowledge audit
methodology, scan audit methodology,
but the most used one is risk-based audit
methodology. Risk-based IT auditing is an
approach that focuses on analyzing risk
applicable to the business. More precisely,
RBA is an approach that focuses on the
response of the organization to the risks it
faces in achieving its goals and objectives.
Unlike other forms of the audit, Risk-
Based Auditing starts with business objectives and their associated risks rather than the need
Source: (Messier, Glover, & Prawitt, 2012)
Figure 3. Major audit phases

9
for controls (Lovaas & Wagner, 2012). Through correlation between organization's risk and
business objectives of the organization, auditing plan will lead to a more accurate, faster and
more precise risk reduction programs. Therefore, the purpose of risk-based auditing is
improving the efficiency and effectiveness of the audit (Mohammadi, Kalali, & Najafzadeh,
2014).
Indicators which could be used are the following: sufficient time is allocated to execute
the audit, follow-up methodology is used, audit work processes and documentation quality,
respect of professional commitments made to the client, quality of the relationship between the
audit team and the client's staff, etc.
4. Audit Team Factors
Audit team factors consider knowledge of the process being audited, interpersonal skills,
technical expertise, and experience level (Havelka & Merhout, 2007). Auditor competence and
auditor independence are, among others, the most critical audit team factors. Competence, a
significant factor for all industries, refers to possessing skills, knowledge, and expertise through
an adequate level of education and experience (Pham et al., 2014). It is a primary factor for
improving and maintaining service and product quality. Competence enables the auditor to
detect material misstatements contained in the financial statements. If auditors are incompetent,
they will be less likely to detect weaknesses and irregularities in the information system of the
auditee.
The auditor should be independent of the client company so that any relationship
between them will not influence the audit opinion. The auditors are expected to give an unbiased
and honest professional opinion on the financial statements to the shareholders. According to
the IIA Glossary (IIA, 2018), auditor independence is the freedom from conditions that threaten
the ability of the internal audit activity to carry out internal audit responsibilities in an unbiased
manner.
The IT audit personnel, social and interpersonal skills category include factors that are
dependent upon the individuals performing the IT audit tasks. Some of the factors in this
category are: communication skills, willingness and ability to change, and
motivation/enthusiasm (Merhout & Havelka, 2008).
Since the audit of information systems is an audit that requires specific skills, other
technical proficiency and professional values of the audit team members should be considered,
most importantly. Also, there should be considered auditors' certification (CISA, ISO 27001,
CIA, local certificates), then specific IT knowledge (databases administration, networks,
virtualization, cloud, etc.) as well as the education on a continuous level.
The indicators that could be used are the following: technical competencies, willingness
to learn, team cohesiveness, social skills, experience, professional skepticism, auditor
motivation, accountability, ethical culture, auditor independence, auditor objectivity, ethics,
etc.
5. Target Process and Audit Scope
In an integrated environment, the audit scope is a critical point to be considered since precise
and defined boundaries are no longer available. The audit scope, namely, physical location,
organizational units, activities, and processes define the extent and boundaries of an audit
(Domingues, Sampaio, & Arezes, 2011). The process or system category included any factors
based on the process or system being audited, i.e., the target of the audit, and specific
considerations for the specific audit “project” being performed. Some examples of process or
system factors are: clearly defined project scope, system complexity and type, amount of
10
manual versus automation in the process, and the level of documentation for the process or
system (Merhout & Havelka, 2008).
The auditor is required to precisely define the targeted process (and/or activity) which
presents the audit object, as well as the complete environment and period which will be covered
by the audit. Audit scope is defined as the amount of time and documents which are involved
in an audit, is an essential factor in all auditing. The audit scope, ultimately, establishes how
deeply an audit is performed. It can range from simple to complete, including all company
documents.
The principal objectives of the audit need to be clearly defined and planned. Within
audit of information systems, there should be defined complexity and type of applications,
systems, transactions and organizational units that are audited, as well as IT environment. Audit
scope could include well-organized standards and processes, correctness and reliability of data
within the system, system diagrams, etc.
The indicators that could be used are the following: audit methodology, time sufficiency,
review of field work, audit procedures, fieldwork conduct, due care, quality commitment,
ethical standards, representative sampling, adequate testing, etc.
6. Legislation and regulation
The institutional setting in which audits are conducted refers to the legal system in a country
that determines an auditor’s legal responsibilities, as well as the broad set of institutions that
regulate auditing practices (Francis, 2011). Each country has its unique institutions that are
directly involved in the regulation and oversight of auditors and companies. It is important to
bear in mind different industry regulation, such as banking industry regulation, public sector,
etc.
Since two main documents used the quantitative methodology as a research
methodology, it is recommended that quantitative methodology is used in a future analysis of
identified quality factors of an audit of an information system.
4.2. RQ2: How does the information system audit add value to the organization?
Merhout & Havelka (2008) provided answers to the second research question, as well. Audit
experts state that they should adopt the roles of consultant, counselor and liaison instead of
being considered as a “police”. By following a sound information system audit methodology
focusing on success factors (e.g., consistent communications with IT management), an
organization can deliver high quality IT audits that meet the requirements of a risk-based
assurance program while simultaneously delivering value-added governance services to the
organization. These value-added services can contribute to a quality IT audit process because
of the partnership nature of the IT auditor-IT management (i.e., the auditee) relationship that
will develop over time. In short, an IT governance partnership can be a win-win scenario for
the entire enterprise (Merhout & Havelka, 2008).
4.3. RQ3: What are the benefits of the information system audit quality in order to maintain
and preserve business continuity?
Freestone & Lee (2007) provided the answer to the third question: What are the benefits of the
information system audit quality in order to maintain and preserve business continuity? One of
the primary objectives of BCM auditing is to evaluate an organization’s processes and related
documents, in order to identify opportunities to improve an organization’s operations and
performance. Furthermore, the audit should examine the organization’s current BCM
11
methodology to determine if it produces the desired risk control outcomes effectively
(Freestone & Lee, 2007).
5. Conclusion
The purpose of this paper is to improve the understanding of IT audit quality related to the
business continuity through critical review utilizing a systematic literature review (SLR)
methodology. SLR is conducted following the steps adopted from Okoli (2015). The narrative
synthesis method was used with the descriptive methodology. Since it was not possible to
identify precise answers to the research questions, the number of analyzed studies was expanded
with other papers which are found in other databases by using the same string. On the basis of
that analysis, there were identified five key documents that could offer answers to our research
questions: Havelka & Merhout (2007), Merhout & Havelka (2008), Pham et al. (2014), Francis
(2011) and Freestone & Lee (2007).
The primary objective was to identify the critical factors for quality of information system audit,
which was the first research question. The answer to that question provided Havelka & Merhout
(2007) and Francis (2011). The following six key quality factors of an information system audit
are selected: Client (Auditee), Audit Company (Auditor), Audit Process and Methodology,
Audit Team Factors, Target Process and Audit Scope, and Legislation and regulation.
An Audit Client (Auditee) is a person, organizational unit(s), or legal entity that is being
audited. The term “Auditor” is used to refer to the person or persons conducting the audit,
usually the engagement partner or other members of the engagement team, or, as applicable,
the firm (IAASB, 2016). To act as an auditor, a person should be certified by the authorized
institution. The Audit process represents the implementation of audit inputs, i.e., the testing
procedures that are applied by the engagement team (Francis, 2011). The audit process can be
broken down into the following audit phases: engagement activities, planning, a test of controls,
substantive procedures, completion and reporting. Audit team factors consider knowledge of
the process being audited, interpersonal skills, technical expertise, and experience level
(Havelka & Merhout, 2007). The audit scope is a critical point to be considered since precise
and defined boundaries are no longer available. The institutional setting in which audits are
conducted refers to the legal system in a country that determines an auditor’s legal
responsibilities, as well as the broad set of institutions that regulate auditing practices (Francis,
2011). An IT governance partnership can be a win-win scenario for the entire enterprise if the
audit experts have the role of consultant, advisor, and associate of the organization instead of
being considered as "police" (Merhout & Havelka, 2008). Finally, the audit should examine the
organization’s current BCM methodology to determine if it produces the desired risk control
outcomes effectively (Freestone & Lee, 2007).
Reference
Akoka, J., & ComynWattiau, I. (1996). A Knowledge-Based System for Auditing Computer
and Management Information Systems. Expert Systems With Applications, 11(3), 361–
375.
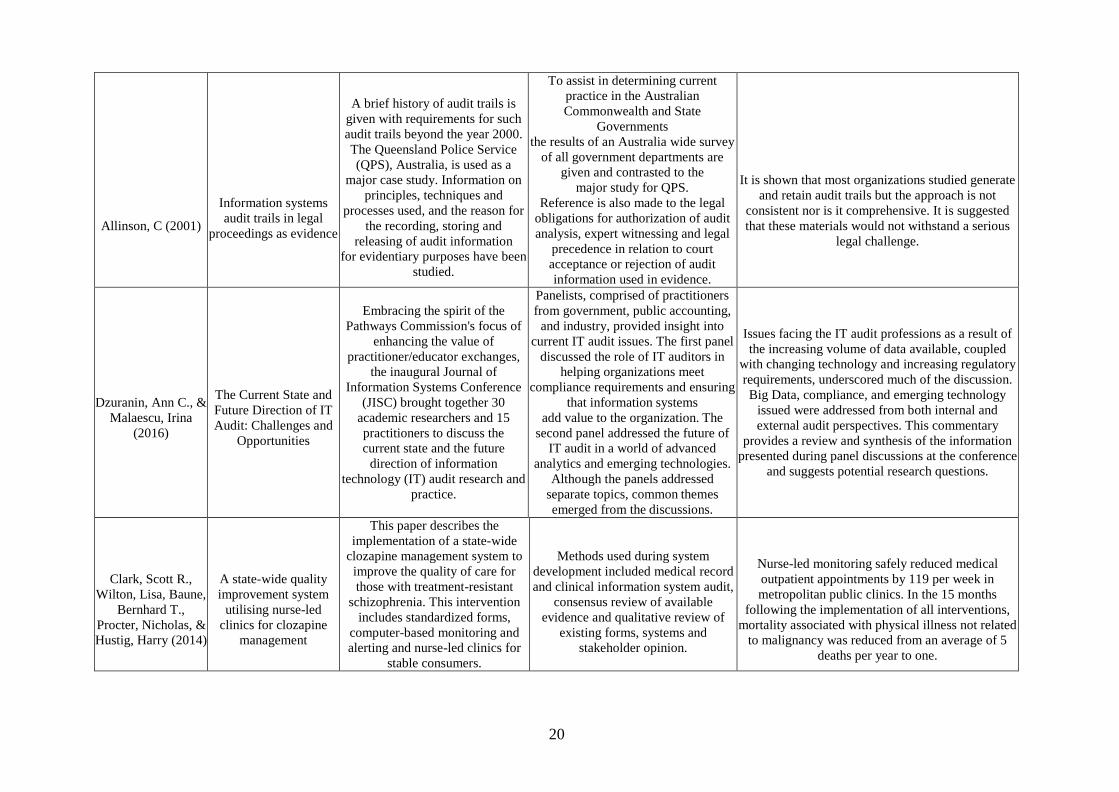
Allinson, C. (2001). Information Systems Audit Trails in Legal Proceedings as Evidence.
Computers & Security, 20(5), 409–421.
Allinson, C. (2002). Information systems audit traits; An Australian government survey.
Journal of Research and Practice in Information Technology, 34(1), 47–64.
12
Barkhi, R., & Kozlowski, S. (2017). ERP in the Classroom: Three SAP Exercises Focused on
Internal Controls. Journal of Emerging Technologies in Accouting, 14(1), 77–83.
Brazel, J., & Agoglia, C. (2007). An examination of auditor planning judgements in a complex
accounting information system environment. Contemporary Accounting Research, 24(4),
1059–+.
Carlin, A., & Gallegos, F. (2007). IT Audit: A Critical Business Process. Computer, 40(7), 87–
89.
Chang, S., Yen, D., Chang, I., & Jan, D. (2014). Internal control framework for a compliant
ERP system. Information & Management, 51(2), 187–205.
CISCO. (2017). Cisco Visual Networking Index: Global Mobile Data Traffic Forecast Update,
2016–2021 White Paper.
Clark, S., Wilton, L., Baune, B., Procter, N., & Hustig, H. (2014). A state-wide quality
improvement system utilising nurse-led clinics for clozapine management. Australian
Psychiatry, 22(3), 254–259.
Cram, W., & Gallupe, R. (2016). A Method to Evaluate Information Systems Control
Alignment. Journal of Information Systems, 30(1), 117–135.
Cruz-Correia, R., Boldt, I., Lapão, L., Santos-Pereira, C., Rodrigues, P., Ferreira, A., & Freitas,
A. (2013). Analysis of the quality of hospital information systems audit trails. BMC
Medical Informatics and Decision Making, 13.
D’Onzda, G., Lamboglia, R., & Verona, R. (2015). Do IT audits satisfy senior manager
expectations?: A qualitative study based on Italian banks. Managerial Auditing Journal,
30(4/5), 413–434.
Davern, M., & Kauffman, R. (2010). Discovering Potential and Realizing Value from
Information Technology Investments. Journal of Management Information Systems,
16(4), 121–143.
Dittes, S., Urbach, N., Ahlemann, F., Smolnik, S., & Mueller, T. (2015). Why don’t you stick
to them? Understanding factors influencing and counter-measures to combat deviant
behavior towards organizational IT standards. Wirtschaftinformatik, 615–629.
Domingues, J., Sampaio, P., & Arezes, P. (2011). Beyond “Audit” Definition: A Framework
Proposal for Integrated Management Systems. In Proceedings of the 2011 Industrial
Engineering Research Conference.
Dzuranin, A., & Malaescu, I. (2016). The Current State and Future Direction of IT Audit:
Challenges and Opportunities. Journal of Information Systems, 30(1), 7–20.
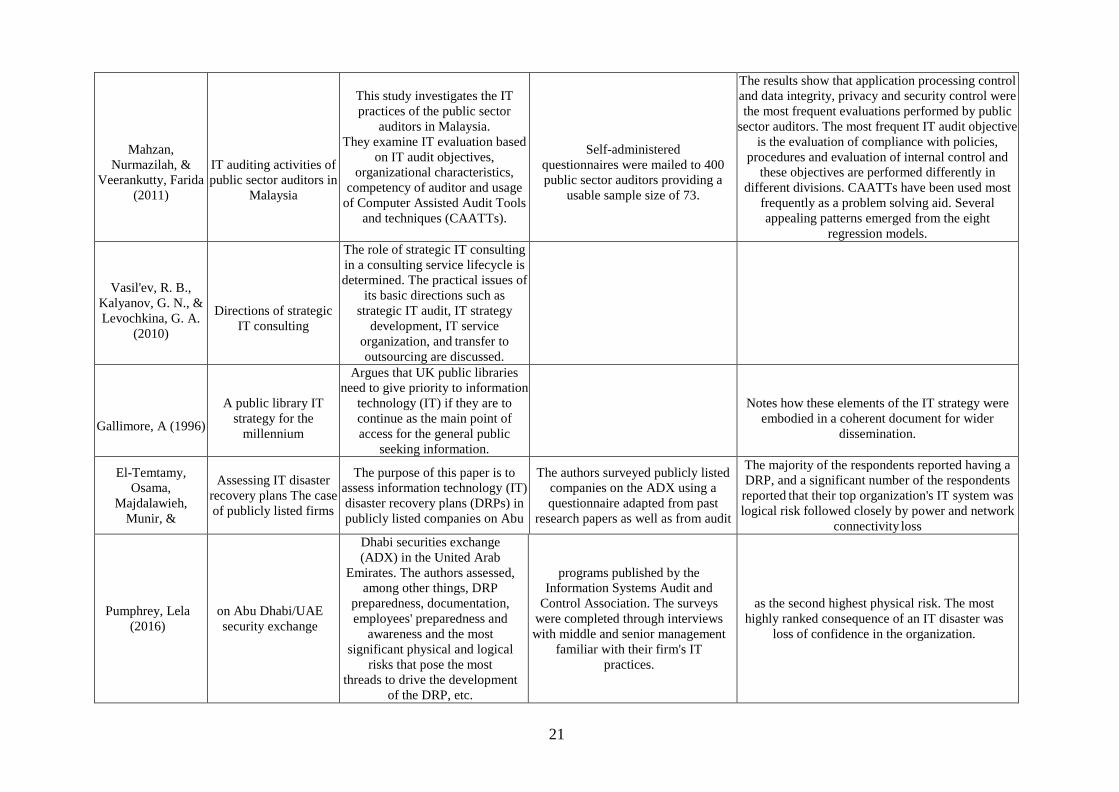
El-Temtamy, O., Majdalawieh, M., & Pumphrey, L. (2016). Assessing IT disaster recovery
plans: The case of publicly listed firms on Abu Dhabi/UAE security exchange. Information
and Computer Security, 24(5), 514–533.
Escalante, R., Chafla, C., Canchig, S., & Zambrano, F. (2017). Knowledge based systems as an
aid in information systems audit. Enfoque UTE, 8(1), 148–159.
Francis, J. (2004). What do we know about audit quality? The British Accounting Review, 36,
345–368.
Francis, J. (2011). A Framework for Understanding and Researching Audit Quality. A Journal
of Practice & Theory, 30(2), 125–152.
Freestone, M., & Lee, M. (2007). Planning for and surviving a BCM audit. Journal of Business
Continuity & Emergency Planning, 2, 138–151.
Friedhoff, J., & Mansouri, M. (2015). Monitoring IT operational risks across US capital
markets. Journal of Operational Risk, 10(2), 61–97.
Gallegos, F., & Looho, A. (2000). Is audit training needs for the 21st century: A selected
assessment. Journal of Computer Information Systems, 41(2), 9–15.
Gallimore, A. (1996). A public library IT strategy for the millennium. Journal of Librarianship
and Information Science, 28(3), 149–157.
13
Gantenbein, D., & Deri, L. (2002). Categorizing computing assets according to communication
patterns. (E. Gregory, G. Anastasi, & S. Basagni, Eds.), Advanced Lectures on Networking
2002 Tutorials (Vol. 2497). Springer.
Gheorghe, M. (2010). Audit Methodology for IT Governance. Informatica Economica, 14(1),
32–42.
Gillani, S., & Ko, A. (2015). Incremental Ontology Population and Enrichment through
Semantic-based Text Mining: An Application for IT Audit Domain. International Journal
on Semantic Web and Information Systems, 11(3), 44–66.
Goosen, R. (2016). The development of an integrated risk assessment questionnaire for internal
auditor’s use. Southern African Journal of Accountability and Auditing Research -
SAJAAR, 18(1), 63–71.
Gordon, S., & Tarafdar, M. (2010). The IT Audit that Boosts Innovation. MIT Sloan
Management Review, 51(4), 39–47.
Havelka, D., & Merhout, J. (2007). Development of an Information Technology Audit Process
Quality Framework. In Americas Conference on Information Systems 2007 Proceedings.
Henderson, D., Bradford, M., & Kotb, A. (2016). Inhibitors and Enablers of GAS Usage:
Testing the Dual Factor Theory. Journal of Information Systems, 30(3), 135–155.
Herath, H., & Herath, T. (2014). IT security auditing: A performance evaluation decision
model. Decision Support Systems, 57, 54–63.
Herbane, B. (2010). The evolution of business continuity management: A historical review of
practices and drivers. Business History, 52(6), 978–1002.
IAASB. (2016). The International Auditing and Assurance Standards Board (IAASB)
Handbook Glossary. IFAC.
ISACA. (2015). CISA Review Manual, 26th Edition. ISACA.
ISACA. (2017). IT Audit Leaders Forum Recap.
Julisch, K., Suter, C., Woitalla, T., & Zimmermann, O. (2011). Compliance by design -
Bridging the chasm between auditors and IT architects. Computers & Security, 30(6–7),
410–426.
Kayrak, M. (2014). Information Technology Audit and the Practice of the Turkish Court of
Accounts. The Journal of Operations Research, Statistics, Econometrics and Management
Information Systems, 2(1).
Kim, H., Kotb, A., & Eldaly, M. (2016). The Use of Generalized Audit Software by Egyptian
External Auditors: The Effect of Audit Software Features. Journal of Applied Accounting
Research, 17(4), 456–478.
Lee, C., Hong, S., Kang, S., & Kim, J. (2009). The Study on the Information Security Audit
Guideline for SCADA System. Information-An International Interdisciplinary Journal,
12(1), 147–162.
Leem, C., & Lee, H. (2004). Development of certification and audit processes of application
service provider for IT outsourcing. Technovation, 24(1), 63–71.
Lovaas, P., & Wagner, S. (2012). IT Audit Challenges for Small and Medium- Sized Financial
Institutions. In Annual Symposium on Information Assurance & Secure Knowledge
Management 2012 (pp. 16–22).
Mahzan, N., & Veerankutty, F. (2011). IT auditing activities of public sector auditors in
Malaysia. African Journal of Business Management, 5(5), 1551–1563.
Marx, B., & Ravjee, H. (2015). An Analysis of the Evolving Role of Information Technology
with Respect to Selected Standards and its Impact on Internal Audit. Journal for New
Generation Sciences, 13(3), 101–119.
Merhout, J., & Havelka, D. (2008). Information Technology Auditing: A Value-Added IT
Governance Partnership between IT Management and Audit. Communications of the
Association for Information Systems, 23, 463–482.
Messier, W., Glover, S., & Prawitt, D. (2012). Auditing & Assurance Services: A Systematic
Approach, 8th Edition. McGraw-Hill.
14
Millard, F., Thistlethwaite, J., Spagnolo, C., Kennedy, R., & Baune, B. (2008). Dementia
Diagnosis: A Pilot Randomised Controlled Trial of Education and IT Audit to Assess
Change in GP Dementia Documentation. Australian Journal of Primary Health, 14(3),
141–149.
Mohammadi, J., Kalali, A., & Najafzadeh, A. (2014). Risk-Based Auditing. Asian Journal of
Research in Business Economics and Management, 4(11), 366–372.
Moorthy, M. K., Mohamed, A. Z., Gopalan, M., & San, L. (2011). The impact of information
technology on internal auditing. African Journal of Business Management, 5(9), 3523–
3539.
Nikitkov, A., & Bay, D. (2015). Shill bidding: Empirical evidence of its effectiveness and
likelihood of detection in online auction systems. International Journal of Accounting
Information Systems, 16, 42–54.
Nuijten, A., Keil, M., Pijl, G. van der, & Commandeur, H. (2018). IT managers’ vs. IT auditors’
Perceptions of Risks: An actor–Observer Asymmetry Perspective. Information &
Management, 55(1), 80–93.
Okoli, C. (2015). A Guide to Conducting a Standalone Systematic Literature Review.
Communications of the Association for Information Systems, 37, 879–910.
Padayachee, L., & de Jager, H. (2015). Integrated auditing - an internal audit perspective.
Southern African Journal of Accountability and Auditing Research-SAJAAR, 17(2), 47–
56.
Panian, Z. (2001). Kontrola i revizija informacijskih sustava. Sinergija-nakladnistvo d.o.o.
Zagreb.
Panian, Z., & Spremic, M. (2007). Korporativno upravljanje i revizija informacijskih sustava.
Zgombic & Partneri – nakladnistvo i informatika d.o.o. Zagreb.
Pathak, J., & Lind, M. (2010). An E-Business Audit Service Model in the B2B Context.
Information Systems Management, 27(2), 146–155.
Pham, H., Amaria, P., Bui, T., & Tran, S. (2014). A study of audit quality in Vietnam.
International Journal of Business, 8(2), 73–111.
Putri, M. A., Lestari, V. A., & Aknuranda, I. (2017). Audit of Information Technology
Governance Using COBIT 4.1: Case Study in PT.XY. Internetworking Indonesia, 9(1),
47–52.
Randeree, K., Mahal, A., & Narwani, A. (2012). A business continuity management maturity
model for the UAE banking sector. Business Process Management Journal, 18(3), 472– 492.
Ridley, D. (2012). The Literature Review: A Step by Step Guide for Students, 2nd edition. SAGE
Publications Ltd.
Sacer, I., & Oluic, A. (2013). Information Technology and Accounting Information Systems’
Quality in Croatian Middle and Large Companies. Journal of Information and
Organizational Sciences, 37(2), 117–126.
Snedaker, S., & Rima, C. (2014). Business Continuity and Disaster Recovery Planning for IT
Professionals, 2nd Edition. Elsevier.
Spremic, M. (2017). Sigurnost i revizija informacijskih sustava u okruzenju digitalne
ekonomije. Ekonomski fakultet – Zagreb.
Spremic, M., Bajgoric, N., & Turulja, L. (2013). Implementation of IT Governance Standards
and Business Continuity Management in Transition Economies: The Case of Banking
Sector in Croatia and Bosnia-Herzegovina. Economic Research, 26(1), 183–202.
Stanciu, N. (2013). Importance of Event Log Management to Ensure Information System
Security. Metalurgia International, 18(2), 144–149.
Stoel, D., Havelka, D., & Merhout, J. W. (2012). An analysis of attributes that impact
information technology audit quality: A study of IT and financial audit practitioners.
International Journal of Accounting Information Systems, 13(1), 60–79.
Strous, L. (1998). Audit of information systems: The need for cooperation. (B. Rovan, Ed.),
SOFSEM’98: Theory and Practice of Informatics (Vol. 1521).

15
Sutton, S., Hampton, C., Deepak, K., & Arnold, V. (2008). Risk Analysis in Extended
Enterprise Environments: Identification of Critical Risk Factors in B2B E-Commerce
Relationships. Journal of the Association for Information Systems, 9(3–4), 151–174.
Tarek, M., Mohamed, E., Hussain, M., & Basuony, M. (2017). The implication of information
technology on the audit profession in developing country: extent of use and perceived
importance. International Journal of Accounting Information Systems, 25(2), 237–255.
Torabi, S., Soufi, H., & Sahebjamnia, N. (2014). A new framework for business impact analysis
in business continuity management (with a case study). Safety Science, 68, 309–323.
Tryfonas, T., & Kearney, B. (2008). Standardising business application security assessments
with pattern-driven audit automations. Computer Standards & Interfaces, 30(4), 262–270.
Vasil’ev, R., Kalyanov, G., & Levochkina, G. (2010). Directions of Strategic IT Consulting.
Automation and Remote Control, 71(8), 1718–1726.
von Solms, B. (2005). Information Security governance: COBIT or ISO 17799 or both?
Computers & Security, 24(2), 99–104.
16
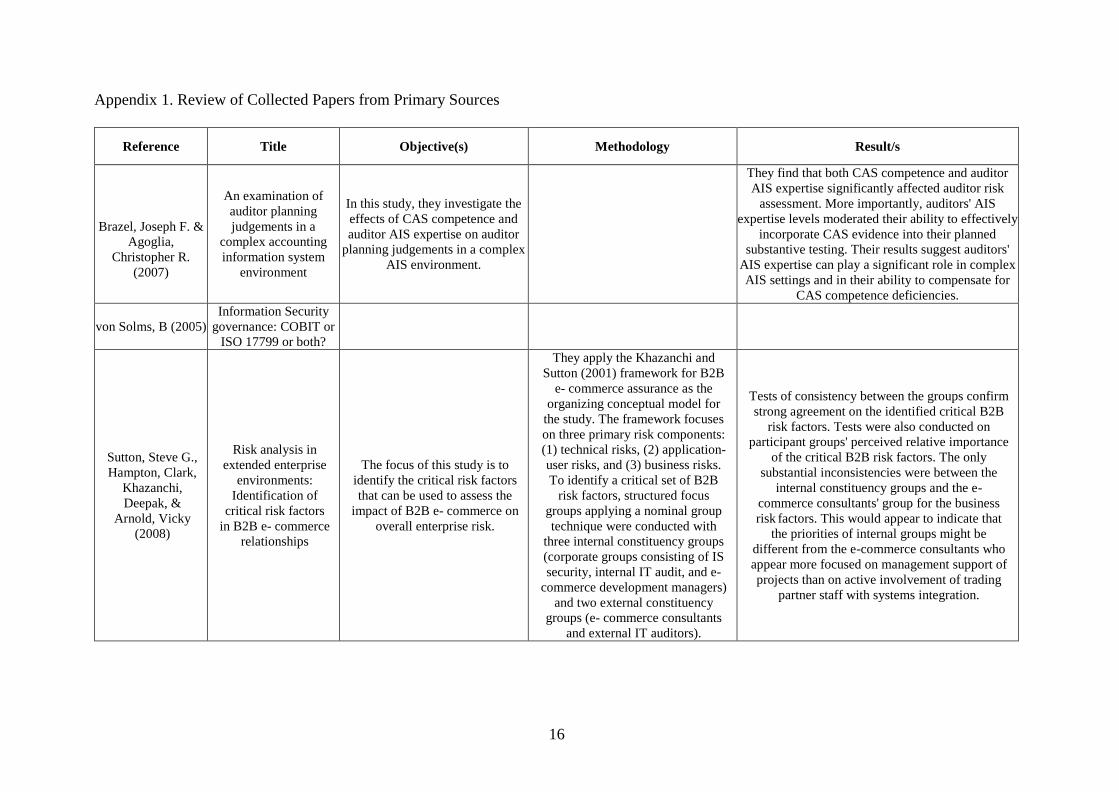
Appendix 1. Review of Collected Papers from Primary Sources
Reference Title Objective(s) Methodology Result/s
Brazel, Joseph F. &
Agoglia,
Christopher R.
(2007)
An examination of
auditor planning
judgements in a
complex accounting
information system
environment
In this study, they investigate the
effects of CAS competence and
auditor AIS expertise on auditor
planning judgements in a complex
AIS environment.
They find that both CAS competence and auditor
AIS expertise significantly affected auditor risk
assessment. More importantly, auditors' AIS
expertise levels moderated their ability to effectively
incorporate CAS evidence into their planned
substantive testing. Their results suggest auditors'
AIS expertise can play a significant role in complex
AIS settings and in their ability to compensate for
CAS competence deficiencies.
von Solms, B (2005)
Information Security
governance: COBIT or
ISO 17799 or both?
Sutton, Steve G.,
Hampton, Clark,
Khazanchi,
Deepak, &
Arnold, Vicky
(2008)
Risk analysis in
extended enterprise
environments:
Identification of
critical risk factors
in B2B e- commerce
relationships
The focus of this study is to
identify the critical risk factors
that can be used to assess the
impact of B2B e- commerce on
overall enterprise risk.
They apply the Khazanchi and
Sutton (2001) framework for B2B
e- commerce assurance as the
organizing conceptual model for
the study. The framework focuses
on three primary risk components:
(1) technical risks, (2) application-
user risks, and (3) business risks.
To identify a critical set of B2B
risk factors, structured focus
groups applying a nominal group
technique were conducted with
three internal constituency groups
(corporate groups consisting of IS
security, internal IT audit, and e-
commerce development managers)
and two external constituency
groups (e- commerce consultants
and external IT auditors).
Tests of consistency between the groups confirm
strong agreement on the identified critical B2B
risk factors. Tests were also conducted on
participant groups' perceived relative importance
of the critical B2B risk factors. The only
substantial inconsistencies were between the
internal constituency groups and the e-
commerce consultants' group for the business
risk factors. This would appear to indicate that
the priorities of internal groups might be
different from the e-commerce consultants who
appear more focused on management support of
projects than on active involvement of trading
partner staff with systems integration.

17
Leem, CS, &
Lee, HJ (2004)
Development of
certification and
audit processes of
application service
provider for IT
outsourcing
In this paper, they discuss
certification and audit
processes of ASP services.
Their research included: first, a
survey of 35 Korean companies’
awareness, advantages and
concerns on ASP services. This
formed the base of their research.
Second, the ASP certification
framework and processes required
to verify the reliability of ASP
services were summarized and case
applications were also outlined.
Finally, they proposed an audit process aimed at
improving the efficiency of ASP services.
Chang, She-I, Yen,
David C., Chang, I-
Cheng, & Jan, Derek
(2014)
Internal control
framework for a
compliant ERP system
This study develops an internal
control framework that can be
applied within an enterprise
resource planning (ERP) system.
A literature review is first conducted
to examine the necessary forms of
internal control in information
technology (IT) systems. The control
criteria for the establishment of the
internal control framework are then
constructed. A case study is conducted
to verify the feasibility of the
established framework. This study
proposes a 12-dimensional framework
with 37 control items aimed at helping
auditors perform effective audits by
inspecting essential internal control
points in ERP systems.
The proposed framework allows companies to
enhance IT audit efficiency and mitigates control
risk. Moreover, companies that refer to this
framework and consider the limitations of their own
IT management can establish a more robust IT
management mechanism.
Julisch, Klaus,
Suter, Christophe,
Woitalla, Thomas,
& Zimmermann,
Olaf (2011)
Compliance by design -
Bridging the chasm
between auditors and IT
architects
This article describes a generalized
audit process.
According to their experience with this
process, there is a risk that material
deficiencies remain undiscovered
when said simplifying assumptions are
not satisfied. To address this risk of
deficiencies, the article compiles
thirteen control patterns, which e
according to their experience e are
particularly suited to help information
systems satisfy the simplifying
assumptions.
As such, use of these proven control patterns makes
information systems easier to audit and IT architects
can use them to build systems that meet audit
requirements by design. Additionally, the practices
and advice offered in this interdisciplinary article
help bridge the gap between the architects and
auditors of information systems and show either role
how to benefit from an understanding of the other
role’s terminology, techniques, and general work
approach.
Carlin, Anna, &
Gallegos, Frederick
(2007)
IT audit: A critical
business process
This paper investigates the co-
existence of and complementary
use of COBIT and ISO 17799 as
reference frameworks for
Information Security governance.
The investigation is based on a
mapping between COBIT and ISO
17799 which became available in
2004, and provides a level of
‘synchronization’ between these two
frameworks.
The investigation is based on a mapping between
COBIT and ISO 17799 which became available in
2004, and provides a level of ‘synchronization’
between these two frameworks.

18
Akoka, J., &
Comyn-Wattiau, I.
(1996)
A knowledge-based
system for auditing
computer and
management
information systems
In this paper, they present an audit
expert system, called
INFAUDITOR, aiding the audit
process related to management
information systems.
Herath, Hemantha
S. B., & Herath,
Tejaswini C. (2014)
IT security auditing: A
performance evaluation
decision model
Given the various costs, including
opportunity costs, the problem of
deciding when to undertake a
security audit and the design of
managerial incentives becomes an
important part of an organization's
control process.
In view of these considerations, this paper
develops an IT security performance evaluation
decision model for whether or not to conduct an IT
security audit. A Bayesian extension investigates
the impact of new information regarding the
security environment on the decision. Since
security managers may act in an opportunistic
manner, the model also incorporates agency costs
to determine the incentive payments for managers
to conduct an audit. Cases in which the agency
model suggests that it is optimal not to conduct an
IT security audit are also discussed.
Cruz-Correia,
Ricardo, Boldt,
Isabel, Lapao,
Luis, Santos-
Pereira, Catia,
Rodrigues, Pedro
Pereira, Ferreira,
Ana Margarida,
& Freitas,
Alberto (2013)
Analysis of the
quality of hospital
information systems
audit trails
Audit Trails (AT) are
fundamental to information
security in order to guarantee
access traceability but can also
be used to improve Health
Information System’s (HIS)
quality namely to assess how
they are used or misused. This
paper aims at analyzing the
existence and quality of AT,
describing scenarios in
hospitals and making some
recommendations to improve
the quality of information.
The responsible of HIS for eight
Portuguese hospitals were contacted
in order to arrange an interview
about the importance of AT and to
collect audit trail data from their
HIS. Five institutions agreed to
participate in this study; four of
them accepted to be interviewed,
and four sent AT data. The
interviews were performed in 2011
and audit trail data sent in 2011 and
2012. Each AT was evaluated and
compared in relation to data quality
standards, namely for completeness,
comprehensibility, traceability
among others. Only one of the AT
had enough information for
us to apply a consistency
evaluation by modelling user
behavior.
The interviewees in these hospitals only knew a
few AT (average of 1 AT per hospital in an
estimate of 21 existing HIS), although they all
recognize some advantages of analyzing AT.
Four hospitals sent a total of 7 AT – 2 from
Radiology Information System (RIS), 2 from
Picture Archiving and Communication System
(PACS), 3 from Patient Records. Three of the AT
were understandable and three of the AT were
complete. The AT from the patient records are
better structured and more complete than the
RIS/PACS.
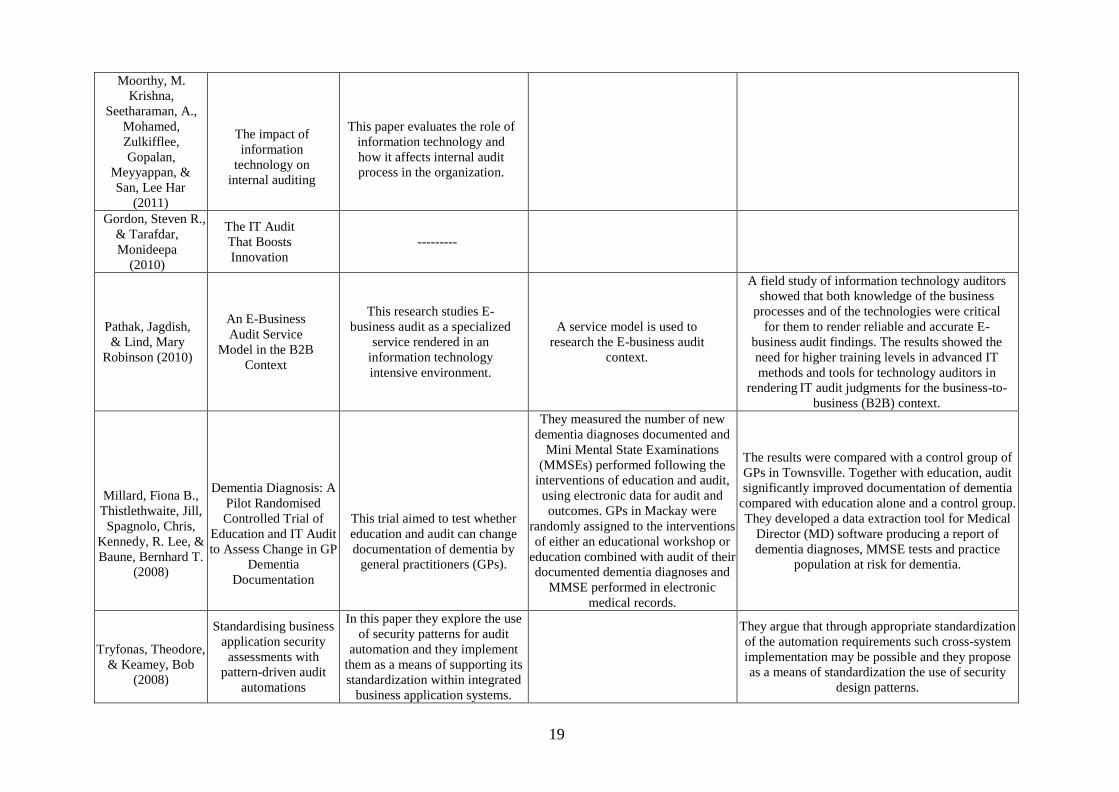
19
Moorthy, M.
Krishna,
Seetharaman, A.,
Mohamed,
Zulkifflee,
Gopalan,
Meyyappan, &
San, Lee Har
(2011)
The impact of
information
technology on
internal auditing
This paper evaluates the role of
information technology and
how it affects internal audit
process in the organization.
Gordon, Steven R.,
& Tarafdar,
Monideepa
(2010)
The IT Audit
That Boosts
Innovation
---------
Pathak, Jagdish,
& Lind, Mary
Robinson (2010)
An E-Business
Audit Service
Model in the B2B
Context
This research studies E-
business audit as a specialized
service rendered in an
information technology
intensive environment.
A service model is used to
research the E-business audit
context.
A field study of information technology auditors
showed that both knowledge of the business
processes and of the technologies were critical
for them to render reliable and accurate E-
business audit findings. The results showed the
need for higher training levels in advanced IT
methods and tools for technology auditors in
rendering IT audit judgments for the business-to-
business (B2B) context.
Millard, Fiona B.,
Thistlethwaite, Jill,
Spagnolo, Chris,
Kennedy, R. Lee, &
Baune, Bernhard T.
(2008)
Dementia Diagnosis: A
Pilot Randomised
Controlled Trial of
Education and IT Audit
to Assess Change in GP
Dementia
Documentation
This trial aimed to test whether
education and audit can change
documentation of dementia by
general practitioners (GPs).
They measured the number of new
dementia diagnoses documented and
Mini Mental State Examinations
(MMSEs) performed following the
interventions of education and audit,
using electronic data for audit and
outcomes. GPs in Mackay were
randomly assigned to the interventions
of either an educational workshop or
education combined with audit of their
documented dementia diagnoses and
MMSE performed in electronic
medical records.
The results were compared with a control group of
GPs in Townsville. Together with education, audit
significantly improved documentation of dementia
compared with education alone and a control group.
They developed a data extraction tool for Medical
Director (MD) software producing a report of
dementia diagnoses, MMSE tests and practice
population at risk for dementia.
Tryfonas, Theodore,
& Keamey, Bob
(2008)
Standardising business
application security
assessments with
pattern-driven audit
automations
In this paper they explore the use
of security patterns for audit
automation and they implement
them as a means of supporting its
standardization within integrated
business application systems.
They argue that through appropriate standardization
of the automation requirements such cross-system
implementation may be possible and they propose
as a means of standardization the use of security
design patterns.
20
Allinson, C (2001)
Information systems
audit trails in legal
proceedings as evidence
A brief history of audit trails is
given with requirements for such
audit trails beyond the year 2000.
The Queensland Police Service
(QPS), Australia, is used as a
major case study. Information on
principles, techniques and
processes used, and the reason for
the recording, storing and
releasing of audit information
for evidentiary purposes have been
studied.
To assist in determining current
practice in the Australian
Commonwealth and State
Governments
the results of an Australia wide survey
of all government departments are
given and contrasted to the
major study for QPS.
Reference is also made to the legal
obligations for authorization of audit
analysis, expert witnessing and legal
precedence in relation to court
acceptance or rejection of audit
information used in evidence.
It is shown that most organizations studied generate
and retain audit trails but the approach is not
consistent nor is it comprehensive. It is suggested
that these materials would not withstand a serious
legal challenge.
Dzuranin, Ann C., &
Malaescu, Irina
(2016)
The Current State and
Future Direction of IT
Audit: Challenges and
Opportunities
Embracing the spirit of the
Pathways Commission's focus of
enhancing the value of
practitioner/educator exchanges,
the inaugural Journal of
Information Systems Conference
(JISC) brought together 30
academic researchers and 15
practitioners to discuss the
current state and the future
direction of information
technology (IT) audit research and
practice.
Panelists, comprised of practitioners
from government, public accounting,
and industry, provided insight into
current IT audit issues. The first panel
discussed the role of IT auditors in
helping organizations meet
compliance requirements and ensuring
that information systems
add value to the organization. The
second panel addressed the future of
IT audit in a world of advanced
analytics and emerging technologies.
Although the panels addressed
separate topics, common themes
emerged from the discussions.
Issues facing the IT audit professions as a result of
the increasing volume of data available, coupled
with changing technology and increasing regulatory
requirements, underscored much of the discussion.
Big Data, compliance, and emerging technology
issued were addressed from both internal and
external audit perspectives. This commentary
provides a review and synthesis of the information
presented during panel discussions at the conference
and suggests potential research questions.
Clark, Scott R.,
Wilton, Lisa, Baune,
Bernhard T.,
Procter, Nicholas, &
Hustig, Harry (2014)
A state-wide quality
improvement system
utilising nurse-led
clinics for clozapine
management
This paper describes the
implementation of a state-wide
clozapine management system to
improve the quality of care for
those with treatment-resistant
schizophrenia. This intervention
includes standardized forms,
computer-based monitoring and
alerting and nurse-led clinics for
stable consumers.
Methods used during system
development included medical record
and clinical information system audit,
consensus review of available
evidence and qualitative review of
existing forms, systems and
stakeholder opinion.
Nurse-led monitoring safely reduced medical
outpatient appointments by 119 per week in
metropolitan public clinics. In the 15 months
following the implementation of all interventions,
mortality associated with physical illness not related
to malignancy was reduced from an average of 5
deaths per year to one.
21
Mahzan,
Nurmazilah, &
Veerankutty, Farida
(2011)
IT auditing activities of
public sector auditors in
Malaysia
This study investigates the IT
practices of the public sector
auditors in Malaysia.
They examine IT evaluation based
on IT audit objectives,
organizational characteristics,
competency of auditor and usage
of Computer Assisted Audit Tools
and techniques (CAATTs).
Self-administered
questionnaires were mailed to 400
public sector auditors providing a
usable sample size of 73.
The results show that application processing control
and data integrity, privacy and security control were
the most frequent evaluations performed by public
sector auditors. The most frequent IT audit objective
is the evaluation of compliance with policies,
procedures and evaluation of internal control and
these objectives are performed differently in
different divisions. CAATTs have been used most
frequently as a problem solving aid. Several
appealing patterns emerged from the eight
regression models.
Vasil'ev, R. B.,
Kalyanov, G. N., &
Levochkina, G. A.
(2010)
Directions of strategic
IT consulting
The role of strategic IT consulting
in a consulting service lifecycle is
determined. The practical issues of
its basic directions such as
strategic IT audit, IT strategy
development, IT service
organization, and transfer to
outsourcing are discussed.
Gallimore, A (1996)
A public library IT
strategy for the
millennium
Argues that UK public libraries
need to give priority to information
technology (IT) if they are to
continue as the main point of
access for the general public
seeking information.
Notes how these elements of the IT strategy were
embodied in a coherent document for wider
dissemination.
El-Temtamy,
Osama,
Majdalawieh,
Munir, &
Assessing IT disaster
recovery plans The case
of publicly listed firms
The purpose of this paper is to
assess information technology (IT)
disaster recovery plans (DRPs) in
publicly listed companies on Abu
The authors surveyed publicly listed
companies on the ADX using a
questionnaire adapted from past
research papers as well as from audit
The majority of the respondents reported having a
DRP, and a significant number of the respondents
reported that their top organization's IT system was
logical risk followed closely by power and network
connectivity loss
Pumphrey, Lela
(2016)
on Abu Dhabi/UAE
security exchange
Dhabi securities exchange
(ADX) in the United Arab
Emirates. The authors assessed,
among other things, DRP
preparedness, documentation,
employees' preparedness and
awareness and the most
significant physical and logical
risks that pose the most
threads to drive the development
of the DRP, etc.
programs published by the
Information Systems Audit and
Control Association. The surveys
were completed through interviews
with middle and senior management
familiar with their firm's IT
practices.
as the second highest physical risk. The most
highly ranked consequence of an IT disaster was
loss of confidence in the organization.
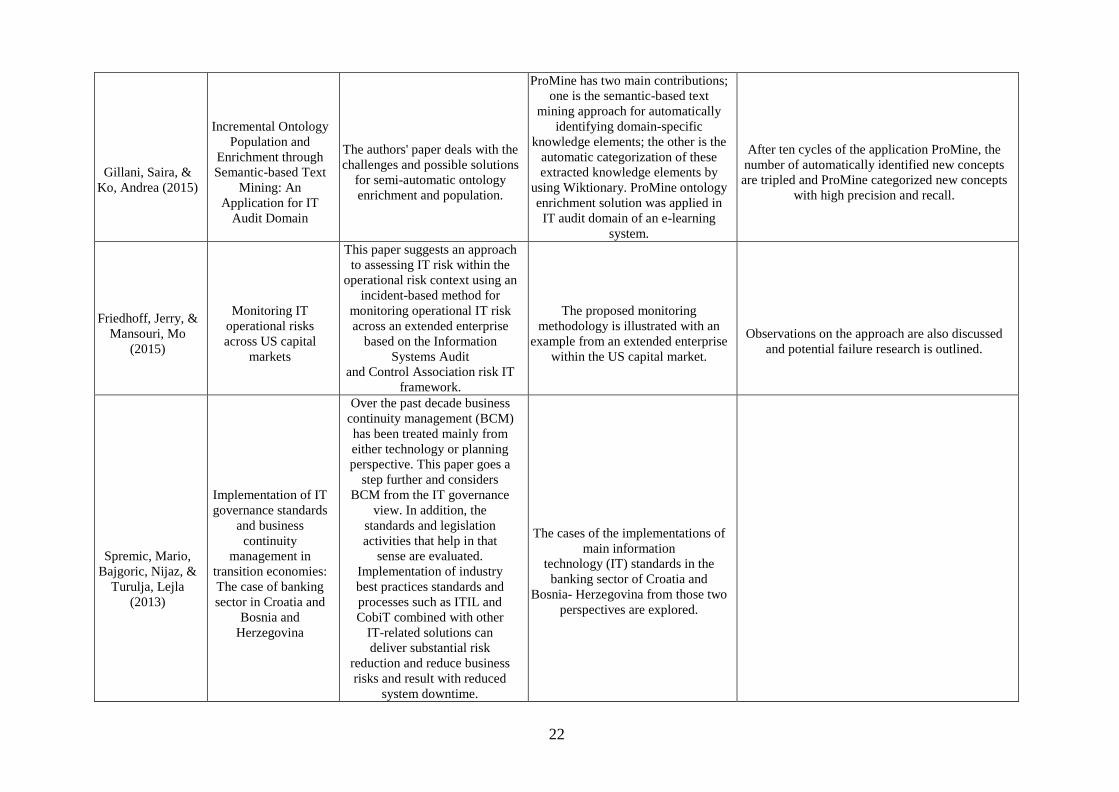
22
Gillani, Saira, &
Ko, Andrea (2015)
Incremental Ontology
Population and
Enrichment through
Semantic-based Text
Mining: An
Application for IT
Audit Domain
The authors' paper deals with the
challenges and possible solutions
for semi-automatic ontology
enrichment and population.
ProMine has two main contributions;
one is the semantic-based text
mining approach for automatically
identifying domain-specific
knowledge elements; the other is the
automatic categorization of these
extracted knowledge elements by
using Wiktionary. ProMine ontology
enrichment solution was applied in
IT audit domain of an e-learning
system.
After ten cycles of the application ProMine, the
number of automatically identified new concepts
are tripled and ProMine categorized new concepts
with high precision and recall.
Friedhoff, Jerry, &
Mansouri, Mo
(2015)
Monitoring IT
operational risks
across US capital
markets
This paper suggests an approach
to assessing IT risk within the
operational risk context using an
incident-based method for
monitoring operational IT risk
across an extended enterprise
based on the Information
Systems Audit
and Control Association risk IT
framework.
The proposed monitoring
methodology is illustrated with an
example from an extended enterprise
within the US capital market.
Observations on the approach are also discussed
and potential failure research is outlined.
Spremic, Mario,
Bajgoric, Nijaz, &
Turulja, Lejla
(2013)
Implementation of IT
governance standards
and business
continuity
management in
transition economies:
The case of banking
sector in Croatia and
Bosnia and
Herzegovina
Over the past decade business
continuity management (BCM)
has been treated mainly from
either technology or planning
perspective. This paper goes a
step further and considers
BCM from the IT governance
view. In addition, the
standards and legislation
activities that help in that
sense are evaluated.
Implementation of industry
best practices standards and
processes such as ITIL and
CobiT combined with other
IT-related solutions can
deliver substantial risk
reduction and reduce business
risks and result with reduced
system downtime.
The cases of the implementations of
main information
technology (IT) standards in the
banking sector of Croatia and
Bosnia- Herzegovina from those two
perspectives are explored.

23
Lee, ChulSoo,
Hong, Seng-phil,
Kang, Sungmin,
& Kim,
Jaehyoun (2009)
The Study on the
Information
Security Audit
Guideline for
SCADA System
This research provided the
basis of quality audit by
suggesting information security
architecture and information
security audit framework and
audit guideline for control
system audit.
Allinson, C (2002)
Information systems
audit traits; An
Australian
government survey
A brief definition of
information systems audit trails
is given, with emphasis on
national and international
standards requirements. Aspects
of Australian privacy legislation
are discussed.
Detail and results of an Australia
wide survey of all government
departments is given and
contrasted with particular results
of a survey conducted by the
Australian Commonwealth
Privacy Commission four years
previous.
It is shown that most organizations studied
generate and retain audit trails but the approach is
not consistent nor is it comprehensive. Within a
four year period there is evidence to suggest that
government organizations are increasingly more
inclined to generate audit trails. It is also suggested
that due to the inadequate and non-compliant
security processes and procedures these materials
would not withstand a serious legal challenge.
Gallegos, F, &
Looho, A
(2000)
Is audit training
needs for the 21st
century: A selected
assessment
This paper explores the
training needs of a selected
population of Information
Technology professionals,
the information systems
auditor.
Through an electronic survey,
information has been gathered
about the training needs and
priorities and resources of this
field.
The results of this paper show the level and areas of
need in information audit, control and security
education. It provides a baseline for other surveys to
be initiated within geographic areas. Universities,
working in partnership with industry, government
and professional associations can help identify such
training needs and in turn, offer coursework or
certificate programs to help develop the information
systems audit, control and security professional of
the present and future.
Strous, L (1998)
Audit of
information
systems: The need
for cooperation
This paper will give an
introduction to the different
aspects of it – auditing in
general and will demonstrate
the difficulties that it – auditors
face when, for example,
auditing an electronic
commerce system. It will
indicate the need for co-
operation and it will be
concluded by suggesting
solutions for the auditors'
problems.

24
Nuijten, Arno,
Keil, Mark, van
der Pijl, Gert, &
IT managers' vs. IT
auditors' perceptions of
risks: An actor-
observer asymmetry
perspective
In this study, they draw upon
the actor-observer
asymmetry perspective to
understand
Through a quasi experiment
with 76 employees of a financial
institution, they found that IT
managers and IT
They found that IT managers and IT auditors
showed the expected actor-observer differences.
Implications for both research and practice are
discussed.
Commandeur,
Harry (2018)
differences in IT managers' vs. IT
auditors' perceptions of risks.
auditors showed the expected
actor-observer differences
Barkhi, Reza, &
Kozlowski,
Stephen (2017)
ERP in the
Classroom: Three
SAP Exercises
Focused on Internal
Controls
Three short exercises are
presented that introduce certain
functional aspects of Enterprise
Resource Planning (ERP)
software. The objective is to
provide students with an
introduction to the functionality
that is incorporated in a typical
ERP software solution that
supports an evaluation of
internal controls and segregation
of duties as part of the
Information Technology Audit
(IT Audit) function.
They have developed three
hands-on step-by-step exercises
using a widely implemented ERP
system (i.e., SAP) and provide
access to SAP on the cloud so
that students can learn how to
verify internal controls
embedded in the system and
identify control weaknesses such
as a lack of segregation of duties.
Proano Escalante,
Rodrigo Arturo,
Saguay Chafla,
Ciro Napoleon,
Jacome Canchig,
Segundo Bolivar,
& Sandoval
Zambrano, Fanny
(2017)
Knowledge based
systems as an aid
in information
systems audit
The objective of this article is
to give a general idea of the
characterization and use of
knowledge based systems, the
way they are implemented and
their application to the audit of
information systems as a tool
to help the opinion issue at the
moment of realization of an
audit.
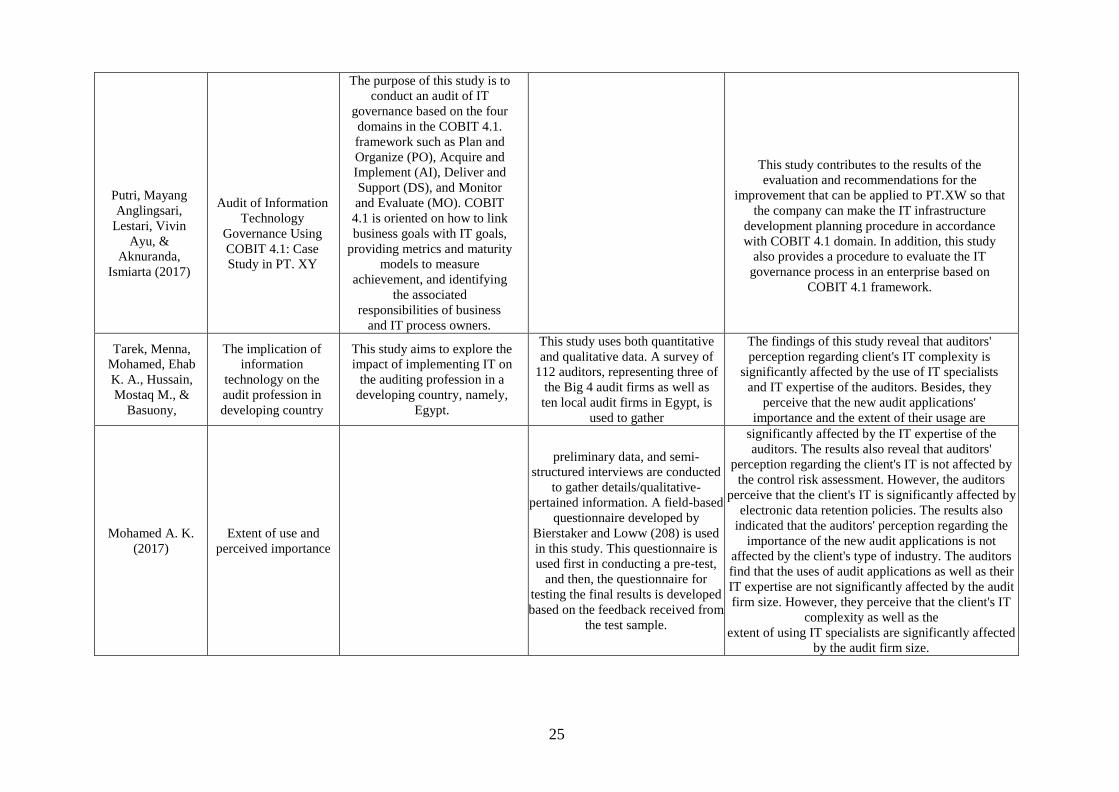
25
Putri, Mayang
Anglingsari,
Lestari, Vivin
Ayu, &
Aknuranda,
Ismiarta (2017)
Audit of Information
Technology
Governance Using
COBIT 4.1: Case
Study in PT. XY
The purpose of this study is to
conduct an audit of IT
governance based on the four
domains in the COBIT 4.1.
framework such as Plan and
Organize (PO), Acquire and
Implement (AI), Deliver and
Support (DS), and Monitor
and Evaluate (MO). COBIT
4.1 is oriented on how to link
business goals with IT goals,
providing metrics and maturity
models to measure
achievement, and identifying
the associated
responsibilities of business
and IT process owners.
This study contributes to the results of the
evaluation and recommendations for the
improvement that can be applied to PT.XW so that
the company can make the IT infrastructure
development planning procedure in accordance
with COBIT 4.1 domain. In addition, this study
also provides a procedure to evaluate the IT
governance process in an enterprise based on
COBIT 4.1 framework.
Tarek, Menna,
Mohamed, Ehab
K. A., Hussain,
Mostaq M., &
Basuony,
The implication of
information
technology on the
audit profession in
developing country
This study aims to explore the
impact of implementing IT on
the auditing profession in a
developing country, namely,
Egypt.
This study uses both quantitative
and qualitative data. A survey of
112 auditors, representing three of
the Big 4 audit firms as well as
ten local audit firms in Egypt, is
used to gather
The findings of this study reveal that auditors'
perception regarding client's IT complexity is
significantly affected by the use of IT specialists
and IT expertise of the auditors. Besides, they
perceive that the new audit applications'
importance and the extent of their usage are
Mohamed A. K.
(2017)
Extent of use and
perceived importance
preliminary data, and semi-
structured interviews are conducted
to gather details/qualitative-
pertained information. A field-based
questionnaire developed by
Bierstaker and Loww (208) is used
in this study. This questionnaire is
used first in conducting a pre-test,
and then, the questionnaire for
testing the final results is developed
based on the feedback received from
the test sample.
significantly affected by the IT expertise of the
auditors. The results also reveal that auditors'
perception regarding the client's IT is not affected by
the control risk assessment. However, the auditors
perceive that the client's IT is significantly affected by
electronic data retention policies. The results also
indicated that the auditors' perception regarding the
importance of the new audit applications is not
affected by the client's type of industry. The auditors
find that the uses of audit applications as well as their
IT expertise are not significantly affected by the audit
firm size. However, they perceive that the client's IT
complexity as well as the
extent of using IT specialists are significantly affected
by the audit firm size.

26
Henderson, David
L., III, Bradford,
Marianne, & Kotb,
Amr (2016)
Inhibitors and Enablers
of GAS Usage: Testing
the Dual Factor Theory
The purpose of this study is to
investigate the enablers and
inhibitors of generalized audit
software (GAS) usage.
Based on a sample of 285 internal
and external auditors, their results
suggest that, after controlling for
mandatory Gas usage, perceived
threat negatively influences usage
and perceived usefulness, whereas
the system problems construct
negatively influences perceived
usefulness and perceived ease of
use.
Furthermore, their findings indicate that the effect of
system problems is fully mediated by perceived
usefulness and perceived ease of use, whereas the
effect of perceived threat is partially mediated by
perceived usefulness. Finally, their results indicate that
the effect of perceived threat on GAS usage is stronger
for internal auditors than external auditors, suggesting
that the effect of inhibitors can vary by position.
Cram, W. Alec, &
Gallupe, R. Brent
(2016)
A Method to Evaluate
Information Systems
Control Alignment
They address this challenge by
operationalizing a method to
evaluate control alignment within
IS processes.
The results ca aid in determining the degree of
complementarity between IS controls, organizational,
staff and process characteristics.
Goosen, R. (2016)
The development of an
integrated IT risk
assessment
questionnaire for
internal auditors' use
This article proposes to develop an
integrated IT risk assessment
questionnaire based on certain
updated IT and risk control
framework to assist the internal
auditor in evaluating high level IT
control risk areas in an effective
manner, whilst complying with the
latest framework requirements and
also taking emerging technology
risks into consideration.
Kim, Hyo-Jeong,
Kotb, Amr, &
Eldaly, Mohamed
Khaled (2016)
The use of generalized
audit software by
Egyptian external
auditors The effect of
audit software features
The purpose of this paper is to
explore: the actual usage of
generalized audit software (GAS)
features among Egyptian external
auditors, through the technology
acceptance model (TAM); how the
conceptual complexity of GAS
features impact its actual usage,
and what factors influencing the
GAS use by Egyptian external
auditors.
External audit professionals at 12
international audit firms, including
the Big 4 and eight medium-sized
firms, in Egypt were surveyed.
The results show that the basic features including
database queries, ratio analysis, and audit sampling
were higher in GAS use, perceived usefulness, and
perceived ease of use among Egyptian external
auditors than the advanced features: digital analysis,
regression/ANOVA, and data mining classification.
The structural equation modelling analysis by GAS
features suggests that perceived ease of use has a
stronger effect on GAS use when the conceptual
complexity of GAS features is high. The analysis
also support that the use of GAS by Egyptian
external auditors is more affected by co-worker,
supervisor, or organization through perceived
usefulness, but not by job relevance, output quality,
and result demonstration.
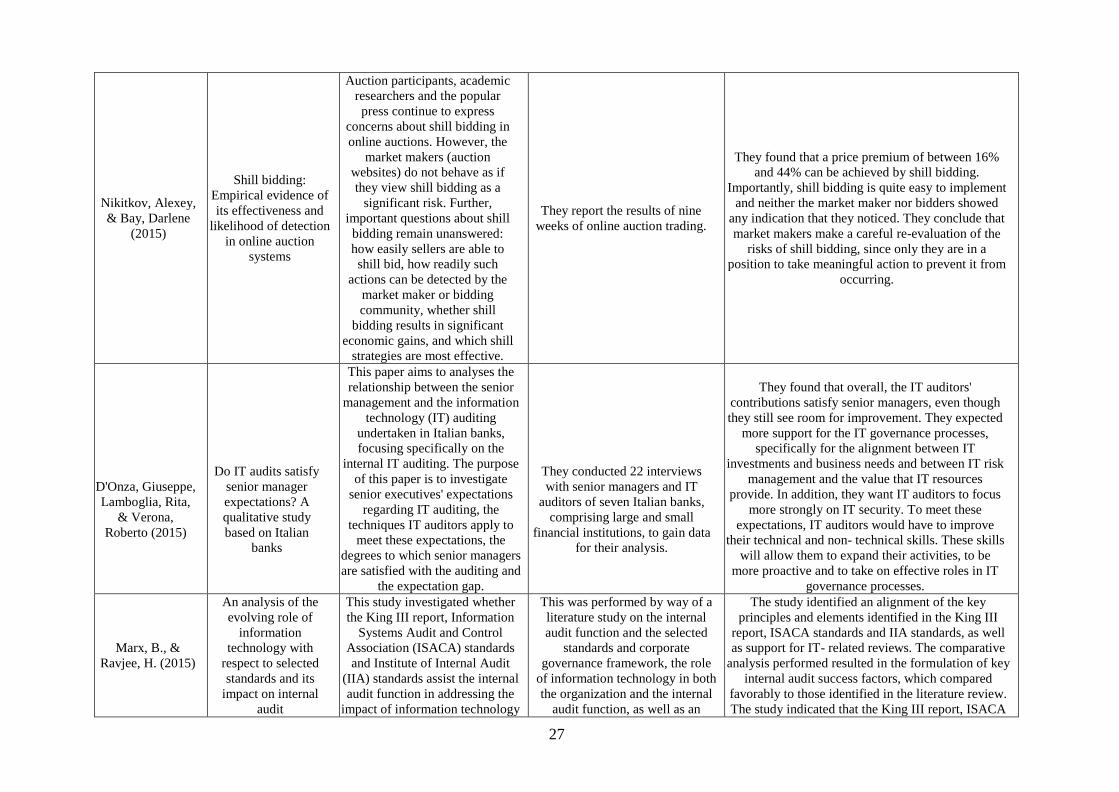
27
Nikitkov, Alexey,
& Bay, Darlene
(2015)
Shill bidding:
Empirical evidence of
its effectiveness and
likelihood of detection
in online auction
systems
Auction participants, academic
researchers and the popular
press continue to express
concerns about shill bidding in
online auctions. However, the
market makers (auction
websites) do not behave as if
they view shill bidding as a
significant risk. Further,
important questions about shill
bidding remain unanswered:
how easily sellers are able to
shill bid, how readily such
actions can be detected by the
market maker or bidding
community, whether shill
bidding results in significant
economic gains, and which shill
strategies are most effective.
They report the results of nine
weeks of online auction trading.
They found that a price premium of between 16%
and 44% can be achieved by shill bidding.
Importantly, shill bidding is quite easy to implement
and neither the market maker nor bidders showed
any indication that they noticed. They conclude that
market makers make a careful re-evaluation of the
risks of shill bidding, since only they are in a
position to take meaningful action to prevent it from
occurring.
D'Onza, Giuseppe,
Lamboglia, Rita,
& Verona,
Roberto (2015)
Do IT audits satisfy
senior manager
expectations? A
qualitative study
based on Italian
banks
This paper aims to analyses the
relationship between the senior
management and the information
technology (IT) auditing
undertaken in Italian banks,
focusing specifically on the
internal IT auditing. The purpose
of this paper is to investigate
senior executives' expectations
regarding IT auditing, the
techniques IT auditors apply to
meet these expectations, the
degrees to which senior managers
are satisfied with the auditing and
the expectation gap.
They conducted 22 interviews
with senior managers and IT
auditors of seven Italian banks,
comprising large and small
financial institutions, to gain data
for their analysis.
They found that overall, the IT auditors'
contributions satisfy senior managers, even though
they still see room for improvement. They expected
more support for the IT governance processes,
specifically for the alignment between IT
investments and business needs and between IT risk
management and the value that IT resources
provide. In addition, they want IT auditors to focus
more strongly on IT security. To meet these
expectations, IT auditors would have to improve
their technical and non- technical skills. These skills
will allow them to expand their activities, to be
more proactive and to take on effective roles in IT
governance processes.
Marx, B., &
Ravjee, H. (2015)
An analysis of the
evolving role of
information
technology with
respect to selected
standards and its
impact on internal
audit
This study investigated whether
the King III report, Information
Systems Audit and Control
Association (ISACA) standards
and Institute of Internal Audit
(IIA) standards assist the internal
audit function in addressing the
impact of information technology
This was performed by way of a
literature study on the internal
audit function and the selected
standards and corporate
governance framework, the role
of information technology in both
the organization and the internal
audit function, as well as an
The study identified an alignment of the key
principles and elements identified in the King III
report, ISACA standards and IIA standards, as well
as support for IT- related reviews. The comparative
analysis performed resulted in the formulation of key
internal audit success factors, which compared
favorably to those identified in the literature review.
The study indicated that the King III report, ISACA

28
on the organization and, as a
result, the internal audit function
itself.
empirical study detailing a
comparative analysis of the King
III report, ISACA standards and
IIA standards, utilizing key
success factors.
standards and IIA standards assisted the internal audit
function by addressing IT-related risks, controls and
governance elements.
Padayachee, L.
G., & de Jager,
H. (2015)
Integrated auditing -
an internal audit
perspective
An integrated audit approach
entails an international audit
design process that cohesively
combines business process
auditing and information
technology (IT) auditing into a
single, coordinated effort.
However, due to the continuing
influence of longstanding
methods of performing audits,
the internal auditing fraternity
has been slow to evolve,
neglecting to train internal
auditors who are confidently
able to perform audits that
combine both
the business process audits
and IT audits into one
seamless audit.
This study found that although holders of the
Certified Internal Auditor qualification, and other
members of the IIA are perceived to have mastered
the theoretical knowledge provided by the CIA
certification programmer and other training courses,
the manner in which they perform audits does not
demonstrate the practical application of this
knowledge.
Stanciu,
Nicoleta
(2013)
Importance of event
log management to
ensure information
system security
This article presents an
overview of the event logs as
part of information system
audit, their importance, how to
analyze them to assess the
effectiveness of controls, the
security log management what
is the process for generating,
transmitting, storing, analyzing,
and disposing of computer
security log data. It presents a
generic Security Information
and Event Management (SIEM)
tool that collect event logs
generated by various sources,
such as security software logs,
operating system logs and
application log, correlate and

29
analyze aggregated and
normalized security event logs,
in centralized manner. Also, it
highlights idea to need the
finding an interoperability
standard format and new methods
for log normalization.
Gantenbein, D, &
Deri, L (2002)
Categorizing
computing assets
according to
communication
patterns
They propose to complement
basic network-based discovery
techniques with the combined log
information from network and
application servers to compute an
aggregate picture of assets, and to
categorize their usage with data-
mining techniques according to
detected communication patterns.
Merhout, J. W., &
Havelka, D. (2008)
Information
Technology Auditing:
A Value- Added IT
Governance
Partnership between
IT Management and
Audit
Primary factors that affect the
quality of an IT audit from the
perspective of project
management
Qualitative research Focus groups
The resulting initial model
consisted of five categories of
factors: Client-related, Target
Process or System, IT Audit
Personnel, IT Audit Organization,
Audit Process/Methodology are
refined and expanded into:
1. Audit Team Factors
2. Audit Process and
Methodology Factors
3. Client-Controlled
Organizational Factors
4. IT Audit-Controlled
Organizational Factors
5. IT Audit Personnel Technical
Competency Factors
6. IT Audit Personnel Social and
Interpersonal Factors
7. Enterprise and Organizational
Environment Factors
8. Target Process and System
Factors
Value-added benefits of IT audits
1. Improved return on investment in information
technology through improved IT governance
2. Using audit documentation to improve
operational efficiency through business (and IT)
process reengineering or improved business process
management
3. Using audit observations to improve risk
mitigation through Enterprise Risk Management
(ERM) awareness
4. Improved Business Continuity Planning and
associated systems Disaster Recovery Planning
5. Improved Systems Development Quality
6. Increased organizational communication and trust
development through facilitation among various
stakeholders
Stoel, D., Havelka,
D., &
An analysis of
attributes that impact
information
The purpose of this study is to
analyze attributes identified in
prior research that are thought to
Factor analysis
Exploratory process identifying
potential attributes (survey items)
They find Planning and Methodology and
Independence as the most important factors for IT
audit quality.

30
Merhout, J. W.
(2012)
technology audit
quality: A study of IT
and financial audit
practitioners
impact the quality of the
information technology audit
process. The long-term goal of
this stream of research related to
IT audit quality is to develop a
testable model of constructs that
may impact IT audit quality; to
develop measurable constructs
related to IT audit quality.
To recruit a broad set of
practitioners, their implementation
of the survey focused on
identifying two respondent sets:
1) IT audit professionals
2) financial auditors and other
accounting professional involved
with IT audits.
Accounting Knowledge and Audit Skills was rated as
one of the most important factors associated with
financial audit quality. Consistent with this assertion
is the higher ratings of Business Process Knowledge
and Experience and IT and Controls Knowledge.
Analysis of differences between groups (IT auditors
and financial auditors as respondents), they find that
IT respondents rate the impact of Auditor
Experience with Auditee, IT and Controls
Knowledge, and Planning and Methodology higher
than the financial respondents.
31
MODERN TRADE AND CSR: THE CASE OF COSMETIC CHAINS IN
BOSNIA AND HERZEGOVINA
Adi Alic
School of Economics and Business Sarajevo, University of Sarajevo
Trg oslobodjenja – Alija Izetbegovic 1, 71000 Sarajevo, B&H
Phone: ++38733253752; Fax: ++38733275900
E-mail: [email protected]
Diala Hubijer Zukic
Tondach BiH d.o.o.
Dzenetica cikma 1, Sarajevo 71000, B&H
Phone: ++38733262820; Fax: ++38733262822
E-mail: [email protected]
Maja Arslanagic-Kalajdzic
School of Economics and Business Sarajevo, University of Sarajevo
Trg oslobodjenja – Alija Izetbegovic 1, 71000 Sarajevo, B&H
Phone: ++38733251883; Fax: ++38733275900
E-mail: [email protected]
Abstract
Retail organizations, as agents in the distribution channels, operate with a task of direct
distribution of goods to the final consumers. Retail organizations need to satisfy consumers’
needs though the structure of their assortment, amount and quality of goods and services, at
the most convenient place and time, and at prices that respond to consumers’ values. Retail
organizations are usually distinguished as modern trade and traditional trade. Although the
topic of modern trade and traditional trade is attractive for practitioners, there is a lack of
research work and scientific sources which describe it. Namely, in the developed world,
modern trade almost completely superseded the presence of traditional trade, while traditional
trade is very much present as a significant retail and trade format in developing countries.
This study is focused on characteristics of modern trade in developing countries and
the role of corporate social responsibility (CSR) for modern trade chains. The issue of
corporate social responsibility becomes a key topic for companies across industries and it
becomes a desirable form of business strategy in development of companies. In order to
examine these issues, an empirical research was conducted on an example of the cosmetic
modern trade chains (DM and CM companies), using secondary data and a qualitative research
with short semi-structured interviews of 30 random consumers in the Sarajevo, Bosnia and
Herzegovina (BIH) city center.
A surprising finding of this study is that the segment of cosmetic products is bought
exclusively through modern trade channels according to the indicators from primary research,
while secondary data show that in BIH traditional trade channels still dominate in comparison
to the modern ones. Conducted researches showed that customers are very loyal to CM and
DM and that they prefer these companies to the competitors, even if the competitor holds
lower price.

32
Concerning socially responsible marketing, it is noted and stated as one of the
significant reasons for purchase in DM, while CM consumers did not even state it as the
reason of their purchase. All of this speaks to the fact that socially responsible marketing of
DM significantly influences the loyalty of its consumers since DM company, through its
marketing activities, places consumers’ interests and relation to the environment before its
profitable goals.
Keywords: modern trade, retail, corporate social responsibility, cosmetic chains
JEL classification: L81, M14
1. Introduction
In the development and classification of retail, we distinguish traditional trade including small,
usually family, grocery stores, and modern trade, which includes supermarkets and large
specialized stores that usually transform into a trading chain (Goldman, Ramaswami and
Krider, 2002). One of the most famous companies that represents the trend of modern trade is
Wal-Mart (Bloom and Perry 2001). Wal-Mart art also initiated the trend of retail chains power
concentration. Weakening the power of the producer and strengthening the power of big retail
chains (modern trade) is one of the most obvious development in the field of trade in the
previous period (Lewis, 2000).
Nowadays, companies invest in corporate social responsibility more and more
(McWilliams and Siegel, 2000). Awareness of the issues such as equal opportunities for all,
racial equality, and safety and health in the working place first initiated the public to question
business customs (Tafra-Vlahovic, 2009). Terms corporate social responsibility, sustainable
development of companies and corporate citizenship are used almost alternatively today.
Corporate social responsibility can simply be defined as a duty of each corporate body
(company, organization, state body, etc.) to protect the interest of the society (Holme and
Watts, 1999).
Previous researches dealt with the role of corporate social responsibility in retail.
Oppewal, Alexander and Sullivan (2006) focused on the influence of socially responsible
initiatives in shopping centers on the perception of their attractiveness by the consumers. The
study partly confirmed the thesis that socially responsible performances positively influence
the attractiveness of shopping centers. The aforementioned implies that corporate social
responsibility can influence the perception of the brand and image of a retailer.
Researchers also state that retail sector is famous for managing to collect the largest
sums for charitable purposes (Barone, Norman and Miyazaki, 2007). For example, CVS
corporation implemented the strategy of donating 25 cents per 35 dollars purchase for
UNICEF, which resulted in 11% increase in sale for CVS. As a significant factor for
consumers’ perception is retailer’s motivation perception, and thus the consumers rated
positively those retailers which they perceived to be truly motivated in a specific socially
responsible activity (Barone, Norman and Miyazaki, 2007).
In a research that included 460 consumers, Gupta and Pirsch (2008) showed that
corporate social responsibility, its politics and practice influence the creation of image
perception of a retailer. Corporate social responsibility is especially efficient in influencing the
image of retail store in case positive performance perception of a retailer is present in
consumers, which significantly influences their satisfaction and loyalty to a retail store.

33
Against this background, the present study is set to examine the following research
questions: (1) what are the characteristics of a modern trade retail chains, in Bosnia and
Herzegovina as a representative developing country? and (2) how corporate social
responsibility of retail chains is connected to the consumers’ perceptions of such retail chains?
There are various types of modern trade retailers. To assess the research questions, this
work focuses on two famous retailers in the sector of hygiene and cosmetics: DM and CM.
DM is a German company with a strong position in the entire Europe, and CM is a company
from Bosnia and Herzegovina which successfully operates in the domestic market. Hence, the
comparison of globally positioned and locally positioned retailer brand could be made.
Characteristics of these two retailers, as representatives of modern trade chains, are
researched, along with the significance of their corporate social responsibility for the
consumers.
2. Theoretical Background
Retail organizations, as agents in the distribution channels, operate with a task of direct
distribution of goods to the final consumers. A primary concern of a retailer is expressed in the
placement of goods whose amount is determined by individual purchase (or a household in
question). Performing this function, retail operates as an agent between the producers and
consumers, representing at the same time one of the phases in distribution channels.
Retail organizations need to satisfy consumers’ needs though the structure of its
assortment, amount and quality of goods and services, at the most convenient place and time,
at prices that respond to consumers’ values. Quality and quantity of offered goods that
represent the retail assortment should be synchronized with the consumers’ purchasing power
to better target an offer.
Retail, as a tertiary and work intensive economic activity, is shaped in line with the
production and consumption. Considering its development, its role constantly grows, both in
national income and when assessing the total number of the employees in the sector. Some
large retailers are employing so many people across countries/regions that they can even
become “too big to fail” and of significant concern for the economies.
In purchase decision making at a specific store, consumers are guided by numerous
criteria (features) like: distance, product and service price, width and depth of assortment,
service, parking availability, etc. (Brcic-Stipcevic and Renko, 2007). Evaluation, or retail
control, is performed continually in comparing the achieved business results with the planed
indicators (Krkac, 2007). Retail control does not encompass only the deviations of the
achieved from planned indicators, but also determines samples with the purpose of taking
certain business activities in the following period. Retail is constantly changing, and fast
change is significantly expedited in the past decade.
As its highest priority, retail included decision making on acquiring necessary
products, but now a holistic access to management and marketing is present, turning to the
consumer more and more, collecting information on their behavior and using an insight into
their consumer habits. Once a one-sided business transformed into a highly sophisticated form
activity requiring significant efforts of management and marketing.
Retail encompasses companies included primarily in the activities of product purchase
from other companies with the intention to sell these goods once again to the final distributor,
usually without transforming the product. Retail process is a final step in goods distribution;

34
therefore, in retail sale products are sold at in smaller quantities to wider population. This
process also includes transport and warehousing of goods. Development in other areas is
responsible for dynamic changes in present day retail management. In the most developed
countries, retail grew and developed dramatically partly due to the occurrence of big trading
chains (modern trade) which took a significant part at the market from small independent trade
stores (traditional trade). These chains first developed regionally and later nationally.
In the past decade, mergers and acquisitions among large chains intensified such
development. Many retail companies now operate with enormous incomes, large number of
employees and branched sales network. The largest retail chain, Wal-Mart at the end of 2017
earned $ 485 billion in profits (Marketwatch, 2018), which exceeds gross domestic product of
many small countries. Wal-Mart itself employs 1.8 million people. French Carrefour, the
largest European retail chain and second in the world, has a network of 12.000 retail stores
worldwide. At the same time, a lot of retail chains developed into multinational companies
which function in many countries offering different retail services to tis consumers. For
example, Carrefour is now a multinational company which uses hypermarkets, supermarkets,
standard stores, discount sale facilities, through which they sell goods to the consumers in 30
different countries. More than a half of Carrefour’s income is realized outside the domestic
market. German Metro group owns food supermarkets, electronics stores, wholesale facilities,
cash & carry and more than 50% of their income is realized at 29 markets outside Germany.
Tesco has a rapid growth into the market of East Europe and Asia and successfully operates
via e-trade at Tesco.com. Even though the growth of electronic trade was overrated at first, it
still developed slowly but firmly, and now Tesco earns EUR 1 billion EUR via electronic
trade.
In most countries, retail organizations are becoming more and more concentrated.
Researches in Great Britain show that first 5 retail food chains make up over 55% of the
market, and in France over 70%. Therefore, redistribution of power between distribution
chains is one of the most obvious developments in the past decade (Lewis, 2000).
Power of retail organisations grows, now they can be compared to large producers,
such as global brands like Proctor & Gamble, Sony or Nestle. Therefore, today a great part of
the producer’s profit depends on several large retail chains. Along with such development
comes an increase in marketing, IT and top management budget.
Increase in sales is not the only contribution to the change in distribution of power
among retail chains, but also increased sophistication in retail management combined with
larger customer’s data availability. Retail is one of the leaders in the field of appliance of new
technologies.
Retail point of sale (PoS) data became more valuable since IT systems are now capable
to process such large amount of data in a short period of time. Also, since retail organisations
grew from regional to national chains, they were capable to acquire knowledge on consumer
trends, sales flow related to certain products which increased their significance on the
products’ way to customers. Data related to the customers are now gathered through loyalty
cards which increase knowledge on consumer habits.
Retail is an agent in the distribution chain. However, even though retail was
considered to be a passive link in the chain of values from producer to consumer, today retail
uses its position to become a dominant player in the distribution chain. Retail chains now
develop their own marketing and logistic concepts and take leadership in marketing and
logistics in vertical with the manufacturer.
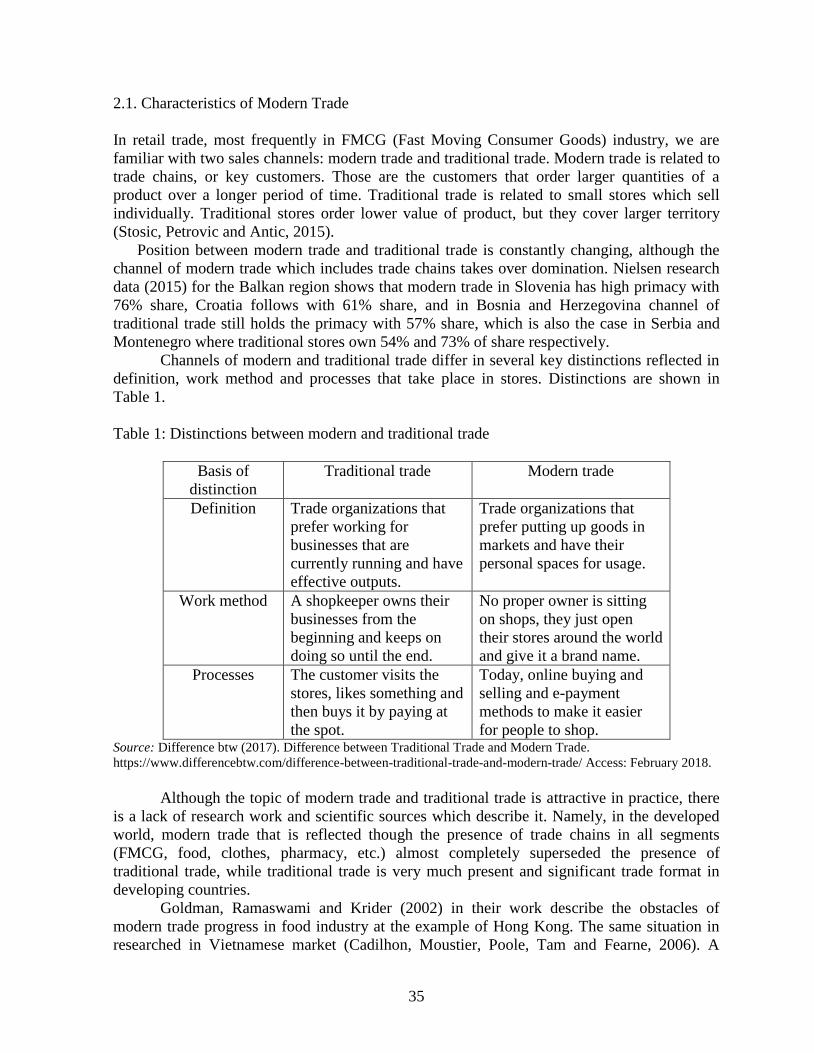
35
2.1. Characteristics of Modern Trade
In retail trade, most frequently in FMCG (Fast Moving Consumer Goods) industry, we are
familiar with two sales channels: modern trade and traditional trade. Modern trade is related to
trade chains, or key customers. Those are the customers that order larger quantities of a
product over a longer period of time. Traditional trade is related to small stores which sell
individually. Traditional stores order lower value of product, but they cover larger territory
(Stosic, Petrovic and Antic, 2015).
Position between modern trade and traditional trade is constantly changing, although the
channel of modern trade which includes trade chains takes over domination. Nielsen research
data (2015) for the Balkan region shows that modern trade in Slovenia has high primacy with
76% share, Croatia follows with 61% share, and in Bosnia and Herzegovina channel of
traditional trade still holds the primacy with 57% share, which is also the case in Serbia and
Montenegro where traditional stores own 54% and 73% of share respectively.
Channels of modern and traditional trade differ in several key distinctions reflected in
definition, work method and processes that take place in stores. Distinctions are shown in
Table 1.
Table 1: Distinctions between modern and traditional trade
Basis of
distinction
Traditional trade Modern trade
Definition Trade organizations that
prefer working for
businesses that are
currently running and have
effective outputs.
Trade organizations that
prefer putting up goods in
markets and have their
personal spaces for usage.
Work method A shopkeeper owns their
businesses from the
beginning and keeps on
doing so until the end.
No proper owner is sitting
on shops, they just open
their stores around the world
and give it a brand name.
Processes The customer visits the
stores, likes something and
then buys it by paying at
the spot.
Today, online buying and
selling and e-payment
methods to make it easier
for people to shop. Source: Difference btw (2017). Difference between Traditional Trade and Modern Trade.
https://www.differencebtw.com/difference-between-traditional-trade-and-modern-trade/ Access: February 2018.
Although the topic of modern trade and traditional trade is attractive in practice, there
is a lack of research work and scientific sources which describe it. Namely, in the developed
world, modern trade that is reflected though the presence of trade chains in all segments
(FMCG, food, clothes, pharmacy, etc.) almost completely superseded the presence of
traditional trade, while traditional trade is very much present and significant trade format in
developing countries.
Goldman, Ramaswami and Krider (2002) in their work describe the obstacles of
modern trade progress in food industry at the example of Hong Kong. The same situation in
researched in Vietnamese market (Cadilhon, Moustier, Poole, Tam and Fearne, 2006). A

36
similar study compares traditional bazars and supermarkets was conducted in China
(Maruyama and Trung, 2007), and in Marocco (Amine and Lazzaoui, 2011). All studies are
focused more or less on reactions of the consumers to the new channel – modern trade channel
in the fields and countries more accustomed to the traditional trade offer.
This paper focuses strictly on modern trade channel in the field of cosmetic products.
Specifically, the focus is on modern trade chains DM and CM, present in Bosnia and
Herzegovina, one of which (DM) is international and the other one (CM) is local. According
to the previous research, there are eight factors that influence the perception of the consumer
in using modern trade chains (Sirohi, McLaughlin and Wittink, 1998): (1) store operations:
operational issues such as working hours, training of the employees and characteristics of the
employees, (2) store appearance: physical appearance and store organization, (3) staff
services: services offered by department managers, workers, cashiers, etc., (4) sales
promotion: sales and special actions at the store, (5) relative prices: prices in comparison to the
prices of similar products in other stores, (6) goods quality: general perception of goods
quality and diversity of brands/categories, (7) perceived value: value for money of a specific
store and (8) perceived value of the competitor: value for money of a competitor.
The very topic of this paper is focused on basic characteristics of DM and CM as
modern trade chains and examining the impact of their responsible business on user
perceptions in conducting qualitative research presented in the research part of this paper.
2.2. Corporate Social Responsibility and Modern Trade
Corporate Social Responsibility, CSR originated in social activism of the 1960s and the 1970s
of the previous century. Awareness of the issues such as equal opportunities for all, racial
equality and safety and health at the workplace were among the first issues to encourage the
public to examine business customs more closely, and then to place such obligations within
legal framework (Habunek, 2015).
For many companies this is still an experimental field since they still struggle with the
definition of basic goals of a company and avoiding unwanted consequences which could be
provoked by forcing such business objectives. European Commission defines Corporate Social
Responsibility as a concept according to which a company voluntarily integrates the care on
social issues and environmental protection into its business activities and relation to the
participants (Vrdoljak Raguz and Hazdovac, 2014). Participants are all individuals,
organisations, institutions that can influence the project/entrepreneurial venture or its activities
can influence them, positively or negatively.
The issue of corporate social responsibility becomes key topic in companies that
operate market business (Singhapakdi and Karanda, 2001), and social responsibility becomes
a desirable form of business strategy in development of companies. Definition of World
Business Council for Sustainable Development, according to the focus of the organization on
economic development, explains corporate social responsibility as a "commitment of a
company to support sustainable economic development, and, with the purpose improving the
quality of life, to cooperate with employees, their families, local communities and society in
general". Organization Business for Social Responsibility defines corporate social
responsibility as "business synchronized with ethical, legal and business expectations, and
with what society expects from companies or ever surpasses such expectations". This is a
broad definition since it includes connecting business decisions with "ethical values and legal
regulations along with the respect for people, society and environment".
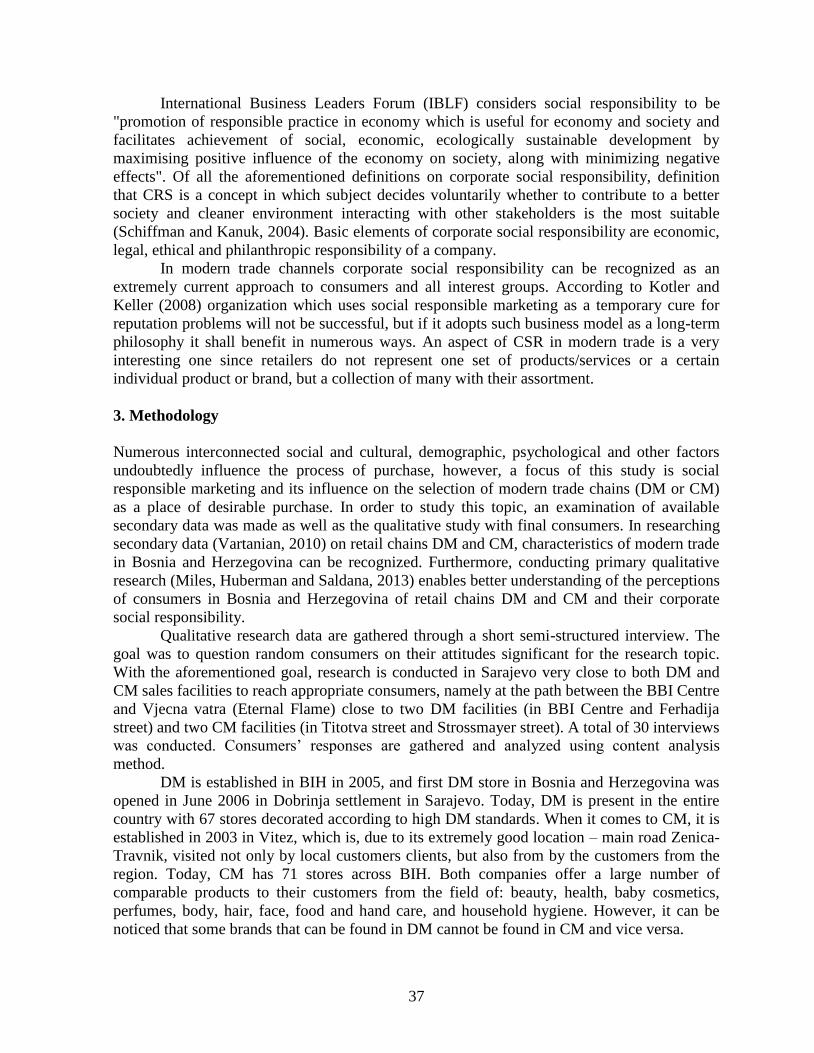
37
International Business Leaders Forum (IBLF) considers social responsibility to be
"promotion of responsible practice in economy which is useful for economy and society and
facilitates achievement of social, economic, ecologically sustainable development by
maximising positive influence of the economy on society, along with minimizing negative
effects". Of all the aforementioned definitions on corporate social responsibility, definition
that CRS is a concept in which subject decides voluntarily whether to contribute to a better
society and cleaner environment interacting with other stakeholders is the most suitable
(Schiffman and Kanuk, 2004). Basic elements of corporate social responsibility are economic,
legal, ethical and philanthropic responsibility of a company.
In modern trade channels corporate social responsibility can be recognized as an
extremely current approach to consumers and all interest groups. According to Kotler and
Keller (2008) organization which uses social responsible marketing as a temporary cure for
reputation problems will not be successful, but if it adopts such business model as a long-term
philosophy it shall benefit in numerous ways. An aspect of CSR in modern trade is a very
interesting one since retailers do not represent one set of products/services or a certain
individual product or brand, but a collection of many with their assortment.
3. Methodology
Numerous interconnected social and cultural, demographic, psychological and other factors
undoubtedly influence the process of purchase, however, a focus of this study is social
responsible marketing and its influence on the selection of modern trade chains (DM or CM)
as a place of desirable purchase. In order to study this topic, an examination of available
secondary data was made as well as the qualitative study with final consumers. In researching
secondary data (Vartanian, 2010) on retail chains DM and CM, characteristics of modern trade
in Bosnia and Herzegovina can be recognized. Furthermore, conducting primary qualitative
research (Miles, Huberman and Saldana, 2013) enables better understanding of the perceptions
of consumers in Bosnia and Herzegovina of retail chains DM and CM and their corporate
social responsibility.
Qualitative research data are gathered through a short semi-structured interview. The
goal was to question random consumers on their attitudes significant for the research topic.
With the aforementioned goal, research is conducted in Sarajevo very close to both DM and
CM sales facilities to reach appropriate consumers, namely at the path between the BBI Centre
and Vjecna vatra (Eternal Flame) close to two DM facilities (in BBI Centre and Ferhadija
street) and two CM facilities (in Titotva street and Strossmayer street). A total of 30 interviews
was conducted. Consumers’ responses are gathered and analyzed using content analysis
method.
DM is established in BIH in 2005, and first DM store in Bosnia and Herzegovina was
opened in June 2006 in Dobrinja settlement in Sarajevo. Today, DM is present in the entire
country with 67 stores decorated according to high DM standards. When it comes to CM, it is
established in 2003 in Vitez, which is, due to its extremely good location – main road Zenica-
Travnik, visited not only by local customers clients, but also from by the customers from the
region. Today, CM has 71 stores across BIH. Both companies offer a large number of
comparable products to their customers from the field of: beauty, health, baby cosmetics,
perfumes, body, hair, face, food and hand care, and household hygiene. However, it can be
noticed that some brands that can be found in DM cannot be found in CM and vice versa.

38
4. Results
In conducting a survey through short semi-structured interview 30 respondents participated
including 15 women and 15 men (Figure 1).
Figure 1: Gender of respondents
Source: Authors’ illustration
Of the total of 30 participants in the interview, most of them belong to the age group of
25-24 (40%) and then follow those aged 35-44 (30%), 15-24 (13%), 45-54 (10 %) and finally
55-64 years (7%), as shown in Figure 2.
Figure 2: Age of respondents
Source: Authors’ illustration
Male
Female

39
Participants responded that they mostly buy at DM (36%). Second in line is CM (27%),
then follows Konzum (and other hypermarkets, since some mentioned Mercator) (23%), and
finally Didaco (14%). Therefore, according to responses we can conclude that DM is entitled
with the greatest trust in the purchase of cosmetic products. Purchase share in competitor
stores shows that they rather purchase cosmetic products when purchasing other products for
personal use since CM comes at the second place. The full dispersion is shown in Figure 3.
Figure 3: Stores in which respondents purchase cosmetics and personal
hygiene products
Source: Authors’ illustration
The respondents were also asked what they would do if they discovered that the same
product is cheaper in a different store in comparison to DM (or CM). The answers show that
56% of the people would still choose DM over cheaper alternative, and if case of CM 67%
would choose CM over cheaper alternative.
First group of people consisted of those who stated that they buy cosmetic products in
DM exclusively and that they never visit other stores with that purpose. On the other hand, the
second group consists of those that state that they would always choose CM over DM, since
CM offers different actions and much cheaper products. One female respondent stated "I
purchase cosmetics in CM exclusively, I have their loyalty card and they have all the products
I need at the best prices". These answers lead to the conclusion that consumers are more
inclined to CM for better prices and benefits and that they are more loyal to it, i.e. that smaller
number of them leaves to other stores for lower prices. On the other hand, there is a significant
segment of those who are loyal only to DM.
DM
KONZUM
DIDACO
CM
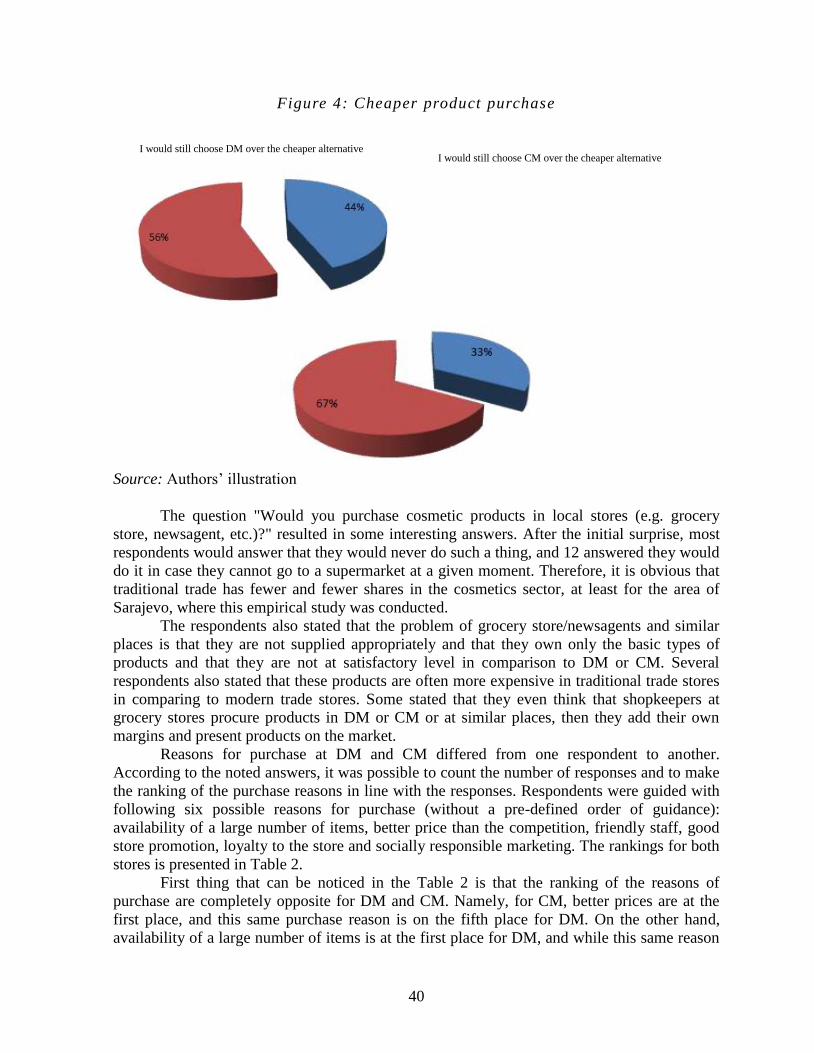
40
Figure 4: Cheaper product purchase
Source: Authors’ illustration
The question "Would you purchase cosmetic products in local stores (e.g. grocery
store, newsagent, etc.)?" resulted in some interesting answers. After the initial surprise, most
respondents would answer that they would never do such a thing, and 12 answered they would
do it in case they cannot go to a supermarket at a given moment. Therefore, it is obvious that
traditional trade has fewer and fewer shares in the cosmetics sector, at least for the area of
Sarajevo, where this empirical study was conducted.
The respondents also stated that the problem of grocery store/newsagents and similar
places is that they are not supplied appropriately and that they own only the basic types of
products and that they are not at satisfactory level in comparison to DM or CM. Several
respondents also stated that these products are often more expensive in traditional trade stores
in comparing to modern trade stores. Some stated that they even think that shopkeepers at
grocery stores procure products in DM or CM or at similar places, then they add their own
margins and present products on the market.
Reasons for purchase at DM and CM differed from one respondent to another.
According to the noted answers, it was possible to count the number of responses and to make
the ranking of the purchase reasons in line with the responses. Respondents were guided with
following six possible reasons for purchase (without a pre-defined order of guidance):
availability of a large number of items, better price than the competition, friendly staff, good
store promotion, loyalty to the store and socially responsible marketing. The rankings for both
stores is presented in Table 2.
First thing that can be noticed in the Table 2 is that the ranking of the reasons of
purchase are completely opposite for DM and CM. Namely, for CM, better prices are at the
first place, and this same purchase reason is on the fifth place for DM. On the other hand,
availability of a large number of items is at the first place for DM, and while this same reason
I would still choose DM over the cheaper alternative I would still choose CM over the cheaper alternative
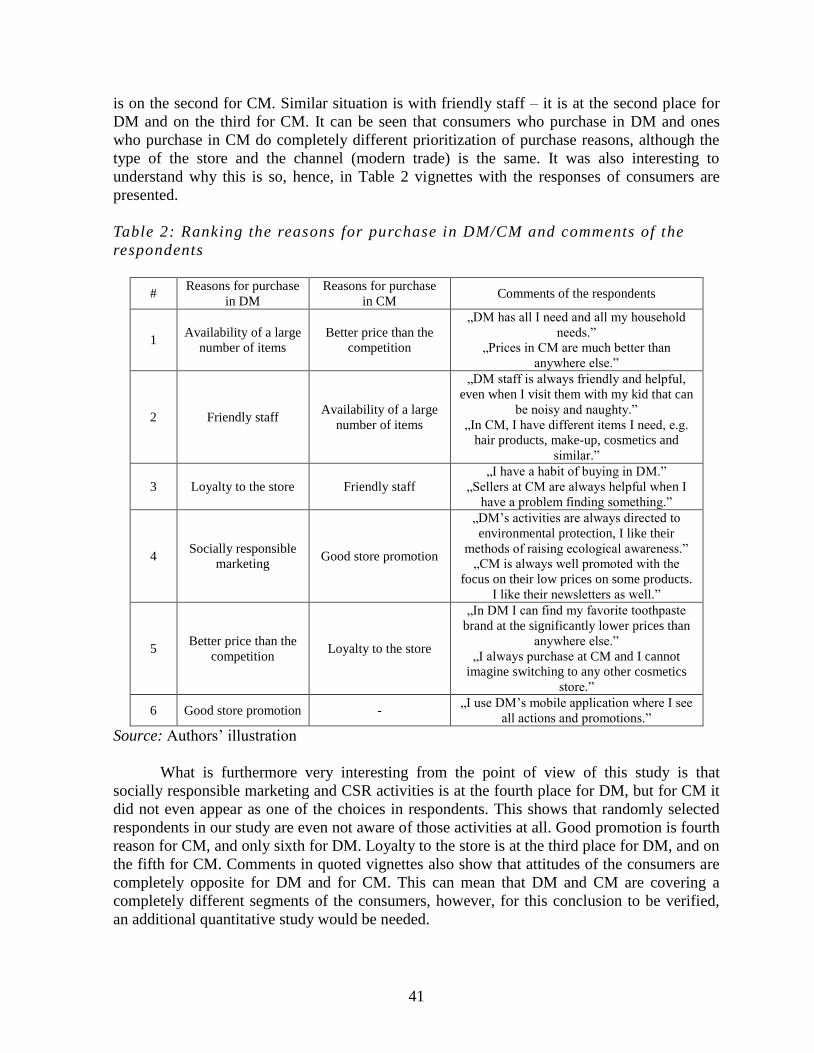
41
is on the second for CM. Similar situation is with friendly staff – it is at the second place for
DM and on the third for CM. It can be seen that consumers who purchase in DM and ones
who purchase in CM do completely different prioritization of purchase reasons, although the
type of the store and the channel (modern trade) is the same. It was also interesting to
understand why this is so, hence, in Table 2 vignettes with the responses of consumers are
presented.
Table 2: Ranking the reasons for purchase in DM/CM and comments of the
respondents
# Reasons for purchase
in DM
Reasons for purchase
in CM Comments of the respondents
1 Availability of a large
number of items
Better price than the
competition
„DM has all I need and all my household
needs.”
„Prices in CM are much better than
anywhere else.”
2 Friendly staff Availability of a large
number of items
„DM staff is always friendly and helpful,
even when I visit them with my kid that can
be noisy and naughty.”
„In CM, I have different items I need, e.g.
hair products, make-up, cosmetics and
similar.”
3 Loyalty to the store Friendly staff
„I have a habit of buying in DM.”
„Sellers at CM are always helpful when I
have a problem finding something.”
4 Socially responsible
marketing Good store promotion
„DM’s activities are always directed to
environmental protection, I like their
methods of raising ecological awareness.”
„CM is always well promoted with the
focus on their low prices on some products.
I like their newsletters as well.”
5 Better price than the
competition Loyalty to the store
„In DM I can find my favorite toothpaste
brand at the significantly lower prices than
anywhere else.”
„I always purchase at CM and I cannot
imagine switching to any other cosmetics
store.”
6 Good store promotion - „I use DM’s mobile application where I see
all actions and promotions.”
Source: Authors’ illustration
What is furthermore very interesting from the point of view of this study is that
socially responsible marketing and CSR activities is at the fourth place for DM, but for CM it
did not even appear as one of the choices in respondents. This shows that randomly selected
respondents in our study are even not aware of those activities at all. Good promotion is fourth
reason for CM, and only sixth for DM. Loyalty to the store is at the third place for DM, and on
the fifth for CM. Comments in quoted vignettes also show that attitudes of the consumers are
completely opposite for DM and for CM. This can mean that DM and CM are covering a
completely different segments of the consumers, however, for this conclusion to be verified,
an additional quantitative study would be needed.
42
Concerning marketing activities of both companies, interviewed consumers are
generally not aware of them. Their attention is mostly occupied by promo catalogues both for
CM and DM. During the interview we could not conclude that promotional activities directly
influence the reasons for purchase, however it is possible that they influence respondents’
attitudes on the brand.
Socially responsible marketing implies that a company is socially responsible in its
marketing activities protecting the interests of its consumers. DM already applies socially
responsible marketing but by applying considering it even stronger it can elevate the status of
this activity in the consumers’ mind and make it even a stronger reason for purchase by their
consumers and improve its chances for long-term business and strengthen its market position.
Current adopted concept of socially responsible marketing of DM provides this company with
good image and reputation, however applying stated recommendations and improving its
marketing activities as socially responsible, DM can achieve for customers to recognize that as
its added value and advantage before competition.
CM should also pay more attention to a better socially responsible marketing. Since the
consumers rather choose the products of the companies that show care for consumers’
interests, applying socially responsible marketing in CM can keep and increase loyalty of its
customers. With the secondary research insights, it could be seen that CM has several active
CSR campaigns and that it shows its social responsibility to the community in various reasons,
however, these activities are still not at the level which is strong enough to be recognized by
consumers as a reason for purchase.
5. Discussion and Conclusions
Review of relevant research literature gives a brief overview of the field of retail trade, with a
special emphasis on rarely researched topic of modern and traditional trade channels in retail.
In addition, the focus of the study was on the application of the concept of socially responsible
marketing in the modern trade chains. Based on the conceptual framework and previously
conducted studies, in this study, an empirical research was conducted consisting of the
overview and analysis of secondary data on an example of modern trade chains in the
cosmetics sector (DM and CM companies), and qualitative research using short semi-
structured interviews of 30 random consumers in the Sarajevo city center.
A surprising finding of this paper is that the segment of cosmetic products is bought
exclusively through modern trade channels according to the indicators from the interviews,
while secondary data show that in BIH traditional trade channels still dominate in comparison
to the modern ones. Possible reason of this finding is that the respondents were placed in the
area of Sarajevo where many modern trade stores are located, and the whole country was
included in the sample, the results would probably be different and more dispersed, since some
places and even towns do not have modern trade stores.
Interviews also showed that customers are very loyal to both examined modern trade
stores, CM and DM, and that this loyalty is even at the behavioral level, since they prefer these
companies to the competitors, even if the competitor holds lower price. It is especially
interesting that higher percent of loyalty is expressed in the case of CM than DM, and a
possible reason is the fact that CM is generally known for better prices and greater sales
promotions for their product assortment than DM.
On the other hand, concerning socially responsible marketing, it is noted and stated as
one of the significant reasons for purchase in DM, while CM consumers did not even state it
43
as the reason of their purchase. All of this speaks to the fact that socially responsible
marketing of DM significantly influences the loyalty of its consumers since DM company,
through its marketing activities, places consumers’ interests and relation to the environment
before its profitable goals. This makes it a company that operates its business ethically,
socially responsible and desirable, which reflects on loyalty of DM customers who choose DM
over other stores due to all the aforementioned applied activities. All of this contributes to a
great business success of DM, but also to the protection and strengthening of interest of its
consumers who always come back faithfully.
DM continually starts and supports numerous projects and campaigns related to social
responsibility and ecology and participates in donating to various health, cultural, educational
and social institutions, which, on the other hand, CM must improve. They turn more and more
to biologically grown food and thus increase production lines based on ecological farming.
Research results showed that consumers perceive DM as a company which tends to protect
consumer’s interests and respects consumers’ wishes and needs, as well as the needs of entire
social community, which is the main reason of consumers’ loyalty to DM, which are main
features of trade.
When it comes to the research questions posited in this study, they are answered as
well. Namely, characteristics of modern trade are shown through characteristics of DM and
CM as chains of cosmetic and other products in BIH, and the fact that is most dominant in
consumers’ perception is the range of assortment and availability of different products. On the
other hand, it is shown that traditional trade channels have limited assortment and usually
bigger pries of the same products which eliminated them as a purchase place in the
respondents.
Concerning second research question that is related to the way corporate social
responsibility of retail chains is connected the customers’ perception of such retail chains, it
could have been seen from the primary study that CSR is significant for DM customers and is
one of 6 basic reasons of purchase in DM stores, and that they are aware of different actions
(including social and ecologically aware activities), while CM customers are not even aware
of these activities and do not state them as a significant reason for purchase.
This research has its limitations as well. Sample representativeness of the interviewed
respondents is certainly one of them. Although qualitative research does not necessarily need
to be representative, since neither causal relations nor statistically confirmed hypotheses have
been created, insights of the study would probably be different if we included respondents
from the entire BIH. Also, one of the limitations is lack of literature in the field of modern and
traditional trade, so literature review was mainly based on characteristics of wholesale and
retail in general. Further studies should focus on examining this issue from the quantitative
point of view, trying to make causal connections between potential reasons of purchase and
CSR activities and consumers’ perceptions, attitudes and behaviors.
References
Amine, A. & Lazzaoui, N. 2011. Shoppers' reactions to modern food retailing systems in an
emerging country: the case of Morocco. International Journal of Retail & Distribution
Management, 39(8): 562-581.
Barone, M. J., Norman, A. T. & Miyazaki, A. D. 2007. Consumer response to retailer use of
cause-related marketing: Is more fit better? Journal of Retailing, 83(4): 437-445.

44
Berman, B. & Evans J. 2006. Retail Management: A Strategic Approach. New Jersey: Prentice
Hall.
Bloom, P. N. & Perry, V. G. 2001. Retailer power and supplier welfare: The case of Wal-
Mart. Journal of Retailing, 77(3): 379-396.
Brcic-Stipcevic, V. & Renko, S. 2007. Cimbenici utjecaja na izbor maloprodajnih oblika.
Zbornik ekonomskog fakulteta u Zagrebu, 5(1): 387-401.
Cadilhon, J. J., Moustier, P., Poole, N. D., Tam, P. T. G. & Fearne, A. P. 2006. Traditional vs.
modern food systems? Insights from vegetable supply chains to Ho Chi Minh City
(Vietnam). Development Policy Review, 24(1): 31-49.
Difference btw. 2017. Difference between Traditional Trade and Modern Trade.
https://www.differencebtw.com/difference-between-traditional-trade-and-modern-
trade/. accessed: February 2018.
Goldman, A., Ramaswami, S. & Krider, R. E. 2002. Barriers to the advancement of modern
food retail formats: theory and measurement. Journal of Retailing, 78(4): 281-295.
Gupta, S. & Pirsch, J. 2008. The influence of a retailer's corporate social responsibility
program on re-conceptualizing store image. Journal of Retailing and Consumer
Services, 15(6): 516-526.
Habunek, D. 2015. Utjecaj drustveno odgovornog poslovanja na ponasanje potrosaca u
Varazdinskoj zupaniji (Doctoral dissertation), University North. University centre
Varazdin. Department of Communicology and Public Relations.
Holme, R. & Watts, P. 1999. Corporate social responsibility. Geneva: World Business Council
for Sustainable Development.
Kotler, P. & Keller, K. L. 2008. Upravljanje marketingom, Zagreb: MATE.
Krkac, K. 2007. Uvod u poslovnu etiku i korporacijsku drustvenu odgovornost. Zagreb:
MATE.
Lewis, A. 2000. The Cambridge handbook of psychology and economic. London: Cambridge
University Press.
Marketwatch. 2018. Annual Financials for Walmart Inc.
https://www.marketwatch.com/investing/stock/wmt/financials/. accessed: March 2018.
Maruyama, M. & Trung, L. V. 2007. Traditional bazaar or supermarkets: A probit analysis of
affluent consumer perceptions in Hanoi. International Review of Retail, Distribution
and Consumer Research, 17(3): 233-252.
McWilliams, A. & Siegel, D. 2000. Corporate social responsibility and financial performance:
Correlation or misspecification? Strategic Management Journal, 21(5): 603-603.
Miles, M. B., Huberman, A. M. & Saldana, J. 2013. Qualitative Data Analysis.3rd ed. Sage
Publications Inc.
Oppewal, H., Alexander, A. & Sullivan, P. 2006. Consumer perceptions of corporate social
responsibility in town shopping centres and their influence on shopping evaluations.
Journal of Retailing and Consumer Services, 13(4): 261-274.
Schiffman G.L. i Lazar Kanuk L. 2004. Ponasanje potrosaca. Zagreb: MATE.
Singhapakdi, A. & Karanda, K. 2001. How important are ethics and social responsibility?
European Journal of Marketing, 35(1/2): 133-145.
Sirohi, N., McLaughlin, E. W. & Wittink, D. R. 1998. A model of consumer perceptions and
store loyalty intentions for a supermarket retailer. Journal of retailing, 74(2): 223-245.
Stosic, B., Petrovic, N. & Antic, S. 2015. ZBORNIK RADOVA - X Skup privrednika i
naucnika SPIN’15: INOVATIVNA RESENJA. Privredna komora Srbije.

45
Tafra-Vlahovic, M. 2009. Konceptualni okvir drustveno odgovornog poslovanja.
MEDIANALI-znanstveni casopis za medije, novinarstvo, masovno komuniciranje,
odnose s javnostima i kulturu drustva, 3(5): 163-184.
Vartanian, T. P. 2010. Secondary Data Analysis. London: Oxford University Press.
Vrdoljak Raguz, I., & Hazdovac, K. 2014. Drustveno odgovorno poslovanje i hrvatska
gospodarska praksa. Oeconomica Jadertina, 4(1): 40-58.
46
ALL YOU NEED IS LOVE! THE ROLE OF BRAND PERSONALITY IN
GENERATING FEELINGS OF LOVE TOWARD A BRAND
Adi Alic
Sarajevo School of Economics and Business
Trg oslobodjenja – Alija Izetbegovic 1, 71 000 Sarajevo, Bosnia and Herzegovina
Phone: ++ 387 33 253 752; Fax: ++ 387 33 275 969
E-mail: [email protected]
Merima Cinjarevic
School of Economics and Business Sarajevo
Trg oslobodjenja – Alija Izetbegovic1, 71 000 Sarajevo, Bosnia and Herzegovina
Phone: ++ 387 33 275 900; Fax: ++ 387 33 275 969
E-mail: [email protected]
Emir Agic
Sarajevo School of Economics and Business
Trg oslobodjenja – Alija Izetbegovic 1, 71 000 Sarajevo
Phone: ++ 00387 33 275 960; Fax: ++ 387 33 275 969
E-mail: [email protected]
Abstract
The purpose of this research is to highlight the role of brand personality dimensions
(‘excitement’ and ‘sincerity’) in the formation of brand love for national and private label brands.
We propose to address this issue by seeking answers to the following questions: (1) Do brand
personality dimensions ('excitement' and 'sincerity') contribute to the formation of a love emotion
toward a brand? (2) Are there differences in the size of effects between brand personality
dimensions and love emotion toward a brand among national and private label brands? Data were
collected through a field survey via the store-intercept method. To test the research hypotheses, we
resort to two samples, which implied the collection of usable 662 questionnaires. Research
instrument – questionnaire compromised scales which were validated and found reliable in
previous research. Confirmatory factor analysis was used to test the reliability, convergent and
discriminant validity of the constructs of interest. Structural equation modeling (SEM) technique
was employed to analyse the effect of brand personality dimensions (‘excitement’ and ‘sincerity’)
on brand love. Moreover, group comparisons were made between national brands and private label
brands, using structural equation modelling. Our findings suggest that two dimensions of brand
personality – ‘excitement’ and ‘sincerity’ have a significant positive influence on brand love for
both types of brands (national and private label brands). The multiple group analysis identified
differences in the influence of brand personality dimensions ('excitement' and 'sincerity) on brand
love between national brands and private label brands. The brand 'excitement' seems to contribute
the most to brand love for national brands, whereas brand 'sincerity' contributes the most to brand
love in the context of private label brands. This study provides marketing managers of national and
private label brands some insights into how to spur brand love. Our results reinforce the notion of
the importance of personality characteristics attached to brand in the formation of love-like
emotion toward a brand.
47
Keywords: Brand love, Brand personality, Consumer-brand relationships, Private label brands,
National brands
JEL classification: M30
1. Introduction
Besides declaring love to our loved ones, the word ‘love’ is also commonly used when talking
about products and brands. Phrases such as “I absolutely love this Chanel dress! “, “I adore
Dior! “, “I love Starbucks Coffee!“ or “Manolo Blahnik - Love His Shoes!“ are quite often
heard. Marketing experts have already picked up the idea of beloved brands, and they rely
heavily on emotionally laden advertising (e.g., McDonald's: "I'm Lovin' It," the 1st generation
MINI Cooper's: “Is it love?", Tiffany& Co.: “What Makes Love True?“). Although
management-oriented literature (e.g., the idea of a ‘lovemark’ developed by the CEO of
Saatchi & Saatchi Kevin Roberts in 2005), has already exposed emotions as a core concept for
building and retaining strong bonds between a consumer and a brand, academic research on
this topic is still in its infancy (Heinrich, Albrecht and Bauer, 2012; Hegner, Fenko and
Teravest, 2017).
Previous brand love related research placed focus on a clear differentiation of brand
love with other consumer-brand relationship constructs such as brand trust, brand
identification or brand attachment, as well as issues of conceptualization and
operationalization of brand love (e.g., Batra, Ahuvia & Bagozzi, 2012; Carroll and Ahuvia,
2006; Shimp and Madden, 1988). The focus of most brand love studies is on national brands
(e.g., Albert and Merunka, 2012; Bairrada, Coelho and Coelho, 2018; Albert, Merunka, and
Valette-Florence 2008; Batra et al., 2012; Carroll and Ahuvia, 2006). However, there is a
paucity of research on the consumer - brand love relationships in the context of private label
brands (e.g., Pandowo, 2016; Roy, Khandeparkar and Motiani, 2016).
Private label brands, i.e., brands sponsored or owned by retailers and sold exclusively
in their stores, have experienced remarkable growth over the last decades. The penetration and
transformation of private label brands across countries, industries, and product categories have
dramatically changed the competitive brand landscape. Nowadays, private label brands are
present in more than 90% of the categories of consumer packaged goods (CPGs) enjoying
broad product assortments, with high levels of visibility in hypermarkets, supermarkets, and
discounters (Cuneo, Milberg, Alarcon-del-Amo and Lopez-Belbeze, 2018). According to the
latest data published by the PLMA (Private Label Manufacturer Association) private label
brands have achieved at least a 30% share of sales in 17 European countries. Overall, Europe
is considered the most developed private label brand region with the countries Spain (52%),
Switzerland (51%), United Kingdom (46%), Germany (45%), and France (33%) reporting the
highest market share of private label brands in Europe and worldwide. Moreover, the growth
of private label brands is also higher than that experienced by national brands (2.5% vs. 1.5%)
(Cuneo et al., 2018). According to a forecast from Rabobank (2012), by 2025, private label
brands are expected to reach a global market share of 50% across all CPG categories. This
makes them of greater strategic importance to retailers and an increasing threat to producers of
national brands.
The relationship between national brands and private label brands can be characterized
as both one of dependency and a struggle for channel control (Garretson, Fisher and Burton,
2002). This peculiar ‘marriage’ creates uneasy alliances between the parties as they need each

48
other and yet simultaneously compete to maximize their share of channel profit. Sitting side
by side on retailers’ shelves, private label brands and national brands are ‘strange bedfellows’
who are struggling to win the hearts and minds of consumers. Thus, exploring the factors
which can lead to the formation of a love-like emotion toward a national brand and private
label brands is an important aspect of research that is interesting and worth studying.
Therefore, this study aims to investigate how brand personality dimensions
(‘excitement’ and ‘sincerity’) are related to the brand love of two types of brands - national
and private label brands. To this end, this study focuses on an emerging and less-investigated
market in the south-eastern region in Europe (i.e., Bosnia and Herzegovina). The following
research questions guide our study:
RQ1. Do brand personality dimensions ('excitement' and 'sincerity') contribute to the
formation of a love emotion toward a brand?
RQ2. Are there differences in the size of effects between brand personality dimensions
and love emotion toward a brand among national and private label brands?
This paper is organized as follows. First, we provide a literature review and hypotheses
corresponding to research objectives. Then, the methodology is described. Next, the results
are discussed, to end with some conclusions, implications and the research limitation.
2. Research background and hypotheses
2.1. Brand love: the concept and its importance
Although brand love is a well-known and essential concept in research on brand-consumer
relationship, there is very little agreement as to what brand love is (Batra et al., 2012). Carrol
and Ahuvia (2006: 81) defined brand love as ‘‘the degree of passionate emotional attachment
a satisfied consumer has for a particular trade name’’. Similarly, Albert, Merunka and Valette-
Florence (2009) described brand love as a strong feeling, made up with a passion and/or a
feeling of affection, of a consumer for a brand. Due to the lack of consensus pertaining to the
definition of brand love, Batra et al. (2012) proposed a prototype-based definition of brand
love. Using a prototype approach, which posits that complex or fuzzy concepts are best
described by a list of attributes that are typically associated with a particular concept, Batra et
al. (2012) position brand love as the type of the relationship (rather than as an emotion) that
consumers establish with the brands. These relationships are very complex and multi-layered,
and they tend to encompass “multiple interrelated cognitive, affective, and behavioral
elements, rather than a specific, single, transient love emotion“ (Batra et al, 2012: 6).
The differences between existing definitions of brand love have led to differing brand
love's conceptualizations. In their ground-breaking study, Shimp and Madden (1988) proposed
a tripartite conceptualization of brand love – liking, yearning, and commitment. Similarly,
Keh, Pang and Peng (2007) argue that brand love is a tri-dimensional construct, which can be
decomposed into intimacy, passion, and commitment, reflecting its emotional, conative, and
cognitive bases, respectively. Adapting the triangular theory of love of Sternberg (1986) in a
consumption context, Thomson, MacInnis and Whan Park (2005) argue that brand love
encompasses three dimensions, namely affection, connection, and passion. While some
scholars have applied interpersonal love theories to define and conceptualize brand love,
others have studied this feeling as “a new marketing construct that helps explain and predict

49
variation in desirable post-consumption behaviors among satisfied consumers” (Carrol and
Ahivia, 2006: 79). Carrol and Ahuvia (2006), without making any reference to interpersonal
love theories, suggest that brand love includes the following elements: (1) passion for the
brand, (2) attachment to the brand, (3) positive evaluation of the brand, (4) positive emotions
in response to the brand, and (5) declarations of love for the brand. According to Batra et al.
(2012), brand love is a long-term relationship between a consumer and brand, and it can be
characterized by the following attributes:
passion-driven behaviors, meaning the consumer has a passionate involvement with the
brand and desires to use it, has frequently interacted with the brand in the past, and
has invested resources, including time and money, in the brand;
a positive emotional connection, relating to consumers’ feelings that there is a natural
fit between the brand and themselves, and experiencing an emotional connection and
positive emotions with the brand;
self-brand integration, denoting that consumers have frequent thoughts about the brand,
which is perceived to express consumers’ current and desired self-identity, also
providing meaning to life;
long-term relationship, meaning that consumers desire the brand to be part of their life
for a long time;
anticipated separation distress, reflecting how emotionally painful it would be for
consumers if the brand were to cease existence;
positive attitude valence, involving an overall positive evaluation of the brand; and
attitude strength, which concerns a high degree of certainty and confidence in the
feelings a consumer holds about a focal brand.
A large body of existing literature advocates a multi-dimensionality of brand love.
However, Carroll and Ahuvia (2006) argue that brand-love is the uni-dimensional construct.
Although Carrol and Ahuvia's (2006) brand love scale favors unidimensionality, ten items
composing a scale capture the different faces of brand love such as passion, happiness,
delights, attachment or well-being.
As to the outcomes of brand love, the findings obtained in previous studies indicate
that brand love is positively related with brand loyalty, word-of-mouth, and willingness to pay
a premium price (e.g., Albert et al., 2009; Bairrada, Coelho and Coelho, 2018; Batra et
al.,2012). These positive outcomes of brand love suggest that identifying the antecedents of
brand love should have important payoffs.
2.2. Antecedents of brand love
Previous studies that have explored the antecedents of brand love have identified few variables
that are linked to brand love. Bairrada et al. (2018) stated that antecedents of brand love can
be separated into two different types, namely utilitarian/functional and symbolic /experiential
attributes of a brand. Studies focusing on the functional attributes as potential antecedents of
brand love found that perceived brand quality (Bairrada et al., 2018: Batra et al., 2012;
Rauschnabel and Ahuvia, 2014), brand innovativeness (Bairrada et al, 2018) are good
predictors of brand love. Additionally, there are a number of studies that rely on an
experiential approach to consumer behaviour, which have identified other antecedents of

50
brand love, including, self-congruity (Bıçakcıoğlu, İpek and Bayraktaroğlu, 2016; Huber,
Meyer, and Schmid, 2015; Wallace, Buil, and Chernatony 2014), brand identification (Albert
et al., 2013), social identity (Vernuccio, Pagani, Barbarossa and Pastore, 2015), and brand
personality (Becheur, Bayarassou and Ghrib, 2017; Glynn and Widjaja, 2017; Ismail and
Spinelli, 2012).
Although both functional/utilitarian as well as symbolic/experiential elements of a
brand are important to the formation of brand love, this study is anchored into an experiential
model of consumer behavior. As suggested by Bairrada et al. (2018) functional/utilitarian
attributes are important for brand love, but their effects are mediated by constructs with a
higher level of abstraction (e.g., self-congruity, brand personality, brand identification, etc.).
Upon a review of the literature on symbolic/experiential attributes of a brand used in
consumer-brand relationship studies, we focused on the brand personality as the attribute with
a higher symbolic/experiential weight.
Brand management scholars (Aaker, 2007; Aaker, Benet-Martinez and Garolera 2001;
Hankinson, 2004) argue that just like humans, a brand has a personality. Thus, brand
personality refers to “the set of human characteristics associated with a brand“ (Aaker, 1997:
347). Brand personality enables consumers to identify themselves with a brand and to express
their own personality through the brand, as individuals tend to consider possessions to be part
of their “self“(Belk, 1998). Brand personality is a multi-dimensional construct, encompassing
five generic dimensions: sincerity (honest, genuine and cheerful), excitement (daring,
imaginative and up-to-date), competence (reliable, dependable and efficient), sophistication
(glamorous, charming and romantic), and ruggedness (tough, strong and rugged). In this
study, the primary focus is on two dimensions of brand personality – ‘excitement’ and
‘sincerity’. As suggested by many scholars, excitement and sincerity are considered as two
fundamental dimensions that capture the majority of variance in personality rating for brands
(Aaker, 1997; Aaker, Fournier and Brasel, 2004). Moreover, previous findings suggest that
these two dimensions of brand personality are robust across individuals, product categories,
and cultural contexts (Aaker et al., 2001).
2.3. The relationship between brand personality and brand equity
Although previous research investigated different antecedents and consequences of brand
love, the relationship between brand personality and brand love is still under-researched. As
mentioned earlier, we will test the effect of two dimensions of brand personality ('excitement'
and 'sincerity') on brand love. Drawing upon the interpersonal love theories, we expect that
certain personality characteristics of a brand trigger greater brand love. On the basis of
literature review, we propose the following hypotheses:
H1: Brand personality dimension 'excitement’ is positively related to brand love, for
national brands and private label brands.
H2: Brand personality dimension 'sincerity' is positively related to brand love, for
national brands and private label brands.
H3: There are differences in the size of the effect between brand personality
dimensions ('excitement' and 'sincerity') and brand love among national and private
label brands.
3. Methodology and findings
3.1. Research setting

51
In this study, we placed focus on brand love for two types of brands, private label brands and
national brands. Since the majority of previous studies investigated brand love in the context
of national brands, findings obtained cannot be easily generalized to private label brands. To
deepen our understanding of brand love, it becomes paramount that scholars conduct more
research in the context of both national and private label brands. Thus, in this study we
selected private label brand Balea and its national brand counterpart Nivea, a German personal
care brand owned by the Hamburg-based company Beiersdorf Global AG. Balea is a private
label brand owned by dm-Drogerie Markt, the leading health and beauty retailer in the Central
and Eastern Europe, encompassing more than 3,000 retail stores in 12 countries. In Bosnia and
Herzegovina, it has been operating since 2006 and currently has more than 50 stores across the
country. It offers a budget to mid-priced private label brands across various product
categories (e.g. Alverde, Balea, Babylove, Sundance, etc.). For instance, the Balea brand
compromises a widespread, range of face, body, and hair care products for women and acts as
an umbrella brand for products that serve special needs like Balea Professional (hair care),
Balea men and Balea med for sensitive skin. As suggested by Richardson, Jain and Dick
(1996) , consumer propensity toward private label brands varies among product categories.
Thus, for the purpose of this study we chose the personal care product category (i.e., shower
gel) that carries higher purchase risk and a greater level of consumer involvement.
3.2. Data collection and sample
Data to test the research hypotheses was collected using a cross-sectional in-store intercept
survey among consumers residing in the city of Sarajevo (Bosnia and Herzegovina). At the
exit of the store, undergraduate students with general training in market research captured
customers whom they asked to complete a self-administered questionnaire that took about 10
min. The surveys were carried out at five different stores belonging to drugstore chain dm -
Drogerie Markt. Upon approaching the respondents, the interviewers identified themselves,
explained the purpose of the research, and provided respondents with the definition of national
and private label brands. To minimize the potential bias due to non-probability sampling,
interviews were conducted on both weekdays and weekends during morning and late
afternoon/evening hours. At the end of fieldwork, a total of 662 usable questionnaires were
obtained across two types of brands, 340 for national brand Nivea and 322 for private label
brand Balea. The sample was slightly skewed towards females, approximately 2:1 (68.3%
were females, and 31.7% were males). This unequal gender distribution of the sample is in
line with the assumption that women are usually more responsible for conducting the shopping
for a household than their male counterparts (Beneke, 2013). In terms of age, 23.3% of
respondents are between 20 – 30 years old; 36.2% between 31-40; 27.2% between 41-50; and
13.3% over 51 years old. Regarding educational level, 52.4% of respondents have a high
school or less, whilst 47.6% have at least a bachelor's degree. With the regard of the frequency
of national brand purchases, 97.6% of respondents said they purchased national brand Nivea
either often or sometimes. Similarly, more than three quarters (87.9%) of respondents said
they purchased private label brand Balea either often or sometimes. This indicates that the
sample is consisted of consumers who are au fait with both national and private label brands.
3.3. Research instrument

52
The research instrument - questionnaire consists of two parts. The first part of the
questionnaire deals with the measurement of the constructs of the interest: two dimensions of
brand personality (‘excitement’ and ‘sincerity’) and brand love. To measure brand love, we
adopted ten items from the scale by Carrol and Ahuvia (2006), which was used subsequently
by other authors (e.g., Khandeparkar and Motiani, 2018). Brand excitement and brand
sincerity, as two dimensions of brand personality, were captured by corresponding items from
Brand Personality Scale developed by Aaker (1997). All the items were measured on a seven
point Likert scale, from 1 totally disagree to 7 totally agree. The second part of the
questionnaire presents respondents’ demographic information (gender, age, income, education,
the frequency of national brand and private label purchases), each measured via a
categorisation scheme.
4. Results
This section focuses on the presentation and analysis of data obtained from research and
provides interpretation of the main findings. Following Anderson and Gerbing (1988)
methodological suggestion, the two-step approach for assessing structural equation models
was employed. The first stage involves the assessment of the measurement model, and the
second stage proceeds to test the structural relationships (hypotheses) among the latent
constructs. Moreover, a multigroup-analysis was carried out for national and private label
brands. The analysis was performed using a program AMOS.
Measurement model. To assess the reliability, convergent validity, and discriminant
validity of constructs of interest, Confirmatory factor analysis (CFA) was employed
Table 1. Scale items and confirmative factor analysis results Constructs Code Manifest variables and dimensions λ
Brand love
(BL)
bl1 This is a wonderful brand 0.764
bl2 This brand makes me feel good 0.687
bl3 This brand is totally awesome 0.777
bl4 I have neutral feelings about this brand. (-) 0.862
bl5 This brand makes me very happy 0.806
bl6 I love this brand! 0.863
bl7 I have no particular feelings about this brand. (-) 0.869
bl8 This brand is a pure delight 0.598
bl9 I am passionate about this brand 0.646
bl10 I’m very attached to this brand 0.521
Brand Excitement
(BE)
be1 Daring 0.659
be2 Spirited 0.987
be3 Imaginative 0.993
be5 Up to date 0.991
Sincerity
(BS)
bs1 Domestic 0.986
bs2 Honest 0.989
bs3 Wholesome 0.888
bs4 Cheerful 0.945
Source: Author's elaboration
. The measurement model was estimated using the maximum-likelihood method
(MLM) and the model fit was tested using several fit indices. Hu and Bentler (1999) argued
that it very difficult to specify cut-off value for each fit index because it does not work equally

53
well under various conditions. However, to enhance the interpretation of the findings, the
following benchmark is being provided. Values for the Root Mean Square Error of
Approximation (RMSEA) can range from zero to 1.0, whereas an RMSEA value of less than
0.5 indicates good fit, in the range of 0.05 to 0.10 is considered an indication of a fair fit, and
values above 0.1 indicated poor fit. For the Standardized Root Mean Squared Residual
(SRMR), the conventional cut-off point is less than 0.08 for a good-fitting model (Hu and
Bentler, 1999). A normed chi-square value (χ2/df) of less than 5.0 has been suggested to
indicate an adequate model fit (Schumacker and Lomax, 2004). According to Hair et al.
(2010), the Comparative Fit Index (CFI) and the Tucker-Lewis index (TLI) should be greater
than 0.9. Traditionally, values of 0.9 and greater for Goodness-of-Fit Index (GFI) and the
Adjusted Goodness of Fit Index (AGFI) indicate well-fitting models (Hooper, Coughlan and
Mullen, 2008). According the model evaluation criteria suggested in the prior discussion, the
overall fit of the measurement model to data was acceptable. Although normed chi-square
value (χ2/df) was slightly higher than recommended value (χ
2 =980.718, df=132, p<0.001), the
value of other fit indices, Comparative Fit Index – CFI (0.938), Tucker-Lewis index – TLI
(0.929), Root Mean Square Error of Approximation – RMSEA (0.070), and the Standardized
Root Mean Squared Residual – SRMR (0.0493) showed the model fit the data adequately.
We then assessed construct’s internal consistency and validity. All constructs were
deemed to be highly consistent and reliable as their composite reliability (CR) scores were
above the recommended cut-off value of 0.7 (Bagozzi and Yi, 2012). According to Hair et al.
(2010), convergent validity is satisfied if the standardized factor loading exceeds 0.5, is
significant at 0.001, and average variance extracted (AVE) is greater than 0.5. As shown in
Table 1 the standardized factor loading of items (manifest variables) ranged from 0.521 and
0.993, and all were statistically significant (p<0.001). Moreover, Average variance extracted
(AVE) of the three latent constructs (brand excitement, brand sincerity, and brand love)
ranged from 0.530 to 0.908. These findings suggest that convergent validity is satisfied.
Discriminant validity was assessed by comparing the square-root AVE of each construct to its
correlations with other constructs (Fornell and Larcker, 1981). The results showed that
discriminant validity of constructs is supported as the square-root AVE of each construct is
greater than the correlations between that construct and any other construct. Table 2 displays
CR, AVE, square-root AVE and correlation values, supporting reliability, convergent and
discriminant validity of constructs.
Table 2. Reliability, convergent and discriminant validity of constructs
Composite reliability and
convergent validity
Discriminant validitya
Construct CR AVE BL BE BS
Brand love (BL) 0.915 0.530 0.728a
Brand excitement (BE) 0.933 0.788 0.259 0.888
Brand sincerity (BS) 0.975 0.908 0.338 0.171 0.953
Note: a Square-root AVE values are in diagonals (bold) and correlations (r) are off diagonal values
Source: Author's elaboration
Structural model. Once the measurement model was validated, subsequent structural equation
modelling (SEM) analyses were conducted to test the hypotheses. The fitting indices of the
structural model are as follows: χ2
=980.718; df=132; p=0.000; CFI = 0.938; TLI = 0.929;
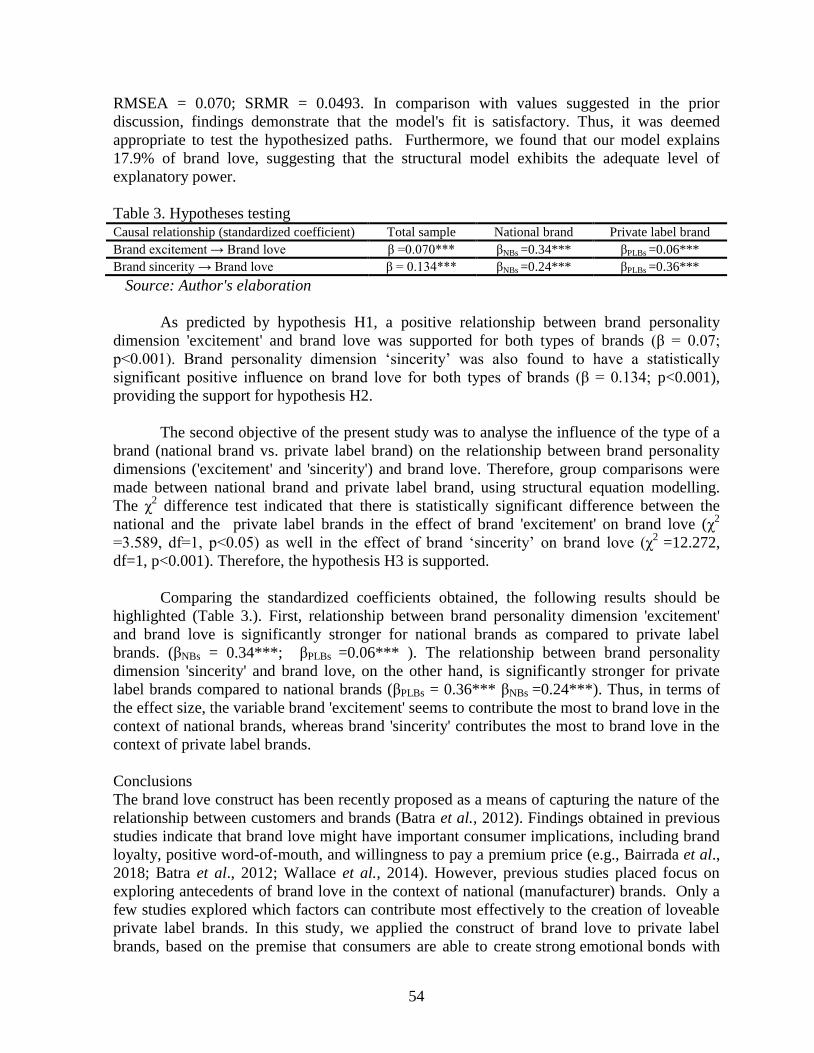
54
RMSEA = 0.070; SRMR = 0.0493. In comparison with values suggested in the prior
discussion, findings demonstrate that the model's fit is satisfactory. Thus, it was deemed
appropriate to test the hypothesized paths. Furthermore, we found that our model explains
17.9% of brand love, suggesting that the structural model exhibits the adequate level of
explanatory power.
Table 3. Hypotheses testing Causal relationship (standardized coefficient) Total sample National brand Private label brand
Brand excitement → Brand love β =0.070*** βNBs =0.34*** βPLBs =0.06***
Brand sincerity → Brand love β = 0.134*** βNBs =0.24*** βPLBs =0.36***
Source: Author's elaboration
As predicted by hypothesis H1, a positive relationship between brand personality
dimension 'excitement' and brand love was supported for both types of brands (β = 0.07;
p<0.001). Brand personality dimension ‘sincerity’ was also found to have a statistically
significant positive influence on brand love for both types of brands (β = 0.134; p<0.001),
providing the support for hypothesis H2.
The second objective of the present study was to analyse the influence of the type of a
brand (national brand vs. private label brand) on the relationship between brand personality
dimensions ('excitement' and 'sincerity') and brand love. Therefore, group comparisons were
made between national brand and private label brand, using structural equation modelling.
The χ2 difference test indicated that there is statistically significant difference between the
national and the private label brands in the effect of brand 'excitement' on brand love (χ2
=3.589, df=1, p<0.05) as well in the effect of brand ‘sincerity’ on brand love (χ2
=12.272,
df=1, p<0.001). Therefore, the hypothesis H3 is supported.
Comparing the standardized coefficients obtained, the following results should be
highlighted (Table 3.). First, relationship between brand personality dimension 'excitement'
and brand love is significantly stronger for national brands as compared to private label
brands. (βNBs = 0.34***; βPLBs =0.06*** ). The relationship between brand personality
dimension 'sincerity' and brand love, on the other hand, is significantly stronger for private
label brands compared to national brands (βPLBs = 0.36*** βNBs =0.24***). Thus, in terms of
the effect size, the variable brand 'excitement' seems to contribute the most to brand love in the
context of national brands, whereas brand 'sincerity' contributes the most to brand love in the
context of private label brands.
Conclusions
The brand love construct has been recently proposed as a means of capturing the nature of the
relationship between customers and brands (Batra et al., 2012). Findings obtained in previous
studies indicate that brand love might have important consumer implications, including brand
loyalty, positive word-of-mouth, and willingness to pay a premium price (e.g., Bairrada et al.,
2018; Batra et al., 2012; Wallace et al., 2014). However, previous studies placed focus on
exploring antecedents of brand love in the context of national (manufacturer) brands. Only a
few studies explored which factors can contribute most effectively to the creation of loveable
private label brands. In this study, we applied the construct of brand love to private label
brands, based on the premise that consumers are able to create strong emotional bonds with

55
private label brands in the same way as they are creating love-like relationships with national
brands. Given that the antecedents of brand love remain mostly unknown, this study enables
us to deepen our understanding of how brand personality dimensions ('excitement' and
'sincerity') can lead to the formation of a love-like emotion toward a national and private label
brand. This study, thus, provides credibility to the applicability of the brand attachment theory
in this context of both national and private label brands.
Regarding RQ1: “Do brand personality dimensions ('excitement' and 'sincerity')
contribute to the formation of a love emotion toward a brand?”, the answer is “Yes”. Our
findings suggest that two dimensions of brand personality (‘excitement’ and ‘sincerity’) have a
significant positive influence on brand love for both types of brands (national and private label
brands). These results suggest that ‘excitement’ and ‘sincerity’, as dimensions of brand
personality, are critical to the success of both national and private label brands. These
findings indicate that the more the brand is perceived as exciting, the more the customer will
feel the pleasure of being in love with it. A brand is perceived as exciting when its products
and packaging are innovative and original, or its advertisement campaigns are unique,
remarkable, surprising or unfamiliar. On the other hand, a brand with sincerity is seen as more
down-to-earth brand, which may mean quality at reasonable prices.
In relation with RQ2: “Are there differences in the size of effects between brand
personality dimensions and love emotion toward a brand among national and private label
brands?“, the answer is „Yes“. Our findings suggest sincerity dimension, which reflects the
down-to-earth nature of the brand, has the greater influence on brand love for private label
brands. On the other hand, excitement dimensions, suggests daring, spiritedness and
imagination, had the greater influence on brand love for national brands. These findings are in
line with previous studies arguing that relative role of brand personality in shaping consumer-
brand emotional relationships varies across product categories and type of a brand (Lim, Ahn
and Yoo, 2003; Glynn and Widjaja, 2015; Toldos-Romero and Orozco-Gómez, 2015).
The present study provides marketing managers of national and private label brands
some insights into how to spur brand love. Our results reinforce the notion of the importance
of personality characteristics attached to brand in the formation of love-like emotion toward a
brand for both national and private label brands. Building on our results, managers are
encouraged to scrutinize the personality characteristics of their brands and focus their
marketing actions on those leading to greater love links with the brand, in order to build long-
term consumer-brand relationships. A closer examination of the differences between the size
of the effect of brand personality dimensions ('excitement' and 'sincerity') on brand love
among national and brand brands suggests that marketing managers should convey different
brand personality traits to consumers in order to cultivate brand love. Marketing managers of
private label brands should emphasize the sincere attributes (e.g., nurturing, warmth, family
orientation, traditionalism) of their brands whereas marketing managers of national brands
should strengthen the excitement of their brands. Marketing managers can act on this in a
number of ways, namely, by carefully managing the price, distribution, product features and
brand communication.
This research has a number of limitations, which constitute areas for future research.
First, data were collected exclusively in the retailer’s stores located in the city of Sarajevo.
Therefore, results may differ concerning other domestic, regional and national markets as well
as other product categories. Future studies are, therefore, welcomed in expanding the domain
of this research with respect to the geographical coverage and product category. Second, the
study was carried out on a convenience sample, and future studies could improve in this

56
regard. Third, it is also possible that the frequency with which consumers use a brand, as well
as how long they have been using it, affect the love for it. Since this issue was not controlled
in the current study and has also been neglected in past research, it should be addressed in
future research endeavours. Fourth, this study only examined the impact of two dimensions of
brand personality on overall brand love. We think future studies should try to capture the
multi-dimensional nature of brand personality as well as brand love. Finally, it is possible that
the relation between brand personality dimensions and brand love might be moderated by
consumer's personality traits (e.g., self-esteem, value consciousness, product involvement,
etc.) as well as contextual variables (e.g.. type of product, the stage of market development
and the number of competing brands in the market). Hence, future studies might address this
issue.
References
Aaker, J. 1997. Dimensions of brand personality. Journal of Marketing Research, 34(3): 347-
356.
Aaker, J., Fournier, S., & Brasel, S. A. 2004. When good brands do bad. Journal of Consumer
Research, 31(1): 1-16.
Aaker, J., Benet-Martinez, V., & Garolera, J. 2001. Consumption symbols as carriers of
culture: a study of Japanese and Spanish brand personality constructs. Journal of
Personality and Social Psychology, 81(3): 492-508.
Albert, N., Merunka, D., & Valette-Florence, P. 2009. The feeling of love toward a brand:
Measurement and concept. Advances in Consumer Research, 36, 300–307.
Anderson, J.C., & Gerbing, D.W. 1988. Structural equation modelling in practice: a review
and recommended two-step approach. Psychological Bulletin, 103(3): 411-423.
Bagozzi, R. P., & Yi, Y. 2012. Specification, evaluation, and interpretation of structural
equation models. Journal of the Academy of Marketing Science, 40(1): 8–34.
Bairrada, C., Coelho, F., & Coelho, A. 2018. Antecedents and outcomes of brand love:
Utilitarian and symbolic brand qualities. European Journal of Marketing, 52(3/4): 656-
682.
Batra, R., Ahuvia, A., & Bagozzi, R. P. 2012. Brand love. Journal of Marketing, 76(2): 1-16.
Becheur, I., Bayarassou, O., & Ghrib,H. 2017. Beyond brand personality: Building
consumer-brand emotional relationship. Global Business Review, 18(3S), 1- 17.
Belk, R. W. (1988). Possessions and the extended self. Journal of Consumer Research, 15(2):
139–168
Bıçakcıoğlu, N., İpek, I., & Bayraktaroğlu, G. 2016. Antecedents and outcomes of brand love:
the mediating role of brand loyalty. Journal of Marketing Communications, 1-15,doi:
10.1080/13527266.2016.1244108
Carroll, B., & Ahuvia, A. 2006. Some antecedents and outcomes of brand love. Marketing
Letters, 17(2): 79-89.
Cuneo, A., Milberg, S. J., Alarcon-del-Amo, M., & Lopez-Belbeze, P. 2018. Private label
and manufacturer brand choice in a new competitive reality: Strategic directions and
the future of brands. European Management Journal. Available online 29 May 2018.
doi: /10.1016/j.emj.2018.05.003.
Fornell, C., & Larcker, D. F. 1981. Structural equation models with unobservable variables
and measurement error: algebra and statistics. Journal of Marketing Research, 18(3):
382–388.
57
Garretson, J. A., Fisher, D., & Burton, S. 2002. Antecedents of private label attitude and
national brand promotion attitude: similarities and differences. Journal of Retailing, 78
(2): 91-99.
Glynn, M. S., & Widjaja, T. 2015, Private label personality: applying brand personality to
private label brands. The International Review of Retail, Distribution and Consumer
Research, 25(4): 362-378.
Hair, J.F., Black, W.C., Babin, B.J., & Anderson, R.E. 2010. Multivariate Data Analysis.
Seventh Edition. Prentice Hall, Upper Saddle River, New Jersey
Hegner, S. M., Fenko, A., & Teravest, A. 2017. Using the theory of planned behaviour to
understand brand love. Journal of Product & Brand Management, 26(1): 26-41.
Heinrich, D., Albrecht, C. M., & Bauer, H. H. 2012. Love actually? Measuring and exploring
consumers’ brand love in consumer-brand relationships–Theory and practice.
London: Routledge.
Hooper, D., Coughlan, J., & Mullen, M. 2008. Structural equation modeling: guidelines for
determining model fit. Electronic Journal of Business Research Methods, 6(1): 53–60.
Hu, L., & Bentler, P. M. 1999. Cutoff criteria for fit indexes in covariance structure analysis:
Conventional criteria versus new alternatives. Structural Equation Modeling: A
Multidisciplinary Journal, 6(1): 1–55.
Huber, F., Meyer, F., & Schmid, D.A. 2015. Brand love in progress – the interdependence of
brand love antecedents in consideration of relationship duration. Journal of Product &
Brand Management, 24(6):567-579.
Ismail, A. R., & Spinelli, G. 2012. Effects of brand love, personality and image on word of
mouth. The case of fashion brands among young consumers. Journal of Fashion
Marketing and Management, 16(4): 386-398.
Keh, H. T., Pang, J., & Peng, S. 2007. Understanding and measuring brand love. Paper
presented at the Proceedings of the Advertising and Consumer Psychology
Conference, New Frontiers in Branding: Attitudes, Attachments, and Relationships,
Santa Monica, CA.
Khandeparkar, K., & Motiani, M. 2018. Fake-love: brand love for counterfeits. Marketing
Intelligence & Planning, 36(6): 661-677.
Lim, B.H., Ahn, K.H. , & Joo, Y.W. 2003. The empirical study of the relative influence of
brand personality and product attributes in the brand choice. Korea Marketing
Review,18(4), 1-21
Rauschnabel, P.A., & Ahuvia, A.C. 2014. You’re so lovable: anthropomorphism and brand
love. Journal of Brand Management, 21(5): 372-395.
Pandowo, J. 2016. How to create brand love in private label: The role of satisfaction as
intervening variable. Journal of Marketing Management, 4(2), 81-91.
PLMA. (2016). In I. news (Ed.), Private label today.
Roberts, K. (2005). Lovemarks.The future beyond brands (2nd ed.). Brooklyn, NY:
powerHouse Books.
Rabobank. (2012). Producing both brands and private labels. Rabobank Industry Note.
Roy, P., Khandeparkar, K., & Motiani, M. 2016. A lovable personality: the effect of brand
personality on brand love. Journal of Brand Management, 23(5): 97-113.
Schumacker, R. E., & Lomax, R. G. 2004. A beginner’s guide to structural equation modeling
(2nd ed.).Mahwah, NJ: Lawrence Erlbaum.
58
Shimp, T.A., & Madden, T. J. 1988. Consumer-object relations: A conceptual framework
based analogously on Sternberg’s triangular theory of love. Advances in Consumer
Research, 15(1): 163-168.
Thomson, M., MacInnis, D. J., & Park, W. C. 2005. The ties that bind: Measuring the strength
of consumers’ emotional attachment to brands, Journal of Consumer Psychology, 15
(1): 77-91.
Toldos-Romero, M. D. L. P., & Orozco-Gómez, M. M. 2015. Brand personality and purchase
intention. European Business Review, 27(5): 462–476.
Vernuccio, M., Pagani, M., Barbarossa, C., & Pastore, A. 2015. Antecedents of Brand love in
online network-based communities. A social identity perspective. Journal of Product
& Brand Management, 24(7): 706.719.
Rauschnabel, P.A., & Ahuvia, A.C. 2014. You’re so lovable: anthropomorphism and brand
love. Journal of Brand Management, 21(5): 372-395.
Richardson, P., Jain, A. K., & Dick, A. 1996. The influence of store aesthetics on evaluation
of private label brands. Journal of Product & Brand Management, 5(1): 19–28.
Wallace, E., Buil, I., & de Chernatony, L. 2014. Consumer engagement with self-expressive
brands: brand love and WOM outcomes. Journal of Product & Brand Management,
23(1): 33–42.

59
TO WHOM ARE YOU LOYAL, TO GLOBAL OR LOCAL BRANDS –
EXPERIENCE BEFORE LOYALTY
Vesna Babic-Hodovic
School of Economics and Business Sarajevo, University of Sarajevo
Trg oslobodjenja – Alija Izetbegovic 1, 71000 Sarajevo, B&H
Phone: ++38733275975; Fax: ++38733275900
E-mail: [email protected]
Maja Arslanagic-Kalajdzic
School of Economics and Business Sarajevo, University of Sarajevo
Trg oslobodjenja – Alija Izetbegovic 1, 71000 Sarajevo, B&H
Phone: ++38733251883; Fax: ++38733275900
E-mail: [email protected]
Amna Jazic
Remedia Plus d.o.o.
Kranjceviceva 37, 71000 Sarajevo, B&H
Phone: ++38762273351; Fax: -
E-mail: [email protected]
Abstract
This research is focused on the impact of the brand awareness and brand reputation on the
customer experience with the brand (brand experience) and further impact of brand experience
on brand image and brand loyalty. Finally, the effect of brand image on the brand loyalty is
considered. In order to test the conceptual model, we conducted an empirical study in a
developing country, using one global and one local brand. Our results show consistent
findings across global and local brands regarding positive impact of brand awareness and
experience on the brand image. On the other hand, there are differences in the determinants of
brand experiences, as well as in the effects of brand reputation. Based on the findings,
theoretical and managerial implications of the findings are considered and future research
suggestions are made.
Key words: brand experience, brand image, brand loyalty, global brands
JEL classification: L81, M14
1. Introduction
Customer loyalty to the brand or brand loyalty is one of the key components for companies
survive and growth in last decades, especially in the cases of the companies which face the
competition of global or regional brands and companies. In that circumstances identification
of brand antecedents and their impact on the brand loyalty as well as identifying customer
preferences regarding local or global brands are becoming one of the most researched topics in
theoretical and empirical studies.

60
In that context different topics related to the brand strength and potentials for brand
development has attracted the attention of many researchers and studies in recent decades
(Rubio, Oubiña & Villaseñor, 2014). Namely, brand strategy is one of the most important
means for creating long-term relationships with the customers and increasing companies’
chances for growth and success in the future. Therefore, academic and empirical researches
are focusing on the concept of branding and antecedents of brand loyalty development (Carrol
& Ahuvia, 2016; Elsäßer & Wirtz 2017; Haryanto et al., 2016; Keller, 2001; Oliver, 1991,
1999).
2. Brand awareness
Brand awareness, sometimes defined as brand knowledge, is an important antecedent of brand
experience, image and loyalty, and the first one in the line of factors affecting brand loyalty
(Rubio et al., 2014). It assumes that current and potential customers are aware of the brand
presence on the market, its meaning, specific characteristic and personality (Gustafson &
Chabot, 2007). Essentially, authors understood brand awareness as association in the mind of
customers about a specific brand (Stokes, 1985) measured through brand recognition, brand
recall, “top of the mind” and brand dominance, as well as brand meaning for the customers
(Aaker, 1991). Kotler et al. (2009) suggest explanation about the brand awareness as the
“mirror” of customer ability to recognize and identify the brand in different situations.
Moreover Aaker (1996) define brand awareness as the level of brand’s presence in the
customer mind, i.e. share-of mind, while Kotler et al. (2009) considers brand awareness as one
of vital indicators of brand state and insist on its role in the process of decision making about
the brand choice caused by the fact that customer prefer buying known brands.
Since the brand awareness leads to the customer preferences regarding the brand and
also presents the first step in the process of deciding about buying (Huang & Sarigollu, 2011),
it is considered as the key determinants in the process of brand loyalty development (Buil et
al., 2008; Keller, 1993; Pappu et al., 2005; Percy, 1987; Tong & Hawley, 2009). Namely,
authors insist on the fact that brand loyalty cannot be developed without a high awareness
(Pinar, Girard & Eser, 2012)
Brand awareness is considered as the level of customer’s knowledge about the brand
and it refers to the number of customers who know of the brand. In general, this is the
“measure” of the potential and current customers’ ability to associate brand meaning and
visual components with a particular product or service (Gilles et al., 2002). Consequently, the
level of brand awareness has strong impact on a customers' expectations regarding the
products and services they are planning to buy or use (Herbig & Milewicz, 1995; Shapiro,
1983). In the process of increasing brand awareness and attracting new customers companies
deliver promises about brands and brand benefits. Customer perception depends on the
consistency between those promises and the experience in the process of buying or using the
brand. Thus, brand awareness and brand experience affect brand image which depends on the
meeting customer expectations regarding the brand and the company.
Authors have studied connections between brand attitudes and customer attitudes and
emotions regarding the brand assuming that brand awareness affect customer choice as a
heuristic effect (customer will buy brand he/she knows about) and effect on expected and
perceived quality of the brand (customers heard about the brand and they believe that brand
must be good) (Chi, Yeh & Yang, 2009; Hoyer & Brown, 1990; Macdonald & Sharp, 2000).
Some of them found that brand awareness decreases customer perception of risks at the same

61
time increasing their confidence in the buying process, positive attitudes toward the brand and
enhance their trust in the brand quality and brand performances (MacDonald & Sharp, 2000;
Xingyuan et al., 2010) and also affects customers’ feelings and overall perceptions about the
company (Joachimsthaler & Aaker, 1997).
Cho et al. (2015) in their research also advocate positive impact of the brand awareness
on customer attitudes regarding the brand and also insist on the fact that high level of brand
awareness increase customers’ purchase intention (Shahid, Hussain & Zafar, 2017) and
enhance brand strength and brand loyalty. Namely, brand awareness is often the source of
customers’ preferences about the brand and the base for their choice, especially in the case
often use brand awareness. Similarly, Kang and Kang (2012) found positive impact of brand
awareness on the brand loyalty between customers of mobile phones while Aaker (2009)
considers brand awareness as prerequisite for brand loyalty. Authors of this paper argue the
attitude that brand awareness without brand experience and customers evaluation of the
product or service quality cannot be accepted as the reliable predictor of the brand loyalty. In
this context, this study hypothesizes:
H1a: Brand awareness has a positive impact on brand experience.
H1b: Brand awareness has a positive impact on brand image.
3. Brand reputation
Brand reputation has become the focus of the marketing strategies as the consequence of the
fact that positive brand reputation assumes higher prices and competitive advantages even in
the businesses where product differentiation has huge challenge (Loureiro & Kaufmann,
2016). Discussing the reputation of a brand, Walsh and Beatty (2017) explain brand reputation
as the customers’ overall evaluation of the product or the company based on the customers'
reactions on the company’s offer, communication and also customer' interaction with the
company or its representatives. In this context brand reputation can be understood as the factor
of the emotional brand attachment developing (Japutra, Ekinci & Simkin, 2014) as well as
strengthening of the brand image and brand loyalty.
Amis (2003) defines brand reputation as the general emotional response of an
individual towards a company that is a result of the previous company’s actions and customers
interactions with the company. According the author this explanation confirms the difference
between brand reputation as the meaning and response created over time and brand image
which is related to the current perception of a brand held in customer mind. On the other hand,
according Fombrun and van Riel (1997) brand reputation can be defined as the overall
estimation of the brand from the customer point of view. Kumbar’s (2012) understanding of
the brand reputation is at the same line; he states that brand reputation is one of the service
quality dimensions evaluated by customers during and after the service process.
Certain authors interpret brand reputation as outcomes of processes and past actions
(Spence, 1974) of the companies which offered the brand or as set of attributes related to the
company (Wigelt & Camerer, 1988). Some of them also insist on the consistency of attributes
over time (Fombrun, 1996; Herbig & Milewicz, 1993) and general emotional response of an
individual towards a firm after a longer period of time (Amis, 2003). Moreover, Zeithaml
(1988) explains brand reputation as an extrinsic cue which is related to the product but is not
the part of the physical offer. She considers brand reputation as a significant intangible asset of
the company, similarly as Stenger (2014) two decades later. In all these definitions authors
62
assume that brand reputation includes the values and beliefs of internal and external interest
groups of the company (Fombrun & Sahnley, 1990). It is also considered as the result of the
flow of information sharing between the organization and individuals or groups of individuals.
If these values are positive and consistent over time the reputation of the brand will also be
positive (Herbig & Milewicz, 1993).
Aaker (1991) sugessted that brand reputation from the company’s perspective presents
the level of customers attachment to the brand developed thanks to the brand credibility and
trustwortiness in the brand. Brand credibility and reputation are results of customer experience
with the brand where promised quality were delivered and customers’ expectations satisfied.
In his later research, Aaker (2004) confirmed previous statemensts; his findings
showed that customers mostly buy brands with high reputation since they pereive thos brand
as more relliable regarding stayint aht the market and providing reasonable quality. They also
fill comfortable with the knwoing brands and their reputation. This is especially important for
the brands that have to find the way how to become a member of the alternative brands which
customers consider in the purchasing process.
Omar, Williams and Lingelbach (2009) argue credibility of and trust in the brand as
key antecedents of positive brand reputation. Both dimensions are results of the consistency of
company’s actions (Herbig, 1997) in the process of providing high quality products and
services as well as fulfilling promises delivered to the customers. On the other hand brand
reputation leads to higher loyalty and stability of future business operations of the company
(Kapferer, 1997) while Abimbola and Kocak (2007) claim that branding and building of
reputation are crucial elements for the organizational success. In that context they suggest that
competitive brands with high reputation present main factor for attracting new customers and
market share growth. Authors who advocate same attitudes suggest that brands with high
reputation should focus efforts in strengthening brand image, obviously assuming positive
impact of brand reputation on the brand image. Young and Rubicam Group explains brand
reputation as brand esteem (elements of Brand Asset Valuator), i.e. customer respect regarding
the brand.
Brand reputation is strongly supported by company's reputation especially in the case
of services. Reputation of the company is described as the combination of the stakeholders'
long-term perception of the company's meaning (what the firm is) and its effectiveness in
meeting stakeholders' needs and confirming their expectations (Logsdon & Wood, 2002).
Whetten & Mackey (2002) defined brand reputation in this context as the specific type of
feedback provided by stakeholders concerning the credibility of brand identity or company's
identity. However, Wartick (2002) suggests that companies should focus an attention on the
direct customers as the most influential stakeholders.
A lot of studies regarding relations between brand reputation and brand loyalty are
provided in recent times. For example, Selnes (1993) found stronger impact of brand
reputation on the brand loyalty compared to customer satisfaction, especially in the cases
when customers are faced with ambiguity of intrinsic cues affecting decision-making process.
Cretu and Brodie (2007) also state that reputation has impact on the customer perception of
value and loyalty while brand image influence is focused on the customer perception related to
the specific product or service.
Similar relations are transferred in virtual environment. Thus, Casalo et al.’s (2008)
study confirmed that brand reputation and satisfaction have a positive impact on website
loyalty. Similarly, Caruana and Ewig (2010) found positive influence of the reputation on the
online loyalty. Brand image and brand reputation represent closely-related intangible
63
resources identified as prerequisites for brand loyalty and potential sources of competitive
advantages (Amis, 2003; Stenger, 2014). Authors accept the idea that intangible elements in
most of the cases present the base for sustainable competitive advantages (Amis, 2003; Clulow
et al., 2003;; Hall, 1993). For the researchers in the field of branding and brand management
topics related to the relationships between brand image and brand reputation are of the
extreme importance.
Hence, this study posits the following hypothesis:
H2a: Brand reputation has a positive impact on brand experience.
H2b: Brand reputation has a positive impact on brand loyalty.
4. Brand experience
Brand experience and its impact on brand loyalty is one of the most studied topics in branding
theory (Al-Hawary, 2013; Sahin et al., 2011; Walter et al., 2013; Wulandari, 2016). The
authors insist that brand experience presents a major prerequisite for customer-brand
relationship and commitment development while Veloutsou (2015) concluded that brand
relationship has a critical impact on the brand loyalty. Following this analysis Al-Hawary
(2013) confirmed positive impact of brand experience on the brand loyalty. Moreover, others
found additional benefit outcomes resulted from positive brand experience such as competitive
advantages (Su & Tong, 2015) and intention to purchase (Tolba & Hassan, 2009) except the
abovementioned brand loyalty.
Brand experience describes what customers think about the brand (Kumar, Dash &
Purwar, 2013) and according previous studies brand experience is related to the customer
contact with the brand in the pre-purchase phase, during the process of buying and finally
through the product consumption or service interaction (Arnould, Price & Zinkhan, 2000;
Brakus, Schmitt & Zarantonello, 2009). Wulandari (2016) explains brand experience in a
similar way stating that brand experience is a customer perception that results from the
customer's contact with a brand, including similar elements as previous authors in the group of
brand contacts. Therefore, brand experience presents customer emotional reactions caused by
brand performances but also all attached elements such as additional services, physical
dimensions of the shop or employees’ attitudes. On the other hand, Brakus et al. (2009)
explain brand experience as subjective, internal and behavioral responses on the elements
related to the brand such as design, packaging, environments and brand identity which
essentially include the same dimensions as “brand stimuli”. Moreover Huang et al. (2015)
discuss about four brand experience dimensions suggesting band sensory experience, band
cognitive experience, brand affective experience and relational brand experience.
Brand experience is identified as a stronger predictor of actual buying behavior than
brand personality (Brakus et al., 2009) and one of the important tools for creating brand
loyalty and increasing competitive advantages (Chang & Chieng, 2006; Prahalad &
Ramaswami, 2004). Moreover, Alba and Hutchinson (1987) suggested that customer brand
experience reflects customer’s awareness of the brand or brand category, while Rajumesh
(2014) claims that brand experience affects brand selection stronger than product attributes
and benefits, thanks to its possibility of creating greater trust in the brand (also Ha & Perks,
2005; Zarantenello & Schmitt, 2000). On the other hand looking from the brand managers’
perspective brand experience is understood as the customer interaction with holistic offer of
64
the brand (Klaus & Maklan, 2007) and consequently a vital prerequisite for brand image and
brand loyalty strengthening (Prahalad & Ramaswamy, 2004).
Authors sometimes compare brand experience and customer experience. This is a
consequence of the fact that customer experience essentially is experience with the brand but
also with other dimensions of customer and company interactions. Since all elements of
interactions are focused on the customers and their satisfaction, connection between brand and
customer experience is inevitable. This holistic understanding is often defined as the
customers’ brand experience gained from the customers interactions with the organization,
personnel, product and the brand. Similarly, Alloza (2008) explains brand experience as a
customer perception and feelings in every moment of interaction between customer and brand,
whether they face with projected images of the brand or personally interact with and use the
brand, or when they are searching information about the brand or talking with others about the
brand (Ambler et al., 2002).
Brand experience directly affects choice of the brand in future buying and has more
influence than product characteristics and benefits on the customer decision regarding
relationships with a particular company. According Bennett et al. (2005) understanding
customer experience before purchasing of professional services significantly contribute to the
brand loyalty. Furthermore it has positive impact on the customer satisfaction and brand
loyalty (Zarantenello & Schmitt, 2000; Ha & Perks, 2005). Namely, positive experience leads
to the brand loyalty (Mascarenhas et al., 2005; Murry, 1991) while negative experience in
most of the cases cause customer decision to switch to another brand (Aaker, 1991; Hoch,
2002). Following the same line of discussion and conclusions other authors found significant
impact of brand experience on customer loyalty (Mohammad, 2017; Walter et al., 2013),
considered brand experience as significant antecedents of brand loyalty (Baser et al., 2015)
and also suggest both direct and indirect effect of brand experience on brand loyalty (Brakus
et al., 2009). Based on previous academic work and empirical studies, next hypothesis is
stated:
H3a: Brand experience has a positive impact on brand image.
H3b: Brand experience has a positive impact on the brand loyalty.
5. Brand image
Brand image is an important aspect of the branding and marketing activities with varied
definitions and conceptualizations (Dobni & Zinkhan, 1990; Fornell et al., 2006; Low &
Lamb, 2000; Martinez & Pina, 2003). Most of the authors describe brand image as the
perception of customers in the form of associations regarding the brand in the customer mind.
These associations transformed in “a mind picture with tangible, intangible, inherent or
acquired facets” (Keller, 1993) based on information collected from public or private sources.
The sources and information might be controlled by the company or independent ones, but the
most important role for the perception of the brand image belongs to the customer experience
with the brand and the company. Consequently, brand image could be considered as the
engagement between customer and the brand, whereby the customer reflection of the brand
depends on inner motivations and external influences (Borja de Mozota, 2003; Grönroos,
2015). Namely, customers often use brands to identify with the social group which adds the
value to the brand experience and improve brand image. In that context, emotional and

65
symbolic advantages resulted from the brand experience present the most important
dimensions of brand associations defined by Aaker, 1992).
Authors (Lee, Lee & Wu, 2009) explain brand image as perceptions of brand
associations, feelings and thoughts in customer memory all related to tangible and intangible
attributes of the brand or the perception of the brand which is direct reflection of the brand
associations linked to the brand name in customer memory (Farquhar & Herr, 1993; Herzog,
1963; Keller, 1993). On the other hand, Low and Lamb (2000) understand brand image as the
rational or emotional perception customer attaches to the brand and suggest that every
individual has his/her image and perception of the brand. They also insist on the uniqueness of
the brand image in regard to competitors’ brands again expressed through the tangible or
intangible characteristics.
Saleem and Raja (2014) explained brand image as a reflection of a brand in customer
memory, i.e. everything that customer spontaneously think when the brand is mentioned or
presented. Similar idea was accepted by Mohajerani and Miredammi (2012) who defined
brand image as the overall impression about the brand and brand attributes in the minds of the
public. These studies lead to conclusions that brand image can be used as the “measure” of the
brand strength, uniqueness or favorability of the brand between customer (Borja de Mozota,
2003; Grönroos, 2015) but also sometimes as the synonym for the company’s reputation (Kim,
2015). Consequently, authors suggest that companies have to strengthen favorable brand
elements and monitor customers respond to branding activities and their commitment to the
brand in order to improve brand image and loyalty as antecedents of business performances
(Grönroos, 2015).
Brand image develops from the brand awareness, customer believes and information
about the brand collected from different sources of information such as marketing channels
directed from the company or external source of information such as word of mouth created
by previous brand customers, friends or members of the family, but also trough service
encounter or customer interaction with the company (Keller, 1993; Suhartanto &
Kandampully, 2003). Except the knowledge about the products or services brand image also
includes customers’ perception of the company’s philosophy and the brand quality. A positive
brand image might have a positive impact on brand loyalty and customer behavior in the
future (Chen & Myagmarsuren, 2011; Kandampully & Suhartanto, 2000; Kim & Kim, 2004;
Nguyen & LeBlanc, 1998).
According to Chen and Myagmarsuren (2011) brand image presents subjective
perception or mental representation of information about the product and significantly affects
customer evaluation of the product or services while Fornell et al. (2006) found positive
impact of brand image on perceived quality and customer satisfaction as the potential
antecedent of customer loyalty. Other studies also confirmed an impact of brand image on
customers’ intentions to buy (Ataman & Ulengin, 2003; Batra & Homer, 2004) and
willingness to recommend the brand (Rio, Vazquez & Iglesias, 2001) as well as company’s
business performances (Kim, Kim & An, 2003).
Furthermore, Neupane (2015) and Vazquez-Carrasco and Foxall (2006) were found
that the brand image helps to enhance brand loyalty. Moreover, Kayaman and Arasli (2007)
suggest developing positive brand image as the prerequisite for customer commitment to the
brand and brand loyalty. Ogba and Tan (2009) support this attitude regarding impact of brand
image on brand commitment and extend their conclusions showing moderating effects of
positive perception of quality and customer satisfaction on the relations between brand image
and brand loyalty. As a consequence, companies are aware of the fact that their profitability

66
comes from the strong positive image of the products or services that leads to customer loyalty
(Mirzaee, Rad, & Molavi, 2013).
Gul et al. (2012) developed discussion about brand image and brand loyalty. They
found correlation between brand image and brand loyalty and found that both variable have
significant influence on the repeat purchase frequency of the product in car industry. These
authors also state that brand image presents inevitable factor in the process of brand loyalty
developing. Based on theoretical framework and previous empirical research it is
hypothesized:
H4: Brand image has a positive impact on brand loyalty.
6. Brand Loyalty
Authors often start to discuss about loyalty with Oliver (1980) and Reichheld and Sasser’s
(1990) definitions. According to these definitions, loyalty can be understood as the catalyst for
the company growth, its profitability and market share (Reichheld & Sasser, 1990) or as
consistent behavior and deep commitment to rebuying the same brand without considering
alternative brands’ offer despite situational influences (Oliver, 1999) while Malik et al. (2013)
advocate understanding of a brand loyalty as a relationship between a customer and specific
brand also irrespective of competitive brands. Following the same logic Keller (2001) suggest
customer's psychological relationship with a brand as the essence of the brand loyalty.
Combining these two attitudes Ali and Muqadas (2015) include both perspective in brand
loyalty definition - psychological commitment and re-purchase intention while Dehdashti et al.
(2012) add long-term relationship to the re-purchase intention and commitment towards the
brand.
Similarly, as Oliver (1999), Chegini (2010) and Tolba and Hassan (2009) relates
loyalty with positive behavior, repurchase, support and commitment to the brand, while Rai
and Srivastava (2012) stress category of preferences and customer readiness for
recommending the brand. They stress that “attitudinal loyalty is based upon the strength of
preference and willingness to recommend” (Rai & Srivastava, 2012, p. 66). On the other hand
according to Hsieh, Pan and Setiono (2004) positive brand image increase likelihood that
customer will buy the brand and according to Su and Tong (2015) increase competitive
advantage. Certain authors discuss about brand loyalty as one of antecedents of brand equity
such as Buil et al. (2008), Yoo and Donthu (2001) or Tong and Hawley (2009). Day (1969) is
one of the rare authors who consider brand loyalty as the consequence of the “…rational
decision made after an evaluation of the benefits of competing brands” (p. 35).
In literature and research authors argue for dominance of the attitudinal or behavioral
loyalty, depending on the type of industry, product or services (e.g. Ali & Muqadas, 2015;
Iglesias et al., 2011) or discuss about cognitive and behavioral loyalty (Severi & Ling, 2013).
In that context attitudinal loyalty is understood as the customer internal dispositional
commitment and connection with a brand (Casidy & Wymer, 2015, 2016; Chaudhuri &
Holbrook, 2001; Haryanto et al., 2016) which result with the relationships between the brand
and customer (Ramaswami & Arunachalam, 2016). Authors advocate impact of different
factors as antecedents of brand loyalty such as brand relations and experience, customer
satisfaction, brand awareness and reputation as well as brand image (Brexendorf et al., 2010;
Haryanto et al., 2016; Rubio et al., 2015; Russell-Bennett et al., 2007). The assumption about
brand commitment leads to the discussion about emotional nature of the loyalty (Elsäßer &
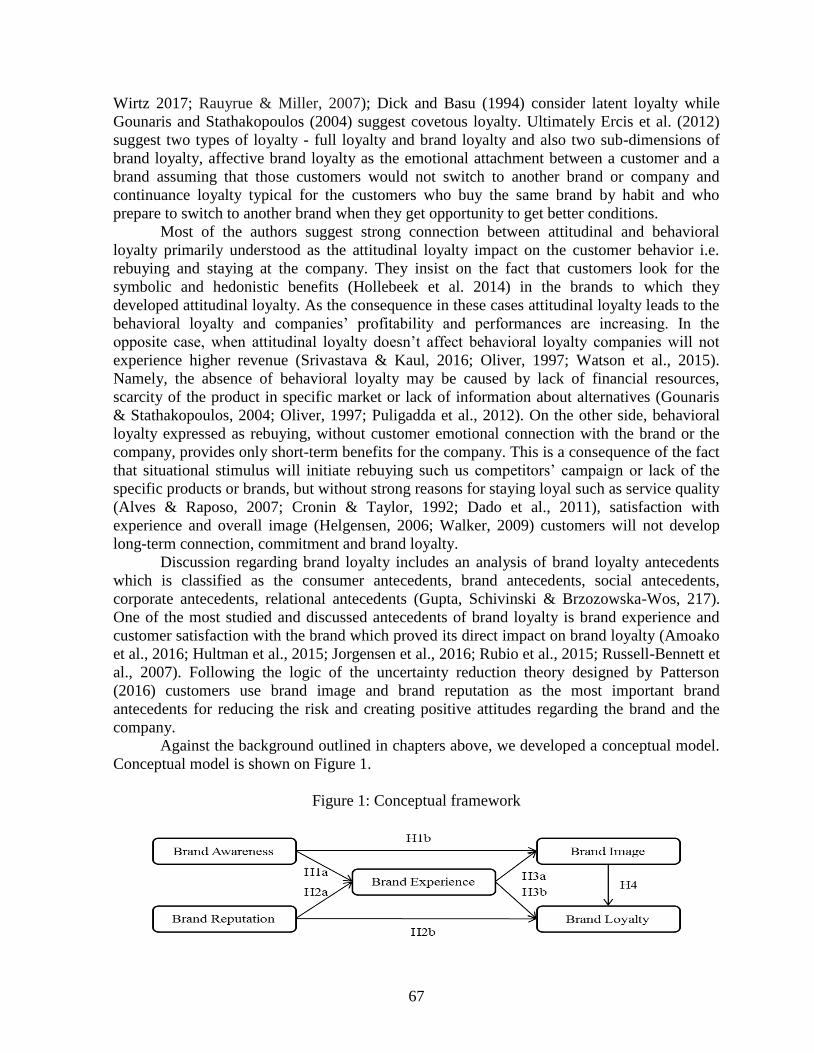
67
Wirtz 2017; Rauyrue & Miller, 2007); Dick and Basu (1994) consider latent loyalty while
Gounaris and Stathakopoulos (2004) suggest covetous loyalty. Ultimately Ercis et al. (2012)
suggest two types of loyalty - full loyalty and brand loyalty and also two sub-dimensions of
brand loyalty, affective brand loyalty as the emotional attachment between a customer and a
brand assuming that those customers would not switch to another brand or company and
continuance loyalty typical for the customers who buy the same brand by habit and who
prepare to switch to another brand when they get opportunity to get better conditions.
Most of the authors suggest strong connection between attitudinal and behavioral
loyalty primarily understood as the attitudinal loyalty impact on the customer behavior i.e.
rebuying and staying at the company. They insist on the fact that customers look for the
symbolic and hedonistic benefits (Hollebeek et al. 2014) in the brands to which they
developed attitudinal loyalty. As the consequence in these cases attitudinal loyalty leads to the
behavioral loyalty and companies’ profitability and performances are increasing. In the
opposite case, when attitudinal loyalty doesn’t affect behavioral loyalty companies will not
experience higher revenue (Srivastava & Kaul, 2016; Oliver, 1997; Watson et al., 2015).
Namely, the absence of behavioral loyalty may be caused by lack of financial resources,
scarcity of the product in specific market or lack of information about alternatives (Gounaris
& Stathakopoulos, 2004; Oliver, 1997; Puligadda et al., 2012). On the other side, behavioral
loyalty expressed as rebuying, without customer emotional connection with the brand or the
company, provides only short-term benefits for the company. This is a consequence of the fact
that situational stimulus will initiate rebuying such us competitors’ campaign or lack of the
specific products or brands, but without strong reasons for staying loyal such as service quality
(Alves & Raposo, 2007; Cronin & Taylor, 1992; Dado et al., 2011), satisfaction with
experience and overall image (Helgensen, 2006; Walker, 2009) customers will not develop
long-term connection, commitment and brand loyalty.
Discussion regarding brand loyalty includes an analysis of brand loyalty antecedents
which is classified as the consumer antecedents, brand antecedents, social antecedents,
corporate antecedents, relational antecedents (Gupta, Schivinski & Brzozowska-Wos, 217).
One of the most studied and discussed antecedents of brand loyalty is brand experience and
customer satisfaction with the brand which proved its direct impact on brand loyalty (Amoako
et al., 2016; Hultman et al., 2015; Jorgensen et al., 2016; Rubio et al., 2015; Russell-Bennett et
al., 2007). Following the logic of the uncertainty reduction theory designed by Patterson
(2016) customers use brand image and brand reputation as the most important brand
antecedents for reducing the risk and creating positive attitudes regarding the brand and the
company.
Against the background outlined in chapters above, we developed a conceptual model.
Conceptual model is shown on Figure 1.
Figure 1: Conceptual framework

68
7. Global vs. Local brands – Are there differences?
Increasing globalization of the business and marketing operations cause also brand
internationalization and authors conduct a lot of research concerned brand experience, brand
image and brand loyalty as well as dimensions and elements that affect causality between
these categories (Sahin et al., 2011; Sengupta, 2014; Walter et al., 2013).
Accepting reality of increasing number of globalized brand and also the fact that local
brands are developing despite business globalization, we based our study on the research and
analysis of one global and local coffee brand. We tested the nature and strength of the
relations between brand awareness and reputation and brand experience, as well as impacts of
brand experience and brand image on the brand loyalty.
8. Methodology
In order to empirically test the outlined hypotheses, we conducted a quantitative study using
paper-and-pencil survey. The survey was conducted on a student sample in Bosnia and
Herzegovina, focusing on two brands of coffee: Nescafe (a well-recognized global brand) and
Zlatna Dzezva (one of the most known local brands). Student sample is deemed as adequate
since student population is one that takes care about coffee rituals, while coffee is taken as a
brand category where involvement is high.
The questionnaire was composed using the established measurement scales for brand
awareness and brand reputation (Yoo et. al, 2000), brand reputation and brand experience
(Sengupta, 2014), brand image (Dodds et. al, 1991), brand loyalty (Lee, Knight, & Kim,
2008). Responses were measured on a 7-point Likert scale where 1 = Absolutely disagree and
7 = Absolutely agree. A between-sample design was used to reach the respondents; hence,
each respondent was randomly assigned to state their responses for one out of two brands, in
the case they are familiar with it and they have experienced it.
A total of 185 responses were collected, where 113 were for Nescafe and 72 for Zlatna
Dzezva. Respondents were of age between 19 and 39 (mean age = 22), and 65% of them were
female. Most of the students (87%) are students of the 1st cycle of studies (undergraduate)
while the rest were at master’s/post-graduate studies. The two samples separately are balanced
in terms of the demographic characteristics of respondents.
9. Results
Before testing the hypotheses, we conducted the assessment of the reliability and validity of
the measures (Fornell & Larcker, 1981) used in the model using a confirmatory factor analysis
in LISREL 8.71. In both cases, measurement model showed a good fit, for Nescafe (χ2 =
158.25; df = 80; χ2/df = 1.98; RMSEA = 0.08; NNFI = 0.96; CFI = 0.97) as well as for Zlatna
Dzezva (χ2 = 142.90; df = 80; χ
2/df = 1.79; RMSEA = 0.09; NNFI = 0.96; CFI = 0.97) fit
indices were acceptable. In the Table 1, reliability and validity properties for both models are
shown.
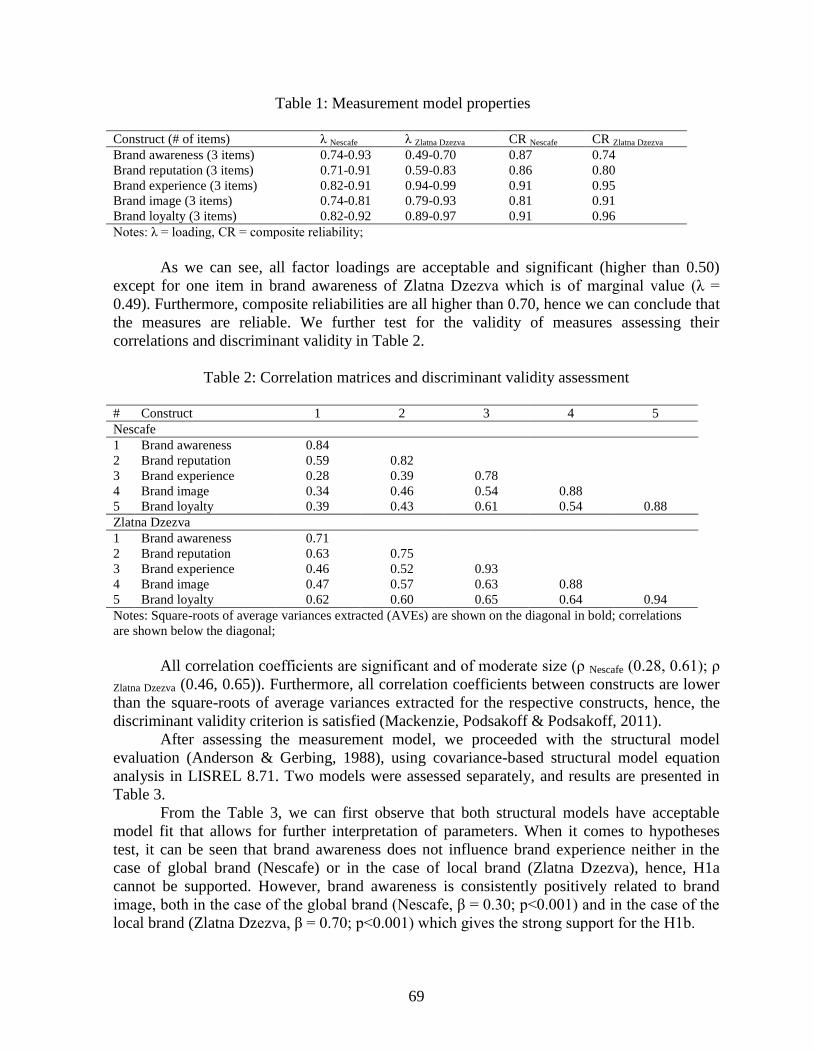
69
Table 1: Measurement model properties
Construct (# of items) λ Nescafe λ Zlatna Dzezva CR Nescafe CR Zlatna Dzezva
Brand awareness (3 items) 0.74-0.93 0.49-0.70 0.87 0.74
Brand reputation (3 items) 0.71-0.91 0.59-0.83 0.86 0.80
Brand experience (3 items) 0.82-0.91 0.94-0.99 0.91 0.95
Brand image (3 items) 0.74-0.81 0.79-0.93 0.81 0.91
Brand loyalty (3 items) 0.82-0.92 0.89-0.97 0.91 0.96
Notes: λ = loading, CR = composite reliability;
As we can see, all factor loadings are acceptable and significant (higher than 0.50)
except for one item in brand awareness of Zlatna Dzezva which is of marginal value (λ =
0.49). Furthermore, composite reliabilities are all higher than 0.70, hence we can conclude that
the measures are reliable. We further test for the validity of measures assessing their
correlations and discriminant validity in Table 2.
Table 2: Correlation matrices and discriminant validity assessment
# Construct 1 2 3 4 5
Nescafe
1 Brand awareness 0.84
2 Brand reputation 0.59 0.82
3 Brand experience 0.28 0.39 0.78
4 Brand image 0.34 0.46 0.54 0.88
5 Brand loyalty 0.39 0.43 0.61 0.54 0.88
Zlatna Dzezva
1 Brand awareness 0.71
2 Brand reputation 0.63 0.75
3 Brand experience 0.46 0.52 0.93
4 Brand image 0.47 0.57 0.63 0.88
5 Brand loyalty 0.62 0.60 0.65 0.64 0.94
Notes: Square-roots of average variances extracted (AVEs) are shown on the diagonal in bold; correlations
are shown below the diagonal;
All correlation coefficients are significant and of moderate size (ρ Nescafe (0.28, 0.61); ρ
Zlatna Dzezva (0.46, 0.65)). Furthermore, all correlation coefficients between constructs are lower
than the square-roots of average variances extracted for the respective constructs, hence, the
discriminant validity criterion is satisfied (Mackenzie, Podsakoff & Podsakoff, 2011).
After assessing the measurement model, we proceeded with the structural model
evaluation (Anderson & Gerbing, 1988), using covariance-based structural model equation
analysis in LISREL 8.71. Two models were assessed separately, and results are presented in
Table 3.
From the Table 3, we can first observe that both structural models have acceptable
model fit that allows for further interpretation of parameters. When it comes to hypotheses
test, it can be seen that brand awareness does not influence brand experience neither in the
case of global brand (Nescafe) or in the case of local brand (Zlatna Dzezva), hence, H1a
cannot be supported. However, brand awareness is consistently positively related to brand
image, both in the case of the global brand (Nescafe, β = 0.30; p<0.001) and in the case of the
local brand (Zlatna Dzezva, β = 0.70; p<0.001) which gives the strong support for the H1b.
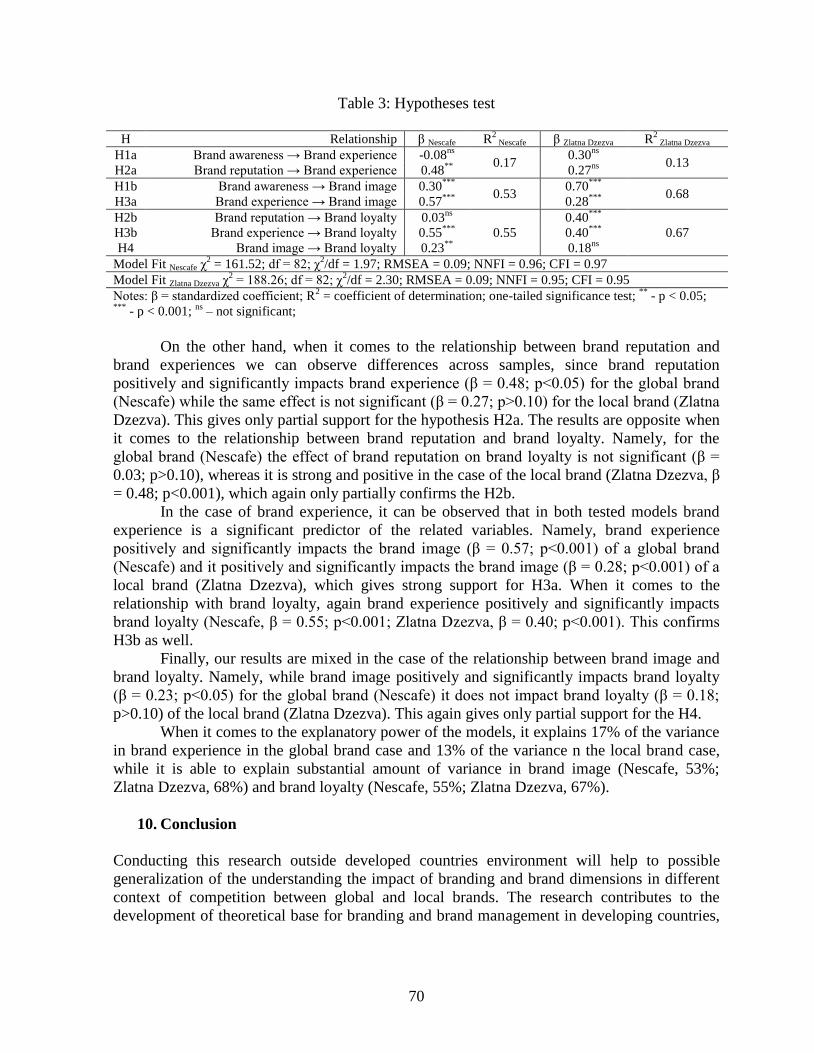
70
Table 3: Hypotheses test
H Relationship β Nescafe R
2 Nescafe β Zlatna Dzezva R
2 Zlatna Dzezva
H1a Brand awareness → Brand experience -0.08ns
0.17
0.30ns
0.13
H2a Brand reputation → Brand experience 0.48**
0.27ns
H1b Brand awareness → Brand image 0.30***
0.53
0.70***
0.68
H3a Brand experience → Brand image 0.57***
0.28***
H2b Brand reputation → Brand loyalty 0.03ns
0.55
0.40***
0.67 H3b Brand experience → Brand loyalty 0.55***
0.40***
H4 Brand image → Brand loyalty 0.23**
0.18ns
Model Fit Nescafe χ2 = 161.52; df = 82; χ
2/df = 1.97; RMSEA = 0.09; NNFI = 0.96; CFI = 0.97
Model Fit Zlatna Dzezva χ2 = 188.26; df = 82; χ
2/df = 2.30; RMSEA = 0.09; NNFI = 0.95; CFI = 0.95
Notes: β = standardized coefficient; R2 = coefficient of determination; one-tailed significance test;
** - p < 0.05;
*** - p < 0.001;
ns – not significant;
On the other hand, when it comes to the relationship between brand reputation and
brand experiences we can observe differences across samples, since brand reputation
positively and significantly impacts brand experience (β = 0.48; p<0.05) for the global brand
(Nescafe) while the same effect is not significant (β = 0.27; p>0.10) for the local brand (Zlatna
Dzezva). This gives only partial support for the hypothesis H2a. The results are opposite when
it comes to the relationship between brand reputation and brand loyalty. Namely, for the
global brand (Nescafe) the effect of brand reputation on brand loyalty is not significant (β =
0.03; p>0.10), whereas it is strong and positive in the case of the local brand (Zlatna Dzezva, β
= 0.48; p<0.001), which again only partially confirms the H2b.
In the case of brand experience, it can be observed that in both tested models brand
experience is a significant predictor of the related variables. Namely, brand experience
positively and significantly impacts the brand image (β = 0.57; p<0.001) of a global brand
(Nescafe) and it positively and significantly impacts the brand image (β = 0.28; p<0.001) of a
local brand (Zlatna Dzezva), which gives strong support for H3a. When it comes to the
relationship with brand loyalty, again brand experience positively and significantly impacts
brand loyalty (Nescafe, β = 0.55; p<0.001; Zlatna Dzezva, β = 0.40; p<0.001). This confirms
H3b as well.
Finally, our results are mixed in the case of the relationship between brand image and
brand loyalty. Namely, while brand image positively and significantly impacts brand loyalty
(β = 0.23; p<0.05) for the global brand (Nescafe) it does not impact brand loyalty (β = 0.18;
p>0.10) of the local brand (Zlatna Dzezva). This again gives only partial support for the H4.
When it comes to the explanatory power of the models, it explains 17% of the variance
in brand experience in the global brand case and 13% of the variance n the local brand case,
while it is able to explain substantial amount of variance in brand image (Nescafe, 53%;
Zlatna Dzezva, 68%) and brand loyalty (Nescafe, 55%; Zlatna Dzezva, 67%).
10. Conclusion
Conducting this research outside developed countries environment will help to possible
generalization of the understanding the impact of branding and brand dimensions in different
context of competition between global and local brands. The research contributes to the
development of theoretical base for branding and brand management in developing countries,

71
especially post-transitional ones where local companies and brands are facing with strong
competition of global brands.
While our results show consistent findings across global and local brands for some
relationships, we observe strong differences in other cases. Primarily, we can state that brand
awareness positively impacts brand image for both types of brands which is in line with
theoretical assumptions that brand awareness is one of the predispositions for developing and
building brand image.
On the other hand, we observe interesting variations when it comes to brand
experience. Firstly, it can be seen that both selected predictors of brand experience (brand
awareness and brand reputation) do not really do a good job in explaining the occurrence of
brand experience, since the explanatory power in the case of both global and local brands is
less than 20% of the variance. Hence, future research should focus in detecting other relevant
variables that are able to capture what explains and determines brand experience. We can also
see that in both cases pure notion of existence of a brand (brand awareness) does not
contribute to the brand experience. While on the other hand brand reputation plays an
important role for global brands and not for the local brands. This implies that brand
reputation carries the “halo” effect of the global brand (Batra, Ramaswamy, Alden, Steenkamp
& Ramachander, 2000), signaling quality and other positive characteristics, which help in
triggering brand experience dimension. On the other hand, we can see that local brands do not
carry this effect; hence, reputation of the local brand does not play a role for brand experience.
In the case of the local brand, possible triggers of brand experience might be related to the
tradition and/or reference groups. This is especially the case in the category of coffee which is
connected to rituals and habits consumers have and which might then be also related to the
experiences consumers bring from family environments and/or from socializing with the in-
groups (friends, relatives etc.)
Even though our findings are mixed and inconclusive for the determinants of brand
experience, there is a very clear picture for the consequent effects of brand experience on
brand image and loyalty. Namely, in cases of both global and local brands, brand experience is
strong and positive predictor of brand image and brand loyalty. This shows the importance of
the brand experience concept, that essentially places all potential promises under the
verification magnifier and hence the better the brand experience, the higher the brand image
perception as well as the brand loyalty – nevertheless the positioning of the brand (i.e. be it
global or local brand).
Also, in the case of brand image, there is a consistent support of our hypotheses across
brands/samples, that demonstrate that brand image can be explain with the level of brand
awareness and with the brand experience. Both predictors contribute to positive brand image
formation in consumers’ minds.
Finally, in the case of brand loyalty, the results are again mixed. Whereas experience is
consistent and positively related to brand loyalty, brand reputation is important for brand
loyalty only in the case of local brand, while brand image is important for the brand loyalty
only in the case of the global brand. In the case of brand reputation, these results, tied with the
previously explained results for brand experience, paint an interesting picture of the
differential effects of reputation in the global/local brand scenario. While reputation is
important for brand experience for global brands (and not for local brands) – i.e. it transfers
the “halo” effect and contributes to the experiential domain – it is at the same time more
important for loyalty in the case of local brands (and not in the case of global brands). The
latter shows that loyalty to the local brands can be triggered if the local brand is strong and
72
reputable at the domestic market and goes hand in hand with the predisposition that
perceptions of consumers about the local in developing countries is usually that they are of
lower quality and inferior (Winit, Gregory, Cleveland & Verlegh, 2014) – however – if the
brand is strong and reputable – then the consumer will consider buying it again and will be
loyal to it. However, global brands do not have such “luxury” and their reputation carries them
towards the experiential domain – further in the chain, the reputation does not help in repeated
purchases, showing that global brands need to excel in other elements for consumers to be
loyal to them. One of these elements is brand image – for which it is shown that positively
impacts loyalty to global brands – carrying symbolic and social elements with it, while it does
not play a role for local brands.
Our results can also give important insights for managers of both global and/or local
brands in developing countries. Namely, it is clear that in order to trigger brand experience,
especially when entering the market, global brand managers should put more attention to the
reputation of their brands since it carries the desired initial effect. On the other hand, this same
reputation does not carry the effect further in the chain of relationships, and for keeping the
consumers global brand managers should insist on good brand experiences and developing a
good brand image.
Managers of local brands should search and clearly define what triggers brand
experience. Our study shows that brand awareness and brand reputation is not enough, and it
is for further research to assess what are the determinants. Possibly, local brand experience can
be boosted with the elements of historical connection, tradition and relation with reference
groups and habitual behavior of consumers. However, local brand managers should know that
the reputation of their brands is important for consumer loyalty, and that it plays way more
important role than brand image. Finally, the role of brand experience could not be stressed
enough since it is shown to be very beneficial for both image and loyalty to local brands.
Limitations of this research are connected with the fact that only one product was in
the focus of the research, as well as specific group of respondents. The results could be also
affected by the category of product. Not only highly involved the coffee brand has also
specific role in local lifestyle and consequently assume strong connection with the brand.
Finally, for developing countries local brands have different status and position, depending on
the time when they appeared on the market. The local brand in this research has long positive
history hence another, younger brand might provide different results. All mentioned
limitations leads to conclusion that further research regarding other types of products and
different target segments as well as brands with longer or shorter history should be conducted.
References
Aaker, D. A. 1991. Managing brand equity. The Free Press, New York, NY.
Aaker, D. A. 1992. The Value of Brand Equity. Journal of Business Strategy, 13(4): 27 – 32.
Aaker, D. A. 1996. Measuring brand equity across products and markets. California
Management Review, 38(3): 102-120.
Aaker, L. J. 1997. Dimensions of brand personality. Journal of Marketing Research, 34(3),
347-356.
Aaker, D. 2004. Leveraging the corporate brand. California Management Review, 41(3): 102-
124.
Aaker, D. A. 2009. Managing Brand Equity. New York: Simon and Schuster.

73
Alba, J. W., & Hutchinson, J. W. 1987. Dimensions of consumer expertise. Journal of
Consumer Research, 13(4): 411-454.
Ali, F., & Muqadas, S. 2015. The Impact of Brand Equity on Brand Loyalty: The Mediating
Role of Customer Satisfaction. Pakistan Journal of Commerce and Social Sciences,
9(3): 890-915
Anderson, J. C., & Gerbing, D. W. 1988. Structural equation modeling in practice: A review
and recommended two-step approach. Psychological Bulletin, 103(3): 411–423.
Abimbola, T., & Kocak, A. 2007. Brand organization identity and reputation: SMEs as
expressive organizations: A resources-based perspective. Qualitative Market Research:
An International Journal, 10(4): 416-430.
Al-Hawary, S. I. S. 2013. The role of perceived quality and satisfaction in explaining customer
brand loyalty: mobile phone service in Jordan. International Journal of Business
Innovation and Research. 7(4): 393-413.
Alloza, A. (2008). Brand Engagement and Brand Experience at BBVA, the Transformation of
a 150 Years Old Company. Corporate Reputation Review, 11: 371-379.
Alves, H., & Raposo, M. 2007. Conceptual model of student satisfaction in higher education.
Total Quality Management and Businesss, 18(5): 571-588.
Ambler, T., Bhattacharya, C. B., Edell, J., Keller, K. L., Lemon, K., & Mittal, V. 2002.
Relating brand and customer perspectives on marketing management. Journal of Service
Research, 5(1): 13-25.
Amis, J. 2003. Good things come to those who wait: The strategic management of image and
reputation at Guinness. European Sport Management Quarterly, 3: 189–214.
doi:10.1080/16184740308721950
Amoako G. K., Dzogbenuku R. K., &vDoe J. K. 2016. How Service Experience Leads to
Brand Loyalty : Perspective from the Telecom Sector in Ghana. IUP Journal of Brand
Management, 13(2): 33-56.
Arnould, E., Price, L., & Zinkhan, G. 2002. Consumers. New York, McGraw-Hill.
Ataman, B., & Ulengin, B. 2003. A note on the effect of brand image on sales. The Journal of
Product and Brand Management, 12(4): 237-250.
Başer, U., Cintamur, G., & Arslan, F. M. 2015. Examining the effect of brand experience on
customer satisfaction, brand trust and brand loyalty, Marmara Üniversitesi, Dergisi YIL,
CILT XXXVII, SAYI II, S: 101-128.
Batra, R., Ramaswamy, V., Alden, D., Steenkamp, J.-B. E. M., & Ramachander, S. 2000.
Effects of Brand Local and Nonlocal Origin on Consumer Attitudes in Developing
Countries. Journal of Consumer Psychology, 9(2): 83–95.
Batra, R., & Homer, P.M. 2004. The situational impact of brand image beliefs. Journal of
Consumer Psychology, 14(3): 318-330.
Bennet, R., Hartel, C. J. H., & Mccoll-Kennedy, J. R.2005. Experience as a Moderator of
Involvement and Satisfaction on Brand Loyalty in a Business-to-Business Settings.
Industrial Marketing Management, 34: 97-107.
Brakus, J. J., Schmitt, B. H., & Zarantonello, L. 2009. Brand experience: what is it? How is it
measured? Does it affect loyalty? Journal of Marketing, 73(3):52-68.
Brexendorf, T. O. Mühlmeier S., Tomczak T., & Eisend M. 2010. The impact of sales
encounters on brand loyalty. Journal of Business Research, 63(11): 1148-1155.
Buil, I., de Chernatony, L., & Martınez, E. 2008. A cross- national validation of the consumer-
based brand equity scale. Journal of Product and Brand Management, 17(6): 384- 92.
74
Carroll, B., & Ahuvia, A. 2006. Some antecedents and outcomes of brand love. Marketing
Letters, 17(2): 79-89.
Caruana, A., & Ewing, M. T. 2010. How corporate reputation, quality, and value influence
online loyalty. Journal of Business Research. Elsevier Inc., 63(9–10): 1103–1110.
doi: 10.1016/j.jbusres.2009.04.030
Casalo, L., Flavian., C., & Guuinali., M. 2008. The role of perceived usability, reputation,
satisfaction, and consumer familiarity on the website loyalty formation process.
Computers in Human Behaviour, 24: 325–345.
Casidy R., & Wymer W. 2015. The impact of brand strength on satisfaction, loyalty and
WOM: An empirical examination in the higher education sector. Journal of Brand
Management. 22(2): 117-135.
Casidy R., & Wymer W. 2016. Linking prestige perception with consumption experience,
loyalty, and WOM. Marketing Intelligence & Planning. 34(4): 540-558.
Chang, P. L. & Chieng, M. H. 2006. Building consumer - brand relationship: A cross-cultural
experiential view. Psychology & Marketing, 23(11): 927-959.
Chaudhuri, A., & Holbrook, M. B. 2001. The chain of effects from brand trust and brand
affect to brand performance: The role of brand loyalty. Journal of Marketing, 65(2): 81-
93.
Chegini, M. G. 2010. Customer loyalty and value key dimensions interaction in organization.
China-USA Business Review, 9(8): 8-14.
Chen, C.-F., & Myagmarsuren, O. 2011. Brand equity, relationship quality, relationship value,
and customer loyalty: Evidence from the telecommunications services. Total Quality
Management & Business Excellence, 22(9): 957- 974.
Chi, H. K., Yeh, H. R., & Yang, Y. T. (2009). The impact of brand awareness on consumer
purchase intention: The mediating effect of perceived quality and brand loyalty. Journal
of International Management Studies, 4: 135-144.
Clulow, V., Gerstman, J., & Barry, C. 2003. The resource-based view and sustainable
competitive advantage: The case of a financial services firm. Journal of European
Industrial Training, 27(5): 220-232.
Cretu, A. E., & Brodie, R. J. 2007. The influence of brand image and company reputation
where manufacturers market to small firms: A customer value perspective. Industrial
Marketing Management, 36(2): 230–240. doi: 10.1016/j.indmarman.2005.08.013
Day, G. S. A. 1969. A two-dimensional concept of brand loyalty. Journal of Advertising
Research, 9: 29-35.
Cronin Jr, J. J., & Taylor, S. A. 1992. Measuring service quality extension. Journal of
Marketing. 5: 55-68.
Dado, J., Petroviova, J. T., Cuzovic, S., & Rajic, T. 2011. An empirical examination of the
relationships between service quality, satisfaction and behavioral intentions in higher
education setting. Serbian Journal of Management, 7: 203-218.
Dehdashti, Z., Kenari, M., & Bakhshizadeh, A. 2012. The impact of social identity of brand on
brand loyalty development. Management Science Letters, 2: 1425-1434.
De Mozota, B. 2003. Design Management: Using Design to Build Brand Value and Corporate
Innovation. NY New York: Allworth Press.
Dick, A. S., & Basu, K. 1994. Customer loyalty: toward an integrated conceptual framework.
Journal of the Academy of Marketing Science, 22(2): 99- 113.
Dobni, D., & Zinkhan, G. M. 1990. In search of brand image: a foundation analysis. Advances
in Consumer Research, 17(1): 110-119.
75
Dodds, W. B., Monroe, K. B., & Grewal, D. 1991. Effects of price, brand, and store
information on buyers' product evaluations. Journal of marketing research, 307-319.
Elsäßer M., & Wirtz B.W. 2017. Rational and emotional factors of customer satisfaction and
brand loyalty in a business-to-business setting. Journal of Business & Industrial
Marketing, 32(1): 138-152.
Ercis, A., Unal, S., Candan, F., & Yildirim, H. 2012. The effect of brand satisfaction, trust and
brand commitment on loyalty and repurchase intentions. Procedia - Social and
Behavioral Sciences, 58: 1395-1404.
Fahy, J. 2000. The resource based view of the firm: some stumbling blocks on the road to
understanding sustainable competitive advantage. Journal of European Industrial
Training, 24(2/3/4): 94.
Farquhar, P.H., & Herr P.M. 1993. The dual structure of brand associations. In Aaker, D.A.,
Biel, A. Eds. Brand Equity & Advertising: Advertising’s Role in Building Strong
Brands: 263-277. Hillsdale, NJ: Erlbaum.
Fombrun, C. J., & van Riel, C. B. M. 1997. The reputational landscape. Corporate Reputation
Review, 1(1/2): 5-3.
Fombrun, C.J. & Shanley, M. 1990. What’s in a name? Reputation-building and corporate
strategy. Academy of Management Journal, 33: 233– 258.
Fombrun, C. J. 1996. Reputation: Realizing value from corporate image. Harvard Business
School, Cambridge, MA.
Fornell, C., & Larcker, D. F. 1981. Structural equation models with unobservable variables
and measurement error: Algebra and statistics. Journal of Marketing Research, 18: 382–
388.
Fornell, C., Mithas, S., & Morgeson, F. V. III and Krishnan, M. S. 2006. Customer satisfaction
and stock prices: high returns, low risk. Journal of Marketing, 70: 3-14.
Gounaris S., & Stathakopoulos V. 2004. Antecedents and consequences of brand loyalty: An
empirical study Journal of Brand Management, 11(4): 283-306.
Grönroos, C. 2015. Service Management and Marketing: Managing the Service Profit Logic.
John Wiley & Sons. Chichester.
Gul, M. S., Jan, F. A., Jan, O. B. B. M. F., & Jan, M. F. 2012. Brand Image and Brand
Loyalty. Abasyn Journal of Social Science, 3(1): 55-74.
Gupta, S., Schininski, B. Brzozowska-Woś, M. (). Antecedents and consequences of brand
loyalty. Handel Wewnetrzny, 5(370): 200-212.
Ha, H-Y., & Perks, H. 2005. Effects of consumer perception of brand experience on the web:
Brand familiarity, satisfaction and brand trust. Journal of Consumer Behavior, 4(6):
438-452.
Hall, R. 1993. A framework linking intangible resources and capabilities to stustainable
competitive advantage. Strategic Management Journal, 14(8): 607-619.
Haryanto J.O., Moutinho L., & Coelho A. 2016. Is brand loyalty really present in the
children’s market? A comparative study from Indonesia, Portugal, and Brazil. Journal of
Business Research, 69(10): 4020-4032.
Helgesen, O., & Nesset, E. 2007. Images, satisfaction and antecedents: Drivers of student
loyalty? A case study of a Norwegian University College. Corporate Reputation Review,
10: 38-59.
Herbig, P., & Milewicz, J. 1993. The relationship of reputation and credibility to brand
success. Journal of Consumer Marketing, 10(3): 18-24.
Herbig, P., & Milewicz, J. 1997. Pricing Strategy & Practice. Bradford.
76
Herzog, H. 1963. Behavioral science concepts for analyzing the consumer. In Bliss, P. (Ed.),
Marketing and the Behavioral Sciences, Allyn and Bacon, Inc., Boston: 76-86.
Hoch, Stephen J., & Young-Won Ha. 1986. Consumer Learning: Advertising and the
Ambiguity of Product Experience. Journal of Consumer Research, 13: 221–223.
Hollebeek L. L. D., Glynn M. M. S., & Brodie R. J. R. 2014. Consumer brand engagement in
social media: Conceptualization, scale development and validation. Journal of
Interactive Marketing, 28(2): 149-165.
Hoyer, W., & Maclnnis, D. 2007. Consumer Behavior. Boston: Houghton Mifflin Company
Hsieh, M. H., Pan, S. L., & Setiono, R. 2004. Product-, corporate-, and country-image
dimensions and purchase behavior: A multicountry analysis. Journal of the Academy of
Marketing Science, 32(3): 251–270.
Huang, R., & Sarigollu, E. 2011. How brand awareness relates to market outcome, brand
equity, and the marketing mix. Journal of Business Research, 65(12): 92-99.
Hultman M., Skarmeas D., Oghazi P., & Beheshti H.M. 2015. Achieving tourist loyalty
through destination personality, satisfaction, and identification. Journal of Business
Research, 68(11): 2227-2231.
Iglesias, O., & Ind, N. 2013. The organic view of the brand: A brand value co-creation model.
Journal of Brand Management, 20(8): 670-688. DOI: 10.1057/bm.2013.8
Japutra, A., Ekinci, Y., & Simkin, L. 2014. Exploring brand attachment, its determinants and
outcomes. Journal of Strategic Marketing, 22: 616–630. doi:10.80/096525
4X.2014.914062
Joachimsthaler, E. & Aaker, D. A. 1997. Building brands without mass media. Harvard
Business Review, 75(1): 39-50.
Jorgensen, F., Mathisen, T.,A., & Pedersen, H. 2016. Brand loyalty among Norwegian car
owners Journal of Retailing and Consumer Services, 31: 256-264.
Kandampully, J., & Suhartanto, D. 2000. Customer loyalty in the hotel industry: the role of
customer satisfaction and image. International journal of contemporary hospitality
management, 12(6): 346-351.
Kang, A., & Kang, S. 2012. Consumer perception and brand loyalty: An empirical study of
smart-phones in India. Organizations and Markets in Emerging Economies, 3(1): 3-14.
Kapferer, J. N. 1997. Strategic Brand Management. Kogan Page.
Kayaman, R., & Arasli, H. 2007, Customer-based brand equity: evidence from the hotel
industry. Managing Service Quality, 17(1): 92-109.
Keller, K. L. 1993. Conceptualizing measuring and managing customer-based brand equity.
Journal of Marketing, 57: 1-22.
Keller, K. L. 2001. Building customer-based brand equity: A blueprint for creating strong
brands. Marketing Management, July/August: 15-19.
Kim, H., Kim, W.G., & An, J.A. 2003. The effect of consumer-based brand equity on firms’
financial performance. Journal of Consumer Marketing, 20(4): 335-351.
Kim, J. Y., Kiousis, S., & Xiang, Z. 2015. Agenda building and agenda setting corporate
reputation attributes. Corporate Reputation Review, 18(1): 25-36.
Klaus, P., & Maklan, S. 2007. The role of brands in a service-domnated world. Journal of
Brand Management, 15(2): 115-122.
Kotler, P., Keller, K., Brady, M., Goodman, M., & Hansen, T. (2009). Marketing
Management. Pearson Education Limited. Essex.
Kumar, R. S., Dash, S., & Purwar, P. C. 2013. The nature and antecedents of brand equity and
its dimensions. Marketing Intelligence & Planning, 31(2): 141-159.

77
Lee, H. M., Lee, C. C., & Wu, C. C. 2009. Brand image strategy affects brand equity after
M&A. European Journal of Marketing, 45(7/8): 1091-1111.
Lee, M.Y., Knight,D., & Kim,Y.K. 2008. Brand analysis of a U.S. global brand in comparison
with domestic brands. Journal of Product & Brand Management, 17, 163-174.
Logsdon, J. M., & Wood, D. J. 2002. Reputation as an emerging construct in the business and
society field: an introduction. Business and Society, 41(4): 365-370.
Loureiro, S. M. C., & Kaufmann, H. R. 2016. Luxury values as drivers for affective
commitment: The case of luxury car tribes. Cogent Business & Management, 3(1): 1–13.
doi:10. 1080/23311975.2016.1171192
Low, G. S., & Lamb, C. W. 2000. The measurement and dimensionality of brand associations.
Journal of Product & Brand Management, 9(6): 350-368.
Macdonald, E., & Sharp, B. 2003. Management perceptions of the importance of brand
awareness as an indication of advertising effectiveness. Marketing Bulletin, 14: 1-11.
Mackenzie, S. B., Podsakoff, P. M., & Podsakoff, N. P. 2011. Construct Measurment and
Validation Procedures in MIS and Behavioral Research: Integrating New and Existing
Techniques. MIS Quarterly, 35(2): 293–334.
Malik, H., Jaswal, L., Malik, S., & Awan, T. 2013. Measuring service quality perceptions of
the customers of restaurants in Pakistan. International Journal for Quality Research,
7(2): 187-200.
Martinez, E., & Pina, J.M. (2003). The negative impact of brand extensions on parent brand
image. Journal of Product & Brand Management, 12(7): 432-448.
Mascarenhas, O . A., Kesavan, R., & Bernacchi, M . ( 2006 ) Lasting customer loyalty: A total
customer experience approach . Journal of Consumer Marketing, 23(7): 397-405.
Mishra, P., & Datta, B. 2011. Perpetual Asset Management of Customer-Based Brand Equity-
The PAM Evaluator. Current Research Journal of Social Sciences, 3(1): 34-43.
Mirzaee, N., Rad, M. K., & Molavi, N. 2013. An examination of the effect of brand's
dimensions on loyalty of industrial customers. Journal of Research and Development,
1(2): 1-14.
Mohajerani, P., & Miremadi, A. 2012. Customer satisfaction modeling in hotel industry: A
case study of Kish Island in Iran. International Journal of Marketing Studies, 4(3): 134-
152.
Mohammad, A. A. S. 2017. The impact of brand experiences, brand equity and corporate
branding on brand loyalty: Evidence from Jordan. International Journal of Academic
Research in Accounting, Finance and Management Sciences, 7(3): 58–69.
Neupane, R. 2015. The Effects of Brand Image on Customer Satisfaction and Loyalty
Intention in Retail Super Market Chain UK. International Journal of Social Sciences
and Management, 2(1): 9-26.
Nguyen, N., & LeBlanc, G. 1998. The mediating role of corporate image on customers'
retention decisions: An investigation in financial services. International Journal of Bank
Marketing, 16(2): 52-65.
Oliver. R. L. 1980. A Cognitive Model of the Antecedents of Satisfaction Decisions. Journal
of Marketing Research, 17: 46-49.
Oliver, R. L. 1997. Satisfaction: A Behavioral Perspective on the Consumer. New York:
Irwin/McGraw-Hill.
Oliver, R. L. 1999. Whence consumer loyalty. Journal of Marketing, 63(4): 33-44.
Omar, M., Williams, R. L., & Lingelbach, W. D. 2009. Global brand market-entry strategy to
manage corporate reputation. Journal of Product & Brand Management, 18(3): 177-187.

78
Pappu, R., Quester, P. G., & Cooksey, R. W. 2007. Country image and customer-based brand
equity: relationships and implications for international marketing. Journal of
International Business Study, 38: 726-745.
Patterson P. 2016. Retrospective: tracking the impact of communications effectiveness on
client satisfaction, trust and loyalty in professional services. Journal of Services Marketing,
30(5): 485-489.
Pinar, M., Girard, T., & Eser, Z. 2012. Customer-based brand equity in banking industry: A
comparison of local and global banks in Turkey. International Journal of Bank
Marketing, 30 (5): 359-375.
Prahalad, C. K., & Ramaswamy, V. 2004. Cocreation experiences: The next practice in value
creation. Journal of Interactive Marketing, 18(3): 5-14.
Puligadda S., Ross W.T., Chen J., & Howlett E. 2012. When loyalties clash purchase behavior
when a preferred brand is stocked out: The tradeoff between brand and store loyalty.
Journal of Retailing and Consumer Services, 19(6): 570-577.
Rai, A. K., & Srivastava, M. 2012. Customer Loyalty Attributes: A Perspective. NMIMS
Management Review, XXII: 49-76.
Rajumesh, S. 2014. The impact of consumer experience on brand loyalty: The mediating role
of brand attitude. International Journal of Management and Social Sciences Research
(IJMSSR), 3(1): 73-79.
Ramaswami S.N., & Arunachalam S. 2016. Divided attitudinal loyalty and customer value:
role of dealers in an indirect channel. Journal of the Academy of Marketing Science,
44(6): 770-790.
Rauyruen P., & Miller K.E. 2007. Relationship quality as a predictor of B2B customer loyalty.
Journal of Business Research, 60(1): 21-31.
Reichheld, F. F., & Sasser, W. E. Jr. 1990. Zero defections: Quality comes to services.
Harvard Business Review, 68(5): 105-111.
Rio, A.B., Vazquez, R., & Iglesias, V. 2001. The effects of brand associations on consumer
response. Journal of Consumer Marketing, 18(5): 410-425.
Rossiter, J.R., & Percy, L. 1987. Advertising and Promotion Management, New York:
McGraw-Hill.
Rubio, N., Oubiña, J., & Villaseñor, N. 2014. Brand awareness–Brand quality inference and
consumer’s risk perception in store brands of food products. Food Quality and
Preference, 32: 289-298.
Russell-Bennett, R., McColl-kennedy, J. R., & Coote, L.V. 2007. Involvement, satisfaction,
and brand loyalty in a small business service setting. Journal of Business Research,
60(12): 1253–1260
Sahin, A., Zehir, C., & Kitapci, H. 2011. The effects of brand experiences, trust and
satisfaction on building brand loyalty: An empirical research on global brands. Procedia
Social and Behavioral Sciences, 24: 1288–1301
Saleem, H., & Raja, N. S. 2014. The impact of service quality on customer satisfaction,
customer loyalty. Middle-East Journal of Scientific Research, 19(5): 706-711.
Sengupta, A. 2014. Brand Analyses of Global Brands Versus Local Brand in Indian Apparel
Consumer Market. Theses and Dissertations-Retailing and Tourism Management. 6.
https://uknowledge.uky.edu/mat_etds/6
Severi, E. and Ling, K. 2013. The mediating effects of brand association, brand loyalty,
brand image and perceived quality on brand equity. Asian Social Science, 9(3): 125-
137.
79
Shahid, Z., Hussain, T., & Zafar, F. 2017. The Impact of Brand Awareness on the Consumers’
Purchase Intention. Journal of Accounting and Marketing, 6: 223. doi:10.4172/2168-
9601.1000223
Selnes, F. 1993. An examination of the effect of product performance on brand reputation,
satisfaction and loyalty. European Journal of Marketing, 27(9): 19-35.
Spence, M.A. 1974. Market Signaling: Informational Transfer in Hiring and Related
Screening Processes. Cambridge: Harvard University Press.
Srivastava M., & Kaul D. 2016. Exploring the link between customer experience – loyalty –
consumer spend. Journal of Retailing and Consumer Services, 31: 277-286.
Stokes, R. C. 1985. The Effects of Price, Package Design, and Brand Familiarity on Perceived
Quality. In J. Jacoby, & J. Olson (eds.). Perceived Quality. Lexington: Lexington Books.
Su, J., & Tong, X. 2015. Brand personality and brand equity: Evidence from the sportswear
industry. Journal of Product & Brand Management, 24: 124–133.
Suhartanto, D., & Kandampully, J. 2003. The role of customer satisfaction and image in
gaining customer loyalty in the hotel industry. Journal of Hospitality & Leisure
Marketing, 10(1/2): 1-24.
Tolba, A., & Hassan, S. 2009. Linking customer-based brand equity with brand market
performance: a managerial approach. Journal of Product & Brand Management, 18(5):
356-366.
Tong, X., & Hawley, J. M. 2009. Creating brand equity in the Chinese clothing market The
effect of selected marketing activities on brand equity dimensions. Journal of Fashion
Marketing and Management, 13(4): 566-581.
Vazquez-Carrasco, R., & Foxall, G. R. 2006. Influence of personality traits on satisfaction,
perception of relational benefits, and loyalty in a personal services context. Journal of
Retailing and Consumer Services, 133: 205–219.
Veloutsou, C. 2015. Brand evaluation, satisfaction and trust as predictors of brand loyalty: the
mediator-moderator effect of brand relationships. Journal of Consumer Marketing, 32
(6): 405-421.
Walker, L. J. H. 2009. Strategic positioning in higher education. Academic Educational
Leadership Journal, 13: 103-112.
Walsh, G., & Beatty, S. E. 2007. Customer-based corporate reputation of a service firm: Scale
development and validation. Journal of the Academy of Marketing Science, 35: 127–
143. doi:10.1007/s11747-007-0015-7.
Walter, N., Cleff, T., & Chu, G. 2013. Brand experience's influence on customer satisfaction
and loyalty: a mirage in marketing research? International Journal of Management
Research and Business Strategy, 2 (1): 130-144.
Watrick, S. 2002. Measuring corporate reputation: Definition and data. Business and Society,
41(4): 371-392.
Watson G.F., Beck J.T., Henderson C.M., & Palmatier R.W. 2015. Building, measuring, and
profiting from customer loyalty. Journal of the Academy of Marketing Science, 43(6):
790-825.
Weigelt, K., & Camerer, C. 1988. Reputation and corporate strategy: A review of recent
theory and applications. Strategic Management Journal, 9: 443–454.
Whetten, D. A., & Mackey, A. 2002. A social actor conception of organizational identity and
its implication for the study of organizational reputation. Business & Society, 41(4): 393-
414.

80
Winit, W., Gregory, G., Cleveland, M., & Verlegh, P. 2014. Global vs local brands: how home
country bias and price differences impact brand evaluations. International Marketing
Review, 31: 102–128.
Wulandari, N. 2016. Brand Experience in Banking Industry: Direct and Indirect Relationship
to Loyalty. Expert Journal of Marketing, 4 (1): 1-9.
Yoo, B. and Donthu, N. 2001. Developing and Validating a Multidimensional Consumer-
Based Brand Equity Scale. Journal of Business Research, 52(1): 1-14.
Yoo, B., Donthu, N., & Lee,S. 2000. An Examination of Selected Marketing Mix Elements
and Brand Equity. Journal of the Academy of Marketing Science, 28(2), 195-211.
Zarantenello, Lia and Schmitt, Bernd H. 2000. Using the Brand Experience Scale to Profile
Consumers and Predict Consumer Behavior. Brand Management, 17(7): 532-540.
Zeithaml, V. A. (1988). Consumer perceptions of price, quality, and value: A means-end
model and synthesis of evidence. Journal of Marketing, 52: 2-22.

81
HUMAN RESOURCES INFORMATION SYSTEMS AND ITS IMPACT
ON ORGANISATIONAL PERFORMANCE
Anton Florijan Barisic
University VERN'
Trg bana J. Jelacica 3,, 10000 Zagreb, Croatia
E-mail: [email protected]
Mirjana Pejic Bach
University of Zagreb, Faculty of Economics and Business,
Trg J. F. Kennedyja 6, 10000 Zagreb, Croatia
E-mail: [email protected]
József Poór
Szent István University,
Páter K.u.1, Gödöllő, Hungary
E-mail:[email protected]
Abstract
Using ICT in delivering human resources management (HRM) services is important for
organisation's performance and a strategy to achieve a competitive advantage and has
become an imperative. Human Resources Information System (HRIS) is an instrument used to
collect, record, and store, analyse and retrieve data related to organization's human
resources. The HRIS provides multiple HRN services from operational assistance in
collecting, storing and preparing data, executing and controlling processes, reducing HRM
labour costs, and providing information to the management enabling them to make quality HR
strategic decisions. As the greatest benefits to the implementation of HRIS, some research
studies perceive the quick response and access to information, but as the greatest barrier they
see lack of sufficient financial support. According to the research findings, ICT enables HR
professionals more efficient access and dissemination of information. Goal of the paper is to
explore how usage of HRIS affects organisational performance in terms of service quality,
level of productivity, profitability, rate of innovation, stock market performance and
environmental matters.
Keywords: IT management, human resources, human resources information system,
organisational performance,
JEL classification: M15, O32, O33, L25
Acknowledgments This paper is written based on the research conducted as part of the PhD
thesis Barisic, A.F. (2018). Impact of Human Resources Information Systems to
Organizational Performance: Global Analysis. Thesis has been defended at Fakulteta za
komercialne in poslovne vede, Celje, Slovenia.
82
1. Introduction
The society and economy today is dominantly characterised by rapid development, growth and
expansion of the information and communication technology (ICT). Such a development
causes increasing needs for firms and individuals with knowledge and competence of ICT
area. There is broad evidence proved by number of studies that new information and
communication technologies are key element of a breakthrough into rapid growth (Abubakar
& Tasmin, 2012). The development of new technologies and their proliferation throughout the
entire economy and society influences productivity and organisational performance
(Alwahaishi & Snasel, 2013).
The main focus of the research was the use of information and communication
technologies (ICT) in human resources management (HRM). Recent technological
development leads to development of human resources information systems (HRIS). The
numerous studies have explored to what extent HRIS usage impacts organizational
performance. Previous researches on that topic have been conducted predominantly on
exploratory level and in the area of limited geographical context or solely on the single aspects
of HRIS, although HRIS usage has number of different aspects, such as type of HRIS, areas of
HRM that are covered by HRIS, availability of self-service in HRIS for both managers and
employees, and extent of HRIS outsourcing. Therefore, the aim of this dissertation research
was to get an insight into impact of HRIS usage from different perspectives (type, areas, self-
service, and outsourcing) to organizational performance with the utilization of global data set,
leading to global analysis.
The intention of this research was to contribute to the better utilization of HRIS usage
in organizations and help in improving the approaches used in HRIS usage in organizations,
with the goal to maximize its impact to organizational performance.
2. Literature review
2.1. Impact of information and communication technologies to the organizational performance
The changes the ICT is affecting are not limited to one single sector of society, but ICT
transforms all sectors of the economy and influences society on many different ways (Xue,
Liang & Boulton, 2008; Rogers, 2010). The organisations must constantly take into account
the ICT development and evolution influencing the technology landscape and affecting the
society behaviour (Mouelhi, 2009; Okello et all, 2014). Some of the most recent ICT trends
include, among others, business intelligence, social media, consumerware, cloud computing,
information security, big data and wireless internet access.
The best description of ICT says that it is a “general purpose technology” beyond the
traditional capital investment. (Bresnahan and Trajtenberg, 1995; Selwyn (2004) defines the
term ICT as “an umbrella term for a range of technological applications such as computer
hardware and software, digital broadcast technologies, telecommunications technologies such
as mobile phones, as well as electronic information resources such as the world wide web and
CDRoms”. According to Weill and Broadbent (2000, p. 333) ICT systems can be defined as
“the base foundation of IT capability, delivered as reliable services shared throughout the
organisation and coordinated centrally, usually by the information systems group”.
Melville, Kraemer, & Gurbaxani, (2004), defines “ICT organizational value” in terms
of effect of ICT to the organizational performance. ICT plays a critical role in supporting

83
organizational strategy implementation and has gain an enormous impact on everyday life of
individuals as well as day-to-day business running of organizations. (Santos Vieira et all,
2013, Oulton, 2012). Therefore ICT has become a strategic organisational resource (Benamati
and Lederer, 2001). ICT enable organisations to implement significant changes in the areas of
process reengineering, governance model, flexible HRM, product development and
outsourcing (Gera and Gu, 2004, Baldwin et al., 2003).
Although ICT contribute to the organisational performance improvement (Saltari et al.,
2013; Outlon, 2012), usefulness and utilisation of ICT resources in terms of organisational
performance are depending on type of ICT, organisational structure, organizational
environment and attitude of the management (Brynjolfsson et al. 2002; Dewan and Kraemer
2000). Therefore, in order to achieve planned strategic goals, companies have to adopt and
implement ICT as a part of organizational system (Hitt, Wu, & Zhou, 2002; Garcia-Canal,
Rialp-Criado & Rialp-Criado, 2013). A various surveys explored the connection between ICT
and its effect on organizational performance, and they posit that the driver of IT impact is not
the investment in the ICT, but the actual usage of the technology (Devaraj and Kohli, 2003).
Considering its importance for an organisation, its rapid change and the increasing
complexity of application, the management of the organisation is faced with the challenges of
ICT implementation which requires different mechanisms for reducing the problems of
complexity and rapid ICT change (Benamati and Lederer, 2001). In that sense there were
identified mechanisms such as; training, support from suppliers, durability, in-house
procedures, and consulting services (Benamati and Lederer, 2001, Oulton, 2012, Garcia-Canal
et all, 2013, Santos Vieira et all, 2013). There are still uncertainties about how ICT contributes
to organizational performance (Sambamurthy et all, (2003). A literature review shows
divergent concepts of the interrelations between ICT and organizational performance. The
different dimension of ICT organizational value are affected by different internal and external
factors such as corresponding organizational resources and organisational environment
(Bharadwaj, 2000; Melville et all, 2004, Santos Vieira et all, 2013). Other authors summarize
that the use of ICT can create organizational competitiveness but putting greater concern on
human and intangible capabilities than tangible capability of organisation to determine its
performance (Sambamurthy et all, 2003, Piccoli & Ives, 2005).
The greatest benefits of ICT for an organisation can be realised if ICT investment is
aligned with new strategy, organisational redesign, core process redesign, and value
reengineering, that should be transformed into practice trough HRM implementation and
effectiveness (Pilat, 2001, Gera and Gu, 2004, Baldwin et al., 2003, Dehning and
Stratopoulos, 2003).
The rapid (ICT) expansion during the last 15 years has created a vibrant environment
of favourable possibilities and interesting challenges for a vast number of organisations. ICT is
providing efficient, easy to use, inexpensive and appropriate communication equipment and
tools. It was found that adoption of ICT in many organisations has a very positive effect on the
organization’s performance (Mouelhi, 2009; Gavrea, Ilies & Stegerean, 2011). In that sense it
can be concluded that organizations that use ICT are developing faster, investing more often,
and they show as more productive and profitable.
2.2. Challenges in contemporary human resources management
Human resources management (HRM) function within the organisation supports development
of organisation specific kompetences and abilities as an outcome of organizational learning.

84
The contemporary HRM function is faced with a number of challenges regarding its purpose,
performance and effectiveness (Rogers and Wright, 1998, Kesti et al., 2011, Di Paolo et al.,
2010). Concerning the introduction of ICT into HRM processes, a major challenge for
strategic HRM today and in future will be to institute a solid, sound, consistent, consequent,
interconnected and efficient model and metrics for organizational performance (Maguire and
Redman, 2007, Panayotopoulou and Papalexandris, 2004, Hiltrop, 1996, Boudreau and
Ramstad, 1999).
The research studies show that HRM has a more significant influence on organisation's
performance in terms of growth and innovation, than on financial perspective (Brewer &
Gajendran, 2009; Strohmeier and Kabst, 2012). Other studies exploring the linkages between
HRM and organisational performance show that still there are a little evidences indicating that
HRM is tied up with high organizational and financial performance (Kesti and Syväjärvi,
2010). Nevertheless, HRM policies and practices can support and foster employees' behaviour
and attitudes towards strengthening the organizational competitive strategy (Kesti, 2012,
Becker and Huselid, 2006, Becker et al., 2001).
New challenge for HRM is a practice of outsourcing of HRM function and emerging of
human resource intermediaries (HRIs), with purpose to deliver HR services to both public and
private sector organisations (Kock et all, 2012, Comacchio et al., 2008). HRM systems are
faced with challenge on how to avoid short-term and reactive assignments of standardized HR
solution delivery and concentrate on long-term relationships, targeting the entire HR processes
within an organisation and its relations with outside environment (Kock et all, 2012, Kalleberg
and Marsden, 2005, Ulrich et al., 2008). There are evidences of increased outsourcing at least
one HRM process with tendency to broaden their range and number (Scullion and Starkey,
2000, Di Paolo et al., 2010)
Theoretical significance of strategic HRM as derived from resource based theory of
organisation emphasizes human resources as essential factor in improving and maintaining
organizational success (Lengnick-Hall, Lengnick-Hall, Andrade & Drake, 2009; Casimir, Lee
& Loon, 2012)
The research studies dealing with HR outsourcing have been generally focused on
multinationals (MNC), and less on European SME companies (Brewster et al., 2007, Silvestri
and Pilati, 2005). SMEs are an important group of clients to HRIs, because they usually have
limited resources and underdeveloped internal HRM competences (Cardon and Stevens, 2004;
Kitching, 2008; Klaas, 2003).
2.3. The role of information and communication technologies in human resources
management
The studies about HRM show that modern HR function in an organisation has evolved from
simple personel administration to development and management of human resources. In that
sense, HRM became strategic partner and change agent in achieving organisational objectives
(Ulrich, 1997, Conner and Prahalad, 1996, Ramstad, 2009). However, in order to fully realize
its’ potentials, HRM practices should be aligned with organizational strategy and
technological (Barney, 1991).
Cronin et al. (2006) emphasize the crucual influence of new technologies in
establishing and improving of effective HRM systems. An HRM function supported with ICT
can create an encouraging and supportive environment that motivate employees to achieve
superior performances in generating and sharing knowledge aimed for the organization in
85
attaining its business strategy (Scott & Davis, 2007, Magnusson & Martini, 2008). Corso,
Martini & Pesoli, (2008), consider ICT as a concept that can introduce such a change within
organizations.
Implementation of ICT can affect the all HRM processes, as from personnel
administration, personnel acquisition, employee selection and recruitment, employee
orientation and integration, performance assessment, employee career development,
organisational communication, until employee training and development and organizational
design and culture development (Di Paolo, Corso and Gastaldi, 2011, Zahra, and Scholar,
2013). leveraging and combining ICT and HRM as key enabling factors can influence. The
organizational culture, organisational knowledge management and organisational learning
processes can be strongly affected by leveraging and combining ICT and HRM as key
enabling factors (Corso and Paolucci, 2001) improving that way organisational performance
and competitive advantage (Cronin et al., 2006).
The main reasons HRM function uses ICT investments are achievement of effective
HR administration and the HR staff costs reduction (Bondarouk and Ruel, 2009). The ICT
investment has also importantly affects organisational performance in sense of quality of
organisational communication and climate, and quality of HR services (Lippert and Swiercz,
2005, Di Paolo, Corso and Gastaldi, 2011, Troshani, Jerram, & Hill, 2011).
The scarce finance investment, resistance to organizational change, and unskilled employees’
in using the ICT can be the significant restraining factors for the ICT investment effectiveness.
Other, less relevant barriers are: poor commitment of management team, unsatisfactory
coordination and communication, inadequate specific competences and procurement of
unsuitable applications (Corso and Paolucci, 2001, Collins and Smith, (2006, Cronin, Morath
Curtin and Heil, 2006).
The evidences from research conducted show that the implementation of ICTs
contributed to the change in organisation of HRM function in a very limited measure. In some
cases investment in ICT caused appearance of new organizational procedures in HRM, but in
some other led to the different distribution of activities. In lot of cases explored, the only effect
was an improvement of HRM competences in terms of planning and control and performance
evaluation (Jorgensen et al., 2006, Jorgensen, Hyland and Kofoed, 2006, Di Paolo, Corso and
Gastaldi, 2011; Rice & Leonardi, 2013).
ICTs in HRM can be used in two different ways: (1) Supporting the current activities
in HRM and improving its efficiency and quality of work, and (2) Changing the HRM
processes and innovating existing practices. In that sense it possible to identify the four types
of ICT used within HRM function in an organisation such as operational support, work
support, change support and strategic support (Zahra and Scholar, 2013). The majority of
organisations use the ICT as an operational support with a limited impact on both existing and
innovative processes. The operational support considers generic HR administration,
operational personnel management, performance management, and career management. ICT is
widely used in HR planning and control, employee performance management, career and
compensation management. Factory role of ICT is mirrored in supporting routine activities,
while as Change Lever, ICT is as a key tool for innovating HR processes of organizational
design and development and internal communication (Bharadwaj, 2000, Santhanam and
Hartono, 2003). The Strategic Lever type of ICT use considers being as relevant for both
managing HR processes and redesigning them.
The ICT is becoming a Virtual Workspace, creating new innovative and efficient
organizational models enabling collaboration, communication and empowerment of
86
employees and providing them with features such as “knowledge sharing, internal and
external social networks and active involvement at all levels” (Corso et al., 2008; Zahra and
Scholar, 2013).
Recently, the HRM function within organizations and organisation itself are positively
affected by ICT use enabling different new effective work features like paperless office
(Doran, 2003, Wali, 2010), time management, databases, teleworking (Baloh and Trkman,
2003, Wali, 2010), transaction processing and reporting (Broderick and Boudreau, 1991), E-
recruiting, for staffing and employee development through internet, (Baloh and Trkman,
2003). The list is not exhausted and practically every day it can be added a new feature
making work easier and more efficient.
Human resource Information System (HRIS) as an innovative approach to HRM is an
outcome of ICT development and its use in HRM, as two essential organisation’s resources.
HRIS enables organisations to increase effectiveness of HRM and improve overall
organisation’s performance (Lippert and Swiercz, 2005, Troshani, Jerram, and Hill, 2011).
Organisation's HRIS can be defined as a system which is acquiring, storing, manipulating,
retrieving and distributing relevant information about its human resources (Kavanagh, Thite,
and Johnson, 2012). Various authors under HRIS consider various terms; computer based
HRM, e-HRM, HR portals, web-based HR, HR intranet and virtual HR (Lengnick-Hall and
Moritz, 2003, Rouel et all, 2004). Recently, HRIS role has moved to HRM strategy and policy
level serving organisation's needs such as selection and recruitment, employee compensation
and performance management, HR self-service and HR planning alignment with the
organisation’s planning (Bell, Lee, and Yeung, 2006, Lengnick-Hall and Moritz, 2003).
In that sense, the HRIS is the part of MIS with the mission to provide the information
regarding human resources in the organization and facilitate the decision making processes in this
regard (Boateng, 2007; Takeuchi, Chen & Lepak, 2009). In further development HRIS has been
transformed from basically administrative role to the valuable foundation of tenable organisational
performance (Boateng, 2007; Singh & Raghuvanshi, 2013; Obeidat & Abdallah, 2014). It has
becoming a key driver for development and improvement of organizational effectiveness (Wright
& McMahan, 2011; Tong, Tak & Wong, 2015; Yekani, 2016).
Following conclusions are emerging from the problem definition that is used as foundation
of the relevance of proposed dissertation thesis. Impact of the information and communication
technologies to the organizational performance has become widely accepted as one of the most
important issues for both practical and theoretical improvements in the area of business
economics. In the same time, due to the strong advances in highly sophisticated technologies,
number of challenges in contemporary human resources management has emerged. Finally, it has
become evident that the acceptance of ICT and its implementation in human resources
management has become one of the critical issues for organizations success. These conclusions are
leading us to important field that investigates impact of human resources management to
organizational performance, which will be discussed in the next section.
Previous studies on HRIS are mainly exploratory, with the geographically limited
focus of the research. Those studies did not explore different aspects of HRIS usage in
organizations and its impact to organizational performance - at the global level. Taking this
into account, and especially if we take into consideration impact of ICT to organizational
performance in general, there is a need to conduct a research on the impact of HRIS to
organizational performance, on the global level and from different perspectives of HRIS
usage.

87
3. Methodology
In the research the usage of information and communication technologies (ICT) in human
resources management (HRM) has been explored. Recent technological development lead to
development of human resources information systems (HRIS), but the question arises to what
extent HRIS usage impacts organizational performance. Previous research on that topic have
been conducted only on exploratory level (Strohmeier et al., 2009; De Alwis, 2010), in the
area of limited geographical context (Panayotopoulou et al., 2007), or solely on the single
aspects of HRIS (e.g. Storhmeier et al., 2009). In addition, HRIS usage has number of
different aspects, e.g. type of HRIS, areas of HRM that are covered by HRIS, availability of
self-service in HRIS for both managers and employees, and extent of HRIS outsourcing.
Therefore, the purpose of this research was to get an understanding into impact of HRIS usage
from different perspectives to organizational performance.
Based on the research of Nuasair and Parsa (2007) and Ruel and Bondaruk (2009) on
the impact of the critical factors that influence both HRIS and overall organizational
performance, the hypothesis saying that categories/classes of overall organizational
performance are independent of usage or non-usage of HRIS is developed. Overall
organizational performance (OOP) is determined as weighted sum of partial performances.
n
i
ii eperformancpartialweperformanconalorganizatioverall1
_*__
(1)
Partial performances are: Service quality, Level of productivity, Profitability, Rate of
innovation, Stock market performance, Environmental matters and parameters. In
experimental part have been assumed different scenarios for setting up weights (i.e. equally
distributed, Pareto distributed, “commons sense”, etc.).
These conclusions guide us to the development of research hypothesis, presented at
Figure 1 and described below. The hypothesis construction was supported by the previous
research ((Nuasair and Parsa (2007) and Ruel and Bondaruk (2009)).
Figure 1 Research model
Source: Authors work
HRIS usage in
organisations
Organisational performance
(Nuasair and Parsa (2007) and
Ruel and Bondaruk (2009))
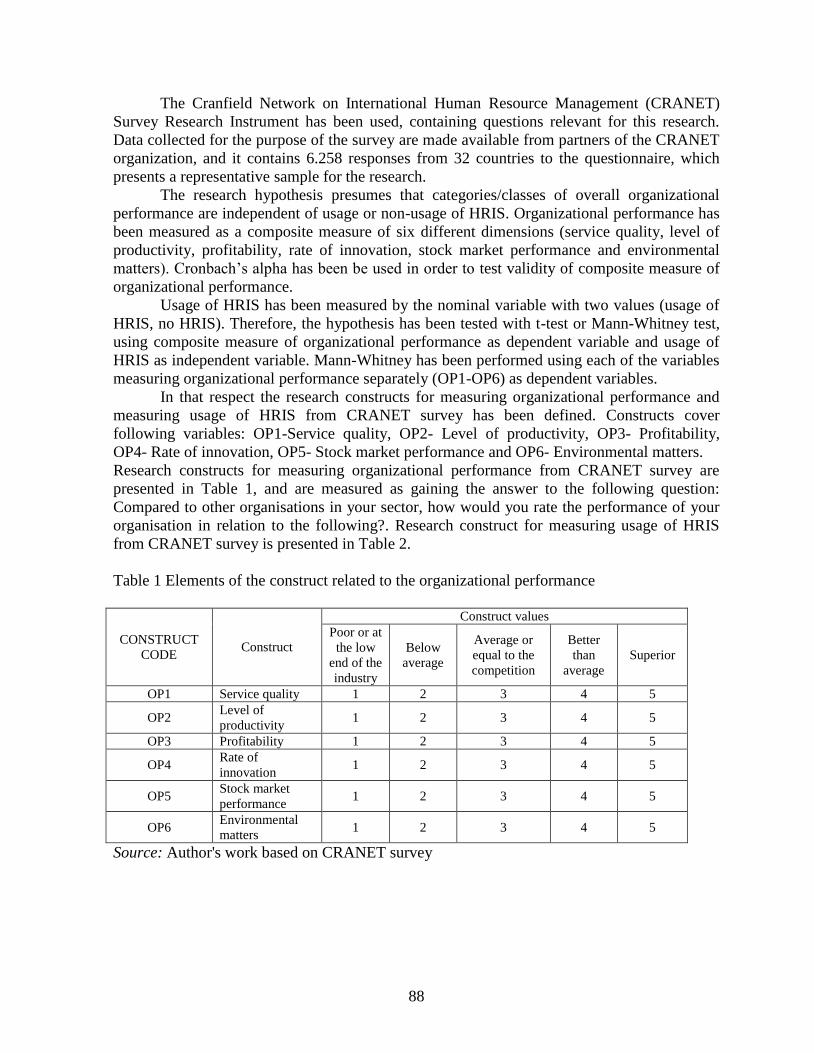
88
The Cranfield Network on International Human Resource Management (CRANET)
Survey Research Instrument has been used, containing questions relevant for this research.
Data collected for the purpose of the survey are made available from partners of the CRANET
organization, and it contains 6.258 responses from 32 countries to the questionnaire, which
presents a representative sample for the research.
The research hypothesis presumes that categories/classes of overall organizational
performance are independent of usage or non-usage of HRIS. Organizational performance has
been measured as a composite measure of six different dimensions (service quality, level of
productivity, profitability, rate of innovation, stock market performance and environmental
matters). Cronbach’s alpha has been be used in order to test validity of composite measure of
organizational performance.
Usage of HRIS has been measured by the nominal variable with two values (usage of
HRIS, no HRIS). Therefore, the hypothesis has been tested with t-test or Mann-Whitney test,
using composite measure of organizational performance as dependent variable and usage of
HRIS as independent variable. Mann-Whitney has been performed using each of the variables
measuring organizational performance separately (OP1-OP6) as dependent variables.
In that respect the research constructs for measuring organizational performance and
measuring usage of HRIS from CRANET survey has been defined. Constructs cover
following variables: OP1-Service quality, OP2- Level of productivity, OP3- Profitability,
OP4- Rate of innovation, OP5- Stock market performance and OP6- Environmental matters.
Research constructs for measuring organizational performance from CRANET survey are
presented in Table 1, and are measured as gaining the answer to the following question:
Compared to other organisations in your sector, how would you rate the performance of your
organisation in relation to the following?. Research construct for measuring usage of HRIS
from CRANET survey is presented in Table 2.
Table 1 Elements of the construct related to the organizational performance
CONSTRUCT
CODE Construct
Construct values
Poor or at
the low
end of the
industry
Below
average
Average or
equal to the
competition
Better
than
average
Superior
OP1 Service quality 1 2 3 4 5
OP2 Level of
productivity 1 2 3 4 5
OP3 Profitability 1 2 3 4 5
OP4 Rate of
innovation 1 2 3 4 5
OP5 Stock market
performance 1 2 3 4 5
OP6 Environmental
matters 1 2 3 4 5
Source: Author's work based on CRANET survey

89
Table 2 Variable measuring the usage of HRIS in the organization
CONSTRUCT CODE Construct Construct values
Usage No usage
HRIS_Usage Usage of HRIS in the organization 1 0
Source: Author's work based on CRANET survey
4. Results
Table 3 presents descriptive statistics of organizational performance according to the usage of
HRIS. For organizations that do not have HRIS and those that use HRIS, mean value is higher
than 3 for all organizational performance variables, with exception of one variable – Stock
market performance (Do not have HRIS: 2.82; Use HRIS: 2.98). However, mean values for all
organizational performance variables are higher in the group of organizations that use HRIS.
The highest mean value is for organizational performance variable named Service quality (Do
not have HRIS: 3.86; Use HRIS: 3.90).
Table 3 Descriptive statistics of organizational performance according to HRIS usage
Serv
ice quality
Pro
ductiv
ity
Pro
fitability
Innovatio
n
Sto
ck m
arket
perfo
rman
ce
Enviro
nm
ental
matters
Averag
e
Org
anizatio
nal
perfo
rman
ce
Do not have HRIS
Mean 3.86 3.60 3.35 3.37 2.82 3.33 3.36
N 844 814 807 814 477 739 443
St. Dev. 0.77 0.88 0.98 1.05 4.10 1.00 0.69
Use HRIS
Mean 3.90 3.63 3.44 3.47 2.98 3.47 3.46
N 3892 3824 3626 3783 2198 3507 2034
St. Dev. 0.75 0.82 0.95 0.95 1.12 0.90 0.64
Total
Mean 3.91 3.63 3.43 3.45 2.95 3.44 3.44
N 4736 4638 4433 4597 2675 4246 2477
St. Dev. 0.75 0.83 0.95 0.97 2.01 0.92 0.5
Source: Author's work based on CRANET survey
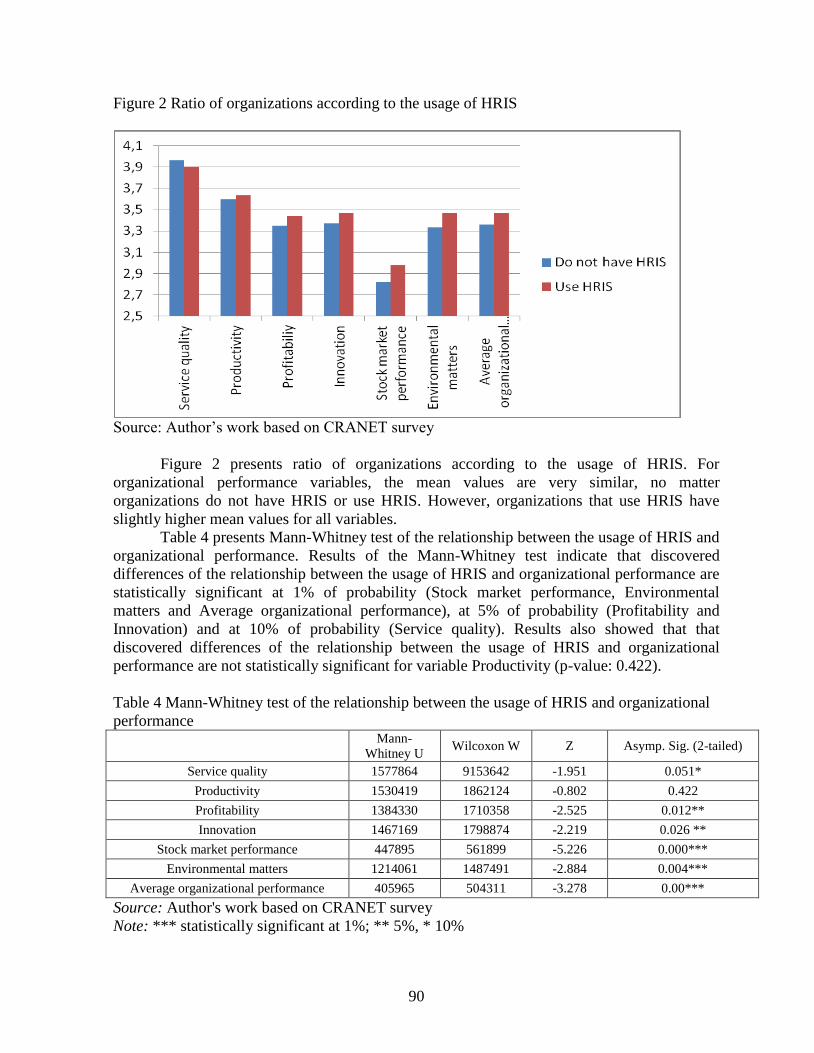
90
Figure 2 Ratio of organizations according to the usage of HRIS
Source: Author’s work based on CRANET survey
Figure 2 presents ratio of organizations according to the usage of HRIS. For
organizational performance variables, the mean values are very similar, no matter
organizations do not have HRIS or use HRIS. However, organizations that use HRIS have
slightly higher mean values for all variables.
Table 4 presents Mann-Whitney test of the relationship between the usage of HRIS and
organizational performance. Results of the Mann-Whitney test indicate that discovered
differences of the relationship between the usage of HRIS and organizational performance are
statistically significant at 1% of probability (Stock market performance, Environmental
matters and Average organizational performance), at 5% of probability (Profitability and
Innovation) and at 10% of probability (Service quality). Results also showed that that
discovered differences of the relationship between the usage of HRIS and organizational
performance are not statistically significant for variable Productivity (p-value: 0.422).
Table 4 Mann-Whitney test of the relationship between the usage of HRIS and organizational
performance
Mann-
Whitney U Wilcoxon W Z Asymp. Sig. (2-tailed)
Service quality 1577864 9153642 -1.951 0.051*
Productivity 1530419 1862124 -0.802 0.422
Profitability 1384330 1710358 -2.525 0.012**
Innovation 1467169 1798874 -2.219 0.026 **
Stock market performance 447895 561899 -5.226 0.000***
Environmental matters 1214061 1487491 -2.884 0.004***
Average organizational performance 405965 504311 -3.278 0.00***
Source: Author's work based on CRANET survey
Note: *** statistically significant at 1%; ** 5%, * 10%

91
Table 5 presents summary results of the Mann-Whitney test of the relationship between the
organizational performance and HRIS usage. Results indicate that relationship between the
organizational performance and HRIS usage is higher and is statistically significant at 10% of
probability for variable Service quality, at 5% of probability for variables Profitability and
Innovation and at 1% of probability for variables Stock market performance, Environmental
matters and Average organizational performance.
Table 5 Summary results of the Mann-Whitney test of the relationship between the
organizational performance and HRIS usage
Organizational performance Type of relationship and statistical significance
Service quality Higher for HRIS USAGE / 10%
Productivity Not statistically significant
Profitability Higher for HRIS USAGE / 5%
Innovation Higher for HRIS USAGE / 5%
Stock market performance Higher for HRIS USAGE / 1%
Environmental matters Higher for HRIS USAGE / 1%
Average organizational performance Higher for HRIS USAGE / 1%
Source: Author's work based on CRANET survey
6. Conclusion
The goal of the paper was to test the relationship between the implementation of HRIS to
various measures of organizational performance. The Mann-Whitney test is are used, and
results show a positive impact of HRIS to organizational performance is stronger if HRIS
supports self-service to managers and employees. The Mann-Whitney test indicate that the
relationship between organizational performance and supports self-service to managers is
higher if HRIS is used, but for variable Service quality is not statistically significant. Results
of regression analysis have shown that the relationship between organizational performance
and supports self-service to employees using HRIS has positive impact only for variable
Innovation and for managers for only three organizational performance variables: Stock
market performance, Environmental matters and Average organizational performance.
Therefore, the hypothesis can be partially accepted.
This work contributes to the area of the researching impact of ICTs to organizational
performance focusing to the usage of HRIS. The purpose of this research was to increase the
understanding into impact of HRIS usage to organizational performance with the utilization of
global CRANET data set, leading to global analysis. The research was based on the
propositions that the data collected by CRANET is representative of the HRM practices of
worldwide companies. Based on the size of the sample, and restrictive practices of CRANET
in data collection, there are strong arguments that this proposition is valid.
On the other hand, the main limitations of research stem from the cross-sectional
characteristics of the data that represents a snap-shot of the specific characteristics, and do not
provide insight into long term relationship and changes. However, cross-sectional research is
widely used due its costs that are lower than longitudinal studies, and this is the reason why
this approach is also used for this research.
92
References:
1. Abubakar, A. A., & Tasmin, R. B. H. (2012). The impact of information and
communication technology on banks’ performance and customer service delivery in the
banking industry. International Journal of Latest Trends in Finance and Economic
Sciences, 2(1), 80-90.
2. Alwahaishi, S., & Snásel, V. (2013). Acceptance and Use of Information and
Communications Technology: A UTAUT and Flow Based Theoretical Model. Journal of
technology management & innovation, 8(2), 61-73.
3. Baldwin, J. R., Sabourin, D. and Smith, D. (2003). Impact of advanced technology use on
firm performance in the Canadian food processing sector (Research Paper), Ottawa:
Statistics Canada, Micro-Economic Analysis Division. Retrieved 26.11.2017 from
http://publications.gc.ca/Collection/Statcan/11F0027M/11F0027MIE2003012.pdf.
4. Baloh, P. and Trkman, P. (2003). Influence of Internet and information technology on
work and human resource management. Informing science: the international journal of an
emerging transdiscipline, 23(6), 498-505.
5. Barney, J. (1991). Firm resources and sustained competitive advantage. Journal of
management, 17(1), 99-120.
6. Becker, B. E. and Huselid, M. A. (2006). Strategic human resources management: where
do we go from here?. Journal of management, 32(6), 898-925.
7. Becker, B., Ulrich, D. and Huselid, M. (2001). The HR scorecard: linking people, strategy,
and performance. Boston: Harvard Business School.
8. Bell, B. S., Lee, S. W. and Yeung, S. K. (2006). The impact of e‐HR on professional
competence in HRM: implications for the development of HR professionals. Human
resource management, 45(3), 295-308.
9. Benamati, J. and Lederer, A. L. (2001). How IT organizations handle rapid IT change: five
coping mechanisms. Information technology and management, 2(1), 95-112.
10. Bharadwaj, A. S. (2000). A resource-based perspective on information technology
capability and firm performance: an empirical investigation. MIS quarterly, 24(3), 169-
196.
11. Bondarouk, T. V. and Ruël, H. J. M. (2009). Electronic human resource management:
challenges in the digital era. The international journal of human resource management,
20(3), 505-514.
12. Boudreau, J. W. and Ramstad, P. M. (1998). Human resource metrics: can measures be
strategic? (CAHRS Working Paper #98-10). Ithaca, NY: Cornell University, School of
Industrial and Labor Relations, Center for Advanced Human Resource Studies. Retrieded
3. 9. 2016 from http://digitalcommons.ilr.cornell.edu/cahrswp/123.
13. Brewer, G. and Gajendran, T. (2009). Emerging ICT trends in construction project teams:
a Delphi survey. Journal of information technology in construction, 14(9), 81-97.
14. Brynjolfsson, E. and Hitt, L. M. (2002). Beyond computation: information technology,
organizational transformation and business performance. The journal of economic
perspectives, 14(4), 23-48.
15. Broderick, R. and Boudreau, J. W. (1991). The evolution of computer use in human
resource management: interviews with ten leaders. Human resource management, 30(4),
485-508.
93
16. Brewster, C., Sparrow, P., Vernon, G. and Houldsworth, L. (2007). International human
resource management (2nd ed.). London: Chartered Institute of Personnel and
Development.
17. Cardon, M. S. and Stevens, C. E. (2004). Managing human resources in small
organizations: what do we know?. Human resource management review, 14(3), 295-323.
18. Collins, C. J. and Smith, K. G. (2006). Knowledge exchange and combination: the role of
human resource practices in the performance of high-technology firms. Academy of
Management journal, 49(3), 544-560.
19. Comacchio, A., Gerli, F., Scapolan, A. and Bonesso, S. (2008). HR outsourcing in Italy. In
G. Martin, M. Reddington and H. Alexander (eds.), Technology, outsourcing and
transforming HR (p. 57-85). London; New York: Routledge.
20. Conner, K. R. and Prahalad, C. K. (1996). A resource-based theory of the firm: knowledge
versus opportunism. Organization science, 7(5), 477-501.
21. Corso, M., Martini, A. and Pesoli, A. (2008). ICT-based innovation: emerging models for
the enterprise 2.0. results from a 70 case-based research. International journal knowledge
and learning, 4(6), 595–612.
22. Cronin, B., Morath, R., Curtin, P. and Heil, M. (2006). Public sector use of technology in
managing human resources. Human resource management review, 16(3), 416-430.
23. Dehning, B. and Stratopoulos, T. (2003). Determinants of a sustainable competitive
advantage due to an IT-enabled strategy. The journal of strategic information systems,
12(1), 7-28.
24. Devaraj, S. and Kohli, R. (2003). Performance impacts of information technology: is
actual usage the missing link?. Management science, 49(3), 273-289.
25. Dewan, S. and Kraemer, K. L. (2000). Information technology and productivity: evidence
from country-level data. Management science, 46(4), 548-562.
26. Di Paolo, A., Corso, M. and Gastaldi, L. (2011). Using new ICTs in human resource
management to foster continuous innovation in public administrations. In M. Corso, A.
Martini, E. Lettieri and P. Locatelli (eds.), Continuous innovation: doing more with less:
12th international CINet conference, Milano, 12.9.2011 (pp. 270-280). Milano:
Politecnico di Milano.
27. Doran, A. (2003). The ties that bind HR and IS. HR professional, 48(12), 56-61.
28. Garcia-Canal, E., Rialp-Criado, A. and Rialp-Criado, J. (2013). Speed of ICT integration
strategies in absorptions: insights from a qualitative study. European management journal,
31(3), 295-307.
29. Gavrea, C., Ilies, L. and Stegerean, R. (2011). Determinants of organizational
performance: the case of Romania. Management and marketing, 6(2), 285-300.
30. Gera, S. and Gu, W. (2004). The effect of organizational innovation and information
technology on firm performance. International performance monitor, 9(3), 37-51.
31. Hiltrop, J. M. (1996). The impact of human resource management on organisational
performance: theory and research. European management journal, 14(6), 628-637.
32. Hitt, L. M., Wu, D. J. and Zhou, X. (2002). Investment in enterprise resource planning:
business impact and productivity measures. Journal of management information systems,
19(1), 71-98.
33. Hiltrop, J. M. (1996). The impact of human resource management on organisational
performance: theory and research. European management journal, 14(6), 628-637.

94
34. Hitt, L. M., Wu, D. J. and Zhou, X. (2002). Investment in enterprise resource planning:
business impact and productivity measures. Journal of management information systems,
19(1), 71-98.
35. Jørgensen, F., Hyland, P. and Kofoed, L. B. (2008). Modelling the role of human resource
management in continuous improvement. Creativity and innovation management, 16(4),
363–375.
36. Kalleberg, A. L., Marsden, P. V., Reynolds, J. and Knoke, D. (2006). Beyond profit?:
sectoral differences in high-performance work practices. Work and occupations, 33(3),
271-302.
37. Kavanagh, M. J. and Thite, M. and Johnson, R. A. (2012). Human resource information
systems: basics, applications and future directions. Los Angeles; London: Sage
Publications.
38. Kesti, M. (2012). Organization human resources development connection to business
performance. Procedia economics and finance, 2(1), 257-264.
39. Kesti, M. and Syväjärvi, A. (2010). Human tacit signals at organization performance
development. Industrial management and data systems, 110(2), 211-229.
40. Kesti, M., Syväjärvi, A., Stenvall, J. and Rivera, M. A. (2011). Human capital scenario
analysis as an organizational intelligence tool for performance management. International
research journal problems and perspectives in management, 9(1), 46-48.
41. Kitching, A. R. (2008). Exploring the public sector adoption of HRIS. Industrial
management and data systems, 111(3), 470-488.
42. Klaas, T. (2003). Knowledge as a transformation agent. Measuring business excellence,
4(4), 24-30.
43. Kock, H., Wallo, A., Nilsson, B. and Höglund, C. (2012). Outsourcing HR services: the
role of human resource intermediaries. European journal of training and development,
36(8), 772-790.
44. Lengnick-Hall, M. L. and Moritz, S. (2003). The impact of e-HR on the human resource
management function. Journal of labor research, 24(3), 365-379.
45. Lippert, S. K. and Swiercz, P. M. (2005). Human resource information systems (HRIS)
and technology trust. Journal of information science, 31(5), 340-353.
46. Magnusson, M. and Martini, A. (2008). Dual organisational capabilities: from theory to
practice: the next challenge for continuous innovation. International journal of technology
management, 42(1/2), 1-19.
47. Maguire, S. and Redman, T. (2007). The role of human resource management in
information systems development. Management decision, 45(2), 252-264.
48. Melville, N., Kraemer, K. and Gurbaxani, V. (2004). Review: information technology and
organizational performance: an integrative model of IT business value. MIS quarterly,
28(2), 283-322.
49. Mouelhi, R. B. A. (2009). Impact of the adoption of information and communication
technologies on firm efficiency in the Tunisian manufacturing sector. Economic
Modelling, 26(5), 961-967.
50. Nuasair, K. K., & Parsa, H. G. (2007). „Critical Factors in Implementing HRIS in
Restaurant Chains “, Advances in Hospitality and Leisure, Vol. Joseph S. Chen.
51. Okello, G., Adhiambo, M., Maritim, K. and Ouma, E. (2014). The role of ICT in economic
growth and poverty reduction. International journal of arts and commerce, 3(3), 35-48.
52. Oulton, N. (2012). Long term implications of the ICT revolution: applying the lessons of
growth theory and growth accounting. Economic modelling, 29(5), 1722-1736.

95
53. Panayotopoulou, L. and Papalexandris, N. (2004). Examining the link between human
resource management orientation and firm performance. Personnel review, 33(5), 499-
520.
54. Piccoli, G. and Ives, B. (2005). Review: IT-dependent strategic initiatives and sustained
competitive advantage: a review and synthesis of the literature. MIS quarterly, 29(4), 747-
776.
55. Pilat, D. (2001). Innovation and productivity in services: state of the art. In OECD,
Innovation and productivity in services (pp. 17-58). Paris: OECD.
56. Ramstad, E. (2009). Promoting performance and the quality of working life
simultaneously. International journal of productivity and performance management,
58(5), 423-436.
57. Rice, R. E. and Leonardi, P. M. (2013). Information and communication technology use in
organizations. In L. L. Putnam and D. K. Mumby (eds.), The Sage handbook of
organizational communication (pp.425-448). Thousand Oaks: Sage.
58. Rogers, E. W. and Wright, P. M. (1998). Measuring organizational performance in
strategic human resource management: problems, prospects and performance information
markets. Human resource management review, 8(3), 311-331.
59. Rogers, E. M. (2010). Diffusion of innovations. Simon and Schuster.
60. Ruël, H. J., & Bondarouk, T. (2009). Exploring the Relationship between e-HRM and
HRM Effectiveness: Lessons Learned from Three International Companies. Technology,
outsourcing and transforming HR.
61. Saltari, E., Wymer, C. R. and Federici, D. (2013). The impact of ICT and business services
on the Italian economy. Structural change and economic dynamics, 25(6), 110-118.
62. Sambamurthy, V., Bharadwaj, A. and Grover, V. (2003). Shaping agility through digital
options: reconceptualizing the role of information technology in contemporary firms. MIS
quarterly, 27(2), 237-263.
63. Santhanam, R. and Hartono, E. (2003). Issues in linking information technology capability
to firm performance. MIS quarterly, 27(1), 125-153.
64. Santos Vieira, J. M., Sarriegi, J. M., Santos, J. and Serrano P. T. (2013) Effecting HRM-
style practices through an integrated human resource information system: an e-greenfield
site?. Personnel review, 30(3), 351-371.
65. Scott, W. R. and Davis, G. F. (2007) A universalistic perspective for explaining the
relationship between HRM practices and firm performance at different points in time.
Journal of managerial psychology, 21(2), 109-130.
66. Scullion, H. and Starkey, K. (2000). In search of the changing role of the corporate human
resource function in the international firm. International journal of human resource
management, 11(6), 1061-1081.
67. Silvestri, G and Pilati, M. (2005). La gestione strategica delle risorse umane: un nuovo
patto tra direzione del personale e management. Economia e management, 1(1), 97-114.
68. Strohmeier, S. and Kabst, R. (2012). Evaluating major human resource information
systems design characteristics: an empirical study. International journal of business
information systems, 9(3), 328-342.
69. Troshani, I., Jerram, C. and Rao Hill, S. (2011). Exploring the public sector adoption of
HRIS. Industrial management and data systems, 111(3), 470-488.
70. Ulrich, D. (1997). HR of the future: Conclusions and observations. Human Resource
Management, 36(1), 175-179.

96
71. Ulrich, D., Younger, J., & Brockbank, W. (2008). The twenty‐first‐century HR
organization. Human Resource Management, 47(4), 829-850.
72. Walli, D. S. (2010) Will the strategic fit between business and HRM strategy influence
HRM effectiveness and organizational performance?. International journal of manpower,
29(2), 92-110.
73. Weill, P. and Broadbent, M. (2000). Managing IT infrastructure: a strategic choice. In R.
Zmud (ed.), Framing the domains of IT management: projecting the future through the
past (pp. 329-353). Cincinnati: Pinnaflex Education Resources.
74. Xue, Y., Liang, H. and Boulton, W. R. (2008). Information technology governance in
information technology investment decision processes: the impact of investment
characteristics, external environment and internal context. MIS quarterly, 32(1), 67-96.
75. Zahra, A. (2013). ICT and HRM: management perceptions about the changing scenario. In
F. U. Islam and R. Kalim (eds.), 3rd international conference on business management,
Lahore, 27-28 February 2012 (pp. 1-14). Lahore: University of the Punjab.
97
SHARING IS CARING, AND MILLENNIALS DO CARE:
COLLABORATIVE CONSUMPTION THROUGH THE EYES OF
INTERNET GENERATION
Merima Cinjarevic
School of Economics and Business, University of Sarajevo
Trg oslobodjenja Alija Izetbegovic 1, 71 000 Sarajevo, B&H
Phone: ++ 387 33 253 784 ; Fax: ++ 387 33 275 969
Amra Kozo
School of Economics and Business, University of Sarajevo
Trg oslobodjenja Alija Izetbegovic, 71 000 Sarajevo, B&H
Phone: ++ 387 33 253 773; Fax: ++ 387 275 969
Denis Berberovic
School of Economics and Business, University of Sarajevo
Trg oslobodjenja Alija Izetbegovic 1, 71 000 Sarajevo, B&H
Phone: ++ 387 33 253 775; Fax: ++ 387 33 275 969
Abstract
The purpose of this research is to investigate the effects of perceived value dimensions (i.e.,
economic value, hedonic value, symbolic value, and social value) on behavioral intent to
engage in collaborative consumption from the perspective of Generation Y. Furthermore, this
research aims to investigate the mediating effect of young consumers’ attitude toward
collaborative consumption on the relationship between perceived value dimensions and
behavioral intent to engage in collaborative consumption. Responses were obtained from a
total of 219 respondents drawn from student groups studying at one of the largest university in
Bosnia and Herzegovina, using convenience sampling. The data collected were analyzed using
confirmatory factor analysis (CFA) and multiple regression analysis. Research findings
suggest that specific dimensions of value perceptions (economic, hedonic, symbolic, and
social) have differing direct effects on young consumers’ behavioral intention to engage in
collaborative consumption services. Regarding mediating role of consumers’ attitude toward
collaborative consumption, it was found that mediating effect takes place only in the symbolic
value-behavioral response link. Given the paucity of research focusing specifically on the
collaborative consumption from the perspective of Generation Y, this study provides new and
useful insights for researchers and managers.
Keywords: Sharing economy, Collaborative consumption (CC), Perceived value, Generation
Y (Millennials)
JEL Classification: M00

98
1. Introduction
Over the past years, sharing economy has become a fast-growing and widespread phenomenon
(Belk, 2014a; Böcker and Meelen, 2017). The idea of sharing is old as humanity (Belk,
2014a), and we share for both functional and altruistic reasons (Fine, 1980). According to
Benkler (2004), sharing is defined as nonreciprocal pro-social behavior. However, thanks to
the information and communication technologies, sharing economy along with collaborative
consumption, is deeply rooted in the Internet age (Belk, 2014a; Hamari et al., 2015). Internet
supports online based networks, and mobile applications, even more, contribute to free and
instant information flow (Bardhi and Eckhardt, 2012; Hamari et al., 2015; Möhlmann, 2015).
Many believe that the global financial crisis (2008) contributed to the development of
sharing economy (Walsh 2011; Bardhi and Eckhardt, 2012; Schor and Fitzmaurice, 2015)
since one of the positive effects of sharing economy is related to cost saving. Still, economic
benefits are not the only drivers that move consumers toward collaborative consumption.
Owyang et al. (2014) suggest that besides economic reasons, collaborative consumption is as
well driven by societal and technological factors. Moreover, the literature suggests that
nowadays consumers are prone to try new ways of accessing what they need, they are open to
experimenting with new brands, and they are environmentally oriented. There is a broad
spectrum of reasons for consumers to share and collaborate, thus flourishing of collaborative
consumption could be evident in the future as well. Furthermore, the demographic
characteristics of consumers are related to the market of sharing economy and perceived
values that lie behind collaborative consumption (Tussyadiah, 2015). Due to their inclination
toward technological inventions and everyday usage of Internet and mobile application,
Generation Y is becoming influential generational cohort that shapes social and economic
trends around the world. Since Millennials are grown up in the era of social media and
cyberspace (Deal et al., 2010), sharing economy and collaborative consumption for this
generation seem like a natural fit (Godelnik, 2017). Perceived Values embraced by Millennials
are related to impact their consumption choices have on the social, communal and
environmental causes, keeping them constantly open for the collaborative type of consumption
(Hwang and Griffiths, 2017).
According to Möhlmann (2015), there is a lack of knowledge about the reasons why
consumers engage and why consumers avoid to participate in collaborative activities. While
Böcker and Meelen (2017) argue how until now there is a lack of quantitative research about
the sharing economy motivators, Jenkins et al. (2014) even emphasize that studies about
drivers of the usage of collaborative consumption are rare and contain shortcomings.
Moreover, Hamari et al. (2015) claim that in so far conducted research, there is an evident
lack of quantitative studies on motivators that influence consumers' attitudes and intentions
toward collaborative consumption. Benoit, S. et al. (2017) suggests that more profound
understanding of factors influencing participation of consumers in CC can be enhanced with
examinations of potential moderators and mediators within observed relations.
Taking all previously mentioned into account and bearing in mind characteristics of
Generation Y, this study aims to explore perceived values that influence consumers'
behavioral intention to engage in collaborative consumption. Moreover, the study assesses
how the attitude toward collaborative consumption mediate the relation between perceived
99
values and behavioral intention to engage in CC. The article is structured in coming manner.
The next section brings the theoretical framework and development of hypotheses. The third
section contains the research methodology, and the fourth contains the results of the conducted
research. The subsequent sections develop discussion and conclusion.
2. Theoretical background and research hypotheses
Even the sharing phenomenon is still in its formative stages (Bucher et al., 2016), many terms
in literature intended to depict this emerging “sharing” trend where products are more shared
than privately owned (Nesta, 2014).
Botsman (2015) conceptualize the sharing economy as an economic system based on
sharing underused assets or services, for free or for a fee, directly from individuals. Other
authors observe sharing economy as “an emerging economic-technological phenomenon that
is fuelled by developments in information and communication technology, growing consumer
awareness, the proliferation of collaborative web communities as well as social
commerce/sharing (Botsman and Rogers, 2010; Kaplan and Haenlein, 2010; Wang and Zhang,
2012). It is considered as an umbrella concept that encompasses several information and
communication technology developments and technologies, among others collaborative
consumption, which endorses sharing the consumption of good and services through online
platforms” (Hamari et al., 2015: 2047).
The concept of sharing economy in literature is often associated with collaborative
consumption. For the purpose of this study, we will follow a collaborative consumption
conceptualization offered by Belk (2014a) where he argues that “collaborative consumption is
people coordinating acquisition and distribution of a resource for a fee or other compensation”
where term other compensation refers to bartering, trading, and swapping, which involve
giving and receiving non-monetary compensation. Also, this definition omits those types of
giving that concern a permanent ownership transfer (Belk, 2014b). Some scholars observe
collaborative consumption broader than just consumption and claims that it is an activity
where contribution and usage of resources are intertwined via peer-to-peer networks (Hamari
et al., 2015). However, this is just confirmation that collaborative consumption can be viewed
through various standpoints: sharing (e.g., Belk, 2014a), borrowing (e.g., Jenkins et al., 2014),
reuse (e.g., Lessig, 2008), and similar.
In both sharing economy and collaborative consumption, Millennials have been
recognized as an outstanding consumer group (Head, 2013). This is expected since Millennials
represents a generational cohort that apt for multitasking due to the high use of technology and
to work for greater good (White, 2011). Moreover, Millennials relation with technology
probably can be very well illustrated if we notice that in literature they are as well recognized
under the names of “Internet generation” or “Connect 24/7” (Schroer, 2015). This research
observes Millennials as a generation born in 1981 – 1999 period (Wong et al., 2008).
According to Theory of Generation (or so-called Sociology of Generation), a generation is a
group of individuals of similar ages whose members have experienced a noteworthy historical
event within a set period (Pilcher, 1993). Therefore, in order to be part of the same generation,
for individuals, it is not enough to belong to same time span but to experience a similar socio-
historical environment that shapes social conscious of people during young ages, since later
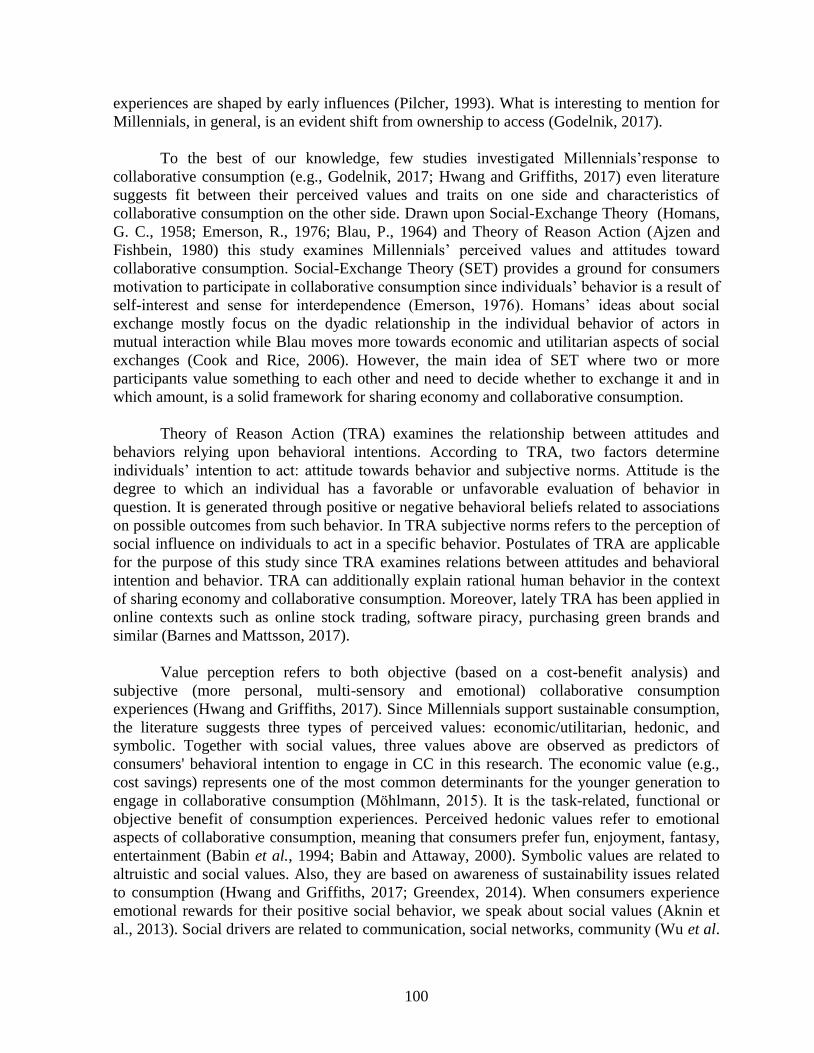
100
experiences are shaped by early influences (Pilcher, 1993). What is interesting to mention for
Millennials, in general, is an evident shift from ownership to access (Godelnik, 2017).
To the best of our knowledge, few studies investigated Millennials’response to
collaborative consumption (e.g., Godelnik, 2017; Hwang and Griffiths, 2017) even literature
suggests fit between their perceived values and traits on one side and characteristics of
collaborative consumption on the other side. Drawn upon Social-Exchange Theory (Homans,
G. C., 1958; Emerson, R., 1976; Blau, P., 1964) and Theory of Reason Action (Ajzen and
Fishbein, 1980) this study examines Millennials’ perceived values and attitudes toward
collaborative consumption. Social-Exchange Theory (SET) provides a ground for consumers
motivation to participate in collaborative consumption since individuals’ behavior is a result of
self-interest and sense for interdependence (Emerson, 1976). Homans’ ideas about social
exchange mostly focus on the dyadic relationship in the individual behavior of actors in
mutual interaction while Blau moves more towards economic and utilitarian aspects of social
exchanges (Cook and Rice, 2006). However, the main idea of SET where two or more
participants value something to each other and need to decide whether to exchange it and in
which amount, is a solid framework for sharing economy and collaborative consumption.
Theory of Reason Action (TRA) examines the relationship between attitudes and
behaviors relying upon behavioral intentions. According to TRA, two factors determine
individuals’ intention to act: attitude towards behavior and subjective norms. Attitude is the
degree to which an individual has a favorable or unfavorable evaluation of behavior in
question. It is generated through positive or negative behavioral beliefs related to associations
on possible outcomes from such behavior. In TRA subjective norms refers to the perception of
social influence on individuals to act in a specific behavior. Postulates of TRA are applicable
for the purpose of this study since TRA examines relations between attitudes and behavioral
intention and behavior. TRA can additionally explain rational human behavior in the context
of sharing economy and collaborative consumption. Moreover, lately TRA has been applied in
online contexts such as online stock trading, software piracy, purchasing green brands and
similar (Barnes and Mattsson, 2017).
Value perception refers to both objective (based on a cost-benefit analysis) and
subjective (more personal, multi-sensory and emotional) collaborative consumption
experiences (Hwang and Griffiths, 2017). Since Millennials support sustainable consumption,
the literature suggests three types of perceived values: economic/utilitarian, hedonic, and
symbolic. Together with social values, three values above are observed as predictors of
consumers' behavioral intention to engage in CC in this research. The economic value (e.g.,
cost savings) represents one of the most common determinants for the younger generation to
engage in collaborative consumption (Möhlmann, 2015). It is the task-related, functional or
objective benefit of consumption experiences. Perceived hedonic values refer to emotional
aspects of collaborative consumption, meaning that consumers prefer fun, enjoyment, fantasy,
entertainment (Babin et al., 1994; Babin and Attaway, 2000). Symbolic values are related to
altruistic and social values. Also, they are based on awareness of sustainability issues related
to consumption (Hwang and Griffiths, 2017; Greendex, 2014). When consumers experience
emotional rewards for their positive social behavior, we speak about social values (Aknin et
al., 2013). Social drivers are related to communication, social networks, community (Wu et al.

101
2017), users sharing and relationship-building with others (Kim et al., 2013). Moreover, they
satisfy needs virtually and not physically (Wu et al. 2017).
As discussed earlier, our research model brings together perceived economic, hedonic,
symbolic and social values, and behavioral intention toward CC from the perspective of
Generation Y. We test attitude toward CC as a mediator in the relationship between values and
behavioral intention. Drawing upon theoretical underpinnings of the conceptual model Figure
1 illustrates proposed research model and hypotheses.
Figure 1. Conceptual framework and research hypotheses
H1: Economic value is positively related to consumers’ behavioral intention to engage in
collaborative consumption.
H2: Hedonic value is positively related to consumers’ behavioral intention to engage in
collaborative consumption.
H3: Symbolic value is positively related to consumers’ behavioral intention to engage in
collaborative consumption.
H4: Social value is positively related to consumers0 behavioral intention to engage in
collaborative consumption.
H5a: The impact of economic value on consumers’ behavioral intention to engage in
collaborative consumption is mediated by consumers’ attitude toward collaborative
consumption.
H5b: The impact of hedonic value on consumers’ behavioral intention to engage in
collaborative consumption is mediated by consumers’ attitude toward collaborative
consumption.
H5c: The impact of symbolic value on consumers’ behavioral intention to engage in
collaborative consumption is mediated by consumers’ attitude toward collaborative
consumption.
H5d: The impact of social value on consumers’ behavioral intention to engage in collaborative
consumption is mediated by consumers’ attitude toward collaborative consumption.
Economic value
Hedonic value
Symbolic value
Social value
Consumers’ attitude
toward collaborative
consumption
Consumers’ behavioural
intention to engage in
collaborative
consumption
H1
H2
H3
H4
H5a H5b H5c H5d

102
3. Research methodology
3.1. Data collection and sample
As the purpose of this study was to investigate the effects of perceived value dimensions (i.e.,
economic value, hedonic value, symbolic value, and social value) on behavioral intent to
engage in collaborative consumption from the perspective of Generation Y, students from
Sarajevo School of Economics and Business (SEBS) were chosen as the target population. We
acknowledge that this sample is not representative of the general Generation Y members, but
it is likely to be a reasonable reflection of collaborative consumption patterns amongst this
generation cohort in Bosnia and Herzegovina.
The primary data for this study were collected during May 2018 using an online survey
questionnaire. The sample consisted of full-time undergraduate students enrolled in seven
courses. Selection of courses was consciously made with the intent to find both upper and
lower division courses that would give us a diverse student sample. An e-mail message
including the statement of research purpose, the invitation to participate in the survey and the
hyperlink for directing participants to the questionnaire were posted on a class website. Due to
budget constraints and the risk of introducing some form of bias into the results, no incentives
were used to solicit survey participation. The potential common method variance (CMV)
problems were mitigated by informing respondents that there are no right/wrong answers and
that they should approach each question honestly and candidly (Podsakoff, MacKenzie &
Podsakoff, 2012).
Among the 227 questionnaires returned, eight were discarded because the respondents
failed to complete all of the required questions. Therefore, 219 questionnaires remained for
use in the data analysis. The sample consisted of a slightly higher proportion of females
(68.9%) than males (31.1%). The average age of respondent was 22.2 years with a standard
deviation of 5.083. With the regard of the experience in collaborative consumption, 86.8% of
respondents said they participated in some form of collaborative consumption in the past.
Therefore, the sample consists of Generation Y adults who are au fait with collaborative
consumption.
3.2. Measurement instrument
The research instrument was made up of established scales that were already validated in
previous research. Section A measured the four facets of perceived value in the context of
collaborative consumption. The economic value of CC was assessed using three items from
Hamari Sjöklint and Ukkonen (2015). The hedonic value and social value were measured by
items proposed by Wu, Zeng, and Xie (2017). The symbolic value was measured with three
items adapted from Hwang and Griffiths (2017). Section B measured consumers' attitude
toward CC using four items adapted from Ajzen (1991) and consumers' behavioral intention to
engage in CC with three items from Bhattacherjee (2001). All involved constructs were
measured using a seven-point Likert scale. The last part of the questionnaire (Section C), is
designed to collect information about the respondent’s gender, age, university standing,
household size, monthly household income.
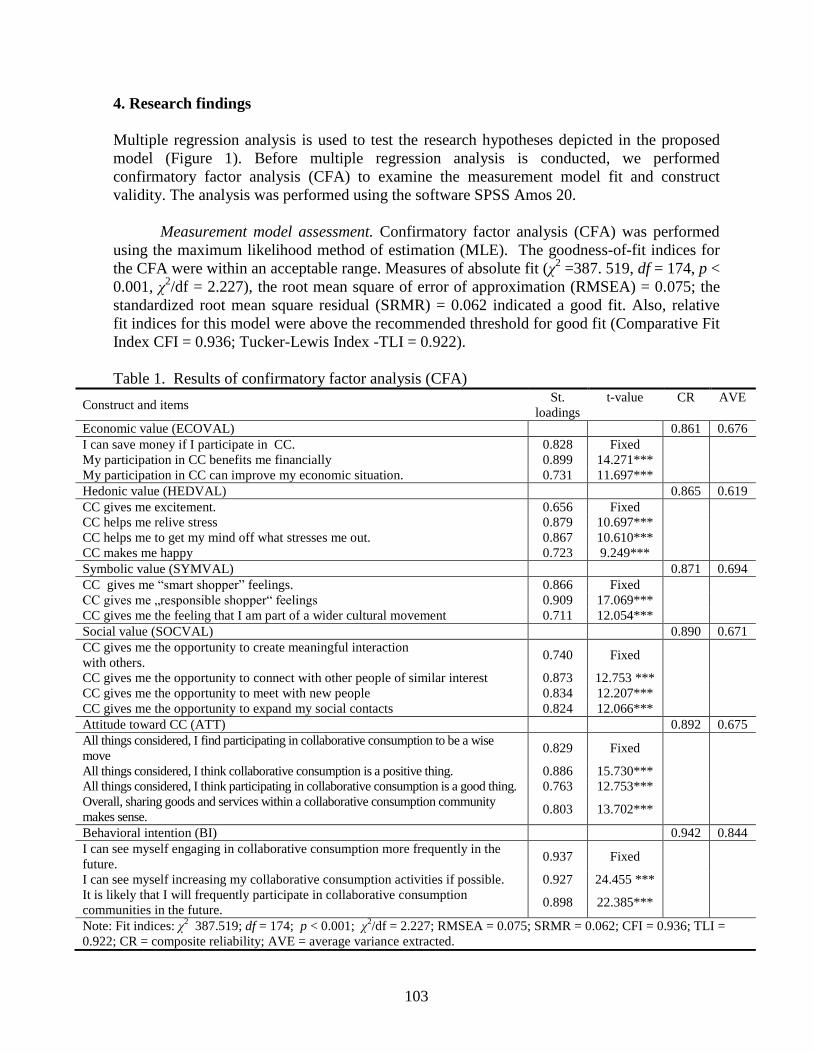
103
4. Research findings
Multiple regression analysis is used to test the research hypotheses depicted in the proposed
model (Figure 1). Before multiple regression analysis is conducted, we performed
confirmatory factor analysis (CFA) to examine the measurement model fit and construct
validity. The analysis was performed using the software SPSS Amos 20.
Measurement model assessment. Confirmatory factor analysis (CFA) was performed
using the maximum likelihood method of estimation (MLE). The goodness-of-fit indices for
the CFA were within an acceptable range. Measures of absolute fit (χ2 =387. 519, df = 174, p <
0.001, χ2/df = 2.227), the root mean square of error of approximation (RMSEA) = 0.075; the
standardized root mean square residual (SRMR) = 0.062 indicated a good fit. Also, relative
fit indices for this model were above the recommended threshold for good fit (Comparative Fit
Index CFI = 0.936; Tucker-Lewis Index -TLI = 0.922).
Table 1. Results of confirmatory factor analysis (CFA)
Construct and items St.
loadings
t-value CR AVE
Economic value (ECOVAL) 0.861 0.676
I can save money if I participate in CC. 0.828 Fixed
My participation in CC benefits me financially 0.899 14.271***
My participation in CC can improve my economic situation. 0.731 11.697***
Hedonic value (HEDVAL) 0.865 0.619
CC gives me excitement. 0.656 Fixed
CC helps me relive stress 0.879 10.697***
CC helps me to get my mind off what stresses me out. 0.867 10.610***
CC makes me happy 0.723 9.249***
Symbolic value (SYMVAL) 0.871 0.694
CC gives me “smart shopper” feelings. 0.866 Fixed
CC gives me „responsible shopper“ feelings 0.909 17.069***
CC gives me the feeling that I am part of a wider cultural movement 0.711 12.054***
Social value (SOCVAL) 0.890 0.671
CC gives me the opportunity to create meaningful interaction
with others. 0.740 Fixed
CC gives me the opportunity to connect with other people of similar interest 0.873 12.753 ***
CC gives me the opportunity to meet with new people 0.834 12.207***
CC gives me the opportunity to expand my social contacts 0.824 12.066***
Attitude toward CC (ATT) 0.892 0.675
All things considered, I find participating in collaborative consumption to be a wise
move 0.829 Fixed
All things considered, I think collaborative consumption is a positive thing. 0.886 15.730***
All things considered, I think participating in collaborative consumption is a good thing. 0.763 12.753***
Overall, sharing goods and services within a collaborative consumption community
makes sense. 0.803 13.702***
Behavioral intention (BI) 0.942 0.844
I can see myself engaging in collaborative consumption more frequently in the
future. 0.937 Fixed
I can see myself increasing my collaborative consumption activities if possible. 0.927 24.455 ***
It is likely that I will frequently participate in collaborative consumption
communities in the future. 0.898 22.385***
Note: Fit indices: χ2 387.519; df = 174; p < 0.001; χ
2/df = 2.227; RMSEA = 0.075; SRMR = 0.062; CFI = 0.936; TLI =
0.922; CR = composite reliability; AVE = average variance extracted.
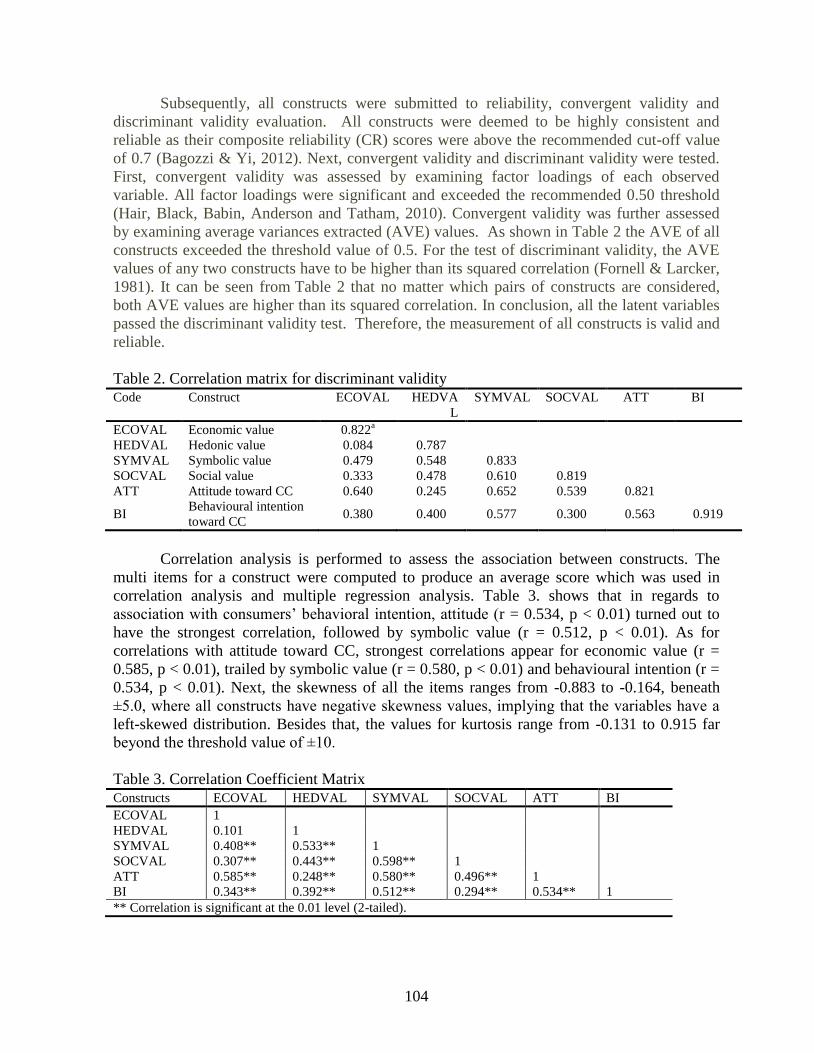
104
Subsequently, all constructs were submitted to reliability, convergent validity and
discriminant validity evaluation. All constructs were deemed to be highly consistent and
reliable as their composite reliability (CR) scores were above the recommended cut-off value
of 0.7 (Bagozzi & Yi, 2012). Next, convergent validity and discriminant validity were tested.
First, convergent validity was assessed by examining factor loadings of each observed
variable. All factor loadings were significant and exceeded the recommended 0.50 threshold
(Hair, Black, Babin, Anderson and Tatham, 2010). Convergent validity was further assessed
by examining average variances extracted (AVE) values. As shown in Table 2 the AVE of all
constructs exceeded the threshold value of 0.5. For the test of discriminant validity, the AVE
values of any two constructs have to be higher than its squared correlation (Fornell & Larcker,
1981). It can be seen from Table 2 that no matter which pairs of constructs are considered,
both AVE values are higher than its squared correlation. In conclusion, all the latent variables
passed the discriminant validity test. Therefore, the measurement of all constructs is valid and
reliable.
Table 2. Correlation matrix for discriminant validity Code Construct ECOVAL HEDVA
L
SYMVAL SOCVAL ATT BI
ECOVAL Economic value 0.822a
HEDVAL Hedonic value 0.084 0.787
SYMVAL Symbolic value 0.479 0.548 0.833
SOCVAL Social value 0.333 0.478 0.610 0.819
ATT Attitude toward CC 0.640 0.245 0.652 0.539 0.821
BI Behavioural intention
toward CC 0.380 0.400 0.577 0.300 0.563 0.919
Correlation analysis is performed to assess the association between constructs. The
multi items for a construct were computed to produce an average score which was used in
correlation analysis and multiple regression analysis. Table 3. shows that in regards to
association with consumers’ behavioral intention, attitude (r = 0.534, p < 0.01) turned out to
have the strongest correlation, followed by symbolic value (r = 0.512, p < 0.01). As for
correlations with attitude toward CC, strongest correlations appear for economic value (r =
0.585, p < 0.01), trailed by symbolic value (r = 0.580, p < 0.01) and behavioural intention (r =
0.534, p < 0.01). Next, the skewness of all the items ranges from -0.883 to -0.164, beneath
±5.0, where all constructs have negative skewness values, implying that the variables have a
left-skewed distribution. Besides that, the values for kurtosis range from -0.131 to 0.915 far
beyond the threshold value of ±10.
Table 3. Correlation Coefficient Matrix Constructs ECOVAL HEDVAL SYMVAL SOCVAL ATT BI
ECOVAL 1
HEDVAL 0.101 1
SYMVAL 0.408** 0.533** 1
SOCVAL 0.307** 0.443** 0.598** 1
ATT 0.585** 0.248** 0.580** 0.496** 1
BI 0.343** 0.392** 0.512** 0.294** 0.534** 1
** Correlation is significant at the 0.01 level (2-tailed).
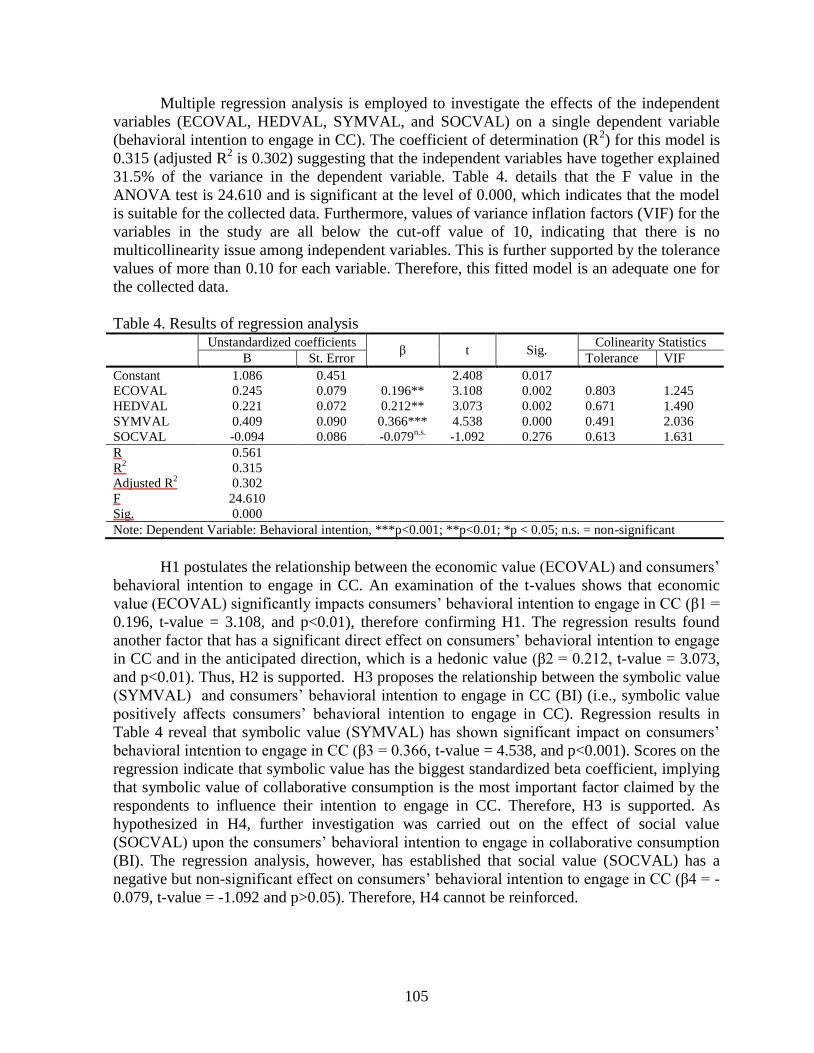
105
Multiple regression analysis is employed to investigate the effects of the independent
variables (ECOVAL, HEDVAL, SYMVAL, and SOCVAL) on a single dependent variable
(behavioral intention to engage in CC). The coefficient of determination (R2) for this model is
0.315 (adjusted R2 is 0.302) suggesting that the independent variables have together explained
31.5% of the variance in the dependent variable. Table 4. details that the F value in the
ANOVA test is 24.610 and is significant at the level of 0.000, which indicates that the model
is suitable for the collected data. Furthermore, values of variance inflation factors (VIF) for the
variables in the study are all below the cut-off value of 10, indicating that there is no
multicollinearity issue among independent variables. This is further supported by the tolerance
values of more than 0.10 for each variable. Therefore, this fitted model is an adequate one for
the collected data.
Table 4. Results of regression analysis Unstandardized coefficients
β t Sig. Colinearity Statistics
B St. Error Tolerance VIF
Constant 1.086 0.451 2.408 0.017
ECOVAL 0.245 0.079 0.196** 3.108 0.002 0.803 1.245
HEDVAL 0.221 0.072 0.212** 3.073 0.002 0.671 1.490
SYMVAL 0.409 0.090 0.366*** 4.538 0.000 0.491 2.036
SOCVAL -0.094 0.086 -0.079n.s.
-1.092 0.276 0.613 1.631
R 0.561
R2 0.315
Adjusted R2 0.302
F 24.610
Sig. 0.000
Note: Dependent Variable: Behavioral intention, ***p<0.001; **p<0.01; *p < 0.05; n.s. = non-significant
H1 postulates the relationship between the economic value (ECOVAL) and consumers’
behavioral intention to engage in CC. An examination of the t-values shows that economic
value (ECOVAL) significantly impacts consumers’ behavioral intention to engage in CC (β1 =
0.196, t-value = 3.108, and p<0.01), therefore confirming H1. The regression results found
another factor that has a significant direct effect on consumers’ behavioral intention to engage
in CC and in the anticipated direction, which is a hedonic value (β2 = 0.212, t-value = 3.073,
and p<0.01). Thus, H2 is supported. H3 proposes the relationship between the symbolic value
(SYMVAL) and consumers’ behavioral intention to engage in CC (BI) (i.e., symbolic value
positively affects consumers’ behavioral intention to engage in CC). Regression results in
Table 4 reveal that symbolic value (SYMVAL) has shown significant impact on consumers’
behavioral intention to engage in CC (β3 = 0.366, t-value = 4.538, and p<0.001). Scores on the
regression indicate that symbolic value has the biggest standardized beta coefficient, implying
that symbolic value of collaborative consumption is the most important factor claimed by the
respondents to influence their intention to engage in CC. Therefore, H3 is supported. As
hypothesized in H4, further investigation was carried out on the effect of social value
(SOCVAL) upon the consumers’ behavioral intention to engage in collaborative consumption
(BI). The regression analysis, however, has established that social value (SOCVAL) has a
negative but non-significant effect on consumers’ behavioral intention to engage in CC (β4 = -
0.079, t-value = -1.092 and p>0.05). Therefore, H4 cannot be reinforced.

106
The mediating effect of the consumers’ attitude toward collaborative consumption
(ATT) on the relationship between perceived value factors (economic value, hedonic value,
and symbolic value) and customer behavioral response was addressed by H5. Mediation
refers to the covariance relationships between independent and dependent variables. It is an
intervening variable through which the effect of an independent variable on the dependent
variable can be explained. The mediating role of consumer’s attitude toward collaborative
consumption (ATT) was tested via the hierarchical regression analysis following the four-step
method proposed by Baron and Kenney (1986). The first step is that the independent variable
must affect the dependent variable. Table 5. presents that the relationship between
independent variables (i.e., ECOVAL, HEDVAL, SYMVAL) and the dependent variable (i.e.,
BI) are significant (p < 0.01). Hence, the first condition for testing mediation is achieved.
Next, the second step is that the independent variables must affect the mediating variable (i.e.,
consumers’ attitude toward collaborative consumption - ATT). Economic value (ECOVAL)
and symbolic value (SYMVAL) showed significant impact on consumers’ attitude toward CC
as p < 0.01. However, it was found that the effect of hedonic value (HEDVAL) on consumers’
attitude toward collaborative consumption is negative and non-significant. Thus, the second
condition for mediating effect is satisfied only for two independent variables – economic value
(ECOVAL) and symbolic value (SYMVAL). The third step requires regression of the
dependent variable on both the independent variables and on the mediator. Results for Step 3
show the mediator satisfactory has affected the dependent variable. Thus, the third condition is
supported.
Table 5. Mediation analysis Constructs Step 1 Step 2 Step 3
Independent variables
Economic value (ECOVAL) 0.188** 0.416*** 0.014n.s.
Hedonic value (HEDVAL) 0.197** -0. 017n.s.
-
Symbolic value (SYMVAL) 0.330*** 0.420*** 0.304***
Mediating variable
Consumers’ attitude toward collaborative
consumption
0.349***
Adjusted R2 0.302 0.364 0.338
In the unmediated model, the path relating economic value (ECOVAL) and consumers’
behavioral intention to engage in CC was significant (β1 = 0.196, t-value = 3.108, and p<0.01
). When the mediating role of consumers’ attitude toward collaborative consumption (ATT)
was added to the model, the path linking economic value (ECOVAL) to consumers’
behavioral intention to engage in CC (β1’= 0.041) was statistically insignificant (p> 0.50).
Therefore, no mediation was reported for consumers’ attitude toward CC in the relationship
between economic value and consumers’ behavioral response. In the unmediated model, the
path linking symbolic value (SYMVAL) and consumers’ behavioral intention to engage in
collaborative consumption was significant (β3 = 0.366, t-value = 4.538, and p<0.001). When
the mediating role of consumers’ attitude toward collaborative consumption (ATT) was
included in the model, the path symbolic value – behavioral response (β3’ = 0.304) was
significant at p < 0.001. Interestingly, the beta coefficient value of the path symbolic value-
behavioral response dropped but remained significant. Thus, a partial mediation of consumers’
attitude toward collaborative consumption was reported in the relationship between symbolic

107
value (SYMVAL) and customer behavioral response (BI). Based on the previous discussion,
only hypothesis H5c was supported. Hypotheses H5a, H5b, H5d are rejected.
5. Discussion
This study’ results provide interesting insights into collaborative consumption from the
perspective of Generation Y. The research was set with the aim to analyze the impact of
Millennials’ perceived values on their behavioral intention to participate in CC. Literature
suggests that Millennials are probably one of the most representative generational cohorts
regarding their interest in activities related to sharing economy and collaborative consumption.
Even this research observe one generational cohort (Millennials), study’ results confirm the
involvement of the young respondents in collaborative consumption.
The rapid development of technologies and Internet age are good soil for the
development of collaborative consumption. Since Millennials are described as Internet
Generation and Connect 24/7 Generation, naturally, their engagement in collaborative
consumption is more than expected. A sample of this study includes full-time students from
SEBS (B&H) whom voluntarily participated in the research. CFA approved validity and
reliability of chosen measurement instruments for all constructs. The results obtained by
multiple regression analysis indicate that the attitude is the strongest predictor of behavioral
intent to engage in collaborative consumption. This result is in line with other research (e.g.,
Hu and Janda, 2012), but more than that, they also confirmed the application of TRA in
collaborative consumption context since TRA claims that attitude determines behavioral
intentions and final behavior of the customer. Besides the attitude-behavioral intention link,
relations between perceived values (i.e., economic, hedonic, symbolic, social) and behavioral
intentions toward collaborative consumption were observed. Here, the strongest relationship is
noted between perceived social value and behavioral intention toward collaborative
consumption. Furthermore, perceived economic, hedonic and symbolic values exhibit weak
relationships with behavioral intentions. Regarding the relationship between attitude and
perceived values, out of four observed perceived values, economic and symbolic values have
the most substantial influence on the attitude.
Perceived symbolic, hedonic and economic values are identified as predictors of
Millennials' behavioral intentions to engage in CC. Study' results identified symbolic values as
strongest predictor among respondents of this study, which is interesting since some of the
previous studies suggests that economic value is probably one of the strongest predictors of
consumers' behavior (e.g., Barnes & Mattson, 2016). However, Millennials respondents from
this study, placed economic values on third place, right after hedonic values. Background for
this can be related to Millennials' idea about ownership – they prefer to have access to the
goods/ services they need than to owe good/ services. However, as Godelnik (2017) claims,
this reasoning cannot be accepted without further research and deeper insight since up to now
academic literature does not have enough supporting findings. Surprisingly, it is interesting to
note how social values are not recognised as a driver for Millennials' behavioral intention
toward CC. Findings of this study imply that perceived symbolic and hedonic values are
strongest determinants of behavioral intention to engage in collaborative consumption among
Millennials. Perceived hedonic and symbolic values are according to findings of this study
prevalent over economic values. Perceived hedonic values are related to feelings of
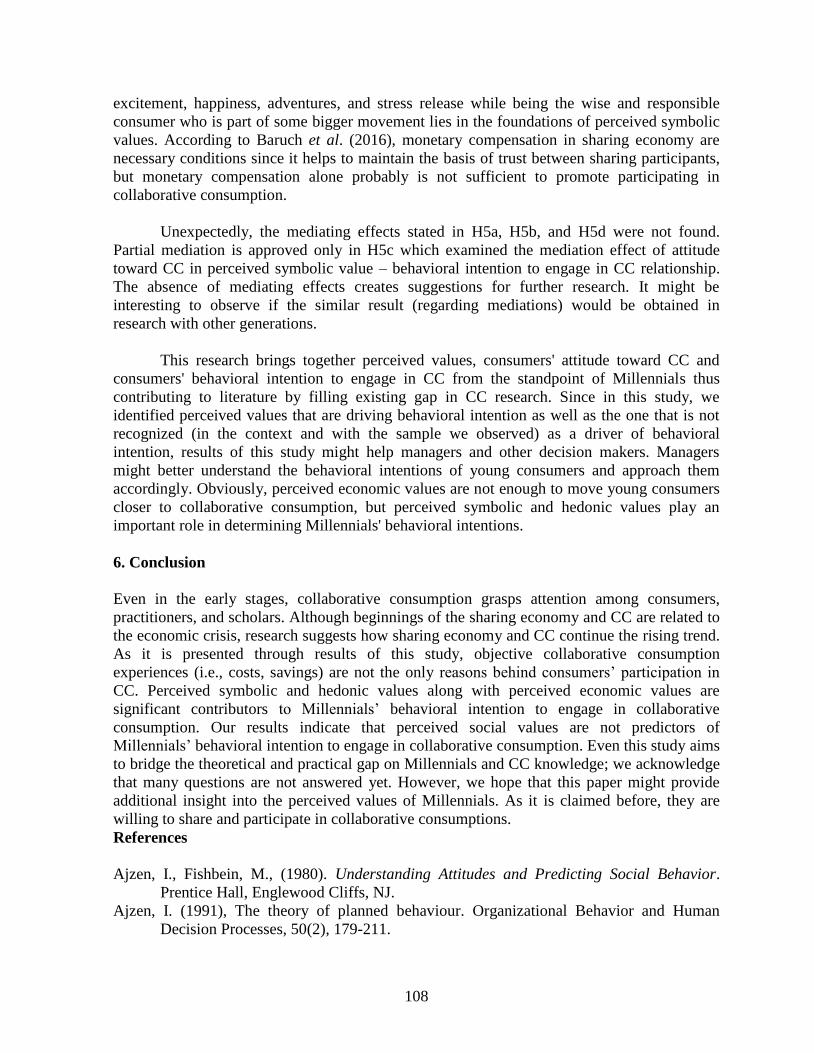
108
excitement, happiness, adventures, and stress release while being the wise and responsible
consumer who is part of some bigger movement lies in the foundations of perceived symbolic
values. According to Baruch et al. (2016), monetary compensation in sharing economy are
necessary conditions since it helps to maintain the basis of trust between sharing participants,
but monetary compensation alone probably is not sufficient to promote participating in
collaborative consumption.
Unexpectedly, the mediating effects stated in H5a, H5b, and H5d were not found.
Partial mediation is approved only in H5c which examined the mediation effect of attitude
toward CC in perceived symbolic value – behavioral intention to engage in CC relationship.
The absence of mediating effects creates suggestions for further research. It might be
interesting to observe if the similar result (regarding mediations) would be obtained in
research with other generations.
This research brings together perceived values, consumers' attitude toward CC and
consumers' behavioral intention to engage in CC from the standpoint of Millennials thus
contributing to literature by filling existing gap in CC research. Since in this study, we
identified perceived values that are driving behavioral intention as well as the one that is not
recognized (in the context and with the sample we observed) as a driver of behavioral
intention, results of this study might help managers and other decision makers. Managers
might better understand the behavioral intentions of young consumers and approach them
accordingly. Obviously, perceived economic values are not enough to move young consumers
closer to collaborative consumption, but perceived symbolic and hedonic values play an
important role in determining Millennials' behavioral intentions.
6. Conclusion
Even in the early stages, collaborative consumption grasps attention among consumers,
practitioners, and scholars. Although beginnings of the sharing economy and CC are related to
the economic crisis, research suggests how sharing economy and CC continue the rising trend.
As it is presented through results of this study, objective collaborative consumption
experiences (i.e., costs, savings) are not the only reasons behind consumers’ participation in
CC. Perceived symbolic and hedonic values along with perceived economic values are
significant contributors to Millennials’ behavioral intention to engage in collaborative
consumption. Our results indicate that perceived social values are not predictors of
Millennials’ behavioral intention to engage in collaborative consumption. Even this study aims
to bridge the theoretical and practical gap on Millennials and CC knowledge; we acknowledge
that many questions are not answered yet. However, we hope that this paper might provide
additional insight into the perceived values of Millennials. As it is claimed before, they are
willing to share and participate in collaborative consumptions.
References
Ajzen, I., Fishbein, M., (1980). Understanding Attitudes and Predicting Social Behavior.
Prentice Hall, Englewood Cliffs, NJ.
Ajzen, I. (1991), The theory of planned behaviour. Organizational Behavior and Human
Decision Processes, 50(2), 179-211.

109
Babin, B.J., Darden, W.R. and Griffin, M. (1994), “Work and/or fun: measuring hedonic and
utilitarian shopping value”, Journal of Consumer Research, Vol. 20 No. 4, pp. 644-
656.
Babin, B.J. and Attaway, J.S. (2000), “Atmospheric affect as a tool for creating value and
gaining share of customer”, Journal of Business Research, Vol. 49 No. 2, pp. 91-99.
Bagozzi, P. R., & Yi, Y. (2012). Specification, evaluation, and interpretation of structural
equation models. Academy of Marketing Science, 40, 8-34.
Bardhi, F., & Eckhardt, G. M. (2012). Access-based consumption: The case of car-sharing.
Journal of Consumer Research, 39(4), 881–898.
Barnes, S. J. & Mattsson, J. (2017). Understanding collaborative consumption: Test of a
theoretical model. Technological Forecasting & Social Change, 118 (2017) 281–292
Baron, R. M. & Kenny, D. A. (1986), Moderator-mediator variables distinction in social
psychological research: Conceptual, strategic, and statistical considerations. Journal of
Consumer Research, 51(6), 1173-1182.
Belk, R. (2014a), You are what you can access: Sharing and Collaborative consumption
online, Journal of Business Research 67 (2014), 1595-1600
Belk, R. (2014b), Sharing versus pseudo-sharing in Web 2.0. Anthropologist 18, 7-23
Benkler, Y. (2004). Sharing nicely: On shareable goods and the emergence of sharing as a
modality of economic production. Yale Law Journal, 114, 273–358
Benoit, S., Baker, S. L., Bolton, R. N., Gruber, T. & Kandampully, J., (2017). A triadic
framework for collaborative consumption: Motives, activities and resources &
capabilities of actors. Journal of Business research 79 (2017) 219-227
Bhattacherjee, A. (2001). Understanding information systems continuance: An expectation-
confirmation model. Management Information Systems Quarterly, 25(3), 351-370.
Blau, P. M. (1964). Exchange & Power in Social Life. Transaction. ISBN 9780887386282.
Botsman, R. (2015), “Thinking,” Retrieved from http:// rachelbotsman.com/thinking/ (last
accessed 05. 09. 2018.)
Botsman, R., & Rogers, R. (2010). Beyond Zipcar: Collaborative consumption. Harvard
Business Review, 88(10), p. 30.
Böcker, L. & Meelen, T. (2017), Sharing for people, planet or profit? Analysing motivations
for intended sharing economy participation, Environmental Innovation and Societal
Transitions 23 (2017), 28-39
Bucher, E., Fieseler, C., & Lutz, C. (2016). What's mine is yours (for a nominal fee) e
Exploring the spectrum of utilitarian to altruistic motives for Internet-mediated sharing.
Computers in Human Behavior, 62 (2016) 316-326
Cook, K. S. & Rice, E., (2006). Social Exchange Theory, In DeLamater, John. The Handbook
of Social Psychology. pp. 53–76. ISBN 978-0-387-36921-1
Deal, J. J., Altman, D.G., & Rogelberg, S.G. (2010). Millennials at work: What we know and
what we need to do (if anything). Journal of Business and Psychology, 25(2), 191–199
Fine, S. (1980). Toward a theory of segmentation by objectives in social marketing. Journal of
Consumer Research, 7, 1–13.
Emerson, R M (1976)., Social Exchange Theory, Annual Review of Sociology. 2: 335–362
Fornell, C. & Larcker, D. F. (1981), Structural equation models with unobservable variables
and measurement error: algebra and statistics, Journal of Marketing Research, 18(3),
382–388.
110
Godelnik, R., (2017). Millennials and the sharing economy: Lessons from a ‘buy nothing new,
share everything month’ project. Environmental Innovation and Societal Transitions
23 (2017) 40–52
Greendex (2014) “Consumer choice and the environment”, available at:
http://environment.nationalgeographic.com/ environment/greendex/ (last access 02. 09.
2018.)
Hair, J., Black, W. C., Babin, B. J., Anderson, R. E. (2010). Multivariate data analysis (7th
ed.). Upper Saddle River, New Jersey: Pearson Education International.
Hamari, J., Sjöklint, M., & Ukkonen, A. (2015). The sharing economy: Why people
participate in collaborative consumption. Journal of the Association for Information
Science and Technology, 67(9), 2047-2059.
Head, L. (2013). Will millennials drive the shift from a consumption-based to a values-based
economy?, available at
www.sustainablebrands.com/news_and_views/behavior_change/will-millennials-drive-
shift-consumption-basedvalues-based-economy (last access 03. 09. 2018.)
Homans, George C. (1958), Social Behavior as Exchange, American Journal of Sociology. 63
(6)
Hwang, J. & Griffiths, M. A. (2017). Share more, drive less: Millennials value perception and
behavioral intent in using collaborative consumption services. Journal of Consumer
Marketing, 34(2),132-146.
Jenkins, R., Molesworth, M., Scullion, R. (2014). The messy social live of objects: inter-
personal borrowing and the ambiguity of possession and ownership. Journal of
Consumer Behaviour 13(2): 131–139.
Kaplan, A.M., & Haenlein, M. (2010). Users of the world, unite! The challenges and
opportunities of Social Media. Business Horizons, 53(1), 59–68.
Kim, Y. H., Kim, D. J. & Wachther, K. (2013), A study of mobile user engagement (MoEN):
Engagement motivations, perceived value, satisfaction, and continued engagement
intention, Decision Support Systems, Vol. 56 No. 1, pp. 361-370
Lessig, L. (2008). Remix: Making art and commerce thrive in the hybrid economy. New York:
Penguin Press.
Möhlmann, M. (2015), Collaborative Consumption: determinants of satisfaction and the
likelihood of using a sharing economy option again, Journal of Consumer Behaviour,
14: 193-207
Nesta, (2014). Making Sense of the UK Sharing Economy. Nesta. London
Owyang. J., Samuel, A., Grenville, A. (2014). Sharing is the new buying, Winning in the
Collaborative Economy. Available online: www.web-strategist.com (Last accessed 04.
09. 2018.)
Pilcher, J. (1993). Mannheim’s sociology of generations: an undervalued legacy. BJS. Vol. 45.
Issue 3
Podsakoff, P.M., MacKenzie, S.B., & Podsakoff, N.P. (2012). Sources of Method Bias in
Social Science Research and Recommendations on How to Control It. Annual Review
of Psychology, 63, 539-569.
Schor, J., & Fitzmaurice, C. (2015). Collaborating and connecting: The emergence of the
sharing economy. In J. B. Schor & C. Thompson (Eds.), Handbook of research on
sustainable consumption (pp. 410–425). Cheltenham, UK: Edward Elgar.
Schroer, W. J. (2008). Generations X, Y, Z and the others. The Portal, 40,9. Retrieved from
http://iam.files.cms-plus.com/newimages/portalpdfs/2008_03_04.pdf

111
Tussyadiah, I. P. (2015), An Exploratory Study on Drivers and Deterrents of Collaborative
Consumption in Travel, Information and Communication Technologies in Tourism
2015, 817-830
Walsh, B. (2011). Today’s smart choice: Don’t own. Share. Time. Retrieved from
http://content.time.com/time/specials/packages/article/0,28804,2059521_2059717_205
9710,00.html
Wang, C., & Zhang, P. (2012). The evolution of social commerce: The people, management,
technology, and information dimensions. Communications of the Association for
Information Systems, 31(1), 105–127
Wu, J., Zeng, M. N., & Xie, K. (2017). Chinese travelers’ behavioral intentions toward room
sharing platforms: The influence of motivations, perceived trust, and past experience.
International Journal of Contemporary Hospitality Management, 29(10), 2688-2707.
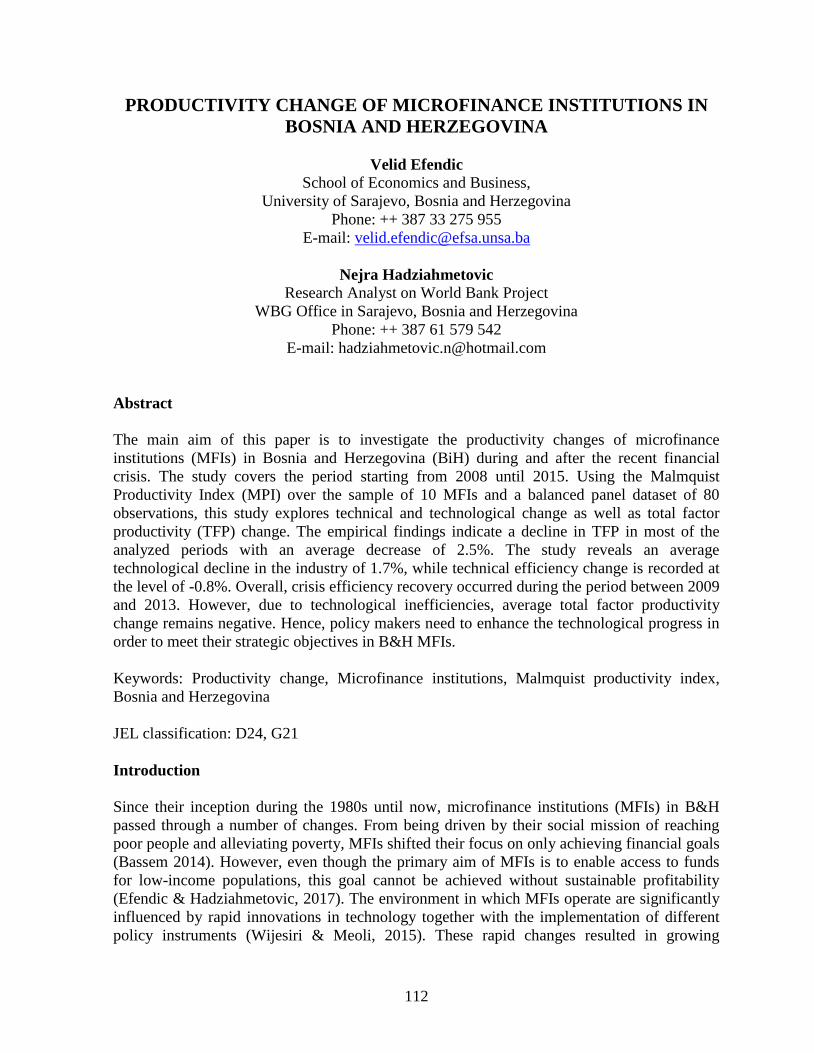
112
PRODUCTIVITY CHANGE OF MICROFINANCE INSTITUTIONS IN
BOSNIA AND HERZEGOVINA
Velid Efendic
School of Economics and Business,
University of Sarajevo, Bosnia and Herzegovina
Phone: ++ 387 33 275 955
E-mail: [email protected]
Nejra Hadziahmetovic
Research Analyst on World Bank Project
WBG Office in Sarajevo, Bosnia and Herzegovina
Phone: ++ 387 61 579 542
E-mail: [email protected]
Abstract
The main aim of this paper is to investigate the productivity changes of microfinance
institutions (MFIs) in Bosnia and Herzegovina (BiH) during and after the recent financial
crisis. The study covers the period starting from 2008 until 2015. Using the Malmquist
Productivity Index (MPI) over the sample of 10 MFIs and a balanced panel dataset of 80
observations, this study explores technical and technological change as well as total factor
productivity (TFP) change. The empirical findings indicate a decline in TFP in most of the
analyzed periods with an average decrease of 2.5%. The study reveals an average
technological decline in the industry of 1.7%, while technical efficiency change is recorded at
the level of -0.8%. Overall, crisis efficiency recovery occurred during the period between 2009
and 2013. However, due to technological inefficiencies, average total factor productivity
change remains negative. Hence, policy makers need to enhance the technological progress in
order to meet their strategic objectives in B&H MFIs.
Keywords: Productivity change, Microfinance institutions, Malmquist productivity index,
Bosnia and Herzegovina
JEL classification: D24, G21
Introduction
Since their inception during the 1980s until now, microfinance institutions (MFIs) in B&H
passed through a number of changes. From being driven by their social mission of reaching
poor people and alleviating poverty, MFIs shifted their focus on only achieving financial goals
(Bassem 2014). However, even though the primary aim of MFIs is to enable access to funds
for low-income populations, this goal cannot be achieved without sustainable profitability
(Efendic & Hadziahmetovic, 2017). The environment in which MFIs operate are significantly
influenced by rapid innovations in technology together with the implementation of different
policy instruments (Wijesiri & Meoli, 2015). These rapid changes resulted in growing
113
competition among MFIs which further on resulted in pushing the production possibility
frontier outward and an increase in both outreach and the sustainability of MFIs (Manos &
Yaron, 2009). Therefore, it is essential for MFIs to operate in an efficient way and in this
framework efficiency and productivity analysis has become quite appealing in its effort to
improve outreach, competitiveness and financial sustainability (Bassem 2014).
While there has been a significant amount of research conducted in the analysis of MFIs
efficiency, among others: Flückiger & Vassiliev (2007) who investigated two dimensional
efficiency of MFIs in Peru; Gutiérrez-Nietoet al. (2007), Bassem (2008) and Hassan
&Sanchez (2009) who analyzed efficiency levels of MFIs located in Latin America, the
Mediterranean and developing countries respectively. Further on similar research was
conducted by Gutiérrez-Nieto et al. (2009) where social and financial efficiency of Asian
MFIs was analyzed, Sedzro & Keita (2009) whose study focuses on the efficiency of MFIs
located in seven countries from the West African Economic and Monetary Union, Haq et al.
(2010) who examined cost efficiencies of MFIs across Africa, Asia and Latin America.
Kipesha (2012) conducted a study which focused on South African MFIs and their efficiency
while Tahir (2013) assessed the efficiency of MFIs in ASEAN countries; Widiarto &
Emrouznejad (2015) went a step ahead and compared two-dimensional efficiency between
Islamic and conventional MFIs; Wijesiri & Meoli (2015) analyzed MFIs efficiency in Sri
Lanka and Efendic & Hadziahmetovic (2017) who investigated the financial and social
efficiency of MFIs in B&H. However, just a few studies have been performed to study the
productivity change of MFIs. One of the possible reasons for this is the greater difficulty in
finding time series data for MFIs (Wijesiri & Meoli, 2015).
This aim of this study is to explore the productivity change of MFIs in the post-crisis period,
or from 2008 and 2009 (the crisis years) until 2015, as a last year of available data for our
sample. Although MFIs showed have efficiency growth in the after crisis period in both the
social and financial dimension (Efendic & Hadziahmetovic, 2017), this study shed light on
productivity changes in the specific period of their development. The aim of this study is also
to quantify the Malmquist productivity index (MPI) and its components for MFIs that are
operating in B&H over the 7-year period from 2008 to 2015. The microfinance sector in B&H
started to develop as a support to the country recovery from the consequences of war
(Bateman et al., 2012) and hence B&H serves as a good case for this kind of research (Efendic
& Hadziahmetovic, 2017). In addition to this, the study will help policymakers, as well as
industry practitioners and donors to understand the performance and productivity change of
MFIs and direct them to construct proper policies, managerial decisions and strategies to
enhance the development of MFIs in this region. Accordingly, the study will contribute to the
limited literature in the field of microfinance.
The paper is organized as follows. Section 2 of the paper provides a literature review on MFIs
productivity changes and Malmquist index as a used methodology in the estimation of
productivity changes. Section 3 covers the Malmquist index as a method of the estimation of
productivity change and its application in the MFI sector as well as a data collection and
statistics as a most significant limitation in efficiency analysis in the MFI sector (Widiarto &
Emrouznejad, 2015). Section 4 provides the results and the discussion of the results with
recommendations. The paper ends with conclusion remarks.
114
Literature on MFIs productivity changes
In the past two decades, there has been a significant increase in interest for microfinance.
Links between the microfinance sector and both national and international economies are
becoming stronger (Littlefield & Kneiding, 2009; Di Bella, 2011) and microfinance is
becoming more similar to traditional finance (Wagner & Winker, 2012). Lately, the main
areas of research interest are efficiency and productivity evaluations of MFIs. Productivity is
considered as one of the main engines of a firm’s growth and its importance for MFIs is
stressed out in numerous studies (Gebremichael & Rani, 2012; Bassem, 2014; Azad et al.,
2015; Mia & Chandran, 2015; Wijesiri & Meoli, 2015; Tahir & Tahrim, 2015; Mia & Bassem,
2016).
Efficiency or productivity can be measured using parametric or non-parametric techniques
depending on the context of the researcher’s study (Mia & Bassem, 2016) and it is considered
as one of the main challenges of micro-economic analysis (Efendic, 2014). The assessment of
productivity and its determinants is important given it can significantly improve the utilization
of a firm’s scarce resources (Isik & Hassan, 2003). However, empirical studies on productivity
and movements of MFIs are still in their infancy (Wijesiri & Meoli, 2015). One of the first
attempts to measure efficiency and productivity of global MFIs considering the effect of
subsidies was research done by Nawaz (2010). The author conducted a three-stage analysis
consisted of a calculation of technical and pure efficiency scores, a calculation of Malmquist
indices to analyze productivity change and an analysis of Tobit regression. Tahir & Tahrim
(2015) conducted a similar study and investigated the efficiency and the productivity of
Cambodian microfinance institutions for the period 2008-2011. Results show that both an
increase and decline in productivity were attributed to technological change. In addition, the
results show that the dominant source of efficiency was scale related meaning that MFIs are
operating at an adequate scale of operations but on the other hand they are inefficient when it
comes to asset and operating cost management. Bassem (2014) examines productivity changes
based on a sample of 33 MFIs operating in the Middle East and North African region during
the period 2006-2011. The methodology used is Malmquist productivity index. Research
shows that overall productivity declines over the analyzed time period. The author stresses that
weakness of the DEA based Malmquist approach should be considered given that this
methodology (due to sampling variation) does not consider the uncertainty that surrounds the
MPI estimates and MPI components. Wijesiri & Meoli (2015) analyzed a sample of 20
Kenyan MFIs. The analysis is done over the period 2009-2012 and they applied DEA based
the Malmquist bootstrap method proposed by Simar & Wilson (1999). In addition, they
decompose MPI into changes in technical and technological efficiency to determine the
sources of movements in productivity. Further on, the authors decompose technical efficiency
on pure and scale efficiency. Empirical results revel that productivity of the majority of MFIs
increases over time mainly due to different policy reforms and the application of innovative
products that caused positive shift in the production frontier. A major contribution of this
study is the use of the bootstrap MPI methodology in order to obtain confidence intervals that
will show whether the results indicate real change or are an artifact or sampling noise.
More recently, Mia & Bassem (2016) investigated the productivity of 50 South Asian MFIs
for the period 2007-2011. The authors employed the Malmquist productivity index. The
results of the study showed that on average productivity grew annually by 2.1% mainly as a

115
result of the technical efficiency changes which describe the degree to which DMU improves
or deteriorates in terms of the efficiency levels. On the other hand, technological change
defined as a process by which an optimal combination of inputs and outputs is achieved
through better technological and capital equipment used (Chandran & Pandiyan, 2008) remain
stagnant. This implies that even though microfinance is an innovative approach to financing in
itself, flexibility is not the characteristic of the MFI sector. MFIs lack the adoption of
innovative financial products and experience in cost cutting delivery methods that can improve
their level of productivity (Mia & Bassem, 2016).
Methodology and data
3.1. The Malmquist index
Efficiency is usually assessed using parametric or non-parametric methods. Data envelopment
analysis (DEA) is a non-parametric method that shows an exponential growth in its
application in academic research over the last 40 years (Emrouznejad &Yang, 2017). DEA is
an approach used for the measurement of the relative efficiency of as set of decision making
units (DMUs) using mathematical programming (Wang & Lan, 2011). DEA, in comparison to
parametric methods, is based on a complex multi-input/output structure (Cooper et al., 2006).
Since the first DEA model was developed – CCR model of Charnes et al. (1978) number of
different DEA models have been developed (Wang & Lan, 2011) and consequently a large
number of DEA applications were reported. Around 10,300 DEA-related research articles
have been published in different journals (Emrouznejad & Yang, 2017).
Productivity measurement represents one of the important research topics of DEA (Wang &
Lan, 2011). One of the commonly used approaches for productivity measurement is the DEA
based Malmquist productivity index (MPI). Beside this one there are Fisher index and
Tornqvist index (Bassem, 2014). However, in comparison to these two MPI has three main
advantages (Grifell-Tatje & Lovell, 1996): there is no requirement for profit maximization nor
for cost minimization assumptions, it does not require information that is related to the prices
of inputs and outputs and what is useful for researchers’ productivity changes could be further
on decomposed into technical efficiency change and technical change. MPI was introduced by
Caves et al., (1982) using input and output distance functions. It is further extended by Fare et
al., (1992). To define the Malmquist index Fare et al., (1994) defined distance functions with
respect to two different time periods; t (based period) and t+1:
(1)
(2)
In (1) the distance function measures the maximal proportional change in output required to
make which is feasible in relation to the technology at time . Similarly, in (2) the
distance function measures the maximal proportional change in output required to make
which is feasible in relation to technology at time t+1.
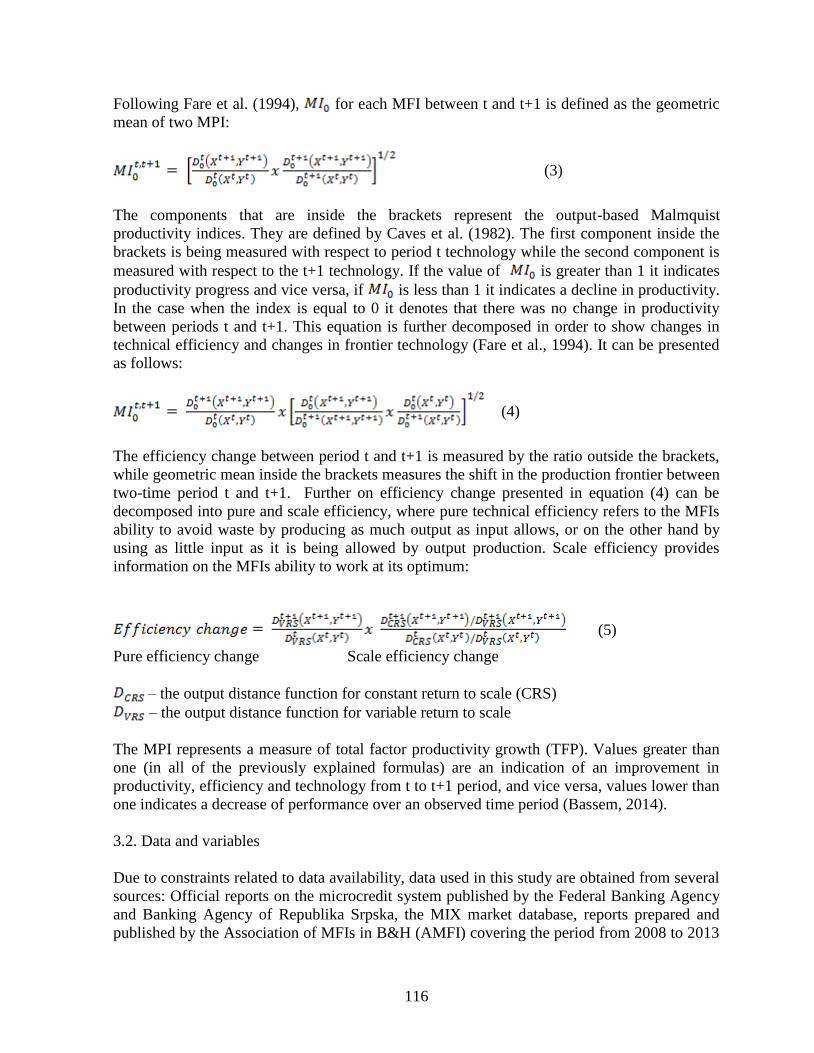
116
Following Fare et al. (1994), for each MFI between t and t+1 is defined as the geometric
mean of two MPI:
(3)
The components that are inside the brackets represent the output-based Malmquist
productivity indices. They are defined by Caves et al. (1982). The first component inside the
brackets is being measured with respect to period t technology while the second component is
measured with respect to the t+1 technology. If the value of is greater than 1 it indicates
productivity progress and vice versa, if is less than 1 it indicates a decline in productivity.
In the case when the index is equal to 0 it denotes that there was no change in productivity
between periods t and t+1. This equation is further decomposed in order to show changes in
technical efficiency and changes in frontier technology (Fare et al., 1994). It can be presented
as follows:
(4)
The efficiency change between period t and t+1 is measured by the ratio outside the brackets,
while geometric mean inside the brackets measures the shift in the production frontier between
two-time period t and t+1. Further on efficiency change presented in equation (4) can be
decomposed into pure and scale efficiency, where pure technical efficiency refers to the MFIs
ability to avoid waste by producing as much output as input allows, or on the other hand by
using as little input as it is being allowed by output production. Scale efficiency provides
information on the MFIs ability to work at its optimum:
(5)
Pure efficiency change Scale efficiency change
– the output distance function for constant return to scale (CRS)
– the output distance function for variable return to scale
The MPI represents a measure of total factor productivity growth (TFP). Values greater than
one (in all of the previously explained formulas) are an indication of an improvement in
productivity, efficiency and technology from t to t+1 period, and vice versa, values lower than
one indicates a decrease of performance over an observed time period (Bassem, 2014).
3.2. Data and variables
Due to constraints related to data availability, data used in this study are obtained from several
sources: Official reports on the microcredit system published by the Federal Banking Agency
and Banking Agency of Republika Srpska, the MIX market database, reports prepared and
published by the Association of MFIs in B&H (AMFI) covering the period from 2008 to 2013
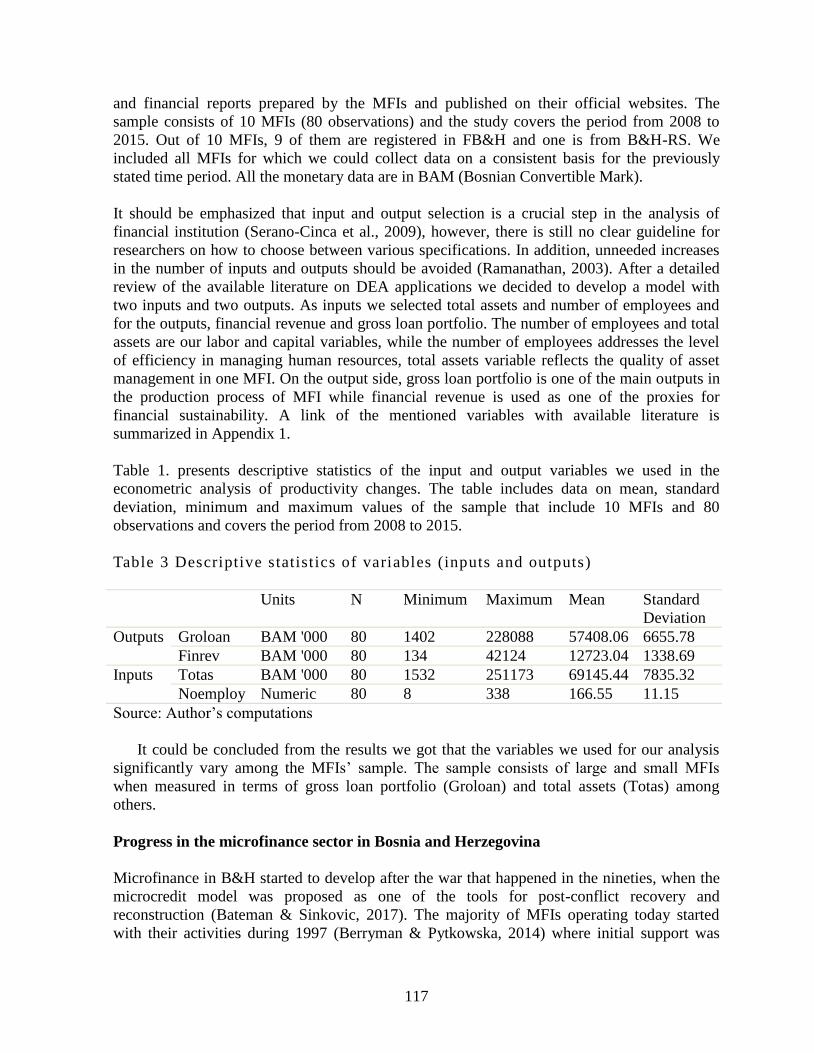
117
and financial reports prepared by the MFIs and published on their official websites. The
sample consists of 10 MFIs (80 observations) and the study covers the period from 2008 to
2015. Out of 10 MFIs, 9 of them are registered in FB&H and one is from B&H-RS. We
included all MFIs for which we could collect data on a consistent basis for the previously
stated time period. All the monetary data are in BAM (Bosnian Convertible Mark).
It should be emphasized that input and output selection is a crucial step in the analysis of
financial institution (Serano-Cinca et al., 2009), however, there is still no clear guideline for
researchers on how to choose between various specifications. In addition, unneeded increases
in the number of inputs and outputs should be avoided (Ramanathan, 2003). After a detailed
review of the available literature on DEA applications we decided to develop a model with
two inputs and two outputs. As inputs we selected total assets and number of employees and
for the outputs, financial revenue and gross loan portfolio. The number of employees and total
assets are our labor and capital variables, while the number of employees addresses the level
of efficiency in managing human resources, total assets variable reflects the quality of asset
management in one MFI. On the output side, gross loan portfolio is one of the main outputs in
the production process of MFI while financial revenue is used as one of the proxies for
financial sustainability. A link of the mentioned variables with available literature is
summarized in Appendix 1.
Table 1. presents descriptive statistics of the input and output variables we used in the
econometric analysis of productivity changes. The table includes data on mean, standard
deviation, minimum and maximum values of the sample that include 10 MFIs and 80
observations and covers the period from 2008 to 2015.
Table 3 Descriptive statist ics of variables (inputs and outputs)
Units N Minimum Maximum Mean Standard
Deviation
Outputs Groloan BAM '000 80 1402 228088 57408.06 6655.78
Finrev BAM '000 80 134 42124 12723.04 1338.69
Inputs Totas BAM '000 80 1532 251173 69145.44 7835.32
Noemploy Numeric 80 8 338 166.55 11.15
Source: Author’s computations
It could be concluded from the results we got that the variables we used for our analysis
significantly vary among the MFIs’ sample. The sample consists of large and small MFIs
when measured in terms of gross loan portfolio (Groloan) and total assets (Totas) among
others.
Progress in the microfinance sector in Bosnia and Herzegovina
Microfinance in B&H started to develop after the war that happened in the nineties, when the
microcredit model was proposed as one of the tools for post-conflict recovery and
reconstruction (Bateman & Sinkovic, 2017). The majority of MFIs operating today started
with their activities during 1997 (Berryman & Pytkowska, 2014) where initial support was

118
mainly provided by the World Bank through its Local Initiatives Project (LIP) (WB, 2005). In
the period from the late 1990s when there was almost no microcredit activity, was by 2009 the
second country in terms of microcredit penetration (Bateman, 2012).
MFIs’ supervision in B&H is at the entity level, and based on the latest reports (as of March
2018) published by the Federal Banking Agency and Banking Agency of B&H-RS there are
12 MFIs with a license for business operation (11 are non-profit organization and 1 of which is
a for-profit organization) in FB&H and 13 MFIs in B&H-RS. Of those 13 MFIs, 9 are for-
profit institutions and 4 non-profit organizations (FBA, 2018; ABRS, 2018).
Overall, when compared to other financial institutions only small numbers of studies are
focused on MFIs and their efficiency (Widiarto & Emrouznejad, 2015), and when speaking
about B&H, there is a serious research gap (Efendic & Hadziahmetovic 2017). To the best of
our knowledge there is only one study that covers “two-dimensional” efficiency of MFIs in
B&H. Efendic & Hadziahmetovic (2017) investigated MFIs social and financial efficiency
through application of Data Envelopment Analysis. The study covered the period starting in
2008 and ending in 2015 and utilized data for 15 MFIs. Results of the empirical analysis
showed that there is a suboptimal level of both financial and social efficiency, where financial
efficiency levels slightly outperformed those of social efficiency. The study also analyzed the
influence of the Global Financial Crisis, and the results showed that MFIs recorded a declining
trend in efficiency up to 2010. It could be concluded from the facts mentioned above that there
is much space for improvement in MFIs utilization of inputs and that due to lack of available
literature it would certainly be useful to conduct additional research on this matter.
Results and discussion of the results
Following the approach proposed by Fare et al. (1994) we have calculated output-oriented
Malmquist index, where values of the index which are larger than one indicates positive TFP
growth and vice versa, MPI lower than one shows a decline of the TFP over the analyzed
period. In order to be able to provide the information on the sources of productivity change we
decompose it into technological change (TECH) and technical efficiency change (EFCH),
where TFPCH=technological x technical efficiency change. In the case when we have
improvement in the technological change it is considered as an improvement in the best-
practice frontier, while the technical efficiency change shows the movement of the industry
towards the frontier. Further on, there is a possibility to conduct the decomposition of
technical efficiency change into scale change (SECH) and pure efficiency change (PECH).
The results are presented in Table 2.
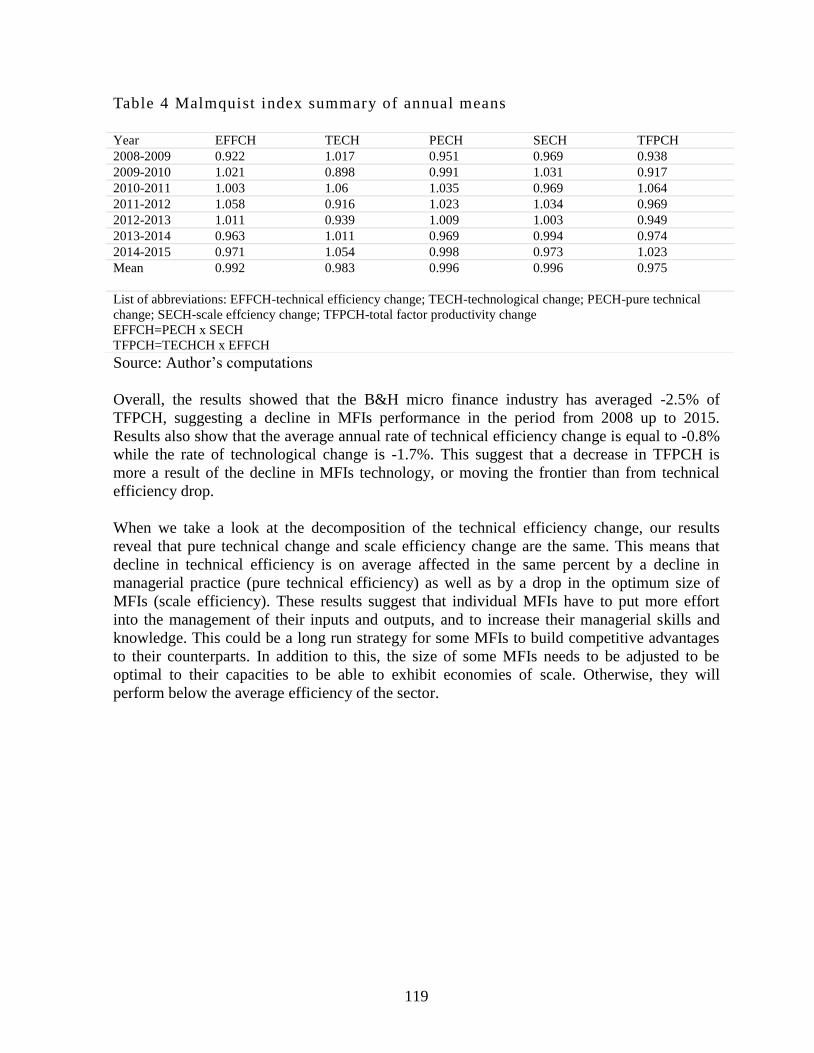
119
Table 4 Malmquist index summary of annual means
Source: Author’s computations
Overall, the results showed that the B&H micro finance industry has averaged -2.5% of
TFPCH, suggesting a decline in MFIs performance in the period from 2008 up to 2015.
Results also show that the average annual rate of technical efficiency change is equal to -0.8%
while the rate of technological change is -1.7%. This suggest that a decrease in TFPCH is
more a result of the decline in MFIs technology, or moving the frontier than from technical
efficiency drop.
When we take a look at the decomposition of the technical efficiency change, our results
reveal that pure technical change and scale efficiency change are the same. This means that
decline in technical efficiency is on average affected in the same percent by a decline in
managerial practice (pure technical efficiency) as well as by a drop in the optimum size of
MFIs (scale efficiency). These results suggest that individual MFIs have to put more effort
into the management of their inputs and outputs, and to increase their managerial skills and
knowledge. This could be a long run strategy for some MFIs to build competitive advantages
to their counterparts. In addition to this, the size of some MFIs needs to be adjusted to be
optimal to their capacities to be able to exhibit economies of scale. Otherwise, they will
perform below the average efficiency of the sector.
Year EFFCH TECH PECH SECH TFPCH
2008-2009 0.922 1.017 0.951 0.969 0.938
2009-2010 1.021 0.898 0.991 1.031 0.917
2010-2011 1.003 1.06 1.035 0.969 1.064
2011-2012 1.058 0.916 1.023 1.034 0.969
2012-2013 1.011 0.939 1.009 1.003 0.949
2013-2014 0.963 1.011 0.969 0.994 0.974
2014-2015 0.971 1.054 0.998 0.973 1.023
Mean 0.992
0.983
0.996
0.996
0.975
List of abbreviations: EFFCH-technical efficiency change; TECH-technological change; PECH-pure technical
change; SECH-scale effciency change; TFPCH-total factor productivity change
EFFCH=PECH x SECH
TFPCH=TECHCH x EFFCH
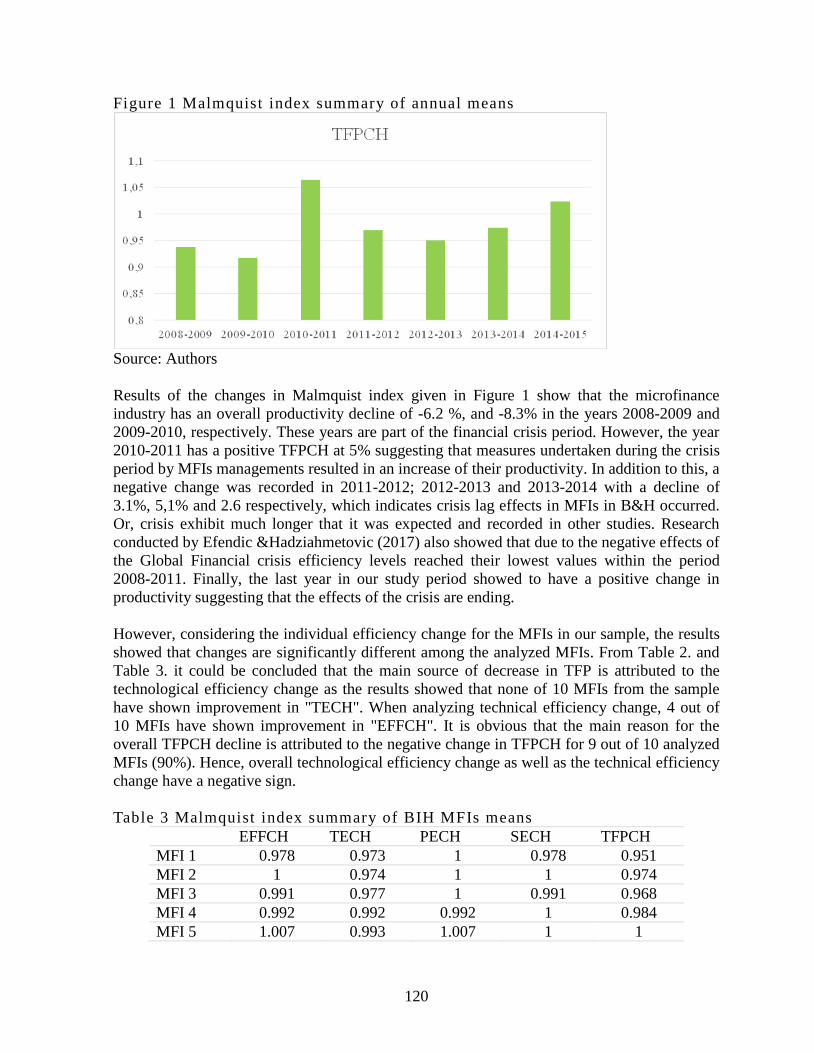
120
Figure 1 Malmquist index summary of annual means
Source: Authors
Results of the changes in Malmquist index given in Figure 1 show that the microfinance
industry has an overall productivity decline of -6.2 %, and -8.3% in the years 2008-2009 and
2009-2010, respectively. These years are part of the financial crisis period. However, the year
2010-2011 has a positive TFPCH at 5% suggesting that measures undertaken during the crisis
period by MFIs managements resulted in an increase of their productivity. In addition to this, a
negative change was recorded in 2011-2012; 2012-2013 and 2013-2014 with a decline of
3.1%, 5,1% and 2.6 respectively, which indicates crisis lag effects in MFIs in B&H occurred.
Or, crisis exhibit much longer that it was expected and recorded in other studies. Research
conducted by Efendic &Hadziahmetovic (2017) also showed that due to the negative effects of
the Global Financial crisis efficiency levels reached their lowest values within the period
2008-2011. Finally, the last year in our study period showed to have a positive change in
productivity suggesting that the effects of the crisis are ending.
However, considering the individual efficiency change for the MFIs in our sample, the results
showed that changes are significantly different among the analyzed MFIs. From Table 2. and
Table 3. it could be concluded that the main source of decrease in TFP is attributed to the
technological efficiency change as the results showed that none of 10 MFIs from the sample
have shown improvement in "TECH". When analyzing technical efficiency change, 4 out of
10 MFIs have shown improvement in "EFFCH". It is obvious that the main reason for the
overall TFPCH decline is attributed to the negative change in TFPCH for 9 out of 10 analyzed
MFIs (90%). Hence, overall technological efficiency change as well as the technical efficiency
change have a negative sign.
Table 3 Malmquist index summary of BIH MFIs means
EFFCH TECH PECH SECH TFPCH
MFI 1 0.978 0.973 1 0.978 0.951
MFI 2 1 0.974 1 1 0.974
MFI 3 0.991 0.977 1 0.991 0.968
MFI 4 0.992 0.992 0.992 1 0.984
MFI 5 1.007 0.993 1.007 1 1
121
MFI 6 1.003 0.983 1.003 1 0.986
MFI 7 1.007 0.991 1 1.007 0.997
MFI 8 1.002 0.983 1 1.002 0.984
MFI 9 0.965 0.985 0.974 0.99 0.95
MFI 10 0.977 0.981 0.985 0.991 0.958
Mean 0.992 0.983 0.996 0.996 0.975
Source: Author’s computations
As previously mentioned, the decomposition of the Malmquist index allows us to determine
the sources of the productivity growth. During the analyzed period our results show that both
pure technical efficiency and scale efficiency decreased by 0.5%.
5. Conclusion
Study examined the productivity change in B&H MFIs during the period from 2008 to 2015
by employing the Malmquist productivity index. The sample included 10 MFIs and a balanced
panel dataset of 80 observations. After a detailed analysis of the available literature we
decided on a combination of input and output variables. For our analysis we specified a
combination of two inputs and two outputs: total assets and number of employees as inputs
and gross loan portfolio and financial revenue as outputs.
The results of our empirical analysis indicate the following: The empirical findings indicate a
decline in TFP in most of the analyzed periods with an average decrease of 2.5%. The study
reveals an average technological decline of the industry for 1.7%, while technical efficiency
change is recorded at the level of -0.8%. Even though results showed recovery during the
period 2009-2013, due to technological inefficiencies the average TFP change remains
negative. Our results reveal that none of the 10 MFIs from the sample have shown an
improvement in TECH over the analyzed time period. Hence, policy makers need to enhance
technological progress in order to meet their strategic objectives in B&H MFIs. Further, the
decomposition of MPI allowed us to investigate sources of productivity change. Accordingly,
the results of our analysis showed that during the observed period, B&H MFIs experienced a
decrease of 0.5% in both pure technical and scale efficiency, so it can be concluded that both
bad management practices and work which is not on the optimal scale are sources of the
average productivity decline. Results of this analysis strongly support previous analysis
conducted by Efendic & Hadziahmetovic (2017) suggesting that MFIs in B&H have efficiency
levels which are quite below optimal level and that MFIs are undoubtedly wasting their
resources.
The study also indicated that MFIs in B&H are using too much labor (employees) and
capital (assets) for the level of their outputs. When speaking about crisis and post-crisis
period results, changes in the Malmquist index have shown that the microfinance industry has
an overall productivity decline in the study period of -6.2 % and -8.3% in the year 2008-2009
and 2009-2010 respectively. The years mentioned are part of the financial crisis period.
However, in the years 2010-2011 results have shown a positive TFPCH at the level of 5%
suggesting that measures undertaken by MFIs management during the crisis resulted in an
increase of their productivity. In addition to this, a negative change was recorded in 2011-
122
2012; 2012-2013 and 2013-2014 with a decline of 3.1%, 5,1% and 2.6 respectively, which
indicates that a crisis lag effect in MFIs in B&H occurred, and that the crisis lasted much
longer than was expected. Also, a potential cause of this subsequent decline in productivity
could be that MFIs did not apply adequate measures that would lead to sustainable recovery
and increase in productivity level but rather focused on short-term results.
References
Azad. M. A., Masum, A. K., Munisamy, S., & Sharmin, D. F. 2015. Efficiency analysis of
major microfinance institutions in Bangladesh: A Malmquist index approach. Quality &
Quantity, 50(4), 1525-1537. doi:10.1007/s11135-015-0219-8
Bassem. B. S. 2014. Total factor productivity change of MENA microfinance institutions: A
Malmquist productivity index approach. Economic Modelling. 39. 182-189. doi:
10.1016/j.econmod.2014.02.035
Bateman. M.,& Chang. H. 2012. Microfinance and the Illusion of Development: From Hubris to
Nemesis in Thirty Years. World Economic Review. 1. 13
Bateman. M.,& Sinkovic. D. 2017. Bosnia's post conflict microfinance experiment: A new
Balkan tragedy. Seduced and Betrayed: Exposing the Contemporary Microfinance
Phenomenon. 127-146.
Bella. G. D. 2011. The Impact of the Global Financial Crisison Microfinance and Policy
Implications. IMF Working Papers. 11(175). 1. doi:10.5089/9781462313303.001
Caves. D. W., Christensen. L. R., & Diewert. W. E. 1982. The Economic Theory of Index
Numbers and the Measurement of Input, Output, and Productivity. Econometrica, 50(6),
1393. doi:10.2307/1913388
Chandran. V. G.,& Pandiyan. V. 2008. Technical efficiency and technological change in
Malaysian service industries. Applied Economics Letters, 15(8), 655-657.
doi:10.1080/13504850600721932
Cooper. W. W. 2006. Introduction to data envelopment analysis and its uses: with DEA-solver
software and references. New York: Springer.
Efendic. V. 2014. Efikasnostbanaka u JugoistocnojEvropi s posebnimosvrtomnaBosnu i
Hercegovinu. Sarajevo: Ekonomskifakultet Sarajevo.
Efendic. V.,& Hadziahmetovic. N. 2017. The social and Financial Efficiency of Microfinance
Institutions: The Case of Bosnia and Herzegovina. South East European Journal of
Economics and Business 12(2). 85-101. doi: 10.1515/jeb-2017-0018
Efendic. V.,& Hadzic. F. (2017). Business Model and Operational Efficiency of Microfinance
in Bosnia and Herzegovina: Lessons for Islamic Microfinance. Chapter 9th of the book:
Critical Issues and Challenges in Islamic Economics and Finance Development.
Palgrave Macmillan.191-211.
Emrouznejad. A.,& Yang. G. (2017). A survey and analysis of the first 40 years of scholarly
literaturein DEA: 1978–2016. Socio-Economic Planning Sciences. 1-5. doi:
10.1016/j.seps.2017.01.008
Färe. R., Grosskopf. S., Norris, M., & Zhang, Z. 1994. Productivity Growth, Technical
Progress, and Efficiency Change in Industrialized Countries. The American Economic
Review, 66-83.
Flückiger. Y.,& Vassiliev. A. 2007. Efficiency in Microfinance Institutions: An Application of
Data Envelopment Analysis to MFIs in Peru. Microfinance and Public Policy. 89-110.
doi: 10.1057/97802303000266

123
Gebremichael. B. Z. & Rani. D. L. 2012. Total Factor Productivity Change of Ethiopian
Microfinance Institutions (MFIs): a Malmquist Productivity Index Approach (MPI),
European Journal of Business and Management, 4(3): 105-114.
Grifell–Tatje. E.,& Lovell. C.A.K 1996, "Deregulation and Productivity Decline: The Case of
SpanishSavings Banks, " European Economic Review 40, 1281-1303.
Gutiérrez-Nieto. B.. Serrano-Cinca. C. & Molinero. C. M. 2007. Microfinance institutions and
efficiency. Omega. 35(2). 131-142. doi: 10.1016/j.omega.2005.04.001
Hermes. N. Lensink. R &Meesters. A. 2011. Outreach and Efficiency of Microfinance
Institutions. World Development Vol. 39. No. 6. pp. 938–948
Hassan. K. M. & Sanchez. B. 2009. Efficiency Analysis of Microfinance Institutions in
Developing Countries. SSRN Electronic Journal. doi: 10.2139/ssrn.1492238
Isik. I. & Hassan. M. K. 2003. Financial deregulation and total factor productivity change: An
empirical study of Turkish commercial banks. Journal of Banking & Finance, 27(8),
1455-1485. doi:10.1016/s0378-4266(02)00288-1
Kablan. S., 2012. Microfinance efficiency in the West African Economic and Monetary Union:
have reforms promoted sustainability or outreach? Munich RePEcArhive.
Kipesha. E,. 2012. Efficiency of Microfinance Institution in East Africa: DEA. European
Journal of Business and Management. 4(17) 77-88.
Littlefield. E.,& Kneiding. C. 2009. The Global Financial Crisis and Its Impact on
Microfinance. CGAP.
Mia. M. A.,& Chandran. V. G. 2015. Measuring Financial and Social Outreach Productivity of
Microfinance Institutions in Bangladesh. Social Indicators Research. 127(2). 505-527.
doi:10.1007/s11205-015-0979-5
Mia. M. A.,& Soltane. B. I. 2016. Productivity and its determinants in microfinance institutions
(MFIs): Evidence from South Asian countries. Economic Analysis and Policy. 51. 32-
45. doi: 10.1016/j.eap.2016.05.003
Milford. B.. Sinkovic. D. & Skare. M. 2012. The contribution of the microfinance model to
Bosnia's post-war reconstruction and development: how to destroy and economy and
society without really trying. Austrian Foundation for Development Research (Ofse). 36
Nawaz. A. 2010. Efficiency and productivity of microfinance: incorporating the role
ofsubsidies. Dec. 30. Retrieved from
https://dipot.ulb.ac.be/dspace/bitstream/2013/56753/1/RePEc_sol_wpaper_10-009.pdf.
Ramanathan. R. 2003. An Introduction to data envelopment analysis: A tool for performance
measurement. SAGE Publications. New Delhi.
Sedzro. K.,& Keita. M. 2009. Assessing the Efficiency of Microfinance Institutions Using Data
Envelopment Analysis. Journal of International Finance & Economics. 9. 54-67.
Serrano-Cinca. C.. Gutiérrez-Nieto. B. & Molinero. C. M. 2009. Social Efficiency in
Microfinance Institutions. Journal of The Operational Research Society. 60 (19). 104-
119
Simar. L. & Wilson. P. W. 1999. Estimating and bootstrapping Malmquist indices. European
Journal of Operational Research, 115(3), 459-471. doi:10.1016/s0377-2217(97)00450-5
Tahir. I. M. & Tahrim. S. N. C. 2013. Efficiency Analysis of Microfinance Institutions in
ASEAN: A Proposed Efficiency Framework. Interdisciplinary Journal of Research in
Business, 3(4). 18-26.
124
Tahir. I.,& Tahrim. S. 2015. Efficiency and Productivity Analysis of Microfinance Institutions
in Cambodia: A DEA Approach. International Review of Business Research
Papers, 11(1). 25-42. doi:10.21102/irbrp.2015.03.111.03
Wagner. C.,& Winkler. A. 2012. The Financial Crisis – a Microfinance Perspective. Die
Unternehmung. 66(4). 324-339. doi:10.5771/0042-059x-2012-4-324
Wang. Y.,& Lan. Y. 2011. Measuring Malmquist productivity index: A new approach based on
double frontiers data envelopment analysis. Mathematical and Computer Modelling,
54(11-12), 2760-2771. doi:10.1016/j.mcm.2011.06.064
World Bank 2005. Retrieved from WB Site sources:
http://siteresources.worldbank.org/INTBOSNIAHERZ/Resources/LIP2.pdf 14.06.2016.
Walter. I.,& Krauss. N. A. 2008. Can Microfinance Reduce Portfolio Volatility? SSRN
Electronic Journal. doi:10.2139/ssrn.943786
Widiarto. I.,& Emrouznejad. A. 2015. Social and financial efficiency of Islamic
microfinance institutions: A Data Envelopment Analysis application. Socio-
Economic Planning Sciences. 50. 1-17. doi: 10.1016/j.seps.2014.12.001
Wijesiri. M.. Viganò. L., & Meoli. M. 2015. Efficiency of microfinance institutions in Sri
Lanka: a two-stage double bootstrap DEA approach. Economic Modelling. 47. 74-83.
doi: 10.1016/j.econmod.2015.02.016
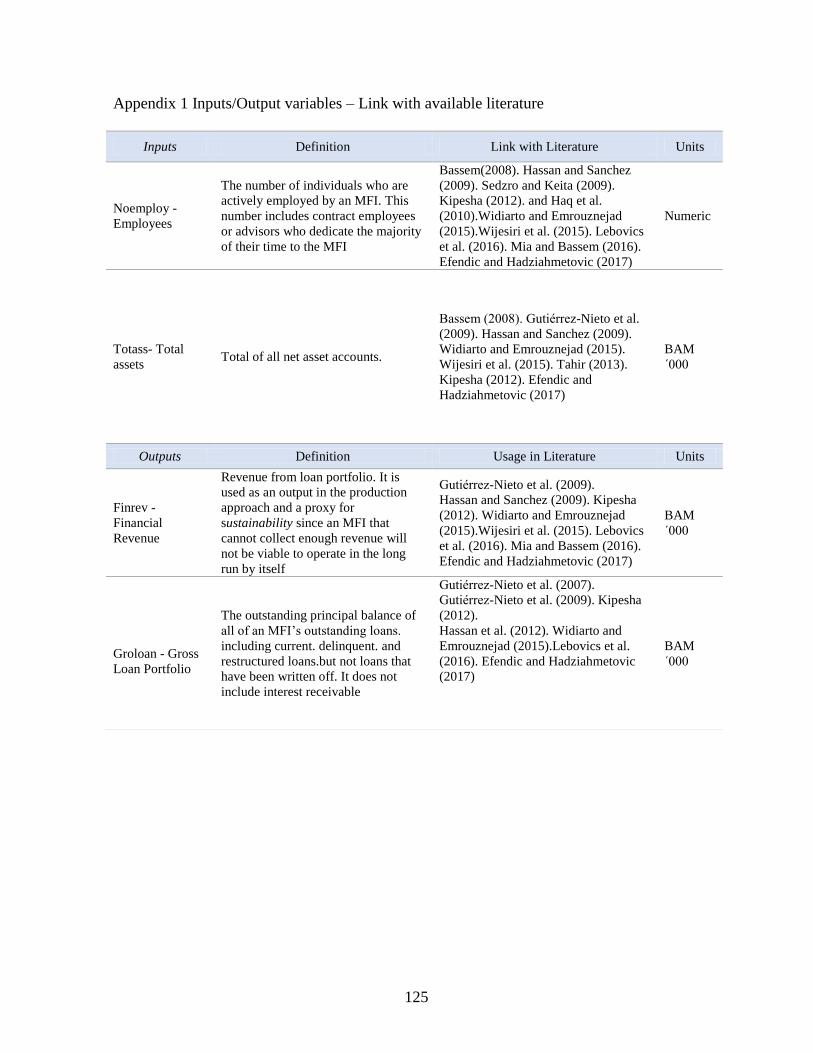
125
Appendix 1 Inputs/Output variables – Link with available literature
Inputs Definition Link with Literature Units
Noemploy -
Employees
The number of individuals who are
actively employed by an MFI. This
number includes contract employees
or advisors who dedicate the majority
of their time to the MFI
Bassem(2008). Hassan and Sanchez
(2009). Sedzro and Keita (2009).
Kipesha (2012). and Haq et al.
(2010).Widiarto and Emrouznejad
(2015).Wijesiri et al. (2015). Lebovics
et al. (2016). Mia and Bassem (2016).
Efendic and Hadziahmetovic (2017)
Numeric
Totass- Total
assets Total of all net asset accounts.
Bassem (2008). Gutiérrez-Nieto et al.
(2009). Hassan and Sanchez (2009).
Widiarto and Emrouznejad (2015).
Wijesiri et al. (2015). Tahir (2013).
Kipesha (2012). Efendic and
Hadziahmetovic (2017)
BAM
´000
Outputs Definition Usage in Literature Units
Finrev -
Financial
Revenue
Revenue from loan portfolio. It is
used as an output in the production
approach and a proxy for
sustainability since an MFI that
cannot collect enough revenue will
not be viable to operate in the long
run by itself
Gutiérrez-Nieto et al. (2009).
Hassan and Sanchez (2009). Kipesha
(2012). Widiarto and Emrouznejad
(2015).Wijesiri et al. (2015). Lebovics
et al. (2016). Mia and Bassem (2016).
Efendic and Hadziahmetovic (2017)
BAM
´000
Groloan - Gross
Loan Portfolio
The outstanding principal balance of
all of an MFI’s outstanding loans.
including current. delinquent. and
restructured loans.but not loans that
have been written off. It does not
include interest receivable
Gutiérrez-Nieto et al. (2007).
Gutiérrez-Nieto et al. (2009). Kipesha
(2012).
Hassan et al. (2012). Widiarto and
Emrouznejad (2015).Lebovics et al.
(2016). Efendic and Hadziahmetovic
(2017)
BAM
´000

126
Appendix 2. List of MFIs included in the sample
Name of MFI Web address
EKI Sarajevo www.eki.ba
LIDER Sarajevo www.lider.ba
LOK Sarajevo www.lok.ba
MI-BOSPO Tuzla www.mi-bospo.org
MIKRA Sarajevo www.mikra.ba
MIKRO ALDI Gorazde www.mikroaldi.org
MIKROFIN Banja Luka www.microfin.com
PARTNER Tuzla www.partner.ba
PRVA ISLAMSKA MCF Sarajevo
SUNRISE Sarajevo www.microsunrise.ba
127
THE EVOLUTION OF FARMLAND REITS IN BULGARIA: THE
INCOME TAX PERSPECTIVE
Svetlana Gercheva
University of Economics - Varna Department of Finance
Tsar Osvoboditel Blvd. 77 9002 Varna
Bulgaria
Phone: + 359888202412; E-mail: [email protected]
Abstract
Bulgaria is among the few new member states of the EU where two segments within the real
estate investment trusts’ (REITs’) industry proliferate. The first segment consists of special
purpose investment companies (SPICs) that securitize farmland, and the second - encompasses
SPICs that securitize other real estates. The bulk of economic literature is devoted to the
assessment of the inherent risk and return on REITs portfolio and the price volatility of their
securities. Given Bulgarian traditions in agriculture, the current paper focuses on how income
taxation impacts the development of farmland REITs in this country.
Relying on primary data compiled from financial statements and annual reports of
Bulgarian REITs, their income for distribution and its determinants have been analyzed. The
income for distribution constitutes a destination for income taxes, whatever the level they may
apply to. Further, the taxation of REITs securitizing farmland is theoretically embedded in the
framework of two tax policy requirements – encouragement and neutrality. The critical
evaluation of their feasibility in Bulgaria shows that tax policy is capable of encouraging the
development of farmland REITs through more neutral tax treatment across investors,
transactions and modes of investment.
The current paper highlights also the relevance of the tax transparent arrangement for
simultaneously reducing the income tax burden and improving the uniform tax treatment of
SPICs in Bulgaria. The methodology of the manuscript is based on the complementary
application of the normative, comparative and interdisciplinary approaches.
Keywords: REITs, income for distribution, tax neutrality, tax encouragement,
tax transparent arrangement.
JEL classification: H25, H29, G28, G35
1. Introduction
Bulgaria joined the “club” of jurisdictions with real estate investment trusts (REITs) in 2003
when the Act on the Special Purpose Investment Companies was adopted by the National
Assembly. By 2003, France had also introduced such investment vehicles, while other
developed market economies still lacked suitable legislation – UK, Germany, Spain.
Initially, REITs were set up in the USA in the1960s. In order to acquire such status
there, any legal entity (corporation, trust, association) has to pass several tests, i.e.
shareholders, revenue, asset, minimum dividend pay-out ones (Internal Revenue Code,
§856). Hence, some authors believe that the trust is not just a legal form for doing business,
but it is a conscious choice of a tax regime (Hudson-Wilson, 2002, p.704).

128
Having studied their origin extensively, researchers point that REITs facilitate investors
experiencing capital and/or knowledge “shortage” but willing to expose to real estate
(Garrigan & Parsons, 1997). Further, the comparative analysis draws attention to some
peculiarities of REITs (Zhishev, 2003;Tokushev, 2009). First, similar to closed-end investment
funds the REITs cannot redeem own shares upon shareholders’ requirement. Second, these
entities are allowed to invest only in real estates. It renders REITs different from open-end and
closed-end investment funds whose operations are based on risk diversification. Third,
contrary to investment funds REITs can diversify their financial sources.
Special purpose investment companies (SPICs) are, by analogy, Bulgarian (BG) REITs set
up as joint stock ones. They should be licensed by the Financial Market Supervision Authority
to issue and sell own securities to the public. The money from the latter is invested in
acquisition of given assets. Bulgaria adheres to international experience. Accordingly, a BG-
SPIC is allowed to securitize receivables or real estate, but not a combination thereof. The
SPICs are part of the financial sector, but their activities beyond investment occur through one
or more servicing company/ies (Act on SPICs, Art. 18 (2)). In the latter, BG-REITs are
allowed to put max.10 % of their capital.
Real estate constitutes a non-homogeneous group of assets which is replicated in the
heterogeneity of entities providing special purpose investment vehicles. There are two types of
them in Bulgaria. The first one invests in farmland, while the rest – in other immovable
property (retail, industrial, office, residential, holiday property, etc.).1
The objective of the instant paper is to critically evaluate the impact of the income tax
design on the development of BG-REITs that securitize farmland. The analysis of the possible
impact is further restricted across two dimensions that seem to be contradictory at first glance
– tax neutrality and encouragement of BG- REITs.
The rest of this paper is organized as follows. In the second section attention is paid to
some issues concerning the derivation of REITs’ income for distribution. The latter constitutes
the tax object, hence, it is crucial for taxation framework of these specific entities in Bulgaria.
In the third section comparison is drawn between farmland and non- farmland BG-SPICs
concerning distribution patterns and their main determinants. In the fourth section several
theoretical concepts of REITs tax design are analyzed in terms of neutrality and
encouragement. Their applicability in Bulgaria has been further analyzed and assessed. The
fifth section concludes.
2. Income for distribution as tax destination
2.1. Definition of the income for distribution in Bulgaria
Against the background of corporate tax exemption, insufficient attention is paid to the
method of computation and the factors determining the amount of income that REITs have to
distribute annually. On the one hand, income for distribution constitutes a tax destination - a
relevant component of the tax design applied to the REITs. The former is the base for
application of income taxes, whatever the level they are imposed to. On the other hand, for the
individual and institutional investors the particular amount of distributed income (i.e.
dividends) is one of the motives and incentives to put money into the SPICs.
1 For the sake of brevity for the immovable property, different from farmland, in this paper the term “non-
farmland” will be used.

129
The rules that clarify the method of computation are non-complicated compared to those
which determine the tax–adjusted profits of any “ordinary” corporation. Though, similarly to
computing taxable profit/loss of the company, the legislator applies adjustments for determining
SPIC’s income for distribution2. In determining the latter, the Act on the SPICs in Bulgaria provides
for not taking into consideration the positive effect of any subsequent (re)assessments of underlying
farmland. The assets’ evaluation follows their life cycle within the company. By the time the asset is
acquired, its acquisition price could encompass the purchase price and any additional transaction cost
(IAS 16, para 16; IAS 40, para. 20). Concerning the subsequent restatement, the fair value method
has to be adopted. Thus, the SPIC should appoint an independent appraiser firm to determine and
argue any change in the fair value of the land possessed. If it tends to appreciate, current profit from
the reassessment accrues which, ceteris paribus, increases the annual profit of the SPIC. Yet, the
profit from the mere reassessment of agricultural land is ignored when calculating the dividends to be
paid out by the SPIC. The reason for excluding the profit from reassessment is that it is a paper one,
which might have been received if the land has been sold under market conditions. In reality, the
ability of the SPIC to pay income out of the paper profits to shareholders does not increase - the
profit from reassessment is thus a potential one. Therefore, it is ignored for the purpose of deriving
the income for distribution that the farmland SPIC owes.
The opposite is also true – if the value of land depreciates, then current loss occurs and
erodes the annual profit of the entity. This current loss, nonetheless, is taken into consideration
for determining the income for distribution by the farmland BG-REITs. Why? The loss
occurred is also hypothetical since there might be a reduction in the future stream of benefits to
the SPIC only if the latter would have sold out cropland at a decreasing market price. This
legal provision aims to financially protect small investors, who are not in a position to
influence the decision-making of the board of directors and the shareholders’ meeting. Despite
the hypothetical loss, SPIC’s ability to pay out dividends does not diminish. Therefore, any
profit/loss from subsequent assessment is recognized for accounting purposes only. It is
reported on the comprehensive income statement of the SPIC.
The amount of income for distribution to SPIC’s investors integrates the gain/loss
accrued anytime when real alienation of farmland takes place. Moreover, it does not matter if
the ownership change occurs through sale or financial leasing of the asset. In this respect,
complete neutrality is preserved such that the SPIC makes the choice of the alienation method.
Any capital gain from an ownership transfer increases SPIC’s net income and is subsequently
distributed to investors. The reverse is also true, i.e. when there is a capital loss from the
alienation, the amount of the former decreases the net annual income. Taking the financial
effect from the transactions of land ownership into the income for distribution is justified as
the former generates a real, not a probable gain/loss. Moreover, the latter directly affects
SPIC’s ability to pay out dividends to its investors’ clientele.
Depreciation allowances (DA) also matter for the income for distribution. Moreover,
as BG-SPICs are non-homogeny in terms of the immovable property acquired, the
interpretation of the depreciation allowances deserves further analysis. DA have different
implications for both types of REITs and the ordinary corporations in Bulgaria. These
implications concern the non-current assets’ definition and structure. If the immovable
2 The tax-adjusted profit of the ordinary corporation is the equivalent term to the income for distribution of the
SPIC. For the corporation, there are cost and revenue that are not recognized for tax purpose in the year they
accrue. The former are tax recognized in subsequent periods, which differ from those when they were recognized
for accounting purpose.

130
property is held for letting it or for the sake of capital appreciation or for both, the former is
considered as investment property (IAS 40, para 7). The regulations do not provide for
depreciation allowances on such a property for accounting, but only for tax, purposes (Dosev,
2014, p.8). The immovable assets used in the production/distribution activities are attributed to
the long-term tangible assets and underlie a depreciation either for accounting or for tax
purposes (IAS 16, para 6). The above-mentioned rules diverge both across types of non-
current assets and of entities holding them. The rules are interpreted across different entities
and non-current assets below.
Table 1: Depreciation allowances – theoretical interpretation and financial effect
in Bulgaria
Type of assets Integration into the net
income (NI) Investment properties Long-term
tangibles
Ordinary corporation
Depreciation allowances (DA)
accrue only for tax
- , but not for accounting
purpose
DA accrue either for
accounting or for tax
purpose
NI annually increased by the
accounting DA (+), while
annually reduced by tax
allowed DA (-)
SPIC investing in
non-farmland
DA do not accrue for
accounting purpose; irrelevant
for tax purpose
DA accrue for
accounting; irrelevant
for tax purpose
After computation - NI
adjusted according to the Act
on SPICs, Art.10.
SPIC investing in
farmland No DA at all
DA accrue for
accounting; irrelevant
for tax purpose
After computation - NI
adjusted according to the Act
on SPICs, Art.10.
Source: Author’s adaptation according to: The Act on corporate income taxation,
The Act on Special Purpose Investment Vehicles and IAS.
From the brief presentation in Table 1 some analysis seems appropriate. For ordinary
companies, the amount of the depreciation allowances for tax purpose consists of the sum of
DA attributed to both types of assets – investment properties and long-term tangibles. The
accounting DA consist only of those accrued for long-term tangibles. While calculating the tax-
adjusted profit, the corporate net income is increased by the amount of DA for accounting
purpose and decreased by tax recognized DA. As the latter amount usually tends to be larger
than the former, it can be suggested that an ordinary corporation is going to report, ceteris
paribus, smaller taxable profit, thereby saving corporate income tax.
As regards SPICs, the amount of the depreciation allowances consists only of those
accrued for long-term tangibles. This amount is relevant for calculation of SPIC’s net income,
but not for the dividends. Therefore, DA for tax purpose is irrelevant. As the farmland does not
underlie any depreciation, ceteris paribus, these BG-REITs are supposed to report higher net
income and distribute more dividends than their non- farmland counterparts.
In sum, DA matter only for the net income of both types of BG-REITs. DA do not affect
income for distribution, resp. dividends that are the tax base, which is subsequently imposed at
the hands of investors. Hence, the structure of the non-current assets acquiredby both types of
BG-REITs could make the difference concerning dividends paid out and income taxes due.
131
3. Distribution patterns of BG-REITs
3.1. REITs in Southeast Europe: too squeezed or too generous?
By the end of 2017, nine farmland and fifty one non-farmland special purpose investment
companies operated in Bulgaria (Association of SPICs in Bulgaria, 2017, p.32). The provision
of special purpose investment vehicles in this part of Europe is institutionalized also in Greece
and Turkey. In Greece four such entities with market capitalization of €2,189 million (EPRA,
2017, p. 61) operate, while in Turkey there are 31 REITs with market value of €7,131 million
(Hepsen, A., Berberoglu, M., Aydin, O., 2017).
Bulgaria has implemented special purpose investment vehicles for 15 years and the
market capitalization of all BG-REITs in 2017 was €396 million (EPRA, 2017, p.18). It renders
this industry much fragment and “overpopulated”. The competition “sorts out” mainly entities
investing in property different from agricultural land. By the end of 2017, twelve out of the 51
non-farmland SPICs were in a process of going bankrupt or in liquidation. The Financial
Supervision Commission revoked their licenses. Still other ten entities reported not being able
to distribute dividends because of losses or carrying them forward. At that time, no one of their
farmland counterparts was in bankruptcy/liquidation or experienced a financial difficulty
(Association of SPICs in Bulgaria, 2017, pp.32-34).
Dividend smoothing is not a relevant policy for the SPICs, as the legislation requires
them to distribute annually a minimum share of their adjusted net income3. It is set too high, so
that little discretion remains with the shareholders’ meeting. Bulgarian SPICs are obliged to
pay out to investors at least 90% of the income for distribution (Act on the SPICs, Art. 10(1)).
In contrast to Bulgaria, in the first decade after their launch in 1995, Turkish (TR) REITs were
not obliged to annually distribute dividends, which constituted a competitive advantage (Aydinoglu,
2004; Corporate Credit Rating Euroasia, 2015). After acquiring more experience and
competitiveness, the legislation still requires from TR-REITs to pay out “the lesser of the net profit
calculated in line with the Turkish Commercial Code or in line with the Capital Market Board
Regulations” (PwC, 2017, p.69).
Regarding income distribution requirement, Greek real estate investment companies
(REICs) have to pay to their investors not less than 35% (2012), increased to 50% (2015) of the
annual net profits (Mitrakos, T., Vlachostergiou, V, Tsolacos. T, 2013; PwC, 2015). Despite
such a relatively moderate distribution threshold, further discretion was built-in in the
legislation. For Greek REICs, experts from PricewaterhouseCoopers (PwC) point that
“exceptionally, and if so provided in the Articles of Association, the dividend distribution
…[to] be waived following a resolution of the general assembly in cases of creating a special
reserve from profits other than gains, or converting profits into share capital” (PwC, 2015,
p.26). One possible motivation for giving Greek and Turkish REICs more financial freedom
over their distribution policies is to enable the enhanced growth of this industry by reinvesting
substantial part of profits into new real estate projects.
Against the background of Greece and Turkey, the Bulgarian 90% minimal share for
dividends seems not a mature enough decision given its emerging and tiny capital market. Back
in 2003, that outcome was influenced by the capital shortage and the expectation that Bulgaria
may become an attractive investment destination due to the very low price level of the
cropland, the competitive advantage of its agriculture and its forthcoming accession to the EU.
3 Its amount is equal to the income for distribution.
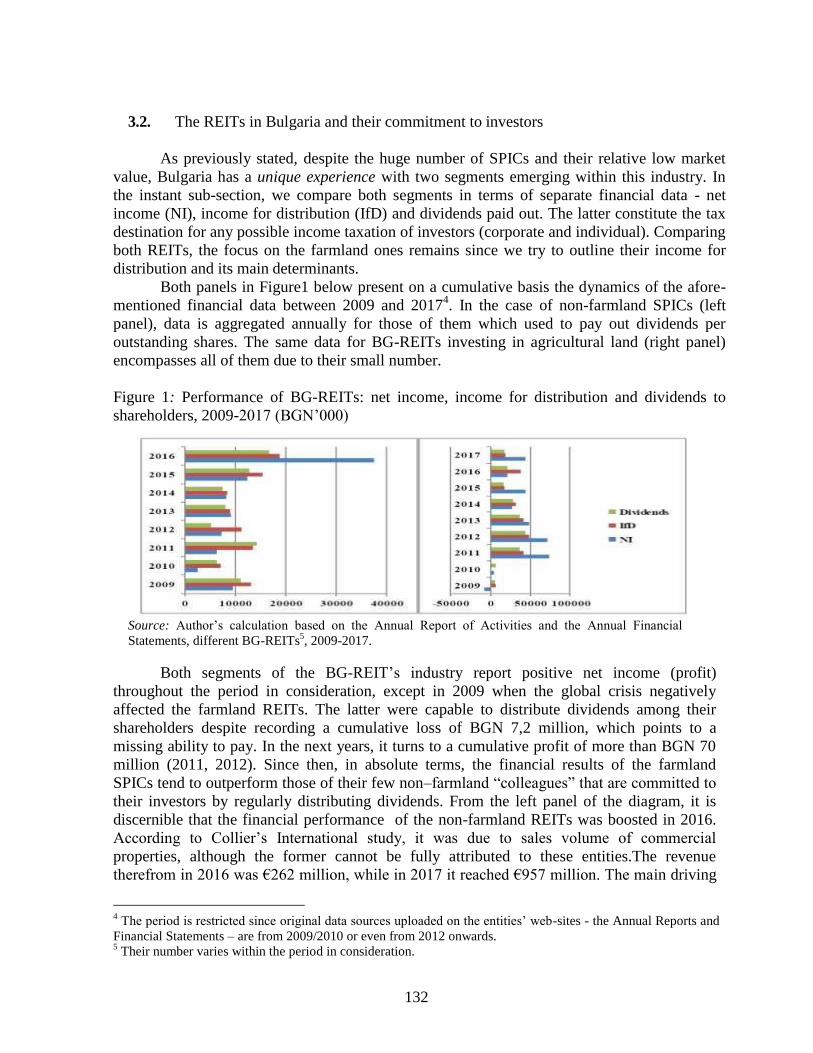
132
3.2. The REITs in Bulgaria and their commitment to investors
As previously stated, despite the huge number of SPICs and their relative low market
value, Bulgaria has a unique experience with two segments emerging within this industry. In
the instant sub-section, we compare both segments in terms of separate financial data - net
income (NI), income for distribution (IfD) and dividends paid out. The latter constitute the tax
destination for any possible income taxation of investors (corporate and individual). Comparing
both REITs, the focus on the farmland ones remains since we try to outline their income for
distribution and its main determinants.
Both panels in Figure1 below present on a cumulative basis the dynamics of the afore-
mentioned financial data between 2009 and 20174. In the case of non-farmland SPICs (left
panel), data is aggregated annually for those of them which used to pay out dividends per
outstanding shares. The same data for BG-REITs investing in agricultural land (right panel)
encompasses all of them due to their small number.
Figure 1: Performance of BG-REITs: net income, income for distribution and dividends to
shareholders, 2009-2017 (BGN’000)
Source: Author’s calculation based on the Annual Report of Activities and the Annual Financial
Statements, different BG-REITs5, 2009-2017.
Both segments of the BG-REIT’s industry report positive net income (profit)
throughout the period in consideration, except in 2009 when the global crisis negatively
affected the farmland REITs. The latter were capable to distribute dividends among their
shareholders despite recording a cumulative loss of BGN 7,2 million, which points to a
missing ability to pay. In the next years, it turns to a cumulative profit of more than BGN 70
million (2011, 2012). Since then, in absolute terms, the financial results of the farmland
SPICs tend to outperform those of their few non–farmland “colleagues” that are committed to
their investors by regularly distributing dividends. From the left panel of the diagram, it is
discernible that the financial performance of the non-farmland REITs was boosted in 2016.
According to Collier’s International study, it was due to sales volume of commercial
properties, although the former cannot be fully attributed to these entities.The revenue
therefrom in 2016 was €262 million, while in 2017 it reached €957 million. The main driving
4 The period is restricted since original data sources uploaded on the entities’ web-sites - the Annual Reports and
Financial Statements – are from 2009/2010 or even from 2012 onwards. 5 Their number varies within the period in consideration.
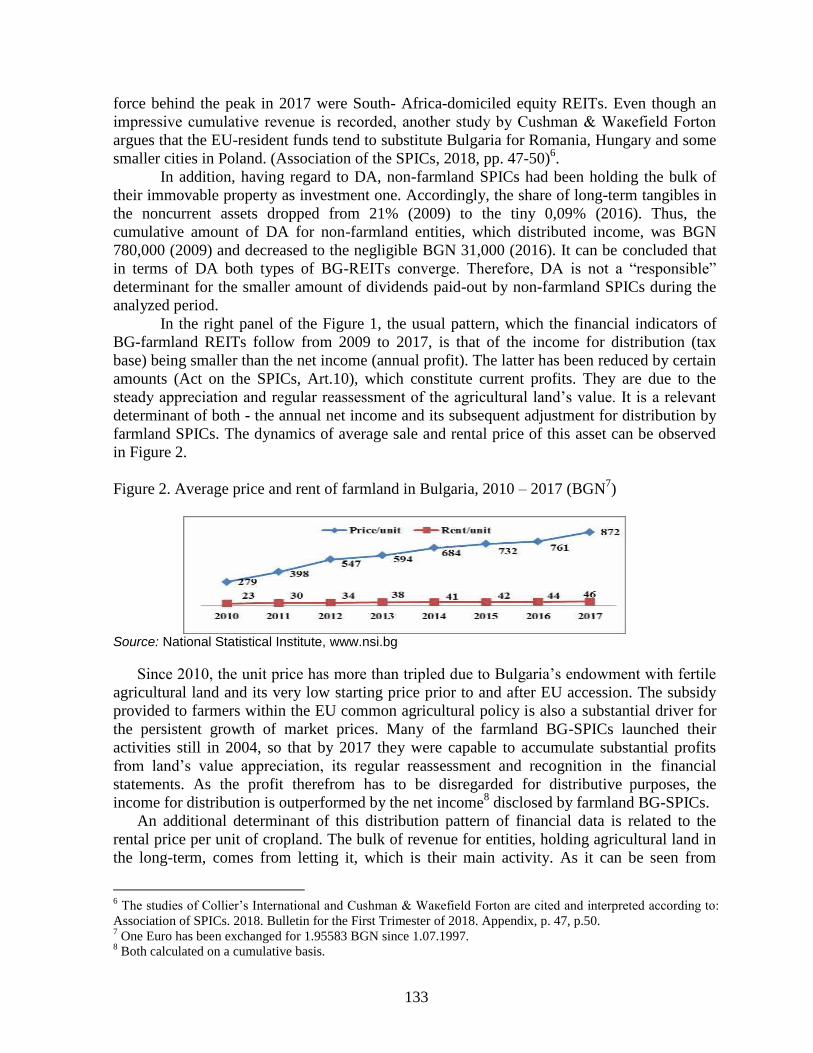
133
force behind the peak in 2017 were South- Africa-domiciled equity REITs. Even though an
impressive cumulative revenue is recorded, another study by Сushmаn & Wакеfіеld Fоrtоn
argues that the EU-resident funds tend to substitute Bulgaria for Romania, Hungary and some
smaller cities in Poland. (Association of the SPICs, 2018, pp. 47-50)6.
In addition, having regard to DA, non-farmland SPICs had been holding the bulk of
their immovable property as investment one. Accordingly, the share of long-term tangibles in
the noncurrent assets dropped from 21% (2009) to the tiny 0,09% (2016). Thus, the
cumulative amount of DA for non-farmland entities, which distributed income, was BGN
780,000 (2009) and decreased to the negligible BGN 31,000 (2016). It can be concluded that
in terms of DA both types of BG-REITs converge. Therefore, DA is not a “responsible”
determinant for the smaller amount of dividends paid-out by non-farmland SPICs during the
analyzed period.
In the right panel of the Figure 1, the usual pattern, which the financial indicators of
BG-farmland REITs follow from 2009 to 2017, is that of the income for distribution (tax
base) being smaller than the net income (annual profit). The latter has been reduced by certain
amounts (Act on the SPICs, Art.10), which constitute current profits. They are due to the
steady appreciation and regular reassessment of the agricultural land’s value. It is a relevant
determinant of both - the annual net income and its subsequent adjustment for distribution by
farmland SPICs. The dynamics of average sale and rental price of this asset can be observed
in Figure 2.
Figure 2. Average price and rent of farmland in Bulgaria, 2010 – 2017 (BGN7)
Source: National Statistical Institute, www.nsi.bg
Since 2010, the unit price has more than tripled due to Bulgaria’s endowment with fertile
agricultural land and its very low starting price prior to and after EU accession. The subsidy
provided to farmers within the EU common agricultural policy is also a substantial driver for
the persistent growth of market prices. Many of the farmland BG-SPICs launched their
activities still in 2004, so that by 2017 they were capable to accumulate substantial profits
from land’s value appreciation, its regular reassessment and recognition in the financial
statements. As the profit therefrom has to be disregarded for distributive purposes, the
income for distribution is outperformed by the net income8 disclosed by farmland BG-SPICs.
An additional determinant of this distribution pattern of financial data is related to the
rental price per unit of cropland. The bulk of revenue for entities, holding agricultural land in
the long-term, comes from letting it, which is their main activity. As it can be seen from
6 The studies of Collier’s International and Сushmаn & Wакеfіеld Fоrtоn are cited and interpreted according to:
Association of SPICs. 2018. Bulletin for the First Trimester of 2018. Appendix, p. 47, p.50. 7 One Euro has been exchanged for 1.95583 BGN since 1.07.1997.
8 Both calculated on a cumulative basis.
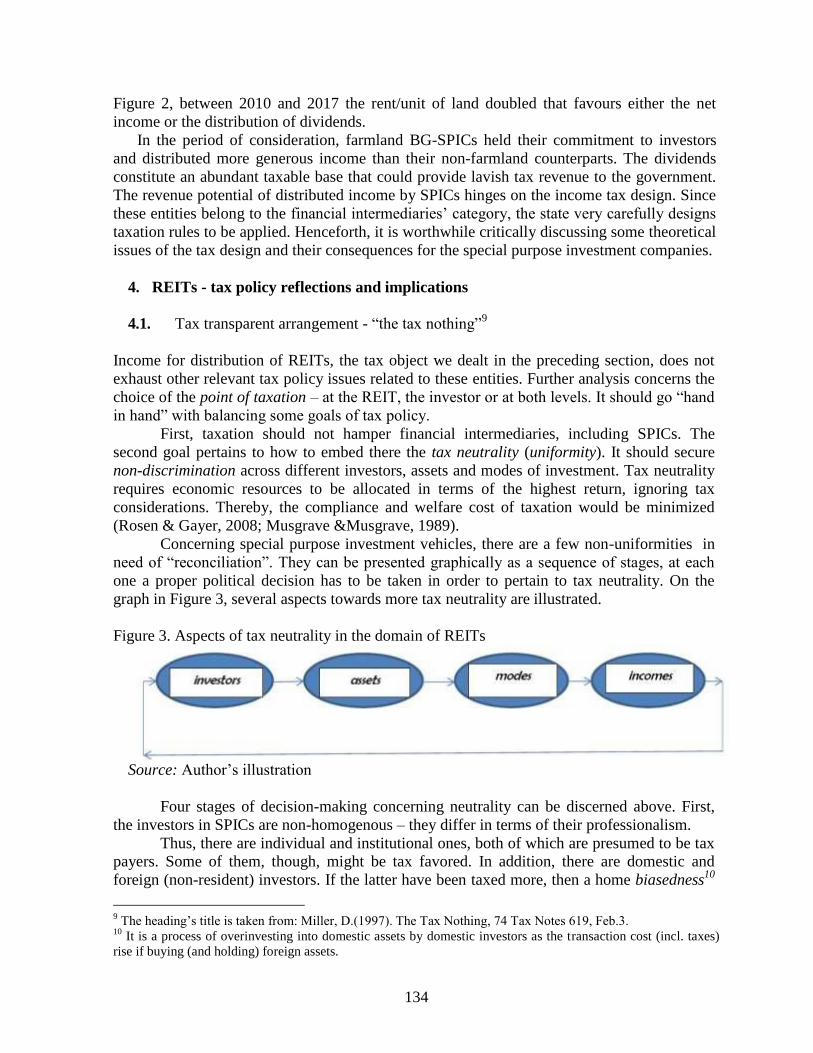
134
Figure 2, between 2010 and 2017 the rent/unit of land doubled that favours either the net
income or the distribution of dividends.
In the period of consideration, farmland BG-SPICs held their commitment to investors
and distributed more generous income than their non-farmland counterparts. The dividends
constitute an abundant taxable base that could provide lavish tax revenue to the government.
The revenue potential of distributed income by SPICs hinges on the income tax design. Since
these entities belong to the financial intermediaries’ category, the state very carefully designs
taxation rules to be applied. Henceforth, it is worthwhile critically discussing some theoretical
issues of the tax design and their consequences for the special purpose investment companies.
4. REITs - tax policy reflections and implications
4.1. Tax transparent arrangement - “the tax nothing”9
Income for distribution of REITs, the tax object we dealt in the preceding section, does not
exhaust other relevant tax policy issues related to these entities. Further analysis concerns the
choice of the point of taxation – at the REIT, the investor or at both levels. It should go “hand
in hand” with balancing some goals of tax policy.
First, taxation should not hamper financial intermediaries, including SPICs. The
second goal pertains to how to embed there the tax neutrality (uniformity). It should secure
non-discrimination across different investors, assets and modes of investment. Tax neutrality
requires economic resources to be allocated in terms of the highest return, ignoring tax
considerations. Thereby, the compliance and welfare cost of taxation would be minimized
(Rosen & Gayer, 2008; Musgrave &Musgrave, 1989).
Concerning special purpose investment vehicles, there are a few non-uniformities in
need of “reconciliation”. They can be presented graphically as a sequence of stages, at each
one a proper political decision has to be taken in order to pertain to tax neutrality. On the
graph in Figure 3, several aspects towards more tax neutrality are illustrated.
Figure 3. Aspects of tax neutrality in the domain of REITs
Source: Author’s illustration
Four stages of decision-making concerning neutrality can be discerned above. First,
the investors in SPICs are non-homogenous – they differ in terms of their professionalism.
Thus, there are individual and institutional ones, both of which are presumed to be tax
payers. Some of them, though, might be tax favored. In addition, there are domestic and
foreign (non-resident) investors. If the latter have been taxed more, then a home biasedness10
9 The heading’s title is taken from: Miller, D.(1997). The Tax Nothing, 74 Tax Notes 619, Feb.3.
10 It is a process of overinvesting into domestic assets by domestic investors as the transaction cost (incl. taxes)
rise if buying (and holding) foreign assets.

135
occurs and hampers globalization of financial markets. Taxation has the difficult task to treat
all investors uniformly in order to be perceived justified and neutral.
The second stage in the sequence (see Figure 3) illustrates the plurality of assets. Since
their launch in the 1960s, the investment vehicles have encompassed real estates, mortgage
bonds, agricultural land, and receivables. The list of assets is not exhaustive, since innovation
challenges markets in real estate and financial services. Nevertheless, for tax purpose
investors have to be indifferent in which asset/s they put their money. The only factor
worthwhile considering should be the highest market return expected, given investors’ risk
tolerance/attitude.
Third, modes of investment refer to the way of assets’acquisition – buying them
directly or indirectly, i.e. through shares in SPICs that subsequently invest into a portfolio of
properties. Taxation rules should leave investors on an indifference curve, concerning direct
or indirect modes of investment. Fourth in the sequence of decision-taking (Figure 3) is the
diversity of incomes. Any portfolio of assets is expected to generate return on investment.
Thus, it is important not to differentiate in tax terms across many income types stemming
from REIT’s assets – rents, dividends, interest, capital gain/loss, even penalty in case
contracts have been breached.
Along with tax uniformity, the encouragement of SPICs is a crucial requirement of the
tax policy. It can be achieved with tax benefits, hence, there are some proposals favoring
investment funds (Zolt, 1998, p.13). Since SPICs are particular kind of the latter, no tax
should be imposed at both levels simultaneously – the investor’s and entity’s – insofar as
shareholders hold their stocks.
In the first proposal, no tax is imposed on any income received by the REIT. In case of
a distribution and a withholding tax thereon, the latter is refunded to investors. Taxation is
deferred until the shareholders sell their securities. In the second alternative, investors’
contribution out of their regular income is tax-free. The subsequent investment income enjoys
the same status. In the end, taxation applies upon investor’s decision to withdraw money. In
most cases, tax legislation restricts the amount of the contribution that provides tax benefits.
Such tax regime is adapted and applied also to pension and health-care funds that operate
within the private-insurance-sector.
By the time mass privatization of assets from the socialist past was underway, tax
regimes were customized to the new investment funds. In terms of tax neutrality and
development promotion, a pass through model scored high. Bulgarian authors acknowledge
that the launch of SPICs helped introduce tax transparent entities in the country (Zhishev
2003; Tokushev 2009).
Their arrangement is based on the integrationist view on corporate taxation.
According to it, a corporation does not possess own identity since its ultimate owners are
individuals. Thus, the corporation enjoys the synergies from aggregation of capital and
personal endowments – education, training, knowledge, qualification, experience, and
intuition. Ignoring the human factor, the corporation per se does not have an ability to pay
and it cannot be a tax liable person. Therefore, they should be imposed with income tax,
which has to be levied uniformly on all different sources of income, including personal
earnings from a corporation. Such a concept presumes only personal income taxation,
rendering any enterprise/corporate levy redundant.
Proponents of income integration promote avoidance of double income taxation.
Instrumental to lightening tax burden is the pass-through arrangement. Musgrave and
Musgrave associate its universality with the “partnership method” of integration where

136
“…shareholders are treated for tax purposes as if they were partners in an incorporated
business” (1989: 376). Still other contributors take an interdisciplinary view, distinguishing
civil and common law systems, embedding there “partnerships” and the flow-through system
(Easson & Thuronyi, 1998). Zolt’s remark on investment fund’s operation seems appropriate
also for the SPIC since it is “as transparent and allocate(s) all items of income and loss directly
to investors. In its purest form, [it] acts simply as a reporting mechanism.” (1998:14). In this
vein, quite illustrative for the transparency arrangement is its qualification as “The Tax
Nothing” (Miller, 1997).
The benefits of its operation are associated also with tax collection. Similar to the
ordinary corporation, which withholds the personal income tax on the remunerations of its
employees (Musgrave & Musgrave, 1989), the SPIC has to determine and collect the income
taxes due by its investors’ clientele. It is further proposed that it applies to investors’ income
the highest - or the most common rate (Zolt, 1998, p.14). If the beneficiaries of dividends are
taxed at a lower marginal rate, they need to fill in a declaration for a tax refund. Otherwise, the
shareholders will benefit from the tax paid by the SPIC which is considered a tax credit
reducing the ultimate liability. (Zolt, 1998; Musgrave & Musgrave, 1989). In the end, all
physical persons pay tax at the rate which conforms to their own ability to pay.
If the tax focus is shifted from investors to the SPIC, it would be overtaxed if the
income imposition applies in tandem with a levy on the fair value of its assets. The latter
constitutes a wealth tax, which affects the substance, while the income tax distorts the return on
assets (Schratzenstaller, 2013, p.19). Concerning the income levy, a problem arises if the tax
rate on REIT is different from the rate imposed on the investor. If the tax rate on the entity is
bigger, then the shareholder would mind indirect investment and vice versa.
More acceptable would be a tax applied simultaneously at the SPIC and at the hands of
investors. The entity is liable for retained income, while the shareholders – for the distributed
one. In an IMF publication Zolt identifies that “[c]ountries that follow this approach …require
funds to distribute a substantial portion of their income each year” (1998:16). REITs fit
completely into this setting. Indeed, if they pass the test of high minimum share of distribution,
they are allowed a deduction for the dividends paid. Moreover, they may be not tax-liable for
the income neither distributed, nor retained (Borden, 2015, p.532).
It is a demanding task to adapt an appropriate design for income taxation to REITs. It
should integrate two different tax policy requirements: encouraging the development of
financial intermediation through improved uniform treatment across investors, transactions and
modes of investment. The “invention” of the tax transparent arrangement and its application to
REITs’ income moves tax theory a step further to the complex economic reality.
4.2. The tax transparent regime of BG-REITs – encouragement through neutrality
It was theoretically argued that tax transparency is a suitable design for the integrationist view
of corporate income taxation. Such arrangement is capable to avoid double income taxation,
while preserving the tax statute of investors in any REIT.
The international experience shows evidence for the universal feasibility of tax
transparency. It has been utilized successfully in a corporate - as well as in a partnership - and
sole-proprietorship setting. Experts from the Tax Foundation cited the Census Bureau that ca
92% of all firms in the USA are pass-through businesses (Tax Foundation, 2017, p.4). Their
combined net income “has been persistently higher than corporate income since 1998 except in

137
2005…The most recent data shows …$1,3 billion in net income, or 63,9% of total business net
income in 2011” (Pomerleau, 2015, p.7-8).
When SPICs were launched in Bulgaria, there was a contestable political dispute
concerning their exempt income tax status. It was deemed non-neutral and unjustified towards
the ordinary corporations. Between 2003 and 2008, the taxation issue around BG- REITs
implied much controversy as the then corporate tax rate changed between 15% and 23,5%,
while dividends for individual shareholders were additionally imposed at a withholding rate of
17%. Attaching a corporate tax-free regime to BG-REITs in Bulgaria could convert these
entities into tax shelters for well off or high net worth individuals. Why?
First, according to Bulgarian legislation, the paid-in capital required upon registration is
min. BGN 500,000, which is an affordable amount for well-off people to set up such corporate
tax free entity. In France and Germany, the nominal capital to be fully paid in shall be at least
EUR 15 million, in Greece – 25 million, in Hungary – 12 million, while in Turkey – about
EUR 6 million (PwC, 2017). Second, a further legal provision, targeting more professional
investors, requires institutional shareholders to acquire at least 30% from the REIT’s equity by
the time of its set up. In fact, there is no legal impediment for this participation to be
transferred later to the individual co-owners, once the SPIC becomes operative with shares
listed for trade on a recognized stock exchange. Third, a brief look at the ownership structure
of BG-REITs is warranted given the persistence of the above-mentioned legal requirements for
15 years in a row.
Figure 4.The ownership constellations in farmland SPICs in Bulgaria, 2017
Source: Author’s calculation based on data from the Central Depositary, Annual Reports of Farmland
SPICs for 2017, Annual Financial Statements of Farmland SPICs for 2017.
138
From the ownership “picture” taken by the end of 2017 (Figure 4), several conclusions
can be drawn. First, almost 50% from the equity capital of the nine farmland BG-REITs
belongs to the financial sector. Second, the ownership of the latter is dispersed among various
financial institutions given their willingness to diversify portfolios. Third, a substantial part of
the capital is concentrated within individuals holding more than 5% of
the former11
. By the end of 2017, the biggest share in the capital of the nine cropland BG-
SPICs were held by individuals. Fourth, the free float is 25%12
, while in 2009 it was 34%
(Commission on Financial Supervision in Bulgaria, 2009, p. 14), which indicates more
concentrated ownership structure than it was 10 years ago.
Some of the conclusions on the ownership constellations in the BG-REITs farmland
segment have direct tax implications and explanations. First, the financial sector traditionally
bears up to 10% of the corporate tax burden in Bulgaria (Ministry of Finance, Government
revenue statistics).
Second, pension and mutual funds use the pass-through arrangements and benefit
themselves from the corporate tax exemption. Third, since 2007, individuals, who in 2017
possessed the largest share in the farmland REITs’ equity, pay only 5% withholding tax
imposed on dividends from the SPICs. In contrast, the bulk of institutional investors receiving
dividends shall integrate them with the rest of the revenue. Subsequently, they owe 10%
corporate income tax.
In light of the foregoing, it can be argued that BG-REITs in their flow-through
arrangement are in a position to favor rich individual investors, providing them with tax
benefits. Therefore, this regime is non-neutral and facilitates the large (for Bulgaria) number of
REITs. Pass-through arrangement does not warrant complete (pure) tax transparency here,
since if distribution of dividends does not occur (in case the SPIC discloses a negative adjusted
annual income), the loss is not “transferred” to the investors as is the profit.
Thus, the loss cannot reduce accordingly shareholders’ taxable income from other
sources (if any). It means preserved ability to pay, while in reality it is eroded. Hence, experts
from PricewaterhouseCoopers believe that in Bulgaria “[t]here is no flow through treatment of
the income of the BG-REIT for …tax purposes.” (2015:12). Against the background of the
flow-through REIT arrangement, the issue of neutral taxation regarding investors, transactions
and modes of investment remains open for further analysis. The following table sketches
briefly the taxes due upon the afore- mentioned dimensions.
11
The SPICs are obliged to regularly disclose any shareholders with more than 5% share in their capital. 12
Concerning individuals’ share in farmland SPICs, it should be noted that in two of them participate two
financial holdings. As they both to more than 90% belong to two high net worth individuals (HNWI), we
calculate separately their shares and those of the financial holdings.
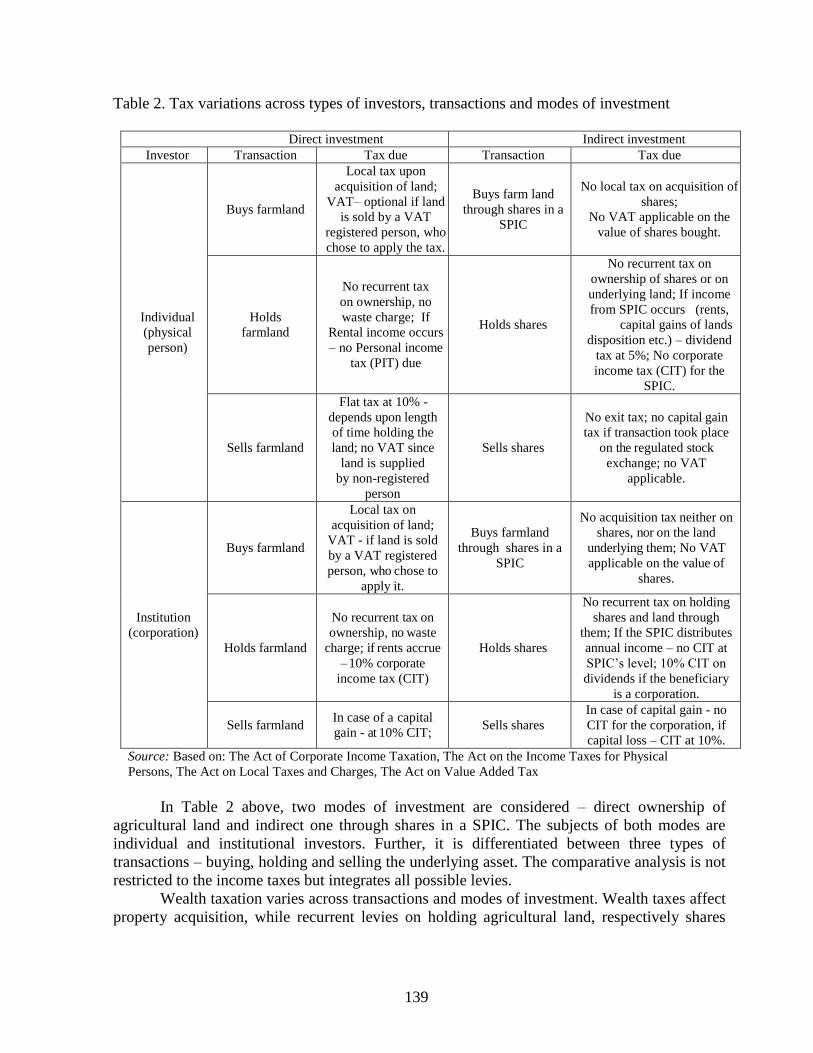
139
Table 2. Tax variations across types of investors, transactions and modes of investment
Direct investment Indirect investment
Investor Transaction Tax due Transaction Tax due
Individual
(physical
person)
Buys farmland
Local tax upon
acquisition of land;
VAT– optional if land
is sold by a VAT
registered person, who
chose to apply the tax.
Buys farm land
through shares in a
SPIC
No local tax on acquisition of
shares;
No VAT applicable on the
value of shares bought.
Holds
farmland
No recurrent tax
on ownership, no
waste charge; If
Rental income occurs
– no Personal income
tax (PIT) due
Holds shares
No recurrent tax on
ownership of shares or on
underlying land; If income
from SPIC occurs (rents,
capital gains of lands
disposition etc.) – dividend
tax at 5%; No corporate
income tax (CIT) for the
SPIC.
Sells farmland
Flat tax at 10% -
depends upon length
of time holding the
land; no VAT since
land is supplied
by non-registered
person
Sells shares
No exit tax; no capital gain
tax if transaction took place
on the regulated stock
exchange; no VAT
applicable.
Institution
(corporation)
Buys farmland
Local tax on
acquisition of land;
VAT - if land is sold
by a VAT registered
person, who chose to
apply it.
Buys farmland
through shares in a
SPIC
No acquisition tax neither on
shares, nor on the land
underlying them; No VAT
applicable on the value of
shares.
Holds farmland
No recurrent tax on
ownership, no waste
charge; if rents accrue
– 10% corporate
income tax (CIT)
Holds shares
No recurrent tax on holding
shares and land through
them; If the SPIC distributes
annual income – no CIT at
SPIC’s level; 10% CIT on
dividends if the beneficiary
is a corporation.
Sells farmland In case of a capital
gain - at 10% CIT; Sells shares
In case of capital gain - no
CIT for the corporation, if
capital loss – CIT at 10%.
Source: Based on: The Act of Corporate Income Taxation, The Act on the Income Taxes for Physical
Persons, The Act on Local Taxes and Charges, The Act on Value Added Tax
In Table 2 above, two modes of investment are considered – direct ownership of
agricultural land and indirect one through shares in a SPIC. The subjects of both modes are
individual and institutional investors. Further, it is differentiated between three types of
transactions – buying, holding and selling the underlying asset. The comparative analysis is not
restricted to the income taxes but integrates all possible levies.
Wealth taxation varies across transactions and modes of investment. Wealth taxes affect
property acquisition, while recurrent levies on holding agricultural land, respectively shares
140
thereon, are non-applicable. Direct investment is more tax-burdened than the indirect one. No
imposition is due on the gross/net assets value.
VAT is optional for farmland transactions in Bulgaria. It applies if they occur between
registered persons so that the latter are allowed a VAT refund on the inputs bought. VAT is not
imposed on transactions with REIT’s securities.
Much differentiated (and complicated) is the income tax treatment. Assuming the
individual acquires land which generates income (Table 2), i.e. rents, it turns out that it is better
to invest directly since no personal tax on any income from land is due. The same provision is
valid for foreigners, which receive rents from directly holding agricultural land (The Act on
Income Taxes for Physical Persons, Art. 13, Para 1, point 4).
If this asset is sold out within five years after its acquisition’s date, from the PIT’s
“point of view” it is better to do it through the SPIC. Then, the possible capital gain will be
taxed at 5% upon dividends distribution to the individual investors (domestic and non-
domestic). If they directly sell the land within a 5-years’ term, any capital gain of the same
amount will be taxed at 10% flat tax. Any capital gain from REIT’s shares disposed by physical
persons at a regulated stock exchange is PIT-free. Any capital loss is irrelevant for tax purpose
as it provides the individuals with no tax benefits.
Is the income taxation so complicated for corporate investors? If the company chooses
to hold the land (Table 2), in terms of CIT, any return will be taxed at 10%, regardless of the
mode of investment. The possible return will be integrated into other income and taxed
accordingly at 10%. The only exception concerns non-domestic corporations, which determine
their taxable profit, according to the respective home country corporate tax legislation. Thus,
within the transparent REIT setting, tax neutrality in terms of mode of investment is achieved
only for domestic corporations.
Once the corporate investor sells the farm land (Table 2), any capital gain will be
aggregated with the rest of its income and taxed at 10% corporation tax. The same occurs if the
SPIC sells land with a capital gain. The latter will be considered for computing the amount of
dividends for the investors. The corporate ones owe 10% tax on the dividends received from
the SPIC. If the corporation sells out its shares in the SPIC on a recognized stock exchange, the
income tax liability depends on the outcome. If it is a gain, then there will be a CIT saving. If
there is a capital loss, there will be an additional CIT due.
In terms of different taxes different patterns of non-neutrality emerge. The wealth
taxation still differentiates across transactions and modes of investment in farmland. Although
a universal indirect tax, VAT is optional in agricultural land transactions. The most divergent
remain income levies. Despite some progress, there is still much tax non- uniformity to
overcome across types of investors, transactions and modes of investment in agricultural land.
5. Conclusion
For 15 years, Bulgaria has been gathering synergy and unique expertise from the markets of
real estates and financial instruments. Farmland BG-REITs show a sustainable pattern of
dividend distribution to shareholders throughout the period 2009-2017.
The tax transparent arrangements made their way in Bulgaria through SPICs. This
arrangement promotes the integrationist view, lightening the tax burden on corporate income.
The latter favors especially the individual investors, which hold the biggest share in the equity
capital of the farmland BG-REITs. In terms of encouragement the tax policy has favored their
development within the period of consideration. Though, relevant differences should be

141
removed across investors, transactions and modes of farmland acquisition, which point to a
still scarce income tax neutrality.
References
Aydinoglu, C. 2004. Turkish REITs: An Overview of the Industry and its Performance. Thesis.
http://citeseerx.ist.psu.edu. Accessed 15 July 2018.
Aidyn, O., Hepsen, A., Berberoglu, M. 2017. Real Estate Investment Trusts in Turkey:
Structure, Analysis, and Strategy. Journal of Economics, Business and Finance,
6(2):191-199.
Association of SPICs in Bulgaria. 2017. Bulletin for the Third Semester of 2017.
http://www.sipca.bg. Accessed 27.06.2018.
Association of SPICs in Bulgaria. 2018. Bulletin for the First Trimester of 2018.
http://www.sipca.bg. Accessed 20.07.2018.
Borden, T.B. 2015. Rethinking the Tax-Revenue Effect of REIT Taxation, Florida Tax
Review, 17 (7): 529- 622.
Commission on Financial Supervision in Bulgaria. 2009. Comparative analysis of the SPICs in
Bulgaria with the REITs in the USA and the developed European countries.
www.fsc.bg. Accessed 14.06.2018.
Corporate Credit Rating Euroasia. 2015. Turkish REITs. http://www.atagyo.com.tr.
Accessed 14.06.2018.
Dosev, H. 2014. Investment property and its representation in annual financial statements
prepared in accordance with the national financial reporting standards for small
and medium-sizes enterprises. Accounting, No 8/2014: 1-14.
European Public Real Estate Association. 2017. EPRA Global REIT Survey. A comparison of
the major REIT regimes around the world. http://www.epra.com. Accessed 25 July
2018.
Easson A., Thuronyi, V. 1998. Fiscal Transparency. In: V. Thornyi (Ed.). 1998. Tax Law
Design and Drafting, volume 2. IMF. Ch. 21.
Garrigan, R., T., Parsons, J.F. 1997. Real Estate Investment Trust: Structure, Analysis and
Strategy. New York:McGraw-Hill.
Hudson-Wilson, S. 2002. Real Estate Investment. In: F. Fabozzi (Ed.). 2002. The Handbook
Of Financial Instruments. Hoboken, Ney Jersey: John Wiley & Sons. Ch.27.
IFRS. IAS 16 Property, Plant and Equipment. http://www.ifrs.com. Accessed 7 May 2018.
IFRS. IAS 40 Investment Property. http://www.ifrs.com. Accessed 10 May 2018.
Internal Revenue Code. §856 Definition of real estate investment trusts. https://www.gpo.gov.
Accessed 18 June 2018.
Miller, D.1997. The Tax Nothing. 74 Tax Notes 619, Feb.3.
Ministry of Finance. 2018. Government revenue statistics. http://www.minfin.bg.
Accessed 5 August 2018.
Mitrakos, T., Vlachostergiou, V, Tsolacos, S. 2013. The Greek REIT Industry: Current State
and its Post-crisis Evolution in: Sotelo,R., McGreal, St. (Eds.). 2013. Real Estate
Investment Trusts in Europe Evolution, Regulation, and Opportunities for Growth.
Springer. Part III. Ch.15.
Musgrave, R.A., Musgrave, P.B. 1989. Public Finance in Theory and Practice. Fifth edition.
McGraw-Hill.
142
National Statistical Institute. 2018. Prices and Rents in the Agriculture of the Republic of
Bulgaria in 2017. www.nsi.bg. Accessed 6 July 2018.
Pomerleau, K. 2015. An Overview of Pass-through Businesses in the United States. Special
Report No 227. https://files.taxfoundation.org. Accessed 8 July 2018.
PwC. 2015. Compare and contrast Worldwide Real Estate Investment Trust (REIT) Regimes.
https://www.pwc.com. Accessed 22 June 2018.
PwC. 2017. Compare and contrast Worldwide Real Estate Investment Trust (REIT) Regimes.
https://www.pwc.com. Accessed 15 July 2018.
Rosen, H., Gayer, T. 2008. Public Finance. Eighth edition. McGraw-Hill. Schratzenstaller, M.
2013. Besteuerung hoeherer Einkommen und Vermoegen
Internationale Entwicklungstendenzen, Moeglichkeiten und Grenzen.
Vierteljahrshefte zur Wirtschaftsfirschung, 82 (1):13-34.
Tax Foundation. 2017. Pass-Through Businesses: Data and Policy. Fiscal Fact № 536.
https://taxfoundation.org. Accessed 8 July 2018.
The Act on Special Purpose Investment Vehicles, State Gazette № 46/16.12.2003. The Act on
Corporate Income Taxation, State Gazette № 105/ 22.12.2006.
The Act on Local Taxes and Charges, State Gazette № 117/ 10.12.1997.
The Act on the Taxes of the Physical Persons, State Gazette №95/24.11.2006. The Act on the
VAT, State Gazette № 63/4.08.2006.
Tokushev, V. 2012. Special Purpose Investment Companies. Sibi.
Zhishev, E. 2003. On some aspects of the legal regime of the special purpose investment
companies. In: Commission of Financial Supervision. 2003. Bulletin №9, pp. 3-
10.
Zolt, E. 1998. Taxation of Investment Funds. In: V.Thornyi. (Ed.) Tax Law Design and
Drafting, volume 2. IMF. Ch. 22.
143
E-CRM DIMENSIONS AND PERCEIVED INNOVATIVENESS OF BANK’S
SERVICES
Elvedin Grabovica
School of Economics and Business Sarajevo
Trg oslobodjenja – Alija Izetbegovic 1
Phone: ++ 387 33 275 900; Fax: ++ 387 33 275 900
E-mail: [email protected]
Lejla Turulja
School of Economics and Business Sarajevo
Trg oslobodjenja – Alija Izetbegovic 1
Phone: ++ 387 33 275 970; Fax: ++ 387 33 275 900
E-mail: [email protected]
Abstract
Research on electronic customer relationship management and innovation has increased in
recent years. The study proposes a model based on specific dimensions of e-CRM, i.e.
customers' satisfaction with bank's website, the level of personalization of services, trust in a
bank, and the integration of online and physical services and their impact on innovativeness in
from a customer perspective. Based on a survey of 214 respondents in B&H, this study applies
the structural equation modeling (SEM) to investigate the research model. The results show
that two e-CRM factors (personalization and channel integration) significantly influence
perceived innovativeness. The paper provides useful information on the relationship between
specific e-CRM dimensions and perceived innovativeness.
Keywords: electronic CRM, perceived innovativeness, website satisfaction, personalization,
trust, channel integration
JEL classification: M15
1. Introduction
With advancements in information technology, drastic changes in service industries have been
created over the past decades. Knowing that customer satisfaction is one of the main goals of
companies, the survival of companies depends on maintaining a more stable long-term
relationship with its customers (Dalir et al., 2017). This is why the literature recognizes the
need for companies to provide better customer service.
With the increasing presence of the Internet and information technologies in all aspects of
business, the segment of communication with customers has undergone certain changes. More
and more customer service activities are taking place online. In other words, companies invest
in customer relationship management, and more recently in electronic means that ease this
relationship. Successful CRM is one of the main competitive advantages that companies can
use to achieve customer loyalty and prevent consumers from switching to other companies
(Kimiloǧlu and Zarali, 2009). The main goal of CRM can be seen as understanding and better
treating customers for increased loyalty and profit. CRM is an integrated approach to customer

144
relationship through a combination of three important components: people; process; and
technology (Kimiloǧlu and Zarali, 2009; Harrigan and Miles, 2014). When using the Internet
as a domain for the implementation of CRM, we are talking about electronic CRM or e-CRM
(Kimiloǧlu and Zarali, 2009).
For the contemporary companies, perceived innovativeness is considered a key
competitive weapon for firms when forging corporate reputations (O’Cass and Carlson, 2012).
Innovation, in general, is considered as a key companies' capability in the digital era. O’Cass
and Carlson (2012) noted that brands that are perceived as being innovative in the minds of
consumers have been found to have a positive impact on firm credibility.
The main goal of this paper is to analyze the relationship between certain elements of e-
CRM and the perceived innovativeness of the company's services by its customers. In this
regard, we have selected the following aspects of CRM for analysis: i) website satisfaction, ii)
personalization, iii) trust and iv) channel integration, and we will analyze the impact of these
constructs on the customers’ perceived innovativeness of the company. The hypotheses will be
tested for users of banking services. In other words, the purpose of this study is to examine to
what extent the customers' satisfaction with bank's website, the level of personalization of
services, trust in a bank, and the integration of online and physical services influence
innovativeness in from a customer perspective.
2. Literature review
2.1. e-CRM
Many companies apply e-CRM in their business, resulting in increased customer loyalty and
customer retention (Lee-Kelley, Gilbert and Mannicom, 2003). The Internet becomes more
and more important for business, which provides companies with direct and effective ways of
communicating with clients and enables direct communication with customers and reduction
of costs as a result of savings in time and space. e-CRM is a term designed to manage
customer relationships that are delivered online (Feinberg and Kadam, 2002). This relates to
online marketing activities, instruments, and techniques that are focused on building and
improving customer relationships (Lee-Kelley, Gilbert and Mannicom, 2003). e-CRM implies
improving customer service and retaining valuable customers and clients (Fjermestad and
Romano, 2003).
Technology plays an important role in improving services by providing new forms of
services and delivery, then strengthening the customer's sense of belonging, responding more
quickly to customer needs (Mulligan and Gordon, 2002). e-CRM implies the improvement of
the basic CRM concept and the application of existing techniques to identify the customer's
value and to manage customer service in an electronic environment.
2.2. Perceived innovativeness
Perceived innovativeness in this research addresses marketing and consumer-related aspects of
innovation (Anselmsson and Johansson, 2009). The development of new products and services
is of great importance for the growth and survival of companies. Perceived innovation
involves the way customers perceive the level of innovation of some company which is
subject to a certain degree of subjectivity (Anselmsson and Johansson, 2009). By following
the attitudes, habits, and needs of the customers, the company comes up with various
145
innovative ideas to improve its products by adapting them to the needs of the target market.
The customer is an important factor influencing innovation and customers play a very
important role in the development of innovations, because their very sophisticated tastes,
desires, and needs force companies to continually create new or change and improve existing
products and services (O’Cass and Carlson, 2012).
3. Theory and hypotheses development
Companies increasingly treat their customers differently using personalized offers, as part of
their e-CRM schemes. Focusing on the needs of customers with differentiated offers can result
in the more efficient use of organizational resources and increased value for both the customer
and the company (Yu et al., 2015). To be competitive means to be innovative and different
from competitors. Creating satisfied and loyal clients is the most important and at the same
time very difficult task of a market-oriented company. Client-oriented operations of banks are
in the function of creating customers’ satisfaction through meeting their needs and desires,
with the aim of achieving a competitive advantage and therefore a profit. In order to achieve
this, companies use different CRM activities. Kim et al. (2011) analyzed the relationship
between CRM and company innovation suggesting that CRM technology should help the
company understand its customers. Improved two-way communication through CRM
technology can facilitate the exchange of ideas generated by customers, which leads to
improved solutions for their needs. This improves the innovation of the company. In other
words, the company through CRM has the ability to discover the needs of its customers, and
therefore to respond better to those needs. On the other hand, through communication with
customers, the company has the opportunity to make its customers familiar with its
innovation, thus influencing the perceived innovation. Thus, we propose the following
hypotheses:
H1. Satisfaction with the website is positively related with perceived innovativeness.
H2. Personalization level is positively related with perceived innovativeness.
H3. Trust is positively related with perceived innovativeness.
H4. Channel integration is positively related with perceived innovativeness.
4. Research methodology
A survey questionnaire was used for the purpose of this research. In the development of the
questionnaire, questions from the following studies were used: Ab Hamid, Cheng and Akhir
(2011) for observed e-CRM dimensions, and Falkenreck and Wagner (2011) for
innovativeness.
4.1. Sample
A total of 256 respondents took part in the research. Following Hair et al., (2014),
observations containing more than 20% of the missing data were removed from the sample, so
214 observations made a suitable sample of this study, of which 50.9% were women and
47.7% were men. The largest part of the sample consisted of faculty-educated respondents
(50.5%), ages 25-34 (50.5%), which is shown in Table 1. The target population was
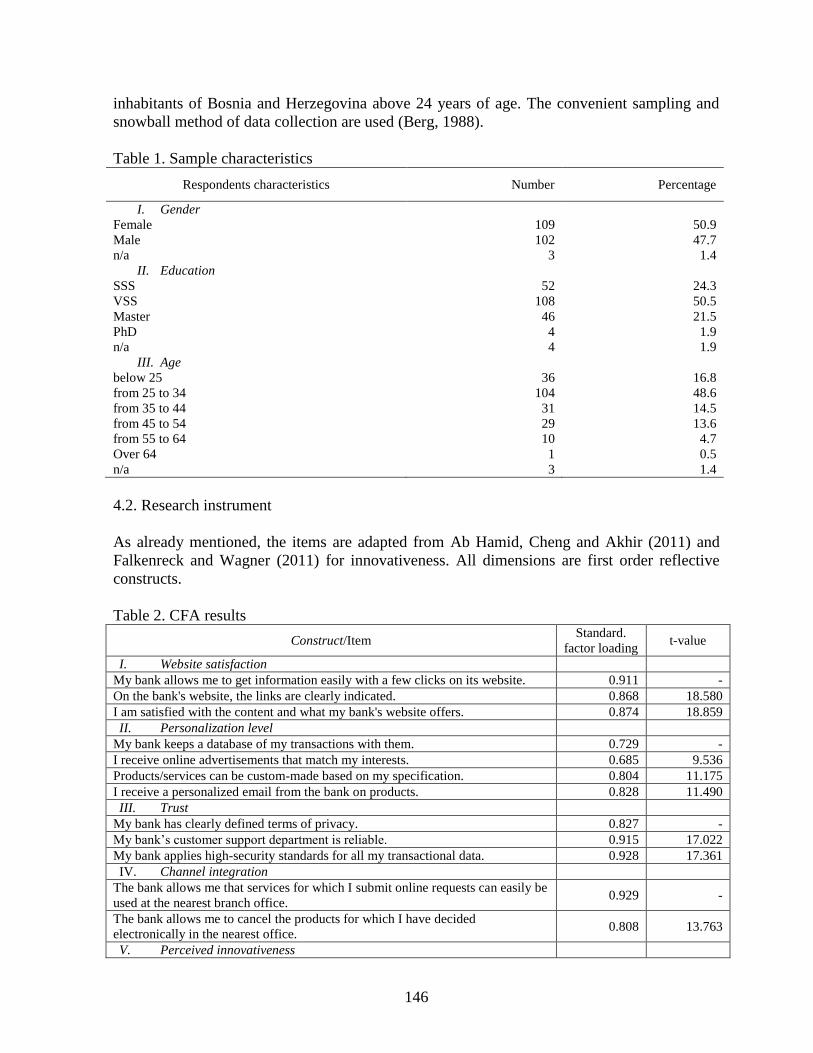
146
inhabitants of Bosnia and Herzegovina above 24 years of age. The convenient sampling and
snowball method of data collection are used (Berg, 1988).
Table 1. Sample characteristics
Respondents characteristics Number Percentage
I. Gender
Female 109 50.9
Male 102 47.7
n/a 3 1.4
II. Education
SSS 52 24.3
VSS 108 50.5
Master 46 21.5
PhD 4 1.9
n/a 4 1.9
III. Age
below 25 36 16.8
from 25 to 34 104 48.6
from 35 to 44 31 14.5
from 45 to 54 29 13.6
from 55 to 64 10 4.7
Over 64 1 0.5
n/a 3 1.4
4.2. Research instrument
As already mentioned, the items are adapted from Ab Hamid, Cheng and Akhir (2011) and
Falkenreck and Wagner (2011) for innovativeness. All dimensions are first order reflective
constructs.
Table 2. CFA results
Construct/Item Standard.
factor loading t-value
I. Website satisfaction
My bank allows me to get information easily with a few clicks on its website. 0.911 -
On the bank's website, the links are clearly indicated. 0.868 18.580
I am satisfied with the content and what my bank's website offers. 0.874 18.859
II. Personalization level
My bank keeps a database of my transactions with them. 0.729 -
I receive online advertisements that match my interests. 0.685 9.536
Products/services can be custom-made based on my specification. 0.804 11.175
I receive a personalized email from the bank on products. 0.828 11.490
III. Trust
My bank has clearly defined terms of privacy. 0.827 -
My bank’s customer support department is reliable. 0.915 17.022
My bank applies high-security standards for all my transactional data. 0.928 17.361
IV. Channel integration
The bank allows me that services for which I submit online requests can easily be
used at the nearest branch office. 0.929 -
The bank allows me to cancel the products for which I have decided
electronically in the nearest office. 0.808 13.763
V. Perceived innovativeness

147
My bank is leading the market in terms of its services. 0.874 -
My bank constantly changes and improves the services it offers. 0.925 19.561
My bank's credit services are innovative. 0.860 17.011
My bank's online services are innovative. 0.868 17.322
5. Data analysis and research findings
Data collected by the questionnaire survey were analyzed in several steps. First, a
confirmatory factor analysis (CFA) was used to verify the reliability and validity of the
measurement models. Finally, the structural equation modeling (SEM) is used for hypotheses
testing. We used following indices for model fit: χ2, root-mean-square-error (RMSEA),
normed-fit index (NFI), and comparative-fit index (CFI) (Hair et al., 2014).
Table 3. CR, AVE and α values for measurement models
Dimensions CR AVE α
Website (WS) 0.915 0.782 0.914
Personalization level (PL) 0.848 0.583 0.838
Trust (TR) 0.920 0.794 0.918
Channel integration (CI) 0.862 0.758 0.857
Perceived innovativeness (PI) 0.933 0.778 0.932
Table 2 presents the results of CFA. As shown, all indicators loaded high (>0.5) on their
respective constructs. Also, the fit indices of the measurement model were all within the
normally specified thresholds. Composite reliability (CR), as shown in Table 3 for each
construct was greater than 0.7, and the average variance extracted (AVE) for each construct
was above 0.5. First of all, Crombach’s alpha test for reliability ranges from 0.857 to 0.932,
which is way above the threshold value recommended by Hair et al. (2014). The Cronbach
alpha values were greater than the correlations between the respective constructs and other
latent constructs (Hair et al., 2010). These results provide evidence of reliability, convergent
validity, and discriminant validity of the measures.
5.1. Model fit and hypotheses testing
This paper performs structural equation modeling (SEM) to test the hypotheses, using Lisrel
8.8 and maximum likelihood estimation techniques to test the model. First, the results
presented in Table 4 show that the model can be accepted. As shown in Table 5, the results
provide strong support for H2 and H4 as indicated by the significant positive coefficients of
personalization on perceived innovativeness (β=0.605, p<0.01) and channel integration on
perceived innovativeness (β=0.316, p<0.01). This suggests that higher customer's satisfaction
with the personalization of the bank's services leads to greater perceived innovativeness. In the
same way, higher customer’s satisfaction with the integration of online and physical services
leads to greater perceived innovativeness.
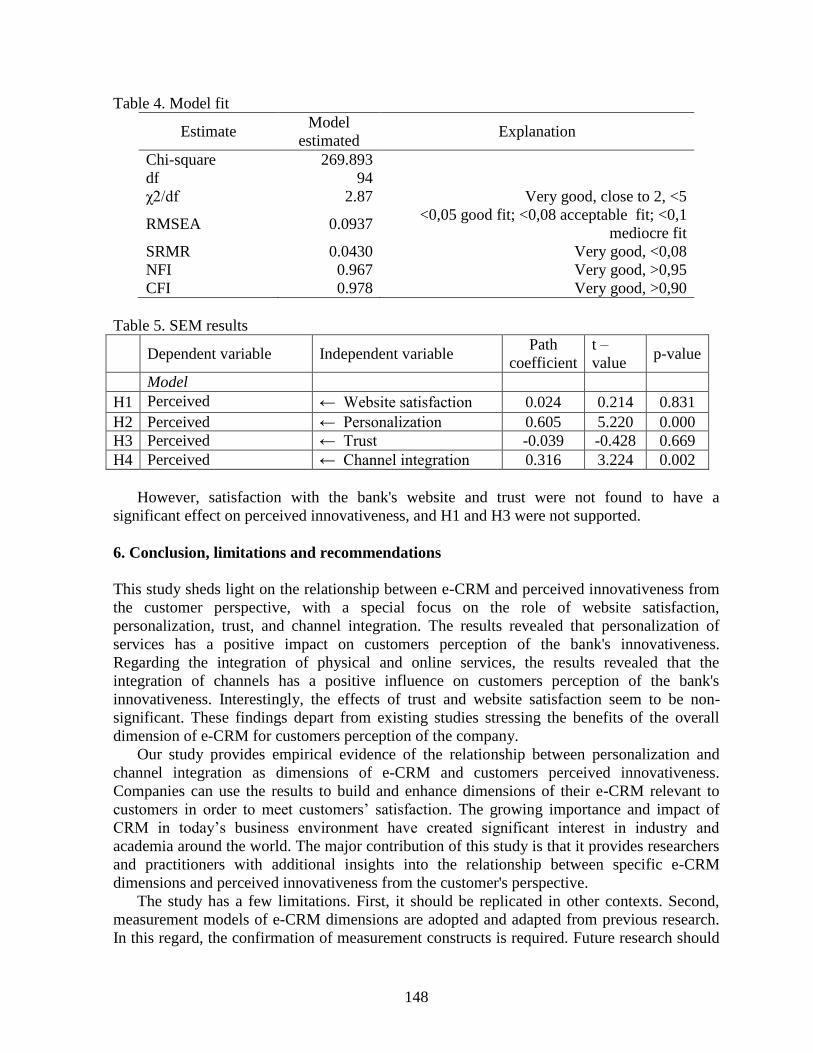
148
Table 4. Model fit
Estimate Model
estimated Explanation
Chi-square 269.893
df 94
χ2/df 2.87 Very good, close to 2, <5
RMSEA 0.0937 <0,05 good fit; <0,08 acceptable fit; <0,1
mediocre fit
SRMR 0.0430 Very good, <0,08
NFI 0.967 Very good, >0,95
CFI 0.978 Very good, >0,90
Table 5. SEM results
Dependent variable Independent variable Path
coefficient
t –
value p-value
Model
H1 Perceived
innovativeness ← Website satisfaction 0.024 0.214 0.831
H2 Perceived
innovativeness
← Personalization 0.605 5.220 0.000
H3 Perceived
innovativeness
← Trust -0.039 -0.428 0.669
H4 Perceived
innovativeness
← Channel integration 0.316 3.224 0.002
However, satisfaction with the bank's website and trust were not found to have a
significant effect on perceived innovativeness, and H1 and H3 were not supported.
6. Conclusion, limitations and recommendations
This study sheds light on the relationship between e-CRM and perceived innovativeness from
the customer perspective, with a special focus on the role of website satisfaction,
personalization, trust, and channel integration. The results revealed that personalization of
services has a positive impact on customers perception of the bank's innovativeness.
Regarding the integration of physical and online services, the results revealed that the
integration of channels has a positive influence on customers perception of the bank's
innovativeness. Interestingly, the effects of trust and website satisfaction seem to be non-
significant. These findings depart from existing studies stressing the benefits of the overall
dimension of e-CRM for customers perception of the company.
Our study provides empirical evidence of the relationship between personalization and
channel integration as dimensions of e-CRM and customers perceived innovativeness.
Companies can use the results to build and enhance dimensions of their e-CRM relevant to
customers in order to meet customers’ satisfaction. The growing importance and impact of
CRM in today’s business environment have created significant interest in industry and
academia around the world. The major contribution of this study is that it provides researchers
and practitioners with additional insights into the relationship between specific e-CRM
dimensions and perceived innovativeness from the customer's perspective.
The study has a few limitations. First, it should be replicated in other contexts. Second,
measurement models of e-CRM dimensions are adopted and adapted from previous research.
In this regard, the confirmation of measurement constructs is required. Future research should
149
explore alternative approaches to conceptualizing e-CRM. Finally, sampling was not random,
but convenient what has to be taken into account when generalizing the findings of the study.
References
Ab Hamid, N., Cheng, A. and Akhir, R. (2011) ‘Dimensions of E-CRM: An Empirical Study
on Hotels’ Web Sites’, The Journal of Southeast Asian Research, 2011, pp. 1–15. doi:
10.5171/2011.820820.
Anselmsson, J. and Johansson, U. (2009) ‘Retailer brands and the impact on innovativeness in
the grocery market’, Journal of Marketing Management, 25(1–2), pp. 75–95. doi:
10.1362/026725709X410043.
Berg, S. (1988) Snowball sampling—I, Encyclopedia of statistical sciences. Edited by S. Kotz
et al. Wiley online library.
Dalir, M. et al. (2017) ‘International Academic Journal of Organizational Behavior and
Human Resource Management International Academic Institute for Science and
Technology The Role of e-CRM in the Quality of Customer-Bank Relationship’,
International Academic Journal of Organizational Behavior and Human Resource
Management, 4(2), pp. 12–22. Available at: www.iaiest.com.
Falkenreck, C. and Wagner, R. (2011) ‘The impact of perceived innovativeness on
maintaining a buyer-seller relationship in health care markets: A cross-cultural study’,
Journal of Marketing Management, 27(3–4), pp. 225–242. doi:
10.1080/0267257X.2011.545672.
Feinberg, R. and Kadam, R. (2002) ‘e-CRM Web service attributes as determinants of
customer satisfaction with retail Web sites’, International Journal of Service Industry
Management, 13(5), pp. 432–451. doi: 10.1108/09564230210447922.
Fjermestad, J. and Romano, N. C. (2003) ‘Electronic customer relationship management:
Revisiting the general principles of usability and resistance – an integrative
implementation framework’, Business Process Management Journal, 9(5), pp. 572–591.
doi: 10.1108/14637150310496695.
Hair, J. F. et al. (2014) Multivariate Data Analysis. Seventh ed, Prentice-Hall, Inc. Seventh
ed. Pearson Education Limited 2014. doi: 10.1038/259433b0.
Hair, J. F. J. et al. (2010) Multivariate Data Analysis. 7th editio. Pearson Prentice Hall.
Harrigan, P. and Miles, M. (2014) ‘From e-CRM to s-CRM. Critical factors underpinning the
social CRM activities of SMEs’, Small Enterprise Research, 21(1), pp. 99–116. doi:
10.1080/13215906.2014.11082079.
Kim, D. et al. (2011) ‘The innovativeness of Born-Globals and customer orientation: Learning
from Indian Born-Globals’, Journal of Business Research. Elsevier Inc., 64(8), pp. 879–
886. doi: 10.1016/j.jbusres.2010.09.008.
Kimiloǧlu, H. and Zarali, H. (2009) ‘What signifies success in e-CRM?’, Marketing
Intelligence and Planning, 27(2), pp. 246–267. doi: 10.1108/02634500910945011.
Lee-Kelley, L., Gilbert, D. and Mannicom, R. (2003) ‘How e-CRM can enhance customer
loyalty’, Marketing Intelligence & Planning, 21(4), pp. 239–248. doi:
10.1108/02634500310480121.
Mulligan, P. and Gordon, S. R. (2002) ‘The impact of information technology on customer
and supplier relationships in the financial services’, International Journal of Service
Industry Management, 13(1), pp. 29–46. doi: 10.1108/09564230210421146.
O’Cass, A. and Carlson, J. (2012) ‘An e-retailing assessment of perceived website-service

150
innovativeness: Implications for website quality evaluations, trust, loyalty and word of
mouth’, Australasian Marketing Journal, 20(1), pp. 28–36. doi:
10.1016/j.ausmj.2011.10.012.
Yu, X. et al. (2015) ‘Electronic CRM and perceptions of unfairness’, Information Technology
and Management, 16(4), pp. 351–362. doi: 10.1007/s10799-014-0210-4.

151
A REVIEW OF FISCAL INCENTIVES FOR RENEWABLE ENERGY IN
EUROPEAN UNION MEMBER STATES
Sabina Hodzic
University of Rijeka, Faculty of Tourism and Hospitality Management/Assistant Professor at
the Department of Public Finance
Primorska 42, POB 97, Ika, 51410 Opatija, Croatia
Phone: +38551294702; Fax: +38551292945
E-mail: [email protected]
Adis Muharemovic
University of Bihac, Faculty of Economics/Senior Assistant at the Department of Finance and
Accounting
Pape Ivana Pavla II 1/2, 77000 Bihac, Bosnia and Herzegovina
Phone: +38737222511; Fax: +38737222513
E-mail: [email protected]
Ema Cankovic
University of Rijeka, Faculty of Tourism and Hospitality Management
Primorska 42, POB 97, Ika, 51410 Opatija, Croatia
E-mail: [email protected]
Abstract
In the past few years, changes in renewable energy markets, investments, industries and
policies have been very rapid. The potential of renewable energy resources is enormous since
they account for approximately 15 to 20 percent of the world's total energy supply. The
objectives of using renewable energy include reduction of CO2 emissions, protection of the
environment, improvement in human health and the quality of the physical environment, the
creation of a sustainable supply chain for improved and clean energy technologies and its
contributions to the environmental aspects of sustainability. The main objective of this paper is
to give an overview of current fiscal incentives for renewable energy, as well as the
advantages and disadvantages of renewable energy sources. We also conducted a linear
regression analysis to investigate the relationship between the primary production of
renewable energy and gross domestic product per capita at market prices in European Union
member states in the 2006-2015 period. Based upon this analysis, we conclude that there is a
positive statistical relationship between the primary production of renewable energy and gross
domestic product per capita at market prices in European Union member states in the 2006-
2015 period. The average share of renewable energy in gross final energy consumption in
European Union member states in the 2006-2015 period was 13.2 percent. By observing
renewable energy finance flows we found that the United Kingdom, Belgium and Germany
had very high investments in renewable energy in the 2014-2016 period. Using a comparative
analysis and an empirical approach, our contribution consists of analyzing and presenting
fiscal incentives for renewable energy in the European Union member states where they are
the most used, in order to achieve renewable energy development.
Keywords: fiscal incentives, renewable energy, investment, European Union
JEL classification: H23, Q20
152
1. Introduction
While raising awareness of climate change and the ways in which environment can be
harmed, most countries are trying to find alternative ways of energy consumption. One alternative is
renewable energy. This type of energy and its implementation does not cause human health issues
and contributes to creating a friendlier environment. While emphasizing the importance of
renewable energy in the production and consumption of energy, the European Union stimulates its
member states to apply different financial and fiscal incentives. Financial and fiscal instruments for
supporting investments in renewable energy include capital subsidies or grants; investment or
production tax credits; reduction in sales, energy, CO2, value added tax or other taxes; energy
production payment and public investments, loans or grants. Renewable energy produces little to no
waste and allows for limited use of fossil fuels in the future. The various types of renewable energy
sources comprise solar energy, wind energy, hydropower, energy produced from biomass,
geothermal energy and ocean energy. Every member state is responsible for achieving a certain level
of renewable energy consumption in compliance with their laws, regulations and directives. Great
potential also lies in local and regional development incentives. Gan and Smith (2011) explored key
factors that may have brought about the differences among OECD countries in renewable energy
shares in the total primary energy supply. By applying a panel data model, they found that only
market deployment policies and gross domestic product (GDP) per capita had a statistically
significant effect on the supply of renewable energy. Johnstone, Hascic and Popp (2010) examined
the effects of public policies on innovation in the renewable energy sector in a cross-section of
OECD countries over the period 1978-2003. They found that public policy plays a significant role in
determining patent applications. Menz and Vachon (2006) and Carley (2009) studied renewable
investment in the USA by applying the panel regression method. Moreover, authors (Koengkan,
2017; Curtin et al. 2017; Servert et al. 2014; Smith and Urpelainen, 2014) investigated the impact of
fiscal incentive policies on the installed capacity of renewable energy.
The main objective of this paper is to give an overview of current fiscal incentives for
renewable energy, as well as the advantages and disadvantages of renewable energy sources.
We also conducted a regression analysis between the primary production of renewable energy
and gross domestic product per capita at market prices in European Union member states in
the 2006-2015 period. Using a comparative analysis and an empirical approach, our
contribution consists of analyzing and presenting the most frequently applied fiscal incentives
for renewable energy in EU-28, trend of renewable energy finance flows in the 2014-2016
period as well as causal relationship with gross domestic product per capita. The paper is
structured as follows. After the introduction, Section 2 describes the importance and the
characteristics of renewable energy and provides a comparative analysis of fiscal incentives
related to renewable energy. The causal relationship between the primary production of
renewable energy and gross domestic product is presented in Section 3. Finally, the last
Section provides an overview and a conclusion.
2. The Importance and the Characteristics of Renewable Energy
Renewable energy sources in today’s world represent a huge potential for responsible use of
energy in the future. According to Directive 2001/77/EC and Directive 2009/28/EC, the
European Union legislation identifies the following renewable energy sources: wind, solar,
geothermal, wave, tidal, hydropower, biomass, landfill gas, sewage treatment plant gas and
biogases. The development of this type of energy is important for several reasons such as
decreasing CO2 emissions in the atmosphere, increasing the share of renewable energy

153
consumption to achieve energy sustainability, maintaining a safer energy supply in order to
reduce electric power consumption and the import of raw energy materials, and making the
share of renewable energy on the market more cost-effective and competitive in the long run.
To increase investment in renewable energy and to achieve renewable energy development
goals, policymakers need to improve investment conditions across all European Union
markets. The following steps should be taken to achieve this:
Designing coherent and targeted investment incentives such as feed-in tariffs,
renewable certificates and public tenders;
Making the renewable energy investment environment more attractive and business-
friendly (especially solar and wind energy sectors); and
Ensuring that the broader investment environment does not work against climate
change mitigation actions.
A study conducted by the International Energy Agency (2006) lists three generations of
renewable energy technologies:
First-generation technologies which have already reached maturity, such as
hydropower, biomass combustion, and geothermal energy;
Second-generation technologies which are undergoing rapid development such as solar
energy, wind power, and modern forms of bio-energy; and
Third-generation technologies which are presently in developmental stages such as
concentrating solar power, ocean energy, improved geothermal, and integrated bio-
energy systems.
All three generations of renewable energy technologies are not equally developed. The future
of first-generation technologies depends on exploiting remaining resources, and overcoming
challenges related to the environment and social acceptance. Support of research, development
and demonstration is very important for second-generation technologies, especially their
commercial viability. Third-generation technologies are on the horizon but still depend on
attracting sufficient attention and research, development and demonstration funding. While
renewable energy sources are abundant, they also have both advantages and disadvantages.
Table 1 displays the main advantages and disadvantages of renewable energy sources.
Table 1. Advantages and Disadvantages of Renewable Energy Sources
ADVANTAGES DISADVANTAGES
Reducing dependence on conventional energy sources
such as oil, natural gas, coal etc.
Very high capital cost of conversion equipment for
renewable energy such as solar, wind and tide energy
Inexhaustible sources of energy (sun, wind, rivers,
organic matter etc.)
Solar power is dependent on sunlight availability
Low operating costs which are not influenced by
fluctuations on international markets
Wind and solar energy generation facilities need to be
spread out on large surfaces
Significant new job creation
Wind and tidal power generation facilities can only be
located in places with suitable wind and tidal
conditions
Maintaining natural resources in the long term Susceptibility to political manipulation
Creating the most ecologically sound solution for
efficient reduction of carbon dioxide emissions and
combating the greenhouse effect
Difficult to access for many people and companies
Source: Authors' systematization.

154
Based on Table 1, we can conclude that despite certain disadvantages, there is great need for
economic and policy mechanisms which would support sustainable markets for renewable
energy systems in the European Union. Akella, Saini and Sharma (2009) found that the social
benefits of renewable energy systems include improved health, broader consumer choice,
greater self-reliance, improved work opportunities and technological advances. On the other
side, Painuly (2001) found that market imperfections and various economic, financial,
institutional, technical, social, cultural, behavioral and other distortions form the main
hindrances to renewable energy development.
The share of renewable sources in gross final consumption of energy increased in 15 of the 28
member states in 2015. The main goal of the Europe 2020 strategy is making sure that energy
obtained from renewable sources comprises 20% of the gross final consumption of energy by
2020, and at least 27% by 2030. The average share of energy from renewable sources in 28
European Union member states in the 2004-2016 period is summarized in Figure 1.
Figure 1. The Average Share of Energy from Renewable Sources in EU-28 Member States
Source: Author's calculation based on Eurostat data on renewable energy.
Figure 1 shows that the highest average shares of energy from renewable sources in EU-28
member states were recorded in Sweden (48%), Latvia (34%), Finland (33%) and Croatia
(25%), while the lowest are in Malta (2%), Luxembourg (3%), the United Kingdom and
Netherlands (4%). Eleven EU-28 member states have already reached the level required to
meet their national 2020 targets. These are Bulgaria, the Czech Republic, Denmark, Estonia,
Croatia, Italy, Lithuania, Hungary, Romania, Finland and Sweden.
Figure 2 displays asset finance investment in renewable energy in 2014-2016 ($ BN).

155
Figure 2. Asset Finance Investment in Renewable Energy in 2014-2016 ($ BN)
Source: Global Trends in Renewable Energy Investment, 2017.
Based on Figure 2, we conclude that asset finance investment decreased in 2016 in all regions.
Several reasons account for this. The most important ones are lower dollar-denominated costs,
inappropriate timing and slowdown in activity caused by dollar-denominated costs which
affected some key markets such as the Chinese one. Besides global trends in renewable energy
investments, we also analyzed the trend in renewable energy finance flows which covers
investments linked to renewable energy project assets in USD million for the 2014-2016
period (Figure 3).
Figure 3. Trend in Renewable Energy Finance Flows in USD million in the 2014-2016 Period
0,0
500,0
1000,0
1500,0
2000,0
2500,0
2014 2015 2016
Source: IRENA (2018), Renewable Energy Statistics.
From the data in Figure 3, we can conclude that the most significant trend in renewable energy
finance investment among European Union member states was recorded in the United

156
Kingdom, Belgium and Germany. Due to lack of data, we included only following member
states.
Many financial institutions in the European Union provide financial support for renewable
energy sources. Among these are the International Finance Corporation, International Bank for
Reconstruction and Development, International Development Association, European
Investment Bank, European Central Bank and others. For example, the European Investment
Bank invested between 0.5 (2006) and 2.8 (2009) billions of EUR in renewable energy
sources. Renewable energy projects in the European Union financed by the European
Investment Bank in the 2010-2017 period are presented in Table 2.
Table 2. Renewable Energy Projects in the European Union Financed by the European
Investment Bank in the 2010-2017 Period Project name Region Country Sector Year Amount (EUR)
EOLICAS DE
PORTUGAL SFF I EU Portugal Energy 2010 8,691,551.45
ENERGY EFFIC &
RENEWABLES
BARCELONA
EU Spain Energy 2010 125,000,000.00
SE POWER PLANT AND
FOREST INDUSTRY
R&D
EU Poland Energy 2010 18,369,000.00
SAPEI HIGH VOLTAGE
CABLE LINK EU Italy Energy 2010 73,000,000.00
CEZ PHOTOVOLTAIC
POWER INVESTMENTS EU Czech Republic Energy 2011 80,000,000.00
TOUL CCGT POWER
PLANT EU France Energy 2011 165,000,000.00
ZELIOS - PV PLANTS -
FRANCE ITALY EU Italy Energy 2011 50,000,000.00
ENBW WPD OFFSHORE
WIND - BALTIC I EU Germany Energy 2011 80,000,000.00
IMWIND WIND POWER EU Austria Energy 2012 35,000,000.00
INELFE
INTERCONNEXION
FRANCE - ESPAGNE
EU France Energy 2012 75,000,000.00
TOSCANA ENERGIA
GAS & SOLAR EU Italy Energy 2012 70,000,000.00
SHE TRANSMISSION
UPGRADE -
RENEWABLES
EU United Kingdom Energy 2013 173,812,282.73
WWU 2013-16 GAS
DISTRIBUTION EU United Kingdom Energy 2014 201,181,943.92
NORTHERN GAS
NETWORKS 2014-17
(RIIO-1 PHASE I)
EU United Kingdom Energy 2015 202,675,314.15
BEATRICE OFFSHORE EU United Kingdom Energy 2016 389,569,914.81
NORDLINK HVDC
PROJECT EU Germany Energy 2017 350,000,000.00
TOTAL 63,384,468,436.78
Source: European Investment Bank, http://www.eib.europa.eu/projects/loan/list/
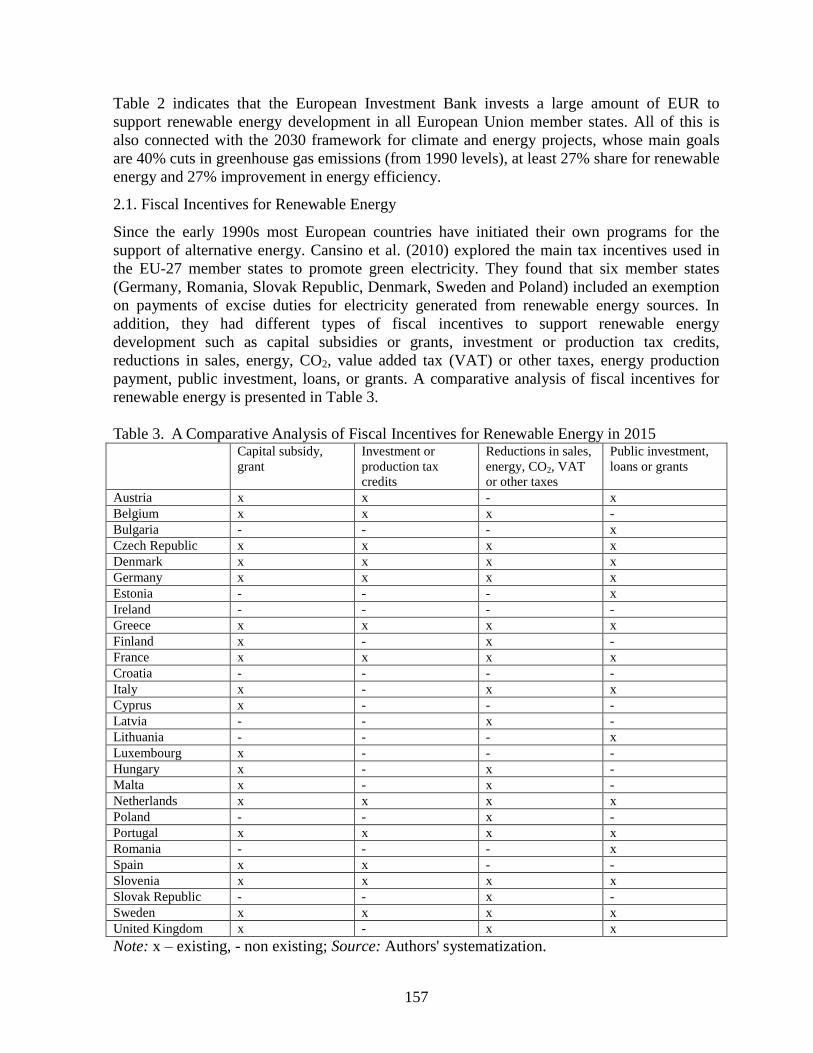
157
Table 2 indicates that the European Investment Bank invests a large amount of EUR to
support renewable energy development in all European Union member states. All of this is
also connected with the 2030 framework for climate and energy projects, whose main goals
are 40% cuts in greenhouse gas emissions (from 1990 levels), at least 27% share for renewable
energy and 27% improvement in energy efficiency.
2.1. Fiscal Incentives for Renewable Energy
Since the early 1990s most European countries have initiated their own programs for the
support of alternative energy. Cansino et al. (2010) explored the main tax incentives used in
the EU-27 member states to promote green electricity. They found that six member states
(Germany, Romania, Slovak Republic, Denmark, Sweden and Poland) included an exemption
on payments of excise duties for electricity generated from renewable energy sources. In
addition, they had different types of fiscal incentives to support renewable energy
development such as capital subsidies or grants, investment or production tax credits,
reductions in sales, energy, CO2, value added tax (VAT) or other taxes, energy production
payment, public investment, loans, or grants. A comparative analysis of fiscal incentives for
renewable energy is presented in Table 3.
Table 3. A Comparative Analysis of Fiscal Incentives for Renewable Energy in 2015 Capital subsidy,
grant
Investment or
production tax
credits
Reductions in sales,
energy, CO2, VAT
or other taxes
Public investment,
loans or grants
Austria x x - x
Belgium x x x -
Bulgaria - - - x
Czech Republic x x x x
Denmark x x x x
Germany x x x x
Estonia - - - x
Ireland - - - -
Greece x x x x
Finland x - x -
France x x x x
Croatia - - - -
Italy x - x x
Cyprus x - - -
Latvia - - x -
Lithuania - - - x
Luxembourg x - - -
Hungary x - x -
Malta x - x -
Netherlands x x x x
Poland - - x -
Portugal x x x x
Romania - - - x
Spain x x - -
Slovenia x x x x
Slovak Republic - - x -
Sweden x x x x
United Kingdom x - x x
Note: x – existing, - non existing; Source: Authors' systematization.

158
Table 3 shows that the countries with the highest number of fiscal incentives are the Czech
Republic, Denmark, Germany, Greece, France, Netherlands, Portugal, Slovenia and Sweden.
Ireland and Croatia are the only ones that do not provide any type of fiscal incentives for
renewable energy.
Ogunlana and Goryunova (2016) found that different measures of tax systems to stimulate
investment in alternative energy are also intended to achieve the effect of stimulating high-risk
investment in energy facilities with a long payback period. Moreover, Curtin et al. (2017)
examined the impact of technology-specific economic and financial incentives for the
promotion of higher level investment in low-carbon technologies from local citizen investors.
They found that "feed-in tariffs, grants and tax incentives can be successful in mobilising
greater levels of investment from local citizen investors, but soft loans tend to be less effective
as a stand-alone instrument" (2017: 534).
3. Relationship between the Primary Production of Renewable Energy and Gross
Domestic Product in European Union Member States
In order to obtain meaningful results, we used annual Eurostat datasets for the EU-28 member
states for the 2006-2015 period. By applying the linear regression method, we investigated the
causal relationship between the primary production of renewable energy and gross domestic
product per capita at market prices in European Union member states in the 2006-2015 period.
The primary production of renewable energy shows how much renewable energy was
produced from biomass, hydropower, geothermal energy, wind and solar energy in the EU-28
member states in total for the 2006-2015 period, while the gross domestic product (GDP) at
market prices is the final result of the production activity of resident producer units. It is
defined as the value of all goods and services produced minus the value of any goods or
services used in their creation.
Our assumption is that by increasing production of renewable energy via fiscal incentives,
gross domestic product, as an indicator of economic growth, will also increase. Since we
cannot quantify fiscal incentives by number and each country’s national legislation prescribes
their own incentives, we used publicly available data, such as primary production of
renewable energy as evidence of the application of this type of fiscal incentives. Our
assumption is that those member states which offer more fiscal incentives for renewable
energy will be characterized by greater primary production of renewable energy and that this
will cause economic growth, measured by gross domestic product.
Figure 4 presents the results of the significant positive relationship between the primary
production of renewable energy and gross domestic product per capita at market prices in EU-
28 in the 2006-2015 period.
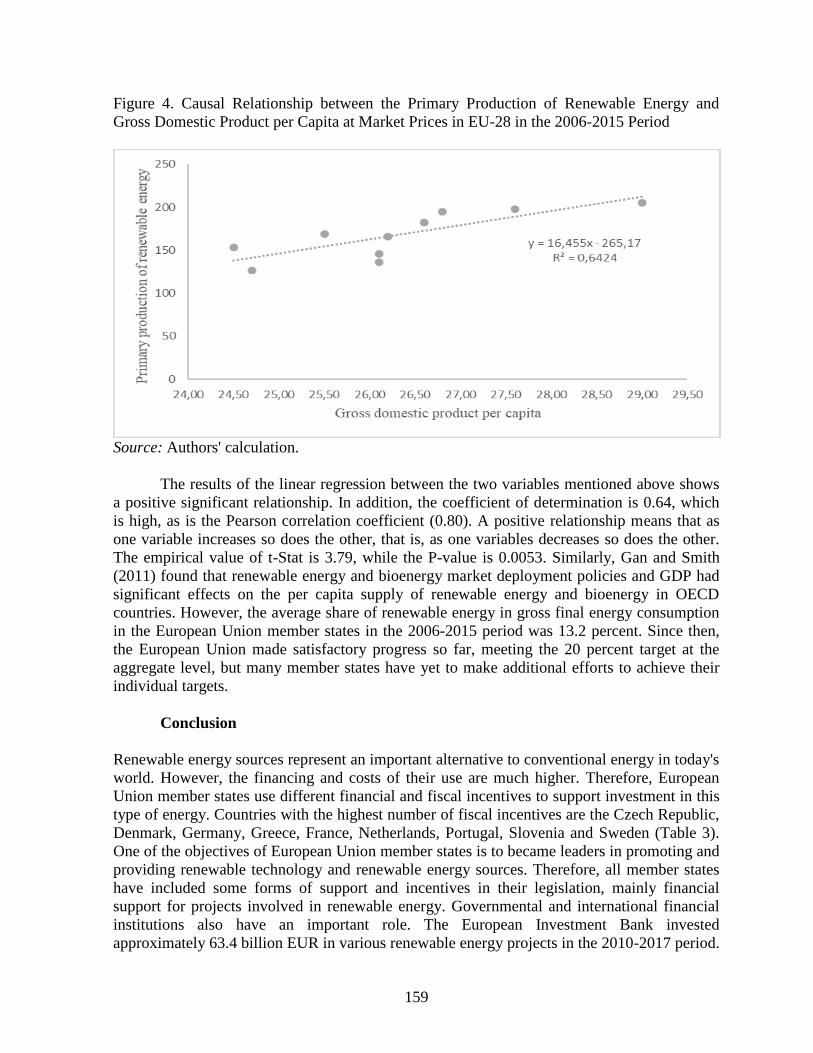
159
Figure 4. Causal Relationship between the Primary Production of Renewable Energy and
Gross Domestic Product per Capita at Market Prices in EU-28 in the 2006-2015 Period
Source: Authors' calculation.
The results of the linear regression between the two variables mentioned above shows
a positive significant relationship. In addition, the coefficient of determination is 0.64, which
is high, as is the Pearson correlation coefficient (0.80). A positive relationship means that as
one variable increases so does the other, that is, as one variables decreases so does the other.
The empirical value of t-Stat is 3.79, while the P-value is 0.0053. Similarly, Gan and Smith
(2011) found that renewable energy and bioenergy market deployment policies and GDP had
significant effects on the per capita supply of renewable energy and bioenergy in OECD
countries. However, the average share of renewable energy in gross final energy consumption
in the European Union member states in the 2006-2015 period was 13.2 percent. Since then,
the European Union made satisfactory progress so far, meeting the 20 percent target at the
aggregate level, but many member states have yet to make additional efforts to achieve their
individual targets.
Conclusion
Renewable energy sources represent an important alternative to conventional energy in today's
world. However, the financing and costs of their use are much higher. Therefore, European
Union member states use different financial and fiscal incentives to support investment in this
type of energy. Countries with the highest number of fiscal incentives are the Czech Republic,
Denmark, Germany, Greece, France, Netherlands, Portugal, Slovenia and Sweden (Table 3).
One of the objectives of European Union member states is to became leaders in promoting and
providing renewable technology and renewable energy sources. Therefore, all member states
have included some forms of support and incentives in their legislation, mainly financial
support for projects involved in renewable energy. Governmental and international financial
institutions also have an important role. The European Investment Bank invested
approximately 63.4 billion EUR in various renewable energy projects in the 2010-2017 period.

160
The global perspective shows that the number of financed renewable energy projects is
constantly increasing, especially in China. European Union member states have different
directives, laws and regulations connected with investment support in renewable energy. The
European Union’s basic energy efficiency goals are presented in the Energy Roadmap 2050
study. One of these goals is to reduce CO2 emissions by 80% till 2050. Therefore, Hodzic and
Arnautovic (2017) consider that the main impact factors for achieving this level of CO2
emission reduction include technological development, technical solutions for nuclear energy,
fossil fuel energy, renewable energy, transport, and information and communication
technology.
Our empirical analysis showed that the causal relationship between the primary
production of renewable energy and gross domestic product per capita at market prices in EU-
28 in the 2006-2015 period is positive and statistically significant. In addition, the Pearson
correlation coefficient showed a high positive value (0.80). This analysis demonstrates that
European Union member states using fiscal incentives will produce more renewable energy,
which will stimulate economic growth in corresponding ways. On the other hand, due to lack
of data and difficulties in quantifying fiscal incentives by number, we were unable to conduct
a more detailed analysis. These were the limits of our research. Recommendations for further
research include conducting an empirical analysis comparing European Union member states
by including a greater number of variables, for a longer time period by applying panel data
analysis.
References
Akella, A.K., Saini, R.P., & Sharma, M.P. 2009. Social, economical and environmental
impacts of renewable energy systems. Renewable Energy, 34: 390-396.
Cansino, J.M., Pablo-Romero, M.P., Román, R., & Yniguez, R. 2010. Tax incentives to
promote green electricity: An overview of EU-27 countries. Energy Policy, 38: 6000-
6008.
Carley, S. 2009. State renewable energy electricity policies: an empirical evaluation of
effectiveness. Energy Policy, 37: 3071-3081.
Curtin, J., McInerney, C., & Gallachόir, B.O. 2017. Financial incentives to mobilise local
citizens as investor in low-carbon technologies: A systematic literature review.
Renewable and Sustainable Energy Reviews, 75: 534-547. doi:
10.1016/j.rser.2016.11.020
European Investment Bank, http://www.eib.europa.eu/projects/loan/list/ Accessed 25 March
2017.
Eurostat. 2017. Energy from renewable resources.
http://ec.europa.eu/eurostat/web/energy/data/shares Accesses 3 March 2017.
Gan, J., & Smith, C.T. 2011. Drivers for renewable energy: A comparison among OECD
countries. Biomass and Bioenergy, 35: 4497-4503.
Global Trends in Renewable Energy Investment. 2017. Frankfurt School of Finance and
Management, Germany.
Hodzic, S., & Arnautovic, S. 2017. Perspektiva ekoloskih poreza u Europskoj uniji. In: Blazic,
H., Dimitric, M., & Pecaric, M. Financije na prekretnici: Imamo li snage za iskorak?,
Ekonomski fakultet Rijeka.
International Energy Agency. 2006. Renewable energy: RD&D priorities, insights from the
IEA technology programmes. IEA. Paris.

161
International Renewable Energy Agency (IRENA). 2018. Renewable Energy Statistics 2018.
The International Renewable Energy Agency, Abu Dhabi, United Arab Emirates.
Johnstone, N., Hascic, I., & Popp, D. 2010. Renewable Energy Policies and Technological
Innovation: Evidence Based on Patent Counts. Environmental and Resource
Economics, 45: 133-155.
Koengkan, M. 2017. Do fiscal incentive policies impact the installed capacity of renewable
energy? An empirical evidence from Latin American countries. Revista de Estudos
Sociais, 39(20): 66-87.
Menz, F., & Vachon, S. 2006. The role of social, political and economic interests in promoting
state green electricity policies. Environmental Science and Policy, 9: 652-662.
Official Journal of the European Communities. Directive 2001/77/EC on the promotion of
electricity produced from renewable energy sources in the internal electricity market. L
283/33.
Official Journal of the European Communities. Directive 2009/28/EC on the promotion of the
use of energy from renewable sources. L 140/16.
Ogunlana, A. O., & Goryunova, N. N. 2016. Tax Incentives for Renewable Energy: The
European Experience. The European Proceedings of Social and Behavioural Sciences.
eISSN: 2357-1330, 507-513.
Painuly, J.P. 2001. Barriers to renewable energy penetration: a framework for analysis.
Renewable Energy, 24: 73-89.
Servert, J.F., Cerrajero, E., Fuentealba, E., & Cortes, M. 2014. Assessment of the impact of
financial and fiscal incentives for the development of utility-scale solar energy projects
in northern Chile. Energy Procedia, 49: 1885-1895.
Smith, M.G. & Urpelainen, J. 2014. The Effect of Feed-in Tariffs on Renewable Electricity
Generation: An Instrumental Variables Approach. Environmental and Resource
Economics, 57(3): 367-392.

162
HEALTH TOURISM IN THE EUROPEAN UNION: FINANCIAL EFFECTS AND
FUTURE PROSPECTS
Sabina Hodzic
University of Rijeka, Faculty of Tourism and Hospitality Management
Primorska 42, POB 97, Ika, 51410 Opatija, Croatia
Tel: +385 51 294 702
E-mail: [email protected]
Hana Paleka
University of Rijeka, Faculty of Tourism and Hospitality Management
Primorska 42, POB 97, Ika, 51410 Opatija, Croatia
Tel: +385 51 294 703
E-mail: [email protected]
Abstract
As a specific branch of tourism, health tourism has rapidly grown into a highly developed
industry providing customers with medical, dental or surgical care while on holiday. All of the
above requires tangible products, services and value, such as improvement in health, illness
prevention and recovery after a serious affliction. Three forms of health tourism were
identified based on a review of relevant literature: medical, wellness and spa, which can be
further divided into the following parallel sections: illness-health-wellness and curative-
preventative-promotive. In 2014, the European Union market witnessed an estimated 56.0
million of domestic arrivals and 5.1 million of international arrivals for the purpose of health
tourism. The objective of this paper is to present the financial effects of health tourism
revenues on the European Union market. In addition, we present the results of a SWOT
analysis of health tourism in the European Union. Based on the data analyzed, we believe that
governments should play a significant role in fostering sustainable development of this
specific branch of tourism and attracting more health tourists from various countries
worldwide. In order to achieve that, European Union member state governments should
improve all types of infrastructure facilities, including road access, electricity and water
supply along with air traffic, safety and accommodation. All of these objectives can be
achieved through grants, subsidies and loans, not only from governments but from
international financial institutions as well.
Keywords: health tourism, government, revenues, European Union, SWOT analysis
JEL classification: I11, H51, Z33
1. Introduction
Tourism, as one of the most dynamic and competitive industries, requires the very special
ability to constantly adapt to customers' diverse and changing needs and desires. This naturally
arises from the fact that the customer’s experience, satisfaction as well as safety are the focus
of the tourism industry. Customers enter the world’s dynamic market with different motives
for travelling. These include fun, work, sightseeing, active or leisure time and health.

163
Literature provides strong evidence of a long history of travelling for health and
wellness. The famous Baths of Caracalla near Rome were once able to accommodate several
thousand visitors and remained in use for three centuries (until the siege of Rome, 537 AD).
Several well-known cold water bathing spots were used by Greek warriors for exercise
purposes in the past (700 BC), while both steam and mud baths existed in Persia (600 – 300
BC). Today’s health tourists enjoy various treatments ‘inherited’ from the past – for instance,
Ayurvedic practices were used as early as 5000 BC, while Egyptian women in 3000 BC used
many cosmetic products that still exist today. The history of health tourism in Europe has
tended to be based around spas and seawater treatments, mainly owing to large numbers of
thermal and mineral springs and a long coastline. The word spa is thought to have originated
from Latin phrases such as sanitas per aqua (“health from water”) or from the Walloon word
espa for fountain (Smith and Puczkό, 2014).
Consequently, health tourism has long played a key role in the development of
sustainable tourism, placing value on environmental quality, reducing seasonality, adjusting
supply to specific customer demands, and financial growth of individual institutions providing
health tourism services. The main objective of this paper is to present the financial effects of
health tourism on the EU-28 tourism market. In addition, this paper aims to fill a gap in
existing literature on health tourism in the European Union by presenting its main strengths,
weaknesses, opportunities and threats via a SWOT analysis.
The paper is structured as follows. The introduction is followed by a brief review of the
most relevant research in the field of health tourism. Section 3 will describe the concept of
health tourism and its subsectors, while Section 4 will present the analysis of the financial
effects of health tourism in the EU-28, together with its SWOT analysis. In Section 5, we
deliberate on the future potential of health tourism in Europe, followed by final remarks in the
conclusion.
2. Literature Review
Scientific literature contains a wealth of research on health tourism. Due to raising awareness
of health tourism not only in Europe, but also abroad, different themes such as its history
(Connell, 2011; Smith and Puczkό, 2009; Connell, 2011), economics (Connell, 2011; Morgan,
2015; Reisman, 2015) and destinations (Cheung, 2015; Cohen, 2008; Smith and Puczkό, 2009;
White, 2009) have been thoroughly researched and discussed. Despite the broad scope of such
literature, only a few researchers have investigated the financial effects and expenditure of
health tourism (Johnson, Youngquist, Garman, Hohmann and Cieslak, 2015; Loh, 2014; Loh,
2015; Ridderstaat, Singh and DeMicco, 2018).
Authors (see Fetscherin and Stephano, 2016; Smith and Puczkό, 2014) agree that
travelling in search of quality health services and well-being is not a new phenomenon.
According to their research, in its early stages from the 18th to the 20th century, it was mostly
wealthy patients from developing countries who travelled for the above reasons. This trend
began to change in the late 20th century due to the globalization of communication and
transportation technologies, resulting in less affluent people from developed countries
increasingly travelling to developing countries for health tourism in the 21st century.
According to Connell “in the past decade there is a significant attempt to achieve better health
while on holiday, through relaxation, exercise or visits to spas, and it has been taken to a new
level with the emergence of a new and distinct niche in the tourist industry (2006: 1093).”

164
Due to the growth of both health tourism in the world and the turnover of health and
wellness services providers, more researchers (Müller and Kaufmann, 2001; Sekliuckiene and
Langvinienė, 2009) have been focusing on the specifics of health tourism as a tourism
business, its concepts and patterns, the impact of health tourism etc.
As Langvinienė (2014) states, more and more opportunities for the growth of specific
tourism subsectors have emerged, especially wellness and healthcare. Due to this growing
interest, several studies that can be seen as reviews or overviews of health tourism in one way
or another have lately appeared. Carrera and Bridges tried to conceptualize health and medical
tourism, saying that “the health tourism is organized travel outside one's local environment for
the maintenance, enhancement or restoration of an individual's well-being in mind and body
(2006: 449).” Ridderstaat et al. (2018) examined the impact of key inbound visitor markets on
health tourism in the United States in the 1986–2016 period. By applying the microeconomic
elasticity model, they found that overall health tourism spending is affected by long-term
variations in several inbound visitor markets.
3. The Concept of Health Tourism
One of the pioneers of health tourism research, Goodrich (1993), states that the concept of
health-care tourism was developed in the early 1980s. As such, its name changed from
medical tourism to health-care tourism, and ultimately, health tourism. As the concept of
health tourism was becoming more closely defined, more research followed in the United
States and the United Kingdom. According to Goodrich and Goodrich, health tourism may be
defined as “the deliberate attempt on the part of a tourist facility (e.g. hotels) or destination to
attract tourists by promoting healthcare services and facilities in addition to regular tourism
(1987: 217).”
In later years, as the concept of health tourism evolved, the World Tourism
Organisation (WTO) included the following aspects into its definition: medical care, sickness
and well-being, rehabilitation and recuperation. The WTO also states that there is no universal
definition of health tourism, thereby encouraging every country to work out their development
model according to their own definition. Based on Connell’s research, “health tourism as a
niche has emerged and has rapidly grown to become an industry where people travel long
distances to other countries to obtain medical, dental and surgical care while simultaneously
having a holiday. It has grown dramatically in recent years primarily because of the high costs
of treatment in developed Western countries, long waiting lists, the relative affordability of
international air travel, favourable economic exchange rates and the ageing of the often
affluent post-war baby boom generation (2006: 27).”
The most common definition of health tourism nowadays is the one made by Smith and
Puczkó which states that “it comprises those forms of tourism which are centrally focused on
physical health, but which also improve mental and spiritual well-being and increase the
capacity of individuals to satisfy their own needs and function better in their environment and
society (2014: 206).” With this in mind, health tourism can be divided into three subsectors –
medical, wellness and spa tourism. These three components are different, but also overlap.
According to Mainil, Eijgelaar, Klijs, Nawijn, and Peeters, “the three forms of health
tourism reside on two parallel continuums: ‘illness-health-wellness’ and ‘curative-
preventative-promotive’ (2017: 9).” Medical tourism involves people travelling for the sole
purpose of undergoing medical treatments, interventions or therapies. In other words, curing
illnesses is the core of the medical tourism subsector. On the other hand, wellness tourism

165
emphasises prevention and personal well-being. Spa tourism, with the aim of healing,
relaxation or beautifying the body, is located in a sort of middle ground between health and
wellness tourism. All of these subsectors can be preventative and/or curative in nature.
4. The Financial Effects of Health Tourism in the European Union
Given the persistent lack of a clear and unified definition of health tourism, researchers face
significant difficulty when trying to obtain statistical data on health tourism. The following
also presents an obstacle – national and local tourism statistics fail to accommodate health
tourism and do not distinguish between different kinds of health tourism data. All of the above
makes estimating growth and the financial effects of health tourism very complex.
Nonetheless, upon research conducted by the European Parliament's Committee on
Transport and Tourism (TRAN) in 2014, Mainil et al. estimated that “the total size of the
health-tourism market in the EU-28 was 56.0 million domestic arrivals and 5.1 million
international arrivals (from all over the world), totalling 61.1 million health-tourism arrivals
within the EU-28. The total health-tourism market (international plus domestic trips)
comprises 4.3 percent of all EU-28 arrivals, 5.8 percent of domestic arrivals and 1.1 percent of
international arrivals (2017: 26).”
In terms of overnight stays, according to Mainil et al. “health tourism in the European
Union comprises 233.7 million guest nights for domestic trips and 16.7 million international
trips, totaling at 250.4 million. The average domestic length-of-stay is 4.1 nights per trip,
while for international travel this is 8.5. (2017: 27).” Table 1 shows the health tourism market
estimate in the EU-28 in 2014.
Table 1. Health tourism market in the EU-28 in 2014
Country Health tourism revenue (billion €) Health tourism
spending (billion €)
Domestic arrivals International arrivals International
departures spending
Austria 1.44 0.31 0.61
Belgium 0.07 0.04 0.23
Bulgaria 0.04 0.03 0.03
Croatia 0.09 0.08 0.06
Cyprus 0.03 0.03 0.04
Czech Republic 0.25 0.04 0.34
Denmark 0.15 0.03 0.13
Estonia 0.01 0.07 0.02
Finland 0.31 0.04 0.34
France 8.11 0.26 2.17
Germany 12.70 0.51 5.11
United Kingdom 0.74 0.11 0.94
Greece 0.95 0.13 0.05
Hungary 0.18 0.13 0.36
Ireland 0.31 0.06 0.17
Italy 4.32 0.88 1.06
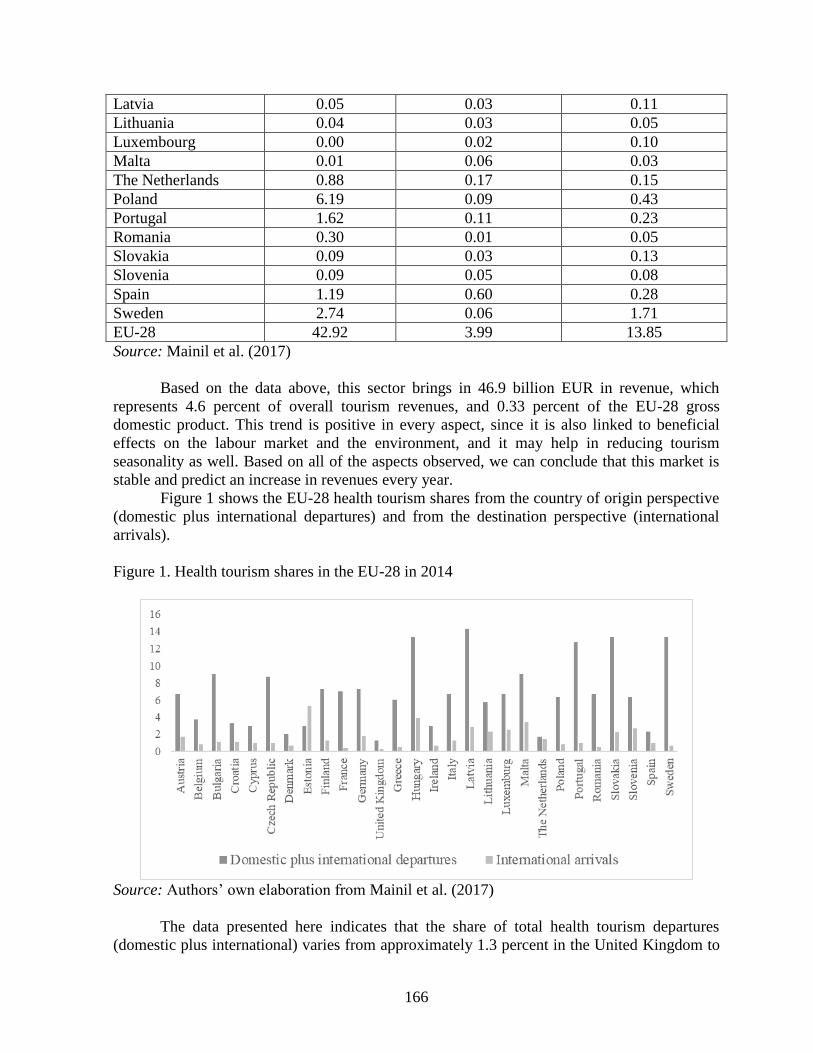
166
Latvia 0.05 0.03 0.11
Lithuania 0.04 0.03 0.05
Luxembourg 0.00 0.02 0.10
Malta 0.01 0.06 0.03
The Netherlands 0.88 0.17 0.15
Poland 6.19 0.09 0.43
Portugal 1.62 0.11 0.23
Romania 0.30 0.01 0.05
Slovakia 0.09 0.03 0.13
Slovenia 0.09 0.05 0.08
Spain 1.19 0.60 0.28
Sweden 2.74 0.06 1.71
EU-28 42.92 3.99 13.85
Source: Mainil et al. (2017)
Based on the data above, this sector brings in 46.9 billion EUR in revenue, which
represents 4.6 percent of overall tourism revenues, and 0.33 percent of the EU-28 gross
domestic product. This trend is positive in every aspect, since it is also linked to beneficial
effects on the labour market and the environment, and it may help in reducing tourism
seasonality as well. Based on all of the aspects observed, we can conclude that this market is
stable and predict an increase in revenues every year.
Figure 1 shows the EU-28 health tourism shares from the country of origin perspective
(domestic plus international departures) and from the destination perspective (international
arrivals).
Figure 1. Health tourism shares in the EU-28 in 2014
Source: Authors’ own elaboration from Mainil et al. (2017)
The data presented here indicates that the share of total health tourism departures
(domestic plus international) varies from approximately 1.3 percent in the United Kingdom to

167
14.3 percent in Latvia. The share of international health tourism arrivals varies from 0.3
percent in the United Kingdom to almost 3.9 percent in Hungary, pointing to their potential
and good practices within the health tourism market. By observing each member state, we can
conclude that according to the country of origin perspective (domestic plus international
departures) the highest shares are recorded in Latvia at 14.3 percent and Hungary, Slovakia
and Sweden at 13.3 percent. The destination perspective (international arrivals) has the highest
share recorded in Estonia (5.3. percent) and Hungary (3.9 percent). Based on all data, we can
conclude that Hungary is the only member state with vast potential and infrastructure in the
sector of health tourism.
4.1. SWOT Analysis
By conducting strengths, weaknesses, opportunities and threats (SWOT) analysis, we provide
a review of the market potential of health tourism in the European Union (Table 2). The most
important conclusions about and recommendations for the future development of health
tourism in European Union can be derived from the data presented in this table.
Table 2. SWOT Analysis of Health Tourism in European Union
Strengths Weaknesses
long and well-established tradition
accesibility of destination
high quality and standard of healthcare (medical
tourism)
well-qualified service sector for providing
healthcare services
environmental preservation (wellness and spa
tourism)
Directive 2011/24/EU for patients’ rights in cross -
border healthcare (medical tourism)
expected sector growth (2 percent per year)
no common definition
difficulties with data measurement
unused potential of member states' patients
(medical tourism)
weak cooperation within health tourism
establishments
lack of grouping, collaboration and joint
promotion
need for public–private partnership (medical
tourism)
need for alternative investment funds (spa
tourism)
old-fashioned facilities
Opportunities Threats
emerging demand for health tourism products
growing income trends
accessibility of information about health services
abroad
state support for health services export
tax incentives for health tourism
seasonality reduction
centres of excellence for rare disease treatments
(medical tourism)
global lifestyle trends
existing infrastructure
rising potential of wellness industry as a workplace
European Union as a strong competitor on the
global market
strong global competition
lack of legislation
loss and degradation of natural resources
increased quantity – decreased quality
Brexit situation
Source: Authors’ research
168
The strength of this market lies in the long and recognizable tradition of health tourism
subsectors throughout the European Union, especially wellness and spa tourism. Europe's
traffic infrastructure and central position make it an accessible destination, with some
European Union member states playing leading roles in the world health tourism market.
When talking about the main strengths of medical tourism, we can highlight the high quality
and standard of healthcare in the European Union (especially perceived as such by
international medical tourists), as well as a qualified service sector. The main strength of
wellness and spa tourism is undoubtedly environmental preservation, since these subsectors
imply the usage of and care for high quality environments. However, this sector’s most
prominent strength by far is its expected growth of 2 percent per year is expected according to
the study from 2014 (Mainil et al., 2017). This is inevitable considering the ageing of the
population, long waiting lists and many other factors, which call for a swift response from the
health tourism industry.
On the other hand, one of the main weaknesses of health tourism development is that
there is no common definition for health tourism, which makes it very difficult to track
statistical data. The unused potential of medical tourists coming from within the European
Union, due to their insufficient knowledge of the Directive 2011/24/EU (which guarantees
their right to seek treatment in other European Union member states), is surely a significant
obstacle as well. Additionally, there is weak cooperation between health tourism
establishments (whereas forming strong networks should be a priority), as well as a lack of
grouping, collaboration and joint promotion in this market. There is a strong need for public–
private partnership in order to upgrade medical tourism services which form one of this
subsector’s biggest weaknesses, while the area of spa tourism requires European Union funds
to replace the gap opened by insufficient private investment. The increasingly old-fashioned
and decrepit facilities in some of Europe’s health tourism hot spots are not to be neglected as
well.
A summary of opportunities reveals emerging demand for health tourism products
(stimulated by population ageing, numerous diseases and waiting lists in many countries) and
growing income trends. Tax incentives offered by the government and state support for health
service exports can play a significant role in promoting the growth of the health tourism
industry. There is a multitude of ways to reduce tourism seasonality via health tourism since it
does not depend on the seasons in a strict sense. For example, the winter season has proven to
suit many spa destinations since their climate is mostly mild and attractive throughout the
whole year. Many medical treatments are often recommended to be avoided during summer,
which is certainly an opportunity to prolong the tourism season throughout the entire year.
Nowadays, information about health services abroad has become much more accessible and
free of cost as a result of information technology advances. In addition, much of the already
existing infrastructure can be upgraded and improved with smaller scale investments instead
of building completely new facilities. The main opportunity in the field of medical tourism lies
in setting up centres of excellence for rare diseases that save on health costs and advance
quality levels based on the cross-border healthcare Directive - which would stimulate the
development of medical tourism’s specialised accommodations and services. All of these
opportunities lead to the conclusion that the European Union can be a very strong competitor
on the global health tourism market, if managed with strong and precise cooperation and a
joint promotion strategy.
The significant growth of global (particularly Asian and Middle-Eastern) competition
is identified as the greatest threat. Lack of health tourism legislation, especially in the medical
169
subsector, and loss and degradation of natural resources on which spa and wellness tourism
are based are not insignificant either. The Brexit situation is also increasingly mentioned as a
threat for health tourism as of late (especially for the medical tourism subsector, since the
United Kingdom is an important market).
4.2. Recommendations based on the SWOT Analysis
Several conclusions and recommendations can be extracted from the results of the SWOT
analysis of health tourism in the European Union.
Firstly, when it comes to its strengths, there are no existing hints for the development
of policies in the European Union, except the idea that health tourism should be more actively
promoted because of its capacity to reduce overall seasonality. However, recommendations for
European Union policies can be deducted from the weaknesses. The first and most important
of these is that there seems to be a potential role for European Union coordination in gathering
reliable data about the health tourism market. Some concrete suggestions regarding this
problem already exist, saying that the solution lies in supporting The Tourism Observatory for
Health, Wellness and Spa or the European Commission’s Virtual Tourism Observatory.
According to Mainil et al. “the lack of uptake of Directive 2011/24/EU in national legislation
is a missed opportunity for medical tourism and the development of specialised
accommodations and services. Therefore, the European Tourism Commission should try to
cooperate with the Health Ministries and departments in all member states (2017: 67).”
There is also a strong need for joint promotion of health tourism in European Union,
emphasized by the European Commission itself. This is becoming vital now that global
competitors are getting more and more serious and upgrading their offers on an everyday
basis. When it comes to global competition, local governments should take part in continuous
funding and fostering a sustainable and faster development of health tourism. Key activities in
this regard must include improvement of all types of infrastructure facilities including road
access, electricity and water supply along with air traffic, safety and accommodation.
Compared to leading global players on the health tourism market, member state
governments surely have a key role in designing strategy, but international financial
institutions do so as well. A great example of this was the ‘WelDest’ project (2012–2014),
funded with support from the European Commission (299,966.00 EUR) and in cooperation
with five higher education institutions from Austria, the Czech Republic, Finland, Germany
and the United Kingdom. The project’s purpose was to create a framework and toolkit for
destination management organisations, public bodies as well as private companies in
destinations trying to become health and well-being destinations. An electronic handbook was
developed to achieve these goals. It offers an interesting self-assessment tool, a development
tool and a course with educator instructions.
Besides this, health tourism is eligible for European Union funding from the European
Regional Development Fund in the period from 2014 to 2020 because it helps develop quality
value-added products and services in niche markets by mobilising specific local resources and
contributing to smart regional specialisation.
Finally, the renovation of a large number of ageing wellness and spa facilities might be
part of, for instance, the European Commission’s destination programmes such as ‘European
Destinations of Excellence’.
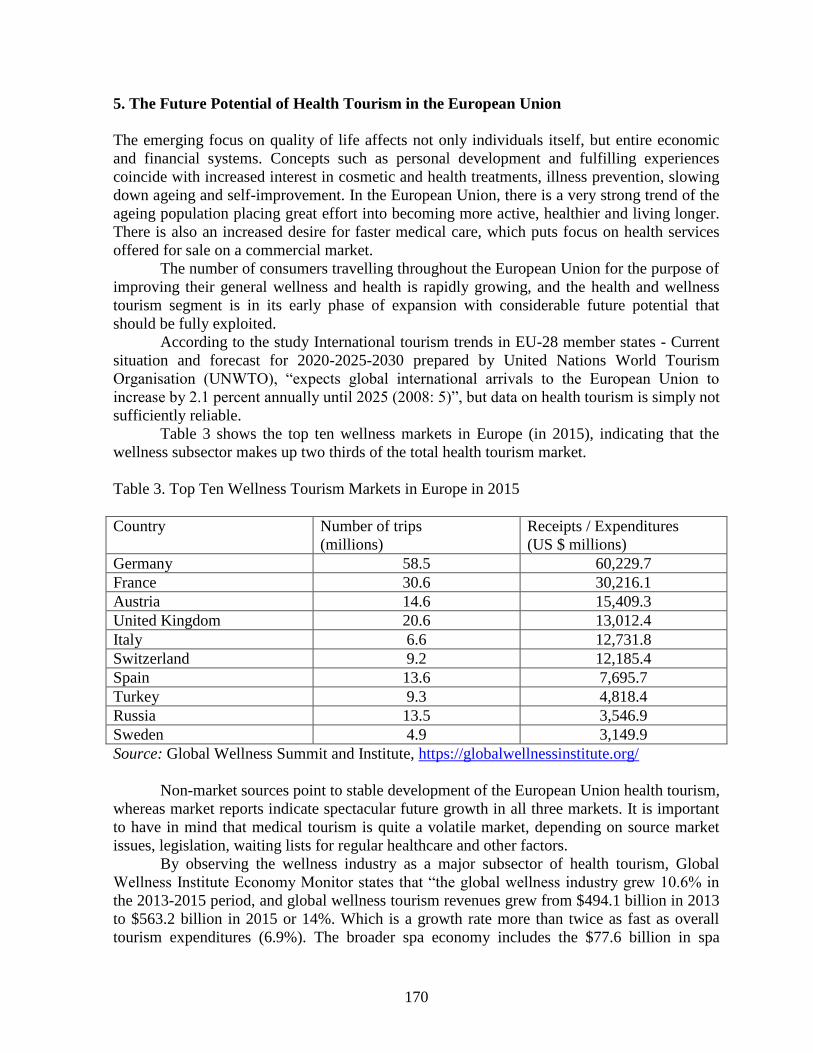
170
5. The Future Potential of Health Tourism in the European Union
The emerging focus on quality of life affects not only individuals itself, but entire economic
and financial systems. Concepts such as personal development and fulfilling experiences
coincide with increased interest in cosmetic and health treatments, illness prevention, slowing
down ageing and self-improvement. In the European Union, there is a very strong trend of the
ageing population placing great effort into becoming more active, healthier and living longer.
There is also an increased desire for faster medical care, which puts focus on health services
offered for sale on a commercial market.
The number of consumers travelling throughout the European Union for the purpose of
improving their general wellness and health is rapidly growing, and the health and wellness
tourism segment is in its early phase of expansion with considerable future potential that
should be fully exploited.
According to the study International tourism trends in EU-28 member states - Current
situation and forecast for 2020-2025-2030 prepared by United Nations World Tourism
Organisation (UNWTO), “expects global international arrivals to the European Union to
increase by 2.1 percent annually until 2025 (2008: 5)”, but data on health tourism is simply not
sufficiently reliable.
Table 3 shows the top ten wellness markets in Europe (in 2015), indicating that the
wellness subsector makes up two thirds of the total health tourism market.
Table 3. Top Ten Wellness Tourism Markets in Europe in 2015
Country Number of trips
(millions)
Receipts / Expenditures
(US $ millions)
Germany 58.5 60,229.7
France 30.6 30,216.1
Austria 14.6 15,409.3
United Kingdom 20.6 13,012.4
Italy 6.6 12,731.8
Switzerland 9.2 12,185.4
Spain 13.6 7,695.7
Turkey 9.3 4,818.4
Russia 13.5 3,546.9
Sweden 4.9 3,149.9
Source: Global Wellness Summit and Institute, https://globalwellnessinstitute.org/
Non-market sources point to stable development of the European Union health tourism,
whereas market reports indicate spectacular future growth in all three markets. It is important
to have in mind that medical tourism is quite a volatile market, depending on source market
issues, legislation, waiting lists for regular healthcare and other factors.
By observing the wellness industry as a major subsector of health tourism, Global
Wellness Institute Economy Monitor states that “the global wellness industry grew 10.6% in
the 2013-2015 period, and global wellness tourism revenues grew from $494.1 billion in 2013
to $563.2 billion in 2015 or 14%. Which is a growth rate more than twice as fast as overall
tourism expenditures (6.9%). The broader spa economy includes the $77.6 billion in spa

171
facility revenues, along with a cluster of other sectors that support and enable spa businesses.
These include spa education, consulting, capital investment, associations, media, and events,
which together add an additional $21.0 billion to the cluster. The overall $98.6 billion global
spa economy has been growing by 2.5% annually in U.S. dollars since 2013 (or 12.1%
annually when expressed in Euros), (2017:5).”
Table 4 shows the latest information on the economic impacts of the wellness industry
in Europe according to the Global Wellness Summit & Institute (2015).
Table 4. Economic Impact of the Wellness Industry in Europe in 2015
Direct impact Indirect & induced
impact
Economy – wide
impact
Wellness
tourism
expenditures
563.2 billion dollars 1.1 trillion dollars 1.6 trillion dollars
Employment 17.9 million jobs 22.8 million jobs 40.8 million jobs
Source: Global Wellness Summit and Institute, https://globalwellnessinstitute.org/
Health tourism is definitely a new opportunity for the European Union countries – not
only for the economic revival, but also for the sustainable development and for the new role in
global tourism market. The potential of health tourism can be defined as a collection of
internal possibilities of the country that enable the development of the health tourism in that
country’s territory. The economic impact of health tourism in the European Union segment is
not negligible, despite missing data. It represents a very interesting potential to create new
recognition and competitiveness of European Union in the domestic and foreign markets.
Certain obstacles exist when we put the need for using the full potential and intensive
development of health tourism subsectors in focus. That is surely a reason why a joint action
in European Union is necessary to influence the creation of a positive and supportive
environment for the further development of this type of tourism. In addition, there should be
more collaboration between public medical universities and private and public hospitals to
provide education and to train more specialists. Besides the current state of all the existing
destinations, it is possible to “provoke” the transformation of the “forgotten” and low
profitable health resorts and spas and their emergence into the health tourism destinations with
new services and hotel capacities. Of course, this would be feasible primarily through the
investments that are already planned on the regional and local levels and that may trigger the
whole process. Since the lack of data is a significant limitation in defining the potential of
health tourism in European Union, we agree that this tourism niche should have more
attention, and that there should be more government initiative in constructing a basis for
further research in this area.
Nevertheless, it remains certain that if the share of health tourism in the global tourism
market increases, tourism seasonality will be significantly reduced, its sustainability improved,
its mobility reduced and the rate of unemployment decreased.

172
6. Conclusion
Tourism plays a significant economic and financial role in many countries worldwide. It is a
strong driver in generating gross domestic product, employment, attracting domestic and
foreign investments, and improving the foreign trade balance. Health tourism may not be the
leading type of tourism when measured by the number of tourists, but it is now considered as
one of the most finance-consuming market segments due to the high cost of services and to the
comparatively long stays it generates.
However, according to available statistics, the high numbers of 61.1 million health
tourism arrivals and 46.9 billion EUR of revenue in the EU-28 show that this market has
become a legitimate model for economic development, which has also proved to be accurate
throughout the global tourism industry. In recent years, health tourism in the European Union
and worldwide has developed as a very strong trend which is changing tourist preferences and
redirecting emerging destinations’ strategies, focused on high added value and high impact
experiences, and reflecting healthier and more responsible lifestyles.
Tax incentives offered by the government can and should play an important part in
promoting the health tourism industry. Currently, governments of certain European Union
countries have already been introducing various tax-related and national policies. However,
many other international funding sources for the European Union health tourism market exist,
and some of the ones mentioned in this paper have already shown a positive effect.
Despite high-profile media interest and coverage, there is a lack of scientific evidence
of the role and financial impact of health tourism. However, there are existing limitations of
this paper. The lack of statistical data, leading to difficulties in tracking and projecting the
future financial development as well as potentials of health tourism in general. Whilst the
amount of literature written on the subject of health tourism increases, the material under
review is hardly ever evidence-based. In order to stay competitive and satisfy present, but also
attract potential demand, it is essential to continue raising awareness of the opportunities of
health tourism in the European Union. Most European Union health destinations have a strong
tradition, are characterized by great professionalism and can count on a highly developed
tourism sector.
However, many challenges remain regarding sustainability, infrastructure,
accessibility, constantly changing consumer trends and governance. All of these need to be
addressed to guarantee successful health tourism development in European Union. One of the
key challenges is the need for a joint vision in the field of health tourism strategy. That
includes joint promotion and collaboration in order to succeed in the global market where
competition is getting bigger and stronger everyday, especially in Asia and the Middle East.
References
Carrera, P. M., & Bridges, J. F. 2006. Globalization and healthcare: Understanding health and
medical tourism. Expert Review of Pharmacoeconomics & Outcomes Research, 6(4):
447-454. https://doi.org/10.1586/14737167.6.4.447
Chang, L., & Beise-Zee, R. 2013. Consumer perception of healthfulness and appraisal of
health-promoting tourist destinations. Tourism Review, 68: 34-47.
Cheung, E. 2015. A review of small-scale niche treatment providers. In: N. Lunt, D. Horsfall,
& J. Hanefeld (Eds.) 2015. Handbook on medical tourism and patient mobility.
Cheltenham: Edward Elgar Publishing, pp.133-140.

173
Cohen, E. 2008. Medical tourism in Thailand. In: Cohen, E. (Ed.) 2008. Explorations in Thai
tourism. Bingley: Emerald, pp.225-255.
Connell, J. 2006. Medical Tourism: Sea, sun, sand and…surgery. Tourism Management,
27(6): 1093-1100.
Connell, J. 2011. Medical tourism. Wallingford: CABI.
Fetscherin, M. & Stephano, A. M. 2016. The medical tourism index: Scale development and
validation. Tourism Management, 52: 539-556.
Global Wellness Summit and Institute. 2015. Top Ten Wellness Tourism Markets in Europe.
https://globalwellnessinstitute.org. Accessed 7 August 2018.
Global Wellness Summit and Institute. 2017. Global Wellness Economy Monitor.
https://globalwellnessinstitute.org. Accessed 22 September 2018.
Goodrich, J. 1993. Socialist Cuba: A Study of Health Tourism. Journal of Travel Research,
32(1): 36-41.
Goodrich, J. N. & Goodrich, G. E. 1987. Health – care study – an exploratory study. Tourism
Management, 8(3): 217-222.
Johnson, T., Youngquist, J., Garman, A., Hohmann, S. & Cieslak, P. 2015. Factors influencing
medical travel into the United States. International Journal of Pharmaceutical and
Healthcare Marketing, 9(2): 118-135.
Langvinienė, N. 2014. Changing patterns in the health tourism services sector in Lithuania.
Procedia - Social and Behavioural Sciences, 156: 310 – 316.
Loh, C. 2014. Health tourism on the rise? Evidence from the balance of payments statistics.
The European Journal of Health Economics, 15: 759-766.
Loh, C. 2015. Trends and structural shifts in health tourism: Evidence from seasonal time-
series data on health-related travel spending by Canada during 1970-2010. Social
Science & Medicine, 132: 173-180.
Sekliuckiene, J. & Langvinienė N. 2009. Service Perspectives in Healthiness and Sport
Tourism in Lithuania: Case of Spa. Economics and management, 14: 505-512.
Mainil, T., Eijgelaar, E., Klijs, J., Nawijn, J. & Peeters, P. 2017. Research for TRAN
Committee – Health tourism in the EU: a general investigation. European Parliament,
Policy Department for Structural and Cohesion Policies, Brussels.
Morgan, D. 2015. Accounting for trade in healthcare. In: N. Lunt, D. Horsfall, & J. Hanefeld
(Eds.) 2015. Handbook on medical tourism and patient mobility. Cheltenham: Edward
Elgar Publishing, pp. 92-103.
Müller, H. & Kaufmann, E. L. 2001. Wellness tourism: Market analysis of a special health
tourism segment and implications for the hotel industry. Journal of Vacation
Marketing, 7: 5-17.
United Nations World Tourism Organization (UNWTO). 2008. International tourism trends in
EU-28 member states - Current situation and forecast for 2020-2025-2030.
https://ec.europa.eu/growth/content/international-tourism-trends-eu-28-member-states-
current-situation-and-forecast-2020-2025-0_en. Accessed 4 August 2018.
Reisman, D. 2015. The economics of health and medical tourism. In: N. Lunt, D. Horsfall, &
J. Hanefeld (Eds.) 2015. Handbook on medical tourism and patient mobility.
Cheltenham: Edward Elgar Publishing, pp.82-91.
Ridderstaat, J., Singh, D. & DeMicco, F. 2018. The impact of major tourist markets on health
tourism spending in the United States. Journal of Destination Marketing and
Management, (Article in Press). https://doi.org//10.1016/j.jdmm.2018.05.003

174
Smith, M. & Puczkό, L. 2009. Historical overview. In: M. Smith & L. Puczkό (Ed.) 2009.
Health and wellness tourism. New York: Routledge, pp.21-38.
Smith, M.K. & Puczkό, L. 2014. Health, Tourism and Hospitality: Spas, Wellness and
Medical Travel. Routledge: London.
White, C. 2009. Harnessing spa and wellness opportunities: An Australian experience. In:
Bushell, R. & Sheldon, P.J. (Eds.) 2009. Wellness and tourism: Mind, body, spirit,
place. New York: Cognizant Communication Corporation, pp.151-161.

175
MANIPULATIVE LEADERSHIP, GENDER AND ETHICAL DECISION-MAKING IN
ORGANIZATIONS
Jasna Kovacevic
Department of Management and Organization
School of Economics and Business in Sarajevo
Trg oslobodjenja – Alija Izetbegovic 1
71000 Sarajevo, Bosnia nad Herzegovina
Zijada Rahimic
Department of Management and Organization
Trg oslobodjenja – Alija Izetbegovic 1
71000 Sarajevo, Bosnia and Herzegovina
Abstract
This research investigates the impact of gender on Machiavellian leadership and ethical
decision-making. Quantitative research design using survey as a research instrument was
applied in order to: a) identify leadership styles of managers in Bosnia and Herzegovina and b)
analyze the effects of gender on identified leadership styles and ethical decision-making. The
identified leadership styles were later tested on gender differences with Mann-Whitney U test.
The study results indicate that gender differences exist only in Machiavellian leadership styles,
but not in other leadership styles. The results imply men score higher on Mach scales and
rather prefer Machiavellian/manipulative leadership practices contrary to women.
Key words: leadership, ethics, decision-making, gender, organizations
JEL classification: M10 (General); M14 (Corporate Culture; Social Responsibility); J16
(Economics of Gender)
1. Introduction
In the recent decade, unethical behaviour in the organizational context has received much
attention worldwide. Transition countries are no exception. Furthermore, corruption and
bribery in politics and in business in these countries remain to be the burning issue. Path from
socialism to capitalism triggered many changes in all aspects of social life, including business
and organizational dynamics. The shift from egalitarian, cooperative cultures in socialism
towards more competitive and individualistic cultures in capitalism influenced managers to
adopt manipulative leadership practices that favor short-term results and efficiency, often
purposly neglecting the importance of ethical decision-making.
One of the most investigated individual variables in the extant leadership literature related to
ethical decision-making is gender. General notion is that women prefer a more democratic,
expressive, participative leadership while men are prone to autocratic, instrumental, aggressive
and competitive leadership. Although results of studies on gender differences in decision-
making are often inconsistent, they still implicate that women are more sensitive to ethical
issues in comparison to their male colleagues.

176
It is important to emphasize how gender represents a complex socio-psychological construct
but in the extant literature it is very often treated as dichotomous biological variable of sex.
Treating gender merely as biological variable thereby excluding the importance of society and
culture, could limit the potential of research studies dealing with both gender and ethical
issues in business. Therefore, in order to make significant conclusions on the matter, in this
paper gender differences are observed as biological, cognitive, social and cultural processes
that shape the diversity, gender development and gender identification.
This paper presents an attempt to fill in the gaps in the existing literature regarding the ethical
decision-making in transitional context by investigating the matter in relation to gender,
addressing strong socio-cultural shifts which play an important role in decision-making,
gender development and gender identification. It is also preassumed that these socio-cultural
shifts from collectivistic, feminine organizational values to more competitive, masculine and
individualistic values influence the mechanisms of ethical decision-making, shedding light on
gender as significant individual variable which moderates the decision-making process.
Research design of the study incloudes exploratory factor analysis aiming to identify the
dominant leadership styles of managers in Bosnia and Herzegovina. Afterwards, identified
leadership styles were tested whether gender differences exist in relation to leadership styles.
In summary, the research study indicates that transition from socialism to capitalism imposed
manipulative leadership style as dominant leadership style which male managers tend to prefer
in comparison to women. Since manipulative leadership practices can violate the
organizational culture and image of organizations in public, the authors of the study
recommend managers to embrace ethical organizational cultures by imposing ethical codes of
conduct and egalitarian organizational values.
2. Literature review
2.1. Overview of Theories - Where Do These Gender Differences Come From?
Gender is one of the most investigated demographic variables which is considered to influence
variety of social activities of humans worldwide. In the past three decades, the differences in
ethical judgments of men and women have been a subject of attention among theoreticians and
practicioners, especially in the field of psychology, management and political behaviour
(Kohlberg, 1966 and 1969; Gilligan, 1977; Bem, 1981; Lifton, 1985; Bussey and Bandura,
1999; White, 1999; Overby and Hammond, 2003; Rayburn, Mazieikiene, 2004; Hyde, 2005;
Baird, Zelin and Brennan, 2006; Gupta, Walker and Swanson, 2011, Smith, DeBode and
Walker, 2011). Many important questions arise from such studies, e.g. are women more
ethical than men and if they are, what are the roots to these differences? Will the inclusion of
more women in the corporate boards and top-executive positions create ethical organizational
environment?
Many studies dealing with the gender differences in ethical judgements tried to answer these
questions by developing variety of scales and research instruments. However, White (1999)
observes how results of these studies were arguable and less conclusive although differences
have noted a tendency to show women as „more ethical“ than men (Bampton and Maclagan,
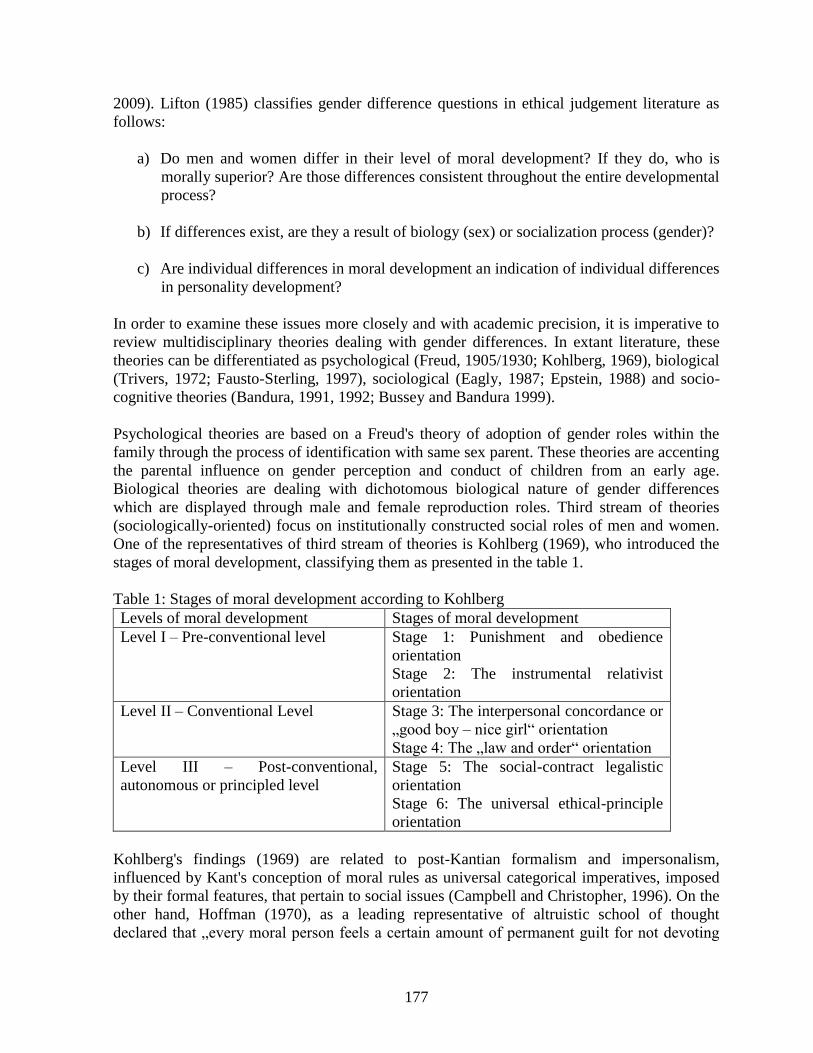
177
2009). Lifton (1985) classifies gender difference questions in ethical judgement literature as
follows:
a) Do men and women differ in their level of moral development? If they do, who is
morally superior? Are those differences consistent throughout the entire developmental
process?
b) If differences exist, are they a result of biology (sex) or socialization process (gender)?
c) Are individual differences in moral development an indication of individual differences
in personality development?
In order to examine these issues more closely and with academic precision, it is imperative to
review multidisciplinary theories dealing with gender differences. In extant literature, these
theories can be differentiated as psychological (Freud, 1905/1930; Kohlberg, 1969), biological
(Trivers, 1972; Fausto-Sterling, 1997), sociological (Eagly, 1987; Epstein, 1988) and socio-
cognitive theories (Bandura, 1991, 1992; Bussey and Bandura 1999).
Psychological theories are based on a Freud's theory of adoption of gender roles within the
family through the process of identification with same sex parent. These theories are accenting
the parental influence on gender perception and conduct of children from an early age.
Biological theories are dealing with dichotomous biological nature of gender differences
which are displayed through male and female reproduction roles. Third stream of theories
(sociologically-oriented) focus on institutionally constructed social roles of men and women.
One of the representatives of third stream of theories is Kohlberg (1969), who introduced the
stages of moral development, classifying them as presented in the table 1.
Table 1: Stages of moral development according to Kohlberg
Levels of moral development Stages of moral development
Level I – Pre-conventional level Stage 1: Punishment and obedience
orientation
Stage 2: The instrumental relativist
orientation
Level II – Conventional Level Stage 3: The interpersonal concordance or
„good boy – nice girl“ orientation
Stage 4: The „law and order“ orientation
Level III – Post-conventional,
autonomous or principled level
Stage 5: The social-contract legalistic
orientation
Stage 6: The universal ethical-principle
orientation
Kohlberg's findings (1969) are related to post-Kantian formalism and impersonalism,
influenced by Kant's conception of moral rules as universal categorical imperatives, imposed
by their formal features, that pertain to social issues (Campbell and Christopher, 1996). On the
other hand, Hoffman (1970), as a leading representative of altruistic school of thought
declared that „every moral person feels a certain amount of permanent guilt for not devoting
178
his or her entire life to the service of others“. The guilt should be considered „normal“ and
„non-neurotic“ and the absence of such guilt should indicate a deficient moral development.
Altruistic view to moral development is focused on prosocial behaviour. Altruist theoreticians
such as Eisenberg-Berg (1979) challenged Kohlberg's theory for restricting the domain of
moral reasoning to issues of moral and political justice.
Furthermore, Gilligan (1982) criticised the rigidness of Kohlbergian approach to moral
development through the theory of care ethics, which treats issues of self-concept and personal
growth as morally relevant. Gilligan presents her work as a response to the Freudian
conception that men have a well-developed moral sense whereas women do not, thereby
referring to the work of her mentor Kohlberg, claiming that his scale provides an account of
male moral development rather than of human moral development. In terms of the care ethics,
moral reasoning does not involve rationality alone but a combination of emotion, cognition
and action. Therefore, care ethics are not concerned with universality of right action (Allmark,
1995). Gilligan (1982) has suggested that women tend to demonstrate an „ethics of care“
rather than a „justice“ or „rule-based“ reasoning which is frequently demonstrated by men.
However, many traditional psychologists and philosophers have reasoned from an
androcentric point of view, seeing woman's moral inferiority where they should have seen
women's moral difference. Although formalist and altruist theories of moral develpment create
sound foundation for debate on moral cognition, they rather create static framework since they
neglect the influence of person's age, sociocultural and technological changes influencing
gender development and differentiation
Bussey and Bandura (1999) gave an overview of previously mentioned theories which explain
gender development and differentiation from different theoretical standpoints. The authors
made remarks how these theories explain gender development and differentiation to some
extent but with certain limitations. For instance, although psychological theories created good
scientific foundation for observervation of gender differences, they still consider gender as an
early childhood phenomenon (Kohlberg, 1966). These theories do not focus on mechanisms
by which gender-linked conceptions are acquired and translated to gender-linked conduct nor
do they specify the motivational mechanisms for acting in accordance with a conception
(Bussey and Bandura, 1999). Bandura (1986) argues that being introduced to a certian
stereotype does not necessarily lead to behavior in accordance with it.
Bandura (1999) introduces the social cognitive theory (SCT) of gender development and
differentiation which acknowledges the influential role of evolutionary factors in human
adaptation and change, but rejects one-sided evolutionism by which social behaviour is the
product of evolved biology. Instead, social and technological innovations are the factors that
create new environmental selection pressures for adaptiveness and have no effect on biological
evolution. The theory proposes that individuals observe others in order to learn certain
behavioural patters where the environment, behaviour and cognition serve as the main factors
influencing the development of an individual.
Although social cognitive theory enlightened some important aspects such as dynamics of
motivational mechanisms, it still does not provide a clear answer how children differentiate
the sexes before they have at least a basic conception of gender. Furthermore, it fails to impart
a directedness of self-efficacy motives in gender development and lacks a clear description of
179
the central processes of the theory – how external standards of gender role conduct become
internalized into personal standards (Martin, Ruble and Szkrybalo, 2002).
For obvious reasons, it is necessary for researchers to observe variety of views and different
theories in order to articulate substantive conclusions on gender and moral reasoning. In a
globalized world, gender differences become even more complex issue where variety of
contigencies influence the ethical judgements of men and women.
2.1. Previous research on gender differences in ethical decision-making
O'Fallon and Butterfield (2005) reviewed the ethical decision-making literature and found that
gender continues to produce fairly consistent results, noting that where differences are found,
women tend to be more ethical than men. One of the most interesting and most popular
theories for assesment of ethical practices of managers is Machiavellianism which is
interpreted as manipulative leadership. Manipulative leadership is described as manipulative,
exploitive, agressive and unethical political behaviour, and has been more broadly applied to
management and invidual actions (Bowlby, McDermott and Obar, 2011). Studies dealing with
Machiavellianism and manipulative practices show how men in general score higher on Mach
scales contrary to women (Menjeriskaja, 1998; Mazeikiene, 2004; Barlow, Qualter and
Stylianou, 2011; Bowlby, McDermott and Obar, 2011;).
Menjeriskaja (1998 cited in Mazeikiene, 2004) found that a high levels of manipulation,
domination, aggression, hostility and low level of emphathy are typical to individuals with
masculine behaviour, while high levels of subordination, a communication strategy of
emotional closeness and empathy, low levels hostility are typical to individuals with feminine
behaviour. These findings are consistent with an observation that care ethics and ethical
leadership styles (for instance transformational and charismatic) are more a characteristic of
women while manipulative, more competitive and aggressive leadership styles are traits of
men. Chodrow (1984) notes how gender personality helps in creation of patriarchal forms of
capitalism, where men prefer the pursuit of professional achievement in the rule-bound, less
affect-laden milieu of capitalist workplace contrary to women who prefer the more affect-
laden and relational work of the care giving within the family.
3. From collectivism to individualism: Impact of socio-cultural changes in transitional
societies on gender differences
Guided by Bussey and Bandura's work on social cognitive theory where gender identification
and developement is also determined by socio-cultural and technological changes, it is
necessary to consider the impacts of political, social and cultural shifts in Bosnia and
Herzegovina, as transitional society.
According to Hofstede (1980) culture is a way of collective programming of the mind in a way
that distinguishes the members of one group to another. Hofstede proposed cultural
dimensions as follows: a) Individualism vs. Collectivism measured by Individualism Index
(IDV) ranging from 0 (low Individualism, high Collectivism) to 100 (high Individualism), b)
Power Distance measured by Power Distance Index (PDI) ranging from 0 (small PD) to 100
(large PD), c) Uncertainty Avoidance measured by Uncertainty Avoidance Index (UAI)
180
ranging from 8 (lowest UA country) to 112 (highest UA country) and d) Masculinity vs.
Femininity measured by Masculinity Index (MAS) ranging from 0 (low Masculinity) to 100
(high Masculinity). The original work by Hofstede included the former Yugoslavia, with
following scores: PDI = 76; UAI = 88; IDV = 27 and MAS = 21. The results implicate that
former Yugoslavia was a collectivistic society with low masculinity, driven by values of in-
groups and social networks, more traditionally associated with the feminine role: putting
relationships with people before financial incentives, cooperating with people and
emphasizing the quality of life in general. The decision-making was based on management of
groups with relationships prevailing over the tasks where collective interests prevail over
individual interests.
Bosnia and Herzegovina was a part of former Yugoslavia, from 1945 until 1992. After the war
broke out in 1992, the state disintegrated. Bosnia and Herzegovina, Serbia, Montenegro,
Croatia, Slovenia and Macedonia gained their political independence as seperate countries.
The independed states became democratic societies, embracing capitalism and market
economy.
Despite many benefits of free-market trends that improved standard of living in new
democratic societies of western Balkans, the cost of democratization of former socialist
country was enormous. Transition to liberal democracy combined with market economy
triggered many changes in lifestyles, rate of employment, family relations, redistribution of
resources and social classes. Political freedom, elections, absence of censorship and
privatization coexist with negative consequences of transition such as high rate of
unemployment, unequal distribution of financial and other resources, poverty as a result of
inadequate structure of social classes, family stress, individualism and materialism (Dabrowski
and Antczak, 1996 cited in Wejnert 2003). Additionally, , Bosnia and Herzegovina also fights
with corruption and bribery in every aspect of political, social and business life.
The sudden shift from collectivism to individualism has influenced both popularity and
necessity of manipulative leadership pratices in business and politics. However, if not
controled, this manipulative behaviour can lead to the emergence of dark side of leadership
(Brown and Mitchel 2010, Woods 2007, McIntosh and Rima 1997) which is related to toxic,
abusive, manipulative (Tepper 2000, 2008, Frost 2004) and machiavellian behaviour
(Richmond 2001, Rayburn and Rayburn 1996, Gable and Topol 1991, Murdack 1994, Hitt
1990, Girodo 1998). Another important notion related to gender differences is concerned with
patriarchal family values in Bosnia and Herzegovina, according to which women are rather
seen as nurturants, wives and mothers who often prefer family before career. They are not
perceived as successful business women, oriented towards professional achievment (Sehic,
Rahimic and Kovacevic, 2010).
4. Research design, methodology and sampling
4.1. Aim of the Study, Sample and Hypotheses
Driven by the complexity of gender indentity and development theories, relevance and
inconsistent results in studies on gender differences in ethical decision-making, we articulated
the main purpose of this research. Our aim is to:
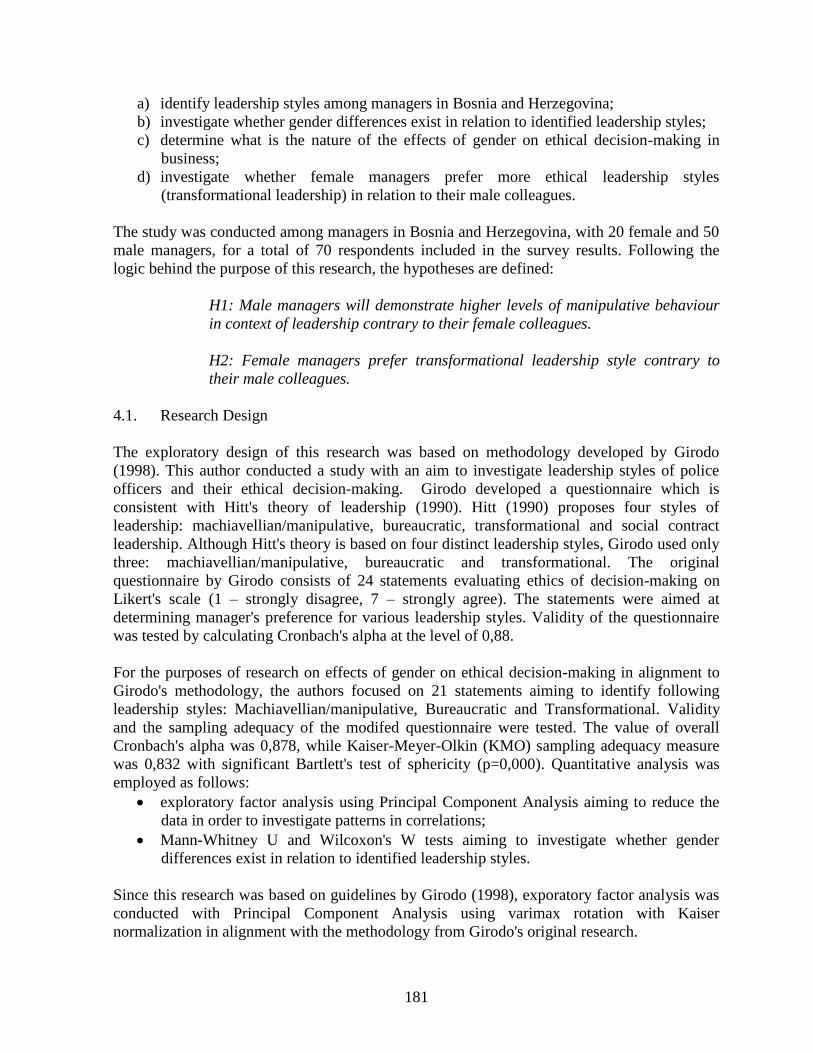
181
a) identify leadership styles among managers in Bosnia and Herzegovina;
b) investigate whether gender differences exist in relation to identified leadership styles;
c) determine what is the nature of the effects of gender on ethical decision-making in
business;
d) investigate whether female managers prefer more ethical leadership styles
(transformational leadership) in relation to their male colleagues.
The study was conducted among managers in Bosnia and Herzegovina, with 20 female and 50
male managers, for a total of 70 respondents included in the survey results. Following the
logic behind the purpose of this research, the hypotheses are defined:
H1: Male managers will demonstrate higher levels of manipulative behaviour
in context of leadership contrary to their female colleagues.
H2: Female managers prefer transformational leadership style contrary to
their male colleagues.
4.1. Research Design
The exploratory design of this research was based on methodology developed by Girodo
(1998). This author conducted a study with an aim to investigate leadership styles of police
officers and their ethical decision-making. Girodo developed a questionnaire which is
consistent with Hitt's theory of leadership (1990). Hitt (1990) proposes four styles of
leadership: machiavellian/manipulative, bureaucratic, transformational and social contract
leadership. Although Hitt's theory is based on four distinct leadership styles, Girodo used only
three: machiavellian/manipulative, bureaucratic and transformational. The original
questionnaire by Girodo consists of 24 statements evaluating ethics of decision-making on
Likert's scale (1 – strongly disagree, 7 – strongly agree). The statements were aimed at
determining manager's preference for various leadership styles. Validity of the questionnaire
was tested by calculating Cronbach's alpha at the level of 0,88.
For the purposes of research on effects of gender on ethical decision-making in alignment to
Girodo's methodology, the authors focused on 21 statements aiming to identify following
leadership styles: Machiavellian/manipulative, Bureaucratic and Transformational. Validity
and the sampling adequacy of the modifed questionnaire were tested. The value of overall
Cronbach's alpha was 0,878, while Kaiser-Meyer-Olkin (KMO) sampling adequacy measure
was 0,832 with significant Bartlett's test of sphericity (p=0,000). Quantitative analysis was
employed as follows:
exploratory factor analysis using Principal Component Analysis aiming to reduce the
data in order to investigate patterns in correlations;
Mann-Whitney U and Wilcoxon's W tests aiming to investigate whether gender
differences exist in relation to identified leadership styles.
Since this research was based on guidelines by Girodo (1998), exporatory factor analysis was
conducted with Principal Component Analysis using varimax rotation with Kaiser
normalization in alignment with the methodology from Girodo's original research.
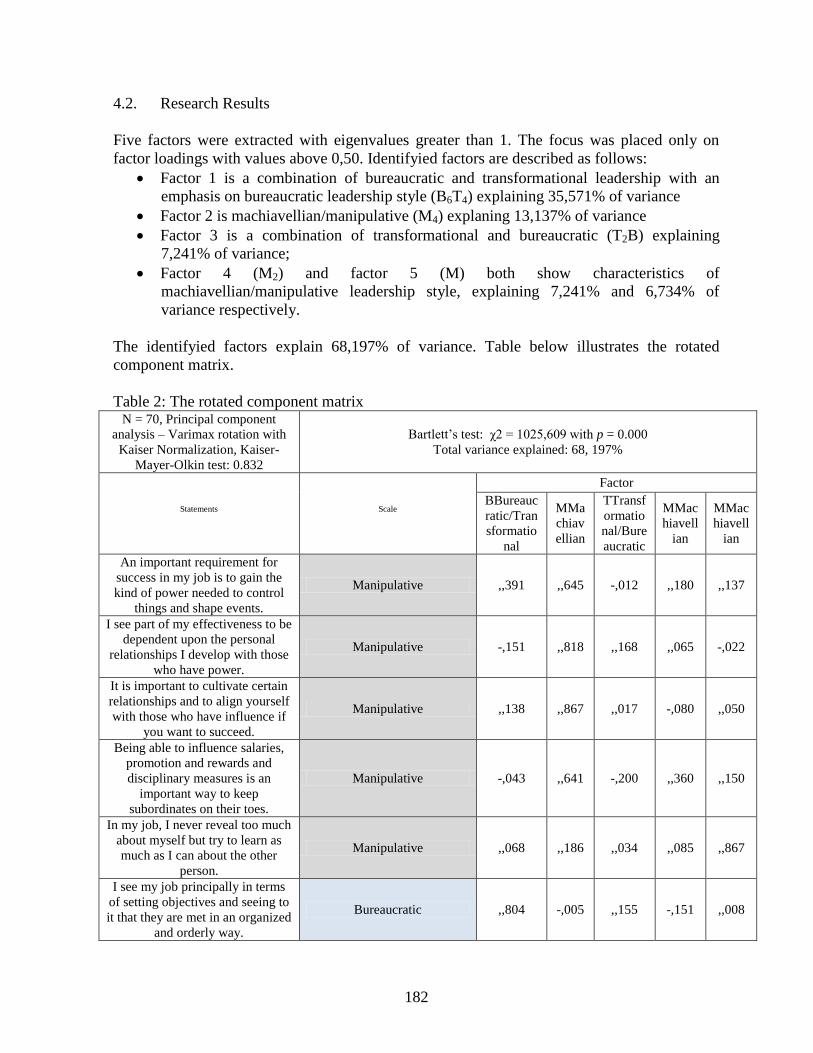
182
4.2. Research Results
Five factors were extracted with eigenvalues greater than 1. The focus was placed only on
factor loadings with values above 0,50. Identifyied factors are described as follows:
Factor 1 is a combination of bureaucratic and transformational leadership with an
emphasis on bureaucratic leadership style (B6T4) explaining 35,571% of variance
Factor 2 is machiavellian/manipulative (M4) explaning 13,137% of variance
Factor 3 is a combination of transformational and bureaucratic (T2B) explaining
7,241% of variance;
Factor 4 (M2) and factor 5 (M) both show characteristics of
machiavellian/manipulative leadership style, explaining 7,241% and 6,734% of
variance respectively.
The identifyied factors explain 68,197% of variance. Table below illustrates the rotated
component matrix.
Table 2: The rotated component matrix N = 70, Principal component
analysis – Varimax rotation with
Kaiser Normalization, Kaiser-
Mayer-Olkin test: 0.832
Bartlett’s test: χ2 = 1025,609 with p = 0.000
Total variance explained: 68, 197%
Statements
Scale
Factor
BBureauc
ratic/Tran
sformatio
nal
MMa
chiav
ellian
TTransf
ormatio
nal/Bure
aucratic
MMac
hiavell
ian
MMac
hiavell
ian
An important requirement for
success in my job is to gain the
kind of power needed to control
things and shape events.
Manipulative ,,391 ,,645 -,012 ,,180 ,,137
I see part of my effectiveness to be
dependent upon the personal
relationships I develop with those
who have power.
Manipulative -,151 ,,818 ,,168 ,,065 -,022
It is important to cultivate certain
relationships and to align yourself
with those who have influence if
you want to succeed.
Manipulative ,,138 ,,867 ,,017 -,080 ,,050
Being able to influence salaries,
promotion and rewards and
disciplinary measures is an
important way to keep
subordinates on their toes.
Manipulative -,043 ,,641 -,200 ,,360 ,,150
In my job, I never reveal too much
about myself but try to learn as
much as I can about the other
person.
Manipulative ,,068 ,,186 ,,034 ,,085 ,,867
I see my job principally in terms
of setting objectives and seeing to
it that they are met in an organized
and orderly way.
Bureaucratic ,,804 -,005 ,,155 -,151 ,,008
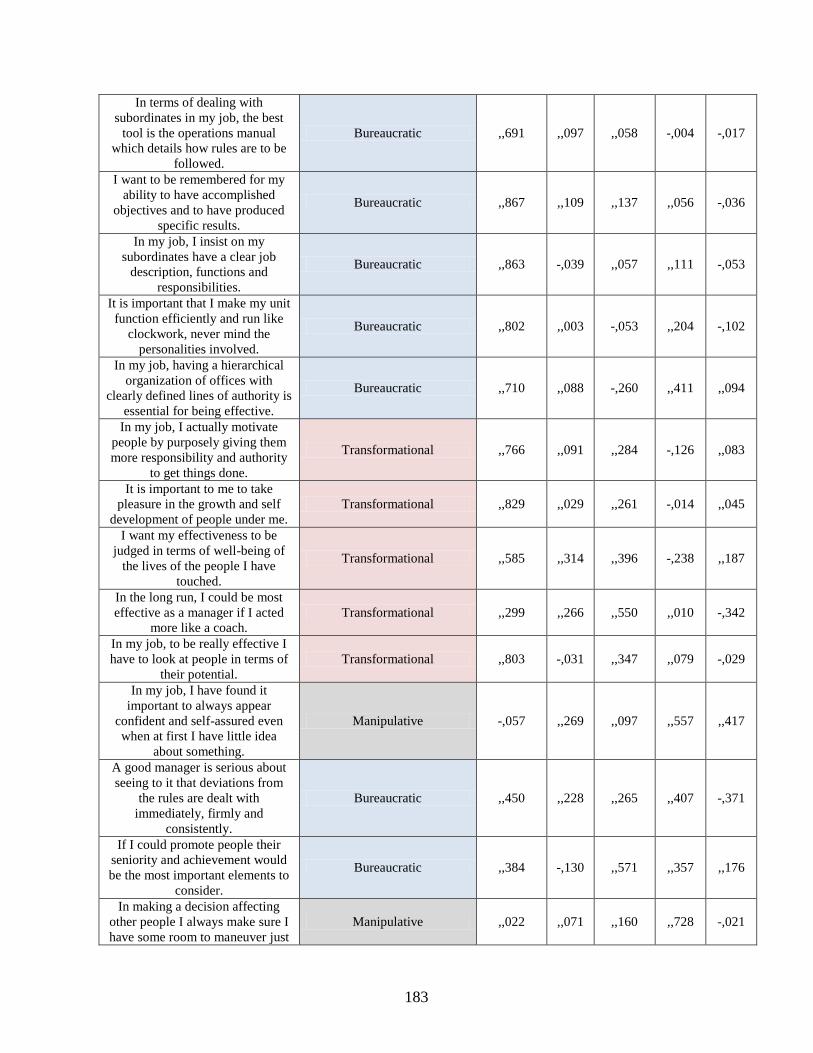
183
In terms of dealing with
subordinates in my job, the best
tool is the operations manual
which details how rules are to be
followed.
Bureaucratic ,,691 ,,097 ,,058 -,004 -,017
I want to be remembered for my
ability to have accomplished
objectives and to have produced
specific results.
Bureaucratic ,,867 ,,109 ,,137 ,,056 -,036
In my job, I insist on my
subordinates have a clear job
description, functions and
responsibilities.
Bureaucratic ,,863 -,039 ,,057 ,,111 -,053
It is important that I make my unit
function efficiently and run like
clockwork, never mind the
personalities involved.
Bureaucratic ,,802 ,,003 -,053 ,,204 -,102
In my job, having a hierarchical
organization of offices with
clearly defined lines of authority is
essential for being effective.
Bureaucratic ,,710 ,,088 -,260 ,,411 ,,094
In my job, I actually motivate
people by purposely giving them
more responsibility and authority
to get things done.
Transformational ,,766 ,,091 ,,284 -,126 ,,083
It is important to me to take
pleasure in the growth and self
development of people under me.
Transformational ,,829 ,,029 ,,261 -,014 ,,045
I want my effectiveness to be
judged in terms of well-being of
the lives of the people I have
touched.
Transformational ,,585 ,,314 ,,396 -,238 ,,187
In the long run, I could be most
effective as a manager if I acted
more like a coach.
Transformational ,,299 ,,266 ,,550 ,,010 -,342
In my job, to be really effective I
have to look at people in terms of
their potential.
Transformational ,,803 -,031 ,,347 ,,079 -,029
In my job, I have found it
important to always appear
confident and self-assured even
when at first I have little idea
about something.
Manipulative -,057 ,,269 ,,097 ,,557 ,,417
A good manager is serious about
seeing to it that deviations from
the rules are dealt with
immediately, firmly and
consistently.
Bureaucratic ,,450 ,,228 ,,265 ,,407 -,371
If I could promote people their
seniority and achievement would
be the most important elements to
consider.
Bureaucratic ,,384 -,130 ,,571 ,,357 ,,176
In making a decision affecting
other people I always make sure I
have some room to maneuver just
Manipulative ,,022 ,,071 ,,160 ,,728 -,021

184
so that I don’t back myself into
corner.
One of the best ways I can do my
job is to appeal to the values and
motives of the people who are
below me.
Transformational ,,124 -,028 ,,808 ,,141 ,,043
Leadership style B (B6T4)
(M4) T(T2B)
M(M2
) M(M)
Total Variance Explained:
335,571%
113,1
37%
77,241
%
66,73
4%
55,51
4%
Principal Component Analysis with varimax rotation and Kaiser normalization (rotation in 6
iterations)
Source: Authors' calculations
Analysis of factors retained was based on Kaisers K1 principle (Kaiser, 1960) and Cattell's
(1966) scree plot test. Based on this analysis, it was decided to retain four factors that explain
62,683% of variance with majority of factor loadings above 0,70.
Interestingly, the leadership style which explains 35,571% of variance is
bureaucratic/transformational, further implying how bureaucratic practices inherited in
socialism are still rooted in organizational dynamics. This observation emphasizes the impact
of cultural values within organizations as complex and timely processes. However, out of five
identified leadership styles, the most frequent are manipulative which cumulatively explain
27,112 % of variance, indicating emergence and popularity of this style among managers.
In order to test whether the gender differences that exist in relation to all identified leadership
styles, Mann-Whitney U and Wilcoxon's W tests were performed. The test results revealed the
relation between machiavellian attitudes and gender.
The test showed statistically significant gender difference (p < .05) within two identified
machiavellian/manipulative leadership styles. For bureaucratic/transformational (B6T4) and
transformational/bureaucratic (T2B) leadership styles there were no statistically significant
differences in relation to gender of managers.
Table 3: Results of Mann-Whitney U test for gender differences and identified leadership
styles
Leadership Style Sig. Mann-
Whitney U
Wilcoxon's
W
Z-score Effect
size r
Bureaucratic/Transformational
B6T4
0,559 455,000 665,000 -,585
Machiavellian - M4 0,045* 346,000 556,000 -2,002 0,239
Transformational/Bureaucratic
T2B
0,603 460,000 670,000 -,520
Machiavellian – M 0,041* 343,000 1618,000 -2,041 0,244
* significance at alpha level of 0.05
Source: Authors' calculations

185
At the normal confidence level of .05 any Z score greater than 1,96 indicates a statistically
significant difference in distribution of the ranks refering that female managers tend to less
prefer manipulative leadership styles in comparison to their male counterparts. This result
supports findings from previous studies dealing with machiavellianism and gender differences.
However, the size of the effect must be considered, since for both machiavellian leadership
styles small to moderate effect sizes were identified. The results of Mann-Whitney U test for
machiavellian/manipulative leadership styles confirm H1, implicating that male managers
demonstrate higher level of manipulative but also self-oriented behaviour and strategical
approach in the context of leadership in relation to their female collegaues who are more
concerned with emotional expressions and interpersonal relations.
Contrarily, H2 was rejected, since no statistically significant difference was detected in
transformational leadership style in relation to gender of managers. However, it was
interesting to investigate whether significant correlations exist between gender and
transformational scale statements without generalizing the results of correlations.
Transformational leadership scale statements were tested in relation to gender using
Spearman's Rho. The results showed statistically significant negative correlation (Spearman's
Rho = -,236; p=0,049) between gender and statement that describes motivation techniques of
transformational leaders towards subordinates by giving them more responsibility and
authority in order to complete their tasks. Mann-Whitney U test for this statement showed
statistically significant difference (p=0,050, Z= - 1,960) in preference to these motivation
techniques in relation to gender. Suprisingly, this result indicates descending medians,
implying that male managers have higher mean rank with value of 38,36 than female
managers (mean rank=28,35). This result indicates that male managers in average prefer
transformational motivation techniques in relation to female managers.
Furthermore, statement related to effectiveness of transformational leaders was tested on
gender differences, measured by well-being of the lives of the subordinates and gender of
leaders. Similarily to previous analysis, Spearman's correlation coefficient was negative and
marginally significant (Spearman's Rho = -,217; p=0,071). Mann-Whitney U test was also
marginally significant (p=0,072) with male managers scoring higher on average (mean
rank=38,21) in relation to female managers (mean rank=28,73), implicating male managers on
average more often observe their effectivenes by well-being of their subordinates contrary to
female managers.
The results of correlation analysis for transformational scale statements necessitate future in-
depth analysis of effect of gender on transformational leadership style aiming to draw more
precise conclusions and implications for researchers and practicioners.
5. Discussion and implications
As Eagly and Johnson (1990) elaborate, men demonstrate more autocratic leadership styles
(dominant, aggressive, competitive) contrary to women who prefer more democratic
apporaches to leadership (cooperation, consensus, intuitive). Results from this study support
Eagly's and Johnson's (1990) notions and also previous research findings on gender
differences and ethical decision-making. Findings imply that female managers express more

186
sensitivity to ethical issues in comparison to male colleauges who tend to exibit more
aggressive and competitive behaviour thereby complying to manipulative leadership practices
in ethical decision-making.
Machiavellian orientation of male managers in Bosnia and Herzegovina certainly highlights
the preference for individualistic, commanding and controlling leadership styles where
hierarchy and dominance shape the organizational dynamics. Contrarily, women tend to avoid
these type of pratices by not complying to manipulative behaviour, scoring significantlly
lower on Mach scales in both identified leadership styles. These findings do not imply that
men are unethical. Rather, they simply indicate that men are more prone to competitive and
dominance-oriented behaviour in organizational context, while women have different attitudes
in regard to ethical leadership.
It also must be taken in consideration that Bosnia and Herzegovina was part of socialist
Yugoslavia, where economy was based on centralized, planned business activities,
significantly influenced by state and politics. After desintegration of Yugoslavia, Bosnia and
Herzegovina became democratic society and a free-market economy. These shifts in political
and economic regimes certainly influenced organizational dynamics. Aggressive and dynamic
competition on the markets requires aggressive leadership styles. Accordingly, Bass (1990)
observes how manipulative behaviour of managers is more common in capitalistic economies,
especially in modern business organizations in USA and Europe (Cyriac and Dharmaraj,
1994).
Altough machiavellistic leadership can be postively related to organizational effectiveness and
performances (Gable i Topol, 1991; Simonton, 1986, Christie i Geis, 1970, Gardner i Avolio,
1995, Deluga, 2001, Bowlby, McDermott i Obar, 2011), if not controlled, it can lead to
malpratices thereby creating negative consequences for both organizations and societies as
well.
Findings from this study present important implications for pratictitioners in order to help
them identify and control overly manipulative leadership behaviour, and encourage leadership
models built on cooperation, collaboration, motivation and intuitive problem-solving when
needed, possibly by focusing the attention on the importance of gender differences in
leadership styles and inclusion of female managers on managerial positions where ethical
dillemas are more frequent. Both male and female managers can be addressed to eachother to
accept and exchange good leadership pratices nevertheless of their leadership style. For
instance, women can acquire knowledge on more strategically defined practices and
competitiveness from their male colleagues while male managers can benefit from learning
about the importance of interpersonal relations and the motivation that lies behind it.
Nevertheless the individual charateristics such as gender, managers must be aware of the
importance of ethical climates which determine the behaviour of individuals in organizations.
Manipulative behaviour can endanger and polute human relations within organization and if
not controlled it can damage the image of organization in public. By imposing explicit ethical
norms and standards, managers can shape the ethics of organizational dynanamics and control
overly manipulative behaviour. Promotion of egalitarian values, fairness and honesty through
codes of conduct and variety of educational programs for employees should be placed on
187
priority list of top managers since these values must be introduced from the top of hierarchy,
thereby implemented throughout the organization. Furthermore, it is advised that educational
institutions such as business schools and universities responsible for educating new
generations of managers should also enlist courses dealing with organizational ethics in their
curricullum. When institutionalized as such, business and organizational ethics can have a
huge impact on the process of identification and supression of manipulative behaviour before
it influences organizational culture, profitability and societal image of organization.
6. Limitations and future directions
Although this study confirms that women and men express significantly different sensitivity to
ethical judgements and dillemas, it also has certain limitations. In order to articulate more
precise conclusions, it is necessary to conduct a research on a larger sample which will include
more female managers in comparison to this research study. The small size of the sample
makes it difficult to generalize the findings to a larger population. It would be interesting to
investigate what the results would be if a similar study with the same survey instrument were
conducted on a larger sample. Even though statistically significant gender differences were
identified, the emphasis must also be placed on the size of the effects. In study by Kabacoff
(2010) effects also tend to be small to moderate in size, meaning that gender differences can be
observed as „subtle but real“. It further implicates that gender differences, when found, can
also be a reflection of other objective or subjective organizational and leadership contigencies
and therefore can be observed as moderating variable.
Mann-Whitney U test was not significant for gender differences for transformational
leadership. However we performed the correlation analysis to satisfy our curiosity. Correlation
analysis revealed that men tend to prefer transformational motivation and effectiveness
techniques contrary to women. Also, it would be interesting to devote research efforts to
investigation of the preference for both men and women to transformational leadership style
on a larger sample by including age as moderating variable which could influence the strength
of relationship between gender and leadership style.
7. Conclusion
The results of this study are consistent with previous research on existing gender differences in
ethical judgements and decision-making. The findings suggest that men and women differ in
their perception of ethical dillemas in organizational context, implicating men's preference for
more competitive, autocratic, aggressive and hierarchy-based leadership. In contrast, women
view ethical dillemas in accordance to their leadership styles which are more democratic,
intuitive and cooperation-oriented. This observation is similar to conclusions made by Smith
and Oakley (1997), stating that different values of female executives will be reflected in
distinct leadership styles.
As noted earlier in the paper, gender differences are product of different influences whether
they are biological, psychological, sociological or socio-cognitive. Therefore, researchers must
be cautious not to overly simplify the background of identified differences between men and
women in business studies. Studies dealing with gender differences in organizational context
often neglect the complexity of gender phenomenon or even tend to define leadership and
188
gender differences in a narrow manner. These pratices can lead to shortcomings, biases and
stereotypical notions especially in changing environments such as transitional economies.
As proven in this study, leadership is a multidisciplinary and complex phenomena and it sets
many „invisible“obstacles to researchers in this field. Therefore it must be assumed that it is
dynamic, non-universal and influenced by contextual forces which differ from organization to
organization and from culture to culture.
References:
Allmark, P. (1995): Can there be an ethics of care?, Journal of Medical Ethics, No. 21, pp. 19 – 24
Baird, J.E., Zelin, R.C. and Brennan, P.J. (2006): Academic major, gender, personal values, and
reactions to an ethical dillema, Journal of Business Case Studies, Vol. 2, No. 2, pp. 73 – 82
Bampton, R. And Maclagan, P. (2009): Does a „care orientation“ explain gender differences
in ethical decision making? A critical analysis and fresh findings, Business Ethics: A
European Review, Vol. 18, No. 2, pp. 179 – 191
Bandura, A. (1986): Social foundations of thought and action: A social cognitive theory,
Englewood Cliffs, NJ: Prentice-Hall
Bandura, A. (1991): Social cognitive theory of moral thought and action, in W.M. Kurtines
and J.L. Gewirtz (eds.), Handbook of moral behaviour and development, Vol. 1, pp. 45 – 103,
Hillsdale, NJ: Erlbaum
Bandura, A. (1992): Social cognitive theory of social referencing, in S. Feinmann (ed.), Social
referencing and the social construction of reality in infancy, pp. 175 – 208, New York:
Plenum Press
Bandura, A. (1999): Social cognitive theory of personality, in L.Pervin and O. John (eds.),
Handbook of personality, 2nd edition, New York, Guilford Publications
Barlow, A., Qualter, P. And Stylianou, M. (2010): Relationship between machiavellianism,
emotional intelligence and theory of mind in children, Personality and Invididual Differences,
Vol. 48, pp. 78 – 82
Bowlby, K., McDermott, E.P. i Obar, R. (2011): Personal values, behaviour and conflict
resolution styles: A study of contemporary mainland chineese business students, Journal of
International Business Ethics, Vol. 4, No. 1, pp. 42 – 59
Brown, M.E. and Trevino, L.K. (2006): Ethical Leadership: A Review and Future Directions,
The Leadership Quarterly, 17, pp. 595-616
Brown, M.E., Mitchell, M.S. (2010): Ethical and Unethical Leadership – Exploring New
Avenues for Future Research, Business Ethics Quarterly 20:4, pp. 583-616
189
Burns, J. M. (1978). Leadership. New York: Harper & Row
Bussey, K. And Bandura, A. (1999): Social cognitive theory of gender development and
differentiation, Psychological Review, No. 106, pp. 676 – 713
Campbell, R.L. and Christopher, J.C. (1996): Moral development theory: A critique of its
kantian presuppositions, Developmental Review, No. 16, pp. 1 – 47
Catell, R.B. (1966): The scree test for the number of factors, Multivariate Behavioural
Research, 1, pp. 245 – 276
Chodorow, N. (1984): The preproduction of mothering: Psychoanalysis and the sociology of
gender, University of California Press.
Christie, R. I Geis, F. (1970): Studies in Machiavellianism, New York: Academic Press
Cyriac, K. and Dharmaraj, R. (1994): Machiavellianism in Indian management, Journal of
Business Ethics, Vol. 13, No. 4, pp. 281 – 286
Dabrowski, M., & Antczak, R. (Eds.) (1996). Ukrainska droga do gospodarki rynkowej 1991–
1995. Warszawa: Wydawnictwo Naukowe, PWN [in Polish].
Deluga, R.J. (2001): American presidential Machiavellianism implication for charismatic
leadership and rated performance, The Leadership Quarterly, Vol. 12, pp. 339 – 363
Eagly, A.H. (1987): Sex differences in social behaviour: A social role interpretation,
Hillsdale, NJ: Erlbaum
Eisenberg-Berg, N. (1979): Development of children's prosocial moral judgement,
Developmental Psychology, No. 15, pp. 128 – 137
Epstein, C.F. (1988): Deceptive distinctions: Sex, gender and the social order, New Haven,
CT: Yale University Press
Fausto-Sterling, A. (1997): Beyond difference: A biologist's perspective, Journal of Social
Issues, No. 53, pp. 233 – 258
Freud, S. (1905/1930): Three contributions of the theory of sex, New York: Nervous and
Mental Disease Publishing Co. (original work published 1905)
Frost, P.J. (2004): New Challenges for Leaders and Their Organization, Organization
Dynamics, 33: 111-127
Gable, M., Topol, M.T. (1991): Machiavellian Managers: Do They Perfom Better?, Journal of
Business and Psychology, Vol. 5, Spring 1991
Gardner, W.L. i Avolio, B. J. (1995): Charismatic leadership: The role of impression
management, Paper presented at the meeting of the Academy of Management, Vancouver,
B.C.
190
Gilligan, C. (1977): In a different voice: Women's conceptions of self and morality, Harvard
Educational Review, pp. 481 – 517
Gupta, S., Walker, E.D. and Swanson, N.J. (2011): Ethical behaviour of graduate business
students: An examination of the effect of age, gender, GPA and work experience, Southern
Journal of Business and Ethics, Vol. 3, pp. 137
Hayton, J.C., Allen, D.G. and Scarpello, V. (2004): Factor retention decisions in exploratory
factor analysis: A tutorial on parallel analysis, Organizational Research Methods, Vol. 7, No.
2, pp. 191 - 205
Hitt, W.D. (1990): Ethics and Leadership – Putting Theory Into Practice, Battelle Press
Hofstede, G. (1983): The cultural relativity of organizational pratices and theories, Journal of
International Business Studies, Fall, pp. 75 – 89
Hyde, J.S. (2005): The gender similarities hypothesis, American Psychologist, Vol. 60, No. 6,
pp. 581 – 592
Kabacoff, R.I. (2010): Gender differences in organizational leadership, Management Research
Group study, http://www.mrg.com/documents/Gender_Paper_1998.pdf, accessed 15th
February 2012
Kluckhohn, C. (1951): Universal categories of culture, in D. Lerner and H.D. Lasswell (eds.),
The policy sciences, Stanford, CA: Stanford University Press
Kohlberg, L. (1966): A cognitive-developmental analysis of children's sex-role concepts and
attitudes, in. E.E.Maccoby (ed.): The Development of sex differences, pp. 82 – 173, Stanford,
CA: Stanford University Press
Kohlberg, L. (1969): Stage and sequence, in D.Goslin (ed.): Handbook of Socialization Theory
and Research, Chicago: Rand McNally
Lifton, P.D. (1985): Individual differences in moral development: The relation of sex, gender
and personality to morality, Journal of Personality, Vol. 53, No. 2, pp. 306 – 334
Martin, C.L., Ruble, D.N. and Szkrybalo, J. (2002): Cognitive theories of early gender
development, Psychological Bulletin, Vol. 128, No. 6, pp. 903 - 933
Mazeikiene, N. (2004): Gender differences in machiavellian art of manipulation, Socialiniai
Mokslai, Vol. 43, No. 1, pp. 38 – 45
McIntosh, G.L., Rima, S.D.Sr. (1997): Overcoming the Dark Side of Leadership: The
Paradox of Personal Disfunction, Grand Rapids, MI: Baker Books
Murdack, P. E. (1994): Are the Elderly Really Machiavellian? A Reinterpretation of an
Unexpected Finding, Journal of Business Ethics, 13: 757-758

191
O'Fallon, M.J. and Butterfield, K.D. (2005): A review of the empirical ethical decision-making
literature: 1996 – 2003, Journal of Business Ethics, Vol. 59, No. 4, pp. 375 – 413
Rayburn, M.R., Rayburn, L.G. (1996): Relationship Between Machiavellianism and Type A
Personality and Ethical Orientation, Journal of Business Ethics, 15: 1209-1219
Rayburn, M., Overby, J. And Hammond, K. (2003): An abbreviated empirical study of the
differences in charisma, ethics, personality and machiavellian characteristics of male and
female marketing students, Allied Academies International Interne Conference Proceedings,
Allied Academies, Inc. Cullowhee, North Carolina, pp. 78 – 83
Richmond, K.A. (2001): Ethical Reasoning, Machiavellian Behaviour and Gender: The
Impact on Accounting Students' Ethical Decision-Making, A Dissertation, Virginia
Polytechnic Institute and State University
Sehic, Dz., Rahimic, Z. And Kovacevic, J. (2010): Participation of women in management in
B&H companies, Economic Development Perspectives of SEE Region in the Global
Recession Context: conference proceedings: International Conference of the School of
Economics and Business in Sarajevo ICES 2010, October 14 – 15, 2010. Sarajevo: School of
Business and Economics 2010. str. 41 – 42. ISBN 978-9958-25-046-0
Simonton, D.K. (1986): Presidential personality: biographical use of the Gough Adjective
Check List, Journal of Personality and Social Psychology, vol. 51, pp. 149 – 160
Smith, L.P. and Oakley, E.F. III (1997): Gender-related differences in ethical and social values
of business students: Implications for management, Journal of Business Ethics, Vol. 16, No. 1,
pp. 37 – 45
Smith, R. D., DeBode, J. D., & Walker, A. G. (2013). The influence of age, sex, and theism on
ethical judgments. Journal of Management, Spirituality & Religion, 10(1), pp. 67-89.
Tepper, B.J. (2000): Consequences of Abusive Supervision, Academy of Management
Journal, 43: 178-190
Tepper, B.J., Henle, C.A, Lambert, L.S., Giacalone, R.A, Duffy, M.K. (2008): Abusive
Supervision and subordinates' Organizational Deviance, Journal of Applied Psychology 93,
721-732
Trivers, R.L. (1972): Parental investments and sexual selection, in B.Campbell (ed.): Sexual
selection and the descent of man 1871 – 1971, pp. 136 – 172, Chicago: Aldine
Wejnert, B. (2003) The Effects of Growth of Democracy and Transition to Market-Based
Economies on Women's Well-Being, Journal of Consumer Policy, Vol. 26, No. 4, pp. 468
White, R. D. (1999): Are women more ethical? Recent findings on the effects of gender upon
moral development, Journal of Public Administration Research and Theory – J-PART, Vol. 9,
No. 3, pp. 459 – 471

192
BETTER REGULATION IN BOSNIA AND HERZEGOVINA: A CENTRAL
PLANK FOR THE RULE OF LAW
Fatima Mahmutcehajic
Economics and Business Trg Oslobodjenja – Alija Izetbegovic 1
Phone: ++ 387 33 253 772; Fax: ++ 387 33 275 994
E-mail: [email protected]
Vedad Silajdzic
School of Economics and Business Trg Oslobodjenja – Alija Izetbegovic 1
Phone: ++ 387 33 275 930; Fax: ++ 387 33 275 994
E-mail: [email protected]
Abstract
The European Commission introduced a Better Regulation Agenda in 2015 and identified
the areas of improvement for the existing body of EU legislation in 2017. This
comprehensive package of reforms covering the entire policy cycle will boost openness and
transparency in the EU decision-making process, improve the quality of new laws through
better impact assessments of draft legislation and amendments, and promote a constant and
consistent review of the existing EU laws, so that EU policies achieve their objectives in the
most effective and efficient way. In such a state of affairs, how can we posit a constructive
reinvestigation of the law-making process in Bosnia and Herzegovina? Is better regulation
the result of good legislative tools and procedures that enables high quality legislation and
rule of law? How does legal tools and procedures enables high quality legislation? The goal
of this paper is to show that Bosnia and Herzegovina must rigorously assess the impact of
legislation in the making, including best practices and principles during the legislative
process which relies on evidence and transparent processes. It can only work if it is a
shared commitment at all the governmental levels of Bosnia and Herzegovina.
Keywords: better regulation, law, business
JEL classification:
K20
Acknowledgements
This paper is based on research within the project “Establishment and/or Strengthening of
Capacities of the Institution/s for Control of Regulations and Establishment of the System of
Reduction of Administrative Barriers”, State Office for Public Administration, Bosnia and
Herzegovina (2016-2018). We are gratefully acknowledge the support of the project team
leader professor Veljko Trivun, for his extensive inputs. The authors would like to thank to
all members of the Supervisory and Implementation Teams at all levels of government in
Bosnia and Herzegovina, for their research assistance and their insightful comments during
the project.
193
1. Introduction
The three main pillars of the rule of law reform are justice, greater access to justice and
support to economic growth, which is in accordance with the requirements for the EU
accession process. In this process, Bosnia and Hercegovina in particular will be required to
fulfil specific preconditions. Precisely, the Stabilization and Association Agreement states
“in their cooperation on justice and home affairs the Parties shall attach particular
importance to the consolidation of the rule of law, and the reinforcement of institutions at all
levels in the areas of administration in general and law enforcement and the administration
of justice in particular.” (SAA, art.78) In this respect, the endorsement of the Bosnia and
Herzegovina 2015-2018 Reform Agenda has reemphasized the need to implement further
reforms in the rule of law area.
Jean Claude Juncker, the President of the European Commission, in his speech about the
status of the European Union in 2017 said: “If we want more stability in our neighbourhood,
then we must maintain a credible enlargement perspective for the Western Balkans. It is
clear that there will be no further enlargement during the mandate of this Commission and
this Parliament. No candidate is ready. But thereafter the European Union will be greater
than 27 in number. Accession candidates must give the rule of law, justice and fundamental
rights utmost priority in the negotiations.”(President Juncker Union Address
SPEECH/17/3165: 2017)
In the beginning of 2018, “A credible enlargement perspective for and enhanced EU
engagement with the Western Balkans” (COM: 2018, 65) was adopted, commonly
presented to the public under the title “the EU Strategy for the Western Balkans”. It includes
the views of the highest organisational structures of the European Union regarding the
processes six Western Balkans countries joining the EU of: Bosnia and Herzegovina,
Serbia, Montenegro, Albania, Kosovo and Macedonia. This is the most relevant document
that presents the potential developments in these countries, which will lead towards the
wanted goal and reach it – the goal of these countries joining the European Union. The
existence of such a document facilitates but does not simplify the task of outlining this
process and viewing it from the Bosnian perspective.
The required improvement of the economy is not possible without the rule of law. Legally
dysfunctional countries cannot be competitive in the economic map of the world and this is
why this topic is of extreme relevance for Bosnia and Herzegovina. In the abovementioned
document, for which it is justified to say that it represents a complete program of changes in
specific countries that are required for their accession to the European Union, the rule of law
has again been given central importance. A clear determination and representation of the
meaning of the rule of law and legal certainty as sine qua non is a precondition of economic
attractiveness to foreign investors and economic development. If there are no rule of law
and legal certainty, there is no and there cannot be any serious, systematically established
and long-term oriented foreign investment.
In research paper (Rigobon, Rodrik, 2004:5) authors discussed interrelationship between
rule of law, democracy, openness and income. Based on previous literature overview and
returning to the questions and statements they posed in their paper, their main important

194
findings that support our research and posted questions is that "Democracy and the rule of
law are both good for economic performance, but the latter has a much stronger impact on
incomes (both statistically and quantitatively). Rule of law and democracy are generally
mutually reinforcing and they tend to feed on each other." Their research results reinforce
findings about a "strong casual impact from economic institutions (the rule of law) to
incomes". (Rigobon, Rodrik, 2004:22).
Legal certainty, and therefore predictability as well, are conditioned by the quality of legal
regulations. The strengthening of the rule of law is not merely an institutional issue; it
requires social reforms. The goal of this paper is to show that Bosnia and Herzegovina must
rigorously assess the impact of legislation in the making, including best practices and
principles during the legislative process which relies on evidence and transparent
processes. It can only work if it is a shared commitment at all governmental levels of
Bosnia and Herzegovina. The plan of the paper is as it follows: Section 2 lays out the basic
recquirements for the Western Balkan countries accession to the EU - reforms that must be
implemented in the areas of the rule of law, fundamental rights and good governance.
Section 3 presents principles of better regulation. Existing methodology for impact
assessment in Bosnia and Herzegovina as prerequisite for better regulation is described in
Section 4. Finally, Section 5 provides concluding observations.
2. Rule of law in focus of credible enlargement perspective
In the abovementioned document (COM, 2018: 65), it is clearly stated that the fulfilment of
the set requirements will most probably enable Montenegro and Serbia to join the European
Union by 2025. For Bosnia and Herzegovina, such a possibility has not been anticipated,
nor is it predictable. This means that, in such a process, Bosnia and Herzegovina could
become fully surrounded by the EU Member States by 2025, while still outside it. This fact
is of crucial relevance for the analysis of the present state in the country and the
determination of a full program of its change in order to achieve the goal which is not
questionable in the document.
In order for the Western Balkans countries to meet the conditions for the accession to the
European Union, i.e. for them to meet the membership requirements and firmly strengthen
their democracies, comprehensive and convincing reforms in the key areas are required,
primarily in the rule of law, competitiveness and regional cooperation. "To make the
ambitious best-case scenario a reality, action must be taken now" (COM, 2018:65). The
reforms that must be implemented in the areas of the rule of law, fundamental rights and
good governance are still the most important issues for the Western Balkans, and the
European Union will evaluate the progress of the countries on the road to accession
precisely based on the achievements in these areas (COM, 2018: 65). These states must
adopt the rule of law, fundamental rights and good governance in a more powerful and more
convincing manner. If these values are not respected, it is seen as a digression from or a
threat to investment and trade. To the extent that the Better Regulation Agenda would be
about reducing the quantity of EU regulation in the interest of business, it would seem to
be a political choice and thus
need a clear democratic validation (see in ed. Garben, Govaere The EU Better Regulation
Agenda: A critical assessment 2018:9).

195
Independence, quality and efficiency of the justice system must be ensured. The
independence of the justice system and of judges is significant for ensuring lawfulness, as
well as for the establishment of accountability of executive and legislative authorities. This
is a precondition of any democratic society established upon the rule of law, which as such
can ensure economic development.
Article II/3 e) of the Constitution of Bosnia and Herzegovina provides for the right to a fair
trial and the right to a fair hearing in civil and criminal matters. One of the key elements of
the right to a fair trial is to make decisions and finalise the procedure within a reasonable
time period. In Bosnia and Herzegovina, in practice, even though there is a range of legal
acts aimed at ensuring the right to trial within a reasonable time period, the inefficiency of
the system of justice, long judicial processes and non-execution of judicial decisions are a
reality (FIC White Book, 2015/2016: 79).
Independence of the justice system is a priority when it comes to the rule of law and legal
certainty. A recent state study for Bosnia and Herzegovina regarding necessary
improvements for business environment (FIPA 2018:28) that surveyed over 500 companies
with foreign capital operating in Bosnia and Herzegovina lists legal uncertainty (which
includes not only the courts and prosecutors, but also the too frequent and non-harmonised
amendments to regulations in general) as one of the key reasons of their reinvestment plans
not being as fast as they would like. For potential investors (investors that consider several
countries for their investment, including Bosnia and Herzegovina), the matter of reliability
of courts and prosecutors (along with the matters of availability of the needed workforce,
political safety, etc.), i.e. the existence of a safe legal state is the crucial issue (more in: FIC
White Book, 2015/2016).
In accordance with that, a resolution of open questions in Bosnia and Herzegovina, such as:
an increase of the number of judges in economic disputes; a higher level of specialisation of
judges along with the necessity to provide training for judges which would enable them to
adequately understand the market and relevant legislation in Bosnia and Herzegovina;
adoption of a specific package of measures regarding trial within a reasonable time period,
and issues related to this; provision of a stable and predictable arbitration system that
investors trust, acceleration of the harmonisation of data in the cadastre and land registries
(FIC White Book, 2015/2016:86-87), as well as a number of other issues, is extremely
important for ensuring legal certainty and hence positioning Bosnia and Herzegovina as a
country attractive to foreign investment.
The countries must eradicate corruption, with no compromise (COM, 2018:65). Strong and
independent institutions are important for the prevention and processing of corruption, as
well as the implementation of more efficient investigations and initiation of procedures,
which lead to just and valid judicial decisions. It is necessary to significantly strengthen the
specialised investigation structures for fight against corruption and organised crime, as well
as judicial authorities. Measures such as illegal asset forfeiture, loss of the right to perform
public office, stricter code of conduct of public officials, and availability of information and
appeal processes for citizens and business entities must be enforced and implemented.
196
The countries must set stricter frameworks for the prevention of corruption. A higher
transparency is necessary in the management of public funds, particularly in all the stages of
public procurement – the area particularly susceptible to corruption. The countries must
significantly increase the transparency, competitiveness and lawfulness of public
procurement tenders, restrict the use of secret procedures and include oversight that
excludes political influence on bidders. Some authors argue that better regulation is a linear
process in which a problem exists, information is lacking and public consultations produces
information and the decision-maker can eventually decide based on the stakeholders’
feedback (Carausan, 2016:120)
The Action Plan states that the use of transparent e-procurement available to the public must
be fully developed in the period from 2018 to 2019 (Annex COM 2018 65:5.3). This way,
the citizens will have a clear picture of how their tax money is spent, from the initial tender
to the final execution of contracts. This is a framework for strengthening the citizens’ tax
morale, and hence for reducing grey economy. In public institutions, the culture of
management accountability and internal control also has to be of critical importance.
According to the abovementioned Strategy, the fundamental rights are widely included in
the legislation of the Western Balkans states, but a lot more must be done regarding their
full application in practice. A particular focus has to be on the protection of freedom of
speech and independence of the media as a pillar of democracy. The major measure
proposed for the time period 2018-2019 in this area is the roll-out of support for the Western
Balkans through the European Endowment for Democracy in the area of independent and
pluralistic media and civil society (Annex COM, 2018 65:1.7). The strengthening of
democratic institutions is of fundamental importance. This includes ensuring constructive
dialogue in the entire political spectrum, particularly in the parliaments.
Public administration reform is a backbone for strengthening management at all levels.
Public administration reform in the EU Member States is among five most important tasks
to support economic development (Excellence in Public Administration for Competitiveness
in EU Member States, 2012). This includes the improvement of quality and liability of
administration, promotion of professionalism, depolitcization and transparency, including
the hiring and dismissal of administration, more transparent management of public finances,
and better services for citizens. Better regulation is a popular label for the regulatory reform
agenda (Radaelli, Meuwese, 2009:639), but what is behind this label? Lodge notes, in his
article on regulatory politics in Europe, the rise of academic interest around this topic
(Lodge, 2008:289). Also Lodge (Lodge 2009:145) suggests that the contemporary debate is
flawed by competing assumptions hiding behind a common language. A more promising
approach is to embed high-quality regulation into regulatory conversations rather than
imposing requirements through hierarchical means.
Impact assessment today is a fascinating point to observe how evidence-based policy and
‘political’ decision-making interact (Dunlop, Radaelli 2016:34). Governments must ensure
for interest groups to actively participate in the processes of reforms and creation of politics
(OECD, 2008, OECD, 2012). Research on regulatory quality has shown that it cannot be
achieved by simply clamping down on the total number of rules. It requires a proper
institutional design of regulatory oversight institutions (Dunlop, Maggetti, Radaelli, Russel

197
2012:24). This all must be introduced in a systematic and long-term established but urgently
implemented process of digitalisation of the entire state system. All these reforms are the
very essence of the road of the Western Balkans countries to the European Union. A
conceivable momentum will be achieved only by the accomplishment of measurable and
sustainable results. This is the view of the European Union Member States regarding the
necessary systematic changes in the entire state order of the six countries. However, such
changes can and must be made only by the authorities of these states. Iyigun and Rodrik
analyze the interplay of policy reform and entrepreneurship in their cross-country evidence
paper (Iyigun &Rodrik, 2004) in which their model offer insights why institutional reforms
have worked in a handful of countries and failed in many others. In sum they argue that "on
the normative side, it helps to identify the circumstances under which different types of
policy reform - policy tinkering versus deeper institutional reforms - are likely to foster
structural change and economic growth." (Iyigun &Rodrik, 2004:4)
3. Principles of better regulation
Better regulation means doing different things, and also doing them better. It does not mean
to deregulate but rather to regulate better; achieving policy goals in the most efficient way,
through EU rules when needed but also at the national level and/or through non-regulatory
means whenever that is sufficient. The Commission wants to update its law-making
practices to ensure that they meet with modern requirements and citizens' expectations for
maximum transparency and wide consultation. Stakeholders also expect our laws to
effectively deliver on the social, environmental and economic objectives we have set, to be
well scrutinised in terms of the burden they create for businesses, citizens or public
administrations when they are implemented, and to have clear measures for their success
which are revised where necessary. (Better Regulation Agenda: Questions&Answers, 2015).
Better regulation relies on evidence and transparent processes, which involves citizens and
stakeholders (Better regulation for better results - An EU Agenda COM 2015). As it was
explained in the Communication from the Commission to the European Parliament and the
Council, with this program, the EU legislation will be able to focus on the areas with the
highest value added. The accomplishment of the goals of joint politics will become efficient
and effective, clear, simple and understandable, and the regulatory burden of the participants
will be reduced to the lowest level possible, hence increasing the competitiveness and the
sustainability of the EU economy. The Commission identified the areas of improvement for
the existing body of EU legislation (Completing the Better Regulation Agenda: Better
solutions for better results, SWD 2017 675). When proposing new policies and laws, the
Commission is focusing on the things that really do need to be done by the EU and makes
sure they are done well.
In this context, the basic documents of better regulation are the following:
a) Interinstitutional Agreement between the European Parliament, the Council of
the European Union and the European Commission on Better law-making
b) Better Regulation Guidelines
c) Better Regulation Toolbox

198
Making sure the EU laws are fit for purpose,the Commission is assessing the performance
of the existing body of EU law and making changes where necessary to keep the laws up-to-
date. The Regulatory Fitness and Performance (REFIT) programme was established in 2012
to make EU law simpler and to reduce the costs of regulation while still achieving benefits.
The Commission is strengthening REFIT, by creating more possibilities for stakeholders
and EU countries to contribute. The REFIT platform chaired by First Vice-President
Timmermans, collects suggestions and makes recommendations on how to simplify laws.
The state of play of REFIT initiatives for simplification and reducing regulatory burden is
published in the REFIT scoreboard. Evaluations and fitness checks are used to assess if EU
laws, policies and funding programmes are delivering the expected results at a minimum
cost.
Through its Work Programme on Better Regulation, the EC pledged to create, deliver and
support the implementation of interventions of the best possible quality. This covers the
entire cycle of politics, from its planning, adoption, creation, then implementation,
application (including execution), evaluation and review. The purpose of all interventions,
whether legislative or non-legislative, as well as the spending programs and other measures
is to achieve certain goals. According to the Better regulation Toolbox (Better regulation
Toolbox, 2017:6-7), the principles of better regulation need to:
a) Be well-planned and timely, and all the preparatory and analytical work, including
stakeholder consultations, must be done in time to feed into the policy development
process;
b) Be of the highest quality, and the basis of any stakeholder consultation should be
clear, concise and include all necessary information to facilitate responses;
c) Be based on the best available evidence including scientific advice, or a transparent
explanation of why some evidence is not available and why it is still considered
appropriate to act;
d) Ensure wide participation of all interest groups throughout the policy cycle, and
open web-based public consultations, which should be mandatory elements of any
consultation strategy associated with and evaluation or impact assessment.
Stakeholders must be given sufficient time to respond (12 weeks for consultation) or
prepare responses (4 working weeks for meetings);
e) Comply with subsidiarity and proportionality and explain how these two principles
are respected. The actions must be relevant and necessary, offer value beyond what
Member State action alone can deliver and not go further than is necessary to resolve
the problem or meet the policy objective;
f) Be comprehensive, while considering relevant economic, social, and environmental
impacts of alternative policy solutions. Stakeholders' views must be collected on all
key issues;
g) Be coherent across different policy domains. New initiatives, impact assessments,
consultations and evaluations must be prepared collectively by all relevant services
in the framework of interservice groups;
h) Be proportionate to the type of intervention or initiative, the importance of the
problem or objective, and the magnitude of the expected or observed impacts;
i) Be clearly visible to the outside world if they are to be understood and credible.
Results of evaluations, impact assessments and consultations should be widely

199
disseminated. Stakeholder responses should be acknowledged and consultation
results widely disseminated through a single access point. The reasons for
disagreeing with dissenting views must be explained;
j) Be objective and balanced. They should inform political choices with evidence, and
not the other way around;
k) Be underpinned by sufficient human and financial resources to enable each
evaluation, impact assessment or consultation to deliver a timely high-quality result.
Director Generals should establish centres of expertise (or functions) to support
Better Regulation activities throughout the policy cycle.
The application of such principles should provide a rigorous evidence base in order to adopt
mindful decisions and help increase the effectiveness, coherence, usefulness, relevance and
efficiency of the Commission’s activities. In essence, this only refers to the impact of the
EU legal legacy on the national legislation of the full members of the EU.
In the Credible Enlargement Perspective (COM 2018 65), it is clearly determined that
Bosnia and Herzegovina significantly lags behind Serbia and Montenegro. It is not a
consequence of anything but a lack of political will and synergy in the implementation of
very clear requirements. For those who express discontent with a set time period for
probable fulfilment of the required changes in the area of the rule of law and legal certainty,
and hence fulfilment of the conditions for joining the European Union, there is only one
answer regarding such discontent: European Union has widely opened its door to Bosnia
and Herzegovina, but the set and known requirements must be met by the authorities of
Bosnia and Herzegovina!
4. Principles of impact assessment in Bosnia and Herzegovina: a way to better regulation
At its best, RIA is a way to increase integrity and trust in the policy-making processes and
improve regulatory outcomes by promoting informed decision-making, which is targeted,
proportional, consistent, accountable and transparent (Camilla Adelle, Donald Macrae,
Andreja Marusic& Faisal Naru, 2015:237). "While the European Commission is certainly
the chef de file on issue of Better regulation in the EU, while generally subscribing to Better
Regulation's objectives, the European Parliament has a rather different view from the
Commission on some of the concrete requirements that it entails, or should entail, for the
legislator, such as the obligation to conduct Impact Assessments and to take the
Commission's assessment as a starting point ... All this means that we have to be very
careful in drawing any firm conclusions about the features and consequences of Better
Regulation in general and to refer to its specific 'incarnations' where appropriate" (see in ed.
Garben, Govaere The EU Better Regulation Agenda: A critical assessment 2018:4)
The general goal of Regulatory Impact Assessment is to create the conditions for creating
and adopting better regulation based on available facts and evidence, so that the legislation
goals are met at the lowest possible cost and do not create obstacles to the business
environment, citizens and society in general. It may be added that the general goal of the
impact assessment process is also consideration of the proposals of possible normative or
other solutions to encourage the business environment, strengthen the rule of law, and
reduce the costs of implementing the legislation. At the same time, the requirements related
to ensuring the protection of human rights and fundamental freedoms, personal and political

200
freedoms, as well as economic, social, cultural and other rights must be met (Methodology
for Impact Assessment - Guide, 2017: 27).
The methodology for the BiH level (Methodology for Impact Assessment in drafting
legislation for the BiH level, 2017) specifically prescribes principles for all impact
assessments. The principles on which each impact assessment is based are as follows:
a) Focus - theproposals for possible solutions are aimed at a complete or partial
elimination of negative impacts of the identified problems;
b) Proportionality – the proposals for possible solutions are proportional to the risk of
causal links of the problems;
c) Responsibility –the proposals for possible solutions are a reflection of a detailed
assessment and selection of the most favourable solution that implies responsibility
for action in a particular area, decisions made in such respect, consistent
implementation thereof, including reporting obligation, especially with respect to
responsibility for the consequences of selected solutions;
d) Transparency - theproposals for possible solutions are the result of a detailed
assessment of possible impacts and consultations with all stakeholders;
e) Objectivity - the impact assessment and the proposal for the most favourable
solution is based on an objective assessment according to the set criteria;
f) Compliance - the proposed solutions are in compliance with the legal framework in
BiH, international standards and the Acquis;
g) Fiscal sustainability - the possible solutions and the proposal for the most favourable
solution are in compliance with the medium-term fiscal framework;
h) Comprehensive (integrated) approach - the impact assessment is conducted in a
balanced manner, in a correlated method of assessing fiscal, economic, social and
environmental impacts.
Other principles may also be discussed:
a) Cost effectiveness in the implementation of impact assessments and throughout the
process of adoption (passage) of legislation, in order for the costs to be planned, first
of all, and then rationalised;
b) Efficiency, in terms of appropriate promptness and mobility in individual stages,
includingthe mandatory compliance with all the prescribed procedures;
c) Sustainability of the proposed solution.
In FBiH, Article 4 of the Decree on Regulatory Impact Assessment Procedure (Decree,
2014) stipulates the following principles:
a) Focus –the proposed options are focused on eliminating unwanted negative effects
of the existing problems,
b) Proportionality –the proposed options are applied when necessary and proportionate
to the risk consequential to the problem,
c) Responsibility –the proposed options are a responsible solution in the given areas
and for given groups
d) Transparency –the proposed options are the result of a transparent evaluation and
consultation process,
e) Objectivity –the impact assessment and the proposal for the most favourable option

201
are based on an objective assessment according to the given criteria, and
f) Compliance –the proposed options are in compliance with other existing legislation.
The RIA Methodology in RS (Methodological Guide for Regulatory Impact Assessment for
the RS Government, 2015) speaks in particular of the principles, and the principles are as
follows:
a) necessity, telling us whether we need a new regulation, whether it meets the
standards and whether it can remove administrative barriers,
b) efficiency, whereby we need to be sure that a new regulation can be adequately
applied in practice and that the regulatory goals can be met as soon as during the
first stage of application thereof,
c) consistency is important in the regulatory process because it provides predictability
and legal certainty to groups and individuals within one society and economy,
d) proportionality means maintaining a balance between the benefits of a regulation
and the constraint it imposes. In addition, this principle also ensures that the
proposed burdens will not impose a risk or that the penalties for non-compliance will
be proportionate to the risk,
e) responsibility is assumed as a fundamental principle due to the complexity of the
regulatory process. This principle means that there is a clear and certain role of those
who propose regulation, those who need to apply it, those who need to respect it and
those who are responsible for appeals
f) transparency contributes to the quality of regulation, as it enables the immediate
collection of information from citizens as consumers and especially those directly
affected by the regulation. This approach gives greater credibility to the regulatory
process due to the inclusion of all key stakeholders in the decision-making process.
5. Instead of conclusion
If we want to improve socio-economic environment of Bosnia and Herzegovina, attracting
foreign investors is one of the most important prerequisites for this. If there is no rule of law
and legal certainty, it means they ought to be built. Only when they are there, the doors to
development and foreign investment will be open. This fact is of crucial relevance for the
analysis of the Bosnia and Herzegovina current status and the determination of a full
program of changes in light of credible enlargement perspective in order to achieve the goal
- EU accession.
All this should be brought into the context of the principles on which the Better Regulation
Tools are based, in order to achieve compliance with the solutions that come from the EU
acquis. Such interaction between the European Union on one side and a single state on the
other side would allow changes to the compatibility of state systems with the European
Union.
On the normative side, to achieve this, there is an urgent need for operational plans for each
of these areas. Of course, their application should be proportionate to the needs and the
specifics of each level of government in Bosnia and Herzegovina. Legal certainty, and
therefore predictability are conditioned by the quality of legislation. By showing the valid
principles as a basis for better regulation for all levels of government in Bosnia and
Herzegovina, we see that there are various solutions in terms of the type and number of
202
principles, however, a common denominator for the solutions can be found. Unavoidability
of the following principles is common for all the solutions mentioned: proportionality,
transparency, responsibility, efficiency, cost-effectiveness, fiscal sustainability. Better
regulation in Bosnia and Herzegovina is a central plank for the rule of law and depends on
quality of RIA processes, and it can only work if it is a shared commitment at all
governmental levels of Bosnia and Herzegovina.
References
Adelle, C., Macrae, D., Marusic, A & Naru, F. 2015. New development: Regulatory impact
assessment in developing countries—tales from the road to good governance. Public Money
& Management, 35(3): 233-238. DOI: 10.1080/09540962.2015.1027500
Anex to the Communication from the Commission to the European Parliament, the Council,
the European Economic and Social Committee and the Committee of the Regions, A
credible enlargement perspective for and enhanced EU engagement with the Western
Balkans, COM(2018) 65 final
Better regulation "Toolbox" - complements the better regulation guideline presented in SWD
(2017) 350. https://ec.europa.eu/info/sites/info/files/better-regulation-toolbox_1.pdf.
Accessed 10 August 2018.
Better Regulation Agenda: Questions & Answers (2015). http://europa.eu/rapid/press-
release_MEMO-15- 4989_en.htm. Accessed 10 August 2018
Better regulation guidelines (SWD 2017 350). https://ec.europa.eu/info/sites/info/files/better-
regulation- guidelines.pdf. Accessed 10 August 2018
Bosnia and Herzegovina Reform Agenda 2015-2018.
http://www.fbihvlada.gov.ba/pdf/Reformska%20agenda.pdf. Accessed 10 August 2018
Building and Institutional Framework for Regulatory Impact Analysis (RIA). OECD,
2008. https://www.oecd.org/gov/regulatory-policy/40984990.pdf. Accessed 10 August 2018
Carausan, M.V. 2016. Better regulation a renewed impetus of the European Union, Journal
of Public Administration, Finance and Law, 2016(8): 114-121.
Communication from the Commission to the European Parliament, the Council, the
European Economic and Social Committee and the Committee of the Regions, Better
regulation for better results – An EU agenda, COM(2015) 215 final.
Communication from the Commission to the European Parliament, the Council, the
European Economic and Social Committee and the Committee of the Regions, A credible
enlargement perspective for and enhanced EU engagement with the Western Balkans,
COM(2018) 65 final.
203
Completing the Better Regulation Agenda: Better solutions for better results, (SWD 2017
675). https://eur- lex.europa.eu/legal-content/EN/TXT/?uri=CELEX%3A52015DC0215.
Accessed 10 August 2018
Constitution of Bosnia and Herzegovina
Decree on Regulatory Impact Assessment Procedure, Official Gazette FBiH, 2014
Dunlop, C. A., Maggetti, M, Radaelli, C.M., Russel, D. 2012. The many uses of regulatory
impact assessment: A meta-analysis of EU and UK cases. Regulation & Governance, 6: 23–
45.
Dunlop, C. and Radaelli, C. (eds.) 2016. Handbook of regulatory impact assessment, Edward
Elgar Publishing
Excellence in Public Administration for Competitiveness in EU Member
States, 2012. https://ec.europa.eu/growth/content/excellence-public-
administration-competitiveness-eu-member-states-0_hr. Accessed 10 August 2018
FIPA Izvjestaj o aftercare aktivnostima i preporuke za poboljsanje poslovnog okruzenja u
Bosni i Hercegovini za 2017. godinu.
http://fipa.gov.ba/publikacije_materijali/Informacije_i_izvjestaji/default.aspx?id=12360&la
ngTag=bs-BA. Accessed 10 August 2018
Foreign Investors Council, White Book 2015/16. FIC: Improving the Business Environment
in BiH.
Garben, S. & Govaere, I. 2018. The EU Better Regulation Agenda: A critical assessment.
Portland, Oregon: Hart Publishing
Interinstitutional Agreement between the European Parliament, The Council of the European
Union and The European Commission on Better Law-Making, OJ L 123, 12.5.2016
Iyigun, M. & Rodrik, D. 2004. On the Efficacy of Reforms Policy Tinkering, Institutional
Change and Eneterpreneurship, NBER Working paper No.10455, Cambridge, MA:
National Bureau of Economic Research
https://drodrik.scholar.harvard.edu/publications/efficacy-reforms-policy-tinkering-
institutional-change-and- entrepreneurship. Accessed 10 August 2018
Jedinstvena pravila za izradu pravnih propisa u institucijama Bosne i Hercegovine, Aneks I
Metodologija procjene ucinaka prilikom izrade propisa, Sluzbeni glasnik Bosne i
Hercegovine, 50/17
Lodge, M. & Wegrich, K. 2009. High-quality regulation: its popularity, its tools and its
future. Public Money & Management, 29(3): 145-152, DOI: 10.1080/09540960902891640
Lodge, M. 2008. Regulation, The Regulatory State and European Politics, West European
Politics, 31(1): 280- 301
204
Odluka o sprovodjenju procesa procjene uticaja propisa u postupku izrade propisa. Sluzbeni
glasnik Republike Srpske, 56/15.
President Jean-Claude Junckers's State of the Union Address 2017, Brussels, 13.September
2017, http://europa.eu/rapid/press-release_SPEECH-17-3165_en.htm. Accessed 10 August
2018
Radaelli, C.M. & Meuwese, A.C. 2009. Better regulation in Europe: Between public
management and regulatory reform. Public Administration, 87(3): 639-654.
Recommendation of the Council on Regulatory Policy and Government. OECD. 2012
Rigobon, R., & Rodrik, D. (2005). Rule of law, democracy, openness, and income.
Estimating the interrelationships. The Economics of Transition, 13(3): 533–564.
Stabilisation and Association Agreement between the European Communities and their
Member States, of the one part, and Bosnia and Herzegovina, of the other part (OJ L 164,
30.06.2015) p. 2-547 https://eur- lex.europa.eu/legal-
content/EN/TXT/?uri=CELEX%3A22015A0630%2801%29. Accessed 10 August 2018
Trivun, V. (ed.), Trivun, V., Silajdzic, V., Ademovic, K., Mahmutcehajic, F. 2017.
Methodology for Impact Assessment - Guide, Project “Establishment and/or Strengthening
of Capacities of the Institution/s for Control of Regulations and Establishment of the System
of Reduction of Administrative Barriers”, State Office for Public Administration, Bosnia
and Herzegovina (2016-2018).
Supporting documents for better regulations are available
https://ec.europa.eu/info/law/law-making-process/planning-and-proposing-law/better-
regulation-why-and- how_en
https://ec.europa.eu/info/law/better-regulation/lighten-load_en
https://ec.europa.eu/info/law/law-making-process/evaluating-and-improving-existing-
laws/refit-making-eu-law- simpler-and-less-costly_en
https://ec.europa.eu/info/law/law-making-process/evaluating-and-improving-existing-
laws/refit-making-eu-law- simpler-and-less-costly/refit-platform_en
https://ec.europa.eu/info/law/law-making-process/evaluating-and-improving-existing-
laws/refit-making-eu-law- simpler-and-less-costly_en#documents
https://ec.europa.eu/info/law/law-making-process/evaluating-and-improving-existing-
laws/evaluating-laws_en https://ec.europa.eu/info/law/law-making-process/planning-and-
proposing-law/better-regulation-why-and- how_en

205
LEVEL OF IMPLEMENTATION STRATEGY DEVELOPMENT OF
SMALL HYDROELECTRIC SECTOR IN A FUNCTION OF INTENSITY
EXPLOITATION RENEWABLE ENERGY AND DEVELOPMENT
ENERGY MARKET IN THE REPUBLIC OF CROATIA
Zeljko Mateljak
Faculty of Economics, Business & Touris, University of Split,
Cvite Fiskovica 5, 21000 Split,
phone: +385 91 430 748
e-mail: [email protected]
Stanko Sapunar
Hrvatska Elektroprivreda, HEP Production,
Ulica grada Vukovara 37, 10000 Zagreb,
e-mail: [email protected]
Abstract
Implementation strategy in any organization contributes to a greater level of use of its own
resources and achieving better positions on domestic and international markets. The subject of
this paper is related to the establishment of interdependence between the degree of
implementation of the strategies for the development of small hydropower plants with the
intensity of use of renewable energy sources and the development of the energy market in the
Republic of Croatia, while the research problem will analyze whether a greater degree of
implementation of the strategy of development of small hydropower plants can increase the
intensity of use renewable energy sources and the development of the energy market in the
Republic of Croatia. According to the subject and the problem of research, the aim of the
research is to determine how the degree of implementation of the strategy for the development
of small hydropower plants affects the intensity of the use of renewable energy sources and
the development of the energy market in the Republic of Croatia. The research results show
that there is no statistically significant difference between the degree of implementation of the
development of small hydropower plants and the intensity of the use of renewable energy
sources in the Republic of Croatia and that there is no statistically significant difference
between the degree of implementation of the development of small hydro power plants and the
development of the energy market in the Republic of Croatia.
Key words: strategy, renewable energy, energy market development, Republic of Croatia.
JEL classification: L10
1. Intrduction
In recent decades, and especially today, renewable energy sources play an increasingly
important role in world energy production. Although some of them are known and used since
ancient times (eg use of hydro power to drive various machines, mills for grain, sawdust to the

206
first power generation plants), renewable energy sources are becoming more and more
economically viable compared to rising oil prices other energy sources.
As a result of the fact that conventional energy sources are limited in quantity and that
the energy sector is largely the cause of the above-mentioned harmful substances, the world is
increasingly developing technologies for the use of renewable and ecologically clean energy
sources. Among them, the most important source is water energy as an ecologically pure
source without major emissions of harmful substances and adverse impacts on man and nature.
It is therefore concluded that the use of renewable energy sources reduces the need for
electricity generation using fossil energy sources. Ecologically, the world with a smaller
number (installed power) of nuclear power plants, thermal power plants and other
environmental pollutants would contribute to a healthier environment.
With unquestionable beneficial effects on the environment and the experience of
developed countries, greater use of renewable energy sources has important economic benefits
and benefits. The strategic development of small hydroelectric power plants and the
continuation of the economic policy of the EU countries to invest in small hydro power plants
means stronger economic activity on the side of the more advanced equipment, assembly,
operation and maintenance, which would again mean opening new jobs and solving
employment problems, which is troubling many countries of the European Union.
Hence, the term 'strategy', etymologically, strategically or generally, is derived from
the words stratos (military) and agein (so it is in the original sense that the strategy of 'mastery
of army management' is taken from military terminology but also the existence of an
appropriate course of action, according to which appropriate activities are directed. Even today
there is no single concept of strategy, so in practice, a variety of approaches to its definition
are used. According to Sikavica, Bahtijarevic-Siber and Poloski-Vokic (2008, pp. 193)
strategy is a plan for organizing an organization or a comprehensive plan for achieving the
goals of an organization or a strategy of alignment within organizational resources and skills
with the opportunities and risks created by the external environment .
Thompson and Strickland (1987, p.8) state that the strategy represents a way to use
certain resources to take advantage of the appropriate circumstances to minimize the difficulty
of creating the desired effects. In other words, the strategy gives answers to Buble questions
(2006, p. 77):
How to adapt to changing conditions?
How to allocate resources?
How to compete in each particular area in which the company appears in terms of
satisfying customer needs?
How to position a company and product in relation to competition and avoid
difficulties?
How to identify actions and approaches that strengthen every functional and
operational part of a company?
Responses to the above-mentioned issues provide a process of strategic management
whose fundamental goal is to set up an organization for tomorrow's success, compete for
winning in today's markets (adapted to Zugaj and Brcic, 2003, p.117).
When defining the concept of strategy, it is important to emphasize that the
formulation and implementation of the strategy aims to determine long-term goals of the
company, adjusting the directions of business activities, determining the concept and choosing
the resources needed to achieve the goals set ).

207
Additionally, strategy is the organization's response to environmental challenges, and it
is not surprising that an important step in formulating a quality strategy is its analysis that can
essentially be divided into three basic categories (Matic, Pavic, Mateljak, 2009, p. 40):
external environment analysis,
internal environment analysis, i
integration of external and internal analysis.
Therefore, the strategy is everywhere present, widespread and often unavoidable: its
meaning and content does not coincide in any situation and depends on the time, space and
area in which it is applied. In order for the strategy to be successful, it is necessary to identify
certain elements and take them into account when forming business activities. Some of these
elements are: aligning the business with the environment, shaping the future, pursuing success,
entrepreneurial activity, consistent corporate behavior and a look at a comprehensive
enterprise.
Strategy provides an answer to the question: Where does the company want to go and
how to get there? It is a plan that integrates the organizational goals, policies and activities
into a single entity. A well-formulated strategy helps the company to redirect and allocate its
resources to a unique layout based on internal relative advantages and disadvantages, but also
in line with expected changes in the environment and in line with the moves of competitors.
The enterprise strategy is a 'fight plan' or 'game plan' made by its management and contains a
whole range of business moves and methods that managers use to run their company. It also
presents a plan of activities that will be realized in a competitive environment with the intent
of achieving organizational goals, resulting in the interconnectedness of goals and business
strategy.
Therefore, according to Bubli et al. (2010, p. 71) strategy and strategy formulation
occupy an important place in the process of strategic management of the organization. The
chosen strategy directs the company's intentions and the way of achieving goals. Research
shows that enterprises with a clearly-defined strategy outgrow enterprises with developed
mixed strategies. It is therefore assumed that companies with a clearly-defined strategy at the
company level are achieving better performance.
In addition to the strategy, this paper will show renewable energy sources and the
development of the energy market. The water flow energy was one of the first that man used
to compensate for the need for own and work of domestic animals. To begin the use of water
streams, the irrigation system is introduced, and the first water machine is probably a
watercourse with water catching vessels, whereby the water from the water stream was raised
to the reservoir from which the irrigation canal system started.
Environmental problems, as a result of technological development, especially the
electric power, have brought the European Union to the need to define common goals in the
field of renewable energy exploitation. Recognizing their importance, the European Union is
through official documents Green Paper, White Paper (https://ec.europa.eu/commission/white-
paper-future-europe-reflections andscenarioseu27_hr, 11.05.2018 .) and various Directives
adopted the entire program of their use and encouragement. Thus, in 1996, at the European
Union level, a document entitled Green Paper
(https://ec.europa.eu/energy/en/publications/green-paper, 11.05.2018) was created. In this
document it was concluded that in 1996 the share of renewable sources, including large hydro
sources, in meeting the total consumption of the European Union countries was only 6%. This
208
document was only the first stage of the development of the European Union's energy strategy.
The paper gives an overview of the situation at the time, explains the need to increase the
share of renewable sources to meet consumption, and provides only basic energy policy
guidelines both for the European Union as a whole and for individual countries. This
document proposes a plan of activities, which states that the promotion of electricity produced
from renewable energy sources has a high community priority due to the safety and diversity
of energy, environmental protection and socio-economic cohesion. The plan was adopted by
the Council Resolution of 08 June 1998 and by the European Parliament in its White Paper
resolution. The resolution was adopted to promote renewable energy sources. It should be
stressed that the role of this goal is not legally binding. Each country of the European Union in
this regard brings its own strategy, within which it proposes its contribution to the overall
objective and states the planned incentive measures.
In 2009, a new Directive 2009/28 / EC of the European Parliament and of the Council
on the promotion of the use of renewable energy sources by amending, supplementing and
abolishing Directive 2001/77 / EC and 2003/30 / EC has been published, while some the
provisions of Directive 2009/28 / EC included in the Renewable Energy Action Plan. It sets a
long-term perspective by 2020 with an assessment in 2030 and a plan of activities for the
development of renewable energy infrastructure in the EU in line with the package of
implementing measures for the EU's Climate Change and Renewable Energy Sources for 2020
(http:
/www.nezeh.eu/assets/media/fckuploads/file/Legislation/RED_23April2009.pdf,11.05.2018.).
In order to realize the plans for the development of renewable energy sources in the
European Union, the European Commission recommends to the countries of the Union that
they have not done to orient their economic policies in this direction. In this respect, it is
necessary to improve the financial conditions for renewable energy by creating various
"green" funds, then public funds and other forms of subsidies, favorable loans and the
purchase of electricity from renewable energy sources, all with the aim of encouraging
potential investors. EU member states have set high targets for building renewable energy
sources. Directive 2009/28 / EU establishes a 20% share of renewable energy in the total
energy consumption of the year
(http://www.nezeh.eu/assets/media/fckuploads/file/Legislation/RED_23April2009.pdf,
11.05.2018).
At its session on October 16, 2009, the Croatian Parliament passed the Energy
Development Strategy of the Republic of Croatia (OG 130/2009). In the Energy Development
Strategy, the need to exploit renewable energy sources is particularly emphasized. Renewable
energy sources are a domestic source of energy and their use is a means of improving the
security of energy supply, encouraging the development of domestic energy production and
services, and the way of achieving environmental goals. The Republic of Croatia will
maximally encourage renewable energy sources, but with the acceptable social costs of their
use. Therefore, the following strategic goals have been set (OG 130/2009):
The Republic of Croatia will fulfill its obligations under the proposal of the European
Union Directive on the promotion of renewable energy sources on the share of
renewable energy sources, including large hydro power plants, in gross direct energy
consumption of 20%.
The Republic of Croatia will fulfill its obligations under the European Union Directive
on the share of renewable energy sources in transport in 2020 in the amount of 10%.

209
The Republic of Croatia sets the target for a share of electricity generation from
renewable energy sources, including large hydro power plants, to be maintained at
35% in total electricity consumption by 2020.
Utilization of hydro power for the production of electricity in small hydro power plants
in the Croatian energy balance could contribute in the long term:
diversification of electricity generation, supply security and consumer supply,
reducing energy imports and increasing energy independence on foreign sources of
energy,
significant reduction of the bad environmental impact of the energy sector,
the creation of new jobs, the development of underdeveloped areas and areas of special
state concern, and the development of the energy market and entrepreneurship.
These goals represent equally valuable components of the energy strategy and the
exclusion of any of these goals would mean a reduction in the value and quality of energy
policy. Dynamics, as well as all the structural features of the energy sector development,
depend on a large number of influential factors, most important of which are:
economic development,
energy sector reform and state measures,
development of the international energy market and international influence,
technology development, and
global environmental constraints.
Each of the factors has its dimension of influence, and the consequences will be
different levels of energy consumption and different energy production structures.
Investing in the construction of small hydropower plants, according to the experiences
of developed economies, apart from circulating and holding money in the country and
developing underdeveloped areas and areas of special state concern, would ensure an increase
in the employment of the population. This would be achieved with two bases: the first relates
to the direct employment of skilled and trained workforce within the energy sector and the
other refers to employment in other sectors of the economy, such as the manufacturing
industry (parts of energy equipment), the construction industry, the accompanying (servicing )
activities and the like. This is achieved through the involvement of the domestic industry in
the construction of small hydropower plants, and considering the technological possibilities of
the domestic industry, it could fully participate in the construction of small hydropower plants,
other than turbine manufacturing and assembly.
So, it is about projects that run the Croatian economy, as it is a transfer of technology
and the adoption of parts for small hydro power plants by domestic producers. With this
"know-how", our companies could emerge as exporters of technology to the east, given that
the sector is experiencing high growth rates.
By initiating amendments to the existing laws to align them with the European
Parliament Directives on General Rules for the Internal Electricity Market, the Republic of
Croatia has assigned significant power to the small hydro power plants in the electricity
market. According to the Electricity Market Act (NN, 102/15), a small hydro power plant as
an energy entity that uses a renewable source of energy for the production of electricity in an
economically feasible manner in an individual production facility and which is in harmony
with environmental protection has acquired a place of privileged electricity producers in the
electricity market in Croatia.

210
The small hydropower market represents a set of current and potential electricity
customers and electricity sellers. Accordingly, the size of the small hydro power market
depends on the construction of small hydro power plants as a producer / supplier of goods /
services and on the number of electricity consumers (the amount of electricity consumed).
After defining the concept of the strategy, concept of renewable sources and the energy
market, this paper defines the subject, the problem, the objective, the research hypothesis and
the methods of research.
The subject of this paper is related to the establishment of interdependence between the
degree of implementation of the strategy for the development of small hydropower plants with
the intensity of use of renewable energy sources and the development of the energy market in
the Republic of Croatia, while the research problem will analyze whether a higher degree of
implementation of the strategy of development of small hydro power plants can increase
intensity of use renewable energy sources and the development of the energy market in the
Republic of Croatia. According to the subject and the problem of research, the aim of the
research is to determine how the degree of implementation of the strategy for the development
of small hydropower plants affects the intensity of the use of renewable energy sources and
the development of the energy market in the Republic of Croatia. Considering that a greater
degree of strategy implementation will enable a quick response to market demands, two
fundamental hypotheses of research will be confirmed or overcome in the paper:
H1: Greater degree of implementation of the strategy for the development of small
hydro power plants affects the increased intensity of the use of renewable energy sources in
the Republic of Croatia.
In testing this hypothesis, it is assumed that the higher degree of implementation of the
strategy for the development of small hydro power plants will cause a higher intensity of use
of renewable energy sources in the Republic of Croatia.
H2: Greater degree of implementation of the strategy for the development of small
hydropower plants affects the greater development of the energy market in the Republic of
Croatia.
In testing this hypothesis, it is assumed that a greater degree of implementation of the
strategy for the development of small hydropower plants will influence the higher degree of
development of the energy market in the Republic of Croatia.
Empirical research will be carried out using common scientific methods, and in
particular through the survey methodology and the method of processing data collected using
the SPSS statistical package.
The expected contribution of the work is related to the determination of the intensity of
the interdependence of the impact on the degree of implementation of the strategy for the
development of small hydro power plants at the intensity of the use of renewable energy
sources and the development of the energy market in the Republic of Croatia.
2. Previous research
Effective implementation of the strategy for the development of small hydro power
plants aiming at the more intensive use of renewable energy sources, ie water, and thus the
development of the electricity market, is of great importance for each country. Therefore, a
number of authors' research on the importance of using water as one of the renewable energy
sources in electricity production will be presented below.
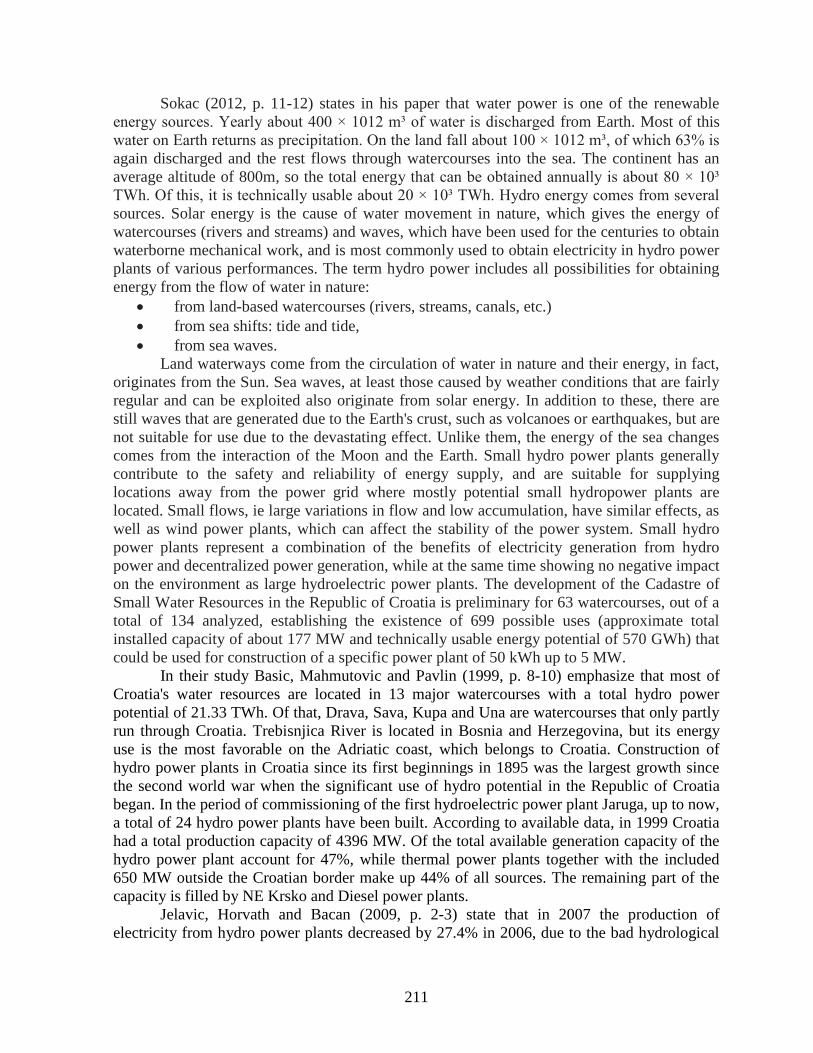
211
Sokac (2012, p. 11-12) states in his paper that water power is one of the renewable
energy sources. Yearly about 400 × 1012 m³ of water is discharged from Earth. Most of this
water on Earth returns as precipitation. On the land fall about 100 × 1012 m³, of which 63% is
again discharged and the rest flows through watercourses into the sea. The continent has an
average altitude of 800m, so the total energy that can be obtained annually is about 80 × 10³
TWh. Of this, it is technically usable about 20 × 10³ TWh. Hydro energy comes from several
sources. Solar energy is the cause of water movement in nature, which gives the energy of
watercourses (rivers and streams) and waves, which have been used for the centuries to obtain
waterborne mechanical work, and is most commonly used to obtain electricity in hydro power
plants of various performances. The term hydro power includes all possibilities for obtaining
energy from the flow of water in nature:
from land-based watercourses (rivers, streams, canals, etc.)
from sea shifts: tide and tide,
from sea waves.
Land waterways come from the circulation of water in nature and their energy, in fact,
originates from the Sun. Sea waves, at least those caused by weather conditions that are fairly
regular and can be exploited also originate from solar energy. In addition to these, there are
still waves that are generated due to the Earth's crust, such as volcanoes or earthquakes, but are
not suitable for use due to the devastating effect. Unlike them, the energy of the sea changes
comes from the interaction of the Moon and the Earth. Small hydro power plants generally
contribute to the safety and reliability of energy supply, and are suitable for supplying
locations away from the power grid where mostly potential small hydropower plants are
located. Small flows, ie large variations in flow and low accumulation, have similar effects, as
well as wind power plants, which can affect the stability of the power system. Small hydro
power plants represent a combination of the benefits of electricity generation from hydro
power and decentralized power generation, while at the same time showing no negative impact
on the environment as large hydroelectric power plants. The development of the Cadastre of
Small Water Resources in the Republic of Croatia is preliminary for 63 watercourses, out of a
total of 134 analyzed, establishing the existence of 699 possible uses (approximate total
installed capacity of about 177 MW and technically usable energy potential of 570 GWh) that
could be used for construction of a specific power plant of 50 kWh up to 5 MW.
In their study Basic, Mahmutovic and Pavlin (1999, p. 8-10) emphasize that most of
Croatia's water resources are located in 13 major watercourses with a total hydro power
potential of 21.33 TWh. Of that, Drava, Sava, Kupa and Una are watercourses that only partly
run through Croatia. Trebisnjica River is located in Bosnia and Herzegovina, but its energy
use is the most favorable on the Adriatic coast, which belongs to Croatia. Construction of
hydro power plants in Croatia since its first beginnings in 1895 was the largest growth since
the second world war when the significant use of hydro potential in the Republic of Croatia
began. In the period of commissioning of the first hydroelectric power plant Jaruga, up to now,
a total of 24 hydro power plants have been built. According to available data, in 1999 Croatia
had a total production capacity of 4396 MW. Of the total available generation capacity of the
hydro power plant account for 47%, while thermal power plants together with the included
650 MW outside the Croatian border make up 44% of all sources. The remaining part of the
capacity is filled by NE Krsko and Diesel power plants.
Jelavic, Horvath and Bacan (2009, p. 2-3) state that in 2007 the production of
electricity from hydro power plants decreased by 27.4% in 2006, due to the bad hydrological
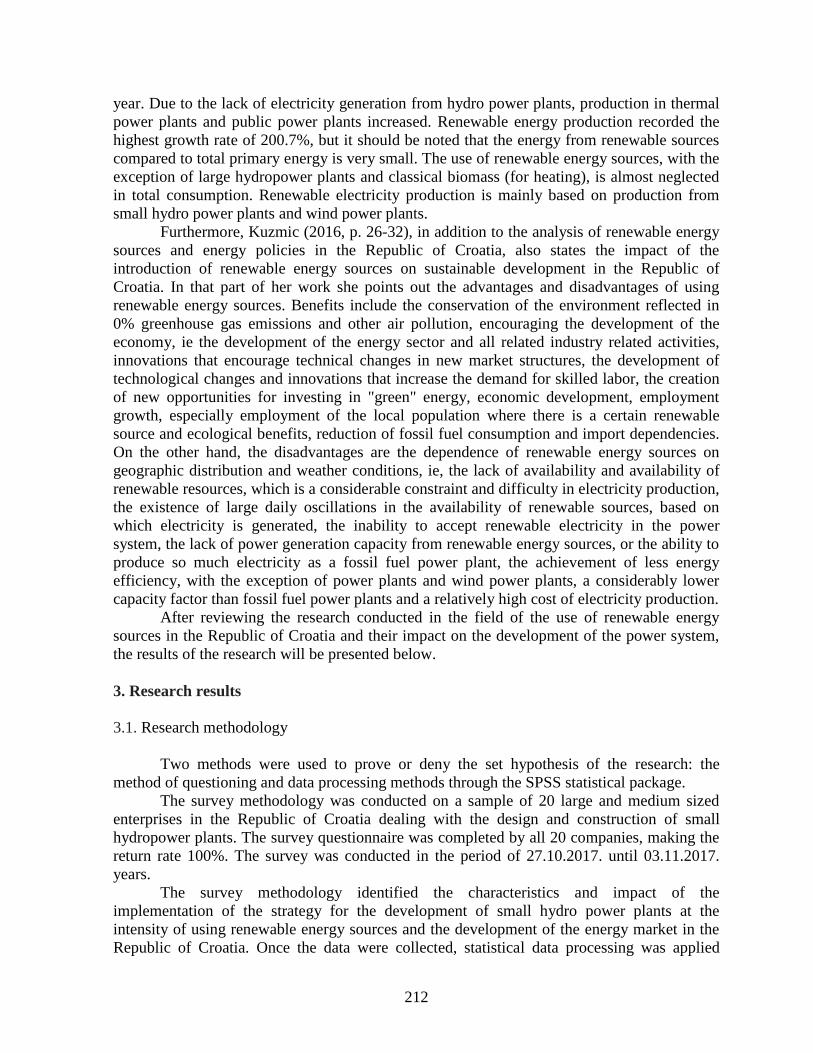
212
year. Due to the lack of electricity generation from hydro power plants, production in thermal
power plants and public power plants increased. Renewable energy production recorded the
highest growth rate of 200.7%, but it should be noted that the energy from renewable sources
compared to total primary energy is very small. The use of renewable energy sources, with the
exception of large hydropower plants and classical biomass (for heating), is almost neglected
in total consumption. Renewable electricity production is mainly based on production from
small hydro power plants and wind power plants.
Furthermore, Kuzmic (2016, p. 26-32), in addition to the analysis of renewable energy
sources and energy policies in the Republic of Croatia, also states the impact of the
introduction of renewable energy sources on sustainable development in the Republic of
Croatia. In that part of her work she points out the advantages and disadvantages of using
renewable energy sources. Benefits include the conservation of the environment reflected in
0% greenhouse gas emissions and other air pollution, encouraging the development of the
economy, ie the development of the energy sector and all related industry related activities,
innovations that encourage technical changes in new market structures, the development of
technological changes and innovations that increase the demand for skilled labor, the creation
of new opportunities for investing in "green" energy, economic development, employment
growth, especially employment of the local population where there is a certain renewable
source and ecological benefits, reduction of fossil fuel consumption and import dependencies.
On the other hand, the disadvantages are the dependence of renewable energy sources on
geographic distribution and weather conditions, ie, the lack of availability and availability of
renewable resources, which is a considerable constraint and difficulty in electricity production,
the existence of large daily oscillations in the availability of renewable sources, based on
which electricity is generated, the inability to accept renewable electricity in the power
system, the lack of power generation capacity from renewable energy sources, or the ability to
produce so much electricity as a fossil fuel power plant, the achievement of less energy
efficiency, with the exception of power plants and wind power plants, a considerably lower
capacity factor than fossil fuel power plants and a relatively high cost of electricity production.
After reviewing the research conducted in the field of the use of renewable energy
sources in the Republic of Croatia and their impact on the development of the power system,
the results of the research will be presented below.
3. Research results
3.1. Research methodology
Two methods were used to prove or deny the set hypothesis of the research: the
method of questioning and data processing methods through the SPSS statistical package.
The survey methodology was conducted on a sample of 20 large and medium sized
enterprises in the Republic of Croatia dealing with the design and construction of small
hydropower plants. The survey questionnaire was completed by all 20 companies, making the
return rate 100%. The survey was conducted in the period of 27.10.2017. until 03.11.2017.
years.
The survey methodology identified the characteristics and impact of the
implementation of the strategy for the development of small hydro power plants at the
intensity of using renewable energy sources and the development of the energy market in the
Republic of Croatia. Once the data were collected, statistical data processing was applied

213
using the descriptive statistics method, correlation and comparative statistics. In order to
investigate the statistical significance of the hypothesis hypothesis set up, t-test was used, a
method for determining the statistical significance of arithmetic meanings between two
samples in the study. If the result of the performed t-test shows that the difference between the
arithmetic mean is not statistically significant then the hypothesis of the research is
statistically rejection. On the other hand, if the difference between the arithmetic mean is
statistically significant, the hypothesis of the research is statistically accepted. Performing a t-
test also investigates statistical significance at a level of 5%. If p > 0.05 there is no statistically
significant difference, and if p < 0.05 there is a statistically significant difference.
3.2. Sample characteristics
Before the results of the research hypothesis set out will be presented, an overview of
descriptive statistics will be presented, which will outline the three basic features of the
surveyed enterprises:
the legal form of the company,
ownership structure of the company,
enterprise size.
For the purposes of this study, companies that are a joint-stock company or a limited
liability company are surveyed. Figure 1 shows the legal form of the surveyed enterprises.
Figure 1. Legal form of surveyed enterprises
11
9
0
2
4
6
8
10
12
joint stock company limited company
Nu
mb
ers
of
com
pa
nie
s
Type of company
Source: Author's processing based on collected data
As can be seen from Figure 1 of the surveyed companies 11 are a joint stock company,
while the other 9 are limited liability companies.
In addition to the legal form of the company, for the needs of the survey, companies
that have ownership structure are surveyed:
foreign private property,
domestic private property,
foreign and domestic private property,

214
private worker ownership (majority share of workers in ownership),
predominantly state ownership,
mixed ownership (state and private property).
Figure 2 shows the division of the surveyed enterprises with regard to the ownership
structure of the company.
As can be seen from Figure 2, surveyed enterprises 10 are in private ownership, 4 are
privately owned, 3 are in mixed state-private ownership, 2 are in private ownership, and 1 are
privately owned.
For the purposes of research, surveyed companies are also included in the groups of
medium and large companies ranked according to the number of employees. Figure 3 shows
the division of the surveyed enterprises with regard to the size of the enterprise.
Figure 2. Ownership structure of surveyed enterprises
4
10
12
0
3
0
2
4
6
8
10
12
Nu
mb
er o
f co
mp
an
ies
Owernship structure of comapny
Source: Author's processing based on collected data
Figure 3. Size of surveyed enterprises
9
11
0
2
4
6
8
10
12
medium companies (50-249) large companies (>249)
Nu
mb
er o
f co
mp
an
ies
Company size

215
Source: Author's processing based on collected data
As can be seen in Figure 3. of the surveyed enterprises 9 there are 50 to 249 middle-
sized companies, while 11 are in large enterprises with more than 250 employees.
3.3. Testing of research hypotheses
In this part of the paper, research hypotheses will be tested to determine the degree of
implementation of the strategy for the development of small hydro power plants to diversify
electricity production in the Republic of Croatia. For the purposes of identifying the degree of
implementation of the strategy for the development of small hydropower plants, two stages
have been defined, a higher and lower degree of implementation. All surveyed companies with
a total average grade of implementation grade greater than 2.5 belong to a higher level
implementation group. On the other hand, all surveyed companies with a total average grade
of deployment grade of less than 2.5 belong to a lower-level implementation group. Tables 1
and 2 show the degree of implementation of the strategy for the development of small hydro
power plants for all surveyed enterprises based on processed data.
Table 1. The degree of implementation of the strategy for the development of small
hydropower plants Elements research Number of companies
1 2 3 4 5 6 7 8 9 10
Ecological problems arising from the
production of energy from non-renewable
sources (water, air and soil pollution,
disposal of toxic and radioactive waste, acid
rain and climate change) affect human
health.
4
4
5
5
5
4
5
4
4
5
The EU and the Republic of Croatia have
developed incentive programs and measures
for the construction of small hydro power
plants.
3
4
4
3
1
1
4
1
3
1
There are not many companies involved in
the implementation of renewable energy
sources in Croatia.
4
4
5
4
1
4
3
3
3
1
Investing in small hydro power plants is a
strategic interest of the Republic of Croatia.
1
3
5
4
5
5
4
4
3
4
ANALYSIS ENVIRONMENT 3 3,75 4,75 4 3 3,5 4 3 3,25 2,75
The future of electricity production should
be based on renewable energy sources
4
2
5
4
5
4
4
5
5
1
Investments in the construction of small
hydropower plants need to be further
encouraged.
5
4
5
5
5
5
5
4
4
5
Croatia needs to use small hydro power
plants to produce electricity today.
5
5
5
5
5
5
5
5
4
5
SETTING VISITS, MISURES AND
OBJECTIVES
4,7 3,7 5 4,7 5 4,7 4,7 4,7 4,3 3,7
Business development should be based on
the implementation of renewable energy
sources.
4
3
5
3
4
4
3
4
4
1
Investing in the construction of small hydro
power plants is socially useful.
3
4
5
4
5
5
4
3
5
5
The danger to the environment by the
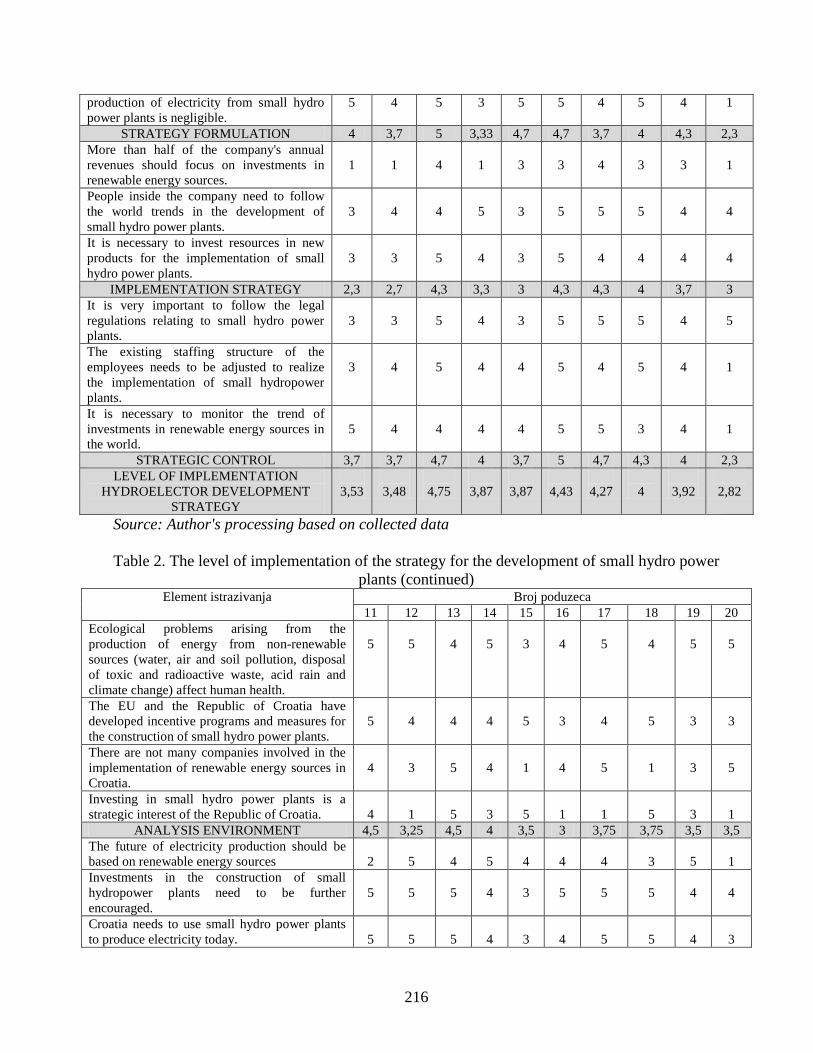
216
production of electricity from small hydro
power plants is negligible.
5 4 5 3 5 5 4 5 4 1
STRATEGY FORMULATION 4 3,7 5 3,33 4,7 4,7 3,7 4 4,3 2,3
More than half of the company's annual
revenues should focus on investments in
renewable energy sources.
1
1
4
1
3
3
4
3
3
1
People inside the company need to follow
the world trends in the development of
small hydro power plants.
3
4
4
5
3
5
5
5
4
4
It is necessary to invest resources in new
products for the implementation of small
hydro power plants.
3
3
5
4
3
5
4
4
4
4
IMPLEMENTATION STRATEGY 2,3 2,7 4,3 3,3 3 4,3 4,3 4 3,7 3
It is very important to follow the legal
regulations relating to small hydro power
plants.
3
3
5
4
3
5
5
5
4
5
The existing staffing structure of the
employees needs to be adjusted to realize
the implementation of small hydropower
plants.
3
4
5
4
4
5
4
5
4
1
It is necessary to monitor the trend of
investments in renewable energy sources in
the world.
5
4
4
4
4
5
5
3
4
1
STRATEGIC CONTROL 3,7 3,7 4,7 4 3,7 5 4,7 4,3 4 2,3
LEVEL OF IMPLEMENTATION
HYDROELECTOR DEVELOPMENT
STRATEGY
3,53
3,48
4,75
3,87
3,87
4,43
4,27
4
3,92
2,82
Source: Author's processing based on collected data
Table 2. The level of implementation of the strategy for the development of small hydro power
plants (continued) Element istrazivanja Broj poduzeca
11 12 13 14 15 16 17 18 19 20
Ecological problems arising from the
production of energy from non-renewable
sources (water, air and soil pollution, disposal
of toxic and radioactive waste, acid rain and
climate change) affect human health.
5
5
4
5
3
4
5
4
5
5
The EU and the Republic of Croatia have
developed incentive programs and measures for
the construction of small hydro power plants.
5
4
4
4
5
3
4
5
3
3
There are not many companies involved in the
implementation of renewable energy sources in
Croatia.
4
3
5
4
1
4
5
1
3
5
Investing in small hydro power plants is a
strategic interest of the Republic of Croatia.
4
1
5
3
5
1
1
5
3
1
ANALYSIS ENVIRONMENT 4,5 3,25 4,5 4 3,5 3 3,75 3,75 3,5 3,5
The future of electricity production should be
based on renewable energy sources
2
5
4
5
4
4
4
3
5
1
Investments in the construction of small
hydropower plants need to be further
encouraged.
5
5
5
4
3
5
5
5
4
4
Croatia needs to use small hydro power plants
to produce electricity today.
5
5
5
4
3
4
5
5
4
3

217
SETTING VISITS, MISURES AND
OBJECTIVES
4 5 4,7 4,3 3,3 4,3 4,7 4,3 4,3 2,7
Business development should be based on the
implementation of renewable energy sources.
2
4
4
4
4
3
4
4
5
1
Investing in the construction of small hydro
power plants is socially useful.
4
4
5
3
5
5
5
5
4
4
The danger to the environment by the
production of electricity from small hydro
power plants is negligible.
5
2
2
3
4
5
5
4
5
3
STRATEGY FORMULATION 3,7 3,3 3,7 3,3 4,3 4,3 4,7 4,3 4,7 2,7
More than half of the company's annual
revenues should focus on investments in
renewable energy sources.
1
1
1
3
1
3
1
1
5
1
People inside the company need to follow the
world trends in the development of small hydro
power plants.
4
5
5
4
5
5
4
5
4
3
It is necessary to invest resources in new
products for the implementation of small hydro
power plants.
4
5
4
4
4
5
4
4
4
2
IMPLEMENTATION STRATEGY 3 3,7 3,3 3,7 3,3 4,3 3 3,3 4,3 2
It is very important to follow the legal
regulations relating to small hydro power
plants.
5
5
5
4
5
5
5
5
4
3
The existing staffing structure of the employees
needs to be adjusted to realize the
implementation of small hydropower plants.
2
4
4
4
5
5
4
3
4
4
It is necessary to monitor the trend of
investments in renewable energy sources in the
world.
5
5
5
5
5
5
5
4
5
5
STRATEGIC CONTROL 4 4,7 4,7 4,3 5 5 4,7 4 4,3 4
LEVEL OF IMPLEMENTATION
HYDROELECTOR DEVELOPMENT
STRATEGY
3,8
3,9
4,2
3,9
3,9
4,2
4,15
3,95
4,2
2,96
Source: Author's processing based on collected data
As can be seen from Tables 1. i 2. the arithmetic mean of environmental analysis,
mission setting, vision and goals, strategy formulation, strategic implementation and strategic
control of each enterprise are calculated. After that, the average degree of implementation of
the strategy for the development of small hydropower plants for certain enterprises was
obtained from the arithmetic mean of the obtained arithmetic meanings of environmental
analysis, mission setting, vision and goals, strategy formulation, strategic implementation and
strategic control of each enterprise. The study obtained the lowest average value of 2,816.
Since there is no average rating of less than 2.5 when calculating the average values
from Table 1. i 2., and no group of higher and lower levels of intensity of the implementation
of the strategy for the development of small hydropower plants can be defined at previously
defined intervals , this paper has started with a new calculation of new implementation
intervals for the development of small hydropower plants. Namely, in the total grade of
implementation of the strategy for the development of small hydropower plants, the lowest
obtained average rating was 2,816 and the highest rating 5 was taken.
Between the least obtained average scores and the highest scores set, the arithmetic
mean of the arithmetic mean will be calculated. Using the aforementioned procedure, the
average value of 3,908 was obtained. Therefore, all surveyed companies with a total average

218
grade of implementation grade greater than 3,908 will belong to a higher level implementation
group. On the other hand, all surveyed companies with a total average grade of deployment of
less than 3,908 will belong to a lower-level implementation group.
It is important to note that the analysis found that out of the 20 surveyed enterprises, 8
belong to the lower level implementation group, while 12 belong to a higher level group of
small hydropower development strategies.
3.3.1. Impact of the degree of implementation of the strategy for the development of small
hydropower plants at the intensity of using renewable energy sources
After defining the degree of implementation of the strategy for the development of
small hydropower plants, the impact of the implementation of the strategy for the development
of small hydropower plants on the intensity of the use of renewable energy sources in the
Republic of Croatia will be examined. Based on the hypothesis of the research it will be
examined whether the higher degree of implementation of the strategy for the development of
small hydropower plants affects the higher intensity of the use of renewable energy sources in
the Republic of Croatia. For the purpose of this test, the results of intensity of use of
renewable energy sources are first presented in Tables 3 and 4.
Table 3. Intensity of use of renewable energy sources for enterprises with a higher degree of
implementation of the strategy for the development of small hydro power plants Elements research Number of companies
1 2 3 4 5 6 7 8 9 10 11 12
Investing in small hydro power
plants contributes to the reduction
of environmental pollution.
5
5
5
1
4
5
4
5
5
2
3
5
Investing in small hydro power
plants contributes to water flow
regulation and flood protection.
5
5
5
5
4
4
4
5
5
5
4
4
Your company is increasingly using
renewable sources for electricity
generation.
4
3
3
4
1
3
5
5
5
5
3
4
INTENSITY OF USE OF
RENEWABLE ENERGY
SOURCES
4,7
4,3
4,3
3,3
3
4
4,3
5
5
4
3,3
4,3
Source: Author's processing based on collected data
From Table 3 it is seen that the lowest value is 3 and the highest 5. The arithmetic
mean of these two arithmetic meanings has an average value of 4.
On the other hand, from Table 4 it is seen that the lowest value is 2.66, and the highest
5. Arithmetic mean of these two arithmetic meanings has an average value of 3.83. From the
results of the research it can be concluded that companies with a higher degree of
implementation of the strategy for the development of small hydropower plants have a higher
intensity of using renewable energy sources than those with a lower level of implementation of
the strategy for the development of small hydropower plants.
To test the statistical significance of this research hypothesis, a two-way t-test was
applied. After the t-test was performed, the value p = 0.570205 was obtained. Since p> 0.05 it
is concluded that there is no statistically significant difference.
Table 4. Intensity of use of renewable energy sources for lower level of implementation of

219
small hydropower development strategy Elements research Number of companies
1 2 3 4 5 6 7 8
Investing in small hydro power plants contributes to
the reduction of environmental pollution.
2
4
5
5
4
5
5
4
Investing in small hydro power plants contributes to
water flow regulation and flood protection.
4
5
3
5
5
4
5
3
Your company is increasingly using renewable
sources for electricity generation.
2
3
3
2
5
4
5
3
INTENSITY OF USE OF RENEWABLE ENERGY
SOURCES
2,7
4
3,7
4
4,7
4,3
5
3,3
Source: Author's processing based on collected data
Although companies with a higher degree of implementation of the strategy for the
development of small hydropower plants have a higher intensity of using renewable energy
sources than companies with a lower degree of implementation of the strategy, it is concluded
that the degree of implementation of the strategy for the development of small hydropower
plants does not affect the intensity of renewable energy utilization, thus the first hypothesis of
research has not been confirmed.
3.3.2. Impact of the degree of implementation of the strategy for the development of small
hydropower plants on the development of the energy market in the Republic of Croatia
This section will examine the impact of the implementation of the strategy for the
development of small hydropower plants on the development of the energy market in the
Republic of Croatia. As noted above, surveyed enterprises with a total average grade of
implementation of the strategy for the development of small hydroelectric power plants over
3,908 belong to the higher level of implementation of the strategy for the development of
small hydropower plants. On the other hand, surveyed enterprises with a total average grade of
implementation of the strategy for the development of small hydro power plants below 3,908
belong to the lower level of implementation of the strategy for the development of small hydro
power plants.
The impact of the degree of implementation of the strategy for the development of
small hydropower plants on the development of the energy market in the Republic of Croatia
will be examined through another fundamental hypothesis of the research. The hypothesis of
research will examine whether a higher degree of implementation of the strategy for the
development of small hydropower plants contributes to the greater development of the energy
market in the Republic of Croatia. For the purpose of this study, tables 5 and 6 show the
results of the development of the energy market in the Republic of Croatia.
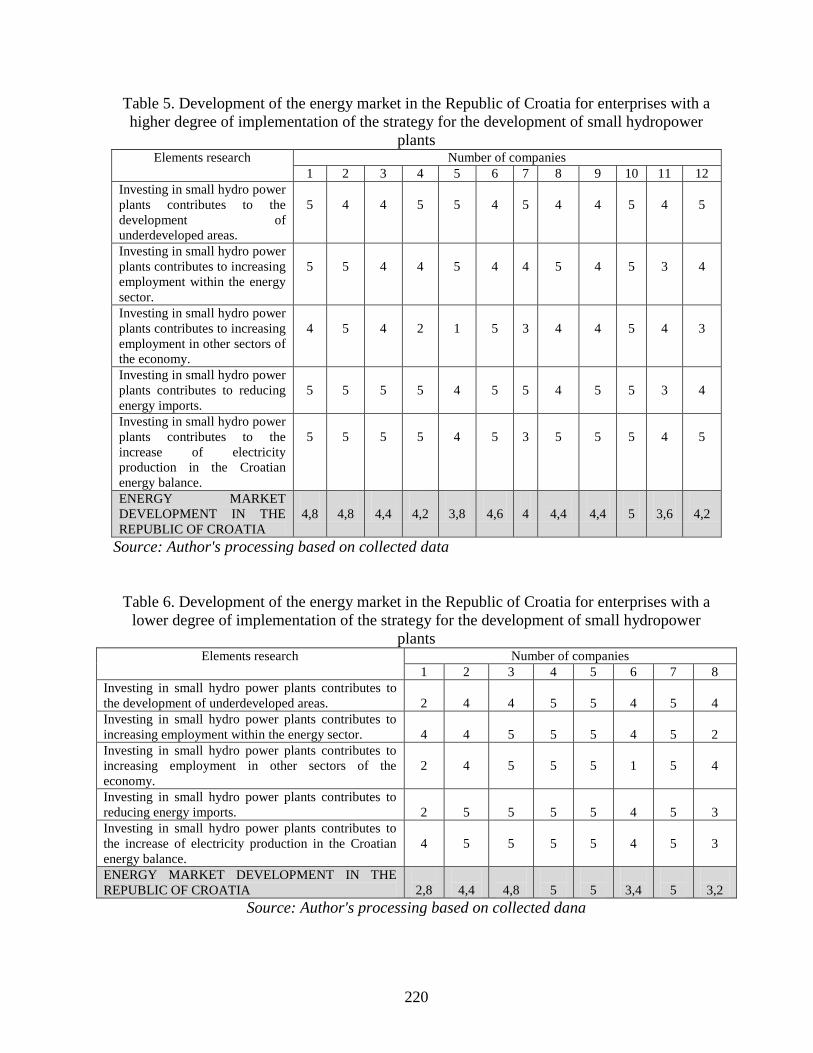
220
Table 5. Development of the energy market in the Republic of Croatia for enterprises with a
higher degree of implementation of the strategy for the development of small hydropower
plants Elements research Number of companies
1 2 3 4 5 6 7 8 9 10 11 12
Investing in small hydro power
plants contributes to the
development of
underdeveloped areas.
5
4
4
5
5
4
5
4
4
5
4
5
Investing in small hydro power
plants contributes to increasing
employment within the energy
sector.
5
5
4
4
5
4
4
5
4
5
3
4
Investing in small hydro power
plants contributes to increasing
employment in other sectors of
the economy.
4
5
4
2
1
5
3
4
4
5
4
3
Investing in small hydro power
plants contributes to reducing
energy imports.
5
5
5
5
4
5
5
4
5
5
3
4
Investing in small hydro power
plants contributes to the
increase of electricity
production in the Croatian
energy balance.
5
5
5
5
4
5
3
5
5
5
4
5
ENERGY MARKET
DEVELOPMENT IN THE
REPUBLIC OF CROATIA
4,8
4,8
4,4
4,2
3,8
4,6
4
4,4
4,4
5
3,6
4,2
Source: Author's processing based on collected data
Table 6. Development of the energy market in the Republic of Croatia for enterprises with a
lower degree of implementation of the strategy for the development of small hydropower
plants Elements research Number of companies
1 2 3 4 5 6 7 8
Investing in small hydro power plants contributes to
the development of underdeveloped areas.
2
4
4
5
5
4
5
4
Investing in small hydro power plants contributes to
increasing employment within the energy sector.
4
4
5
5
5
4
5
2
Investing in small hydro power plants contributes to
increasing employment in other sectors of the
economy.
2
4
5
5
5
1
5
4
Investing in small hydro power plants contributes to
reducing energy imports.
2
5
5
5
5
4
5
3
Investing in small hydro power plants contributes to
the increase of electricity production in the Croatian
energy balance.
4
5
5
5
5
4
5
3
ENERGY MARKET DEVELOPMENT IN THE
REPUBLIC OF CROATIA
2,8
4,4
4,8
5
5
3,4
5
3,2
Source: Author's processing based on collected dana

221
From Table 5 it is seen that the lowest value is 3.6 and the highest 5. Arithmetic mean
of these two arithmetic meanings has an average value of 4.3.
On the other hand, from Table 6 it is seen that the smallest value is 2.8 and the highest
5. Arithmetic mean of these two arithmetic meanings has an average value of 3.9. Based on
the results of the research, it can be concluded that companies with a higher degree of
implementation of the strategy for the development of small hydropower plants contribute to
the greater development of the energy market in the Republic of Croatia from companies with
a lower degree of strategy implementation.
To test the hypothesis, a two-way t-test was used. After the performed t-test, the value
p = 0.675664 was obtained. Since p> 0.05 it is concluded that there is no statistically
significant difference.
Although companies with a higher degree of implementation of the strategy for the
development of small hydropower plants contribute to the larger development of the energy
market in the Republic of Croatia than companies with a lower degree of strategy
implementation, it is concluded that the degree of implementation of the strategy for the
development of small hydropower plants does not statistically affect the development of the
energy market in the Republic of Croatia confirmed.
4. Conclusion
In recent decades, and especially today, renewable energy sources play an increasingly
important role in world energy production. Nature supplies us with free water, large quantities
of water. On the other hand, there is less and less oil, coal and other alternative energy sources
on our planet, whose cost is comparable with that fact. In addition, over the last few years, it
has become increasingly clear that excessive use of fossil fuels is increasingly polluting the
environment and that the energy sector greatly contributes to this. The impacts of energy
sources on the pollution of the natural environment, observed in the chain from production to
energy consumption, are very diverse.
As a result of the fact that conventional energy sources are limited in quantity and that
the energy sector is largely the cause of the above-mentioned harmful substances, the world is
increasingly developing technologies for the use of renewable and ecologically clean energy
sources. Among them, the most important source is water energy as an ecologically pure
source without major emissions of harmful substances and adverse impacts on man and
nature. All EU countries have pledged to increase the share of renewable energy sources.
Croatia as a member of the European Union also has an obligation to increase the share of
renewable energy sources in total electricity consumption.
Therefore, in view of the importance of this topic for the Republic of Croatia, this
paper has carried out a research that has been shown to have certain advantages in the use of
renewable energy sources.
In testing the first research hypothesis that a higher degree of implementation of the
strategy for the development of small hydropower plants affects the increased intensity of
renewable energy utilization has assumed that the advantages of small hydro power plants
compared to conventional sources of electricity in the context of environmental impact are
manifested in their work not causing emitting greenhouse gases into the atmosphere,
contributing to water flow regulation and flood protection. Although companies with a higher
degree of implementation of the strategy for the development of small hydropower plants
contribute to a higher intensity of renewable energy use than companies with a lower level of
222
implementation of the strategy, it is concluded that the degree of implementation of the
strategy for the development of small hydropower plants does not affect the intensity of
renewable energy sources, thus the first hypothesis of research has not been confirmed.
In testing another research hypothesis that a greater degree of implementation of the
strategy for the development of small hydropower plants affects the greater development of
the energy market in the Republic of Croatia has come from the assumption that by investing
in the construction of small hydropower plants other than circulating and holding money in
the country, as well as development of underdeveloped areas and areas of special state care, to
ensure increased employment of the population. Although companies with a higher degree of
implementation of the strategy for the development of small hydropower plants contribute to
the larger development of the energy market in the Republic of Croatia than companies with a
lower degree of strategy implementation, it is concluded that the degree of implementation of
the strategy for the development of small hydropower plants does not statistically affect the
development of the energy market in the Republic of Croatia. confirmed.
5. Limitations of research and recommendations for future research
When carrying out research for the purpose of this paper, there was one important
limitation concerning the inability to increase the sample size in this research, as all renewable
energy companies and hydro power plants are covered.
In addition to limiting the research, authors also propose recommendations for future
research. Future research in this area should relate to the application of existing research
activities in industries dealing with other energy sources, in determining the degree of
implementation of the development and development strategy of their energy market and the
intensity of use of other energy sources in the Republic of Croatia. Additionally, the same
research process should also be extended by applying comparative statistics between these
industries to examine the possible persistence of differences in the impact of the degree of
implementation of the development strategy on the development of their energy market and
the intensity of the use of other energy sources in the Republic of Croatia.
Literatures
Journal articles
1. Jelavic, B., Horvath, L., Bacan, A. (2009). Trend i razvoj projekta koristenja obnovljivih
izvora za proizvodnju elektricne energije s naglaskom na energiju vjetra i Sunca. Sibenik:
5. medjunarodni znanstveno-strucni skup o naftnom gospodarstvu: Imaju li nafta i plin
energetsku zamjenu u ovom stoljecu.
2. Sokac, D. (2012). Regulativa vezana za distribuirane izvore, ukljucujuci i specificne
probleme obnovljivih izvora i kogeneracijskih postrojenja. Sveti Martin na Muri: Hrvatski
ogranak medjunarodne elektrodistribucijske konferencije, 3. (9.) savjetovanje.
Books
3. Alfirevic, N., Pavic, I., Matic, I. (2007). Menadzment – Prirucnik za nastavu. Split:
Ekonomski fakultet.

223
4. Basic, H., Mahmutovic, Z., Pavlin, Z. (1999). Mogucnosti koristenja vodnog potencijala u
strategiji energetskog razvitka Republike Hrvatske. Zagreb: Energetski institut “Hrvoje
Pozar” d.o.o., Elektroprojekt d.d.
5. Buble, M. (2006). Management. Zagreb: Sinergija nakladnistvo d.o.o.
6. Buble, M., et. al. (2010). Utjecaj organizacijskih varijabli na uspjeh programa
unaprjedjenja poslovnih procesa. Split: Ekonomski fakultet.
7. Commission of the European Communities. (1996). Energy for the Future: Renewable
Sources of energy, Brussels.
8. Kuzmic, K. (2016). Uloga obnovljivih izvora energije u procesu tranzicije ka odrzivom
gospodarstvu Hrvatske. Pula: Fakultet ekonomije i turizma „Dr. Mijo Mirkovic“
9. Matic, I., Pavic, I., Mateljak, Z. (2009). Menadzment – Prirucnik za nastavu. Split:
Ekonomski fakultet.
10. Sikavica, P., Bahtijarevic-Siber, F., Poloski-Vokic, N. (2008). Temelji menadzmenta.
Zagreb: Skolska knjiga.
11. Thompson, A. A. Jr., Strickland, A. J. III. (1987). Strategic Management: Concepts and
Cases, Fourth Edition, Business Publication, Texas.
12. Zugaj, M., Brcic, R. (2003). Menadzment. Varazdin: Fakultet organizacije i informatike.
Online documents
13. http://www.nezeh.eu/assets/media/fckuploads/file/Legislation/RED_23April2009.pdf,
11.05.2018
14. https://ec.europa.eu/energy/en/publications/green-paper., 11.05.2018.
15. https://ec.europa.eu/commission/white-paper-future-europe-reflections-and-scenarios
eu27_hr, 11.05.2018.
16. Narodne novine, broj 130/2009
17. Narodne novine, broj 102/15

224
THE EFFECTS OF ENERGY PRODUCED FROM RENEWABLE SOURCES
ON CARBON DIOXIDE EMISSIONS: AN EMPIRICAL ANALYSIS OF EUROPEAN
UNION MEMBER COUNTRIES
Vedad Mulalic
Adriatics Strategic Partner Manager, Online Partnerships Group - EU Headquarters at Google
E-mail: [email protected]
Eldin Mehic
School of Economics and Business
Trg oslobodjenja-Alija Izetbegovic 1, 71000 Sarajevo
Phone: ++38733253952; Fax: ++38733275994;
E-mail: [email protected]
Sabina Silajdzic
School of Economics and Business
Trg oslobodjenja-Alija Izetbegovic 1, 71000 Sarajevo
Phone: ++38733253766; Fax: ++38733275994;
E-mail: [email protected]
Abstract
In this paper we investigate the impact of energy produced from renewable sources on carbon
dioxide emissions in EU countries. The empirical analysis covered 28 European Union
countries in the period from 2004 to 2012. The principal variable of interest was Share of
energy from renewable sources in total consumption. We used fixed-effect panel data
estimates with PCSE panel-corrected standard errors. This analysis provided strong evidence
of a causal relationship between renewable energy consumption and CO2 emissions. With
regards to this government should design and implement effective support policies to promote
investment in new renewable energy technologies in order to achieve steady and sustainable
growth in renewable energy use.
Key words: CO2 emissions, renewable sources, environmental policy, pollution, European
Union countries
1. Introduction
Energy is one of the priorities in the world nowadays. Therefore, a lot is being done to
improve the ways in which it is being produced and there are many possible solutions for this
global issue. Environmental degradation together with different economic and social problems
has led many countries to start producing energy using sources such as wind, sunlight, water,
waves, geothermal and other. Renewable energy sources are unlimited, and they replenish
naturally. Taking into account future and current social and economic needs, renewable energy
production is considered as a clean source of energy. According to Panwar, Kaushik and
Kothari (2011) the use of these resources produces a low amount of secondary wastes and
minimizes environmental impacts. Non-renewable energy sources still stand for the traditional

225
and non-excludable way for the production of energy, but governments actively try to increase
the share of clean production of energy and to replace the existing power plants that are
largely contributing to the emissions of CO2 into the atmosphere.
The assumptions are that the current methods of creating energy are about to change radically
in the future. The reason for that is a low supply of natural gas and oil and more significantly,
changes in climate. The climate changes are the result of the release of gases during the
combustion of fuels. Non-renewable energy sources like fossil fuels were formed a long time
ago in history from animal and plant remaining. Intensive use of fossil fuels, especially during
the 20th century caused that coal reserves will be enough for the next 80 years and oil reserves
for the next 50 years approximately.
Fossil fuels are the main resources to produce electricity today. Unfortunately, fossil fuels are
the major polluters of the environment. The burning of fossil fuels releases significant
amounts of CO2, which is one of the gases that contribute to the change of climate, the
creation of the so-called greenhouse effect and global warming. Carbon dioxide is considered
as the most responsible and stands for about 57% of global warming according to Moriarty
and Honnery (2012).
The average temperature on the surface of the earth has increased over time due to rising
concentrations of greenhouse gases, including mostly carbon dioxide and also, nitrous oxide,
methane, and sulfur oxide. Precipitation patterns, storm severity, and the increase in overall
sea level are just some of the climate change occurrences that have emerged lately states Muis,
Hashim, Manan, Taha and Douglas (2010). Moriarty and Honnery (2011) also state that
methods for reducing GHG include using renewable energy sources and higher energy
efficiency to cut CO2 emissions from energy production.
The strategy of the European Union regarding renewable energy sources is on a path for a
greener and low carbon economy. The goals have been set and determined for renewables, and
they include reaching a share of 20% of all the energy consumed by the year 2020. These
directives are obligatory for all the members of the union. The orientation towards renewable
energy in Europe started in the year 1997. It continued to grow from its initial goals to de-
carbonize the energy sector and address the problems of using fossil fuels to an industry that
employs over 1.5 million workers today, with an expected increase to 3 million by the year
2020. However, this young and developing industry is still facing many difficulties and
barriers, which are yet to be met and resolved. Nevertheless, the success of the production,
promotion, and usage of this kind mean that renewable energy should not be ignored.
European directives and legislative have the main goal of creating an energy market that is
sustainable, competitive and secure. Developed countries produce the highest levels of
emission, and must bear the highest responsibility for global warming. Nevertheless, action
must also be taken by developing countries to evade increases in emission levels in the future
while their population grows and economies develop (Omer, 2008).
The purpose of this paper is to analyze the relationship between production of electricity
gained from renewable energy sources and CO2 emissions. Furthermore, the purpose is to
show the significance of renewables in the global production of energy and give emphasis to
the environmental degradation caused by the CO2 emissions.

226
2. Literature review
A story about reducing CO2 emissions dates back to the 1990s when this issue was first
mentioned aloud. Reducing global warming and steady increase in temperatures forced many
countries to sit down and discuss what can be done. This first led to the United Nations
Framework Convention on Climate (UNFCCC) that was then followed by the Rio Earth
Summit on 9 May 1992. Kyoto Protocol on 11 December 1997, which is considered an
extended version of the convention, came after (De Jonghe, Delarue, Belmans and
D’haeseleer, 2009). The most recent European action plan proposed a 20% decrease in CO2
emission by the year 2020, which can be further extended to 30% if there is a mutual
international agreement.
Many studies and works deal with carbon dioxide emissions. These studies have been
conducted in various countries with numerous approaches and findings. In the research of
natural resources, few approaches have been applied. Some researchers like Van den Bergh,
Delarue, and D'haeseleer (2013) analyzed renewable energy sources deployment and its
effects on CO2 emissions but also how they affect the European Union Allowance prices, for
the period between the years 2007 and 2010 for 12 countries of the European Union and
Switzerland. More often, approaches include the connection between economic growth and its
impact on the environment like the empirical analysis conducted by Kearsley and Riddel
(2010). Their emphasis was on Environmental Kuznets Curve (EKC), a hypopaperthat
economic growth leads to increased pollution up to the moment when the economy reaches a
certain stage and starts to decrease afterwards.
In addition to this approach Chiu and Chang (2009) included all 30 member countries of the
OECD in their empirical analysis and covered a period from 1996 to 2005. They concluded
that with the growth of the world economy the CO2 emissions problem continues to worsen
despite the increasing numbers of countries that have implemented renewable energy
development mechanisms for reducing carbon dioxide emissions.
More authors like Sadorsky (2009), who examined G7 countries, agree that economic growth
comes with staggering energy demands. Ohler and Fetters (2014) inspected the causal
relationship between electricity generation and economic growth from renewables in 20
OECD countries between 1990 and 2008. Mourelatos (1998) deals with the conflicts among
environmental and economic goals, influencing the development of renewable energy sources.
Furthermore, strategic planning of the energy sector and impact of CO2 reduction policies is
examined in his work. While using various econometric techniques Khan et al. (2014)
examined in their study the long-run relationship between GHG emissions and energy
consumption for various groups of countries. Their result confirmed the aforementioned
relationship.
Marques, Fuinhas, and Pires Manso (2010) have done a panel data research regarding the
motivation behind the deployment of renewable energy sources for a period between 1990 and
2006 in European countries. They managed three kinds of factors that either encourage or
discourage renewable energy such as political, socioeconomic (including CO2 emissions) and
country-specific. Their research came to unexpected results like the one that renewable energy
preferences were smaller with larger CO2 emissions. A higher level of economic activity

227
directly results in higher pollutions and, therefore, investments in renewable sources are
smaller. On the other hand, they concluded that reducing energy dependency promotes the use
of renewables.
Among researchers, there are also some doubts that the problem of greenhouse gases
emissions can be solved, even if the renewable energy sources take a larger part in the
portfolio of energy production. Chiu and Chang (2009) used panel data in their empirical
approach that included all 30 OECD countries (at the time of the research) from 1996 to 2005.
Their research showed a positive relationship between GDP growth and energy production
despite the increases in shares of energy produced from renewable energy sources, which is
explained by larger consumption of fossil fuels, and the increase inCO2 emissions.
The second approach takes into account the connection between development of renewable
energy sources and reduction of carbon dioxide emissions. Abolhosseini, Heshmati, and
Altmann (2014) have done research on the effects of renewable energy development on CO2
reduction. The empirical results in this research were founded on a panel data estimation using
the European Union countries data observed from 1995 to 2010. They evaluated the
effectiveness of renewable energy development on CO2 emissions reduction, and found that
increases in renewable energy production help reduce CO2 emissions. Furthermore, they have
taken into consideration other elements such as technological innovation and market
regulation findings. Instead, some researchers like Shafiei and Salim (2014) used the data for
OECD countries from 1980 to 2011 to explore the determinants of CO2 emissions and show
how non-renewable energy consumption increases CO2 emission and vice versa. OECD
countries are largest energy consuming countries in the world with 41% of global energy
consumption, which is still growing. In addition, the results of this research support the
environmental Kuznets curve hypo paper between urbanization and CO2 emissions. This
implies that environmental degradation decreases at higher levels of urbanization.
3. Model
The empirical analysis covers 28 countries in the period from 2004 to 2012. These countries
have put many efforts to help reduce CO2 emissions with an attempt to reach 0 net CO2
emissions by the year 2020 as in line with the global climate change objectives. These policy
efforts include market regulations as well as public support to renewable energy production
and development of environmentally friendly technology. Accordingly, the EU countries are
leaders in the development of renewable energy and this is the reason why they are chosen to
be included in this empirical analysis. In our estimation, carbon dioxide emissions are used as
a dependent variable, and it is defined as man-made emissions of the 'Kyoto basket' of
greenhouse gases. The variable does not include emissions and removals related to land use,
land-use change and forestry (LULUCF); nor does it include emissions from international
aviation and international maritime transport. Independent variables in this research are a
share of renewables in gross final energy consumption, GDP per capita, final energy
consumption, energy imports, environmental tax revenues and Total intramural R&D
(Research and Development) expenditure (GERD). Specifically, following Abolhosseini,
Heshmati and Altmann (2014), and Shafiei and Salim, (2014), we specify the following model
using equation 1.
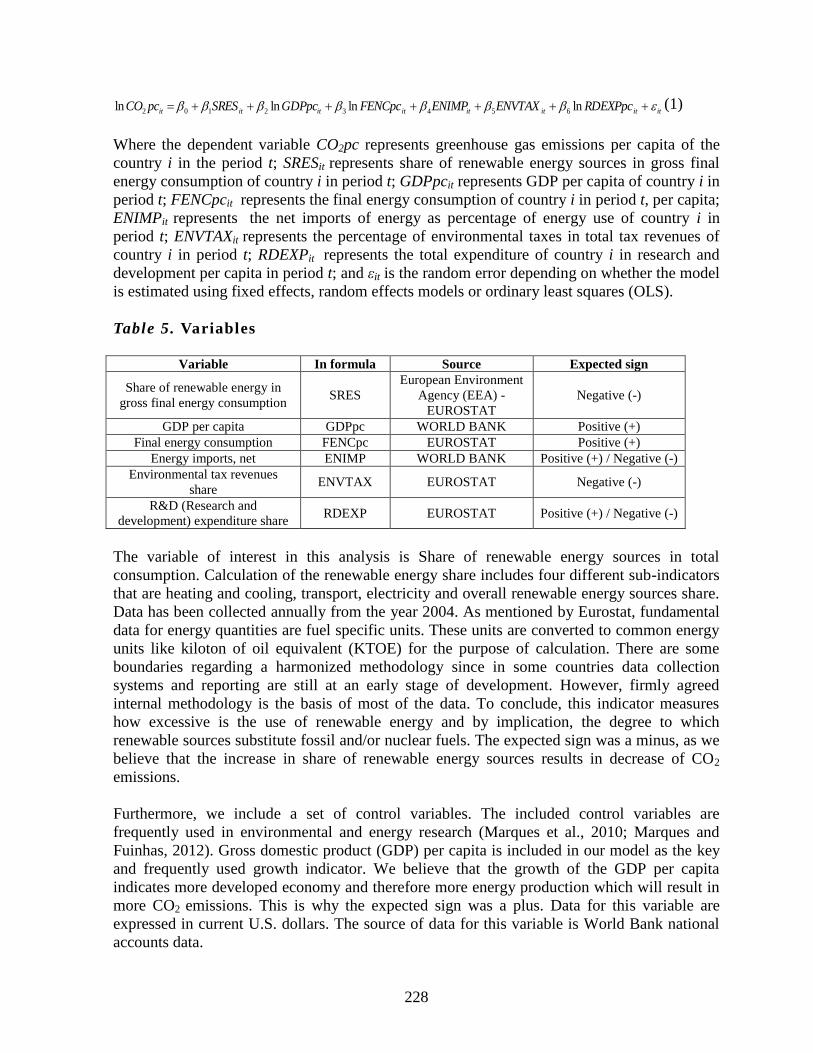
228
itititititititit RDEXPpcENVTAXENIMPFENCpcGDPpcSRESpcCO lnlnlnln 65432102(1)
Where the dependent variable CO2pc represents greenhouse gas emissions per capita of the
country i in the period t; SRESit represents share of renewable energy sources in gross final
energy consumption of country i in period t; GDPpcit represents GDP per capita of country i in
period t; FENCpcit represents the final energy consumption of country i in period t, per capita;
ENIMPit represents the net imports of energy as percentage of energy use of country i in
period t; ENVTAXit represents the percentage of environmental taxes in total tax revenues of
country i in period t; RDEXPit represents the total expenditure of country i in research and
development per capita in period t; and εit is the random error depending on whether the model
is estimated using fixed effects, random effects models or ordinary least squares (OLS).
Table 5. Variables
Variable In formula Source Expected sign
Share of renewable energy in
gross final energy consumption SRES
European Environment
Agency (EEA) -
EUROSTAT
Negative (-)
GDP per capita GDPpc WORLD BANK Positive (+)
Final energy consumption FENCpc EUROSTAT Positive (+)
Energy imports, net ENIMP WORLD BANK Positive (+) / Negative (-)
Environmental tax revenues
share ENVTAX EUROSTAT Negative (-)
R&D (Research and
development) expenditure share RDEXP EUROSTAT Positive (+) / Negative (-)
The variable of interest in this analysis is Share of renewable energy sources in total
consumption. Calculation of the renewable energy share includes four different sub-indicators
that are heating and cooling, transport, electricity and overall renewable energy sources share.
Data has been collected annually from the year 2004. As mentioned by Eurostat, fundamental
data for energy quantities are fuel specific units. These units are converted to common energy
units like kiloton of oil equivalent (KTOE) for the purpose of calculation. There are some
boundaries regarding a harmonized methodology since in some countries data collection
systems and reporting are still at an early stage of development. However, firmly agreed
internal methodology is the basis of most of the data. To conclude, this indicator measures
how excessive is the use of renewable energy and by implication, the degree to which
renewable sources substitute fossil and/or nuclear fuels. The expected sign was a minus, as we
believe that the increase in share of renewable energy sources results in decrease of CO2
emissions.
Furthermore, we include a set of control variables. The included control variables are
frequently used in environmental and energy research (Marques et al., 2010; Marques and
Fuinhas, 2012). Gross domestic product (GDP) per capita is included in our model as the key
and frequently used growth indicator. We believe that the growth of the GDP per capita
indicates more developed economy and therefore more energy production which will result in
more CO2 emissions. This is why the expected sign was a plus. Data for this variable are
expressed in current U.S. dollars. The source of data for this variable is World Bank national
accounts data.

229
Final energy consumption per capita is another control variable used in research. Eurostat
provides data for this variable, which is measured annually and expressed in million TOE
(tons of oil equivalent). For this research, we calculated values per capita. This is done in the
same way as for the GDP per capita, dividing the data by the population. According to
Eurostat, this indicator shows the sum of the energy provided to the final consumer for all
energy uses. Final Energy Consumption includes total energy provided to industry,
households, transport, agriculture and services. On the other hand, it excludes the energy
industries themselves and the process of delivery to the energy transformation sector. This
justifies our assumptions that the expected sign is a plus and that with the increase in final
energy consumption, the CO2 emissions will rise. According to the Eurostat data, for
measuring the energy consumption at a final place of its use, this quantity is relevant. Also, it
can be used for comparing the result to the Europe 2020 targets.
Net energy imports are an important variable estimated since less production of energy
domestically is assumed to be associated with lower CO2 emissions. The source of this data is
the International Energy Agency (IEA), and it is measured in oil equivalents. It can be
assumed that if country imports energy it will produce less energy since the overall needs for
energy would be partially satisfied with imports.
The variable environmental tax revenues are measured as the percentage of total revenues
from taxes and social contributions. The essential purpose of environmental taxes is to
incorporate environmental costs into the costs of production and provide right market
incentives structures that would potentially decrease damage to the environment relying on
costs approach. Companies would then be forced to include the effects of their actions on the
environment in the price of products or services. Hence, it is important that the amount of the
tax applied equals to the cash value of the damage caused to the environment. Therefore, the
expected sign is negative meaning that the higher environmental tax revenues are, the smaller
CO2 emissions are.
Total revenues from environmental taxes include taxes on pollution, transport, resources and
energy. EUROSTAT publishes this indicator for the European Union Member States, Iceland,
Norway, and the European Union (aggregated data). The time series covers the period 2000-
2011.This indicator is selected as a main Resource Efficiency Indicator used for the evaluation
of the progress towards the targets and objectives of the Europe 2020 Initiative.
Total intramural R&D (Research and development) expenditure (GERD) is used in this
research as a proxy for countries’ level of technological development and innovative
capability. We believe it is important to include this variable in the model not only to control
for the differences in the levels of technological development among countries, but also to
investigate the impact of innovative efforts on CO2 emissions. Given the right market
incentives, smart regulation in the EU is designed to promote investments in the development
of new or improved market friendly technology. We believe that this variable may pick up
some of the effects of these efforts, and attempt to investigate the nature of the relationship in
the EU context. At least it seems reasonable to assume negative relationship between R&D
expenditures and CO2 emission. The R&D data are collected annually by the European Union
Member States based on a legal obligation. Eurostat research and development database holds
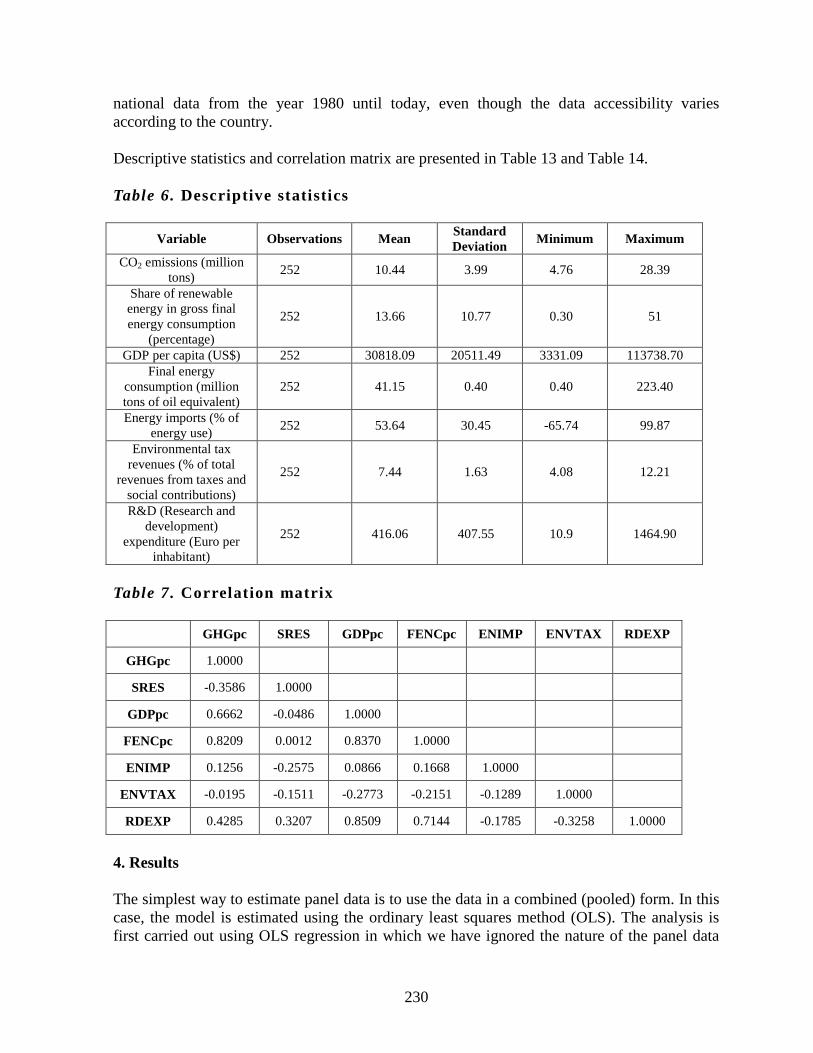
230
national data from the year 1980 until today, even though the data accessibility varies
according to the country.
Descriptive statistics and correlation matrix are presented in Table 13 and Table 14.
Table 6. Descriptive statistics
Variable Observations Mean Standard
Deviation Minimum Maximum
CO2 emissions (million
tons) 252 10.44 3.99 4.76 28.39
Share of renewable
energy in gross final
energy consumption
(percentage)
252 13.66 10.77 0.30 51
GDP per capita (US$) 252 30818.09 20511.49 3331.09 113738.70
Final energy
consumption (million
tons of oil equivalent)
252 41.15 0.40 0.40 223.40
Energy imports (% of
energy use) 252 53.64 30.45 -65.74 99.87
Environmental tax
revenues (% of total
revenues from taxes and
social contributions)
252 7.44 1.63 4.08 12.21
R&D (Research and
development)
expenditure (Euro per
inhabitant)
252 416.06 407.55 10.9 1464.90
Table 7. Correlation matrix
GHGpc SRES GDPpc FENCpc ENIMP ENVTAX RDEXP
GHGpc 1.0000
SRES -0.3586 1.0000
GDPpc 0.6662 -0.0486 1.0000
FENCpc 0.8209 0.0012 0.8370 1.0000
ENIMP 0.1256 -0.2575 0.0866 0.1668 1.0000
ENVTAX -0.0195 -0.1511 -0.2773 -0.2151 -0.1289 1.0000
RDEXP 0.4285 0.3207 0.8509 0.7144 -0.1785 -0.3258 1.0000
4. Results
The simplest way to estimate panel data is to use the data in a combined (pooled) form. In this
case, the model is estimated using the ordinary least squares method (OLS). The analysis is
first carried out using OLS regression in which we have ignored the nature of the panel data
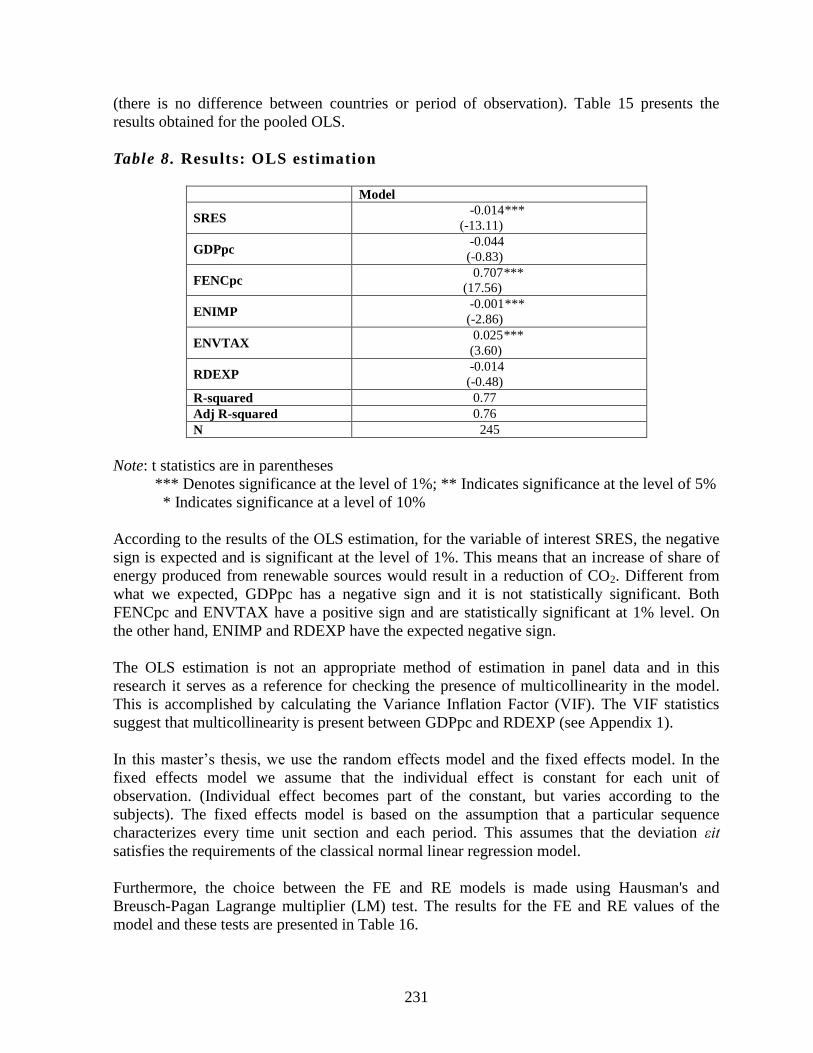
231
(there is no difference between countries or period of observation). Table 15 presents the
results obtained for the pooled OLS.
Table 8. Results: OLS estimation
Model
SRES -0.014***
(-13.11)
GDPpc -0.044
(-0.83)
FENCpc 0.707***
(17.56)
ENIMP -0.001***
(-2.86)
ENVTAX 0.025***
(3.60)
RDEXP -0.014
(-0.48)
R-squared 0.77
Adj R-squared 0.76
N 245
Note: t statistics are in parentheses
*** Denotes significance at the level of 1%; ** Indicates significance at the level of 5%
* Indicates significance at a level of 10%
According to the results of the OLS estimation, for the variable of interest SRES, the negative
sign is expected and is significant at the level of 1%. This means that an increase of share of
energy produced from renewable sources would result in a reduction of CO2. Different from
what we expected, GDPpc has a negative sign and it is not statistically significant. Both
FENCpc and ENVTAX have a positive sign and are statistically significant at 1% level. On
the other hand, ENIMP and RDEXP have the expected negative sign.
The OLS estimation is not an appropriate method of estimation in panel data and in this
research it serves as a reference for checking the presence of multicollinearity in the model.
This is accomplished by calculating the Variance Inflation Factor (VIF). The VIF statistics
suggest that multicollinearity is present between GDPpc and RDEXP (see Appendix 1).
In this master’s thesis, we use the random effects model and the fixed effects model. In the
fixed effects model we assume that the individual effect is constant for each unit of
observation. (Individual effect becomes part of the constant, but varies according to the
subjects). The fixed effects model is based on the assumption that a particular sequence
characterizes every time unit section and each period. This assumes that the deviation εit
satisfies the requirements of the classical normal linear regression model.
Furthermore, the choice between the FE and RE models is made using Hausman's and
Breusch-Pagan Lagrange multiplier (LM) test. The results for the FE and RE values of the
model and these tests are presented in Table 16.

232
Table 9. Results: FEM and REM
FEM REM
SRES -0.016***
(-8.73)
-0.015***
(-10.11)
GDPpc 0.009
(0.34)
0.014
(0.55)
FENCpc 0.762***
(13.56)
0.714***
(15.44)
ENIMP -0.000
(-0.65)
-0.000
(-1.08)
ENVTAX 0.019***
(4.39)
0.018***
(4.30)
RDEXP 0.023
(1.14)
0.008***
(0.44)
R-squared
(within/between) (0.78 / .73) (0.77/0.75)
F test/Wald chi2
Prob>F
125.75
0.000
811.28
0.000
N 245 245
Note: t/z statistics are in parentheses
*** Denotes significance at the level of 1%
** Indicates significance at the level of 5%
* Indicates significance at a level of 10%
We used Hausman test to check the null hypopaperthat the additional orthogonal condition for
RE estimator is valid. The null hypopaperfor the Hausman's test states that the difference in
coefficients between the FE and RE specifications is not systematic. Thus, a small p-value
(<0.05) suggests rejection of RE Specifications.
Moreover, we have to take into account the distribution of the error processes and
homoscedasticity of the residuals, and correlation of residuals within and across the panels. If
the variance of random error is different for some observations and if the residuals show a
systematic deviation for various values of the independent variables and systematic
correlation, the assumptions of homoscedasticity and of no serial correlation in the data are not
satisfied. To test for the presence of heteroscedasticity, serial correlation and cross-sectional
dependence in the data, we use appropriate tests. Panel data often includes complex error
processes associated with the presence of heteroscedasticity and serial correlation.
This is why, before choosing an applicable estimator to observe the estimates of CO2
emissions, it is necessary to perform diagnostic tests. These include heteroscedasticity, the
cross-sectional dependence, and serial correlation tests. Complicated error processes are often
part of the panel data, and they include panel heteroscedasticity. This means that among
countries different variances of the error processes occur. Besides, error processes in
coexistent correlation (i.e. country i shows huge errors at time t) will frequently be linked with

233
significant errors for country j at time t, and serial correlation may be present. In regard to this,
for groupwise heteroscedasticity we used Modified Wald test in fixed effect regression model.
Also, we used Pesaran's test of cross sectional independence and contemporaneous correlation
along with Wooldridge test for autocorrelation in panel data. The results indicate the existence
of heteroscedasticity together with cross-sectional dependence and serial correlation between
the variables in the model (see Appendix). In order to address this issue, we used a Beck and
Katz’s (1995) approach. With regard to the results of the FE model, Wald test for
heteroscedasticity in the FE model, test for autocorrelation in panel data by Wooldridge and
test for cross-sectional dependence, we used suggestions from Beck and Katz (1995) and
performed OLS with panel-corrected standard errors using Prais-Winsten transformation.
Table 10. Prais-Winsten regression, correlated panels corrected standard errors (PCSEs)
Model 1 Model 2 Model 3
SRES -0.006***
(-2.74)
-0.009**
(-3.72)
-0.009***
(-3.83)
GDPpc 0.115***
(2.65)
0.312***
(6.34)
0.253***
(5.34)
FENCpc 0.525***
(9.62)
ENIMP 0.000
(0.30)
0.000
(0.81)
0.000
(1.06)
ENVTAX 0.013***
(3.15)
0.012***
(2.66)
0.013***
(2.90)
RDEXP 0.037**
(2.09)
0.049**
(2.09)
R-squared 0.78 0.78 0.78
F test/Wald chi2
Prob>F
3.48e+07
0,000
1.93e+07
0,000
1.22e+07
0,000
N 245 245 245
Note: Z statistics are given in brackets (PCSE); all regressions include constant, country and
time dummies (not reported in the table).
*** Denotes significance at the level of 1%
** Indicates significance at the level of 5%
* Indicates significance at a level of 10%
The results of econometric analysis are shown in the Table 17. Precisely, the table shows
estimates for OLS fixed-effect panel data together with PCSE panel-corrected standard errors.
Table 17 includes the estimated model results which include the baseline specification (model
1), and also models 2 and 3 which are simplified from model 1 without two control variables
FENCpc and RDEXP due to the problem of multicollinearity and the econometric
consequences of the energy consumption variable. With regard to the latter, according to
Jaforullah and King (2017) the energy consumption variable can have several unhelpful
234
effects on the econometric results when included as independent variable in CO2 emissions
models. Specifically, it may generate under- or overestimates of both the total effect of income
on CO2 emissions, and could also affect other control variables in the model, for example, that
the energy consumption variable may lead to systematic volatility in the model's coefficients
in case of omitted variable problem. This is why we tested for the robustness of the obtained
results when excluding the Energy consumption variable from the models 2 and 3 to be
estimated. Essentially, it seems important to note that the model is robust (the significance and
the size of the obtained coefficients remain unchanged) to changes in the specifications of
model. Interpretation of variables’ coefficients refers to, on average, ceteris paribus
conclusions. It should be noted that we included country-specific effects (country dummy
variables). This was done in order to take into account for the disregarded country specific
effects, time-invariant, and time dummies to check for the effects that are time specific e.g. to
control for the economic crisis reflected in large decline of output in years 2008 and 2009. In
addition, the possible delayed effects linked with time specific variation in the times after the
crisis are included. Additionally, following Wooldridge (2003) we claim that coefficients are
estimated with better precision when we include time dummies. Some of the variation in the
dependent variables is absorbed by the independent variables in the model when time
dummies that are time specific are absent. In most cases, we found that both time and country
specific effects are significant in most cases, however they are not reported here due to space
limitations.
Generally, all variables included in a model have the expected sign. The only exception is that
the environmental tax variable has a positive sign. We find that share of renewable energy
source, as our variable of interest, significantly decreased level of CO2 across the EU
countries. The extent of the coefficient reflects on economic importance of increases in share
of renewable energy source that negatively impacts CO2 emissions (i.e. 1% rise in share of
renewable energy in gross final energy consumption leads to decrease in CO2 emission per
capita of about 0.006 percent). Overall, the empirical results support the hypopaperthat there is
a significant and negative effect of the use of energy gained from renewable sources and CO2
emissions in the European Union countries.
It is also found that CO2 emissions are significantly impacted by the GDPpc variable. In
addition, both FENCpc and ENVTAX are significant at 1% level and have a positive sign. The
results obtained with respect to variable ENVTAX are somewhat unexpected. Specifically, the
results for this variable suggest the positive relationship between environmental tax and CO2
emission. A possible explanation for the obtained results for variable ENVTAX could be that
higher revenues from environmental taxes will not necessarily be linked to higher tax rates, as
a scenario with high consumption of lightly taxed goods is possible. Additionally, a more
effective tax may diminish the base of the environmental tax, thereby reducing total revenue
from environmental taxes. It is worthwhile noticing that most of the revenues from
environmental tax come from taxes on motor fuels and demand inelasticity from these goods
is such that these taxes do not cause reductions in the base of the tax. Actually, these taxes are
far from consistent with the environmental damage generated by motor fuel consumption
(Obrien and Vourch, 2002; Albrecht, 2006). The EU-28 countries have a relatively high GDP
per capita and are considered developed countries. This means that the tax rate should be high
enough to cause a subtle energy consumption reduction. Pearce (1991) showed that a decrease
in carbon emission might not be the case unless the associated elasticities are recognized with
235
acceptable certainty. On the other hand, ENIMP has a negative sign and is not significant. This
outcome indicates that the dependence on energy imports of EU countries is not associated
with lower CO2 emissions.
Conclusion
CO2 emissions have been put into the energy policy spotlight because of the global warming
issues. Reduction of fossil fuels dependence is crucial if there is any serious effort to deal with
global warming. Increased consumption of energy gained from renewable sources is likely to
be caused by increased concern over global warming and generally increases in carbon
dioxide emissions. Shifting completely to renewables is not possible now due to the various
economic and technological problems. However, fulfilling the energy mix with clean energy is
definitely a huge step in that direction. Some of the policies that are related to each country
effectiveness when it comes to energy mix will have to be revised and further assessed. The
reason is different infrastructural and geological structure of each country that renewable
energy sources depend on. There are more obstacles for increasing energy efficiency including
old electrical grids, which are also not adjusted for renewables. Countries will have to invest
much time and capital into finding mechanisms and establishing long-term policies in order to
overcome these kinds of problems.
The main goal of this study was to investigate the impact of energy produced from renewable
sources on carbon dioxide emissions in EU countries. The empirical analysis covered 28
European Union countries in the period from 2004 to 2012. The principal variable of interest
was Share of energy from renewable sources in total consumption. We used fixed-effect panel
data estimates with PCSE panel-corrected standard errors. This analysis provided strong
evidence of a causal relationship between renewable energy consumption and CO2 emissions.
With regards to this government should design and implement effective support policies to
promote investment in new renewable energy technologies in order to achieve steady and
sustainable growth in renewable energy use.
Recommendation for further actions regarding the reduction of carbon dioxide emissions and
consumption of renewable energy sources, based on the results of the research of the European
Union members, is to keep the positive way of fulfilling the defined goal - the reduction of
GHG emissions by 20% until 2020. The EU member states have to continue and maintain
decreased level of overall GHG emission, and also make significant developments in years to
come in terms of policy developments. By maintaining this level of efforts done by the EU
Member States until 2020, there is a possibility of emission reductions that will exceed
projected target of 20% and continue its trend of extension in the future years as well. It is
very important to pay attention to raising the awareness of the environmental protection. This
could play a very important role when it comes to implementation of different policies
associated with environmental degradation. It would be much easier to overcome climate
change problems if these policies are not only considering energy sector but are also integrated
into other industries like education, manufacturing, transport, etc.
236
References
1. Panwar, N., Kaushik, S., and Kothari, S. (2011). Role of renewable energy sources in
environmental protection: A review. Renewable And Sustainable Energy Reviews, 15(3),
1513-1524.
2. Moriarty, P., and Honnery, D. (2012). What is the global potential for renewable energy?.
Renewable And Sustainable Energy Reviews, 16(1), 244-252.
3. Muis, Z., Hashim, H., Manan, Z., Taha, F., and Douglas, P. (2010). Optimal planning of
renewable energy-integrated electricity generation schemes with CO2 reduction target.
Renewable Energy, 35(11), 2562-2570.
4. Moriarty, P., and Honnery, D. (2012). What is the global potential for renewable energy?.
Renewable And Sustainable Energy Reviews, 16(1), 244-252.
5. Omer, A. (2008). Green energies and the environment. Renewable And Sustainable
Energy Reviews, 12(7), 1789-1821.
6. De Jonghe, C., Delarue, E., Belmans, R., and D’haeseleer, W. (2009). Interactions
between measures for the support of electricity from renewable energy sources and CO2
mitigation. Energy Policy, 37(11), 4743-4752.
7. Van den Bergh, K., Delarue, E., and D'haeseleer, W. (2013). Impact of renewables
deployment on the CO2 price and the CO2 emissions in the European electricity sector.
Energy Policy, 63, 1021-1031.
8. Kearsley, A., and Riddel, M. (2010). A further inquiry into the Pollution Haven
Hypothesis and the Environmental Kuznets Curve. Ecological Economics, 69(4), 905-
919.
9. Chiu, C., and Chang, T. (2009). What proportion of renewable energy supplies is needed
to initially mitigate CO2 emissions in OECD member countries? Renewable And
Sustainable Energy Reviews, 13(6/7), 1669-1674.
10. Sadorsky, P. (2009). Renewable energy consumption, CO2 emissions and oil prices in the
G7 countries. Energy Economics, 31(3), 456-462.
11. Ohler, A., and Fetters, I. (2014). The causal relationship between renewable electricity
generation and GDP growth: A study of energy sources. Energy Economics, 43, 125-139.
12. Mourelatos, A. (1998). Impact of CO2 reduction policies on the development of
renewable energy sources. International Journal Of Hydrogen Energy, 23(2), 139-149.
13. Marques, A., Fuinhas, J., and Pires Manso, J. (2010). Motivations driving renewable
energy in European countries: A panel data approach. Energy Policy, 38(11), 6877-6885.
237
THE RELATIONSHIP BETWEEN TOURISM AND ECONOMIC
GROWTH: A PANEL GRANGER CAUSALITY METHOD
Adnan Muslija
PhD candidate, University of Sarajevo
Hazima Dedica 15b, 71300 Visoko, Bosnia and Herzegovina
Phone: + 387 61 778 131
E-mail: [email protected]
Elma Satrovic Assistant professor, Çağ University
Yaşar Bayboğan Kampüsü Adana-Mersin Karayolu üzeri 33800, Yenice/MERSİN, Turkey
Phone: +90 324 651 48 00
Email: [email protected]
Cansu Unver Erbas
Assistant professor, Çağ University
Yaşar Bayboğan Kampüsü Adana-Mersin Karayolu üzeri 33800, Yenice/MERSİN, Turkey
Phone: +90 324 651 48 00
Email: [email protected]
Saliha Cabro
Research assistant at University of Zenica
Fakultetska 3, 72000 Zenica, Bosnia and Herzegovina
Phone: +387 61 877 053
Email: [email protected]
Abstract
This research aims to conduct a causality analysis of the mutual relationship between tourism
and economic growth using the panel data of 113 countries while controlling for income
disparity. The observed period is between 1995 and 2015. Panel Granger causality method is
used for testing the existence of assumed causality between tourism and economic growth of
the selected countries. This method provides also information about direction of their
interaction. Findings indicate that tourism is reported to Granger cause economic growth. In
addition, the findings suggest economic growth to be an important determinant of the tourism
industry. Hence, this industry and economic growth are reported to reinforce each other
suggesting a bidirectional positive effect when a single lag is introduced. Besides that it is
important to emphasize that the obtained results are confirmed in the case when 2 and 3 lags
are introduced respectively. Income disparity analysis confirms there is a bidirectional positive
relationship between tourism and economic growth in low-, middle- as well as high-income
countries.
Keywords: economic growth, Granger causality, panel data, tourism
JEL classification: Z32, O47

238
1. Introduction
The World Tourism Organization (UNWTO) indicates that tourism has been and is one of the
best positioned economic sectors to drive inclusive socioeconomic growth. It also provides
sustainable livelihoods, contributes to global peace and understanding and has it effects in
protecting climate. Wide range of literature confirms the tourism-led theory, that is, tourism
enhances the economic growth of the country by stimulating the development of traditional
industries as well as the development of modern services of countries (Satrovic and Muslija,
2017; Muslija et al., 2017).
According to UNWTO Annual report in 2015 and 2016, tourist arrivals have grown up
to 4 per cent every year comparing the previous year. With a potential increase such high
every year, tourism sector has been considered as one of the leading, while contributing 10%
of global GDP (UNWTO, 2016). Knowing the fact that tourism has an enhancing impact on
economic growth, one might question that economic growth may be the first cause on tourism
sector growth. Thus, it is now the question of which direction tourism and economic growth
relationship have an impact on.
In the context of the previous question, the aim of this study is to discover the
reciprocal cause-effect relationships between tourism and economic growth. The importance
of this discovery is reflected in recognizing tourism as a sector in which more attention should
be paid, and which at the same time depends on the economic rating of the home country. To
investigate this, Dumitrescu-Hurlin (DH) test - panel causality technique- will be applied for
113 countries around the world for the years capturing 1995 to 2015. Countries sampled are
disaggregated based on their economic well-being. Along with this test, the contribution to the
literature is reflected also in the generation of an existing publication dealing with these
phenomena, and comparison with previous research results.
Operating two and three lags in the econometric model specification, tourism and
economic growth are reported to reinforce each other suggesting a bidirectional positive effect
on low-, middle- as well as high-income countries. In other words, the results suggest a
reverse causality of tourism and economic growth, that is, in addition to the positive impact of
tourism on the economic growth, it is expected that growth tends be an important driver of
tourism industry.
Based on the obtained results, policy implication would include promoting tourism
activities and allocating fiscal resources to mentioned economic sector in order to increase
economic growth and vice versa.
The paper will proceed as follows. In section 2, literature will be reviewed. Section 3
will provide insights on methodology and describe each variables used in the econometric
model. In section 4, empirical results will be presented with interpretations, and finally section
5 will give concluding remarks. In Appendix 1 we present the list of countries sampled.
2. Literature Review
The relationship of interest in this paper has been an issue to be solved for quite long. Besides
that, it is also a question of whether this impact is rather two way. To look for an answer,
Wang et al. (2012), found a vital impact of China’s domestic tourism on economic growth
both in the short run and long run for the years from 1984 to 2009, while the impact forth folds
in the long run. Also, they showed both domestic tourism and economic growth Granger cause
each other. Similarly, Balaguer and Cantavella-Jorda (2012), showed a stable and positive

239
relationship between tourism and economic growth in Spain within the years from 1975 to
1997. Using a multiplier effect they have managed to confirm that tourism Granger causes
economic growth in the long run. Dritsakis (2004), while observing a causal effect from
economic growth toward tourism earning and real exchange rate in 1960 to 2000., concluded
that the economic growth in tourism oriented country- Greece, was the result of simultaneous
interaction of these two phenomena.
Lee and Chang (2008), disaggregated countries sampled as OECD and non-OECD
countries and found bilateral causal relationship between tourism and economic growth in
non-OECD countries-mostly undeveloped or developing, and unidirectional impact of tourism
on economic growth in OECD countries-mostly developed countries in the long run for the
period 1990 -2002.
Tang and Tan (2015) showed that tourism has a positive impact on economic growth in
both, short- and the long-term in Malaysia between 1975 and 2011. Oh (2005), however,
observed no long-run relationship between tourism and economic growth in Korea, yet found
only one way relationship that economic growth favors tourism in the short run as well, but
remain open to different methodologies, and different country samples. Brida and Pulina
(2010), showed that in their extensive literature survey about tourism-led growth hypothesis,
apart from the tourism oriented and developing countries no bilateral long run relationship
between tourism and growth is observed. It is no surprise, as tourism- oriented and developing
countries would enhance economic growth through tourism, and similarly by the improved
level of growth.
Lanza et al. (2003), found that although comparing to other sectors, tourism is less
powerful component of economic growth across 13 OECD countries and seemingly
unidirectional impact of tourism toward economic growth is observed, yet it still has no
negative impact in terms of contributing economic growth.
Çağlayan et al, (2012), by applying three-stages panel Granger analysis found mixed
result depending upon country’ well-being across 135 countries between 1995 and 2008.
Apart from developed countries there is no evidence of causal relationship between tourism
and economic growth. Narayan et al, (2010) found a positive and significant long run
relationship between tourism and GDP growth for four Pacific Island countries by applying
Pedroni's (1999, 2004) panel co-integration test in 1988-2004. Apergis and Payne (2012),
found bidirectional relationship between tourism and economic growth for 9 Carribean
countries during 1995 and 2007 using Pedroni’s (1999, 2004) co-integration test. Dritsakis
(2012), applied FMOLS and showed a long run interaction between tourism and economic
growth of eight Mediterranean countries for the years 1980-2008.
Santana-Gallego et al, (2011), showed that tourism trade and tourism seem to have a
bidirectional relationship, they both promote country’s economy across OECD countries.
Belloumi (2010), showed that while tourism-led hypothesis is held for Tunisia, the
relationship is found to be one directed from tourism to economic growth and both series have
a cointegration for the period 1970 and 2007. Balaguer and Cantavella-Jorda (2002), found out
that in long term there is a stable relationship between economic growth and tourism using
cointegration test.
3. Methodology and Variables
Seetanah (2011) indicates that the empirical evidence on the reverse causal relationship
between tourism and economic growth is lacking in research to date. Lopez and Weber (2017)
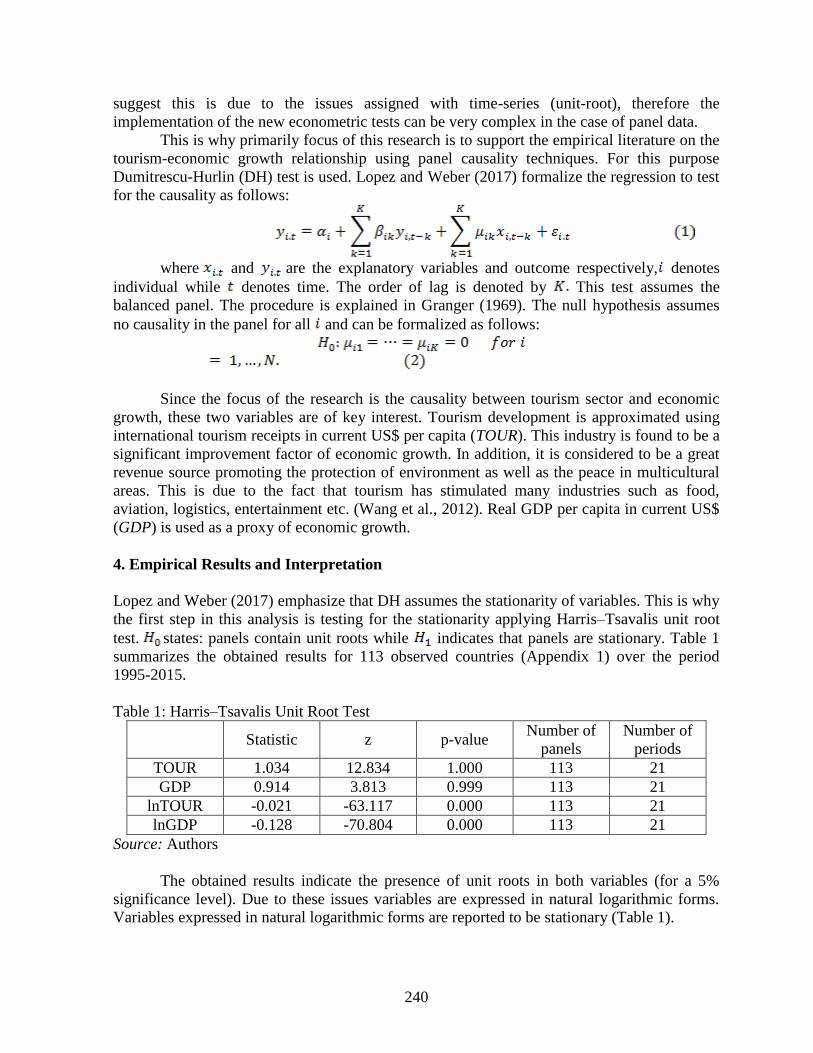
240
suggest this is due to the issues assigned with time-series (unit-root), therefore the
implementation of the new econometric tests can be very complex in the case of panel data.
This is why primarily focus of this research is to support the empirical literature on the
tourism-economic growth relationship using panel causality techniques. For this purpose
Dumitrescu-Hurlin (DH) test is used. Lopez and Weber (2017) formalize the regression to test
for the causality as follows:
where and are the explanatory variables and outcome respectively, denotes
individual while denotes time. The order of lag is denoted by This test assumes the
balanced panel. The procedure is explained in Granger (1969). The null hypothesis assumes
no causality in the panel for all and can be formalized as follows:
Since the focus of the research is the causality between tourism sector and economic
growth, these two variables are of key interest. Tourism development is approximated using
international tourism receipts in current US$ per capita (TOUR). This industry is found to be a
significant improvement factor of economic growth. In addition, it is considered to be a great
revenue source promoting the protection of environment as well as the peace in multicultural
areas. This is due to the fact that tourism has stimulated many industries such as food,
aviation, logistics, entertainment etc. (Wang et al., 2012). Real GDP per capita in current US$
(GDP) is used as a proxy of economic growth.
4. Empirical Results and Interpretation
Lopez and Weber (2017) emphasize that DH assumes the stationarity of variables. This is why
the first step in this analysis is testing for the stationarity applying Harris–Tsavalis unit root
test. states: panels contain unit roots while indicates that panels are stationary. Table 1
summarizes the obtained results for 113 observed countries (Appendix 1) over the period
1995-2015.
Table 1: Harris–Tsavalis Unit Root Test
Statistic z p-value Number of
panels
Number of
periods
TOUR 1.034 12.834 1.000 113 21
GDP 0.914 3.813 0.999 113 21
lnTOUR -0.021 -63.117 0.000 113 21
lnGDP -0.128 -70.804 0.000 113 21
Source: Authors
The obtained results indicate the presence of unit roots in both variables (for a 5%
significance level). Due to these issues variables are expressed in natural logarithmic forms.
Variables expressed in natural logarithmic forms are reported to be stationary (Table 1).
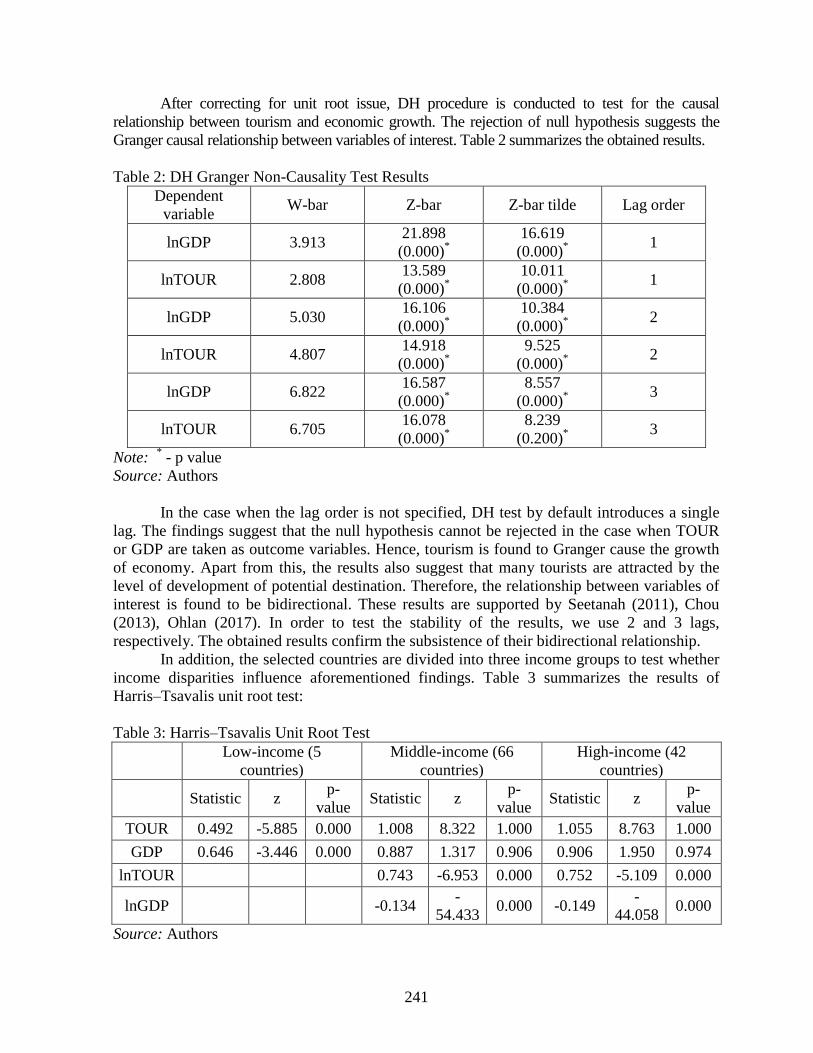
241
After correcting for unit root issue, DH procedure is conducted to test for the causal
relationship between tourism and economic growth. The rejection of null hypothesis suggests the
Granger causal relationship between variables of interest. Table 2 summarizes the obtained results.
Table 2: DH Granger Non-Causality Test Results
Dependent
variable W-bar Z-bar Z-bar tilde Lag order
lnGDP 3.913 21.898
(0.000)*
16.619
(0.000)*
1
lnTOUR 2.808 13.589
(0.000)*
10.011
(0.000)*
1
lnGDP 5.030 16.106
(0.000)*
10.384
(0.000)*
2
lnTOUR 4.807 14.918
(0.000)*
9.525
(0.000)*
2
lnGDP 6.822 16.587
(0.000)*
8.557
(0.000)*
3
lnTOUR 6.705 16.078
(0.000)*
8.239
(0.200)*
3
Note: * - p value
Source: Authors
In the case when the lag order is not specified, DH test by default introduces a single
lag. The findings suggest that the null hypothesis cannot be rejected in the case when TOUR
or GDP are taken as outcome variables. Hence, tourism is found to Granger cause the growth
of economy. Apart from this, the results also suggest that many tourists are attracted by the
level of development of potential destination. Therefore, the relationship between variables of
interest is found to be bidirectional. These results are supported by Seetanah (2011), Chou
(2013), Ohlan (2017). In order to test the stability of the results, we use 2 and 3 lags,
respectively. The obtained results confirm the subsistence of their bidirectional relationship.
In addition, the selected countries are divided into three income groups to test whether
income disparities influence aforementioned findings. Table 3 summarizes the results of
Harris–Tsavalis unit root test:
Table 3: Harris–Tsavalis Unit Root Test
Low-income (5
countries)
Middle-income (66
countries)
High-income (42
countries)
Statistic z p-
value Statistic z
p-
value Statistic z
p-
value
TOUR 0.492 -5.885 0.000 1.008 8.322 1.000 1.055 8.763 1.000
GDP 0.646 -3.446 0.000 0.887 1.317 0.906 0.906 1.950 0.974
lnTOUR 0.743 -6.953 0.000 0.752 -5.109 0.000
lnGDP -0.134 -
54.433 0.000 -0.149
-
44.058 0.000
Source: Authors

242
The obtained results indicate the presence of unit roots in both variables (for a 5%
significance level) in the case of middle- and high-income countries. Due to these issues
variables are expressed in natural logarithmic forms. Variables expressed in natural
logarithmic forms are reported to be stationary (Table 3).
After correcting for unit root issue, DH procedure is conducted to test for the causal
relationship between tourism and economic growth. Table 4 summarizes the obtained results.
Table 4: DH Granger Non-Causality Test Results
Low-income (5 countries) Middle-income (66 countries) High-income (42 countries)
Dep
end
ent
var
iab
le
W-b
ar
Z-b
ar
Z-b
ar t
ild
e
Lag
ord
er
W-b
ar
Z-b
ar
Z-b
ar t
ild
e
Lag
ord
er
W-b
ar
Z-b
ar
Z-b
ar t
ild
e
Lag
ord
er
ln
GD
P
4.448 5.452
(0.000)*
4.168
(0.000)*
1 4.230 18.557
(0.000)*
14.150
(0.000)*
1 3.351 10.775
(0.000)*
8.084
(0.000)*
1
ln
TO
UR
2.081 1.709
(0.087)*
1.192
(0.233)*
1 3.067 11.889
(0.000)*
8.847
(0.000)*
1 2.081 5.975
(0.000)*
22.798
(0.000)*
1
ln
GD
P
5.434 3.840
(0.000)*
2.512
(0.012)*
2 5.184 12.935
(0.000)*
8.389
(0.000)*
2 4.740 8.879
(0.000)*
5.650
(0.000)*
2
ln
TO
UR
6.538 5.073
(0.000)*
3.405
(0.001)*
2 6.538 11.944
(0.000)*
7.672
(0.000)*
2 4.391 7.749
(0.000)*
4.831
(0.000)*
2
ln
GD
P
10.65
1
6.985
(0.000)*
3.985
(0.000)*
3 6.693 12.247
(0.000)*
6.271
(0.000)*
3 6.569 9.443
(0.000)*
4.799
(0.000)*
3
ln
TO
UR
8.308 4.845
(0.000)*
2.647
(0.001)*
3 6.122 10.354
(0.000)*
5.088
(0.000)*
3 7.430 11.720
(0.000)*
6.222
(0.001)*
3
Note: * - p value
Source: Authors
The obtained findings (Table 4) indicate that tourism is confirmed to be Granger determinant
of economic growth. The obtained results confirm aforementioned bidirectional positive relationship
between tourism and economic growth for low-, middle- as well as high-income countries in the
case 2 and 3 lags are introduced respectively. Therefore, tourism and economic growth are reported
to reinforce each other suggesting a bidirectional positive effect.
5. Conclusion
This research aims to conduct a causality analysis of the mutual relationship between tourism and
economic growth using the panel data of 113 countries while controlling for income disparity. The
observed period is between 1995 and 2015. For this purpose, panel Granger causality method is

243
used. This research aims to fill in this gap in literature by applying Granger panel causality approach,
by using the most recent available data and by controlling for the impact of income disparity. The
findings suggest that the null hypothesis cannot be rejected in the case when TOUR or GDP are
taken as outcome variables. Hence, tourism is found to Granger cause the growth of economy. Apart
from this, the results also suggest that many tourists are attracted by the level of development of
potential destination. Therefore, the relationship between variables of interest is found to be
bidirectional. In order to test the stability of the results, we use 2 and 3 lags, respectively. The
obtained results confirm the existence of bidirectional relationship. In addition, the selected countries
are divided into three income groups to test whether income disparities influence aforementioned
findings. The obtained findings indicate that tourism is confirmed to Granger improvement factor of
economic growth. The obtained results confirm aforementioned bidirectional positive relationship
between tourism and economic growth for low-, middle- as well as high-income countries in the
case 2 and 3 lags are introduced respectively. Therefore, tourism and economic growth are reported
to reinforce each other suggesting a bidirectional positive effect.
Appendix 1: List of the countries
244
Algeria
Argentina
Armenia
Australia
Austria
Bahamas, The
Bahrain
Bangladesh
Barbados
Belarus
Belgium
Brazil
Bulgaria
Cambodia
Cameroon
Canada
Central African
Republic
Chile
China
Colombia
Congo, Rep.
Costa Rica
Cote d'Ivoire
Croatia
Cuba
Cyprus
Czech Republic
Denmark
Dominican
Republic
Ecuador
Egypt, Arab Rep.
Estonia
Ethiopia
Fiji
Finland
France
Germany
Ghana
Greece
Honduras
Hong Kong SAR,
China
Hungary
Iceland
India
Indonesia
Iran, Islamic Rep.
Iraq
Ireland
Italy
Jamaica
Japan
Jordan
Kazakhstan
Kenya
Korea, Rep.
Kuwait
Kyrgyz Republic
Lao PDR
Latvia
Lebanon
Libya
Lithuania
Luxembourg
Macedonia, FYR
Malaysia
Mali
Malta
Mauritius
Mexico
Moldova
Mongolia
Morocco
Namibia
Nepal
Netherlands
New Zealand
Nicaragua
Nigeria
Norway
Oman
Pakistan
Panama
Paraguay
Peru
Philippines
Poland
Portugal
Romania
Russian
Federation
Senegal
Sierra Leone
Singapore
Slovak Republic
Slovenia
Spain
Sri Lanka
Sudan
Sweden
Switzerland
Syrian Arab
Republic
Thailand
Trinidad and
Tobago
Tunisia
Turkey
Uganda
Ukraine
United Arab
Emirates
United Kingdom
United States
Uruguay
Venezuela, RB
Yemen, Rep.
Zimbabwe
References
Apergis, N.,& Payne, J. E. 2012. Tourism and growth in the Caribbean–evidence from a panel
error correction model. Tourism Economics, 18(2): 449-456.
Balaguer, J.,& Cantavella, J. M. 2002. Tourism as a long-run economic growth factor: the
Spanish case. Applied economics, 34(7): 877-884.
Belloumi, M. 2010. The relationship between tourism receipts, real effective exchange rate and
economic growth in Tunisia. International journal of tourism research, 12(5): 550-560.
Brida, J.G.,& Pulina, M. 2010. A literature review on the tourism-led-growth hypothesis.
CRENoS-CUEC, 2010 (17): 1-26
Balaguer, J.,& Cantavella, J. M. 2002. Tourism as a long-run economic growth factor: the
Spanish case. Applied economics, 34(7): 877-884.
Chou, M. C.2013. Does tourism development promote economic growth in transition countries?
A panel data analysis.Economic Modelling, 33(2013): 226–232.
Çağlayan, E., Şak, N.,& Karymshakov, K. 2012. Relationship between tourism and economic
growth: A panel Granger causality approach. Asian economic and financial review, 2(5):
518-529.
Dritsakis, N. 2012. Tourism development and economic growth in seven Mediterranean
countries: A panel data approach. Tourism Economics, 18(4): 801-816.
Dritsakis, N. 2004. Tourism as a long-run economic growth factor: an empirical investigation for
Greece using causality analysis. Tourism Economics, 10(3): 305-316.
245
Granger, C. W. 1969. Investigating Causal Relations by Econometric Models and Cross-Spectral
Methods.Econometrica, 37(3): 424-438.
Lanza, A., Temple, P.,& Urga, G. 2003. The implications of tourism specialisation in the long
run: an econometric analysis for 13 OECD economies. Tourism Management, 24(3): 315-
321.
Lee, C.C.,& Chang, C. P. 2008. Tourism development and economic growth: A closer look at
panels. Tourism management, 29(1): 180-192.
Lopez, L.,& Weber, S. 2017. Testing for Granger Causality in Panel Data. University of
Neuchatel (Institute of Economic Research), online
publication:https://www.unine.ch/files/live/sites/irene/files/shared/documents/Publication
s/Working%20papers/2017/WP17-03_V2.pdf.
Muslija, A., Satrovic, E. & Unver Erbas, C. 2017. Panel Analysis of Tourism – Economic
Growth Nexus. International Journal of Economic Studies, 3(4): 535-545.
Narayan, P.K., Narayan, S., Prasad, A.,& Prasad, B. C. 2010. Tourism and economic growth: a
panel data analysis for Pacific Island countries. Tourism economics, 16(1): 169-183.
Oh, C. O. 2005. The contribution of tourism development to economic growth in the Korean
economy. Tourism management, 26(1): 39-44.
Ohlan, R. 2017. The relationship between tourism, financial development and economic growth
in India.Future Business Journal, 3(1): 9-22.
Pedroni, P. 2004. Panel cointegration: asymptotic and finite sample properties of pooled time
series tests with an application to the PPP hypothesis. Econometric theory, 20(3): 597-
625.
Pedroni, P. 1999. Critical values for cointegration tests in heterogeneous panels with multiple
regressors. Oxford Bulletin of Economics and statistics, 61(S1): 653-670.
Santana, G. M., Ledesma, R. F.,& Pérez, R. J.V. 2011. Tourism and trade in OECD countries. A
dynamic heterogeneous panel data analysis. Empirical Economics, 41(2): 533-554.
Satrovic, E. & Muslija, A. 2017. Foreign Direct Investments and Tourism: Empirical Evidence
from Turkey, ICPESS 2017 Proceeding, 9-11 November 2017, Ankara-Turkey: 88-100.
Seetanah, B. 2011. Assessing the dynamic economic impact of tourism for Island
economies.Annals of Tourism Research, 38(1): 291–308.
Tang, C.F., & Tan, E. C. 2015. Does tourism effectively stimulate Malaysia's economic
growth?.Tourism Management, 46(2015): 158-163.
Wang, L., Zhang, H.,& Li, W. 2012.Analysis of Causality between Tourism and Economic
Growth Based on Computational Econometrics. JCP, 7(9): 2152-2159.

246
WHAT DOES ENTREPRENEURSHIP HAVE IN COMMON WITH
GAMBLING?
Azra Pasic Mesihovic
School of Economics and Business, University of Sarajevo
Trg oslobodjenja - Alije Izetbegovica 1, 71000 Sarajevo, Bosnia and Herzegovina
Phone: +387 33 564 394
E-mail: [email protected]
Mirza Kulenovic
University College “CEPS - Center for Business Studies”'
Josipa Bana Jelacica bb, 71250 Kiseljak, Bosnia and Herzegovina
Phone: +387 33 614 386
E-mail: [email protected]
Ljiljan Veselinovic
School of Economics and Business, University of Sarajevo
Trg oslobodjenja - Alije Izetbegovica 1, 71000 Sarajevo, Bosnia and Herzegovina
Phone: +387 33 253 766
E-mail: [email protected]
Abstract
Individuals with different types of personalities have different ways of perceiving risk. As
willingness to take risk is one of the most important trait in the entrepreneurial mindset, this study
applied a survey research method to examine the influence of personality traits and risk
propensity on (a) risk perception (gambling domain) and (b) entrepreneurial intentions. In order
to test the conceptual model and proposed hypotheses, we collected data from 245 students in
Bosnia and Herzegovina. Our first model tested whether risk propensity and personality traits are
related to risk perception. By using structural equation modeling, we also examined whether risk
propensity has a mediating role on the relationship between personality traits and risk perception
in gambling. Our second model is specified in a similar way as the first one, but instead of
gambling risk perception, we employed entrepreneurial intention construct. Our ultimate goal
was to test whether same personality traits are associated with risk perception and entrepreneurial
intentions. The findings of this research contribute to the literature on the importance of gaining
knowledge about risk assessment among students and shed some light on the necessity of
creating a supportive environment for risk decision making of future entrepreneurs.
Keywords: The Big Five, personality traits, Risk propensity, Risk perception, Entrepreneurial
intention
JEL classification: L26
247
1. Introduction
The risk propensity is a tendency of an individual to take or avoid risks (Sitkin & Weingar,
1995). This individual trait is not long-lasting, i.e. it can change over time. Risk perception is
assessment about probability that perceived risk event can occur, how controllable is a risk and
how confident an individual is about risk estimations (Sitkin & Weingar, 1995). Previous
research identified risk propensity as a critical explaining factor, but the results are not consistent
across studies (see Wang, Xu, Zhang, & Chen, 2016, pp. 1296). Therefore, we start by testing the
relationship between risk propensity and risk perception. In addition to risk propensity, we also
included personality traits which might contribute to explanation of risk perception. Since risk
perception is an important part of entrepreneurs’ intentions and actual behaviours of
entrepreneurs, in this paper we tested whether risk propensity is positively associated with
entrepreneurial intentions; assuming that gambling risk perception and entrepreneur intentions
represent different but similar concepts. Both risk perception and entrepreneurial intention are not
actual behaviours, but perception about existence of risk and opportunity in different
environments (gambling and business environment). Our ultimate goal is to examine whether
same personality traits are associated with risk perception in gambling and entrepreneurial
intentions. We begin by providing short overview of big five personality traits. We also provide
definition of two key determinants of risky-decision making behavior: risk propensity and risk
perception. Afterwards, brief overview of literature is provided in order to derive research
questions and hypotheses. Finally, we present sample, data, the model and conclusions.
2. Theoretical Background
In this theoretical background section we provide most important definition of constructs and
concepts used in the paper, as well as overview of existing relationships between personality
traits, risk propensity, and risk perception.
2.1. Big Five Personality Traits
Five Factor Model (FFM) or Big Five Model (BFM) of personality has provided a framework for
a variety of personality variables into a parsimonious and relatively comprehensive set of
personality constructs. Those five broad personality dimensions are Emotional Stability,
Extraversion, Openness to Experience, Agreeableness, and Conscientiousness, and they tend to
capture the basic structure of human personality. These dimensions are often represented as
acronym OCEAN or CANOE.
Openness to experience reflects the degree of intellectual curiosity and creativity, and
individuals with high openness can be perceived as unpredictable or with lack of focus, and it is
more likely for that person to engage in risky behaviour. On the other hand, those individuals
with low openness seek to gain fulfillment through perseverance and are characterized as
pragmatic and data-driven, sometimes even perceived to be dogmatic and closed-minded.
Conscientiousness represents tendency to be organized and dependable, it shows self-discipline,
allowing individuals to act dutifully while engaging in planned rather than spontaneous behavior.
High conscientiousness is often perceived as stubbornness and obsession, while low
conscientiousness means flexibility and spontaneity. Extraversion (high) reflects energetic
behaviour, positive emotions, assertiveness, sociability and talkativeness, while low extraversion
trait (introverted people) causes a reserved, reflective personality. Agreeableness (high) is

248
tendency to be compassionate and cooperative, while people with low agreeableness are often
competitive or challenging. Neuroticism or emotional stability is a trait that allows individuals to
experience unpleasant emotions more easily. For example, high stability manifests itself as a
stable and calm personality, while low stability manifests itself as the reactive and excitable
personality often found in dynamic individuals.
One very important and yet very controversial trait for entrepreneurial research is risk
propensity (Miner & Raju, 2004; Rauch & Frese, 2007; Zhao, Seibert, & Lumpkin, 2010). Some
scholars (e.g., Nicholson, Fenton-O’Creevy, Soane, & Willman, 2005) suggest that risk
propensity is a compound personality trait reflecting a specific combination of scores on all five
dimensions of personality (namely, high extraversion, openness, and emotional stability
combined with low agreeableness and low conscientiousness). Others argue that risk propensity
forms a separate sixth dimension of personality not captured by the Big Five (Jackson, 1994;
Paunonen & Jackson, 1996). Because of the theoretical importance of risk propensity as a trait,
we include it as an additional personality construct outside of the Big Five, as it was in some
previous research (eg. Zhao et al., 2010, Wang et al., 2016).
2.2. Risk propensity
Generally, individuals differ in their ways of dealing with risks (Lion, Meertens, & Bot, 2002).
Risk propensity, also seen as a risk-taking tendency can be defined as “the tendency of a decision
maker either to take or to avoid risks” (Sitkin & Pablo, 1992: p.12). Also, risk propensity may be
seen as an individual trait which can change over time, depending on the experience gained
(Sitkin & Weingart, 1995). Individuals with higher risk propensity deal more comfortable with
risky situations and perceive the same situations as less risky than others.
Although individuals differ in their willingness to take a risk, there is a disagreement
about the nature of this trait and the impact it has on decision-making (Keil, Wallace, Turk,
Dixon-Randall, & Nulden, 2000). Some authors (Kogan & Wallach, 1964; Jackson, Hourany, &
Vidmar, 1972; Keinan, Meir, & Gome-Nemirovsky, 1984) state that it is a general personality
trait where individuals demonstrate constant tendencies around different situations. On the other
hand, MacCrimmon & Wehrung (1985) found risk propensity to be a situationally-specific
variable where risk propensity depends on a particular situation. For the purpose of our study, we
use general scale for risk propensity developed by Meertens & Lion (2008). The reason is that it
distinguishes itself from longer scales that measure risk taking across large number of domains
and because it has been used mostly in student population.
Some other studies also includes risk propensity in explaining different phenomenon. For
example, the results of Cui, Sun, Xiao, & Zhao (2016) provide evidence that risk propensity has a
moderating effect on alertness to business ideas and entrepreneurial capabilities.
Table 1 summarizes the expected influence of personality traits on risk propensity based
on the literature review of Wang et al. (2016)

249
Table 1. Personality traits and risk propensity
Personality trait Description of individuals → Risk propensity
Extraversion Individuals with needs for sensation, excitement, ... More inclined to seek the
experience of risk taking
Agreeableness Impulsive decision-makers Engage in risky behavior
Conscientiousness Individuals that focus on their own lives under
circumstances of regulations and control Low levels of risk propensity
Emotional Stability Individuals that are less likely to be anxious Less risk seeking
Openness to
Experience
Individuals ignoring uncertainty change because of
their impulsion and willfulness More risky behaviour
Note: Based on the literature review of Wang et al. (2016).
2.3. Risk perception
In classical decision theory, risk is perceived as a variation in the distribution of possible
outcomes, their likelihoods, and their subjective values (March & Shapira, 1987). In that sense
Sjöberg, Moen, & Rundmo (2004: pp.8) define risk perception as the “subjective assessment of
the probability of a specified type of accident happening and how concerned we are with the
consequences. To perceive risk includes evaluations of the probability as well as the
consequences of a negative outcome”. For the measurement of risk perception most commonly
used scale is the Domain-Specific-Risk-Taking (DOSPERT) scale developed by Weber, Blais, &
Betz (2002). DOSPERT scale has been tested for reliability and validity in many studies (Blais &
Weber, 2006; Harris & Jenkins, 2006). It allows researchers to perceive risk attitudes in five
commonly encountered content domains: ethical, financial - further decomposed into gambling
and investment, health/safety, social, and recreational decisions.
Although many factors may affect risk perception, Sitkin & Pablo (1992) particularly
emphasize the influence of the risk propensity on risk perception. This relationship between risk
propensity and risk perception has been proposed and supported many times in the past (Brockhaus,
1980; Vlek & Stallen, 1980; Schneider & Lopes, 1986). Different authors (Brockhaus, 1980; Vlek &
Stallen, 1980; Sitkin & Weingart, 1995) argue that risk propensity, by influencing the relative
prominence of situational threat or opportunity causes different, biased risk perceptions. In this context,
people who are risk-averse will more appreciate negative than the positive consequences of the
outcome. They attend to and weight potentially negative outcomes more heavily than positive
outcomes. On the other hand, risk-seeking decision makers will appreciate more positive than negative
effects of the outcome, overestimating the probability of gain relative to the probability of loss. Previous
articles confirmed the proposed relationship. Sitkin & Weingart (1995) found that risk propensity has a
significant negative relationship related to risk perception in the case of thirty-eight master’s of business
administration students. They conclude that when subjects reported higher levels of risk propensity,
they also reported that they have perceived less risk in the situation. Byrne (2005) reported the same
effect in the case of consumers evaluation of risk in financial products. Furthermore, risk propensity has
a negative influence on risk perception of construction project managers (Wang, Zhao, Zhang, & Wang,
2015) and Chen, Zhang, Liu, & Hu (2015) confirm that there is a significant negative relationship
between risk propensity and risk perception in bid/no-bid decision-making of construction projects.

250
Table 2 summarizes the expected influence of personality traits on risk perception based
on the literature review of Wang et al. (2016).
Table 2. Personality traits and risk perception
Personality trait Description of individuals → Risk perception
Extraversion
Extroverts can accept deviant behaviors more
easily than introverts; they engage in multiple,
risky health behaviors; they are seeking sensation
Low level or risk perception
Agreeableness
Individuals with high agreeableness show more
sympathy and empathy to others; they choose safer
solutions to reduce uncomfortable feelings
High level of risk perception
Conscientiousness Individuals that focus on their own lives under
circumstances of regulations and control High level of risk perception
Emotional Stability Individuals that are less likely to be anxious or to
demonstrate risky or impulsive actions High level of risk perception
Openness to
Experience
Individuals that can accept new things more easily
and have more tolerance to uncertainty Low level or risk perception
Note: Based on the literature review of Wang et al. (2016).
2.4. Entrepreneurial intention
A starting point for every rational and important action is the intention. An often used example of
intention is found in entrepreneurship: cognitive states prior decision to start a business, which is
not an ad hoc activity. It is a cognitive and time-consuming process, where business emergence is
just a top of an iceberg. Individuals with higher intentions to start businesses have to make many
creative simulations and administrative steps in order to reach the goal and to make sure startups
will emerge on the market. Thus, entrepreneurial activity is intentional, resulting from motivation
and cognition (Frese, 2009; Kautonen, Van Gelderen, & Tornikoski, 2013; Kolvereid & Isaksen,
2006; Krueger, 2005). Social psychology scholars define intentions as cognitive states
immediately prior to the decision to act (Ajzen, 1991; Ajzen & Fishbein, 1980; Fishbein &
Ajzen, 1975). Entrepreneurial intentions are the single most important predictor of individual's
later entrepreneurial behavior. This construct is an essential part of every conceptual model that
explains business formation.
Through the history of entrepreneurial thought, the entrepreneur is perceived as
uncertainty-bearer (Barreto, 1989). In that context, entrepreneur is someone who should
overcome uncertainty in order to sell products on the market, or make decisions about future
development in a uncertain environment. Besides being uncertainty-bearer, several other roles
can be attributed to entrepreneurs: coordinator, innovator and arbitrageur. While uncertainty does
not guarantee success of the firm, the results of Boermans & Willebrands (2017) suggest that
“entrepreneurs with higher perception of risk in general earn higher revenue.”
For the purpose of this study we use only the gambling domain of risk perception, since it
is closest to entrepreneurial context and therefore it has strongest link to entrepreneurial
intentions. The reason for that is because students often identify risk situations as gambling
(March & Shapira, 1987). Therefore, we follow the insight from March & Shapira who stated
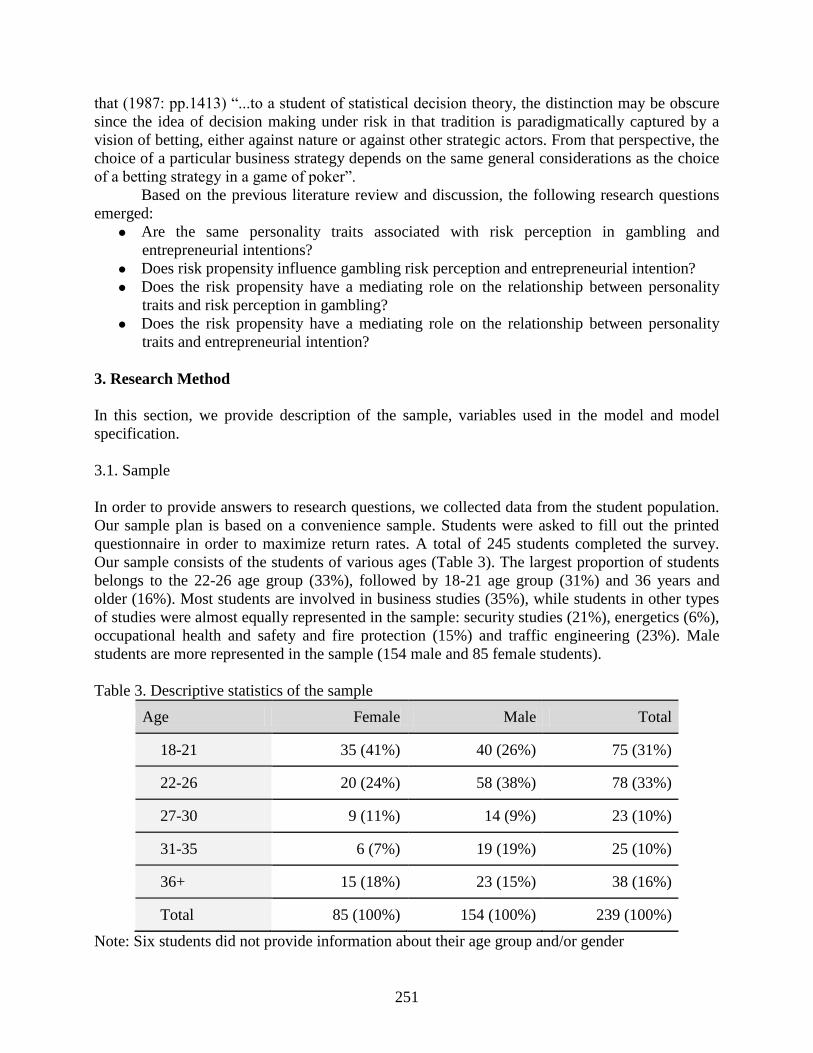
251
that (1987: pp.1413) “...to a student of statistical decision theory, the distinction may be obscure
since the idea of decision making under risk in that tradition is paradigmatically captured by a
vision of betting, either against nature or against other strategic actors. From that perspective, the
choice of a particular business strategy depends on the same general considerations as the choice
of a betting strategy in a game of poker”.
Based on the previous literature review and discussion, the following research questions
emerged:
Are the same personality traits associated with risk perception in gambling and
entrepreneurial intentions?
Does risk propensity influence gambling risk perception and entrepreneurial intention?
Does the risk propensity have a mediating role on the relationship between personality
traits and risk perception in gambling?
Does the risk propensity have a mediating role on the relationship between personality
traits and entrepreneurial intention?
3. Research Method
In this section, we provide description of the sample, variables used in the model and model
specification.
3.1. Sample
In order to provide answers to research questions, we collected data from the student population.
Our sample plan is based on a convenience sample. Students were asked to fill out the printed
questionnaire in order to maximize return rates. A total of 245 students completed the survey.
Our sample consists of the students of various ages (Table 3). The largest proportion of students
belongs to the 22-26 age group (33%), followed by 18-21 age group (31%) and 36 years and
older (16%). Most students are involved in business studies (35%), while students in other types
of studies were almost equally represented in the sample: security studies (21%), energetics (6%),
occupational health and safety and fire protection (15%) and traffic engineering (23%). Male
students are more represented in the sample (154 male and 85 female students).
Table 3. Descriptive statistics of the sample
Age Female Male Total
18-21 35 (41%) 40 (26%) 75 (31%)
22-26 20 (24%) 58 (38%) 78 (33%)
27-30 9 (11%) 14 (9%) 23 (10%)
31-35 6 (7%) 19 (19%) 25 (10%)
36+ 15 (18%) 23 (15%) 38 (16%)
Total 85 (100%) 154 (100%) 239 (100%)
Note: Six students did not provide information about their age group and/or gender
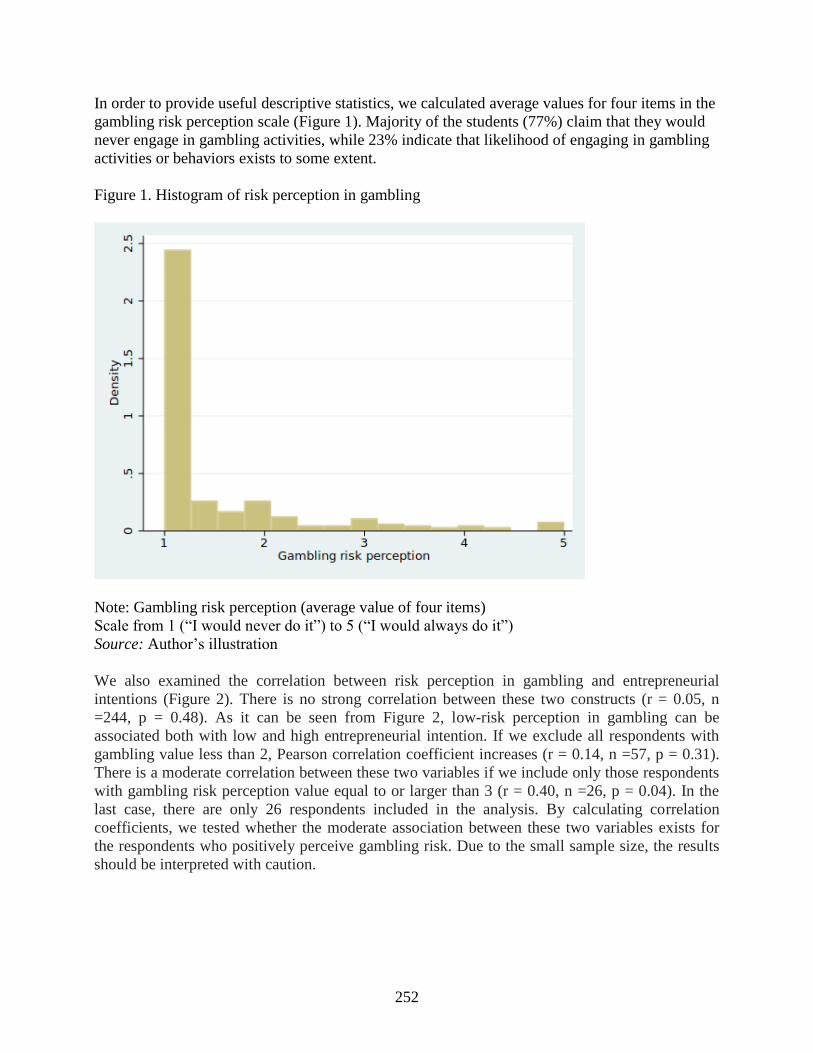
252
In order to provide useful descriptive statistics, we calculated average values for four items in the
gambling risk perception scale (Figure 1). Majority of the students (77%) claim that they would
never engage in gambling activities, while 23% indicate that likelihood of engaging in gambling
activities or behaviors exists to some extent.
Figure 1. Histogram of risk perception in gambling
Note: Gambling risk perception (average value of four items)
Scale from 1 (“I would never do it”) to 5 (“I would always do it”)
Source: Author’s illustration
We also examined the correlation between risk perception in gambling and entrepreneurial
intentions (Figure 2). There is no strong correlation between these two constructs (r = 0.05, n
=244, p = 0.48). As it can be seen from Figure 2, low-risk perception in gambling can be
associated both with low and high entrepreneurial intention. If we exclude all respondents with
gambling value less than 2, Pearson correlation coefficient increases (r = 0.14, n =57, p = 0.31).
There is a moderate correlation between these two variables if we include only those respondents
with gambling risk perception value equal to or larger than 3 (r = 0.40, n =26, p = 0.04). In the
last case, there are only 26 respondents included in the analysis. By calculating correlation
coefficients, we tested whether the moderate association between these two variables exists for
the respondents who positively perceive gambling risk. Due to the small sample size, the results
should be interpreted with caution.

253
Figure 2. Correlation between gambling risk perception and entrepreneurial intentions
Source: Author’s illustration
3.2. Variables in the model
In this study, we used four scales: Risk propensity (RPRO), Risk Perception (RPER), Five-
Factor Model (FFM) of personality and five items scale for measuring entrepreneurial intention.
The risk propensity scale was adopted from Meertens & Lion (2008): a seven-items form of risk
propensity scale where respondents had to indicate the extent to which they agree or disagree
with statements on a nine-point Likert scale. Risk propensity is a variable that is not directly
observed, i.e. latent variable. Risk perception also represents a latent construct taken from Weber
et al. (2002). Respondents had to indicate a likelihood of engaging in 40 different activities or
behaviors on a five-point Likert scale. The underlying factors of risk perceptions are ethical,
investment, gambling, health/safety, recreational, and social items. As already explained, in this
paper we focus only on gambling risk perception. We used relatively short measures of the Five-
Factor Model (FFM) of personality, with two items per dimension. This short form was
previously validated by Gosling, Rentfrow, & Swann (2003). Finally, Liñán & Chen’s (2009)
Likert type scale with five items for measuring entrepreneurial intention was used.
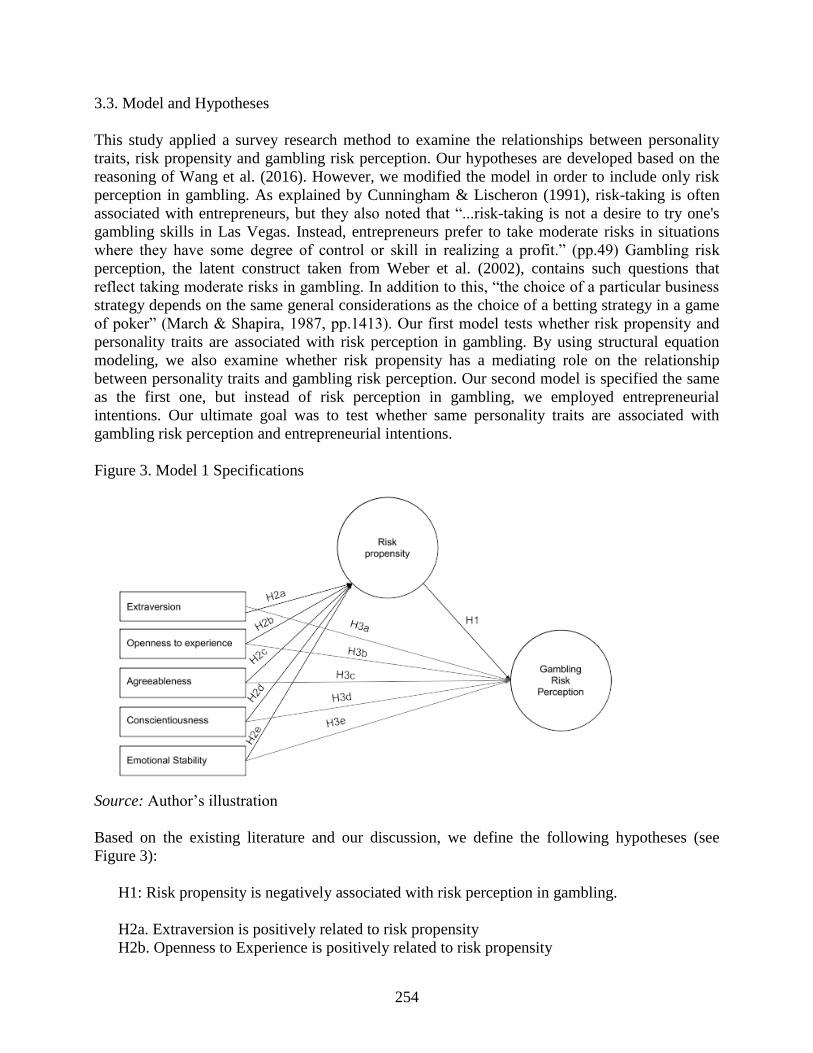
254
3.3. Model and Hypotheses
This study applied a survey research method to examine the relationships between personality
traits, risk propensity and gambling risk perception. Our hypotheses are developed based on the
reasoning of Wang et al. (2016). However, we modified the model in order to include only risk
perception in gambling. As explained by Cunningham & Lischeron (1991), risk-taking is often
associated with entrepreneurs, but they also noted that “...risk-taking is not a desire to try one's
gambling skills in Las Vegas. Instead, entrepreneurs prefer to take moderate risks in situations
where they have some degree of control or skill in realizing a profit.” (pp.49) Gambling risk
perception, the latent construct taken from Weber et al. (2002), contains such questions that
reflect taking moderate risks in gambling. In addition to this, “the choice of a particular business
strategy depends on the same general considerations as the choice of a betting strategy in a game
of poker” (March & Shapira, 1987, pp.1413). Our first model tests whether risk propensity and
personality traits are associated with risk perception in gambling. By using structural equation
modeling, we also examine whether risk propensity has a mediating role on the relationship
between personality traits and gambling risk perception. Our second model is specified the same
as the first one, but instead of risk perception in gambling, we employed entrepreneurial
intentions. Our ultimate goal was to test whether same personality traits are associated with
gambling risk perception and entrepreneurial intentions.
Figure 3. Model 1 Specifications
Source: Author’s illustration
Based on the existing literature and our discussion, we define the following hypotheses (see
Figure 3):
H1: Risk propensity is negatively associated with risk perception in gambling.
H2a. Extraversion is positively related to risk propensity
H2b. Openness to Experience is positively related to risk propensity
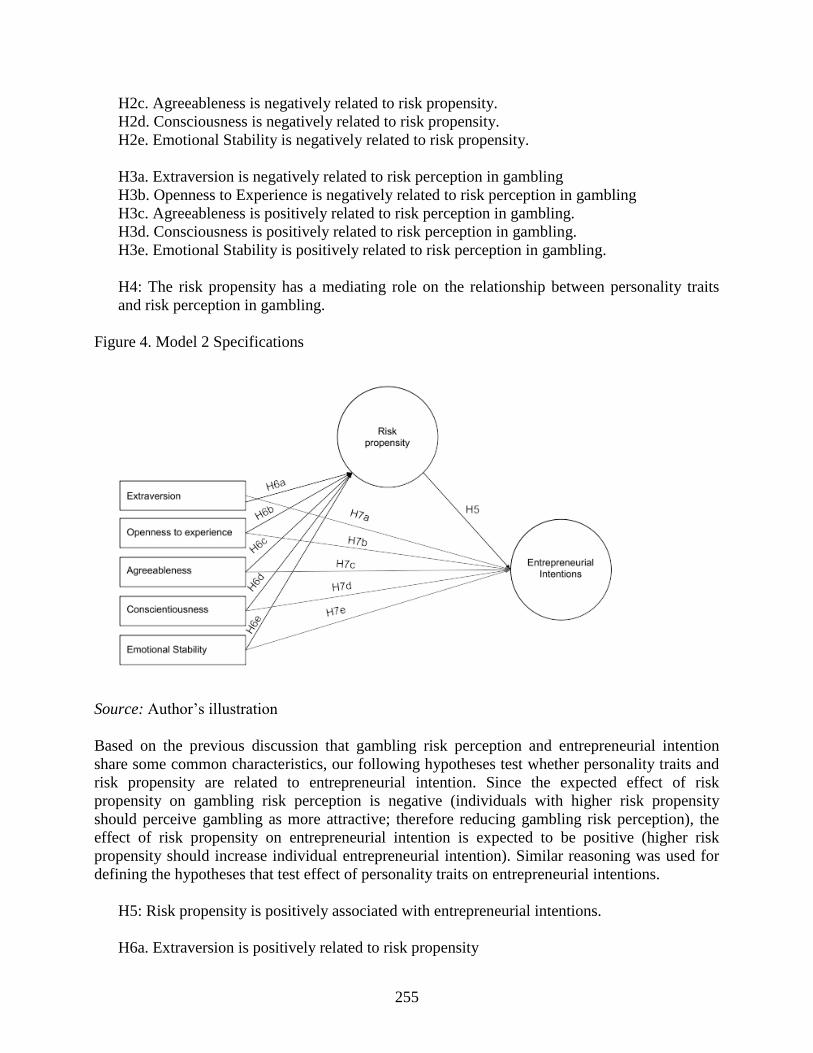
255
H2c. Agreeableness is negatively related to risk propensity.
H2d. Consciousness is negatively related to risk propensity.
H2e. Emotional Stability is negatively related to risk propensity.
H3a. Extraversion is negatively related to risk perception in gambling
H3b. Openness to Experience is negatively related to risk perception in gambling
H3c. Agreeableness is positively related to risk perception in gambling.
H3d. Consciousness is positively related to risk perception in gambling.
H3e. Emotional Stability is positively related to risk perception in gambling.
H4: The risk propensity has a mediating role on the relationship between personality traits
and risk perception in gambling.
Figure 4. Model 2 Specifications
Source: Author’s illustration
Based on the previous discussion that gambling risk perception and entrepreneurial intention
share some common characteristics, our following hypotheses test whether personality traits and
risk propensity are related to entrepreneurial intention. Since the expected effect of risk
propensity on gambling risk perception is negative (individuals with higher risk propensity
should perceive gambling as more attractive; therefore reducing gambling risk perception), the
effect of risk propensity on entrepreneurial intention is expected to be positive (higher risk
propensity should increase individual entrepreneurial intention). Similar reasoning was used for
defining the hypotheses that test effect of personality traits on entrepreneurial intentions.
H5: Risk propensity is positively associated with entrepreneurial intentions.
H6a. Extraversion is positively related to risk propensity
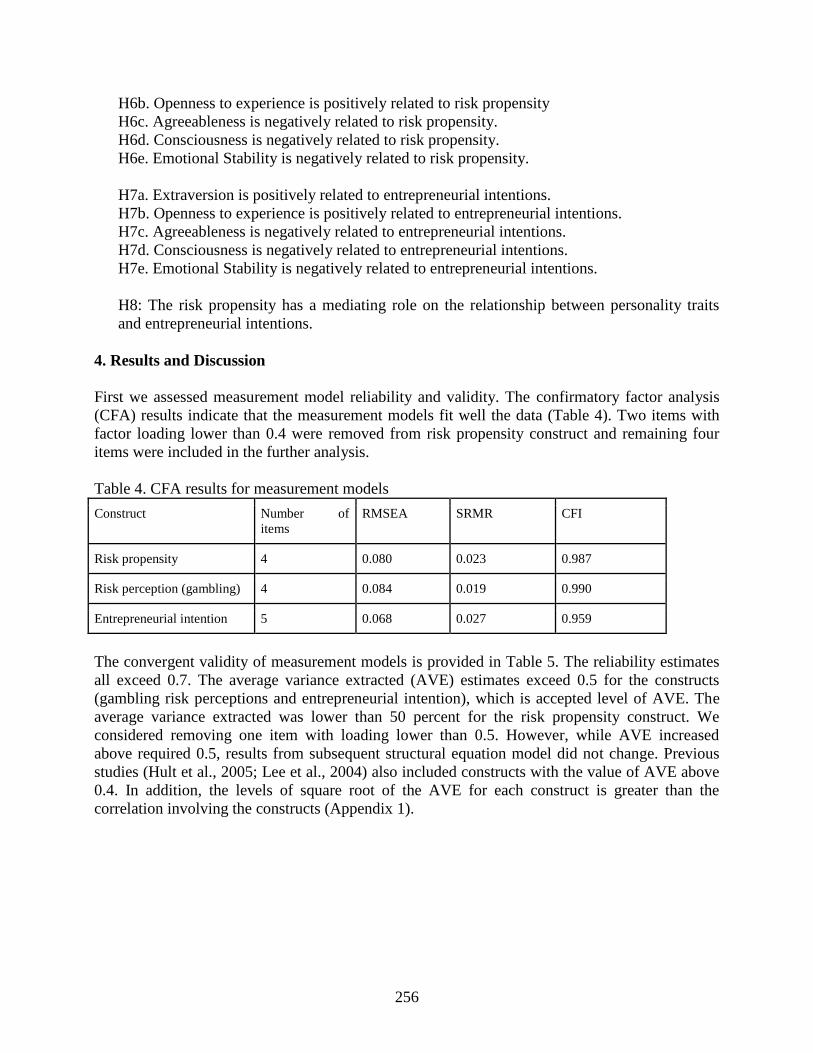
256
H6b. Openness to experience is positively related to risk propensity
H6c. Agreeableness is negatively related to risk propensity.
H6d. Consciousness is negatively related to risk propensity.
H6e. Emotional Stability is negatively related to risk propensity.
H7a. Extraversion is positively related to entrepreneurial intentions.
H7b. Openness to experience is positively related to entrepreneurial intentions.
H7c. Agreeableness is negatively related to entrepreneurial intentions.
H7d. Consciousness is negatively related to entrepreneurial intentions.
H7e. Emotional Stability is negatively related to entrepreneurial intentions.
H8: The risk propensity has a mediating role on the relationship between personality traits
and entrepreneurial intentions.
4. Results and Discussion
First we assessed measurement model reliability and validity. The confirmatory factor analysis
(CFA) results indicate that the measurement models fit well the data (Table 4). Two items with
factor loading lower than 0.4 were removed from risk propensity construct and remaining four
items were included in the further analysis.
Table 4. CFA results for measurement models
Construct Number of
items
RMSEA SRMR CFI
Risk propensity 4 0.080 0.023 0.987
Risk perception (gambling) 4 0.084 0.019 0.990
Entrepreneurial intention 5 0.068 0.027 0.959
The convergent validity of measurement models is provided in Table 5. The reliability estimates
all exceed 0.7. The average variance extracted (AVE) estimates exceed 0.5 for the constructs
(gambling risk perceptions and entrepreneurial intention), which is accepted level of AVE. The
average variance extracted was lower than 50 percent for the risk propensity construct. We
considered removing one item with loading lower than 0.5. However, while AVE increased
above required 0.5, results from subsequent structural equation model did not change. Previous
studies (Hult et al., 2005; Lee et al., 2004) also included constructs with the value of AVE above
0.4. In addition, the levels of square root of the AVE for each construct is greater than the
correlation involving the constructs (Appendix 1).

257
Table 5. Items of measurement model 1 with loadings, t-values, CR and AVE values
Model 1
Construct Code Indicator St.
loadings t-value CR AVE
Cronbach’s
Alpha
Risk
propensity
RP1 Safety first 0.69 15.32
0.74 0.43 0.75
RP2 I do not take risks with my health 0.84 20.59
RP3 I prefer to avoid risks. 0.67 14.04
RP5 I really dislike not knowing what is
going to happen
0.43 6.85
Risk
perception
(gambling)
GRP1 Betting a day’s income at the horse
races.
0.62 12.38
0.80 0.50 0.82
GRP2 Betting a day’s income at a high
stake poker game.
0.73 16.96
GRP3 Betting a day’s income on the
outcome of a sporting event (e.g.
baseball, soccer, or football).
0.70 15.86
GRP4 Gambling a week’s income at a
casino. (G)
0.78 19.64
Entre-
preneurial
intention
EI1 I am ready to do anything to be an
entrepreneur
0.82 31.00
0.92 0.69 0.91
EI2 My professional goal is to become
an entrepreneur
0.86 39.74
EI3 I will make every effort to start and
run my own firm
0.89 47.05
EI4 I am determined to create a firm in
the future
0.87 42.01
EI6 I have the firm intention to start a
firm someday
0.71 19.64
As expected, risk propensity is negatively associated with risk perception in gambling (Table 6).
Therefore, our H1 is supported. Only emotional stability is related to risk propensity. However,
the coefficient is positive, not negative as expected. Other personality traits are not related to risk
propensity (H2a, H2b, H2c and H2d not supported). Openness to experience is negatively related
to gambling risk perception (H3b supported), while we have not found that other personality
traits are directly related to risk perception in gambling (H3a, H3b, H3c and H3d).
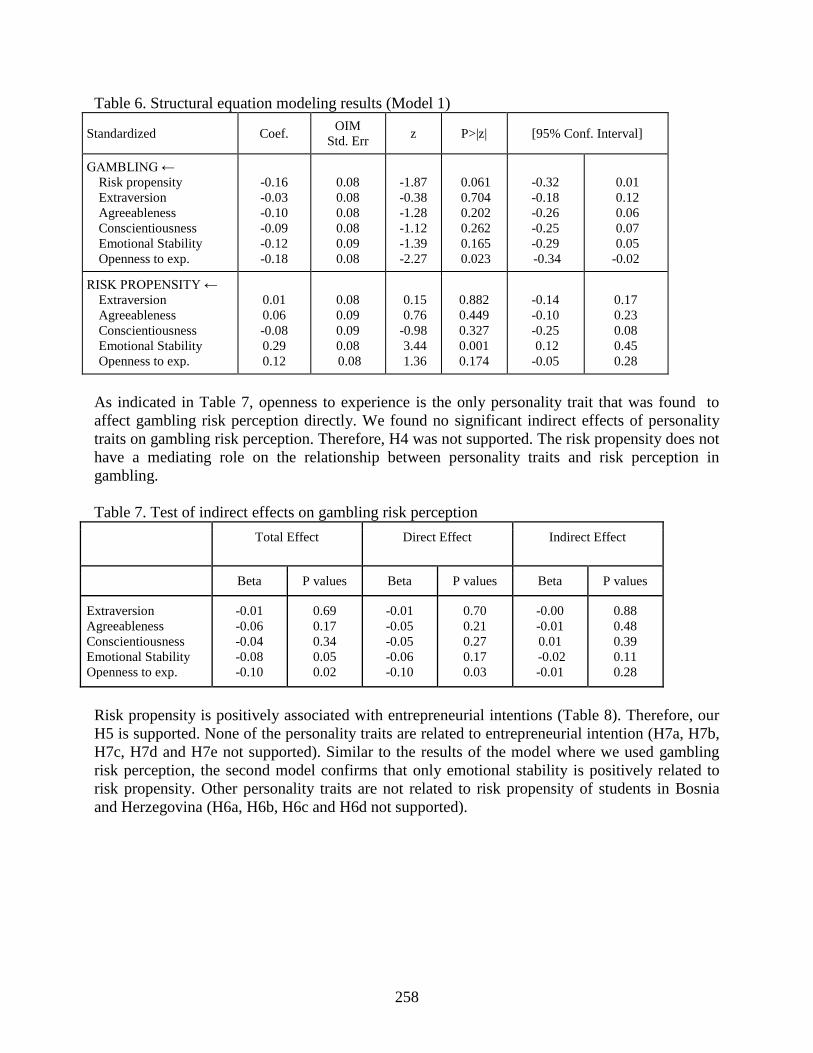
258
Table 6. Structural equation modeling results (Model 1)
Standardized Coef. OIM
Std. Err z P>|z| [95% Conf. Interval]
GAMBLING ←
Risk propensity
Extraversion
Agreeableness
Conscientiousness
Emotional Stability
Openness to exp.
-0.16
-0.03
-0.10
-0.09
-0.12
-0.18
0.08
0.08
0.08
0.08
0.09
0.08
-1.87
-0.38
-1.28
-1.12
-1.39
-2.27
0.061
0.704
0.202
0.262
0.165
0.023
-0.32
-0.18
-0.26
-0.25
-0.29
-0.34
0.01
0.12
0.06
0.07
0.05
-0.02
RISK PROPENSITY ←
Extraversion
Agreeableness
Conscientiousness
Emotional Stability
Openness to exp.
0.01
0.06
-0.08
0.29
0.12
0.08
0.09
0.09
0.08
0.08
0.15
0.76
-0.98
3.44
1.36
0.882
0.449
0.327
0.001
0.174
-0.14
-0.10
-0.25
0.12
-0.05
0.17
0.23
0.08
0.45
0.28
As indicated in Table 7, openness to experience is the only personality trait that was found to
affect gambling risk perception directly. We found no significant indirect effects of personality
traits on gambling risk perception. Therefore, H4 was not supported. The risk propensity does not
have a mediating role on the relationship between personality traits and risk perception in
gambling.
Table 7. Test of indirect effects on gambling risk perception
Total Effect Direct Effect Indirect Effect
Beta P values Beta P values Beta P values
Extraversion
Agreeableness
Conscientiousness
Emotional Stability
Openness to exp.
-0.01
-0.06
-0.04
-0.08
-0.10
0.69
0.17
0.34
0.05
0.02
-0.01
-0.05
-0.05
-0.06
-0.10
0.70
0.21
0.27
0.17
0.03
-0.00
-0.01
0.01
-0.02
-0.01
0.88
0.48
0.39
0.11
0.28
Risk propensity is positively associated with entrepreneurial intentions (Table 8). Therefore, our
H5 is supported. None of the personality traits are related to entrepreneurial intention (H7a, H7b,
H7c, H7d and H7e not supported). Similar to the results of the model where we used gambling
risk perception, the second model confirms that only emotional stability is positively related to
risk propensity. Other personality traits are not related to risk propensity of students in Bosnia
and Herzegovina (H6a, H6b, H6c and H6d not supported).

259
Table 8. Structural equation modeling results (Model 2)
Standardized Coef. OIM
Std. Err z P>|z| [95% Conf. Interval]
ENTREPRENEURIAL INTENTION ←
Risk propensity
Extraversion
Agreeableness
Conscientiousness
Emotional Stability
Openness to exp.
0.17
0.06
-0.04
0.09
-0.09
0.09
0.08
0.09
0.10
0.10
0.10
0.10
2.10
0.66
-0.39
0.99
-0.99
0.98
0.035
0.508
0.694
0.324
0.324
0.328
0.01
-0.11
-0.23
-0.09
-0.28
-0.09
0.33
0.22
0.16
0.28
0.09
0.28
RISK PROPENSITY ←
Extraversion
Agreeableness
Conscientiousness
Emotional Stability
Openness to exp.
0.01
0.09
-0.10
0.34
0.14
0.10
0.11
0.11
0.11
0.11
0.07
0.80
-0.92
3.19
1.31
0.943
0.421
0.358
0.001
0.192
-0.18
-0.13
-0.31
0.13
-0.07
0.19
0.31
0.11
0.55
0.36
As indicated in Table 9, none of the Big Five personality traits was found to affect
entrepreneurial intention directly. However, we have found significant indirect effect of
emotional stability on gambling risk perception (significant at 0.10 level). Therefore, H8 was
partly substantiated. As such, risk propensity mediated the positive effects on entrepreneurial
intentions (Beta = 0.05, p=0.095).
Table 9. Test of indirect effects on entrepreneurial intention
Total Effect Direct Effect Indirect Effect
Beta P values Beta P values Beta P values
Extraversion
Agreeableness
Conscientiousness
Emotional Stability
Openness to exp.
0.03
-0.03
0.10
-0.04
0.15
0.75
0.77
0.29
0.65
0.11
0.02
-0.04
0.11
-0.09
0.13
0.76
0.65
0.21
0.33
0.17
0.00
0.02
-0.01
0.05
0.02
0.90
0.40
0.36
0.10
0.24
Assessment of overall models fit is provided in Table 10. Both models have good fits.
Table 10. Assessment of Overall Model Fit
Assessment of Overall Model Fit Model
1 Comment Model 2 Comment
Root Mean Square Error of Approximation
(RMSEA) 0.040 < 0.05 good fit 0.042 < 0.05 good fit
Comparative fit index (CFI) 0.967 >.95 good fit 0.973 >.95 good fit
Tucker-Lewis index (TLI) 0.954 >.95 good fit 0.964 >.95 good fit
Standardized root mean squared residual
(SRMR) 0.041 <.05 acceptable fit 0.037 <.05 acceptable fit
260
5. Discussions and Conclusions
This study examined the relationships between (a) personality traits, risk propensity and
gambling risk perception and (b) personality traits, risk propensity and entrepreneurial intentions.
By using structural equation modeling, we also examined whether risk propensity has a
mediating role on the relationship between (a) personality traits and gambling risk perception and
(b) personality traits and entrepreneurial intentions. Our ultimate goal was to test whether same
personality traits are associated with gambling risk perception and entrepreneurial intentions.
As expected, risk propensity is negatively associated with risk perception in gambling.
Individuals with higher risk propensity should perceive gambling as more attractive; therefore
reducing gambling risk perception. Previous pieces of research identified risk propensity as a
critical explaining factor, but the results are not consistent across studies (see Wang et al., 2016,
pp. 1296). The negative result from our study confirms that students that are more willing to take
a risk (i.e. higher level of risk propensity) focus on gains rather than on losses which eventually
leads to a reduction in gambling risk perception scores.
Openness to experience is negatively related to gambling risk perception, while no other
personality traits were found to be related to perception of this risk type. Similar to our previous
discussion regarding the relationship between risk propensity and gambling risk perception,
openness to experience decreases gambling risk perception. Higher openness to experience
reflects an individual’s unpredictability or lack of focus, therefore leading to more risky
behaviour and consequently lower perception of gambling risk behaviour. When it comes to risk
propensity, we found that only emotional stability is positively related to it; not negatively as
expected from Wang et al. (2016). A possible explanation of the results might be that emotionally
stable persons have more rational approaches to risk management, allowing them to increase their
risk propensities. Another possible explanation might be that risk preferences are not consistent
across three decision domains: work, health, and personal finance. The findings of Soane &
Chmiel (2005) show that “greater inconsistency of risk preferences across domains for the
inconsistent group was predicted by high scores in neuroticism, openness, and conscientiousness,
low scores in agreeableness, and by inconsistent risk perceptions and a tendency to consider
payoffs and costs.” (p.1787). Other personality traits are not found to be significantly related to
risk propensity. As noted earlier, a possible explanation might be that that risk propensity is a
compound personality trait reflecting a specific combination of scores on all five dimensions of
personality (e.g., Nicholson et al., 2005). In addition to this, our results do not confirm that the
risk propensity has a mediating role on the relationship between personality traits and risk
perception in gambling. Our results might suggest that risk propensity and openness to
experience reduce gambling risk perception because: (a) risk propensity captures most important
explanatory variable that can lead to changes in risk perception in gambling; (b) however,
individuals should also be ready to accept new experiences in order to engage into more risky
behaviours.
Risk propensity is positively associated with entrepreneurial intentions. Higher risk
propensity increases individual entrepreneurial intention. None of the Big Five personality traits
was found to affect entrepreneurial intention directly. Similar to results from the first model,
emotional stability is positively related to risk propensity. However, we found significant indirect
effect of emotional stability on entrepreneurial intentions (significant at 0.10 level). As such, risk
propensity mediated the positive effects on entrepreneurial intentions of emotional stability. As
noted earlier, a possible explanation is that emotionally stable persons have more rational
261
approaches to risk management, allowing them to increase their risk propensities and
consequently entrepreneurial intentions. However, these results should be interpreted with
caution.
When we compare two models, following conclusions can be drawn: (a) risk propensity
has significant effect on both gambling risk perception and entrepreneurial intentions; (b)
openness to experience has direct effect on risk perception in gambling, while no personality
traits affect entrepreneurial intention directly; (c) emotional stability is important predictor of risk
propensity in both models; (d) the indirect effects of emotional stability on entrepreneurial
intentions through risk propensity were significant, i.e. risk propensity mediated the positive
effects on entrepreneurial intentions of emotional stability.
Policymakers could use these results in the following ways: (a) creating more supportive
environment where students can increase their risk propensity, which consequently should
increase the intention to start a business, and (b) providing appropriate entrepreneurial education
that will increase self-confidence, allowing students to increase scores on their emotional stability
traits.
References
Ajzen, I. 1991. The theory of planned behavior. Organizational behavior and human decision
processes, 50(2), 179-211.
Ajzen, I., & Fishbein, M. 1980. Understanding attitudes and predicting social behavior.
Englewood Cliffs, NJ: Prentice Hall.
Barreto, H., 1989. The entrepreneur in microeconomic theory: Disappearance and explanation.
London and New York: Routledge.
Blais, A. R., & Weber, E. U. 2006. A domain-specific risk-taking (DOSPERT) scale for adult
populations.
Boermans, M. A., & Willebrands, D. 2017. Entrepreneurship, risk perception and firm
performance. International Journal of Entrepreneurship and Small Business, 31(4), 557-569.
Brockhaus Sr, R. H. 1980. Risk taking propensity of entrepreneurs. Academy of management
Journal, 23(3), 509-520.
Byrne, K. 2005. How do consumers evaluate risk in financial products?. Journal of Financial
Services Marketing, 10(1), 21-36.
Chen, Y. Q., Zhang, S. J., Liu, L. S., & Hu, J. 2015. Risk perception and propensity in bid/no-bid
decision-making of construction projects. Engineering, Construction and Architectural
Management, 22(1), 2-20.
Cui, Y., Sun, C., Xiao, H., & Zhao, C. 2016. How to become an excellent entrepreneur: The
moderating effect of risk propensity on alertness to business ideas and entrepreneurial
capabilities. Technological Forecasting and Social Change, 112, 171-177.
Cunningham, J. B., & Lischeron, J. 1991. Defining entrepreneurship. Journal of small business
management, 29(1), 45-61.
Fishbein, M., & Ajzen, I. 1975. Belief, attitude, intention, and behavior: An introduction to
theory and research. Reading, MA: Addison-Wesley.
Frese, M. 2009. Towards a psychology of entrepreneurship—an action theory perspective.
Foundations and Trends® in Entrepreneurship, 5(6), 437-496.
Gosling, S. D., Rentfrow, P. J., & Swann Jr, W. B. 2003. A very brief measure of the Big-Five
personality domains. Journal of Research in personality, 37(6), 504-528.

262
Harris, C. R., Jenkins, M., & Glaser, D. 2006. Gender Differences in Risk Assessment: Why do
Women Take Fewer Risks than Men? Judgment and Decision Making, 1(1), 48-63.
Hult, G. T. M., Ketchen Jr, D. J., & Slater, S. F. 2005. Market orientation and performance: an
integration of disparate approaches. Strategic management journal, 26(12), 1173-1181.
Hung, K. T., Tangpong, C., Li, J., & Li, Y. 2012. Robustness of general risk propensity scale in
cross-cultural settings. Journal of Managerial Issues, 78-96.
Jackson, D. N. 1994. Jackson Personality Inventory test manual. Goshen, NY: Research
Psychologists Press.
Jackson, D.N., Hourany, L., Vidmar, N.J., 1972. A four-dimensional interpretation of risk taking.
Journal of Personality 40 (3), 483-501.
Kautonen, T., Van Gelderen, M., & Tornikoski, E. T. 2013. Predicting entrepreneurial behaviour:
a test of the theory of planned behaviour. Applied Economics, 45(6), 697-707.
Keil, M., Wallace, L., Turk, D., Dixon-Randall, G., & Nulden, U. 2000. An investigation of risk
perception and risk propensity on the decision to continue a software development project.
Journal of Systems and Software, 53(2), 145-157.
Keinan, G., Meir, E., Gome-Nemirovsky, T., 1984. Measurement of risk takers' personality.
Psychological Reports 55 (1), 163-167.
Kolvereid, L., & Isaksen, E. 2006. New business start-up and subsequent entry into self-
employment. Journal of Business Venturing, 21(6), 866-885.
Kogan, N., & Wallach, M. A. 1964. Risk taking. Holt, Rinehart & Winston.
Krueger, N. F. (2005). Sustainable entrepreneurship: Broadening the definition of “opportunity”.
SSRN Accepted Paper Series, 7: Entrepreneurship in a Diverse World.
Lion, R., Meertens, R. M., & Bot, I. 2002. Priorities in information desire about unknown risks.
Risk Analysis: AN INTERNATIONAL JOURNAL, 22(4), 765-776.
Liñán, F. & Chen Y.W. 2009. ‘Development and cross- cultural application of a specific
instrument to measure entrepreneurial intentions’, Entrepreneurship Theory and Practice,
33(3), 593–617.
Lee, C.K., Lee, Y.K. and Wicks, B.E. 2004. Segmentation of festival motivation by nationality
and satisfaction”, Tourism Management, Vol. 25 No. 1, pp. 61–70.
MacCrimmon, K.R., Wehrung, D.A., 1985. A portfolio of risk measures. Theory and Decision 19
(1), 1-29.
March, J. G., & Shapira, Z. 1987. Managerial perspectives on risk and risk taking. Management
science, 33(11), 1404-1418.
Meertens, R. M., & Lion, R. 2008. Measuring an Individual's Tendency to Take Risks: The Risk
Propensity Scale 1. Journal of Applied Social Psychology, 38(6), 1506-1520.
Miner, J. B., & Raju, N. S. 2004. Risk propensity differences between managers and
entrepreneurs and between low-and high-growth entrepreneurs: A reply in a more
conservative vein.
Nicholson, N., Soane, E., Fenton‐O'Creevy, M., & Willman, P. (2005). Personality and
domain‐specific risk taking. Journal of Risk Research, 8(2), 157-176.
Paunonen, S. V., & Jackson, D. N. 1996. The Jackson Personality Inventory and the five-factor
model of personality. Journal of Research in Personality, 30(1), 42-59.
Rauch, A., & Frese, M. 2007. Let's put the person back into entrepreneurship research: A meta-
analysis on the relationship between business owners' personality traits, business creation,
and success. European Journal of work and organizational psychology, 16(4), 353-385.

263
Schneider, S. L., & Lopes, L. L. 1986. Reflection in preferences under risk: Who and when may
suggest why. Journal of Experimental Psychology: Human perception and performance,
12(4), 535.
Soane, E., & Chmiel, N. 2005. Are risk preferences consistent?: The influence of decision
domain and personality. Personality and Individual Differences, 38(8), 1781-1791.
Sitkin, S. B., & Pablo, A. L. 1992. Reconceptualizing the determinants of risk behavior.
Academy of management review, 17(1), 9-38.
Sitkin, S. B., & Weingart, L. R. 1995. Determinants of risky decision-making behavior: A test of
the mediating role of risk perceptions and propensity. Academy of management Journal,
38(6), 1573-1592.
Sjöberg, L., Moen, B. E., & Rundmo, T. 2004. Explaining risk perception. An evaluation of the
psychometric paradigm in risk perception research, 10(2), 665-612.
Stein, J. 2013. Millennials: The Me Me Me Generation. The Time Magazine.
http://time.com/247/millennials-the-me-me-me-generation/ [accessed: 03/09/2018]
Vlek, C., & Stallen, P. J. 1980. Rational and personal aspects of risk. Acta psychologica, 45(1-3),
273-300.
Wang, C. M., Xu, B. B., Zhang, S. J., & Chen, Y. Q. 2016. Influence of personality and risk
propensity on risk perception of Chinese construction project managers. International
Journal of Project Management, 34(7), 1294-1304.
Wang, W., Zhao, J., Zhang, W., & Wang, Y. 2015. Conceptual framework for risk propensity,
risk perception, and risk behaviour of construction project managers. in Thirty-first annual
conference 2015 September 7-9 (p. 165).
Weber, E. U., Blais, A. R., & Betz, N. E. 2002. A domain‐specific risk‐attitude scale: Measuring
risk perceptions and risk behaviors. Journal of behavioral decision making, 15(4), 263-290.
Zhao, H., Seibert, S. & Lumpkin, G.T. 2010. The Relationship of Personality to Entrepreneurial
Intentions and Performance: A Meta-Analytic Review. Journal of Management, Vol. 36 No.
2, March 2010 381-404 DOI: 10.1177/0149206309335187

264
Appendix 1
Table 11a. Assessment of discriminant validity (Model 1)
Latent construct Risk perception (gambling) (AVE = 0.50)
Risk propensity (AVE=0.43) 0.07*
Table 11b. Assessment of discriminant validity (Model 2)
Latent construct Entrepreneurial intention (AVE = 0.69)
Risk propensity (AVE=0.43) 0.03*
* Squared correlations among latent constructs
Note: when AVE values > squared correlations among latent variables values there is no problem
with discriminant validity
Table 12. Correlation between variables
GPR* EI* RP* EX AG CO ST OP
GRP* Correlation 1.00
Sig.
EI* Correlation 0.05 1.00
Sig. 0.65
RP* Correlation -0.18 0.15 1.00
Sig. 0.00 0.02
EX Correlation -0.15 0.09 0.06 1.00
Sig. 0.02 0.15 0.36
AG Correlation -0.21 -0.01 0.19 -0.07 1.00
Sig. 0.00 0.93 0.00 0.28
CO Correlation -0.21 0.12 0.09 0.27 0.22 1.00
Sig. 0.00 0.07 0.18 0.00 0.00
ST Correlation -0.28 0.08 0.30 0.15 0.45 0.43 1.00
Sig. 0.00 0.24 0.00 0.02 0.00 0.00
OP Correlation -0.27 0.13 0.18 0.31 0.30 0.47 0.33 1.00
Sig. 0.00 0.04 0.00 0.00 0.00 0.00 0.00
* Average value of items representing a construct
Variable labels:
RP – risk propensity, GRP – Gambling risk perceptions, EI – Entrepreneurial intention, EX –
Extraversion, AG – Agreeableness, CO – Conscientiousness, ST – Emotional Stability, OP –
Openness to exp.
265
INFORMAL ECONOMY IN BOSNIA AND HERZEGOVINA – AN
EMPIRICAL INVESTIGATION USING MIMIC APPROACH
Edin Pasovic
School of Economics and Business, MA student
Trg oslobodjenja - Alija Izetbegovic 1
Adnan Efendic
School of Economics and Business, Associate Professor of Economics
Trg oslobodjenja - Alija Izetbegovic 1
Abstract:
This is the first study to explore the size of informal economy in Bosnia and Herzegovina (BiH)
over the period 1997-2016. We rely on an empirical investigation based on the well-established
MIMIC (Multiple Input Multiple Causes) methodology. As the underlying factors of informal
economy in BiH we use tax burden, the level of unemployment, the agricultural sector and
government subsidies. As such, the model specification is based on the existing literature which
is tailored to the conditions of the BiH economy. The empirical analysis investigates the link
between the selected macroeconomic indicators and the informal economy, confirming the
importance of these indicators for the incidence of informal economy. We estimate that the
informal economy in BiH for the period 1998-2016 was, on average, 34% of GDP, being the
largest in 1998 (43%) and the smallest in 2009 and 2016 (30%). Overall, there is a slightly
decreasing trend of the size of informal economy, while the model has captured structural brakes
linked to the introduction of value added tax (decrease) and the latest global economic crisis (an
increase) in BiH.
Keywords: informal economy, tax burden, unemployment, MIMIC, Bosnia and Herzegovina
JEL classification: O17.
Introduction
Informal economy13
is most often viewed as a part of the economy that should be formalized.
However, the question is whether it is better to conduct business activities in the informal
economy or to completely abandon it? Participants in the informal economy are often in a
situation of choice between these two options, although many formal businesses are also
sometimes partly informal (De Soto, 2001).
Bearing in mind that the general impact of the informal economy does not necessarily have to be
negative, informal economy needs to be approached with appropriate strategies, with the goal of
minimizing the negative effects on the positive side of the informal economy, such as increasing
money in circulation or reducing total unemployment.
13
In the literature, it is possible to identify number of other words used to define what we call here informal
economy. This include terms as grey economy, informal economy, undeclared economy, unobserved economy and
similar. To avoid any inconsistency in the text, we will refer always to informal economy.
266
The informal economy is an active component of the majority, if not all the world's economies,
although the size varies considerably among different countries. Informal activities should be
included in national statistics as much as possible. However, it is crucial to understand the
economic theory that describes the emergence of informal economy together with the factors that
increase informal activity (Fleming, Roman, & Farrell, 2000).
Having in mind that informal activities do not participate in the official national statistics, the
question arises as to whether these statistics accurately represent the true state of the state's
economy? Given that national statistics are used as underpinning of economic policies, inaccurate
figures can lead to inappropriate policies and development strategies. Also, the emergence and
growth of the informal economy can indicate that current policies, such as taxation and
regulatory, are poorly targeted, and lead to the reduction of potential state revenues (Fleming,
Roman, & Farrell, 2000).
It is important to note that this paper does not observe transactions within illegal activities such as
stolen goods, narcotics, prostitution or theft, but will focus on activities that should be included in
the official GDP but are not part of it due to the fact that these legal activities are not declared to
the official authorities. However, this study provides contribution to the existing literature by
offering an estimate of informal economy for BiH based on a rigorous empirical MIMIC
methodology and the most recent data.
This paper is structured as follows. In section 2, we provide a typical literature review of
theoretical and empirical literature. Section 3 includes an explanation of the MIMIC model
approach that we use in this study. Section 4 contains the empirical analysis which provides us
with outputs on the size of informal economy in Bosnia and Herzegovina. Section 5 discusses the
main finding, while concluding remarks are part of section 6.
Literature Review
Theoretical background as well as empirical analysis of the informal economy phenomenon is
examined in number of papers by prominent authors of this field, including primarily Feige
(1989), Williams (2006), Feige, (1989), Wiliams, (2006), Giles & Tedds, (2002), Schneider
(2000), Schneider & Buehn, (2013), Williams & Schneider, (2016), Tanzi, (1999). The papers are
useful for our investigation as they demonstrate the importance of particular determinants of
informal economy and provide comparison of measurement methods. A discussion of these
studies is reported in this section.
There are numerous definitions of the informal economy. The most frequently used definition in
the key economic literature describes the informal economy as all currently unregistered
economic activities that contribute to the officially calculated or observed gross domestic product
(Feige, 1989; Schneider, 1994; Breusch, 2005).
Webb, Tihanyi, Ireland, & Sirmon (2009) elaborate that informal economy exists because of the
discrepancy between what is defined as legitimate by formal and informal institutions. A gap
between formal and informal institutions is evident in the transition countries that work to
establish the rule of law and at the same time are struggling with the inheritance of former
systems and imposed norms and regulations. Institutions influence economic performance
(Efendic & Pugh, 2015), especially in cases where formal and informal institutions come into
conflict, which leads to participation in activities within the informal economy. Participants in the
informal economy estimate that the benefit of engaging in these activities is greater than
participation in the official economy.
267
Informal economy can also be described as a tendency of people and legal entities to conduct
business activities, without the intervention of the state (Tanzi, 1999). Eilat & Zinnes (2002) view
the informal economy as a separate phenomenon, instead of the usual approach that treats these
activities as a symptom of failed policies. They study the effects in the short term, while
assessing the obstacles to sustainable development, focusing on transition countries. In their
work, they bring that a high level of unemployment may result in an increase of activities in the
informal sector.
Although it is more common in transition and undeveloped countries, the informal economy is
not a specific problem solely for these areas, it is also a burden even for the most developed
economies of the world. The transition process brings systematic transformations, and the
increase in informal activities is inevitable. Adequate institutional and regulatory activities can
affect the informal economy, with the timely and effective prioritization of targeted reform
sectors, since it is not a one-dimensional problem (Schneider, 2010).
The informal economy affects companies that carry out business activity within the official
economy, which may lead to competitive advantages in favour of those enterprises within the
informal economy, given the avoidance of legal obligations and non-payment of taxes, although
they can take a significant market share (Williams & Schneider, 2016).
Activities of the informal sector cause inefficient functioning of the market and labour,
decreasing the total revenues of the state, and encouraging corruption while reducing trust in
institutions. Also, there is a question of efficiency from the microeconomic point of view, which
is reflected in a poor allocation of resources and ultimately causes an apparent decrease in gross
domestic product, since it is an unregistered activity (Eilat & Zinnes, 2002).The discouraging
aspect of engagement in the informal economy includes the lack of access to public goods. The
primary problem is the lack of support for the legal system, since transactions are out-of-state
control. If business activities are performed in the informal sector, participants lose the right of
social protection (Eilat & Zinnes, 2002).
Also, the informal economy exposes citizens to the risk of violation of rights, lack of access to
the health care system, lower pensions in the future and reduction of funds for public goods
(Golias, 2013).
However, two-thirds of the income from the informal economy are spent in the official economy,
which shows that it is needed to cautiously approach this phenomenon (Schneider & Enste,
2002). Also, it is possible for the informal economy to alleviate the effects of unemployment and
increase economic activity.
After examining the empirical literature focused on BiH, we find a limited number of studies
which incorporate this country in their focus, and in particular, we found no studies that followed
dynamics of informal economy in this country. One of important study in this literature is by
Schneider, Buehn and Montenegro (2010), based on MIMIC approach and panel data. This study
with estimates the informal economy for 162 countries, including BiH, for the period from 1999
to 2006/2007 The average value of the informal economy in BiH at the level of 33% of GDP for
the observed period is estimated. However, there is no any discussion about this phenomenon in
BiH, while the data does not capture more then one decade of economic performance of this
country.
One of the frequent references that we find in the BiH literature is a research by Tomas (2010) in
which the author provides an assessment of the informal economy in BiH using the indirect
method. The author uses several factors in the analysis (for example, labour supply, tax evasion)
to provide his estimate of the size of the informal economy in BiH for 2008.

268
Nastav and Bojnec (2007) investigates the performance of labour force in BiH, Croatia and
Slovenia, based on which they provide their estimate of the informal economy. The levels of
informal activity differ significantly in these countries, despite the fact that there are indications
of a common trend over the long run. The authors estimate the size of the informal economy to be
around 30% of official GDP for the period 1999-2001, attributing this to the lower level of
economic development, high unemployment rates and destructive warfare (Nastav & Bojnec,
2007).
Krstic and Sanfey (2006) investigate the informal employment in BiH, using a panel data, and
find a significant labour market mobility in BiH, which goes hand-in-hand with the growth of the
informal sector. They also link poverty and lower income with people in the informal sector,
which is additionally caused by a lower level of life satisfaction (Krstic & Sanfey, 2006). In
another study, Krstic and Schneider (2015) combine a series of works dealing with tax evasion,
labour market distortion, resource shortages, and the causes and measures of the informal
economy on the example of Serbia. This study offers a contribution to the measures of reducing
the informal economy, as well as the effects of the growth of the official economy in the case of
Serbia.
Klaric (2010) investigates the size of informal economy in Croatia by using MIMIC methodology
for his estimation. The author author makes estimates of the non-observed economy in Croatia
for the period 1998-2009. What he finds is that the informal economy is growing during times of
crisis and increases its share in the formal economy. This finding should be important to be
checked for the BiH sample as well.
Buehn & Schneider (2008) also rely on the MIMIC model, emphasizing the relationship of
cointegration and error correction, through the example and application of the model when it is
used to estimate the informal economy in France. In this paper, they demonstrate the analysis in
the short and long-term, and they conclude that the results of this macroeconomic model could be
used to support policy makers and economic strategies.
Zagorsek, Jaklic, & Hribernik (2009) provides the analysis of informal activities in Slovenia by
presenting historical and social institutions that, in their opinion, are closely related to the
development and functioning of the informal economy. The authors find that the informal
economy is an obstacle to economic development and future progress in a situation when the
economy moves towards investment activities and growth. The results of the study show the
effects of the informal economy on the economic activity, such as orientation towards low added
value and the development of unfair competition in entrepreneurship.
Eilat & Zinnes (2002) investigates informal economy in Poland and Ukraine in the early 1990s
and estimate how informal activities are useful in the short term for those who participate in
them. They argue that informal economic activities serve as a temporary leverage of productive
work in environments with high levels of corruption and bureaucracy, although the implications
of the informal economy for long-term recovery have not been properly clarified.
Zaman & Goschin (2015) have examined the informal economy and economic growth in
Romania, based on the advantages and disadvantages of the informal economy for the economy
and society in general. They main conclusion is that in the long run there is a consistent link
between the informal economy and economic growth in Romania.
Dell'Anno (2007) estimates the size of the informal economy of Portugal from 1977 to 2004 and
tests the statistical link between the informal economy and macroeconomic variables using the
MIMIC model. This study recommends the reduction of the informal economy through the
reform of the social protection system, increase in the efficiency of the public sector with the
increase in economic freedom and the reform of tax regulation for the self-employed.
269
Mai & Schneider (2016) model the informal economy of Egypt using two different research
methods. In addition to the MIMIC model, they also use the currency demand approach, and
conclude that the informal economy takes a significant share in the official economy, but at the
same time point to a downward trend. In this paper, variables specific to Egypt's economy are
used, such as the importance and size of the agricultural sector and the quality of institutions.
To conclude, there is number of studies which offer estimates of the informal economy, but very
limited which focused in BiH. While majority of studies are based on MIMIC indirect
methodology of estimation, this approach has not been utilized for BiH, apart Schneider, Buehn
& Montenegro, (2010), but with the data more than a decade ago. Our intention is to fulfil the gap
in the existing literature focused on BiH and provide estimates of the informal economy that take
into account the latest economic performance, including the potential effect of the economic
crisis that recently ended.
Methods for Estimating the Informal Economy
There are two main methods of estimation of the informal economy in use, direct and indirect
methods. We discuss shortly the key features, advantages and disadvantages of this
methodologies.
Direct Methods
The direct methods of estimates are based mostly on qualitative interviews implemented on the
ground. These interviews are mostly based on a methodology that structures the examination in
three distinct areas. The first part of the questionnaire serves to examine the perception of the
respondents about the informal economy. The second part highlights activities within the
informal economy which are carried out by respondents, while the final part is based on social
and economic factors. When creating a questionnaire, it is important to define the research
problem, and clearly separate and refer the respondents to the theoretical setting and activities
that fall within the domain of the informal economy (Wiliams, 2006).
Another direct approach that we can meet in the literature is based on the official fiscal audits.
These methods are particularly effective when it comes to keeping the track of differences
between reported tax revenues and actual income, where the amount of undeclared income that is
subject to taxation and the size of the informal economy is brought into direct relation (Feige,
1989).
Overall, the advantages of direct methods is a detailed and in-depth report on monetary activities,
structure and socioeconomic characteristics, methods and motivation of people involved in the
unofficial economy. It is especially useful to use these methods when preparing policies and
strategies that can contribute to improving social well-being. However, direct approaches are
difficult to apply at the international level, given the specifics of particular areas in particular
countries and the need for standardized interviews that will enable the results comparable.
Indirect Methods
Indirect approaches are based on some indirect indicators that are investigated to provide
estimates of informal economy. This approach depends on the definition of research focus itself,
since the formation of the model depends on the variables and indicators used to obtain the
results of the informal economy distribution. One of these methods look at the difference between
270
the state consumption and the official income statistics. This approach simply investigates the
difference between government revenue and consumption, which is a simple model that is used to
provide approximation of informal economy. The larger is the difference, the grater is the level of
informal economy. This method provided the basis for development of ISTAT (Italian National
Institute of Statistics) / Eurostat model for an unregistered economy. The approach deals with the
division of the unofficial economy into "underground" production, informal production, illicit
production and production for its own use (Smith, 1994).
Another similar approach is to investigate the difference between the official and the actual
employment in the labour force. A decline in the labour force participation of the official
economy may indicate increased activity within the informal economy, assuming that the total
number of working-age people is constant. The lack of this method is reflected in the fact that
there are other reasons for the termination of work, and the fact that work within the official
economy does not necessarily mean that a person does not participate in an unofficial economy.
Apparently, these estimates should not be taken as precise indicators of the size and development
of the informal economy, given their one-dimensional approach (Smith, 1994; Schneider &
Buehn, 2016).
A transaction indirect approach is developed by Feige (1989). It is based on an assumption of a
persistent and stable link between the volume of transactions and the official GDP. The model
requires a calculation based on the deduction of the official GDP from the nominal GDP, using a
base year for which the assumption of a non-existence of a informal economy is valid. It is
difficult to estimate transactions carried out in cash, especially to separate legal from illegal
transactions, and this model uses a wider definition of a informal economy that includes illegal
activities. This is one of disadvantages of this indirect methodology.
Cagan (1958) has developed a currency demand approach as another indirect methodology of
informal economy estimation. This approach examines the correlation between demand for
currency and tax pressure, and it is firstly applied on the United States of America (USA) data. It
was further enhanced by Tanzi (1982), who adjusted this approach to investigate the USA
informal economy. The basic assumption of the model is based on transactions in cash, which
ultimately means that the increase in the informal economy will increase the demand for money.
In its model, author controls variables that have a direct impact on the demand for money, such as
income increases, payment habits and interest rates. It also sets the foundations for the theoretical
layout of the causes of labour in the informal economy, such as tax burden, government
regulations, institutions and tax morality.
The main disadvantages of the money demand model are reflected in the fact that money is not
paid for all activities within the informal economy. Also, surveys in countries that use a currency
that has substantial reserves outside the state cause data inconsistencies, given the exposure to
external influences.
Method of electricity consumption is also an indirect method used to estimate informal economy.
This approach uses consumption of electricity as a factor that can be directly observed, and which
can indicate the volume of the total economic activities. The growth of electricity consumption
serves as an indicator of the growth of the aggregate official and unofficial economy. Using the
estimation of overall economy (official and unofficial) as a proxy and subtracting the value of the
statistically reported GDP, Kaufmann and Kaliberda (1996) come to the estimation of unofficial
GDP. This method is easier to use, but it encounters criticisms like those that for some informal
activities it is not necessary to use electricity. In addition, this model does not take into account
other energy sources which are important for functioning of one economy. Also, technological

271
progress increases energy efficiency, which brings up a question if it is possible to analyse the
informal economy by this method in the long run.
Finally, a widely used indirect method of estimation of informal economy is MIMIC (Multiple
Inputs Multiple Causes) model. The MIMIC model constructs informal economy as a latent
variable, which means that it cannot be precisely observed or measured. Accordingly, other
variables that are observed in the model serve to explain the existence of the informal economy,
i.e. they indirectly become a measure of the extent of the latent variable, i.e. informal economy
proxy.
MIMIC belongs to a group of linear independent structural models (LISREL) and is modelling by
using structural equations (SEMs). Theoretical conditions were set by Joreskog and Gooldberger
(1975).
The MIMIC model was first applied to measure the informal economy in the work of Frey &
Hannelore (1984). It was used to assess the relative size and development of the underground
economy over time in OECD sample of countries, where taxation, regulation and moral duty of
taxation were used as statistically relevant determinants. As we have already pointed out, the
MIMIC model examines the relationship between a latent variable that is used as an
approximation of the "extent of the informal economy" and the relevant observed variables.
The statistical methodology is based on comparing the covariance matrix of the observed
variables with the parametric structure imposed by a hypothesized model based on a strong
theoretical confirmation, which leads to the conclusion that the MIMIC model is a confirmatory
rather than exploratory research technique (Schneider & Buehn, 2016). The model assumes that
all model factors are correlated, all the observed variables directly affect other factors, and that
the errors within the model are not in correlation (Williams & Schneider, 2016).
The use of the MIMIC methodology involves evaluating a function that represents the connection
between a latent variable as a clarifying variable:
,
and causes as independent variables, for example:
represented with following equation:
Second equation that links the indicators, for example:
, and latent variable , represents measurement model that is
estimated in the following way:
The MIMIC model provides an assessment of relative changes in the size of the informal
economy over time, which means that an additional step is required to express the informal
272
economy through absolute values. The authors most often show the informal economy as a
percentage of GDP, and the procedure is termed "benchmarking" and essentially defines the
reference value of the informal economy using the index obtained by the MIMIC model. This is
the main shortcoming of the methodology, as this step is needed to express the relative values in
absolute form (Schneider & Williams, 2013).
Adapting this model for use implies the need to rely on the informal economy estimates, which is
derived by another model or authors, which potentially multiplies the probability of calculation
errors. In addition, the most frequent criticisms of the MIMIC model refer to the latent variable
itself, since it is difficult to delineate potential legal and illegal activities within the model, and it
is impossible to exclude completely obscure variables from illegal activities that do not enter the
informal economy.
Helberger and Knepel (1988) argue that Structural Equation Models (SEM) models cause
unstable coefficients when changing the size of the sample used. Dell'Anno (2007) also argues
that instability is reduced by increasing sample size, but the problem is evident in areas with
limited access to the data.
The choice of the normalized index between 1 / -1 in front of the GDP variable, to which
theoretically informal economy can influence positively or negatively depending on the
specificity of individual economies, directly determines the sign of structural parameters of
causative variables, which leads to the potential subjective adaptation of the effects of certain
causes of informal economy, in order to adapt it to the theoretical setting. Thus, coefficients of
the influence of the cause of the informal economy have an expected sign because they might be
forcibly adapted and not based on the theoretical setting (Feige, 2016). This is also convincing
crisis which shed lights on the weaknesses of this empirical approach as well.
It is prevailing practice among researchers to use indirect methods for measuring the size of the
informal economy and direct methods to identify the characteristics of this phenomenon
(Williams & Schneider, 2016; Eurofound, 2013).
The previous discussion implies that there is no the best methodology for estimation of informal
economy, as any approach has some advantages and disadvantages. Still, our literature review
establishes that MIMIC methodology was widely used method of estimation, having credibility
among researchers, and giving possibility for a longer-time span observation, which all lead us to
rely on this approach in estimating the informal economy in Bosnia and Herzegovina. The
empirical analysis follows.
Empirical Analysis
Model specifications
Following the mainstream MIMIC literature (Breusch, 2005; Dell'Anno, 2007; Schneider &
Buehn, 2016), the inputs that we use in our MIMIC analysis includes the real GDP index and
money in circulation. On the causes side, we again follow the relevant literature and include the
data on the size of agricultural production, tax burden, unemployment and government subsidies.
We argue that these indicators are very likely to be important for investigation of the informal
economy in BiH, having in mind that the undeclared work is identified to be the largest in BiH
economy in the agricultural sector (MCPBiH, 2010), the business sector is generally laud in this
country because of the level of taxes and other parafiscal levies they face. Moreover, the
unemployment in this country is extensive and very often ordinary people rely on different
informal strategies in such environments (Efendic, Cveticanin, & Kumalic, 2017), and finally, the
273
level of government subsidies in this country is quite high, which is identified in the literature to
be relevant to take into consideration (Dell'Anno, 2007). The further rationale behind these
variables is presented below.
X1 - Size of the agriculture sector is used based on a fact that it is a sector with many
undeclared informal participants since it is difficult to regulate, and it is generally poorly
controlled (Chen, 2007). For example, there is evidence of significant influence of this sector for
Egypt (Mai & Schneider, 2016) and for countries of the Latin America (Vuletin, 2008).
It is expected that a larger agricultural sector leads to greater scope of the informal economy.
X2 - Tax burden is a most commonly used cause of the informal economy, and it is found
to be relevant by many authors (e.g. Tanzi, 1999; Schneider, 2010; Dell'Anno, 2007). Taxes
affect decision on employment and stimulate labour market in different ways (Mai & Schneider,
2016). Larger the gap between the total cost of labour and net revenues, the stronger is the
incentive to work in the informal economy and to avoid taxes (Loayza, 1996). Tax burden
generally increases costs, which makes relevant products more expensive. Actors in developing
countries often avoid taxes to offer more competitive price on the market (Mai & Schneider,
2016).
In recent survey performed as part of INFORM14
project, 60% of respondents found tax
evasion as never justified, with 20% responses that say that the tax evasion is sometimes justified.
These numbers show that tax morality in BiH is lower compared to the EU (European
Commission, 2013), especially when it comes to entrepreneurs who justify tax evasion more than
ordinary citizens.
In the context of BiH, we expect that the higher tax burden stimulates the growth of the
informal economy.
X3 – Unemployment rate link with the informal economy is not clearly established due to
the opposing findings of researchers (Mai & Schneider, 2016). With larger unemployment rate,
more people could potentially seek employment in the informal sector. On the other hand, the
reduction of unemployment may indicate a general slowdown in economic activities and also
reduce activities in both, formal and informal sectors (Klaric, 2010). Labour force has a
heterogeneous structure with part of participants being classified as unemployed and other part as
retired, minors or housewives, categories excluded from official unemployment statistics
(Dell'Anno, 2007). Also, there is possibility that officially employed people participate in the
informal economy (Tanzi, 1999).
However, we link to the conventional thinking and believe that the higher unemployment
rate in BiH will lead to a greater share of informal economy.
X4 – Finally, subsidies may motivate participation in the official economy. However, subsidies
could potentially widen the competition gap if they are ineffectively distributed, which could lead
to discrepancies between the business owners (Dell'Anno, 2007). Following the literature, we
expect for subsidies to increase the informal economy.
Y1 – Real GDP Index is used as a reference variable, that is, as a measure of the informal
economy. The authors of empirical research take on contradictory attitudes about the link
between the official and the informal economy. The question arises whether the reduction in
14
This project has received funding from the European union’s Horizon2020 research and innovation programme
under grant agreement no 693537.
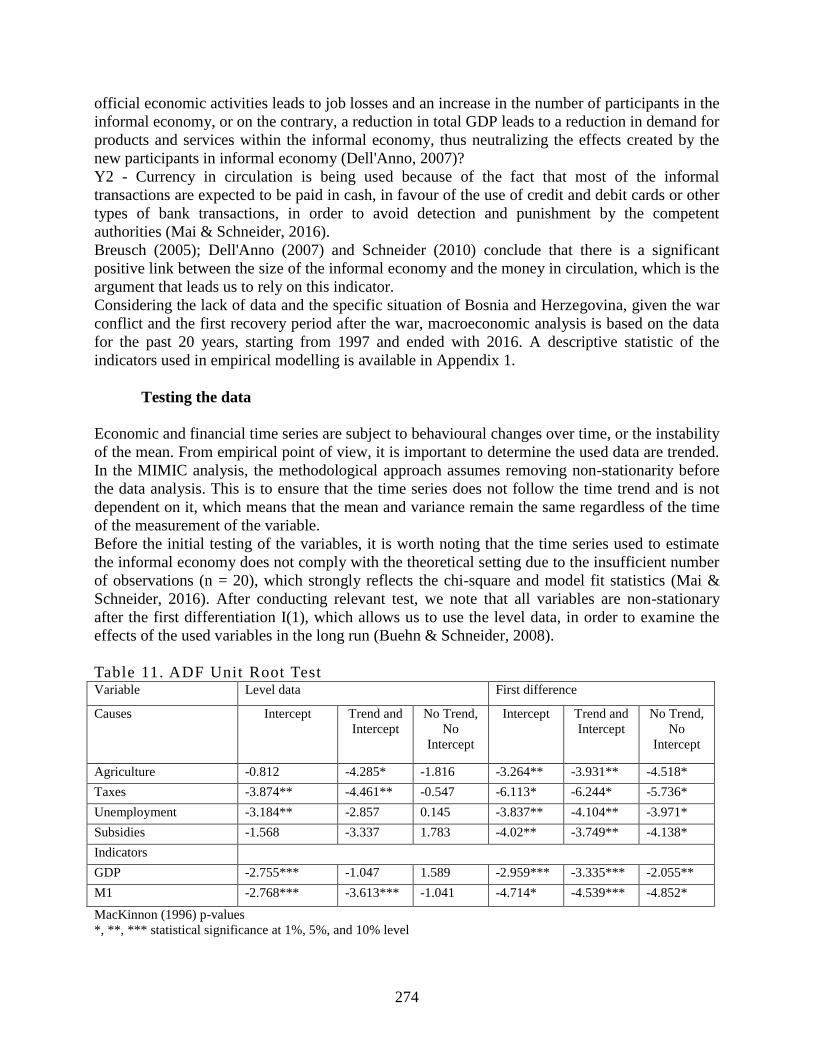
274
official economic activities leads to job losses and an increase in the number of participants in the
informal economy, or on the contrary, a reduction in total GDP leads to a reduction in demand for
products and services within the informal economy, thus neutralizing the effects created by the
new participants in informal economy (Dell'Anno, 2007)?
Y2 - Currency in circulation is being used because of the fact that most of the informal
transactions are expected to be paid in cash, in favour of the use of credit and debit cards or other
types of bank transactions, in order to avoid detection and punishment by the competent
authorities (Mai & Schneider, 2016).
Breusch (2005); Dell'Anno (2007) and Schneider (2010) conclude that there is a significant
positive link between the size of the informal economy and the money in circulation, which is the
argument that leads us to rely on this indicator.
Considering the lack of data and the specific situation of Bosnia and Herzegovina, given the war
conflict and the first recovery period after the war, macroeconomic analysis is based on the data
for the past 20 years, starting from 1997 and ended with 2016. A descriptive statistic of the
indicators used in empirical modelling is available in Appendix 1.
Testing the data
Economic and financial time series are subject to behavioural changes over time, or the instability
of the mean. From empirical point of view, it is important to determine the used data are trended.
In the MIMIC analysis, the methodological approach assumes removing non-stationarity before
the data analysis. This is to ensure that the time series does not follow the time trend and is not
dependent on it, which means that the mean and variance remain the same regardless of the time
of the measurement of the variable.
Before the initial testing of the variables, it is worth noting that the time series used to estimate
the informal economy does not comply with the theoretical setting due to the insufficient number
of observations (n = 20), which strongly reflects the chi-square and model fit statistics (Mai &
Schneider, 2016). After conducting relevant test, we note that all variables are non-stationary
after the first differentiation I(1), which allows us to use the level data, in order to examine the
effects of the used variables in the long run (Buehn & Schneider, 2008).
Table 11. ADF Unit Root Test Variable Level data First difference
Causes Intercept Trend and
Intercept
No Trend,
No
Intercept
Intercept Trend and
Intercept
No Trend,
No
Intercept
Agriculture -0.812 -4.285* -1.816 -3.264** -3.931** -4.518*
Taxes -3.874** -4.461** -0.547 -6.113* -6.244* -5.736*
Unemployment -3.184** -2.857 0.145 -3.837** -4.104** -3.971*
Subsidies -1.568 -3.337 1.783 -4.02** -3.749** -4.138*
Indicators
GDP -2.755*** -1.047 1.589 -2.959*** -3.335*** -2.055**
M1 -2.768*** -3.613*** -1.041 -4.714* -4.539*** -4.852*
MacKinnon (1996) p-values
*, **, *** statistical significance at 1%, 5%, and 10% level

275
The testing of the correlation between the variables is also needed to prove the validity of the
model, avoiding a model that would have coefficients that are not based on the interaction of
variables, but reflect external influences, a non-measurable spurious model. To investigate this
possibility, we use the Engle and Granger's two-step approach to make sure that all four
indicators that we aim to use in the model are correlated with the imposed indicators. In the first
step we perform regression on level data, using the Least Squares method and we get the
coefficients, residuals and statistical data:
Table 12. Engle Granger Cointegration Test
Coefficient GDP M1
Agriculture 0,04 0,37
Taxes 0,03 0,16
Unemployment -0,01 0,17
Subsidies 0,01 0,07
R-squared 0,87 0,71
Durbin-Watson 2,04 1,34
The statistical tests reported in Table 2 show a lower value of R-squared compared to Durbin-
Watson statistics, which is a signal that these are equations with possibility of cointegration. In
order to test cointegration, we perform the ADF test over the residuals u1 (-3.2) and u2 (-2.07)
and reject the null hypothesis (which is, say in the brackets) at a conventional level (5% level).
Thus, we conclude that the causes of the informal economy are cointegrated with both indicators
that we use, i.e. GDP and money circulation.
Estimating the model parameters
The MIMIC approach assumes a normal distribution of errors, limiting the model error
parameters, by restraining the mean to a value of 0 and standard deviation to a constant, while
retaining the conditions of uncorrelated error terms (Dell'Anno & Schneider, 2009). As stated in
the model explanation, it is necessary to specify one of the indicators to a value different from
zero. Given that the GDP sign can be positive and negative (+/- 1) depending on the impact, we
decide to limit the value of +1, so that we can monitor the movement of the informal economy
index and express it through the ratio of GDP. The approach to limiting the parameter in front of
one of the indicators is typically used in the MIMIC literature (e.g. Giles & Tedds, 2002).
For regression and calculation of the MIMIC coefficients, we use Maximum likelihood (MLE)
estimation, a method that determines the values of model parameters, but we also use the option
to calculate parameters for a time series with incomplete data. This is because the tax burden and
subsidies are variables with a few missing data not available from official sources. The values of
the parameters obtained by this method maximize the probability that the process described by
the model creates the data that is observed.
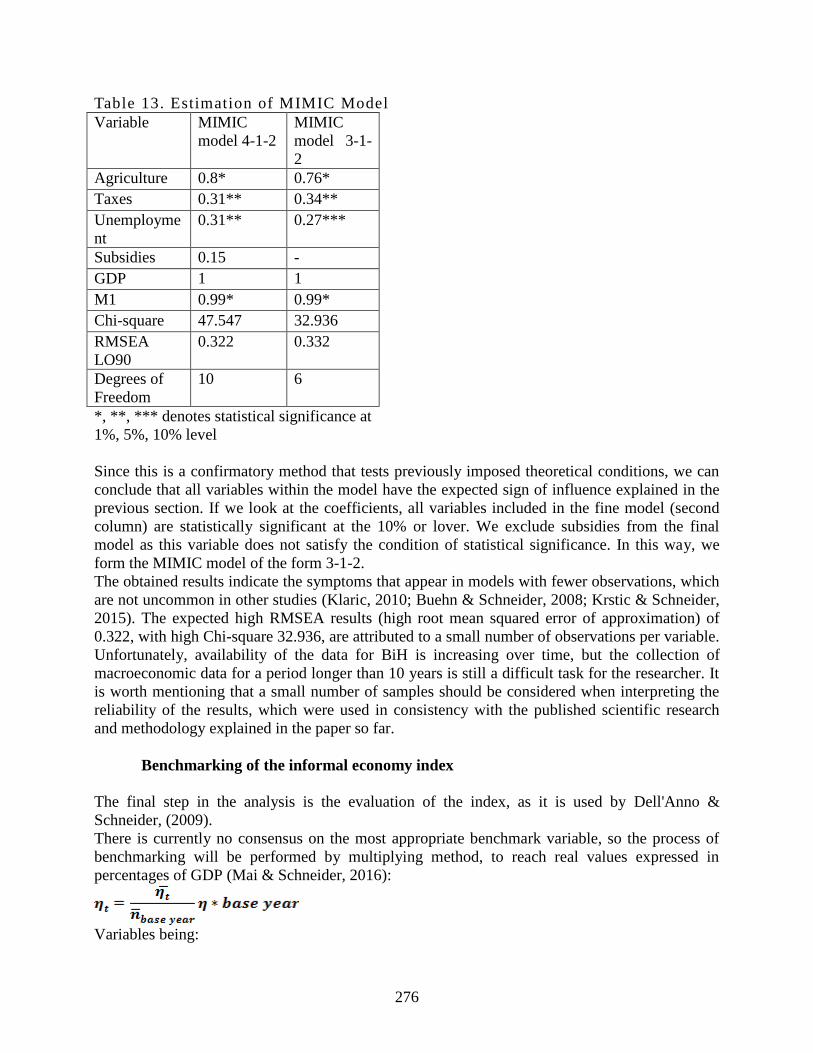
276
Table 13. Estimation of MIMIC Model
Variable MIMIC
model 4-1-2
MIMIC
model 3-1-
2
Agriculture 0.8* 0.76*
Taxes 0.31** 0.34**
Unemployme
nt
0.31** 0.27***
Subsidies 0.15 -
GDP 1 1
M1 0.99* 0.99*
Chi-square 47.547 32.936
RMSEA
LO90
0.322 0.332
Degrees of
Freedom
10 6
*, **, *** denotes statistical significance at
1%, 5%, 10% level
Since this is a confirmatory method that tests previously imposed theoretical conditions, we can
conclude that all variables within the model have the expected sign of influence explained in the
previous section. If we look at the coefficients, all variables included in the fine model (second
column) are statistically significant at the 10% or lover. We exclude subsidies from the final
model as this variable does not satisfy the condition of statistical significance. In this way, we
form the MIMIC model of the form 3-1-2.
The obtained results indicate the symptoms that appear in models with fewer observations, which
are not uncommon in other studies (Klaric, 2010; Buehn & Schneider, 2008; Krstic & Schneider,
2015). The expected high RMSEA results (high root mean squared error of approximation) of
0.322, with high Chi-square 32.936, are attributed to a small number of observations per variable.
Unfortunately, availability of the data for BiH is increasing over time, but the collection of
macroeconomic data for a period longer than 10 years is still a difficult task for the researcher. It
is worth mentioning that a small number of samples should be considered when interpreting the
reliability of the results, which were used in consistency with the published scientific research
and methodology explained in the paper so far.
Benchmarking of the informal economy index
The final step in the analysis is the evaluation of the index, as it is used by Dell'Anno &
Schneider, (2009).
There is currently no consensus on the most appropriate benchmark variable, so the process of
benchmarking will be performed by multiplying method, to reach real values expressed in
percentages of GDP (Mai & Schneider, 2016):
Variables being:
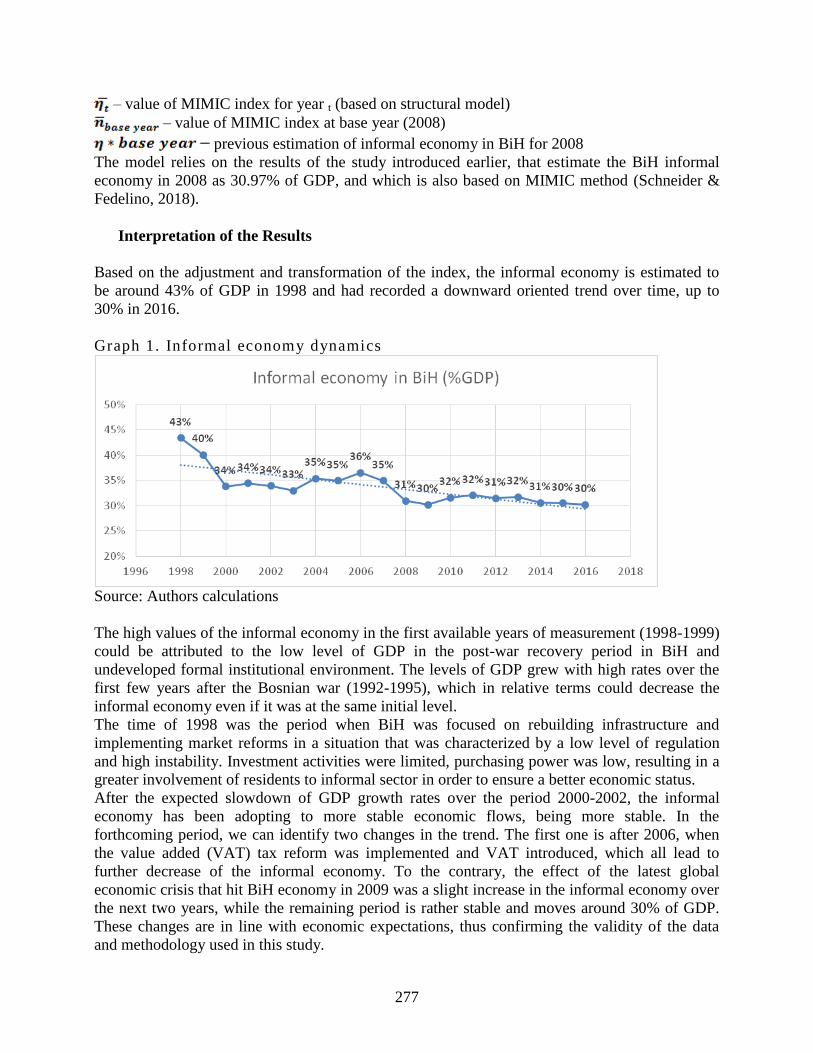
277
– value of MIMIC index for year t (based on structural model)
– value of MIMIC index at base year (2008)
previous estimation of informal economy in BiH for 2008
The model relies on the results of the study introduced earlier, that estimate the BiH informal
economy in 2008 as 30.97% of GDP, and which is also based on MIMIC method (Schneider &
Fedelino, 2018).
Interpretation of the Results
Based on the adjustment and transformation of the index, the informal economy is estimated to
be around 43% of GDP in 1998 and had recorded a downward oriented trend over time, up to
30% in 2016.
Graph 1. Informal economy dynamics
Source: Authors calculations
The high values of the informal economy in the first available years of measurement (1998-1999)
could be attributed to the low level of GDP in the post-war recovery period in BiH and
undeveloped formal institutional environment. The levels of GDP grew with high rates over the
first few years after the Bosnian war (1992-1995), which in relative terms could decrease the
informal economy even if it was at the same initial level.
The time of 1998 was the period when BiH was focused on rebuilding infrastructure and
implementing market reforms in a situation that was characterized by a low level of regulation
and high instability. Investment activities were limited, purchasing power was low, resulting in a
greater involvement of residents to informal sector in order to ensure a better economic status.
After the expected slowdown of GDP growth rates over the period 2000-2002, the informal
economy has been adopting to more stable economic flows, being more stable. In the
forthcoming period, we can identify two changes in the trend. The first one is after 2006, when
the value added (VAT) tax reform was implemented and VAT introduced, which all lead to
further decrease of the informal economy. To the contrary, the effect of the latest global
economic crisis that hit BiH economy in 2009 was a slight increase in the informal economy over
the next two years, while the remaining period is rather stable and moves around 30% of GDP.
These changes are in line with economic expectations, thus confirming the validity of the data
and methodology used in this study.

278
Given the weaknesses and limitations of the MIMIC method that we discussed above, the
estimates that we report should be viewed as approximate values of the dynamics of the informal
economy in BiH, rather than the exact values of the scope of this sector.
Conclusions
This is a first study which investigates dynamics of informal economy in a post-conflict Bosnia
and Herzegovina, covering the period 1997-2016. The study uses secondary data and MIMIC
methodology to calculate the proxy for informal economy in this country. Our empirical
investigation reveals that the informal economy in BiH has a decreasing trend over the observed
period, ranging between 43% and 30% of GDP, with an average value over the observed period
of 33,6%. The most recent data suggest that the informal economy in this country could be
around 30%, which signifies importance of this topic to the policy makers and a need for policies
and strategies that will tackle this phenomenon in the future.
The data suggests also that a dynamic behaviour of informal economy in BiH recorded two
brakes worth mentioning. The first one is the introduction of the value added tax reform in 2006,
which had a positive effect in the country by lowering the level of the informal economy over the
following few years. And, the contrary effect was identified during the latest crisis which hit BiH
in 2009, which slightly increased the value of informal economy for the following couple of
years. The both results are in line with economic expectations.
Finally, we acknowledge that MIMIC methodology has its weaknesses and these results should
be interpreted as approximation but not exact values of the size of informal economy. Still, these
findings are consistent with other estimates and they do suggest that informal economy in BiH
remains rather high and they suggest a need for more active focus on this issue.
References
Arandarenko, M. (2017). The Shadow Economy: Challenges to Economic and Social Policy. In
S. F. Krstic G., Formalizing the Shadow Economy in Serbia. Contributions to Economics.
Springer.
Breusch , T. (2005). Estimating the Underground Economy using MIMIC Models.
Buehn, A., & Schneider, F. (2008). MIMIC Models, Cointegration and Error Correction: An
Application to the French Shadow Economy. IZA DP , 3306.
Cagan, P. (1958). The Demand for Currency Relative to the Total Money Supply. Journal of
Political Economy.
Chen, M. A. (2007). Rethinking the Informal Economy Linkages with the Formal Economy and.
DESA Working Paper, 1(46), 1-30.
De Soto, H. (2001). The Mystery of Capital: why capitalism triumphs in the West and fails
everywhere else. London: Black Swan.
Dell'Anno, & Schneider. (2009). Response to Beuch Critique.
Dell'Anno, R. (2007). The Shadow Economy in Portugal: An analysis with the MIMIC approach.
Journal of Applied Economics, X(2), 253-277.
Efendic, A., & Pugh, G. (2015). Institutional effects on ecnomic performance in post-socialist
transition: A dynamic panel analysis. Acta Oeconomica, 503-523.
Efendic, A., Cveticanin, P., & Kumalic, I. (2017). Household strategies in the period of economic
crisis. Südosteuropa 65, 495-519.
Eilat, Y., & Zinnes, C. (2002). The Shadow Economy in Transition Countries: Friend or Foe? A
Policy Perspective. World Development, 30, 1233-1254.
279
Eurofound. (2013). Tackling Undeclared Work in 27 European Union Member States and
Norway: approaches and measures since 2008. Dublin: Eurofound.
European Commission. (2013). Public opinion in the European Union.
Feige, E. L. (1989). The Underground Economies. Tax Evasion and Information DIstortion.
Cambridge: Cambridge University Press.
Feige, L. E. (1998). Underground activity and institutional change: Productive, protective and
predatory bahavior in transition economies. In T. a. Nelson (Ed.), Transforming Post-
Communist Political Economies Nelson, Tilly and Walker (pp. 19-34). Washington:
National Academy Press,.
Feige, L. E. (2016). Professor Schneider's Shadow Economy: What Do We Really Know? A
Rejoinder. Journal of Tax Administration.
Fleming, M. H., Roman, J., & Farrell, G. (2000). The Shadow Economy. Journal of International
Affairs,.
Frey, B., & Hannelore, W.-H. (1984). The hidden economy as an 'unobserved' variable.
European Economic Review, 26(1-2), 33-53.
Giles, D., & Tedds, L. (2002). Taxes and the Canadian Underground Economy. Toronto:
Canadian Tax Foundation.
Golias, P. (2013). The shadow economy and how to fight against it . Institutte for economic and
social reforms.
Helberger, C., & Knepel, H. (1988). How big is the shadow economy? : A re-analysis of the
unobserved-variable approach of B.S. Frey and H. Weck-Hannemann. European
Economic Review, 965-976.
Joreskog, K., & Goldberger, A. (1975). Estimation of a model with multiple indicators and
multiple causes of a single latent variable. Journal of the American Statistical
Association, 70(351).
Kaufmann, D., & Kaliberda, A. (1996). Integrating the unofficial economy into the dynamics of
post-socialist economies : a framework of analysis and evidence. Economic Transition in
Russia and the New States of Eurasia, 81-120.
Klaric, V. (2010). Estimating the size of non-observed economy in Croatia using the MIMIC
approach. Financial theory and practice, 35(1).
Krstic, G., & Sanfey, P. (2006). Mobility, poverty and well-being among the informally employed
in Bosnia and Herzegovina. EBRD.
Krstic, G., & Schneider, F. (2015). Formalizing the Shadw Economy in Serbia. Belgrade:
Springer Open.
Lacko, M. (2000). Hidden Economy -- An Unknown Quantity: Comparative Analysis of
Economies in Transition Countries, 1989-95. Economics of Transition, 117-149.
Loayza, N. V. (1996). The economics of the informal Sector : a simple model and some empirical
evidence from Latin America.
Mai, H., & Schneider, F. (2016). Modeling the Egyptian Shadow Economy: A Currency Demand
and a MIMIC model approach. Journal of Economics and Political Economy, 3(2).
Ministarstvo Civilnih Poslova BiH (MCPBiH). (2010). Strategija zaposljavanja u Bosni i
Hercegovini 2010-2014. Ministarstvo Civilnih Poslova BiH.
Nastav, B., & Bojnec, S. (2007). The shadow economy in Bosnia and Herzegovina, Croatia, and
Slovenia: the labor approach. Eastern European Economics, 45(1).
Schneider, F. (1994). Can the shadow economy be reduced through major tax reforms? An
empirical investigation for Austria. Supplement to Public Finance/Finances Publiques,
49, 137-152.

280
Schneider, F. (2000). Dimensions of the Shadow Economy. The Independent Review, 5(1), 81-91.
Schneider, F. (2010). The influence of public institutions on the shadow economy: An empirical
investigation for OECD countries. Review of Law and Economics, 6(3), 113-130.
Schneider, F., & Buehn, A. (2013). Estmating the Size of the Shadow Economy: Methods,
Problems and Open Questions.
Schneider, F., & Buehn, A. (2016). Estimating the Size of the Shadow Economy: Methods,
Problems and Open Questions. IZA DP(9820).
Schneider, F., & Enste, D. (2002). Hiding in the Shadows The Growth of the Underground
Economy. IMF.
Schneider, F., & Fedelino, A. (2018). Shadow Economies Around the World: What Did We
Learn Over the Last 20 Years?
Schneider, F., & Williams, C. C. (2013). The Shadow Economy. London: The Institute of
Economic Affairs.
Schneider, F., Buehn, A., & Montenegro, C. (2010). Shadow Economies All over the World:
New Estimates for 162 Countries from 1999 to 2007. The World Bank Development
Research Group Poverty and Inequality Team: Policy Research Working Paper.
Smith, P. (1994). Assessing the Size of the Underground Economy: The Canadian Statistical
Perspectives. Canadian Econ. Observer, 11(10).
Tanzi, V. (1982). The Underground economy in the United States and abroad. Lexington:
Lexington Books.
Tanzi, V. (1999). Uses and Abuses of Estimates of the Underground Economy. The Economic
Journal, 109(456), 338-347.
Tomas, R. (2010). Kriza i Siva Ekonomija u BiH. Sarajevo: Friedrich-Ebert-Stiftung BiH .
Vuletin, G. J. (2008). Measuring the Informal Economy in Latin America and the Caribbean.
IMF Working Papers, 08(102).
Webb, J. W., Tihanyi, L., Ireland, R. D., & Sirmon, D. G. (2009). You say illegal, I say
legitimate: Enterprenuership in the informal economy. Academy of Management Review,
34(3), 492-510.
Wiliams, C. C. (2006). Evaluating the magnitude of the shadow economy: A direct survey
approach. Journal of Economic Studies, 33(5).
Williams, C. C., & Schneider, F. (2016). Measuring the Global Shadow Economy: The
Prevalence of Informal Work and Labour. Edward Elgar Publishing.
World Bank. (2018). World Development Indicators. World Bank.
Zagorsek, H., Jaklic, M., & Hribernik, A. (2009). The Shadow Economy and Its Impact on
National Competitivness: The Case of Slovenia. South East European Journal of
Economics and Business, 4(1), 37-50.
Zaman, G., & Goschin, Z. (2015). Shadow economy and economic growth in Romania. Cons
and. Procedia Economics and Finance, 22, 80-87.

281
Appendix
Table A 1. Descriptive statistics of the variables
Variable name Obs Mean Std.
Dev.
Min Max Description
Year 20 1997 2016 Time series
Agriculture 20 10.51 3.91 7.23 21.34 Agriculture as % of GDP
Taxes 12 20.18 0.75 18.95 21.69 Taxes as % of GDP
Unemployment 20 26.58 2.33 22.21 31.1 ILO Unemployment rate
Subsidies 12 45.20 2.82 40.58 50.13 Subsidies as % of expense
GDPindex 20 0.85 0.18 0.48 1.08 GDP index (base year 2008)
M1 19 2.38 0.86 0.77 4.35 Natural logarithm of money
growth
*Yearly data
Source: World Bank (2018)
282
SWOT ANALYSIS OF THE BiH’S ECONOMIC REGULATORS
Maja Rimac-Bjelobrk
Directorate for European Integration
dr. Silve Rizvanbegovic 24A
Phone: 063/799-228; E-mail: [email protected]; [email protected];
Abstract
Getting closer to the European Union (EU) implies meeting accession criteria, but at the same
time their fulfilment is just a procedural step on the way toward full economic integration into the
EU and participation in their economic life on equal basis. Thus, existence of the functioning
market economy, which is at the same time both, formal membership criteria and transition
requirement, needs to be coupled with strong economic governance. Some of the most important
in this respect are economic regulators aimed at both, addressing market failures and promoting
competition.
Regulation plays important part in economic life. Network industries and their good
regulation are considered to be of crucial importance for functioning of modern market economy
and hence, their performance is being one of the pillars of the second economic (sub)criteria and
economic governance accordingly.
The purpose of this Paper is to outline role of the good regulation and economic regulators
in the context of the BiH’s accession process and especially fulfilling Economic criteria for EU
membership. Development and functioning of the economic regulators in BiH are assessed by
using SWOT analysis. Paper is focused on economic regulators and regulators with both,
economic and competition/consumer protection responsibilities. Although each of network
industries, as well as economic regulators have its own specificities, for the purpose of this Paper
they are considered as whole.
Apart from being recognised as a crucial for existence and functioning of market
economy, the main economic governance instruments in BiH, such as Reform Agenda and ERP
do not refer to performance of the economic regulators, and do not compare them with respective
regulators abroad. Instead, they emphasize need for privatisation or/and restructuring in the field
of network industries.
Based on presented SWOT analysis, it is obvious that regulators in BiH suffer from many
weaknesses, while they act in very complex environment. However, process of European
Integration should provide incentive for restructuring of whole system in line with the
requirements deriving from the EU accession process and best practices, resulting thus in proper
functioning of regulated and competitive segments.
Keywords: Bosnia and Herzegovina, European Integration, Economic Criteria, Economic
Regulators
JEL classification: L51 Economics of Regulation
1. Introduction
In modern world we live in, boundaries become less important, while words as “integration” and
“connectivity” are the ones that make difference. What matters most are energy, transport, water,

283
railroads, digital technologies and other network industries, whose proper development leads to
growth and prosperity of economy as whole.
Getting closer to the European Union (EU) implies meeting accession criteria, but at the
same time their fulfilment is just a procedural step on the way toward full economic integration
into the EU and participation in their economic life on equal basis. Thus, existence of the
functioning market economy, which is at the same time both, formal membership criteria and
transition requirement, needs to be coupled with strong economic governance. Some of the most
important in this respect are economic regulators aimed at both, addressing market failures and
promoting competition.
In market economy, market failures cannot be corrected by state intervention, but by
introducing regulatory policies and structures. In order to liberalize market and to open it to
competition, network industries which previously had been the subject of government
intervention should become subject of regulation. That will ensure that service providers in these
industries have equal access to network infrastructure, benefiting thus competitiveness of the
economy and consumers’ welfare.
Having in mind above mentioned importance of network industries for economy as whole,
it can be concluded that good regulation plays important part in economic life. Network
industries and their good regulation are considered to be of crucial importance for functioning of
modern market economy and hence, their performance is being one of the pillars of the second
economic (sub)criteria and economic governance accordingly.
The aim of this Paper is to outline role of the good regulation and economic regulators in
the context of the BiH’s accession process and especially fulfilling Economic criteria for EU
membership. Special attention is paid to reviewing a progress achieved by Bosnia and
Herzegovina (BiH) in this respect. Development and functioning of the economic regulators in
BiH are assessed by using SWOT analysis, that is analytical tool based on the qualitative
analysis. Paper is focused on economic regulators and regulators with both, economic and
competition/consumer protection responsibilities. Although each of network industries, as well as
economic regulators have its own specificities, for the purpose of this Paper they are considered
as whole.
Apart from Introduction and Conclusion, theoretical part of this Paper is consisted of three
main chapters. The first chapter deals with membership criteria, especially economic one, aiming
at explaining logic upon they are based. Special attention is paid to issue of economic
governance, including different instruments BiH is provided with currently, as a part of
conditionality deriving from BiH’s European Integration Process. Second chapter is about
regulation and regulators in general, their role in economic life and functioning market economy.
It outlines common roles and functions of regulators as well as the main challenges they are faced
with. Finally, third chapter will contain main findings related to work of BiH’s regulators
presented in Answers of the BiH to the EC Questionnaire (Answers), the Economic Reform
Programme (ERP) and other key economic governance documents.
2. Economic Criteria and Economic Governance
2.1. Membership Criteria
Up to now the enlargement countries have been guided in part by the Copenhagen criteria which
are the essential conditions all candidate countries must fulfil to become a member state. They
include following:

284
Political (or I) criteria: stability of institutions guaranteeing democracy, the rule of
law, human rights and respect for and protection of minorities;
Economic (or II) criteria: a functioning market economy and the capacity to cope with
competition and market forces;
Legal (or III) criteria: administrative and institutional capacity to effectively
implement the acquis and ability to take on the obligations of membership.
In all former central planning economies, including BiH, European Integration Process
and Transition goes in parallel. Taking into account substance of the economic membership
criteria stated above, especially its first part, it is obvious that their successful fulfilment would
mean at the same time completion of transition process requirements.
Both, fulfilment of Economic criteria and transition process requirements are about the
quality of the functioning of the economy, the efficient allocation of resources and the relative
power of competing against other countries’ products in the EU market which all represents very
essence of economic governance.
However, Economic criteria is consisted of two substantially separate parts, that is sub-
criteria. In its analysis of Economic criteria Mrak concluded that “the both economic criteria are
not only interrelated and mutually reinforcing, but are also closely linked to the non-economic
criteria, i.e. with the political as well as with the acquis criteria (2005: 1)”. Furthermore, he has
elaborated that first economic (sub) criteria – existence of the functioning market economy (or
transition) – can only be achieved if the rule of law is well established and democratic institutions
are strong (Political criteria). The second (sub) criteria – the capacity to compete in the EU
market – is closely related to the country’s ability to take on the obligations of the membership
(Legal criteria). A candidate country can compete on the EU market only if its products are
produced in conformity with the EU standards, and are being in compliance with norms and
requirements stipulated by the acquis.
Therefore, transition from central planning to market economy should be based not only
on economic, but on a legal reform also, while illustration above is good example in this respect.
Thus, two reforms are independent, but need to proceed in parallel, while legal framework needs
to enable smooth running of the basic economic functions (EC, 1997, pp. 2-7).
2.2. Economic Governance
Apart from Copenhagen criteria, countries in the European Integration Process are being
provided with many other instruments which facilitates process of economic reforms and
strengthens their economic governance, contributing fulfilment of Economic criteria and thus
process of their economic integration into EU.
When it comes to Bosnia and Herzegovina (BiH), process of economic reforms currently
is based on instrument called Reform Agenda for Bosnia and Herzegovina 2015-2018 (Reform
Agenda) whose implementation became new conditionality for BiH and hence central element
for assessing BiH’s progress in the European Integration Process in general. Reform Agenda sets
out the main plans for socio-economic and related reforms of all levels of government and it has
been adopted by them accordingly. As such, it is closely aligned with the aims of the EU's new
approach to economic governance in the Western Balkans (WB) and is complementary to the
ERP (Reform Agenda, pp. 1-2).

285
The main goal of the ERP15
is to outline a medium-term macroeconomic and fiscal
framework, including fiscal measures, and a comprehensive structural reform program aimed at
improving the country's growth and competitiveness.
Finally, economic reforms in BiH currently are also based on Stabilisation and
Association Agreement (SAA) and (sub) committees’ recommendations respectively, the EC’s
annual progress reports, International Financial Institutions’ reports, etc. They all together
contain European Integration related economic governance requirements, outlining thus structural
reform strategies conducive to future integration into EU internal market and economic policy
coordination processes.
Moreover, all these instruments focus on socio-economic reforms and pay attention to
elements such as enhancing employment, the knowledge base, competitiveness, energy efficiency
and social inclusion. Since most of the consequences of the EU financial crisis are rooted in the
lack of structural reforms, the European Commission (EC) has changed its enlargement strategy
as of 2013 to include Europe 2020 and its main priorities for the enlargement countries. The issue
is essential not only in terms of giving enlargement countries a more European perspective, but
also for helping them to tackle the economic fundamentals first and to be able to successfully
fulfil the Economic criteria.
Thus, the EC has been implementing a new exercise „touch of European Semester” by
which enlargement countries are requested to adapt their economic governance to the changing
European model (Euinside, 2013). This new approach is predominantly targeted on the WB
countries since the EC has assessed „none of them is yet considered to be a functioning market
economy. It will build on the experience of EU Member States in the European Semester. There
will be an increased emphasis on structural reforms which are sectoral in nature (2014: 5)”.
3. Good Regulation and Economic Regulators
3.1. Why regulation?
Network industries, such as transport, e-communication and energy, provide services through a
network infrastructure. The network infrastructure is considered as a natural monopoly subject to
regulation when it comes to pricing and access to the network, while network services are subject
to competition. The co-existence of both segments, regulated and competitive, requires them to
be coordinated and regulated by a strong and independent regulator. In general, as long as each
operator gets a fair and transparent access to the infrastructure, competition related to service
provision can be ensured. In opposite, absence of regulation could result in situation in which
operators would be able to increase its market power, resulting finally in insufficient delivery of
services at too high prices, and distortion of competition at EU internal market accordingly (EC,
2013a, p. 15; OECD, 2017, p. 33).
Following these considerations, during 1990s the European Union (EU) has started with
broad regulatory reform programme in network industries, in order to increase competition in
these sectors through liberalisation and privatisation (ECB, 2005, p. 4). This action was part of
overall Lisbon reform agenda intended to establish European economy as leading one at global
level.
15
ERP 2018-2020 has been adopted by the BiH Council of Ministers on its 131st session, held on 30 January 2018,
and submitted to the EC accordingly.
286
In more detail, rationale of the EU's liberalisation policy in the field of network industries
was “to increase, through an intensification of competition, the efficiency and the performance of
these network industries. Ultimately this is expected to lead to lower prices and better services for
households and enterprises, thereby increasing the overall competitiveness of the economy”.
Finally, EU considers this process improves performance and resulted in “generally lower price
levels, expanded output and productivity gains” (EC, 2013c).
According to last available data provided by the EC (2013a, p. 9), key network industries
regulated at the EU level such as e-communications, energy and transport in recent years account
together for some 9% of value added, 6% of employment, and 11% of households' purchases in
the EU. Moreover, these are the industries of great economic importance since goods and/or
services they produce serve as inputs for all range of different economic, but also social activities.
The EC thus has considered “the price and quality of their outputs are essential for the growth
and competitiveness of European industries, for the well-functioning of the internal market, and
for the standard of living of European consumers (2013a: 9)”.
When it comes to enlargement agenda, accession requirements in this respect are derived
from EU policy in this particular area, which is reform and liberalisation of network industries
aimed at increasing competition and enhancing consumer welfare. In order to evaluate reform
progress in this respect, the EC assess:
To which extent network industries are subject to specific protection such as market
entry, price setting etc.;
Liberalisation and deregulation measures taken over the past year and their achieved
and/or expected economic impact;
Quality and characteristics of existing regulatory framework, that is the regulatory and
institutional environment and changes to it that materialised over the past year
(Progress Report 2006: Economic criteria - report by the national authorities, 2006).
3.2. What is regulation?
According to the Organisation for Economic Co-operation and Development (OECD), which has
established itself as a key source of international principles for good regulatory practices over the
past three decades “regulation is a key tool for achieving the social, economic and environmental
policy objectives of governments that cannot be effectively addressed through voluntary
arrangements and other means (2014: 17)”.
There are seven main principles of good regulation and they include (OECD, 2014, p. 23):
Serve clearly identified policy goals, and be effective in achieving those goals;
Have a sound legal and empirical basis;
Produce benefits that justify costs, considering the distribution of effects across
society and taking economic, environmental and social effects into account;
Minimise costs and market distortions;
Promote innovation through market incentives and goal-based approaches;
Be clear, simple and practical for users;
Be consistent with other regulations and policies;
Be compatible as far as possible with competition, trade and investment-facilitating
principles at domestic and international levels.
Regulation is being implemented by regulators which can been defined as “entities
authorised by statute to use legal tools to achieve policy objectives, imposing obligations or
287
burdens through functions such as licensing, permitting, accrediting, approvals, inspection and
enforcement (OECD, 2014: 17)”.
Regulators can take different institutional form (unit within ministry, separate agency
etc.), while their functions can be performed at different level of government (central, local,
regional, municipality, etc.). They can be in charge of regulation of single or several industries,
but also of regulation of whole economy. Their competences can be purely economic, purely
non-economic or they can have combination of these or other functions. Finally, regulators can
be market or non-market regulators, depending on whether their decisions will have an economic
effect or impact on the market. (OECD, 2014, pp. 18-19).
The five most common roles and functions of regulators are (OECD, 2017, p. 34):
Tariff regulation;
Access regulation;
Monitoring;
Dispute resolution;
Setting technical standards.
Even though different regulators are faced with different challenges, depending on their
role industry they operate in, or, the most common challenges they are facing with can be
summarized as follows (OECD, 2017, p. 53):
Encouraging efficient investment, in the sense they should find way to keep investment
incentives, while making decision about tariffs and infrastructure access at the same time;
Data and information asymmetry, means they obtain valuable data necessary for smooth
performance of regulator’s functions;
Governance of economic regulators;
New technology;
Changes related to mandates, responsibilities and functions;
Coordination with other stakeholders in performing their roles;
Engaging with other stakeholders when it comes to making regulatory decisions;
Regulating infrastructure in the conditions of declining demand for services provided
through that infrastructure;
Appeals means dealing with decision making in the context of legal review.
4. SWOT Analysis of the Economic Regulators in BiH
4.1. Economic Regulators in the EC Questionnaire
Questions related to the state of play of economic regulators in network industries in BiH were
included in the EC Questionnaire submitted to BiH. The most concrete question in that respect
was Question No. 13 related to status and work of economic regulators. It was included in
Economic criteria; I sub(criteria): Existence of a functioning market economy; part II: the
Functioning of product market. Concretely, BiH was asked to list active regulatory and
supervisory institutions, including a short description of their legal competences, institutional
setup, financing and the number of staff. In addition, within the same question, BiH was asked to
describe challenges and coordination of regulatory institutions with respect to market
competition, consumer protection, energy and transport sectors (the EC Questionnaire, 2016, p.
58).

288
Answers submitted by institutions in BiH have referred to economic regulators
established at their level of government, explaining briefly their legal basis, competences,
institutional setup, number of staff, and financing to some extent. Economic regulators being
mentioned in this respect were notably the Competition Council, the Regulatory Agency for
Communication and Electricity Regulatory Commissions established at the level of state and
entities. However, Answers lack the deeper analysis of their functions and challenges they are
faced with in performing their actions.
Although proper functioning of regulatory structures has been recognised as a crucial for
existence and functioning of market economy, the main economic governance instruments in
BiH, such as Reform Agenda and ERP do not refer to their performance and do not compare
them with respective regulators abroad. Instead, they emphasize need for privatisation or
restructuring in the field of network industries.
4.2. SWOT analyses
As already stated in Introduction, SWOT is analytical tool based on the qualitative analysis. It
can provide a good basis for successful strategy formulation, since it helps in understanding
current situation (Prunckun, 2010, pp. 135-137). As for methodology applied in SWOT, it is
being concentrated on analysis of the firms’ strengths and weaknesses (internal factors), together
with opportunities and threats (external factors), contributing thus appropriate strategy
formulation (Hitt, Black & Porter, 2014, p. 80).
What needs to be stated is that in some situations is not easy to distinguish among SWOT
indicators in the terms of their evaluation. In more detail, same variable or situation at the same
time can be considered as an opportunity or a threat, depending of perspective and point of view.
However, having in mind subject and context, indicators in this Paper will be evaluated from the
perspective of overall benefits for state, economy and society as whole, while perspectives and
single interests of particular industries or regulators will not be taken into considerations.
One of such situations that is not easy to assess is the fact that vast majority of network
industries in BiH, especially in Federation of BiH are still state-owned, means there is a strong
need for independent regulation. Process of liberalisation and opening to competition in those
industries are still in early stage, even though the most industries already being regulated and
have implemented process of unbundling. Taking into account that unbundled and regulated
market gradually enables efficient competition among new coming independent operators, above
mentioned state ownership for the purpose of this Paper will be taken as a strength, limited to
situations where network infrastructure is managed independently and without political
interference.
Transposition and implementation of international standards in domestic legal order in
respective fields, as a part of the European Integration Process, as well as existing level of
technical assistance, including cooperation between foreign and domestic experts, should also be
regarded as strengths.
However, regulatory system in BiH, as well as in the most other former centrally planned
economies suffers from many weaknesses, and is being far from fulfilling its social and economic
role. BiH still does not have in place proper legal or institutional framework, neither institutional
culture of regulation. Along with the slow pace of reform process in general, limited progress in
this particular reform area is caused largely by lack of political will and resources, coupled by
misunderstanding of the regulatory independence concept and role of the regulation in general.
289
Following existing administrative structure in BiH, there are different rules governing this
area at different levels of government, or there is a possibility of their unequal application,
undermining thus existence of the BiH’s single economic space.
Considering opportunities, the first to be mentioned is European perspective, which
among other means that reforms requirements will be supported through funds and technical
assistance in respective policy fields. Opening to competition of the network industries, which is
important element of the transition process, should also provide incentive for further positive
trends in this area, resulting finally in increasing willingness for investments in these sectors.
However, market liberalization and privatisation which opening to competition entails, in the
case that are not led properly could easily become threat and have negative effects on overall
economic output, endangering thus functioning of market economy including network industries
service provision.
However, even though European perspective as such should be regarded as an
opportunity, as stated above, in the BiH where support to the completion of European Integration
Process is only declaratory, this opportunity is transformed into one of the major threats in
general. Thus, insufficient commitment to successful completion of requirements deriving from
European Integration Process, including completion of transition process and establishment of the
functioning market economy is one of the most dangerous threats.
Although in recent years process of court settlements in BiH has been improved in
general, functioning of the network industries regulators in BiH (as well as of judiciary) is still
burdened with case backlogs, especially in the field of utility services, caused by increasing
number of unpaid utility bills cases. According to last available data from June 2016, this backlog
was made up of over 1.7 million cases (EC, 2016, p. 16), resulting thus in lower level of
profitability of utility network industries.
Moreover, EU acquis is “moving target” that changes and develops all the time, which
concretely means country could be in position of constant changing legislation in order to
harmonize it with acquis.
Based on above presented brief analysis and findings, it can be concluded that economic
regulators in BiH neither play basic roles and functions of regulators, nor are faced with
challenges presented earlier, considered to be common for all regulators. That would mean that
regulation as a social function, and economic regulators as their decisive part, are still in the early
stage of its development, while their importance and roles are not fully understood. Perhaps, this
is the most dangerous of all the weaknesses in this respect.

290
Table 1. SWOT Analysis of the BiH’s Network Industries Regulators
Internal
Strengths Weaknesses
1. International standards implemented and
reflected in national legislation;
2. Predominantly state-owned network industries
and infrastructure;
3. Markets regulated and unbundling
implemented in the most of the cases;
4. Cooperation between national and international
authorities.
1. Deficient legal and institutional framework;
2. Slow pace of reform process;
3. Lack of institutional culture in this policy area;
4. Lack of political will and resources;
5. Strong political influence without independence;
6. Different rules or their unequal application;
7. No single economic space.
8. Insufficient performance of standard economic
regulators’ functions;
9. Importance and roles are not fully understood.
External
Opportunities Threats
1. European Perspective;
2. Availability of technical assistance and
international expertise;
3. Market liberalisation;
4. Willingness to invest.
1. Declaratory political support to the European
Integration Process, including transition to
functioning market economy;
2. Network industries (but predominantly utility)
case backlogs;
3. EU acquis as a “moving target”.
5. Conclusion
Fulfilment of formal accession criteria is just step on the way to full integration into the EU.
Concretely, II Copenhagen criteria, known also as Economic criteria, provides for existence of a
functioning market economy and capacity to cope with competition and market forces in the EU.
However, full participation in the EU’s economic life, notably internal market, Economic and
Monetary Union (EMU) and whole range of horizontal policies, as well as the realization of
benefits arising from it, requires more than fulfilling formal requirements. Among other things, it
requires existence of functioning economic institutions and their profound reform, coupled with
legal framework which needs to enable smooth running of the basic economic functions.
Successful economic and institutional integration is a process and can only be achieved, if
EU membership is actively used as a reform anchor and domestic ownership of reforms is
sustainable. Without addressing the need for far reaching structural policies reform, not only the
new Member States will be disappointed when expected instant prosperity fails to materialise, but
the current Member States will be disappointed also, finding themselves in an EU with a
depressed economic periphery. Finally, in order to reflect these considerations, as of 2013 the EC
changed its approach to help the enlargement countries to tackle the economic fundamentals,
contributing thus strengthening of their economic governance and fulfilment of the Economic
criteria.
One of the pillars of the functioning market economy is existence of efficient and
effective economic regulators in the fields of network industries. In general, some of the biggest
changes in transition process take place in the field of network industries since transition to a
market economy implies that they can no longer be subject to state intervention, but the subject to
regulation aimed at correcting market failures. Network industries needs to be unbundled in the
terms that network infrastructure, considered to be natural monopoly, should become subject to
291
regulation, while services are to be opened to competition. Finally, one of the roles of the
economic regulators would be to enable smooth and coordinated functioning of both segments,
regulated and competitive, ensuring thus fair and transparent access to the network infrastructure
and competition in service provision accordingly.
Answers to the EC Questionnaire submitted by the BiH’s institutions, although contain
certain situation overview regarding economic regulators of network industries, in general lacks
the deeper analysis of their performance and challenges they are faced with. Apart from being
recognised as a crucial for existence and functioning of market economy, the main economic
governance instruments in BiH, such as Reform Agenda and ERP do not refer to performance of
the economic regulators, and do not compare them with respective regulators abroad. Instead,
they emphasize need for privatisation or/and restructuring in the field of network industries.
Based on presented SWOT analysis, it is obvious that regulators in BiH suffer from many
weaknesses, while they act in very complex environment. However, process of European
Integration should provide incentive for restructuring of whole system in line with the
requirements deriving from the EU accession process and best practices, resulting thus in proper
functioning of regulated and competitive segments.
However, the most dangerous weakness among all would be that concept of regulation
and economic regulators are not fully understood, while their development in BiH is still in the
early stage. Their performance can not be checked against performance of economic regulators in
similar network industries abroad, since they hardly play their standard roles and functions.
Finally, challenges they are faced with are also far from those outlined as common for all
economic regulators.
Finally, in order to improve understanding of the concept of network industries regulation,
and functioning of economic regulators accordingly, BiH’s institutions in charge of ensuring
smooth operation of regulated network industries should focus their efforts on:
Reviewing general market context in relation to existence and work of network
industries economic regulators.
Outlining the best practice models related to performance of the network industries
economic regulators in the EU and other accession countries, especially taking into
account challenges outlined as a common for all economic regulators.
Further alignment of existing legal and institutional framework of network industries
economic regulators in BiH with the EU requirements and best practices.
Advocacy and awareness rising of ministries and other government institutions,
business community and general public in BiH, regarding necessary policy changes
with regards to establishment and work of economic regulators in the field of network
industries.
References
The BiH Council of Ministers. 2015. Economic Reform Program for 2018-2020.
http://www.dep.gov.ba/naslovna/Archive.aspx?pageIndex=1&langTag=en-US. Accessed
1 September 2018.
Essay UK. 2015. British Telecom SWOT Analysis. http://www.essay.uk.com/guides/swot-
analyses/british-telecom-swot-analysis.php. Accessed 17 September 2015.
292
EUinside. 2013. The European Semester Enters the Enlargement Process.
http://www.euinside.eu/en/news/european-semester-enters-the-enlargement-process.
Accessed 17 September 2015.
European Central Bank. 2005. Regulatory Reforms in Selected EU Network Industries.
Occasional Paper Series, No.28/April
https://www.ecb.europa.eu/pub/pdf/scpops/ecbocp28.pdf. Accessed 18 September 2015.
European Commission. 1997. The Legal Underpinnings of Market Economy in Transition
Economies. Brussels: European Commission. Non-Paper.
European Commission. 2006. Progress Report 2006: Economic criteria - Report by the national
authorities. Brussels: European Commission. Non-Paper.
European Commission. 2013. Market Functioning in Network Industries - Electronic Communications,
Energy and Transport. European Economy, Occasional Papers 129, February.
http://ec.europa.eu/economy_finance/publications/occasional_paper/2013/pdf/ocp129_en.pdf.
Accessed 17 September 2015.
European Commission. 2013. Network industries.
http://ec.europa.eu/economy_finance/structural_reforms/product/network_industries/index_en.h
tm. Accessed 18 September 2015.
European Commission. 2013.
http://ec.europa.eu/economy_finance/structural_reforms/product/competition/index_en.htm.
Accessed 18 September 2015.
European Commission. 2016. Bosnia and Herzegovina 2016 Report.
https://ec.europa.eu/neighbourhood-
enlargement/sites/near/files/pdf/key_documents/2016/20161109_report_bosnia_and_herzegovi
na.pdf. Accessed 1 September 2018.
European Commission. 2016. The EC Questionnaire.
http://dei.gov.ba/dei/media_servis/vijesti/default.aspx?id=17741&langTag=bs-BA Accessed 2
September 2018.
Hitt, M., Black, S. & Porter, L. 2014. Management. Edinburgh Gate: Pearson.
Markovska, N., Pop-Jordanov, J. & Gjorgievska-Taseska, V. 2009. SWOT analyses of the national
energy sector for sustainable energy development. Elsevier: Energy, June, Vol. 34 (6): 752–
756.
http://www.researchgate.net/publication/235409375_SWOT_analyses_of_the_national_energy
_sector_for_sustainable_energy_development. Accessed 3 September 2018.
Mrak, M. 2005. Copenhagen Economic Criteria: Outline for preparation of the second chapter of
the NPAA. Non-Paper.
OECD. 2014. The Governance of Regulators, OECD Best Practice Principles for Regulatory
Policy. https://doi.org/10.1787/9789264209015-en. Accessed 4 September 2018.
OECD. 2017. The Role of Economic Regulators in the Governance of Infrastructure, The
Governance of Regulators. https://read.oecd-ilibrary.org/governance/the-role-of-
economic-regulators-in-the-governance-of-infrastructure_9789264272804-en#page3.
Accessed 4 September 2018.
Prunckun, H. 2010. Handbook of Scientific Methods of Inquiry for Intelligence Analysis.
Plymouth: Scarecrow Press.
Reform Agenda for Bosnia and Herzegovina 2015 – 2018 (Working translation).
https://europa.ba/wp-content/uploads/2015/09/Reform-Agenda-BiH.pdf. Accessed 4 September
2018.
293
THE USEFULNESS OF REPORTING OF LEGAL ENTITIES IN THE
FEDERATION OF BOSNIA AND HERZEGOVINA
Amra Salihovic
Revicon Ltd, Sarajevo, Bosnia and Herzegovina
Asima Behmena 9, Sarajevo
Phone: ++ 38761201309; Fax: ++38733720581
E-mail: [email protected]
Abstract
According to the law on accounting, the regular annual financial report of the legal entities that
apply IFRS, i.e. IFRS for SMEs includes the Balance sheet, Income statement, Reports of
changes in capital, Cash flow and Notes. The objective of general purpose financial information
about reporting entity that is useful to existing and potencial investitors, lenders and other
creditors in making decisions relating to providing resources of entity. However, classical
financial reporting does not meet the information needs for decisions in the new economy, which
has led to the development of new models of business reporting. Investors and lenders do not
accept the financial statements just like that which presents them to management, but they are
trying to get into the quality of examining and taking notes, they get a clearer picture of the
performance that are the product of the accounting policies. The objective of this research is to
analyse the usefulness of reporting of legal entities in the Federation of Bosnia and Herzegovina.
So, the aim of this research was to examine the topic of quality financial reports with reporting
entities in Bosnia and Herzegovina. The paper deals with the issue of reporting with special
emphasis on the reporting of non financial information, such as accounting policies and
integration of financial and non-financial information in the annual reports. Empirical research
was conducted on a sample of 49 professionals from the accounting profession. We conducted
data analysis including factor analysis, scale reliability analysis, data verification and hypothesis
testing. The final factor analysis shows factors as following: Change in accounting policies, Fair
presentation and comparability of nonfinancial information, Integration of financial and non-
financial information in the annual reports and clarity of estimates and assumption, Neutrality
and predictive ability of the annual reports. Regression results showed that there was a
statistically significant positive relationship between Change in accounting policies and quality of
reporting (presented throw the Fair presentation of financial and non.finacial informations in
annual report) as well as positive relationship between Integration of financial and non-financial
information in the annual reports and clarity of estimates and assumption and quality of reporting.
This research contributes to understanding the perceptions of qulity of reporting legal entities in
BiH. It was found that both Change in accounting policies and Integration of financial and non-
financial information in the annual reports and clarity of estimates and assumption intentions to
usefulness of reporting of legal entities in the FiH.
Keywords: financial report, non financial information, quality of reporting, accounting policies
JEL classification: M41
294
1. Introduction
Discussions have always been held about quality of the financial reporting. The problem of the
quality of reporting is certainly not easy and can be analyzed from different perspectives,
especially in the countries in transition such as BiH (Stanisic, 2016). About high-quality reporting
is possible to speak only if it provides an objective and complete presentation of economic
performance, financial position and risks which the economic society is exposed to, as well as
relevant information to forecast the financial situation and business performance in the future
(Ramljak, 2017). According to the law on accounting, the regular annual financial report of the
legal entities that apply IFRS, i.e., IFRS for SMEs includes:
1) the Balance sheet, which presents an overview of the assets, liabilities and capital of a
legal entity on a certain day;
2) Income statement, which presents an overview of revenue, expenditures and results in a
particular period;
3) Reports of changes in capital, that provides information about the changes in capital of
legal entities during the reporting period;
4) Cash flows, which provides information about cash and cash equivalents during the
reporting period;
5) Notes to the financial statements, which contain descriptions or parsed items posted in
mentioned reports in points 1 to 5, applied the accounting policies, as well as information
about items that are not eligible for recognition in these reports, and are significant for the
assessment of the financial position and business performance of the legal entity, as well
as other information in accordance with the requirements of IFRS.
In addition, the annual report on the operations of reported entities required the following:
1) credible view of the development and results of the operations of the entity, and
particularly the financial state in which it is located, as well as the data relevant to the
assessment of the condition of the assets of the entity;
1) description of the expected development of entity in the coming period, changes in
business policies of the company, as well as the main risks and threats which it is the
business of the entity is exposed to;
2) all important business events that occurred after the expiration of the fiscal year for which
the report is prepared;
3) all significant dealings with related parties;
4) activities of the society in the field of research and development.
Classical financial reporting does not meet the information needs for decisions in the new
economy, which has led to the development of new models of business reporting. Users are
interested in assessment of the future of business enterprises, and their management need to
present and such information, not only for the assessment of the past and the present (Piljic;
2016;). A Committee of the American Accounting Association for financial accounting standards
gave "recommendations regarding the release of non-financial performance", in 2001. This
Committee, together with the FASB and other professional organizations, is noted that the rating-
financial performance can be extremely useful for the management of the company, the owners
and the other stekeholders.
295
There are many researches about exceptional importance of the release of non-financial
information, as well as to the traditional financial measures have less significance for timely
reaction to changes in the company management conditioned by the "new economy". It was
pointed out that the financial measures of performance are turned to the past and that they are not
sufficient for the projection of future performance of the company. The need for reporting non-
financial performance, also, is conditioned by and thus that some companies adopted models that
take into consideration non-financial measures. Investors, especially, require reporting in the
form of models that include and non-financial performance measures, in addition to financial,
that can be used in the process of formulating or redesigning strategies of the company. Some
researches expire possibilities of the use of non-financial information for predicting future
financial performance. They has shown that the current non-financial performance can be
significant for investors and creditors, which its decisions were based on the expected future
financial performance. Common include financial and non-financial performance can ensure a
better insight into the operations of a company (Piljic, 2011).
The subject is obliged to decide, taking into account all the relevant facts and
circumstances, how to merge the information in the financial statements, which include and
Notes. The subject must not reduce the intelligibility of its financial statements by the
insignificant information obscures significant information which brings together significant items
that have a different nature and function (Salihovic, 2017). A significant role in the quality of
financial reports have adopted accounting policies. The choice of accounting policies is a multi-
dimensional issue whose effects ripple through the contents of the financial statements, but also
on the assessment that in the name of investors and lenders are performed by financial analysts
and rating agencies (Piljic, 2017).
Investors and lenders do not accept the financial statements just like that which presents
them to management, but they are trying to get into the quality of examining and taking notes,
they get a clearer picture of the performance that are the product of the accounting policies (Pijic,
2017).
The objective of this research is to analyse the usefulness of reporting of legal entities in
the Federation of Bosnia and Herzegovina. In order to realize the objective of this research, the
study will be structured in the following way. After Introduction, in the second part, there will be
given literature overview which includes review of existing articles with the topic that includes
financial and non-financial reporting. Also, main hypothesis will be stated. In the third part,
empirical research will be described together with explanation of the process of research,
measuring scales as well as research samples. The fourth part will delineate data analysis
including factor analysis, scale reliability analysis, data verification and hypothesis testing. The
fifth part will provide certain discussion about this paper which will be followed by specific
conclusions.
2. Literature review
Many theorists are engaged in research in connection with the quality of the financial
statements.
296
According to the law, all legal entities should submit prescribed financial statements.
The financial statements should provide the necessary information for making business decisions.
The question arises as to whether the financial statements are of sufficient quality to satisfy their
purpose.
There are many researches that classical financial reporting does not meet the
information needs for decisions in the new economy. Also, there are many researches about
exceptional importance of the release of non-financial information. A significant role in the
quality of financial reports have adopted accounting policies. The choice of accounting policies is
a multi-dimensional issue whose effects ripple through the contents of the financial statements,
but also on the assessment that in the name of investors and lenders are performed by financial
analysts and rating agencies.
The objective of this research is to analyse the usefulness of reporting of legal entities in
the Federation of Bosnia and Herzegovina.
In this paper I was guided by the research that is conducted on the same topic in South
Africa (Padia, Maroun and Olandzobo, 2014).
These authors presented prior literature which was the basis for the developing of the
research instruments.
I was guided by the research issues from this work, and I've created a questionnaire with
the same issues with small adjustments. Customizing the questionnaire was conducted for
transactions with related parties. Namely, according to IFRS 15 B87 there is a requirement to
present revenue from contracts with customers in the parse the categories that describe the way in
which economic factors affect the type, amount, timing and uncertainty of income and cash
flows. It is especially important to publish the income of the related parties.
The questionnaire was distributed to the professionals from the accounting profession.
The aim was to examine the topic of quality financial reports with reporting entities in Bosnia
and Herzegovina. The paper deals with the issue of reporting with special emphasis on the
reporting of non financial information.
3. Hypotheses development
The accounting policies have a special importance for the quality of the financial statements.
According to IAS 8, the Management Board should define accounting policies that enable the
application of all the requirements of all IASs / IFRSs so that they accurately represent the results
and financial condition of a legal entity, reflect the economic substance of events and transactions
(and not only their legal form), to be neutral and complete in every respect. In the preparation of
financial statements, entities are required to comply with adopted accounting policies and to
make the most significant disclosures in the Notes to the financial statements. Thus (Ramljak,
2011) analyzed the impact of accounting policies on the quality of financial statements. Also, this
issue was dealt with by other authors (Svigir, 2009, Ramljak 1999.). In this regard, the following
hypotheses is proposed:

297
H1: Change in accounting policies is positively related to fair presentation of financial report
and nonfinancial information.
H2: Integration of financial and non-financial information in the annual reports and clarity of
estimates and assumption is positively related to fair presentation of financial report and
nonfinancial information.
H3: Neutrality and predictive ability of the annual reports is positively related to fair
presentation of financial report and nonfinancial information.
4. Empirical research
4.1. Research process and measuring scales
A structured questionnaire was consisting of 20 questions. Scale used in this questionnaire was
Likert type scale. Similar to a study by Van Beest et al. (2009), a five-point Likert scale was
used, ranging, in general, from a low (1) to high (5) perceived level of usefulness (Abadir, 2005;
Groth & Bergner, 2006; Azam, Warraich & Awan , 2011). Initial descriptive statistics (mode,
median and mean responses) were generated, using a statistical programme (SPSS). Thereafter,
the data was summarised and aggregated into different ‘themes’ or factors. Collected data were
analyzed in SPSS 21.0 statistical program. There were no any missing values to deal with,
considering that all questions were obligatory for answering.
The questions are given in the following table:
Table 1: Questionnaire items
How much you agree or disagree with each of these statements using the scale
provided below. Write the number that best indicates how you feel in the space next to
each statement.
strongly disagree 1 2 3 4 5
strongly agree
R1. Presentation of information on the future activities of the entity (through Notes, the
business report, etc.) helps users in predicting the future of the company.
R2. Non-financial information (such as the views of business, strategic/operational goals,
business opportunities and risks) complement with the presented financial information.
R3. The additional disclosures in the Notes connected with the transactions with related
parties (e.g. about related parties, the criteria of connection revenues and expenditures
during the period, receivables and commitments from the previous period, etc.) are useful
for different interest groups.
R4. The information presented in the financial statements are in accordance with those
that are presented through the publication in the annual report on operations, and Notes
(related to the assessment of the expected future development, objectives and policies of
the status of a legal entity in connection with the the management of financial risks,
activities with related parties, and accounting policies, etc.).
R5. The annual report provides interested parties to assess the long term and short term

298
performance of the company, as well as its sustainability.
F1: Notes presented significant assumptions and estimates that were used when drafting
financial statements.
F2: Summary of the accounting polices and an explanation in connection with the choice
of accounting policy is given in your Notes.
F3: Entity presented significant business events (with negative and/or positive outcomes)
in its annual reports.
F4: Presented strategy, values, risks, policies, risk management, assessment of expected
future development, objectives, and policies of a legal entity are connected to the
management financial risks, activities with related parties, accounting the financial
performance of the company are in accordance with the real state.
F5: Published non-financial information corresponded to the published financial
information contained in the annual reports and adopted accounting policies.
C1: Entity published changes and adjusted retroactively items due to changed accounting
policies and adjusted retroactively items due to material misstatement updates from
previous period.
C2: You adequately explain the changes in accounting policies and their implications for
the appropriate balancing entries in your notes and adequately explain the error
corrections and their implications on the appropriate balancing entries.
C3: The information presented in the Notes are comparable from period to period.
C4: Information presented in the financial statements are comparable with information
supplied to other entities (eg. The tax authorities).
U1: The information presented through Notes, the annual report on operations and
accounting policy are well organized and presented (in terms of content, structure, cross
links...)
U2: The Notes are useful in the sense of presenting additional information necessary for
the understanding of financial reports (Balans sheet, Balance of success, Cash flows and
Reports of change in the capital).
U2: Accounting policies are useful in the sense of presenting additional information
necessary for the understanding of the Balans sheet, Balance of success, Cash flows and
Reports of change in the capital.
U3: Additional information (such as a glossary, structure, cross connection) contributes to
the understanding of the financial statements?
T1: Deadline for the presentation of financial statements (28.2.) and operations with
related parties (30.3) in relation to in relation to the reporting period (31.12.) from the
point of view of interested users is appropriate?
Source: Author’s illustration
4.2. Research sample
Empirical research was conducted on a sample of 49 professionals from the accounting
profession. In order to collect the necessary data and for the purpose of this study, a questionnaire
was distributed to professionals as an online survey using Limesurvey software using mailing
lists. Data was collected at the beginning of April 2018. Respondents’ demographics are shown
in below:

299
Table 2: Respondents’ Demographics
Source: Author’s illustration
4.3. Research Findings
First we check the eligibility of the correlation matrix. It is necessary that the Kaiser-Meyer-
Olkin Measure of Sampling Adequacy value equal to or greater than 0.6; in our example was
0.773.
Since factor analysis uses the correlation between variables, before the start of the
procedure should be checked whether the variables in correlation and is used for this purpose,
Bartlett's test (tests the null hypothesis that the interkorelations matrix of the variables included in
the procedure of the identity matrix that is,. that all of the correlations between the variables are
equal to zero).
If Bartlett's test is not a statistically significant application of factor the analysis makes no
sense (except strong theoretical justification). The results of Bartletovog tests (we're looking
Sig.); p there is a 0.001 < statistical significance. Which means that we can move on (chi-square
= 427.184, df = 153).
We emphasize that the authors of the paper that served as the basis for this research
provided certain limitations that are listed below.
“Despite the reliability and validity safeguards, however, this research is not without its
limitations. Firstly, the research examines the perceptions of a relatively small number of experts.
On the one hand, this is an inherent restriction, given the limited number of individuals
knowledgeable about IFRS. A relatively small, purposefully selected group of experts is also
used to ensure that only informed responses are considered (Cohen et al., 2002; Creswell, 2009;
Maroun, Turner & Sartorius, 2011), although this means that responses are not representative of
the entire population of stakeholders (Azam et al., 2011; Hussey & Hussey, 2003). Secondly, the
factor analysis only summarises the perceptions of respondents, aggregating these under six
Item Frequency Percentage
Sex
F 37 75.5
M 12 24.5
Education
Some secondary - -
Completed high school - -
Some additional
training
- -
Completed
undergraduate
40 81,6
Postgraduate completed 7 18,4
Main Area of work
Accounting 49 100
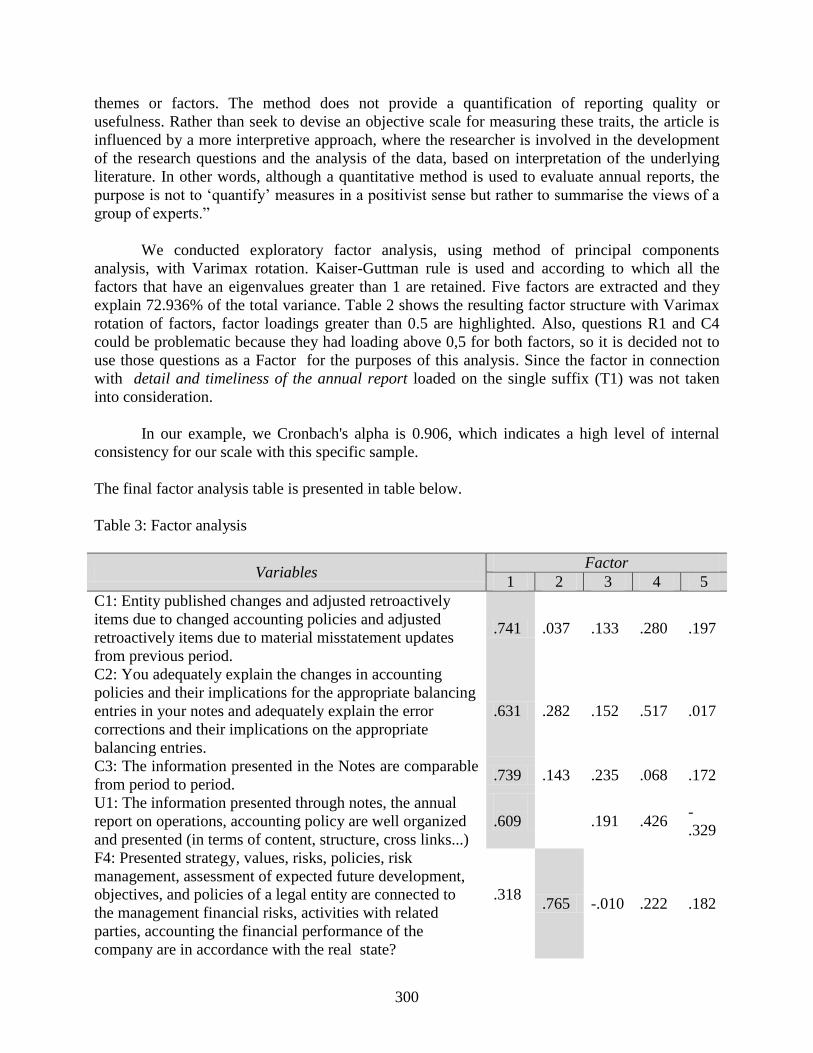
300
themes or factors. The method does not provide a quantification of reporting quality or
usefulness. Rather than seek to devise an objective scale for measuring these traits, the article is
influenced by a more interpretive approach, where the researcher is involved in the development
of the research questions and the analysis of the data, based on interpretation of the underlying
literature. In other words, although a quantitative method is used to evaluate annual reports, the
purpose is not to ‘quantify’ measures in a positivist sense but rather to summarise the views of a
group of experts.”
We conducted exploratory factor analysis, using method of principal components
analysis, with Varimax rotation. Kaiser-Guttman rule is used and according to which all the
factors that have an eigenvalues greater than 1 are retained. Five factors are extracted and they
explain 72.936% of the total variance. Table 2 shows the resulting factor structure with Varimax
rotation of factors, factor loadings greater than 0.5 are highlighted. Also, questions R1 and C4
could be problematic because they had loading above 0,5 for both factors, so it is decided not to
use those questions as a Factor for the purposes of this analysis. Since the factor in connection
with detail and timeliness of the annual report loaded on the single suffix (T1) was not taken
into consideration.
In our example, we Cronbach's alpha is 0.906, which indicates a high level of internal
consistency for our scale with this specific sample.
The final factor analysis table is presented in table below.
Table 3: Factor analysis
Variables Factor
1 2 3 4 5
C1: Entity published changes and adjusted retroactively
items due to changed accounting policies and adjusted
retroactively items due to material misstatement updates
from previous period.
.741 .037 .133 .280 .197
C2: You adequately explain the changes in accounting
policies and their implications for the appropriate balancing
entries in your notes and adequately explain the error
corrections and their implications on the appropriate
balancing entries.
.631 .282 .152 .517 .017
C3: The information presented in the Notes are comparable
from period to period. .739 .143 .235 .068 .172
U1: The information presented through notes, the annual
report on operations, accounting policy are well organized
and presented (in terms of content, structure, cross links...)
.609 .191 .426 -
.329
F4: Presented strategy, values, risks, policies, risk
management, assessment of expected future development,
objectives, and policies of a legal entity are connected to
the management financial risks, activities with related
parties, accounting the financial performance of the
company are in accordance with the real state?
.318 .765 -.010 .222 .182

301
F5: Published non-financial information corresponded to
the published financial information contained in the annual
reports and adopted accounting policies.
.189 .844
.189
.156
.064
R2: Non-financial information (such as the views of
business, strategic/operational goals, business opportunities
and risks) complement the presented financial information?
.076 -.048 .737 .323 .222
R3: The additional disclosures in the Notes in connection
with the transactions with related parties (e.g. about related
parties, the criteria of connection revenues and expenditures
during the period, receivables and commitments from the
previous period, etc.) are useful for different interest
groups.
.141 .082 .837 -.171 -
.045
F1: Are explained in the notes/presented significant
assumptions and estimates that were used when drafting
financial statements?
.397 .228 .612 .306 .011
F2: Summary of the accounting polices and an explanation
in connection with the choice of accounting policy is given
a in your Notes?
.259 .251 .179 .622
.423
F3: Entity presented significant business events (with
negative and/or positive outcomes) in its annual reports. .198 .145 -.027 .811
-
.012
T1: Deadline for the presentation of financial statements
(28.2.) and operations with related parties (30.3) in relation
to in relation to the reporting period (31.12.) from the point
of view of interested users is appropriate?
.063 .043 .102 .089
.877
Source: Author’s calculation
Table 4: Loading Factors
Factors N Variables correlated
to factor
Cronbach’s
alpha Mean Std. Dev.
1: Change in accounting policies
(CAP) 49 C1, C2, C3,U1 0.854 3.404 0.155
2: Fair presentation and
comparability of nonfinancial
information (FPC)
49 F4, F5 0.824 3.435 0.095
3: Integration of financial and non-
financial information in the annual
reports and clarity of estimates and
assumption (IIR)
49 R2, R3, F1 0.711 3.993 0.307
4: Neutrality and predictive ability of
the annual reports (NPR) 49 F2, F3 0.660 3.565 0.000
Source: Author’s calculation
302
4.4. Hypotheses testing
Multikolinearity
A multivariate analysis of the outlier discovery involves analyzing the multidimensional position
of each variable in relation to some common points (Hair et al., 2010). The Mahalanobis D2
method is used to measure the distance of each observation in a multidimensional space relative
to the center of the mean values of all observations, counting the value for each observation
regardless of the number of variables. The value of Mahalanobis D2 / df was calculated and the
threshold used was 3.50 (Hair et al., 2010, p. 67). The table with the results of the Mahalanobis
method of the outlier detection is given in Appendix A. The multivariate analysis did not show
the existence of an outlier. Based on the results of these analyzes, all observations are retained
and will be subject to further analysis.
Also, the Mahalanobis Distances score is considered and it does not exceed a critical value.
Based on those results, it is possible to confirm that there are no outliers.
Normality
The data were tested on the assumption of normality using measures of skewness and kurtosis.
For approximately normal distribution, the skewnes value should be close to 0, and the Kurtosis
value is close to 3. Skewness measures for all variables are negative (Appendix B), which means
that the distribution of data is shifted to the right (Hair et al., 2010). there is not much deviation,
and we can use regression.
Homogeneity
Homogeneity relates to the assumption that dependent variables show equal level of the variance
for all analyzed variables (Hair et al., 2010). Homogeneity was tested by using Breusch-Pagan
test whose zero hypothesis is the existence of homogeneity. After conducted regression according
to this test, the result -square .665 was obtained. Hence, the model explains 66% of the variance
meaning that zero hypothesis cannot be rejected. In other words, the results suggest the
homogeneity of the data.
Kollinearity
However, in the analysis of collinearity, it is necessary to take into account the interconnection of
the abilities that are the subject of this research. Collinearity was tested by calculating the
variance inflation factor (VIF) for each of the predicate latent variables (Hair et al., 2010), after
which the values obtained were compared to the defined maximum threshold. The threshold
value of VIF in this work will be 10. This is in accordance with the attitude of Hair et al. (2010,
p. 204) who claim that the usual threshold of the VIF is 10.
Multiple regression modeling was conducted to test the hypotheses proposed by this
study. The Table bellow presents the results of the regression modeling.

303
Table 5: Regression Analysis Results
Model Hypotheses Parameters
Estimates R
2
M1 CAP → FPC 0.561* (0.101) 0.405
M2 CAP → FPC
IIR → FPC
0.447* (0.109)
0.375* (0.166) 0.467
M3
CAP → FPC
IIR → FPC
NPR → FPC
0.342* (0.126)
0.320*** (0.166)
0.196 (0.121)
0.497
Source: Author’s illustration
Standard errors are reported in parentheses.
*, **, *** indicates significance at the 99%, 95% and 90 % level respectively
The R-squared or the coefficient of determination for the model is 0.497 which means that
49.7% of the variables in FPC are determined by the predictor variables (perceived easy to use
and perceived usefulness) while 48.8% of the variation is caused by some other factors that are
not examined in this study.
We can conclude that the quality of adopted and applied accounting policies is directly
related to the quality of financial reporting. Also, the content and manner of publishing non-
financial information (IIR) affects the quality of financial reporting at the level of significance p
<0.1. Neutrality and predictive ability of annual reports (NPR) has a positive impact on the
quality of the financial statements that manifests itself in a fair presentation of the decision-
making information (FCP), but it is not significant. However, it can be concluded that it
contributes to the model by increasing R2.
Regression results showed that there was a statistically significant positive relationship
between Change in accounting policies and quality of reporting (presented throw the Fair
presentation of financial and non.finacial informations in annual report) as well as positive
relationship between Integration of financial and non-financial information in the annual reports
and clarity of estimates and assumption and quality of reporting. Regression equation can be
presented as:
FCP = 0.474 + 0.342 * CAP + 0.320 * IIR + 0.196 * NPR + ↋
5. Conclusion
This research contributes to understanding the perceptions of qulity of reporting legal entities in
BiH. The accounting policies have a special importance for the quality of the financial
statements. In this regard, the following hypotheses is proposed:
H1: Change in accounting policies is positively related to fair presentation of financial report
and nonfinancial information.
304
H2: Integration of financial and non-financial information in the annual reports and clarity of
estimates and assumption is positively related to fair presentation of financial report and
nonfinancial information.
H3: Neutrality and predictive ability of the annual reports is positively related to fair
presentation of financial report and nonfinancial information.
We conducted exploratory factor analysis and presented four loading factors as following:
1: Change in accounting policies (CAP)
2: Fair presentation and comparability of nonfinancial information (FPC)
3: Integration of financial and non-financial information in the annual reports and clarity
of estimates and assumption (IIR)
4: Neutrality and predictive ability of the annual reports (NPR)
We tested hypotheses in respect to multikolinearity, normality, homogeneity and kollinearity.
Multiple regression modeling was conducted to test the hypotheses proposed by this study.
We concluded that the quality of adopted and applied accounting policies is directly related to the
quality of financial reporting. Also, the content and manner of publishing non-financial
information (IIR) affects the quality of financial reporting at the level of significance p <0.1.
Neutrality and predictive ability of annual reports (NPR) has a positive impact on the quality of
the financial statements that manifests itself in a fair presentation of the decision-making
information (FCP), but it is not significant.
So, we can conluded that it was found that both Change in accounting policies and Integration of
financial and non-financial information in the annual reports and clarity of estimates and
assumption intentions to usefulness of reporting of legal entities in the FBiH.
Literature
Cosset, J., & Suret, J. 1995. Political risk and benefits of international portfolio diversification.
Journal of International Business Studies, 26(2): 301-318.
Nirupa P., Waren M. & Lucien O. S. The usefulness of south African annual reports as at january
2010. Journal of Economic and Financial Sciences | JEF | April 2014 7(1): 35-52.
Stanisic, M., The role of the Audit Committee in the control of the integrity of the financial
statements, Tax Advisor 2/16, Revicon, 60-67.
Belak V., Balanced Scorecard in the planning and monitoring of business results, Accounting,
Auditing and Finance number 11/05, Zagreb, 2005.
Piljic J., Business Reporting, Tax Advisor 4/16, Revicon, Sarajevo, 2016.
Bonic Lj., Affirmation and basic postulates of business reporting, Economic issues, No. 5/04,
University of Nis Faculty of Economics, Nis
Piljic J., Analysis of financial statements - The influence of the choice and application of
accounting policies on the financial position and performance of the business of the
company, OFF-SET, Tuzla, 2012.
Piljic J., Ethics as an assumption of objective financial reporting, Tax Advisor 1/17, Revicon,
Sarajevo, 2017.
305
Salihovic, A. Amended IAS 1: A Guide to the New Balance Sheet Form, Tax Advisor 5/17,
Revicon, Sarajevo, 2017.
Masic, M. New Accounting Directive EU, Tax Advisor 7-8/13, Revicon, Sarajevo, 2013.
Piljic, J. Reporting on Intellectual Capital and Non-Financial Performance, Tax Advisor 11/11,
Revicon, Sarajevo, 2011.
Piljic, J., Financial Reporting and the Process of Harmonization in International Accounting, Tax
Advisor 12/17, Revicon, Sarajevo, 2017.
Ramljak B., Financial Reporting and the Process of Harmonization in International Accounting,
Tax Advisor..., https://bib.irb.hr/.../524444.B._RamljakRacunovodstvene_politike.doc
Ramljak, B. Accounting Policies in Small Enterprises, Doctoral Dissertation, Faculty of
Economics, Split, Split, 1999.
Svigir, A. Accounting policies and their impact on business and tax returnst, RRIF, br. 12/09,
Zagreb, 2009.
http://www.europarl.europa.eu/sidesgetDoc.do?type=TA&reference=P7-TA-
20130261&language=EN&ring=A7-2012-0278#top
http://eur-lex.europa.eu/LexUriServ/LexUriServ.do?uri=OJ:L:20 13:182:0019:0076:EN:PDF
http://europa.eu/rapid/press-release_MEMO-13-540_ en.htm?locale=en
306
THE EFFECTS OF RELIGION ON CONSUMER BEHAVIOUR IN INSURANCE
Jasmina Selimovic
Ekonomski fakultet Univerzitet u Sarajevu
Trg oslobodjenja – Alija Izetbegovic 1
Tel.: ++ 387 33 275 906; Fax: ++ 387 33 275 900
E-mail: [email protected]
Dzana Hurko
Tel.: ++ 387 33 667 509; Mob: 061 928 066
E-mail: [email protected]
Abstract
There are many indicators that effect or can effect the purchase of insurance, including religious
beliefs. Religious interpretations of insurance never had only one answer, only one interpretation.
Some are sharply opposed to insurance and considered to be a lack of faith in God while others
have an opinion that only life insurance is forbidden. There si also a third party whose
interpretation is adjusted to a modern time they live in. Through the development of society risks
got bigger and that changed many of the previous interpretations of religion when it comes to the
purchase of insurance. However, in developing countries and countries that have emerged from
war conflicts like Bosnia and Herzegovina, there is a return to religion because religion is often
confused with nationality. This paper examines if and to what extent religious beliefs affect
consumers in Bosnia and Herzegovina on their decision to purchase insurance.
Key words: religion, religious belief, consumer behavior, insurance, purchase
JEL classification: G22
1. Introduction
The relationship between religion and insurance is still a controversial topic. There are so many
different opinions on the scale from complete ban to incitement. In this paper we will see how
and why religion and insurance have appeared and how they develop. Religion has historically
had a negative attitude towards insurance, especially to life insurance - many religious
interpreters claim that buying insurance policies is a loss of faith in the protection of life provided
by God.
There are many factors that, to a major or minor extent, effect the purchase of the insurance
policy, one of them is religion (Satrovic, 2018; Satrovic and Muslija, 2018). Here we will
elaborate the views towards insurance that three most influential religions of the world have.
Those are: Christianity, Islam and Judaism. Islam is the strictest when it comes to insurance,
however, Islam has produced Tekaful - Islamic insurance, according to Sharia principles. So, it is
certain that Islam understands the basic idea and the need for insurance.
We will make a comparison of classical (commercial) and Islamic insurance. We will see what
kind of role religion plays today in modern society, whether more or less than before and what
are the tendencies. We will investigate if and to what extent does religious beliefs really influence

307
the purchase of the insurance policy in the life of people in 21th century. In order to obtain as
much information as possible about the influence of religious beliefs on the purchase of the
insurance policy, we did a survey, a research whose results will be shown later.
2.The occurrence of religion and insurance
Both religion and insurance, in their original, early, primitive forms, had great influence on
people and their development. There is a lot of definitions of religion, but a definition that
examines the essence of what religion is and what religion provides to believers is that religion is
a set of answers to existential questions (Scheve and Stasavage, 2006). These questions, every
human being is faced with sooner or later, what is the reason we exist, what is our purpose and
role, what do we do here, why this really happened, could it be different or it must have been the
way it was and we can do nothing to change it.
The role of religion is to distinguish good from the bad, to instruct how to behave and what is
forbidden, what is morally and what is not. It can be said that religion was a product of the human
mind as a protection against everything that made people insecure and frightened. Religion itself
was light in the dark and a right way through unknown streets of life. People always turn to God
when is the hardest, as an exit, as a salvation. Religion has made mankind secure. Thus, a
spiritually secured man is difficult to decide on the purchase of an insurance policy. He believes,
he is protected by God and no one or nothing can harm him.
If an accident comes, it is from God and God will help and provide salvation. After all, whatever
happens to us is given by God, it is God's determination and we should accept it. This is an ideal
of faith and belief, and it could take place when everything goes the way we want it, when we do
not meet problems or if we are absolutely immune to all the problems and all external factors
which is impossible because we are just human beings. The reality is that we face different
challenges on a daily basis, problems that we do not accept so easily, we struggle and we are
trying to find a solution. As society grew more and more, as society develop, there were more
and more challenges to face.
When, for example, a man began to trade, and by transporting goods on ships, he noticed that all
ships did not arrive at the final destination and that the merchant whose ship had had the least
luck loses everything. Realising that, a man came up with the idea that he could reduce the risk,
distribute the goods to all ships. In that case, if an accident happens, all merchants share a loss
which is smaller now and will not jeopardise their business, they shared solidarity.
Life insurance provides benefits, there are laws that ensure it, while religion is based on
assumptions. The occurrence of insurance has made great progress for people, facilitated their
daily work, reduced loss, reduced stress, improved work and improved life. Religion remained,
but man realized that he could not only trust in God, because he had the experience to see that the
accidents were happening, so he had to do something to help himself, to think about his future, to
come up with the plan if something bad happens.
All religions promote helping someone in need, who is going through a difficult period, before
the occurrence of classical insurance, people - members of the same religious community (this is
the most common in Christianity) have been organized to collect funds for their member in need.

308
This also strengthened the sense of religious affiliation because believers knew that they could
count on the church to provide them with the necessary material, financial and emotional support.
That assistance was delivered directly from the church, from religious community. For this
reason, more religious people were less likely to buy classical insurance, not because insurance
was forbidden, but because they organized in their religious community something that was the
real practice of insurance - collecting money for people in need. What insurance does - it
provides assistance or financial protection when we need it most, either in case of fire, flood, car
theft, loss of a family member, serious illness, travel... Of course, it is not a free help because we
actually buy it in advance. We had to give something away when we had the opportunity for that,
so that we could get help at the right time. All religions encourage believers to secure the future
in the sense of securing their offspring a beautiful life, not leaving them in poverty. All of this
leads to the insurance we know today.
2.1. The appearance and development of religion
Religion appeared when a man realised that many things happen outside his control, that he can
not influence them, these were natural phenomena: rain, wind, thunder, lightning, floods,
droughts, heat, cold... To explain themselves that, people began to believe that there is something
supernatural, an upper force, something that has the power to rule over nature and over humans.
People from the beginning believed in something, first in some supernatural force, then in the
ghosts, then in several Gods and ultimately in only one God. Chronologically there are four forms
of religion: animism, toteism, polytheism and monotheism. Monotheism is a modern form of
religion, a belief in one God. These religions are widespread throughout the world, each has its
founder. Religion has a task and should provide peace and consolation through faith. There is
also a different division of religion, to the religious or ascending, which were created by people
and descended or published by God, which are Judaism, Christianity and Islam. Each religion has
its own history, place of origin, founder, holy book, rituals, prayers, morality.
Religion is not based on human views and their opinions and attitudes but in God's Word in
sacred books. Religiousness is a subjective, indivudual relationship to God. Today religiosity or
religious beliefs do not effect the behavior of man, man decides what he wants and what he will
not accept from religion, he decides whether it is good or bad for him. The influence of religion
in the modern world is weakening. With the economic development of the country, this is more
noticeable.
In developing countries and countries that have emerged from war conflicts, religion has more
power and that can be a source of conflict, but it all speaks about the underdevelopment of the
country, about poverty and low awareness in education both basic and financial (Satrovic, 2017).
What is significant for this region – Balkan, is that during the former Yugoslavia, in the era of
socialism and communism, religion was rather suppressed from life, from society. So, there was a
secularization that is defined as the human liberation from mythical, religious thinking. The
development of science has declined the influence of religion. Secularization in the modern world
is most often interpreted as something positive, man becomes free, religion is excluded from life.
Science rejects belief in upper power and everything that can not be neither proven nor explained.
Science has actually given explanations for the phenomena that led the ancient people to believe
in a higher power because they could not explain rain, thunder, wind etc. What is noteworthy is
that, as people are less educated, they are more religious and they absolutely respect and do

309
everything that religion prescribes. In Bosnia and Herzegovina, a large percentage of the illiterate
population, most of whom are familiar with the Arabic letter, are reading the Qur'an, because
people didn't let their female children, after completing four grades of primary school, to continue
their education. They were fearing that school and society might "spoil" them. More educated
people tend to read different literature, a higher level of education is giving people wisdom and
they tend to think more, they have more understanding and tolerance for the different and
„other“.
Ofcourse, this does not mean that educated people are not believers only because they understand
much more what religion actually is, because they live in accordance to modern times and make
their own decisions about whether something is good or bad for them. The war has made people
turn to nationalism, to identify and connect religion with the nation, to hate people who are not
the same religion and nation as they are. The breakdown of socialism and the former Yugoslavia
has restored traditional religiosity in all countries to which Yugoslavia divided. There has been a
desecalization of religion, which is still widely used today for political purposes. "Religion is
most effective in times of crisis, difficult times, there is a Latin proverb - Res adversae admonent
religionem, which means that disaster encourages religion."16
Religion was a refuge from the
horrors brought by war in this area. Also, with the democratization of society and freedom of
manifesting religion - the religiousness that may have been suppressed by communism – has
grown stronger. Religion nowadays has a much bigger significance compering it with a period of
former Yugoslavia.
Today, many societies are deeply religious. Religion has not lost significance in the modern
world, it has a special place in the life of man in 21th century who is facing the increasing
challenges in modern society and time, new technologies, an accelerated lifestyle, alienation,
increasing social differences among people, terrorism and distrust. Religion is a shelter in
challenging times but religion, in order to survive, will have to adapt to the modern way of life.
This will make life easier for a man who is torn between modernism and tradition. Much has
changed to this day and, accordingly, the interpretations of religion must be more flexible and
adjusted to the time when interpreted.
Currently, the largest religion in the world is Christianity, with about 2.1 billion people or 32.5%
of the population. However, some research shows that Islam is the fastest growing religion and
that by 2070, it could be the number one. Today, around 1.5 billion Muslims live in the world and
that is about 23% of the population. Atheists, people who do not believe in God, have about 1
billion and take 16% of the population. Beyond Islam, the largest is Hinduism (about 900 million
believers), then China's traditional religion (about 800 million believers), Buddhism (500 million
believers), followed by popular and traditional African religions. In this paper we will deal with
Christianity, Islam and Judaism as the three most common religions in Bosnia and Herzegovina.
Judaism - the Jewish community, has been held up to this day in Bosnia and Herzegovina, where
they arrived at the end of the 15th century after the persecution from Spain. There are not many
of them (about 1000 believers), but in Sarajevo there is a synagogue and a Jewish cemetery that
talks about their long-standing presence. But it should not be forgotten that Judaism is valid for
the oldest religion in the world and that it is believed that the Jews survived so many years in
spite of all the persecutions and extermination attempts due to the strong faith that binds them.
16
Bakrač V. (2012) Religiousness of youth in Montenegro - Dissertation, Belgrade University, p.108-111

310
Judaism is also one of the most influential religions in the world. For these reasons we have
included Judaism in research.
2.2. Occurrence and development of insurance
"Insurance has two basic features: transferring or shifting risk from an individual to a group and a
loss distribution to all members of the group."
"Insurance represents a method of transferring a risk to an insurer that assumes the obligation to
compensate for potential losses from a fund formed from the collected insurance premiums."
People were aware of the importance of risk sharing in the ancient times. In China, 3,000 years
ago, merchants who carried goods to ships knew that not all ships would reach the destination.
For this reason they made a plan - they distributed goods to all ships, so when the ship gets
destroyed they all share a loss, not just an individual, an unfortunate one, whose goods traveled
precisely on that ship that was unable to reach where he needed it.
Fire protection had its beginning in Germany in 1591 when a Fire Protection Association was
established - Fauer Casse. However, the most powerful development of fire insurance takes place
in 1666 in London when a huge fire burning the city for five days. Recognizing the importance of
fire insurance, English doctor, Nicholas Barbon, was the first to enter the job of securing newly
built objects from fire.
When we talk about the oldest form of accident insurance, it is insurance against accidents. Since
1848, the protection of rail passengers has been sold in Great Britain. In 1886, the first insurance
policies for liability covered the employer's responsibility towards the employees.
In 1898, the car insurance policy was first issued in the United States. Reinsurance appeared for
the first time in maritime insurance.
The development of life insurance is also related to maritime traffic in order to be able to pay off
the ransom in case of capturing. These were short-term insurance policies because the long-term
needed accurate estimations of the death of the insured. The first life insurance policy was made
in 1536 and in 1693 the first mortality tables were made, which were based on statistics of deaths
in the period from 1687 to 1691.
In the 18th and especially in the beginning of the 19th century, insurance is increasingly
developing, actuarial charts begin to apply. It should be noted that at that time, James Dodson
(1705-1757), a British mathematician, studied life insurance and laid out the basic principles for
life insurance.
In modern business and operating conditions, the insurance industry is a very important economic
activity that provides protection against risks, provides security and protection of capital. Risk is
a daily part of life, it is always there, we live with it, we work with it, and it is therefore very
important that safety is treated as a priority, to use insurance, but also to take all necessary actions
to ensure that the insured case does not happen.

311
3. The attitude of religion about insurance
Religions or religious interpretations versus insurance never had only one answer, nor only one
interpretation. This topic is quite controversial precisely because of the different interpretations.
These interpretations have changed through history. Some were sharply opposed to insurance and
considered him to be an unfaithful act that ceased faith in God, others considered that only life
insurance was forbidden until the third party think that we should adjust interpretation to the
modern times in which we live and do not consider insurance as the opposite of faith. Insurance
attitudes have changed over time, as science and technology have advanced, the world has
become more and more modern, the huge difference between the past and the present, how
difficult it is to imagine what is waiting for us in the future, so insurance is becoming a necessity
and religious interpreters are becoming more and more tolerant towards insurance by seeing its
good sides. Indeed, the goal and effect of insurance is what religions propagate - care for the
offspring, for children, family protection. These are the values which all religions are based on -
the family always comes first.
In prehistoric times, the man was a hunter who hunted for his family to bring lunch. With the
development of society, a man no longer goes hunting, but today he has more stress than before,
making it harder to make money and bring bread to his family's table. Nowadays, people more
often get sick from various diseases, no matter how old are they, insurance has become a need, a
relief, a help, a tight sleeping. It is clear that the Holy Books do not directly refer to insurance but
people make conclusions by studying them and hence different interpretations. Below we will
examine what are the interpretations of today's biggest and most influential religions about
insurance.
3.1. Christianity about insurance
The Church did not support the purchase of life insurance, it was considered incompatible with
the belief in God and His preaching. Although the Bible does not directly talk about insurance,
the various authors in their own way emphasized as inadmissible and interpreted the texts of the
Bible in their own way and justified their claim. In 1860, Roswell F. Cottrell, a prominent author
and believer, claimed that the text in the Bible: "The one who hates safety is safe" means that any
kind of insurance is forbidden. God has obliged Christians to study the Bible and come to their
own religious beliefs on any issue that is not explicitly stated in the Bible. They need to wonder if
a family foster dies, who will take care of family? Will the family with the death of a family
member remain without resources and be confronted with a financial disaster? Will the family in
that case be forced to take help from others and be dependent on others? On all these questions,
Christians should give their own answers in order to reach their own personal opinion. However,
with development of society, the risks grew, and a large number of risks changed many of the
opinions, the previous interpretations of the Bible were corrected so that the property insurance of
fire, storm and theft was accepted and allowed. Also a new interpretation was launched that the
insurance of assets differs from life insurance and is not prohibited. Life insurance was still
considered contrary to Christian principles, God is the one who will provide and promised the
immortal life of the soul. Every believer needs to know that what is not explicitly stated in the
Bible, allowed or prohibited, requires that each Christian examine, analyze, and take his stand. In
addition, as the believers say, they should ask God to show them the right way, to show them
how to act. Bible principles should guide the Christian and they say that the law is respected - so

312
if the law requires insurance, then it should be taken and it is not disobedience to God. God has
ordered man to take care of his family, that care can be insurance and should be taken. Purchase
of life insurance can be interpreted and acceptable from God as pre-planning, as a concern for the
family if the early death of the foster family occurs, if illness happens etc. But it can also be
interpreted as a lack of faith, disbelief in God's protection, love for money and gambling.
Christians should develop their personal opinion if something is or is not in accordance to Bible.
We should appreciate the beliefs of others, but our own beliefs are more important than others.
From this it follows that different people - believers will come to different beliefs, everyone has
the right to his own opinion and his conviction, his explanation. Everyone is responsible for his
actions. Everyone will die and sometimes people get sick. That is why people have been saving
money for an old age and illness, and in the event of an early death, they leave something to the
family, to care for them and not to be considered unbelievers, but they have fulfilled the
obligations God has given them, family care. It is a wise management of money and has nothing
to do with distrust in God. True believers live responsibly towards God and do not wait for a
miracle to happen and give them everything they need. Believing that God will care for man does
not mean that man does not need to take care of himself. People should act in a responsible way.
When the insurance is properly used, it can help the family in illness or disability, it can help the
family due to the death of the family's survivor to continue living, and when it comes to property
insurance, compensate for the damage caused by natural disasters or burglary. God wants the
family to be protected and every Christian is obligated to provide the family. Life insurance gives
peace to a man that his family will be secured, that he will not depend on others if something
happens to him. Buying insurance is not a belief in God, but smart planning and preservation of
property, protection of property from various risks, and God requires believers to take care of
their family and property, to provide the financial means with which the family can continue to
live if something happens to him . Planning the future is not a sin. Illness, accidents, fires, natural
disasters and disasters require a lot of money if they hit a person and their consequences can be
minimised by insurance. Religious beliefs of some people go so deeply that they believe in the
spiritual belief that God will protect them all, and when an accident happens, they are willing to
accept the help of other people, rather they will depend on others than to take insurance.
Insurance is not a protection against death, it does not prevent death or disease, insurance
provides compensation, costs that can arise and which can not be paid, ensures that the family
gets on their feet if something happens to the foster. The Bible speaks about the need for saving
for the future and teaches that saving money is a wise practice.
There is a lot of examples in practice where Christians are convinced that life insurance is a smart
planning that many families have saved from hunger and poverty after the illness or death of a
family member. The insurance helped them to continue to live and give even greater faith to God
by believing that God showed them how to act and that they were provided with the guidance of
God. Ofcourse, there is the other side when the Christians were not ensured, when they were left
without anything, they again consider that it is all from God and will later be rewarded for this
suffering and consider that they have acted right because their belief is that God forbids
insurance, prohibits any protection except His.
3.2. Judaism about insurance
Judaism does not even have any controversy or discussion on this subject, the answer is one and
clear - Judaism allows insurance, it is believed that, like everything else, insurance is given by
God. Maybe it has to do with the fact that the Jews have always been traditionally businessmen,
313
always at the top when it comes to finances. For Judaism insurance is a legitimate job, a financial
plan that is even welcome and desirable as it shows concern for the family and in no way
diminishes faith. It is believed that God gave humanity a clever idea of establishing insurance for
their welfare. Believers trust in God that He will provide them with money to pay the premium of
insurance. People seek and receive protection from financial loss through insurance. Jews even
collected money to secure city fortresses and walls as a contribution of every citizen to protect
their city. The Jews always had a strong sense of community, and their religion was always kept
strong. This practice exists today and Jews pay money as a donation, a contribution to the
insurance of the Jewish community.
They know that people without adequate health insurance have a higher mortality rate than those
who have insurance. So, insurance is also important for the survival of the Jewish community.
They are aware that when a foster family dies, his children and wife remain without any
protection and fall under the burden of the community, and that is why interpreters of Judaism
encourage life insurance that means protecting the family what God wants and supports.
3.3. Islam on insurance
Insurance in Islam has been known since the life of Prophet Muhammad and it was part of the so-
called Medina Constitution. It was used in situations where there was insufficient funds to buy
prisoners or pay for bloodshed. The necessary funds were often much higher than what the
borrower was able to pay. Solidarity insurance was introduced for these purposes where the
members of the tribe to which the debtor belonged had taken over the debt repayment. The
insurance was organized by the state, based on solidarity with the aim of helping the vulnerable
side. What is important to point out is that this insurance had no commercial motives, while
today's insurance companies were founded with the goal of earning profit.
We have many different opinions about commercial insurance. The first opinion is that every
type of commercial insurance is banned (haram). They identify insurance with gambling and
lottery. They are opposed to insurance because of the uncertainty or the unknown final outcome
of the contract that is forbidden in Islam. Furthermore, as stated in the interpretation "someone
loses and someone gets" - they find that the value one side loses the other gets. If damage occurs,
the insured 'wins' because the paid premium is normally less than the amount of the damage paid.
On the other hand, if no damage occurs, the insured loses his paid premiums. It can be noticed
that when one party gets one, the other one must always lose. Who will be in this contract will be
the winner depends on the probability of whether the security case will happen. "So, the first
interpretation discards any type of commercial insurance, both life and non-life. The second
opinion is completely opposite to the first because this group of people consider that the
insurance contract is a modern contract, adapted to the modern way of life, and as such is not
explicitly mentioned anywhere, and therefore is not prohibit in Sharia regulations.
The third opinion is that only life insurance is prohibited. In non-life insurance, the goal is
security and protection, for example, the cost of water spillage in property insurance or the cost
of car repairs in car insurance policy. Non-life insurance is permitted in the opinion of these
scholars, because there is a justified need for this type of insurance. Life insurance is forbidden
because the ultimate goal is money and profit (interest).

314
Islam does not accept contracts with elements of uncertainty, and insurance contract is considered
to be that, it is not certain whether the insured event will happen. In Islam these contracts are
called garar, they are uncertain for both sides and therefore are forbidden. The insured pays for
something that may never happen – it is uncertain, he pays a service whose usage is uncertain.
Since the insured knows if insured case happens he will receive compensation, than can
encourage him to cause damage and thereby deceive an insurance company to pay him damages
that are not in accordance with Islam. Otherwise, Islam believes insurance contracts contain
interest, fraud, gambling and insecurity which is also prohibited. Interest in Islam is forbidden,
and that is why so many people believe that life insurance is a sin. Interest is mentioned explicitly
in the sacred book of the Qur'an as a sin and ban where curses are given by those who give
interest, interest rates, witnesses and recorders of the interest contract. In Islam, interest is
regarded as unlawful enrichment on someone else's misfortune, interest is injustice - "eating
another's property" (En-Nisa, 161).
Some scholars consider that insurance is weakening and losing faith in Allah, because everything
that happens is will of Allah and vain people try to be protected by insurance. They believe that
one should only rely on Allah, in His grace and giving. However, it is mentioned in the Qur'an
that Muhammad one day met a man whose camel run away because he did not bind it. He asked
him why he had not binded a camel and the man replied, "I trust in Allah" to which the Prophet
said: "First you bind a camel and then trust in Allah."
This story tells us that a person must do something to help himself and one of the things he can
do is an insurance policy to secure and protect his family, not leave them without anything or
worse with loans and debts. Some scholars think that men must adapt to the time in which they
live, the challenges and needs of today, and insurance is certainly the way to do that. Everything
can be interpreted in many ways, and insurance is not explicitly mentioned anywhere in the
Qur'an, so it remains for every individual to make his own decision. It is true that Islam is the
strictest in terms of insurance comparing to other religions, because insurance contracts contain
many prohibitions in Islam that we have discussed above.
3.3.1. Alternative: Islamic Insurance - Tekaful
Islam has developed an alternative to classical insurance, whereby Islam as a religion is unique.
Yes, commercial insurance is prohibited but the good side of insurance is recognized. The
prohibited cathegories that are part of the insurance are evicted and insurance does not conflict
with the principles of the sharia and at the same time meets the basic purpose of insurance.
Tekaful as a model of insurance, Islamic insurance, is based on mutual guarantee.
In Islamic insurance, profit is not the most important, they put first: solidarity, help, honesty,
social responsibility. Islamic finance companies would never engage in profitable but immoral
jobs that could harm society.
3.3.2. Appearance, development, idea
Islamic insurance was derived from the customs that Arabian tribes had in the case of murder. If
a member of one tribe was killed by a member of another tribe, the family of the one who
committed the murder paid some sort of compensation for the blood that was spilled, for the loss.
315
The last Prophet of Allah, Muhammad, supported this practice of Arab tribes. All tribes
participated in collecting money intended for damages, in the event of unintentional murder. It
was a way of mutual help, solidarity in an accident. Traders from Mecca had the practice of
organizing funds to compensate travel losses as well as mutual assistance in natural disasters. In
the Ottoman Empire there were maritime insurance in the 18th century.
In the past twenty years, many Islamic insurance companies have been established in the Muslim
countries, but also in other countries of the world. Islamic (Tekaful) insurance was the most and
the fastest developing in Malaysia and then in Singapore, Indonesia, Iran, Qatar, Egypt, Jordan,
Kuwait... What is particularly interesting is that Great Britain, a non-Muslim country, has become
today's largest Islamic finance center, which includes Islamic banking and Islamic insurance. The
Islamic insurance market has an annual growth of 20% while conventional insurance has an
annual growth of 6-8%. Islamic banking and Islamic insurance became an excellent alternative to
the conventional banking and insurance due to its principles, ethics and trust it enjoys, especially
in last financial crisis.
3.3.3. Similarities and differences between Islamic and commercial insurance
The key difference between commercial and Islamic insurance is in interest. In Islam, interest is
forbidden. Furthermore, the significant difference is that Islamic insurance is based on mutual
help - helping others is the primary goal and purpose. Companies dealing with Islamic finance
are extremely socially responsible. Solidarity is strongly expressed, and what is specific is that
both insurance and the clients share the risk and take responsibility for unsuccessful projects.
Commercial insurance is based on a contract whereby the insured pays the insurance premium,
and the insurance company pays compensation in case of occurrence of the insured event,
compensating the damage. The insurance company collects premiums. The goal is profit that
Islam does not support.
In the case of classical insurance, the insured pays a premium in order to receive compensation
from the insurance in case of damage, but the damage does not have to happen, it is uncertain,
and Islam does not allow contracts that are uncertain.
Insurance companies, collecting funds from premiums, are able to invest, invest in local
communities and allocate financial resources within the country to stimulate its economic
development. Insurance companies are considered to be the strongest institutional investors, play
a major role in the development of the financial sector, and through it to the development of the
entire economy of a country. In classical insurance, there are no restrictions in terms of investing,
it is a decision of insurance company and is based on profitability, while Tekaful insurance is
allowed to invest only in halal activities without interest.
Tekaful is based on the principle of mutual assistance (Ta-awun) which is a donation (tabarru).
For tekaful insurance, there is a fund of insurance in which no premium is paid, but donations.
Donations are exempt from interest, in fact, complete business is without interest, because
interest is forbidden in Islam. Payments are considered an attachment-donation and are paid by
the insured into the donation fund and at the same time they are the owners of that fund..
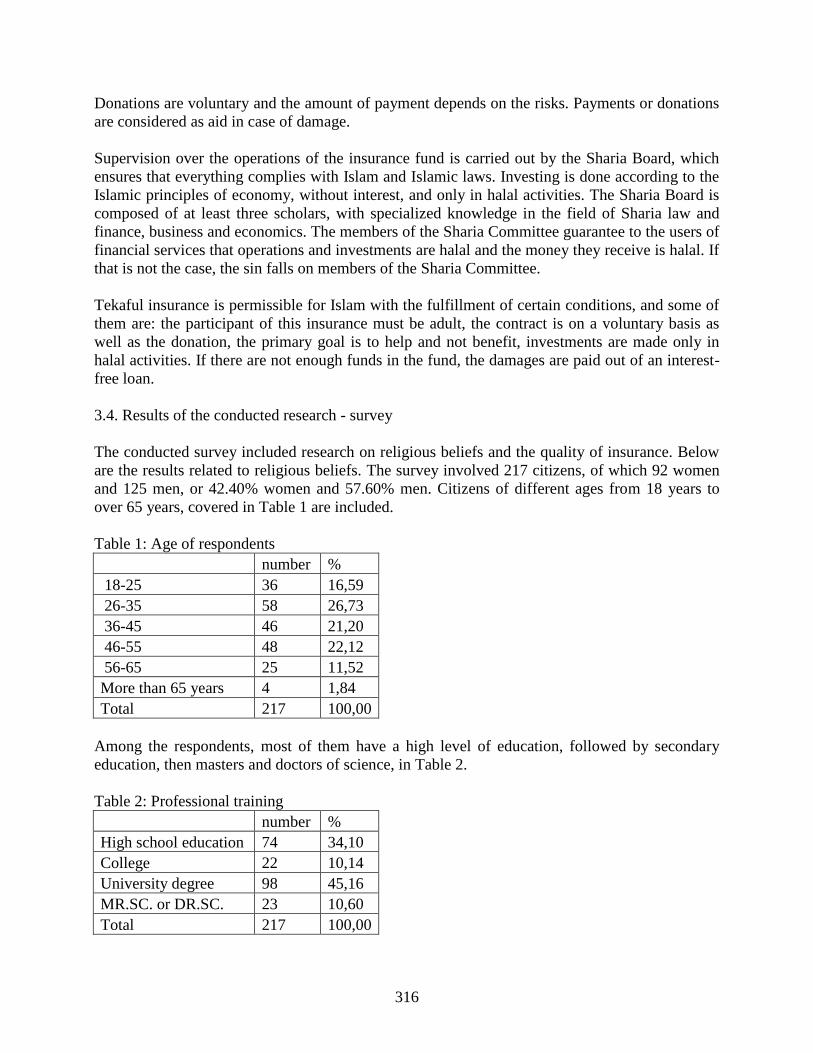
316
Donations are voluntary and the amount of payment depends on the risks. Payments or donations
are considered as aid in case of damage.
Supervision over the operations of the insurance fund is carried out by the Sharia Board, which
ensures that everything complies with Islam and Islamic laws. Investing is done according to the
Islamic principles of economy, without interest, and only in halal activities. The Sharia Board is
composed of at least three scholars, with specialized knowledge in the field of Sharia law and
finance, business and economics. The members of the Sharia Committee guarantee to the users of
financial services that operations and investments are halal and the money they receive is halal. If
that is not the case, the sin falls on members of the Sharia Committee.
Tekaful insurance is permissible for Islam with the fulfillment of certain conditions, and some of
them are: the participant of this insurance must be adult, the contract is on a voluntary basis as
well as the donation, the primary goal is to help and not benefit, investments are made only in
halal activities. If there are not enough funds in the fund, the damages are paid out of an interest-
free loan.
3.4. Results of the conducted research - survey
The conducted survey included research on religious beliefs and the quality of insurance. Below
are the results related to religious beliefs. The survey involved 217 citizens, of which 92 women
and 125 men, or 42.40% women and 57.60% men. Citizens of different ages from 18 years to
over 65 years, covered in Table 1 are included.
Table 1: Age of respondents
number %
18-25 36 16,59
26-35 58 26,73
36-45 46 21,20
46-55 48 22,12
56-65 25 11,52
More than 65 years 4 1,84
Total 217 100,00
Among the respondents, most of them have a high level of education, followed by secondary
education, then masters and doctors of science, in Table 2.
Table 2: Professional training
number %
High school education 74 34,10
College 22 10,14
University degree 98 45,16
MR.SC. or DR.SC. 23 10,60
Total 217 100,00
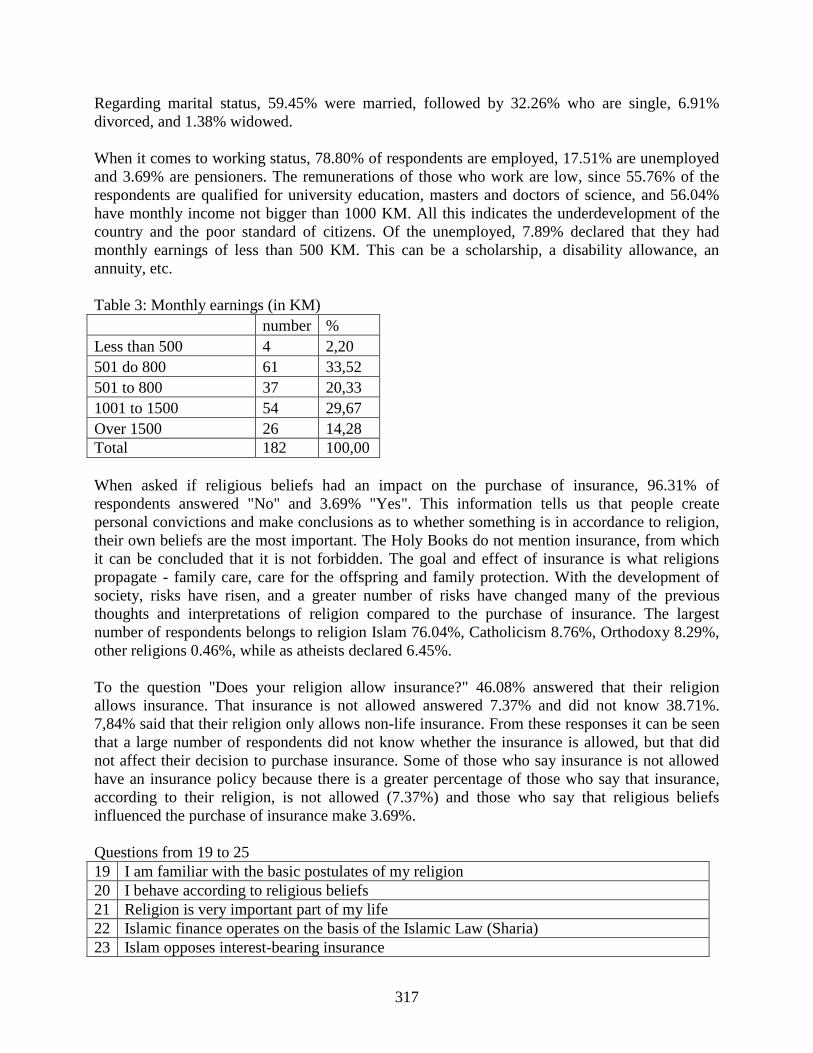
317
Regarding marital status, 59.45% were married, followed by 32.26% who are single, 6.91%
divorced, and 1.38% widowed.
When it comes to working status, 78.80% of respondents are employed, 17.51% are unemployed
and 3.69% are pensioners. The remunerations of those who work are low, since 55.76% of the
respondents are qualified for university education, masters and doctors of science, and 56.04%
have monthly income not bigger than 1000 KM. All this indicates the underdevelopment of the
country and the poor standard of citizens. Of the unemployed, 7.89% declared that they had
monthly earnings of less than 500 KM. This can be a scholarship, a disability allowance, an
annuity, etc.
Table 3: Monthly earnings (in KM)
number %
Less than 500 4 2,20
501 do 800 61 33,52
501 to 800 37 20,33
1001 to 1500 54 29,67
Over 1500 26 14,28
Total 182 100,00
When asked if religious beliefs had an impact on the purchase of insurance, 96.31% of
respondents answered "No" and 3.69% "Yes". This information tells us that people create
personal convictions and make conclusions as to whether something is in accordance to religion,
their own beliefs are the most important. The Holy Books do not mention insurance, from which
it can be concluded that it is not forbidden. The goal and effect of insurance is what religions
propagate - family care, care for the offspring and family protection. With the development of
society, risks have risen, and a greater number of risks have changed many of the previous
thoughts and interpretations of religion compared to the purchase of insurance. The largest
number of respondents belongs to religion Islam 76.04%, Catholicism 8.76%, Orthodoxy 8.29%,
other religions 0.46%, while as atheists declared 6.45%.
To the question "Does your religion allow insurance?" 46.08% answered that their religion
allows insurance. That insurance is not allowed answered 7.37% and did not know 38.71%.
7,84% said that their religion only allows non-life insurance. From these responses it can be seen
that a large number of respondents did not know whether the insurance is allowed, but that did
not affect their decision to purchase insurance. Some of those who say insurance is not allowed
have an insurance policy because there is a greater percentage of those who say that insurance,
according to their religion, is not allowed (7.37%) and those who say that religious beliefs
influenced the purchase of insurance make 3.69%.
Questions from 19 to 25
19 I am familiar with the basic postulates of my religion
20 I behave according to religious beliefs
21 Religion is very important part of my life
22 Islamic finance operates on the basis of the Islamic Law (Sharia)
23 Islam opposes interest-bearing insurance
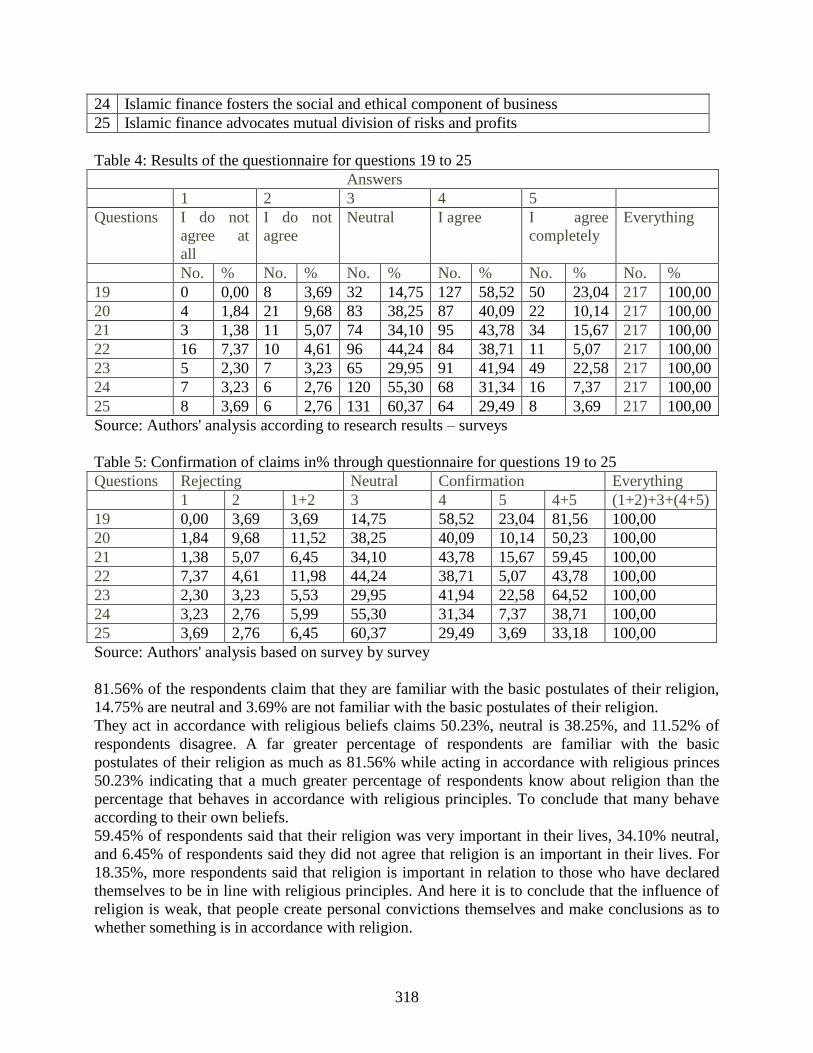
318
24 Islamic finance fosters the social and ethical component of business
25 Islamic finance advocates mutual division of risks and profits
Table 4: Results of the questionnaire for questions 19 to 25
Answers
1 2 3 4 5
Questions I do not
agree at
all
I do not
agree
Neutral I agree I agree
completely
Everything
No. % No. % No. % No. % No. % No. %
19 0 0,00 8 3,69 32 14,75 127 58,52 50 23,04 217 100,00
20 4 1,84 21 9,68 83 38,25 87 40,09 22 10,14 217 100,00
21 3 1,38 11 5,07 74 34,10 95 43,78 34 15,67 217 100,00
22 16 7,37 10 4,61 96 44,24 84 38,71 11 5,07 217 100,00
23 5 2,30 7 3,23 65 29,95 91 41,94 49 22,58 217 100,00
24 7 3,23 6 2,76 120 55,30 68 31,34 16 7,37 217 100,00
25 8 3,69 6 2,76 131 60,37 64 29,49 8 3,69 217 100,00
Source: Authors' analysis according to research results – surveys
Table 5: Confirmation of claims in% through questionnaire for questions 19 to 25
Questions Rejecting Neutral Confirmation Everything
1 2 1+2 3 4 5 4+5 (1+2)+3+(4+5)
19 0,00 3,69 3,69 14,75 58,52 23,04 81,56 100,00
20 1,84 9,68 11,52 38,25 40,09 10,14 50,23 100,00
21 1,38 5,07 6,45 34,10 43,78 15,67 59,45 100,00
22 7,37 4,61 11,98 44,24 38,71 5,07 43,78 100,00
23 2,30 3,23 5,53 29,95 41,94 22,58 64,52 100,00
24 3,23 2,76 5,99 55,30 31,34 7,37 38,71 100,00
25 3,69 2,76 6,45 60,37 29,49 3,69 33,18 100,00
Source: Authors' analysis based on survey by survey
81.56% of the respondents claim that they are familiar with the basic postulates of their religion,
14.75% are neutral and 3.69% are not familiar with the basic postulates of their religion.
They act in accordance with religious beliefs claims 50.23%, neutral is 38.25%, and 11.52% of
respondents disagree. A far greater percentage of respondents are familiar with the basic
postulates of their religion as much as 81.56% while acting in accordance with religious princes
50.23% indicating that a much greater percentage of respondents know about religion than the
percentage that behaves in accordance with religious principles. To conclude that many behave
according to their own beliefs.
59.45% of respondents said that their religion was very important in their lives, 34.10% neutral,
and 6.45% of respondents said they did not agree that religion is an important in their lives. For
18.35%, more respondents said that religion is important in relation to those who have declared
themselves to be in line with religious principles. And here it is to conclude that the influence of
religion is weak, that people create personal convictions themselves and make conclusions as to
whether something is in accordance with religion.

319
Islamic finance operates on the basis of Islamic law (Sharia) 43,78% of respondents agree,
neutral 44,24%, and does not agree 11,98%. Such a large percentage of those who have declared
themselves neutral and those who disagree show how much is not known about the Islamic law
(Sharia).
Islam opposes interest: 64.52% of respondents agree, neutral is 29.95% and does not agree
5.53%. Many more respondents, more specifically by 47.37%, know that Islam is opposed to
interest-bearing insurance in relation to the knowledge that Islamic finance operates under
Islamic law (Sharia).
Islamic finance fosters a social and ethical business component claims 38.71%, neutral 55.30%,
and 5.99% of respondents disagree. Such a large number of neutral responses point to ignorance
of Islamic finance by the respondents and even ignorance of those who have declared themselves
to belong to Islamic religion.
Islamic finance advocates mutual risk and profit sharing, 33.18% of respondents agree, it does
not agree 6.45% while declaring neutral 60.37%. This is another proof of the ignorance of
Islamic finance.
4. Conclusion
Through history, religion was opposed to insurance, especially to life insurance, because it was
believed that God's protection was sufficient, that it was the greatest and best, that no earthly
protection could be measured against divine's – God's.
The development of science and technology made religion must adapt and interpret holy books in
accordance with time. The negative attitude some scholars have towards insurance comes from
insufficient knowledge of what insurance is, how it works, and what its effects are. The public
should be educated about insurance and from the aspect of religion. It would be good to educate
religious leaders who communicate messages to the public and who have an imapct on public. A
modern world is a challenge to religion, and religion does not need to reject all but adapting to
time and the basis of learning to be interpreted in conjunction with the times in accordance with
the development of science and its achievements. We should accept everything that is good for a
better life on Earth and which is not explicitly forbidden. Every individual - the believer is
obliged to read the Holy Books and behave in the way he feels his relationship with God. We are
all ourselves responsible for our actions.
God directs us, we have our minds and intelligence to prepare ourselves for good and bad times,
to wisely protect our family and property. Insurance is not a substitute for God, nor a belief in
God, it is the protection of a family that does not exclude God's protection; it is proper planning
to provide a family that God also teaches believers. Being religious or being a believer is not a
reason for not having a life insurance policy. Religion even encourages believers to protect
themselves and their families, to help others. In fact, religion requires a believer to take care and
provide a family, and insurance only helps him fulfill this obligation.
Today, the negative attitude of the religion toward insurance faded, the strictest is Islam but Islam
is giving us alternative - Islamic insurance known as Tekaful Insurance that is adapted to Islamic
mode of business and Sharia regulations. Religious beliefs have no impact on the purchase of
insurance, these are individual and minor cases. Results of the survey have shown this and they
are presented in this paper.
320
References:
1. Bakrac, Vladimir (2012) Religiousness of youth in Montenegro - Doctoral dissertation,
University of Belgrade, Faculty of Philosophy
2. Beck, T., Webb, I. (2003): Determinants of Life Insurance Consumption across
countries, The World Bank Economic Review
3. Becirovic, S. (2011) How is the provision of insurance services according to Islamic
principles, University Think, no. 10, p. 8-17.
4. Browne, M. J., Kim, K. (1993): An International Analysis of Life Insurance Demand.
The Jurnal of Risk and Insurance
5. Iqbal Z., Mirakhor A. (2009) Introduction to Islamic Finance - Theory and Practice,
Zagreb: Mate
6. Kavazovic S. (2010). Risk management and insurance. Tuzla: Faculty of Economics in
Tuzla
7. Ljevakovic, E., Insurance Agreement between the prohibition and the permission in
Islamic law; Sarajevo, 2001.
8. Meng, Xingguo. (1994) Insurance Markets in Developing Countries: Determinants, Policy
Implications, and the Case of China. Temple University, Fox School of Business and
Management, Philadelphia.
9. Milenkovic, I and Milenkovic D. (2016) Interest and Guarantor in Islamic Banking -
Faculty of Economics Subotica University Novi Sad, Faculty of Economics Kosovska
Mitrovica, University of Prishtina
10. Satrovic, E. (2018). Merits of Life Insurance, Munich: GRIN Verlag.
11. Satrovic, E. (2017). Financial Development and Human Capital in Turkey: ARDL Approach,
Cappadocia Academic Review, 1(2): 1-15.
12. Satrovic, E. and Muslija, A. (2018). Economic and Demographic Determinants of the
Demand for Life Insurance: Multivariate Analysis, Journal of Management and Economics
Research, Vol. 16, pp. 102-115.
13. Treerattanapun, A. (2011) The Impact of Culture on Non-Life Insurance Consumption
14. Vaughan, E. & Vaughan, T. (2000). Basics of Insurance-Risk Management. Zagreb: Mate
15. Viviana A. Rotman Zelizer. (1979) Morals and Markets The Development of Life Insurance
in the United States
321
THE ROLE OF INNOVATION POLICY IN PROMOTING COMPETITIVENESS:
THE CASE OF BOSNIA AND HERZEGOVINA
Sabina Silajdzic
School of Economics and Business
Trg oslobodjenja-Alija Izetbegovic 1, 71000 Sarajevo
Phone: ++38733253766; Fax: ++38733275994;
E-mail: [email protected]
Abstract
This paper analyses the Innovation policy mix in Bosnia and Herzegovina, and explores the
potential role of integrated innovation policy in building and integrating National System of
Innovation. It provides, in-depth assessment of the existing legal and institutional framework,
governance structure and innovation policy instruments, and identifies key policy priority areas,
that are of interest in strategic policy formulation. The innovation policy in BiH is only emerging
with limited focus of government authorities to design innovation policy to improve
competitiveness. The paper presents the evolution of Innovation policy in BiH, and reviews the
impact of persistent policy failures on the National System of Innovation. Based on the extensive
literature review on the role played by innovation policy in building and strengthening
comparative advantages, the paper posit that the scope and the character of innovation policy in
BiH is ill-suited to stimulated post-crises recovery and real sector growth. The main findings
presented in this paper are based on the qualitative research on innovation policy mix in Bosnia
and Herzegovina.
Key words: innovation policy, competitiveness, transition economies, Bosnia and Herzegovina
1. Introduction
The transition from a centrally planned economy to a market economy in Bosnia and
Herzegovina (BiH) was characterised by comprehensive liberalisation of the economy principally
relying on market forces to carry out structural transformation. Overall, reforms intend to
integrate BiH economy into the global economy, especially European economic structures. The
early transition period was marked by rapid changes in the industrial structure, particularly, by
the sharp deterioration in industrial output and employment. The transformational “recession”
pattern came to be replaced by the period of economic recovery which gained momentum only in
1999/2000 (Silajdzic, 2006:2011) largely due to the specific circumstances of complex post-war
reconstruction and conflict related consequences. From the year 1999 onwards, manufacturing
was characterised by relatively high growth rates of production, albeit from the low base. The
period of recovery concerning manufacturing production was accompanied by fairly high
economic growth rates. Yet, economic growth in the initial years of transition was principally
driven by the growth in trade-related service sector and financial market growth (Uvalic, 2013).
In 2008, when the BiH’s economy was hardly hit by the global financial crisis and plunged to
negative growth rates, the structural problems of the economy and the development gap that is
technologically pronounced came to the fore. The limited marginal productivity gains across all
sectors and small competitive gains of more dynamic (that is technology and knowledge

322
intensive) industries throughout the transition period (Silajdzic, 2016), explain the slow catching
up of the economy. The structure of the economy has remained largely unchanged, with
remarkably little changes in manufacturing industry share in GDP (around 12%). Thus, the share
of private sector to GDP remains below 65%, which is the lowest among the transition
economies.
The average growth rate remains low even in recent years and averaged only 1.4% between
2012-2016. Increases in domestic consumption and external demand continue to be the major
driving forces of growth. As a consequence, economic growth does not affect employment (WB
and WiiW, 2017). A persistent very high unemployment rate (36%) with only modest increase in
industrial employment (below 50% of the pre-war level), throughout the transition process
suggest important structural weaknesses of the economy. The structural weaknesses are
seemingly the result of important policy failures, including innovation policy design, addressed in
this paper.
This paper’s main conclusion is that recent policy measures have not effectively addressed BiH’s
need for support for innovation and competitiveness. BiH innovation inputs and outcomes are
exceptionally low by any standard, and severly inhibit re-industrialisation potential. Altough,
bosnian firms’ innovative activities are incremental and mostly related to technology adoption
and accumulating imitative & absorptive capabilities, firms face severe constraints—both internal
and external—that result in severe underinvestments in technology and adversely affect their
performance including exports. Policy failures and limited technology and innovation related
funding opportunities preclude technology growth and adoption. These factors affect SMEs
particularly adversely. Moreover, poor policy frameworks governing innovation activities and
innovation collaboration make developing sources of sustainable business sector growth and
competitiveness difficult. In view of this strong policy measures are needed to stimulate private
sector growth and dynamic integration of the economy.
This paper is structured as follows. In following section we provide an overview of the evolution
of innovation policy in BiH with special reference to the changes in the institutional and
governance structures in the post-Dayton period. We then present a brief literature review and
discuss the rationale for innovation policy. In sections 3 and 4 we provide an in-depth assessment
of innovation policy governance structures, policy programs and instruments. It identifies key
policy priority areas that are of interest in strategic policy formulation. Section 5 concludes and
brigs some important policy challenges to the fore.
2. Literature review: the rationale for innovation policy
Under the old regime, all firms could be involved in foreign trade and they would do so to test the
competitiveness of their products and rip of the benefits of export-based internationalisation. In
general, firms from more technology intensive branches were continuously involved in
innovation activities and had relied on extensive and systemic research collaboration with Public
Research Organisations (PROs) i.e. especially with Universities and Industry specific research
institutes. However, within the framework of lacking competitive pressures State Owned
Enterprises have been rather moderately engaged in specialisation or product innovation
compared to their western counterparts at the time.
323
The opening up of markets and the excessive exposure of domestic firms to foreign competition
has provided new incentives and new opportunities for firms in all industries. However, in face of
the previously mentioned severe and unfavourable changes in framework conditions following
dissolution and conflict, resulted in destroyed productive and innovative capacities of local firms.
This industry context posed a serious concern in terms of their potential for revitalisation,
especially in face of increasing competition following passive liberalisation of markets and trade
in the aftermath of war and demanded systemic policy programs and instruments to enhance the
catching-up process. Instead transition policies reflected a ‘hand-offs’ approach to building
competitiveness through corporate restructuring and revitalisation programs. The lack of financial
and knowledge resources on the government side could partly explain these policy failures. In
view of this, it comes as no surprise that previous research has identified severe market and co-
ordination failures that inhibit technology growth and innovation potential of the existing firms
and industries, particularly pronounced in the manufacturing sector ( Silajdzic, 2006:2011b).
Innovative capabilities at the firm and institutional level evolve through complex interaction
between them reflecting a systematic learning pattern and gradual accumulation of knowledge
(Lall, 2001:2004). Needless to say, that the overwhelming market failures associated with
investments in research and innovation including finances, coordination failures, risks and
indivisibilities, learning to learn innovation policy, call for an integrated approach and policy
governance (Pavitt, 1988; Nelson, 1993). Accumulating technological and innovative capabilities
is determined by a multifaceted, interrelated and interdependent interplay between various actors
i.e. business and industry, research institutions, academia, the processes in which government
funding and policy support plays a key and decisive role (Dosi et al.,1989). This is key policy
challenge transition economies face, in an attempt to embark on the course of technological
catching up and industrial restructuring.
Even, the development of adaptive/imitative capabilities is necessary for mastering existing
technologies and closing of the technological gap. These, however, require systematic gov’t
support with targeted R&D investments, general funding of R&D activities and the creation of
preconditions to support innovations in business enterprise sector. Investments in new technology
and innovation are characterized by risks, indivisibilities and ‘learning to learn’, and are
associated with considerable market failures (Pavit, 1984; Dosi and Pavitt,1988). The innovation
success is often dependant/conditioned on the complex interface of different actors (e.g. co-
ordination failures), that require incentive structures in place to institutionalize innovation and
research collaboration. Firms lack internal funds to finance R&D activities, let alone transition
economy enterprises.
Past research clearly indicate the complexities and barriers associated with the accumulation of
knowledge and patterns of learning. The complexities relating to technology adoption and growth
hinder viable restructuring and growth of more technology-intensive sectors, and/or qualitative
upgrading within existing industries. The latter proposition has been tested empirically and the
results of econometric analysis clearly show that external barriers to innovation i.e. lack of inter-
firm/inter-institutional innovation collaboration have significantly adversely affected export
performance, particularly pronounced for firms within medium-high technology group. The latter
companies that have reported loss of institutional collaboration in face of eroded National System
of Innovation, are found to export less by about 40% on average, ceteris paribus (Silajdzic,
2011b). The results reveal not only the essential importance of access to capital and foreign

324
markets, but also the importance of supply capacity such as access to “knowledge” pertaining to
the increase in technological competences.
The findings of this research support the theoretical arguments put forward by Lall (1995),
(2001); Pack and Westphal (1986), Chenery (1973). Although, a proper set of market incentives
is essential in industrial restructuring and development, technological change may be inhibited by
both market and investment coordination failures, but also by the fact that some elements of
technology (i.e. are tacit)17 may not be perfectly tradable. Pack and Westphal (1986) further
argue that investments in new technologies are often associated with indivisibilities (such as i.e.
returns on investment) implying high risks and investment-averse behaviour of private agents.
Limited supply-side capacity i.e. technical expertise within business enterprises, limited
cooperation and innovation collaboration, if accompanied with absent systematic government
support to technology growth and innovation hinders the potential for more productivity growth
and innovation. In the light of the foregoing discussion it is important to emphasize that
integrated approach to technological upgrading and innovation is necessary as development of
imitative capabilities by firms and technology absorption requires integrated support for specific
thematic areas and or industry specific needs. Even development of imitative capabilities related
to the adoption of the old technologies demands investments in innovation. This is because
technology transfer is not a process of sole imitation. On the contrary it is the cumulative and
path dependant process of acquiring knowledge and capabilities as a necessary precondition for
mastering and adopting technology (Pavitt, 1988) As such it requires investments in absorptive
capabilities, through continuous investments in R&D, or engagement in diverse forms of R&D
activities, research and knowledge cooperation. Given the overwhelming market failures
associated with funding sources for innovation and technology activities (WB,2010), explain the
need to effectively target the process of technological change and growth. Accumulation and
upgrading of imitative capabilities requires systematic support that is often content, industry and
context specific (Pavitt and Dosi, 1984).
3. Context of investigation:
3.1 The evolution of Science and Innovation policy in BiH
During socialist period, S&T and technological progress in Bosnia and Herzegovina was
considered as an essential ‘productive force’ underpinning successful transformation of the
economy and industrial progress. Investments in R&D amounted to 1% of GDP in 1990; thus
GERD amounted to 1.45% of GDP in the 1985-1989 period (EI (1991) cited from
Silajdzic,2012a), compared to en estimated less than 0.3 percent in recent years. At that period,
not only was state spending on research higher than today, but also strong industrial institutes
existed in the aeronautics, energy, metalworking, machine tool, automotive, steel, defence,
electronics and agri-food industries. R&D system consisted of 66 R&D institutes and 22
Scientific Research laboratories (extra mural, independent research institutes) closely linked to
industries (Silajdzic, 2009:2011). R&D investments presented a main source of industrial
innovation.
17
Tacit refers to both uncertainty regarding the range of available techniques of production, as well as non-transferable knowledge embodied in organisational capabilities of firms, institutional and local technological practices.

325
In 1995, the Dayton Peace Agreement established BiH as a sovereign state, with complex and
decentralized administrative structure dividing the country into two entities, as main
administrative units, The Federation of BiH entity further divided into ten cantonal government
units, and Repulic of Srpska entity, along with very limited competences at the state level. In the
after math of the Dayton Peace Accord, the BiH economy was faced with massive physical
devastation of its productive capacity, devastated human & physical capital, broken and lost
market linkages, broken collaborative- supply-chain linkages, dis-economies of scale as lay in
market fragmentation, and overall bleak industry revitalisation opportunities. Policies of
industrial and corporate restructuring relied on privatisation of state(socially) owned capital, as a
supreme solution to boost market efficiency and promote private sector growth. None the less,
privatisation in BiH has been generally characterised by low investment interest, limited
economic impact and massive policy failures. In the course of transition, technology related
issues have been largely neglected, mirrored in a ‘hands-off’ approach to industrial restructuring
and re-industrialisation. The ‘lesser fare’ doctrine wrongly perceived as systematic withdrawal of
state from all economic activities including support to innovation. In line with this ideology,
restructuring and/ or revitalisation of National System of Innovation (NSI) or R&D Systems was
not considered important. Precisely, S&T and innovation generally perceived as a liability and
unnecessary burden.
This has been accompanied with missing industrial policy in the early years of transition reforms,
as well as deficient industrial policy in recent times. As a consequences, BiH economy soon
became to be characterised by massive ‘Erosion of NSI’ and persistent de-industrialisation
throughout the transition period driven by deprived technological upgrading opportunities of its
industries, with modest signs of industry revitalisation (Silajdzic & Hashi, 2011; Kaminski and
Ng, 2010). The eroded NSI were prominent in closure of research organisations and prominent
research institutes, ‘disappearance’ of industrial R&D function and innovation activity, lost
partnership and innovation linkages (pre-war), low demand for innovation and limited revival of
research cooperation (Silajdzic & Mehic, 2014; OECD 2013). Past empirical research has
identified severe consequences of eroded NSI, including estimated severe negative impact on
enterprises’ competitiveness (Silajdzic 2011:2014), bleak prospect for technological upgrading
and ‘catching up’ (Halilbasic, 2012; Silajdzic, 2012b). All in all BiH economy is characterized by
a ‘wedge’ that is technological and structural in its very nature, explaining diverging trade
patterns and poor technological performance of industries, with specialisation in traditional low-
tech industries, and restructuring away from industries with higher value-added. In view of these,
strong policy measures are needed to reverse these trends.
Following the dissolution of Yugoslavia and conflict related adverse developments, the structural
reforms and the overall approach to transition of BiH economy left the country with the lost
relatively good position in terms of science and research infrastructure, with the significant gap
between industry and science presenting a major challenge in rebuilding the science and research
system.
Innovation policy is relatively a new phenomena in BiH. First innovation programmes have been
adopted only in 2007, most of which are ongoing. The new institutional and policy structure is
only emerging. As a matter of fact, BiH is in the process of establishing a new NSI-research and
science system(s) and science and innovation policy. It has recently developed its basic legal
framework to support science and research. A big step forward in terms of basic legal provisions
326
at the state level present the adoption of the Framework Law on Higher Education (2007),
Framework law on Scientific Research Activities and the Coordination of Internal and
International Scientific Co-operation in BiH Science (2009), and the Law on intellectual property
rights (2009).
The adoption of Strategy for the Development of Science in BiH – 2016-2022, has clearly
identified the roles and responsibilities of key innovation actors at the state, entity and canton
levels. The S&T policy is entirely under the competences of entity level governments, following
the decentralized state constituency. The state level competences reflect policy coordination and
support to international cooperation. Support to innovation and research activities is managed
through narrow financial support activities and administered by Ministry of Civil Affairs
(MoCA) at the state level.
3.2 Policy structure and governance
The governance of innovation policy in BiH is designed in accordance with the highly
decentralised state structure and its complex constituency. As noted earlier, three ministries are
effectively responsible for S&T policy design and its implementation: MoCA at the state level,
Ministry of Science and Technology in RS, and the Federal Ministry of education and science in
FBiH.
Innovation policy is drafted, funded and administered by the relevant ministries. In principle
policy makers act as funding organisations, and these two function are not separated following
the best practices. This is truly problematic considering the limited competences and capabilities
of the ministries to adequately address and evaluate innovation and research proposals, and
especially considering the needed flexibility related to the updating and modifying research
projects. Although government officials lack specific technical expertise and knowledge needed
to implement and provide technical assistance to project proposals under implementation, they
engage technical expertise to facilitate the project support effectively. Still more targeted
interventions by experts may be welcome in the course of implementation of research project.
While, the problem of lack of competences is bypassed by special commission, and/ or steering
committees for evaluation and monitoring that is comprised of government officials and S&T
experts in the field, the problem of mitigating the risks associated with research project outcomes
along the different phases of project implementation remain an open issue. Engagement of
technical expertise and technical assistance to assist and evaluate project proposals and its
implementation remains a necessary precondition for successful selection and implementation of
innovation support programs even of running small scale funding schemes. This is much less
issue in RS as opposed to federation entity and state level. However, generally the share of
private sector in funding programmes is extremely low across all levels of government.
The policy design and formulation is supported by the recently established Science Councils (See
chart below). Science council advice on the preparation of policy support and the annual
programs for scientific research; makes propositions and takes initiatives on strengthening the
innovation system at the state level, comment on the innovation programs, undertake external and
internal evaluations of research activities. Limited expertise on diverse and complex issues
related to industrial innovation.

327
So
urce: (OECD, 2011)
.
Strengthening the capacity Science councils has been stressed as an important priority by most
government representatives. However, science councils may be weak instruments to advise
on/develop coherent and strategic measures for innovation and technology targeted investments
in BiH, given their heterogeneous scientific profile and diverse/dispersed interests among
academic workers in different fields. It is not surprising, then that currently Science Councils
have not played any significant role in developing systematic research and innovation support
programs.
3.3 Policy formulation and policy scope
The strategy for S&T in Republic of Srpska has been developed for the first time only in 2012
and revised version has been adopted recently (2013-2017). The strategy focuses on both
promotion of scientific research and applied research as well as on innovation in a more general
sense. Unlike other strategic documents, this document identifies the sectors of strategic
importance to RS, and clearly sets thematic research priorities (i.e. agriculture & food, new
materials, ICT, medicine and health, energy and energy efficiency, environment & ecology). This
is the only policy designed specifically to target individual sectors, although the funding schemes
do in principle cover a broad range of priority areas, or assure some flexibility in funding
research activities.
The situation in FBiH is rather bleak. The S&T strategy for FBiH was prepared back in 2011 but
was never officially adopted due to lack of political commitment to support research and
innovation on a larger scale as envisaged by the document. The new S&T strategy is under
preparation for FBiH (2016-2026). Given this, the current funding support and innovation policy
measures are not in line with any strategic document and research priority areas remain
328
unidentified in FBiH. Innovation policy programmes are targeted to support scientific research
and skills development principally with respect to public higher education institutions.
3.3 Innovation policy funding in BiH
As of 2014 Agency for Statistics of BiH reports on science, technology and innovation activities,
according to the international standards set out by the OECD i.e. Frascati manual. According to
the first statistical release GERD in BiH amount to 70.4 million KM (35 mill EUR) which is
equivalent to 0.38% of GDP. This figure seems significantly higher compared to the earlier
estimates of GERD.18 Gross expenditures on research and development (GERD) in BiH have
been estimated at 0.1 percent (OECD, 2013). Estimates are usually quoted between 0.1 -0.14%
(Europe, 2011). This level of spending is significantly lower compared to pre-war level and
significantly below the EU-27 or even SEE averages (1.85 and 0.46 %, respectively). GERD are
inconsistent with the country’s national income, and represent only 0.04 % of GDP per capita.
The new official statistics also provides data on the actual government expenditures on R&D in
BiH for the year 2014 (hence, the latest year available). According to these official data the level
of expenditures is much below the earlier estimates, with total actual government expenditures
amounting to only 13.8 million KM (less than 7 million EUR), that is about 0.07% of GDP.
Hence, the share of government expenditures going to business sector is less than 2%, equivalent
to 118 000 KM (59 000 EUR) (Agency for Statistics of BiH, 2015). Moreover, R&D spending in
BiH is heavily concentrated toward basic (over 84%) as opposed to applied research (ASBiH,
2015; OECD STI, 2011).
3.4 Policy coherence and integration issues
An integrative strategy to support innovation and technological upgrading is not existent in the
country either at the entity, let alone the sate level. The notable exception to this, present recent
efforts by RS government officials to coordinate SME, Higher education and S&T strategies.
Strategies are being drafted independently and with no reference to the importance of policy
coherence between, for instance, the Industrial strategy, Strategies for SME development,
Education policy on one hand and the Strategies for S&T.
Coherence between these strategies and applied policy measures are crucial for promoting SME
development, enhancing innovative capabilities by business sector, and accelerating
commercialisation of innovative efforts, particularly if considering the limited financial resources
available to spur SME growth and technological progress. Noteworthy is the fact that no policy
coherence efforts have been put in place to provide background information on how innovation
policy could serve the interests of wider socio-economic policy goals. Specifically worrying is
the fact that in Industrial strategy documents at the entity levels including the currently drafted
and partly adopted sectoral specific policies, and SME policies. More specifically, there is no
mention of how S&T policy could trigger innovation and contribute to increased companies’
performance. Nevertheless, the common interest of increasing competitiveness and export
capacity of the real sector, and in particular the selected sectors envisaged by these strategic
documents could provide important starting point for identifying key priority areas for innovation
18
329
policy, and designing innovation policy measures that are strictly related to enhancing innovative
capability of wider innovation performers irrespective of other policy measures.
4. Overview of innovation policy in Bosnia and Herzegovina
4.1 Methodological remarks
The main findings presented in this paper are based on the qualitative research on innovation
policy mix in Bosnia and Herzegovina. This research draws extensively on data and information
gathered and prepared within the framework of the EC funded Paccino project. The aim of the
qualitative research was to evaluate innovation policy in BiH, while also attempting to identify
key policy challenges, policy perspectives and best practice(s), (if any) and assess the potential
for their improvement and strategic orientation. The interviews were structured to assess key
policy aspects including (i) legal and institutional setting, (ii) policy formulation and governance,
(iii) policy evaluation and monitoring, (iv) policy perspectives and challenges, (v) R&D
infrastructure capacity. The 5 sections cover a wide range of questions and issues that were
addressed and discussed in detail. The principal questions include questions relating to the critical
assessment of the existing legal framework (e.g. laws, coverage and compliances); assessment of
policy formulation processes and responsible institutions (e.g. validation and assessment of key
strategic documents; identification of key institutions and innovation actors); assessment of
institutional capacity and governance structure (e.g. organisational, knowledge & funding
capabilities of responsible government bodies; the role of research, academic, and intermediary
institutions); assessment of policy programmes and specific policy instruments as well as policy
program impact analysis. Specific reference was given to identification of policy priorities and
key barriers to reach boarder impact on the existing research system.
The qualitative analysis employs in-depth interviews with key policy stake-holders i.e.
government officials responsible for S&T policy in Bosnia and Herzegovina (BiH), as well as
key policy stake-holders representatives from wider business and selected science & research
organisations. All of the expert interviewers were initially identified on the basis of internet
search that is based on the review of government representatives responsible for S&T policy
formulation. Other stakeholders’ interviewers’ were selected for interviews based on author’s
previous experience and recommendation from the network of researchers and/or international
experts who conducted previous/ongoing research on innovation policy and S&T policy in BiH.
4.2 Framework conditions for effective Innovation policy
The role of inter-mediary actors
The role of intermediary actors in strategic support to innovation and technology is missing. The
current governance and research system structure is weak as it effectively has no intermediary
actors responsible and performing targeted and large scale innovation and technology
investments. Recent efforts to establish science and technology parks, and promote clustuer
initiatives at all levels of government present a good step forward (e.g. Innovation Centres Banja
Luka, Technology parks in number of micro-regions across the country). However, the
institutional setup is weak and not functioning properly, due to lack of sufficient and systematic
funding, lack of competences and expertise etc. Several measures in support for SMEs, science
and/ or technology parks, incubators and innovative clusters have been put in place at different

330
levels in recent years, like small grants but these measures remain ineffective in establishing the
proper structures and work of these institutions, and prompting systematic linkages with
universities, business and industry. General roles/activities of these institutions include; support
to start-up firms; Promotes cooperation between business and universities; integration of different
socio-economic and political actors, technical capacity building and consultancy. Most of these
institutions are only emerging, and generally face financial resource, human capability and
technical capacity constraints and organizational challenges.
The National Development and S&T Strategy proposed the establishment of a technology parks
across different branches and across the entire country. For instance the technology park in
Sarajevo with a focus on information technologies, electronics, mechatronics and bio-medicine;
technology park in Tuzla with a focus on chemicals, IT and energy; technology park in Mostar
focusing on processing of coloured metals, agri-business, energy efficiency/renewable energy;
technology park in Banja Luka with a focus on electronics; and technology park in Zenica
dedicated to new materials, metal and wood processing. These strategy measures have not yet
been translated into effective policy actions.
The impact of all these efforts is rather weak. The real challenge in BiH is the technological
upgrading of existing industries and across number of sectors with viable economic potential.
Whether cluster initiatives and technology parks of the kind proposed can be sustainable remains
an open question. The sustainability of most of the incubators and technology parks strongly
depends on the character of support these institutions may get from the government, but also on
human capability issues and host of pre-conditions necessary for their effective work. Having
said this, although incentive to establish technology parks might seem welcome, it may only drug
already limited financial resources with limited impact on business sector. In the light of this
discussion, one needs to bear in mind that technology parks do not evolve exogenously and
overnight, it takes significant time and effort on the public policy side. Hence, knowledge
capabilities evolve through time and are the buy-product concentrated efforts to first build and
extract scientist and researchers, and than integrate education and science with industry needs.
The idea that technology parks may be built from the scratch to serve the technology and
innovation interests of business community or rather specific industries in the particular context
of this country is at least ambiguous. This country faces overwhelmingly scarce knowledge
capacity, and further disintegration of these capacities may not be feasible. Perhaps concentrating
efforts on building capabilities of surviving and existing nucleuses of accumulated knowledge
that rest with universities and science and research organisations, and finding mechanisms to spur
their cooperation with industries may seem more effective from both policy perspective and
resources view. In the next section we provide a more detailed assessment of R&D and academic
organisations.
The role of R&D and academic organisations
Most of public research infrastructure is inherited from the past (i.e. old system) and persist to be
mainly located within public universities. However, the institutions have been through a severe
‘erosion’ of research capabilities in the course of transition reforms, principally due to the lack of
funding opportunities and human capital erosion. Eventually, nowadays many research-oriented
institutions seek to exist, formally or functionally. The ‘surviving’ institutes operate in a 'vacuum'
, with limited material and technical capacities necessary to undertake research activities, and
331
with no systematic links with gov’t and industries. None of these institutions has access to
permanent funds in the form of general purpose funding, and experts rarely engaged in research
either basic or applied, but rather operate on the basis of short term consultancy projects/services.
Public universities & Research laboratories/institutes include:
research organisations within public universities (i.e. 8 public universities include 2 in RS
and 6 in FBiH and related scientific research institutes include 11 in RS and 20 in FBiH)
other scientific research organisations include 4 within private universities in RS and 10
research institutes in FBiH registered as private legal entities)
Research organisations and institutions across BiH face a number of difficulties in performing
their tasks and in particular limited funding opportunities that exist to undertake scientific and
applied research, as well as research with a commercialization potential to boost collaboration
between research&science organizations and industry and business. Lack of human resource
capabilities and technical equipment is another major obstacle in their work. Currently, science-
business linkages could hardly be recorded with the notable exception of Agriculture-related
S&R organization, that have intensified efforts in helping businesses and agricultural industry
grow.
A systematic support to these or selected number or institutions should enable first accumulation
of knowledge base and capabilities necessary to undertake research efforts, and second
establishment and deepening of collaboration with industry and business sector
is a necessary pre-condition in the process of integration National System of Innovation. Having
said this, it would require certain efforts on the government side to identify and select institutions
that ought to be subject of systematic government support following for instance the public S&R
organization taxonomy (OECD 2011) and importantly matching the enhancement of their
capabilities with objectives of other inter-related strategic documents e.g. SME strategy,
industrial policy, Education policy. For instance, deeper analysis and technical assistance may be
required in an attempt to identify the so called Research-technology organizations/Industrial
research institutes that should be responsible for the task of development and transfer of science
and technology to industry and business sector.
The development of proper R&D infrastructure should be built on the assessment of existing
capacities and the potential for their revitalization, development and collaboration with business
sector, rather than on further fragmentation and establishment of new infrastructure i.e. the
example of recent technology parks in Mostar, Tuzla, Banja Luka, given the limited human and
financial resources available.
The role of business enterprises
Business R&D expenditures in BiH are exceptionally low by any standard of comparison, and are
recorded to be EUR 6.8 millions, which is equivalent to about 0.07% of GDP (source of data
Agency of Statistics, 2014). Innovation activities are financed almost exclusively by internal
sources of funding i.e. 88% of expenditures. Industrial R&D expenditures barely exist. (Silajdzic,
2011; OECD, 2013). There are no exact figures estimating recent Industrial R&D activities
(data), although we can consider the R&D expenditures by engineering and technology sector as
a good proxy indicating poor presence of industrial R&D activity in BiH. Total R&D

332
expenditures by this sector amount to only 4.5 million EUR which is hardly worth mentioning
(ASBiH, 2015).
According to official statistics number of employees engaged in R&D by private sector amounts
to only 373 persons altogether. Although there is limited R&D function, firms in BiH do engage
in innovative activities (Silajdzic, 2011:2014; OECD, 2013). However, it is worthwhile noticing
that innovative efforts mostly relate to the absorption of existing and rather ‘readily’
available/adaptive technologies (Silajdzic, 2011). Recent innovation efforts rarely incorporate
new technical/technological solutions that are ‘content’ and ‘context’ specific (Silajdzic,
2011:2014).
4.3 Innovation policy mix: review of programs and instruments
Overall, innovation policy in BiH is mainly generic in character, focusing mainly on scientific
research, with the notable exception of RS that envisages support to specific thematic areas and
support to applied research and technology commercialization activities. Notwithstanding this,
given the limited financial resources and low awareness among policy makers innovation in
broader sense is not recognized in policy documents. Overall, innovation policy at different levels
of government reflects a rather narrow perception of innovation with absent systemic support to
enhancing innovative capabilities of network of innovation actors. Thus innovation programs and
funding schemes at the state and FBiH level place no reference to innovation policy impact on
industries, business competitiveness and overall socio-economic benefits. Further, across all
levels of government innovation funding schemes are designed to support a one year, that is a
short term and small scale projects with the limited impact on research and innovation system.
This is mostly due to limited funding capabilities of these institutions. However, notable
differences exist in terms of efficient policy design between the two entities. It is worthwhile
noticing that FBiH policy is designed to follow horizontal approach i.e. all sectors and thematic
fields are treated equally, and designed mainly to support scientific research and researchers
skills development at public HEIs, the innovation policy mix in RS covers much broader range of
activities including innovation, research commercialization and technological upgrading. Hence,
unlike FBiH or state level, funding schemes are based on clear and careful selection of criteria
including the evaluation of socio-economic impact and innovation collaboration.
Overall, financing of research and innovation activities is based on short timeframe (i.e. up to one
year) research grants as the form of funding. The fact is that, R&D grants present the only
instrument available to support research and innovation activity. Generally, policy initiatives
incorporate a wide range of programs which are horizontal in character and include support to
innovation culture as well as support to scientific and applied research and innovation in a more
general sense. Generally, innovation programs include competitive grants for innovators,
competitive grants for funding basic and applied research, acquisition of basic research
equipment etc.19 Yet, small size of grants available inhibits significant impact on research
capacity of individual research organisations, and essentially discourage applications for funding
research activities and innovation with wider commercialisation potential and use. Innovations or
applications of new technology that serves wider social interest, typically bear cost burden and
1919
Due to space limitation here we do not present a detailed description of policy programs and instruments. They
are available upon request.
333
are accompanied with indivisibilities and ‘learning to learn’ cycles that require longer term
funding, technical assistance and systematic support. SMEs are generally not eligible for funding,
which is particularly problematic considering pervasive market failures that SMEs face when
investing in new technology and innovation. However, RS encourages SMEs to participate in
innovation thorough cooperation with research institutes or academic organization.
Innovation support programmes include financial grants and matching grants for financing
‘scientific and research activities’ and some ‘narrow-based’ innovation activities in the context of
RS policy (e.g. prototype development and testing, patenting activities). Overall, policy programs
are mainly generic in character, with the following major policy weakness:
Innovation support programmes are not designed for specific thematic areas (FBiH),
although in RS they are defined with reference to research priority areas and the
socio- economic impact (RS).
The main policy measures including financial instruments for financing are not
targeted for either fields of science and/or type of research. The RS, however, defines
preferred thematic research and these include agriculture & food, new materials,
environment & ecology, energy and energy efficiency.
The policy programmes do not target SMEs and they are not directly eligible for
funding.
Policy initiatives are not designed to overcome market failures including widespread
access to capital problem, problems firms face that relate to ‘tacit’ and indivisible
aspects of technology acquisition and adoption, problems relating to investment
coordination, technological complementarities and interdependencies among and
within specific industries with the ‘defy’ comparative advantage
There is a lack of systematic and effective evaluation of the research supporting
programmes – ex-post evaluation with poorly/generically defined evaluation criteria
Poor implementation capability and technical assistance facility, all policy
programmes are administered by the relevant State/entity ministry
Poor evidence on the effectiveness of innovation policy and its socio-economic
impact. Poor financing is considered a major weakness.
Finally, as noted earlier innovation is severely underfunded. Maximum grants
available per program is EUR 25 000. On average, however, the size of the grants
ranges between EUR 5 000 – 7 000 due to large number of eligible applications
received and poorly targeted initiatives. With this level of funding, no impact on
larger scale can be expected.
Innovation funding is principally allocated via competition-based calls and administered by the
Ministry of Civil Affairs- at the State level , the Ministry of Science and Technology of RS , the
Ministry of Education and Science of FBiH. Policy instruments basically include grants and
matching grants. Most common policy initiatives include:
Competitive grants for conducting basic research, applied research and experimental
development
Competitive grants for supporting young and gifted scholars in their science and research
activity
Competitive grants for publishing scientific and research publications and journals

334
Competitive grants for participation in international scientific conferences and
development of scientific cooperation; Competitive grants for acquisition of research
equipment
Direct grants for support of scientific and professional associations
Competitive grants for the organisation of scientific events
Competitive grants for innovators
Projects for development of new technologies
Project for development of ICT
The total funding allocated to support science and research activities in BiH is rather limited
which present the major constrain to affect business innovation activity and competitiveness on a
larger scale. In RS total innovation-related funding amounts to about 443 000 EUR (actual
expenditures), with limited funding available per research project (max EUR 20 000 – 25 000).
The interviewers agree that current dispersion of funds inhibits more effective use of applied
measures. In view of this, the staff has engaged in concentrated efforts to support large scale
research project. Although SMEs cannot directly apply for these funds, they are highly
encouraged to collaborate with academia and research institutions. The fact that SMEs have
limited knowledge and research capacity OECD, et al. (2012), (also frequently noted by
interviewees) is an argument worth considering when thinking about policy effectiveness.
The largest share of public funding that goes to support research activities in BiH , is allocated by
Federal Ministry for Education and Science, yet, with no reference to any policy document (some
1.3 million EUR). Thus, more than 4/5 of this amount is distributed directly to public universities
and public research organization in the form of an ongoing support to R&D activities.
Specifically, these funds are administered by public Universities (HEI) through internal
competition calls, without considering the wider use and impact of funding research activities.
Given the linear pattern of funds distribution, individual faculties receive about 9 000 EUR for
financing their research and other research activities per annum. The individual university budget
is too small to have an impact on national research system. Although, general purpose funding of
research organisations and HEIs is needed, or is ultimate priority, some criteria that would call
for university-industry collaboration would be preferable, especially considering limited/eroded
research capability of HEIs and limited financial resources available. A simple selection of
research priority areas and preference given to applied research or research with
commercialization potential would be beneficial.
It is important to note, that there are no demand side policy measures applied in BiH in terms of
providing tax incentives for investors in R&D activities or through stimulating innovation by
procurement policy measures. At the top of it, the acquisition/import of technology or research
equipment is not exempt from custom or VAT duties unless it is financed by international donor
community. The latter exemption poses the only existing incentive to research and innovation in
the country.
Although government officials responsible for innovation policy are generally aware of lack of
systematic support to innovation being a major weakness (i.e. officials form the responsible
ministry in RS), they point that limited financial resources on the government side, and missing
proper institutional and governance structures on the other inhibit effective policy design. This is

335
primarily why innovation policy and envisaged support measures are mostly designed to target
individual actors and their specific, short time-frame research and innovation activity, with no
systemic support to research collaboration.
All in all, with this level of funding, and eroded science base one can hardly expect re-
establishment of national-system of innovation. The lack of systematic support to building of a
science base and linking science with industry through decent funding opportunities present
major barrier to creating and integrating innovation system(s) in BiH and boosting
competitiveness and growth. Considering limited financial capacity for funding innovation, the
current innovation policy and its running funding schemes attempt to follow narrow-targeted
activities defined in the S&T strategies (or even not defied as is the case of FBiH), with no visible
division between ministries competence lines . Consequently, recent R&D funding is not linked
to industry and current R&D policy mostly reflects modest state funding of scientific and applied
research with no or limited commercialisation potential. While the notable exception is evident in
RS that does provide some funding that prioritises ‘the potential commercial use of innovation’
or that it serves business interest, R&D funding in FBiH is predominantly based on funding
scientific research by public Universities. No funding of industrial R&D activities is effectively
present.
5. Concluding remarks, policy perspectives and challenges
The aim of this paper was to explore the evolution and the character of innovation policy in BiH
in an integrated framework. Specifically, this paper aims to assess the Innovation policy mix in
Bosnia and Herzegovina, with focus the (potential) role played by integrated innovation policy in
building National System of Innovation, stimulating competitiveness and technology growth. It
provides, in-depth assessment of the existing legal and institutional framework, governance
structure and innovation policy mix, and identifies key policy priority areas, that are of interest in
strategic policy formulation.
Based on the qualitative analysis, we seek to investigate the extent to which specific policy
measures and instruments provide support for industrial upgrading and growth. Overall we
conclude that current policy measures are ineffective and do not provide sufficient support for
industry revitalisation. The level of funding is too small, with short timeframe, thus accompanied
with excessive number policy instruments available that prevent more effective use of innovation
support measures. Moreover, policy initiatives do not target specific industries, sectors and/or
firms, and are not content or technology specific which prevent enhancement of competitiveness
of strategic firms and industries. Last but not least, policy initiative target strictly innovation, with
limited support for innovation collaboration (only envisaged in RS) and absent direct support to
innovation by firms (e.g. Small and Medium Enterprises). At this level of technological
development, policy initiatives should principally focus on direct measures such as subsidies and
concessional loans that target technology acquisitions and knowledge transfer. Overall, the
potential to boost the country’s competitiveness and growth is certainly dependant on country’s
ability to scale-up funding of direct policy instruments that might have greater impact on industry
and sector level technological and innovative capabilities.
We also explore how effective these policy measures have been in reintegrating National System
of Innovation. The IP and innovation related governance structure is not appropriate. Moreover,

336
the current institutional setting is inadequate for both effective policy formulation and
implementation. This problem is especially pronounced in FBiH given its complex administrative
structure. More specifically, the institutional setting in place reveals critical weaknesses: i) the
underdeveloped institutional framework (e.g. there are no independent-sustainable technology
and R&D related institutions in place, eroded human capabilities and limited technical capacity
of existing institutions, poor or no links with industrial enterprises –general purpose R&D
funding is a prerequisite); ii) the limited capacities of existing governance structures, especially
those related to skills and knowledge needed for effective IP formulation, implementation and
monitoring. National priorities in R&D need be clearly defined, including: (i) policy on structural
and institutional transformation of R&D systems; (ii) prerequisites for development of
cooperation on R&D between higher education and the business sector defined; (iii) Developed
capacity to promote international cooperation and integration into European Research Area.
Putting incentive structures and policy measures in place for the purposes of not only
strengthening the science base, but also in promoting collaboration present a key policy
challenge. In years to come BiH faces a demanding challenge of (re)building National System of
Innovation that serves the wider interests of industrial restructuring, revitalisation and
competitiveness building.
In light of this discussion the key strategic goals of S&T strategies(s) should embrace; 1.
strengthening of the science-base; 2. accelerating commercialization of research and innovative
efforts; 3. promote business growth and technological upgrading through industry related
research, technology acquisition and knowledge transfer; 4. accelerate new business growth and
facilitate innovative start-up companies. The achievement of these goals is directly dependant on
the innovation policy design, and governance of the national innovation systems. Overall, the
effective innovation policy requires not only a significant funding capabilities (which BiH lacks)
but necessitates a systematic approach to a: first, understanding growth in terms of knowledge on
the determinants of economic growth from both macroeconomic, and industry and firm level
perspectives, as inputs to industrial and science and innovation policy; second, identifying
barriers to technological upgrading and innovation in a specific country& industry content, as
inputs to industrial and science and innovation policy; third, a need to identify major challenges
facing policy formulation that would be growth enhancing in a specific country (BiH) and
industry context, including policy instruments to effectively promote industrial restructuring and
dynamics, technological change and growth, regional integration and industrial cooperation
International competition.
References
Aiginger, K. and Sieber, S. (2005) Towards a renewed industrial policy in Europe
http://karl.aiginger.wifo.ac.at/fileadmin/files_aiginger/publications/2005/CR_chapter1.pd
f
Aiginger, K. (2007) Industrial Policy: A Dying Breed or a Re-Emerging Phoenix. Journal of
Industry Competition and Trade Vol 7:p297-323
http://karl.aiginger.wifo.ac.at/fileadmin/files_aiginger/publications/2007/aiginger_fin.pdf;
Estrin, S. & M. Uvalic (2014), Foreign direct investment into transition economies: Are the
Balkans different?, Europe in Question Discussion Paper Series of the London School of
Economics (LEQs)No 4, European Institute London School of Economics.

337
Halilbasic,M.& Brkic,S.,(2017) Export Specialisation of South East European Countries in their
trade with the European Union, Economic review-Journal of Economics and Business,
Vol.XV, Issue 1, pp.75-86.
Kaminski, Bartlomiej and Ng, Francis (2010) Bosnia and Herzegovina's Surprising Export
Performance: Back to the Past in a New Veil But Will it Last?. World Bank Policy
Research Working Paper Series, Vol. , pp. -, 2010. Available at SSRN:
http://ssrn.com/abstract=1543046
Navarro, L. (2003) Industrial Policy in the economic literature: recent theoretical developments
and implications for EU policy. European Commission Enterprise Paper No12
http://www.hadjarian.info/Strategic-Management/bahrami.pdf;
Nelson, R. (1993). National Innovation Systems: A Comparative Analysis. Front Cover. Richard
R. Nelson. Oxford University Press, Jun 3, 1993.
OECD, European Union (2013), Triple Helix Partnerships for Innovation in Bosnia and
Herzegovina. Available at:
http://mcp.gov.ba/images/RCI%20Project%20Paper%20Bosnia%20and%20Herzegovina.
OECD, et al. (2012), SME Policy Index: Western Balkans and Turkey 2012: Progress in the
Implementation of the Small Business Act for Europe, OECD Publishing.
http://dx.doi.org/10.1787/9789264178861-en
OECD (2013) Triple Helix Partnership for Innovation in Bosnia and Herzegovina,
OECD (2016), Competittiveness in South East Europe-A Policy Outlook, OECD, Paris.
OECD (2016), Western Balkans and Turkey 2016 - Assessi ng the Implementation ofthe Small
Busi ness Act for Europe, OECD, Paris
OECD (2017), ACCESS TO FINANCE & INNOVATION IN THE WESTERN BALKANS
Findings from the Small Business Act Assessment, OECD, Paris.
Pavitt, K. (1984), Sectoral patterns of technical change: Towards a taxonomy and a theory.
Research Policy, 1984, vol. 13, issue 6, 343-373.
Rodrik, D. (2008) Normalising Industrial Policy
http://www.hks.harvard.edu/fs/drodrik/Research%20papers/Industrial%20Policy%20_Gr
owth%20Commission_.pdf;
Rodrik, D. (2004) Industrial Policy for the Twenty-First Century Working Paper
http://www.hks.harvard.edu/fs/drodrik/Research%20papers/UNIDOSep.pdf
Sanfey P., J. Milatovic & A. Kresic (2016), How the Western Balkans can catch up?, European
Bank for Reconstruction and Development, Working paper No.185.
Silajdzic, S. (2015). De-industrialisation of Western Balkan Countries: causes and Consequences.
Paper presented at Regional Conference on Regional Cooperation in South East Europe—
Working Together towards EU accession. 17th & 18th of November 2015, Sarajevo,
Bosnia & Herzegovina. Conference Programe GIZ (Deutsche Gezelschaft fur
internationale Zusammenarbeit).
Silajdzic, S. (2012a), Innovative Capability and Firm Export Performance: Sources of Innovation
and the Relevance of National System of Innovation in a Transition Economy Context,
paper presented at the EBES 2012 Istanbul Conference. May 24-26. 2012
Istanbul,Turkey, EBES Book of Abstract.
Silajdzic, S. and Hashi, I. (2011), Competitiveness of Transition Economies: evidence from
dynamic shift-share analysis, paper presented at the Ninth International Conference:
Challenges of Europe: Growth and Competitiveness - Reversing the Trends, Faculty of

338
Economics Spilt, Split - Bol, 26th - 28th May 2011, Conference Proceedings, pp. 685-
740.
Silajdzic, S., & Mehic, E. (2014). The relevance of absorptive capabilities in comprehending the
FDI economic growth relationship in a transition economy context, paper presented at the
EBES 2014 Istanbul Conference. June 5-7. 2014 Istanbul, Turkey, 13th EBES Conference
– Istanbul Program and Abstract Book, ISBN 978-605-64002-6-1.
Silajdzic, S. (2012b) Technology, Innovation and Competitiveness in Transition Economies,
Germany, Saarbrücken: Lambert Academic Publishing. 572 pages. ISBN 978-3-8484-
2139-8.
Silajdzic, S. (2009), Technology and Competitiveness of Transition Economies’ enterprises:
determinants of technological capabilities, paper presented on Conference: Economic
aspects of BiH’s European integration process; within the framework of European Union
funded EU support to the Directorate for Economic Planning project, February 25,
Sarajevo , 2010, EPPU/Ecorys Research Report No. 0093.
UNCTAD (2015), Investment policy Review-Bosnia and Herzegovina, UNCTAD, Geneva.
UNECE (2007), Creating a conducive environment for higher competitiveness and effective
national innovation systems-Lessons learned from the experiences of UNECE countries,
United Nations, New York and Geneva.
United Nations (2007) Rethinking industrial policy Discussion Paper No183;
http://unctad.org/en/docs/osgdp20072_en.pdf;
WB & WiiW (2017), Western Balkans Labour Market Trends, World Bank Group and The
Vienna Institute for International Econoic Studies, Report no.113922.
WB (2013), Western Balkans Regional R&D Strategy for Innovation, World Bank Group,
Washington DC.
Weiss, J. (2011) Industrial Policy in the Twenty-First Century United Nations Working Paper No
2011/55 http://www.wider.unu.edu/publications/working-papers/2011/en_GB/wp2011-
055/ 25

339
DO ENVIRONMENTAL TAXES PAY OFF? THE IMPACT OF ENERGY
AND TRANSPORT TAX ON CO2 EMISSIONS IN TRANSITION
ECONOMIES
Sabina Silajdzic School of Economics and Business
Trg oslobodjenja-Alija Izetbegovic 1, 71000 Sarajevo
Phone: ++38733253766; Fax: ++38733275994;
E-mail: [email protected]
Eldin Mehic School of Economics and Business
Trg oslobodjenja-Alija Izetbegovic 1, 71000 Sarajevo
Phone: ++38733253952; Fax: ++38733275994;
E-mail: [email protected]
Abstract
In this paper we investigate the impact of environmental taxes on CO2 emissions in the context of
emerging market economies. An attempt has been made to identify what role does the
environmental policy and its specific tax policy measures play in understanding the relationship
between economic development and environmental degradation. The empirical analysis covers ten
Central and Eastern European countries in the period from 1995 to 2015. The latest data on
environmental taxes are available only from 1995. We contribute to recent literature in two respects.
First we study this relationship in an dynamic framework in which we take into account the issues
of serial correlation and endogeneity in the regressors due to cointegration relationship.
Specifically, we rely on fully-modified least squares (FM-OLS) estimation technique to model the
long term relationship between income and carbon-dioxide emissions. Second, this paper advances
our understanding on the effectiveness of tax policy measures in curbing CO2 emissions, on which
we have scarce empirical evidence. The results of this analysis provide rather strong evidence in
support of an inverted U-shaped relationship between economic growth and the environment.
However, environmental taxes do not seem to be effective in modifying the behaviour of economic
agents and in protecting the environment. The results are robust to different models.
Key words: Environmental Kuznets Curve (EKC) Hypothesis, environmental policy, pollution,
CO2 emissions, transition countries
1. Introduction
What is the relationship between economic growth and the environment presents one of the critical
questions prominent in today’s policy debate. The conventional Environmental Kuznets Curve
Hypothesis (EKC) is often used to explain the relationship. The EKC hypothesis implies the
existence of the so called inverted-U relationship between economic development and
environmental degradation. According to this phenomena observed in number of early EKC studies
(Grossman and Kreuger, 1995; De Bruyn et al., 1998) environment is deteriorated in the phases of
progressive growth following structural transformation of the economy and industrialisation, up
until a certain point ( usually referred to as the threshold income level) which is then followed by a
340
subsequent phase of improvement in environmental quality. The reverse influence is often
associated with the so called technological effect and the composition effect (see for instance
Panayotou, 1993), considered the major driving forces explaining the downward slope of the
inverted-U shape relationship. The technological effect reveals improvements in environmental
quality following introduction of more environmentally friendly technologies, or simply by
improvements in production efficiency and productivity in wake of innovation that result in more
efficient use of energy or input mix. The composition effect, implies simply that the changes in the
structure of the economy are favourable in terms of service sector playing a dominant role driving
economic growth.
Yet, more recent empirical evidence fail to comply with the existence of an inverted-U relationship,
thus casting serious doubts on the robustness of earlier findings (see for instance Stern, 2004; Ekins,
2000; Harbaugh et al., 2002; Borghesi, 2000) and the suggested merits of the technological and
composition effects. In wake of this scepticism, the importance of reconsidering the so called scale
effect, according to which economic activity is always environmentally damaging as increases in
production and consumption imply intensified use of environmental resources, comes to the fore.
Likewise, the role played by environmental regulation has gained increased attention among
academic scholars and policy makers. In view of intensified efforts to protect the environment, and
in particular to curb CO2 emissions globally, the question of how effective environmental policy
has been in safeguarding the environment has become prominent in policy discourse.
That is to say that the policy effect (see for instance Yandle et al. 2004) has been considered as an
important factor that may influence the relationship between economic growth and the environment.
In view of inconsistent empirical evidence on the income-environment relationship, countries have
put increasing efforts to regulate the environment and restrict pollution emissions. How effective
these policy efforts have been is the principal question investigated by this empirical study. In
particular, we explore whether environmental taxes have been associated with decreases in CO2
emissions in the context of transition economies. The literature often points to the adverse effect of
environmental taxes on industry’s competitiveness, suggesting that the taxes bear significant
economic costs (Hendersone, 1996:2000, Greenstone, 2002 Walker, 2012, Silajdzic&Mehic,
2015).20
The critical question investigated in this paper is the one of policy effect on CO2 emission.
Following increases in the overall tax burden imposed on companies operating within the EU
market, it is worthwhile considering the effectiveness of these rigorous policy measures. The
commonly accepted principle that the prices should incorporate the full cost of environmental
damage is used to justify the imposition of higher and diverse environmental tax rates among the
EU member states.
This said, comprehending the effectiveness of environmental policy in safeguarding the
environment requires deeper understanding of the relationship between economic growth and the
environment. In this paper, we look at how income is related to environmental quality while also
taking into account the policy effect. An attempt is made to investigate the role played by
environmental policy initiatives and its specific tax policy measures in comprehending the income-
environment relationship. We analyse the existence of Environmental Kuznetz Curve (EKC)
hypothesis in the context of the ten Central and Eastern European countries (CEECs) i.e. Czech
Republic, Slovenia, Slovakia, Poland, Hungary, Estonia, Latvia, Lithuania, Romania, Bulgaria.
20
Indeed, a number of studies have suggested benefits of cleaner air regulation in line with the so called Porteer
hypothesis (see for instance Deschenes et al. (2012); Lleras-Muney (2010).

341
We find rather strong evidence on the existence of EKC hypothesis. The obtained results are,
however, only indicative that continued economic growth does provide for better environmental
quality (EKC) since environmental taxes do not seem to be effective in curbing CO2 emissions in
transition economies. The results of this study have profound policy implications that should be
considered in the context of international environmental policy agenda.
This paper is structured as follows. First, we explore past empirical literature examining the
relationship between income and the environment, and highlight the scarce empirical evidence
investigating the effectiveness of environmental policy. In section three we explain the model and
econometric approach to investigating the EKC hypothesis. We embark from earlier studies in that
we employ dynamic econometric framework to account for the potential problems of endogeneity,
serial correlation and cross sectional dependence in the data. Discussion of results and policy
implications follow. Section 5 concludes.
2. Literature review
The relationship between economic growth and environment is commonly explained using the so
called Environmental Kuznets Curve Hypothesis. The EKC hypothesis posit that environment
initially worsens as economy grows up to a certain threshold, after which increases in income are
associated with significant improvements in environmental quality (Grossman and Kreuger, 1995).
Yet, there is no grounded theory on the income-environment relationship, and a number of diverse
though complementary theoretical proposition have emerged in explaining the relationship. In
sections to follow we briefly explain main theoretical propositions and review the empirical
evidence on the matter.
The assumed inverse-U shape of the EKC curve is commonly explained while referring to the key
drivers of income-environment relationship, namely the scale effect, the technological effect and the
composition effect. The scale effect – implies that increases in production and consumption are
always environmentally damaging as they are associated with the intensified use of natural
resources. The technological effect implies that advances in technology underpin improvements in
environmental quality. Innovation often leads to increases in production efficiency and subsequent
productivity gains by affecting input mix (e.g less dependence on natural capital), lessening the
energy intensities of certain industries, or generally results in more efficient use of environmental
resources and less pollution. Panayotou (1993) stresses the importance of the changes in the
technology structure of an economy as industrialisation takes place. Finally, the composition effect
– implies that the changes in the structure of the economy along the development path are
associated with less environmental degradation following the expansion of the service sector that
becomes the key driving force of growth.
The composition effect is closely associated with the structuralist approach to understanding the
income environment relationship, or the so called structuralist economic growth model (Lewis,
1963; Chenery, 1974). This ‘closed-economy’ model is, however, less applicable in a today’s
increasingly globalised world where de-industrialisation in the context of for instance industrialised
countries may occur as a result of shift rather than a reduction in the levels of pollution. Put
differently, if this growth model is taken as granted, with limited or no reference to interrelatedness
and inter-dependency of countries now a days, it may have implicit and profound implications on

342
environmental policy (see for instance Everet et al. 2010).21
In terms of developing countries,
imposing stricter environmental regulation may be considered costly and unnecessary burden, while
subsequently in the context of more advanced industrialised countries environmental policy can
come at odds with broader societal goals linked to the impact of subsequent shift in labour, scale
and pollution intensive industries on employment and competitiveness in these countries. At last,
the structuralist view may justify the hands-off approach to protecting the environment.
The persistent increases in aggregate consumption, and total energy consumption by industrialised
countries in particular, alongside increases in income has become increasingly worrying (Everet et
al., 2010). This commonly observed behavioural pattern is assumed to have profound adverse
effects on the earth’s environment, thus calling for proactive and integrated policy measures to
safeguard the environment. On this ground the merits of environmental policy efforts have come to
the fore of policy discussion. This is why, integrating policy efforts in understanding the income
environment relationship has become increasingly important nowadays. The policy effect reflects on
incentive structures and policy measures specifically designed to protect the environment. Yet,
while the existence of EKC may reduce the relevance of environmental policy, preventing the
adverse impact of economic activity on the environment, seems essential. No doubt, the cost of
repairing the environmental damage may be too high or simply the environmental damage may be
irreversible. In the light of this discussion, Yandle et al. (2004) highlight the role of environmental
regulation, that is institutional and policy development as society progresses, to be the major driving
force explaining the downward slope of the inverted-U shape relationship. Along these lines of
reasoning, a study by De Bruyn (1997) suggests that the inverse relationship between income and
environmental degradation is better explained by environmental policy than by economic factors i.e.
structural change, giving rise to the importance of environmental policy.
Notwithstanding this, the vital question, however, remains the one on which policy options seem to
pay-off? Environmental policy is quite complex set of direct and indirect measures i.e. incentive-
structures aimed at protecting the environment. Where possible policy options should induce
convergence between to two pillars of sustainable development namely the environment and
economic growth,-the principle that has trigged much of controversial policy debate. While
environmental taxes are considered the most effective tool in protecting the environment (OECD)
countries often remain reluctant on imposing those taxes, given the risks of inducing additional
economic costs and jeopardising competitiveness of local industries in wake of heterogeneous
environmental regulations between countries.
A number of studies have found that environmental taxes adversely affect industries'
competitiveness, and lower investments and employment opportunities. (Hendersone, 1996:2000,
Greenstone, 2002 Walker, 2012, Silajdzic&Mehic, 2015).22
A more recent study by Greenstone et
al.(2012) provide robust evidence on the negative impact of the US air quality regulation on total
factor productivity of US manufacturing plants. Thus, more stringent environmental regulation is
21
Ekins (2000) analyses the GDP growth and growth in emissions of CO2, SO2, and NOX in seven developed
countries between 1970 and 1993. his study finds evidence on relative and absolute decoupeling. Increases in GDP have
been associated with lower increases in emissions for majority of countries, while decreases in emmissions along GDP
increeases have been found in few countries. For instance, the updated analysis using OECD data up to 2005 indicates
absolute decoupling in UK, Germany, and France for all indicators.
22
Indeed, a number of studies have suggested benefits of cleaner air regulation in line with the so called Porteer
hypothesis (see for instance Deschenes et al. (2012); Lleras-Muney (2010).
343
often associated with shifting production overseas i.e. Haven Pollution Hypothesis. This said, the
critical question, remains the one of how effective environmental policy measures have been in
modifying the behaviour of economic agents, regardless of economic costs.
Previous literature, have mostly failed to study this relationship in an integrated framework (e.g.
early studies using reduced-form regressions), and have failed to investigate the impact of
environmental policy while referring to more disaggregated policy measures as argued by Stern
(2004). 23
Similarly, most studies failed to address the relevance of the scale effect relative to
composition and technological effect, since as pointed by Arrow (1996) economic activity may
always be environmentally disruptive in some way, and scaling of either consumption or production
is highly relevant for understanding the shape of the curve. After all, given the mixed evidence on
the matter,24
the relevant question becomes not the one of the shape of the curve (since we may
never be able to obtain robust evidence on income elasticities) but rather on the underlying
processes that explain the factors that impact environmental degradation.
This said, it is worth mentioning that fixed effect models estimated in most of past studies bear little
information on the existence of EKC in an transition economy context. As shown by Hsiao (1986),
fixed effect model results cannot be generalised to other samples of data. Transition countries
embarked on similar policy pattern in the processes of far-reaching structural and institutional
transformation. On this ground, it is seems reasonable to analyse what role has the environmental
policy played in Central and Eastern European transition economies. Specifically, we analyse the
impact of environmental taxes i.e. energy and transport taxes on CO2 emissions while referring to
the sample of CEECs transition economies. The obtained results allows us to go into greater detail
about these countries, minimising the risks of obtaining biased estimates.
Finally, past empirical studies examining the existence of EKC hypothesis mostly fail to account for
the problems of endegenieity due to correlation in the regressors, the problems of serial correlation
and cross-sectional dependence in the data, and often ignore the possible cointegration between
income and CO2 emissions. For a detailed discussion on methodological issues related to testing of
EKC hypothesis see Wagner (2008). Studies that relay on fixed effect models bear little relevance
to understanding the dynamics of the income environment relationship. In this study we employ a
dynamic econometric framework. An attempt is made to remedy for the methological deficiencies
which may bais the results, as we discuss later on.
3. Context of investigation
The interest of this paper is to examine the relevance of EKC hypothesis and environmental policy
measures in the context of CEECs countries. The specificities that relate to economic restructuring
23
Previous studies indicating importance of social and human capital as well as political governance and corruption in
lowering environmental degradation (Deacon, 2005, Barros et al. ,2002), Dacon and Norman , 2004), Constantini and
Martini , 2006) may bear little information for policy makers. The causal links of some of these institutional and policy
factors with pollutants or some indicator of environmental degradation may be questionable from theoretical point of
view. 24
The existence an inverted U shaped EKC hypothesis has been indicated in studies by (Wang, 2013; Wagner, 2008;
Vollebergh et al., 2009; De Bruyn et al., 1998; Constantini and Martini (2006), Dutt, 2008); an N-shaped EKC
suggested by (Akbostanci et al. 2009; Inmaculada and Aurelia, 2004; Galeotti et al, 2006; Grossman and Kreuger,
1991). A number of studies found weak or no evidence to support the EKC hypothesis (Perman and Stern, 2003;
Harbaugh et al., 2002; Borghesi, 2000).
344
and institutional transformation and development along the processes of transition and integration
into the EU institutional and policy structures, seems important to be acknowledged for at least
three reasons. Although the income disparities between the CEECs and the EU-15 countries still
prevail, it is principally the differences in the institutional capabilities, economic structures and the
levels of technological development that are of particular importance in the sense that these pose a
specific and distinctive context of investigation. More specifically, it seems reasonable to assume
that these differences may not only affect government capabilities, its policy orientation and
choices, but also the responsiveness of economic agents (both the consumers and the producers)
given the differences in the patterns of behavior and overall technological capabilities of firms and
industries that are important to be considered in the context of environmental policy effectiveness
and promotion. This is to say that although policy commitments to low-carbon age are imposed at
the supranational, that is EU-28 level, specific policy measures may vary across countries and
generally, given the aforementioned differences the consequences and the effect of these policy
measures may be different in the specific context of CEECs countries relative to more advanced EU
member states.
For instance average private and public R&D investments among CEECs remain generally below
the EU-15 average. Similarly environmental policy taxes seem modest relative to those applied in
more advanced EU countries if considering the revenues collected from environmental taxes, with
notable exception of Slovenia. The average environmental tax revenues relative to GDP is below
the EU average of 2.3% (see Appendix, figure 3) while energy efficiency measured as energy
consumption relative to output (, i.e. energy consumption per unit of physical output ) remain at
much lower level in these countries compared to EU-15 levels (see Appendix, figure 2). The latter
indicator is particularly important and indicative of persistent reliance on energy intensive industries
such as chemicals, steel and paper in value added of manufacturing industries. Over the period
2005-2009, improvements took place in all industrial branches across CEECs, such as -5.1%/year in
Poland, -5.9%/year in Romania, -4.9%/year in Slovenia, -3.2% in Hungary, -2.2%/year in Czech
Republic). Energy efficiency improvement in industry results from technical improvement in
industrial process and electric motors, encouraged by policies combining tax incentives and
voluntary agreements, investment and R&D subsidies. Given the persistent underperformance in
terms of energy efficiency of CEECs countries the improvements in energy efficiency as well as
shift in production structures of CEECs remains a challenge.
In view of these differences, it seems important address the issue of how environmental policy
measures have been effective in modifying the behavior of producers and in curbing CO2 emissions
. In particular, we emphasise that investigating the influence of energy and transport taxes on
aggregate carbod dioxide emmissions seem valuable from EU-28 policy perspective. Energy
industries and transport sector did no show the gradual dicline in emissions as other sectors.
Emissions only started to decrase from about 2007 onwards but still remain higher than in 1990
(European Commission, European Climate Change Programme(s)). Transport accounts for about
one-quarter of EU green-gas house emissions. In line with a new European Strategy for low-
emission mobility (adopted 2016) transport taxes are seen as an important market-based instrument
initiated not only to integrate the ‘full’ costs of environmental degradation but to effectively modify
the behavior of the consumers and producers. Furthermore, in line with energy efficiency
objectives, energy taxes (including oil and gasoline) are expected to contribute to the improvements
in energy efficiency and provide incentive structures to acquire additional shifts in the production

345
structure towards more cleaner and sophisticated production. These taxes also generate revenues
that can potentially be used to finance environmental policy programmes.
However, in veiw of the above mentioned structural and technological differences between CEECs
and EU-15 countries, we do postulate that effectiveness of for instance energy tax imposed is
dependent on a firm or industry’s ability to either pursue subsequent shifts in structure of value
added that would lead to improvements in energy efficiency, while shifts in the production structure
would require building systemic technological capabilities across vital industrial branches, to move
up the technology ladder.
Environmental tax revenues as share of total revenue from taxes and social contributions remain at
about 6.4% at the EU level. Environmental taxes remain at a very low level despite increasing
policy efforts and commitments to preserve the environment. Energy taxes account for about 76%
of all environmental tax revenues, while transport tax revenues account for about 20%, and
pollution and resources for only about 2.5 %. Breakdown of tax revenues by country and type of tax
is presented in figure 3 below. In the specific context of CEECs countries, the tax revenues from
pollution and resource are barely existent, with the notable exception of Slovenia and Estonia.
The EU has made very strict commitment to cut its energy consumption by 20% (compared with
projected levels) by 2020. The policy focus is on providing policy support measures and investing
in shift from fossil fuels to energy production from renewable resources. CEECs do not seem to lag
behind other EU member countries. Thus, when it comes to CEECs countries, most countries have
already reached the 2020 targets for the share of renewable energy as a % share in total energy
consumption or are very close to reaching those targets (see Appendix, figure 4). Given the general
tendency to lower energy consumption, its significant and economically important impact on
aggregate carbon dioxide emissions would reflect on the relevance of existing policy efforts to
reduce energy consumption. Worth mentioning, energy consumption has decreased significantly
compared to 1990 level, in the EU-28. Though energy consumption has been decreasing in relative
terms (see Appendix, figure 1), it has been increasing in absolute terms, since 1993 onwards at an
average annual rate of 0.6 present.
4. Empirical analysis
The model
In this empirical analysis, data on CO2 emissions for CEEC-10 are examined in an attempt to
provide information on not only whether EKC exists but also on the role played by environmental
policy. We examine the impact of environmental taxes by incorporating a more disaggregated data
on environmental policy, precisely taking into account the impact of individual energy and transport
taxes. We also analyse the impact of technological and scale effects proxied by energy intensity of
industry. We include a number of control variables i.e. country specific effects to control for time-
invariant country effects, as well as time effects to control for the time-variant specific effects.
Finally, as noted earlier, we analyse the relationship while referring to the case of more advanced
transition economies of Central and Eastern Europe (CEE-10) in the period 1995-2013. In the
period 1992-2013 however the data on environmental taxes are available from 1995. We use
unbalanced panel data. In line with above propositions, we estimate the following equation:

346
it
i i
iiit
ititititit
TimeDCountryDaxpcFDITransportt
cEnergytaxpstrypcEnergyIndupcGDPGDPpcpcCO
10
1
10
1
5
43
2
210
log
loglogloglog2log
where:
the dependant variable, CO2pcit denotes CO2 emissions per capita of the country i in the period t;
GDPpc and GDPpc2 denote real GDP per capita of the country i in the period t; EnergyIndustrypc
denotes energy intensity of industry expressed as per capita energy consumption of industries of
country i in the period t25
; Energy environmental taxes (EnergyTaxit) denotes energy taxes per
capita of the country i in the period t; Transport environmental taxes (TransportTaxit) denotes
transport taxes per capita of the country i in the period t; FDIit denotes FDI stock26
in
manufacturing sector per capita of the country i in the period t, CountryD denotes country dummy
variables used to control for time-invariant country specific effects and TimeD denotes year dummy
variables used to control for time specific effect, it – random error (structure eit determined by the
Fixed Effect (FE) model).27
All variables are expressed in logs. Importantly, following Jaforullah
and King (2017) we do not incorporate total energy consumption into the CO2 model, considering
the demonstrated econometric consequences and the sensitivity of the obtained results with respect
to both magnitude and sign of the obtained coefficients when energy consumption is included in the
model to be estimated.
Principle variable of interest: the impact of environmental tax policy measures
In this study we assume that taxes may be efficient and linearly related to lowering CO2 emissions.
However, we also allow for the neutral or even positive effect of taxes, given that in some or
number of instances taxes may not be associated with improved environmental quality, depending
on the availability of the input alternatives. It seems reasonable to argue that in instances in which
firms and industries reach the technological frontiers taxing energy consumption, resource use or
pollution may not be effective since, more energy efficient technologies may not be readily
available, or simply it may take significant time before new or alternative input and output
structures of environmentally friendly technologies become available. Therefore, we have no a
priory expectations with respect to the sign and the significance of the three principal variables of
interest i.e. Tax variables. However, we do assume that environmental taxes may pose good
incentive structures in countries/industries that are at the lower level of technological sophistication
and could relatively easily switch to/adopt more energy efficient as well as cleaner technologies,
subsequently reducing CO2 emissions.
25
Energy intensity by industry is calculated as the sum of inland consumption of the five sources of energy solid fuels, oil, gas,
nuclear and renewable sources by industry including manufacturing industry, construction and mining, expressed as the ratio to GDP
. Since the gross inland consumption of industry is measured in kilograms of oil equivalent and GDP in EUR 1000, this ratio is
measure in kgoe per EUR 1000. This data is then divided by poplation to obtain industry energy intensity in per capita terms. This
data reflect on economic efficieny of an industry.The energy consumption in manufacturing sector represents around 98% of the
consumption of industry. (source Eurostat) The share of energy consumption by industry may depict on subsequent changes in the
production structure of an economy i.e. shifts from energy-intensive to more environmentally friendly or sophisticated production. 26 Considering FDI stock rather than inflows is assumed more appropriate in an attempt to capture the long-term technology related
spillovers associated with foreign capital inflows (Neuhaus, 2006; Campos and Kinoshita, 2002). 27The source of CO2 data, Energy intensity of industry, and environmental taxes data is EUROSTAT. The source of GDP data is
World development indicators; it refers to real GDP per capita income. Source of the FDI data is Vienna Institute for International
Economic Studies (WIIW) database on FDI.
347
Most CEECs countries have introduced energy and pollution taxes, in an attempt to limit emissions
of air pollutants, in particular of green gas emissions from power generations (see OECD,
2004:2010). They have done so mostly by introducing energy taxes. Energy use account for largest
proportion of environmental degradation estimated at about over 80% in OECD countries (OECD,
2004). Energy taxes reflect on important measures to reduce energy demand via economic, that is
market based instruments. How effective energy taxes are in lowering energy demand and in
curbing CO2 emissions in transition economies, present principal question of interest in this
analysis?
Similarly, a number of countries (Slovakia, Czech Republic, Slovenia and Hungary) have
introduced sufficient transport taxes, since taxing transport seems important and effective mean of
lowering air pollutions. Although transport does contribute to economic growth and is important for
overall social well being, further growth in transport may lead to significant degradation in
environment given it contributes to the depletion of non-renewable resources. Introducting transport
taxes and restructuring transport taxes to better target negative externalities on the environment e.g..
by replacing fuel excises with per-kilometre charges has been practice in number of transition
economies. We investigate how effective transport taxes have been in curbing CO2 emissions, via
lowering demand for road transport.
An environmental tax is a tax whose base is a physical unit (or a proxy of a physical unit) of
something that has a proven, specific negative impact on the environment. Environmental tax
statistics present data on taxes in the following areas: energy, transport, pollution and resource.
Considering the definition and the methodology of tax application, both energy and transport tax
attempt to reduce CO2 emissions emanating from transport, since Energy tax base calculation
encompasses taxing fuel from transport, while transport tax principally includes motor vehicles
import/sale, registration and use taxes, as well as road taxes and other means of transport. 28
Hence,
road transport accounts for about 75% of all GGH emissions from transport.29
Descriptive statistics
Table 1, Table 2 present the descriptive statistics of variables and the correlation matrix among
variables, respectively.
28
Specifically, the list of environmental tax bases for: a) Energy (including fuel for transport) tax includes the following: 1. Energy
products for transport purposes; Unleaded petrol ; Leaded petrol; Diesel ; Other energy products for transport purposes (e.g. LPG,
natural gas, kerosene or fuel oil) 2. Energy products for stationary purposes; Light fuel oil , Heavy fuel oil, Natural gas, Coal ,
Coke , Biofuels , Electricity consumption and production, District heat consumption and production, Other energy products for
stationary use, 3. Greenhouse gases; carbon content of fuels , emissions of greenhouse gases (including proceeds from emission
permits recorded as taxes in the national accounts) . The list of Transport (excluding fuel for transport) tax base includes: 1. Motor
vehicles import or sale (one off taxes); 2. Registration or use of motor vehicles, recurrent (e.g. yearly taxes), 3. Road use (e.g.
motorway taxes); 4. Congestion charges and city tolls (if taxes in national accounts), 5. Other means of transport (ships, airplanes,
railways, etc.), 6. Flights and flight tickets, 7. Vehicle insurance (excludes general insurance taxes). 29
Worthwhile noticing is that we also attempted to investigate the impact of the so called implicit tax rate measured as the ratio
between energy tax revenues and final energy consumption calculated for a calendar year. This variable may potentially allow for
obtaining more precise estimates of the effect of environmental tax on CO2 emissions, given that it implicitly (proportionally)
accounts for energy intensity of individual country. However, this variable could not be included in the model to be estimated given
its high correlation with income, and number of other energy intensity indicators included in the model (the pair-wise correlation
coefficient is over 0.84 for these variables, and thus over 0.88 with income variable).
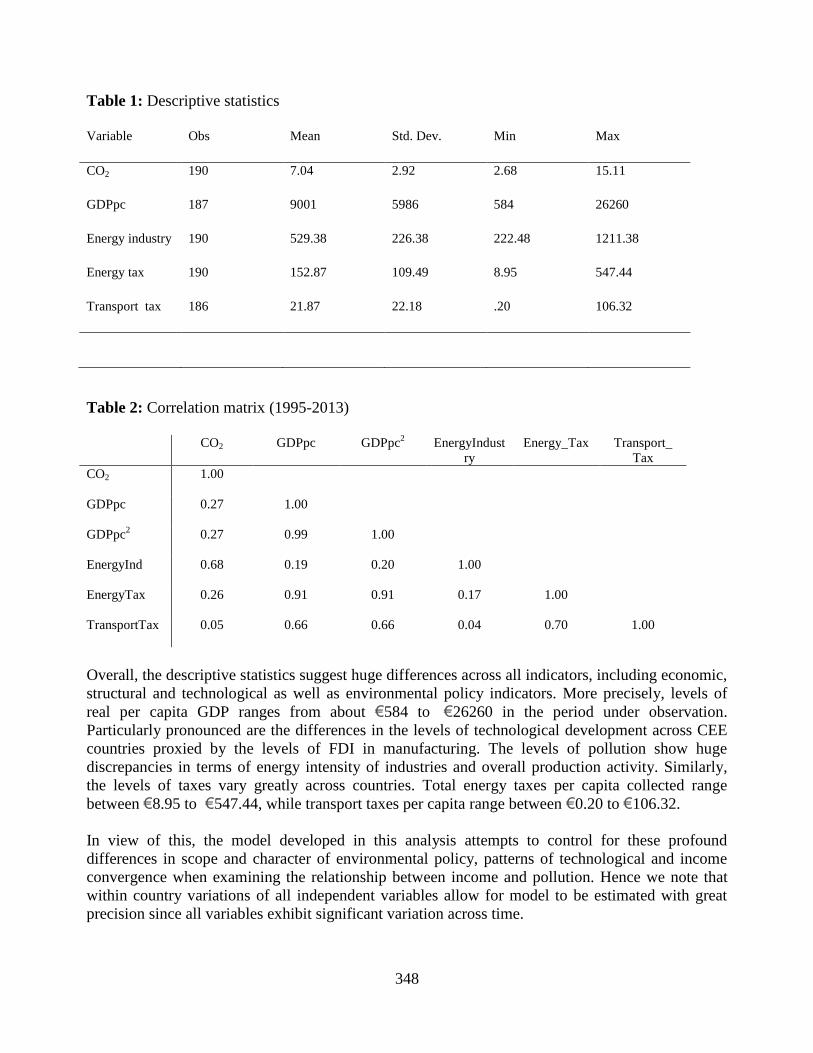
348
Table 1: Descriptive statistics
Variable Obs Mean Std. Dev. Min Max
CO2 190 7.04 2.92 2.68 15.11
GDPpc 187 9001 5986 584 26260
Energy industry 190 529.38 226.38 222.48 1211.38
Energy tax 190 152.87 109.49 8.95 547.44
Transport tax 186 21.87 22.18 .20 106.32
Table 2: Correlation matrix (1995-2013)
CO2 GDPpc GDPpc
2 EnergyIndust
ry
Energy_Tax Transport_
Tax
CO2 1.00
GDPpc 0.27 1.00
GDPpc2 0.27 0.99 1.00
EnergyInd 0.68 0.19 0.20 1.00
EnergyTax 0.26 0.91 0.91 0.17 1.00
TransportTax 0.05 0.66 0.66 0.04 0.70 1.00
Overall, the descriptive statistics suggest huge differences across all indicators, including economic,
structural and technological as well as environmental policy indicators. More precisely, levels of
real per capita GDP ranges from about €584 to €26260 in the period under observation.
Particularly pronounced are the differences in the levels of technological development across CEE
countries proxied by the levels of FDI in manufacturing. The levels of pollution show huge
discrepancies in terms of energy intensity of industries and overall production activity. Similarly,
the levels of taxes vary greatly across countries. Total energy taxes per capita collected range
between €8.95 to €547.44, while transport taxes per capita range between €0.20 to €106.32.
In view of this, the model developed in this analysis attempts to control for these profound
differences in scope and character of environmental policy, patterns of technological and income
convergence when examining the relationship between income and pollution. Hence we note that
within country variations of all independent variables allow for model to be estimated with great
precision since all variables exhibit significant variation across time.
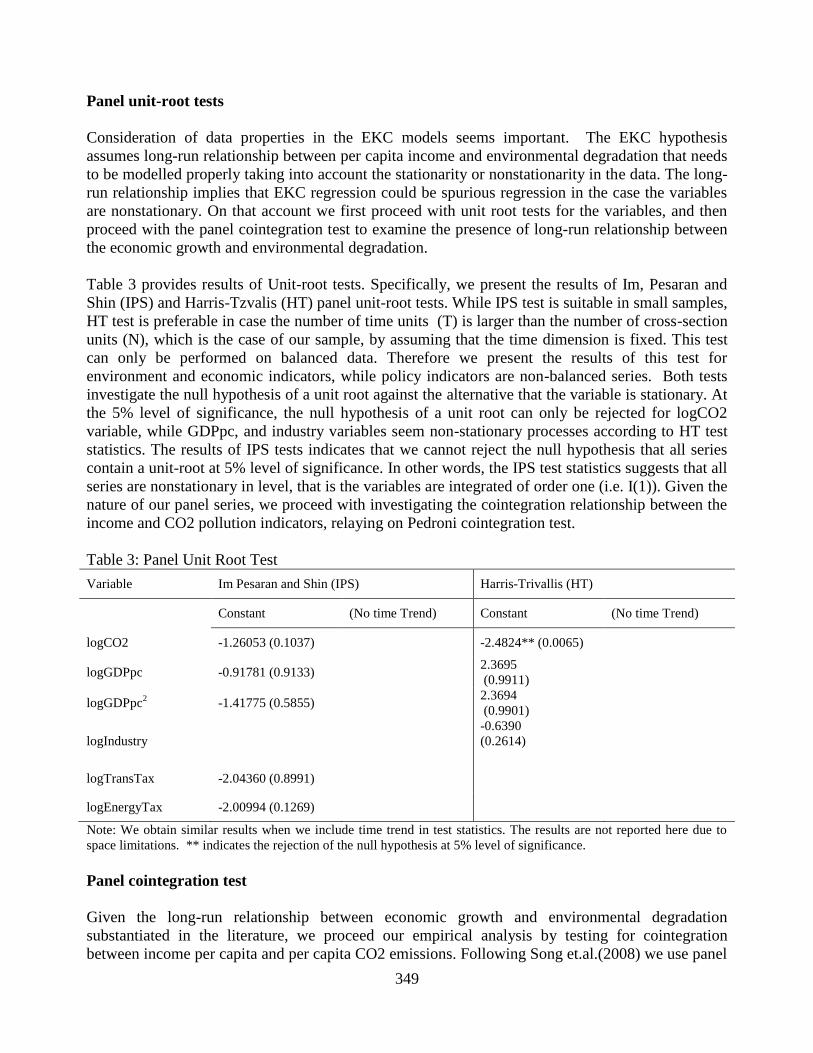
349
Panel unit-root tests
Consideration of data properties in the EKC models seems important. The EKC hypothesis
assumes long-run relationship between per capita income and environmental degradation that needs
to be modelled properly taking into account the stationarity or nonstationarity in the data. The long-
run relationship implies that EKC regression could be spurious regression in the case the variables
are nonstationary. On that account we first proceed with unit root tests for the variables, and then
proceed with the panel cointegration test to examine the presence of long-run relationship between
the economic growth and environmental degradation.
Table 3 provides results of Unit-root tests. Specifically, we present the results of Im, Pesaran and
Shin (IPS) and Harris-Tzvalis (HT) panel unit-root tests. While IPS test is suitable in small samples,
HT test is preferable in case the number of time units (T) is larger than the number of cross-section
units (N), which is the case of our sample, by assuming that the time dimension is fixed. This test
can only be performed on balanced data. Therefore we present the results of this test for
environment and economic indicators, while policy indicators are non-balanced series. Both tests
investigate the null hypothesis of a unit root against the alternative that the variable is stationary. At
the 5% level of significance, the null hypothesis of a unit root can only be rejected for logCO2
variable, while GDPpc, and industry variables seem non-stationary processes according to HT test
statistics. The results of IPS tests indicates that we cannot reject the null hypothesis that all series
contain a unit-root at 5% level of significance. In other words, the IPS test statistics suggests that all
series are nonstationary in level, that is the variables are integrated of order one (i.e. I(1)). Given the
nature of our panel series, we proceed with investigating the cointegration relationship between the
income and CO2 pollution indicators, relaying on Pedroni cointegration test.
Table 3: Panel Unit Root Test
Variable Im Pesaran and Shin (IPS) Harris-Trivallis (HT)
Constant (No time Trend) Constant (No time Trend)
logCO2 -1.26053 (0.1037) -2.4824** (0.0065)
logGDPpc -0.91781 (0.9133) 2.3695
(0.9911)
logGDPpc2 -1.41775 (0.5855)
2.3694
(0.9901)
logIndustry
-0.6390
(0.2614)
logTransTax -2.04360 (0.8991)
logEnergyTax -2.00994 (0.1269)
Note: We obtain similar results when we include time trend in test statistics. The results are not reported here due to
space limitations. ** indicates the rejection of the null hypothesis at 5% level of significance.
Panel cointegration test
Given the long-run relationship between economic growth and environmental degradation
substantiated in the literature, we proceed our empirical analysis by testing for cointegration
between income per capita and per capita CO2 emissions. Following Song et.al.(2008) we use panel
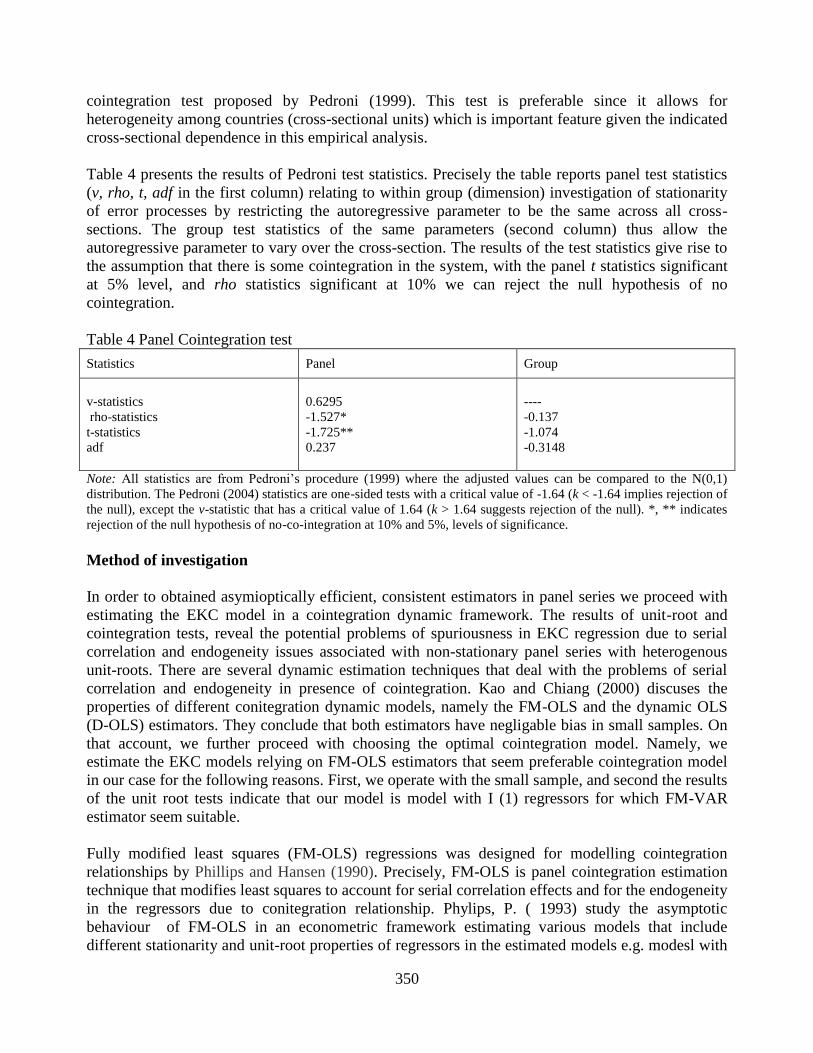
350
cointegration test proposed by Pedroni (1999). This test is preferable since it allows for
heterogeneity among countries (cross-sectional units) which is important feature given the indicated
cross-sectional dependence in this empirical analysis.
Table 4 presents the results of Pedroni test statistics. Precisely the table reports panel test statistics
(v, rho, t, adf in the first column) relating to within group (dimension) investigation of stationarity
of error processes by restricting the autoregressive parameter to be the same across all cross-
sections. The group test statistics of the same parameters (second column) thus allow the
autoregressive parameter to vary over the cross-section. The results of the test statistics give rise to
the assumption that there is some cointegration in the system, with the panel t statistics significant
at 5% level, and rho statistics significant at 10% we can reject the null hypothesis of no
cointegration.
Table 4 Panel Cointegration test
Statistics Panel Group
v-statistics
rho-statistics
t-statistics
adf
0.6295
-1.527*
-1.725**
0.237
----
-0.137
-1.074
-0.3148
Note: All statistics are from Pedroni’s procedure (1999) where the adjusted values can be compared to the N(0,1)
distribution. The Pedroni (2004) statistics are one-sided tests with a critical value of -1.64 (k < -1.64 implies rejection of
the null), except the v-statistic that has a critical value of 1.64 (k > 1.64 suggests rejection of the null). *, ** indicates
rejection of the null hypothesis of no-co-integration at 10% and 5%, levels of significance.
Method of investigation
In order to obtained asymioptically efficient, consistent estimators in panel series we proceed with
estimating the EKC model in a cointegration dynamic framework. The results of unit-root and
cointegration tests, reveal the potential problems of spuriousness in EKC regression due to serial
correlation and endogeneity issues associated with non-stationary panel series with heterogenous
unit-roots. There are several dynamic estimation techniques that deal with the problems of serial
correlation and endogeneity in presence of cointegration. Kao and Chiang (2000) discuses the
properties of different conitegration dynamic models, namely the FM-OLS and the dynamic OLS
(D-OLS) estimators. They conclude that both estimators have negligable bias in small samples. On
that account, we further proceed with choosing the optimal cointegration model. Namely, we
estimate the EKC models relying on FM-OLS estimators that seem preferable cointegration model
in our case for the following reasons. First, we operate with the small sample, and second the results
of the unit root tests indicate that our model is model with I (1) regressors for which FM-VAR
estimator seem suitable.
Fully modified least squares (FM-OLS) regressions was designed for modelling cointegration
relationships by Phillips and Hansen (1990). Precisely, FM-OLS is panel cointegration estimation
technique that modifies least squares to account for serial correlation effects and for the endogeneity
in the regressors due to conitegration relationship. Phylips, P. ( 1993) study the asymptotic
behaviour of FM-OLS in an econometric framework estimating various models that include
different stationarity and unit-root properties of regressors in the estimated models e.g. modesl with

351
I(1) regressors, models with I(1) and I (0) regressors, models with unit roots, models with only
stationary regressors and models with I(1) and I(0) regressors as well as deterministic trend.
According to Phylips, P. ( 1993) findings FM-OLS cointegration model has some interesting and
desirable features indicating hyperconsistency in the obtained coefficients when there is some
cointegration in the system, and also considering the different nature of the deterministic processes
of the regressors. Precisely, Phylips, P. ( 1993) point that when the system has full set of unit roots,
as is the case in this analysis ‘ the FM VAR estimator of the complete unit root matrix is
hyperconsistent’. On that account FM-OLS model seems preferable. Table 5 reports the empirical
results of the FM-OLS cointegration model.
4. Results
Table 5 report the results of econometric analysis. Precisely, we report the results of FM-OLS
cointegration model. Precisely, the table reports the results with respect to the 3 models estimated;
namely the reduced from equation, and the two models incorporating tax variables
First, we note that we estimate all equations with country specific and time specific effect. The
results reported in Table 5, strongly suggest the existence of EKC hypothesis when the relationship
between income per capita and per capita CO2 emissions is studied in a dynamic cointegration
framework. In all three models estimated we find strong evidence to support the significant relation
between income and pollution. Precisely, the relationship depicts an inverted U hypothesis in
reduced from equasion Model 2. Similarly, after controlling for environmental tax variables and
energy intensity of industry (Models 2 and 3; the variables are included singly intro the regression
equasion due to potential problem of multicolinearity between the environmental tax variables), the
income variable and its quadratic transformation remain significant, suggesting strong evidence in
support of EKC hypothesis in a transition economy context. However, these results need be treated
with caution given the indicated problem of multicolinearity in the data (see Table 2b and Appendix
1 - the correlation matrix and the VIF statistics i.e. 1/VIF is below 0.2 for the energy tax variable).
The environment does not seem to be a sole function of income, since other factors tend to explain
the shape of this relationship. The scale effect, proxied by the energy intensity of industries seem to
be the most important contributor to environmental degradation as a priori expected. Lower
economic efficiency of industries is associated with significant increases in CO2 emissions as
anticipated. This result implies the importance of technological progress and the subsequent
increases in energy efficiency of industries. Lower energy consumption of industries in relative
terms is associated with structural transformation of industries and higher value added of more
technologically sophisticated produce.
Finally, energy taxes seem not to be effective and seem associated with higher CO2 emissions. This
is to say, that energy taxes are ineffective for most industrial activities which face no or limited
alternatives to switch to lower energy use, while facing higher economic costs. In this particular
context, companies may very likely be incapable of inducing new technologies to comply with
stricter regulation, or to opt for alternatives, and continue scaling up their production activities
albeit with higher economic costs jeopardising their productivity, investment and employment
potentials. Transport taxes, on the other hand, are negatively related to CO2 emissions but the
results do not seem to render much support to the proposition that they present meaningful
instrument in curbing CO2 emissions. Transport taxes are expected to lower aggregate demand for

352
non-renewable resources such as oil and fossil-fuels, most probably because they can easily affect
behavioural patterns of individual consumption.
While government action is needed to prevent and limit environmental degradation, misguided
policies and inefective policy measures can generate opposite results. This is not to say that
governments should reconsider imposition of energy taxes, since the costs of environmental
degradation should be incorporated fully in prices. However, inducing environmentally friendly
technological innovation, and energy efficient technologies in particular goes well beyond
individual firm capacity, and taxing energy use may not lead to significant improvements in
environmental quality. These policy efforts should be accompanied by systematic and concurred
efforts of collectively inducing technological progress especially considering alternative energy use,
support to the use of renewable energy and its production, as effective means of protecting the
environment.
Finally, based on panel cointegration estimation and the obtained inverted U relationship between
income per capita and per capita CO2 emissions, we calculated the turning points i.e. the threshold
levels for all three models respectively. Essentially all threshold levels fall within the range of per
capita income in the sample. However, it is interesting to note that the threshold level increases
susbstantially once we control for energy tax suggesting the importance of integrating
environmental regulation in determining the turning points.
Table 5: Results
Model 1
Model 2
Model 3
logGDP pc .517***
( 2.32)
1.925***
(9.06)
.653***
(2.85)
logGDP pc
2 -.038***
(-2.53)
-.143***
(-9.72)
-.034***
(-2.23)
Energy industry .228***
(4.74)
.243***
(5.34)
.255***
(5.07)
Energy tax
.151***
(5.48)
Transport tax -.015
(-1.47)
Turning point (TP) 809
13,062 803
No. of observations
186
186
182
Notes: TP denotes turning point of quadratic curve; Turning point is computed by τˆ =exp(−0.5βˆ 1/βˆ2); Z statistics
are given in brackets; all regressions include a constant, country and time dummies (not reported in the table);
*denotes statistical significance at the level of 10%, **denotes statistical significance at the level of 5%, ***denotes
statistical significance at the level of 1%.
353
5. Conclusion
The purpose of this study was to analyse the presence of EKC hypothesis in the context of
transition, namely CEEC-10 countries (i.e. Czech Republic, Slovenia, Slovakia, Poland, Hungary,
Estonia, Latvia, Lithuania, Romania, Bulgaria). More importantly, an attempt has been made to
identify what role does the environmental policy and its specific tax policy measures play in
understanding the EKC hypothesis. The results of our analysis provide strong evidence on the
presence of EKC hypothesis. Notwithstanding this, energy intensity of industry seems to be the
most prominent factor associated with increases in CO2 emissions. Hence, we find no evidence to
support the proposition that energy taxes are effective means of lowering CO2 emissions. The tax
related incentive structures do not seem to lessen energy and pollution intensity, quite the contrary.
Moreover, transport taxes although negatively related to CO2, seem insignificant determinant of
lower CO2 emission.
This paper advances our understanding on the underlying mechanisms that explain the relationship
between income and pollution, by incorporating environmental policy factors that have not been
empirically investigated in previous literature, and by reflecting econometric issues suggested to be
taken into consideration in empirical investigation of the EKC hypothesis.
Following the obtained results, on the ineffectiveness of environmental taxes, we question the
popular perception that market-based instruments including environmental taxes are among the best
policy options. Environmental taxes are commonly considered most effective, more easily
administered and less costly compared to alternatives (OECD, 2001:2002). The basic premise is
that the costs of environmental degradation should be fully incorporated into the costs of production
- the view that the prices should fully reflect the costs of environmental degradation. However, we
argue that market-based instruments may still not be effective let alone sufficient to translate into
better environmental quality outcomes. Obviously, the impact of environmental taxes and other
incentive structures depend on host of factors, but predominantly on the structure of industrial base
and its diversification determining the character of further scaling and upgrading of production
activities, degree of technological sophistication of firms and industries on which it is being
imposed, the availability of technological solutions (presumably technologically friendly solutions)
and the complexity of its adoption.
References
Akbostanci, E.; Türüt-AsIk, S.; Ipek, T. G. 2009. The relationship between income and
environment in Turkey: is there an environmental Kuznets curve?, Energy Policy 37(3):
861–867.
Arrow, K., Bolin, B., Costanza, R., Dasgupta, P., Folke, C., Holling, C. S., ... & Pimentel, D.
(1996). Economic growth, carrying capacity, and the environment. Environment and
Development Economics, 1(01), 104-110.
Barros, F. G., Mendonca, A. F., & Nogueira, J. M. (2002). Poverty and environmental degradation:
The Kuznets environmental curve for the Brazilian case. Department of Economics Working
Paper Series, No. 267, Universidade De Brasília.
Beck, N., & Katz, J. N. (1995). What to do (and not to do) with time-series cross-section data.
American political science review, 89(03), 634-647.

354
Borghesi, S. (2000). Income inequality and the environmental kuznets curve. Fondazione
Enrico Mattei, Nota di lavoro No. 83.2000, Milan, Italy.
Caviglia-Harris J., Chambers L., Dustin K. and R. James, (2009). Taking the “U” out of Kuznets: A
comprehensive analysis of the EKC and environmental degradation”, Ecological
Economics, Elsevier, 68(4), 1149-1159.
Cole, M. A. (2007). Corruption, income and the environment: An empirical analysis. Ecological
Economics, 62, 637–647.
Cole, M. A., Rayner, A. J., & Bates, J. M. (1997). The environmental Kuznets curve: An empirical
analysis. Environment and Development Economics, 2(4), 401–416.
Constantini, V., & Martini, C. (2006). A modified environmental Kuznets curve for sustainable
development assessment using panel data. Fondazione Enrico Mattei, Nota di lavoro No.
148.2006, Milan, Italy.
Dasgupta, S., Wheeler, D., Roy, S., & Mody, A. (1995). Environmental regulation and
development: A cross country empirical analysis. World Bank Working Paper Series WPS
1448, Washington, DC.
De Bruyn, S. M. (1997). Explaining the environmental Kuznets curve: Structural change and
international agreements in reducing sulphur dioxide emissions. Environment And
Development Economics, 2, 485–503.
De Bruyn, S. M. (1997). Explaining the environmental Kuznets curve: Structural change and
international agreements in reducing sulphur dioxide emissions. Environment And
Development Economics, 2, 485–503.
Deacon, R. T. (2005). Dictatorship, democracy, and the provision of public goods. Department of
Economics Working Paper, University of California at Santa Barbara.
Deacon, R. T., & Norman, C. S. (2004). Is the Environmental Kuznets Curve an Empirical
Regularity? Department of Economics Working Paper, University of California at Santa
Barbara.
Deschenes, O., Greenstone, M., & Shapiro, J. S. (2012). Defensive investments and the demand for
air quality: Evidence from the nox budget program and ozone reductions (No. w18267).
National Bureau of Economic Research.
Dutt, K. (2009). Governance, institutions and the environment-income relationship: a cross-country
study. Environment, Development and Sustainability, 11(4), 705-723.
Ekins P., (2000). Economic Growth and Environmental Sustainability: The Prospects for Green
Growth, Routledge, London.
Galeotti, M., Lanza, A. and Pauli, F. (2006). Reassessing the environmental Kuznets curve for CO2
emissions: A robustness exercise.. Eco. Econ., 57: 152–163.
Greenstone, M. (2002). The impacts of environmental regulations on industrial activity: Evidence
from the 1970 and 1977 Clean Air Act admendments and the Census of Manufactures,
Journal of Political Economy 110:1175—1219.
Grossman, G. M., & Krueger, A. B. (1991). Environ-mental impacts of a North American Free
Trade Agreement. National Bureau of Economic Research Working Paper 3914, NBER,
Cambridge MA.
Harbaugh, W., Levinson, A., & Wilson, D. (2002). Reexamining the empirical evidence for an
environmental Kuznets curve. Review of Economics and Statistics 2002. MIT Press.
Hendersone, J. Vernon, (1996). The effects of air quality regulation. American Economic Review,
86(4).
Hsiao, C. (1986). Analysis of Panel Data. Cambridge University Press, Cambridge.

355
Inmaculada, M. Z. and Aurelia, B. M. (2004). Pooled mean group estimation of an environmental
Kuznets curve for CO2 .. Econ. Lett., 82: 121–126.
Landesmann, M. A., & Stehrer, R. (2001). Convergence patterns and switchovers in comparative
advantage. Structural Change and Economic Dynamics, 12(4), 399-423.
Kiviet, J. F. (1995). "On bias, inconsistency, and efficiency of various estimators in dynamic
panel data models." Journal of Econometrics 68(1): 53-78.
Liddle, B., & Messinis, G. (2015). Revisiting sulfur Kuznets curves with endogenous breaks
modeling: Substantial evidence of inverted-Us/Vs for individual OECD countries. Economic
Modelling, 49, 278-285.
Lleras-Muney, A. (2010). The needs of the army using compulsory relocation in the military to
estimate the effect of air pollutants on children’s health. Journal of Human Resources,
45(3), 549-590.
Millimet D. L., List J. A. and T. Stengos, (2003), “The Environmental Kuznets Curve: Real
Progress or Misspecified Models?,” The Review of Economics and Statistics, MIT Press,.
85(4), 1038-1047.
Panayotou, T. (1997). An inquiry into population, resources, and environment. In Ahlberg, D. A.,
Kelley, A. C., & Mason, K. O. (Eds.), The impact of population growth on well being in
developing countries. New York: Springer.
Silajdzic, S., and Mehic, E. (2015a), Absorptive Capabilities, FDI, and Economic Growth in
Transition Economies, Emerging markets, Finance and Trade, Published online 23 Sep
2015, pp.1-19. Published by Rutledge, DOI: 10.1080/1540496X.2015.1056000
Silajdzic, S., and Mehic, E. (2015b), The impact of environmental taxes on competitive
performance of pollution intensive industries among transition economies: evidence from
panel analysis, Eurasian Studies in Business and Economics, accepted for publication
(forthcoming), published by Springer, ISSN: 2364-5067.
Stern, D. I. (2004). The rise and fall of the environmental Kuznets curve. World Development,
32(8), 1419–1439.
Vollebergh, H., Melenberg, B., Dijkgraaf, E. (2009). Identifying reduced-form relations with
Wagner,M (2008). The carbon Kuznets curve: a cloudy picture emitted by bad econometrics?
Resour. Energy Econ. 30 (3), 388–408.
Walker, R. (2012). The transitional costs of sectoral reallocation: Evidence from the Clean Air Act
and the workforce. US Census Bureau Center for Economic Studies Paper No. CES-WP-12-
02.
Wang, Y.-C. (2013). Functional sensitivity of testing the environmental Kuznets curve hypothesis.
Resour. Energy Econ. 35, 451–466.
Yandle, B., Vijayaraghavan, M., & Bhattarai, M. (2004). The environmental Kuznets curve: A
review of findings, methods, and policy implications. PERC research study, Property and
Environment Research Center, Montana.

356
Appendix 1
Variance inflation factors (VIF) statistic
Variable | VIF 1/VIF
-------------+----------------------
log2RealGD~c | 361.33 0.002768
logRealGDPpc | 342.24 0.002922
logENERGYT~C | 6.90 0.144896
logTRANSPO~C | 2.00 0.498843
logINDUSTR~C | 1.08 0.922346
-------------+----------------------
Mean VIF | 142.71
Variable | VIF 1/VIF
-------------+----------------------
log2RealGD~c | 511.87 0.001954
logRealGDPpc | 475.69 0.002102
logENERGYT~C | 10.84 0.092271
logFDImanpc | 3.35 0.298066
logTRANSPO~C | 1.91 0.522998
logINDUSTR~C | 1.34 0.746375
-------------+----------------------
Mean VIF | 167.50

357
Appendix 2
Figure 1 Energy intensity and economic growth in the EU-28
(source Eurostat) Figure 2 Energy_intensity of the economy, 2004 and 2014_(kg of oil equivalent per 1000 EUR of
GDP)
(source Eurostat)

358
Figure 3 Environmentaltaxes by tax category,2014 (% of total environmental taxes)

359
REGULATORY IMPACT ASSESSMENT AND REDUCTION OF
ADMINISTRATIVE OBSTACLES: THE CASE OF THE FEDERATION OF
BOSNIA AND HERZEGOVINA
Vedad Silajdzic
School of Economics and Business
Trg Oslobodjenja – Alija Izetbegovic 1
Phone: ++ 387 33 275 930; Fax: ++ 387 33 275 994
E-mail: [email protected]
Fatima Mahmutcehajic
School of Economics and Business
Trg Oslobodjenja – AlijaIzetbegovic 1
Phone: ++ 387 33 253 772; Fax: ++ 387 33 275 994
E-mail: [email protected]
Abstract
The aim of this paper is to present the potential and necessary long-term development of
Regulatory Impact Assessment (RIA) and Reduction of Administrative Obstacles (RAO) in the
legislative procedure, with the goal of adopting better and more purposeful laws and regulations
for the society, citizens and businesses. To envisage new possibilities means to integrate the best
EU practices with as many initiatives as possible for simplification and reduction of regulatory
burden. This is why states and regions that wish to take part in the international framework of
business must expand and harmonise the heritage of traditional law making in order to meet the
new business conditions. The paper also provides an overview of prospective and urgent
measures which should be taken at the level of the Federation of Bosnia and Herzegovina.
Keywords: Regulatory Impact Assessment, better regulation, law, legislative procedure
JEL classification: K20
Acknowledgements
This paper is based on the authors' research and findings within the project “Establishment and/or
Strengthening of Capacities of the Institution/s for Control of Regulations and Establishment of
the System of Reduction of Administrative Barriers”, State Office for Public Administration,
Bosnia and Herzegovina (2016-2018). We would like to gratefully acknowledge the support of
the Project Team Leader professor Veljko Trivun, and to thank him for his extensive inputs. The
authors also thank all the members of the Supervisory and Implementation Teams at all levels of
the Government of Bosnia and Herzegovina for their assistance on this research project and their
insightful comments.
1. Introduction
The Global Competitiveness Report 2017-2018 was published at the moment when the world
economy started showing signs of recovery, and when further steps of growth and economic
development were being considered. Governments, companies and individuals have felt a high
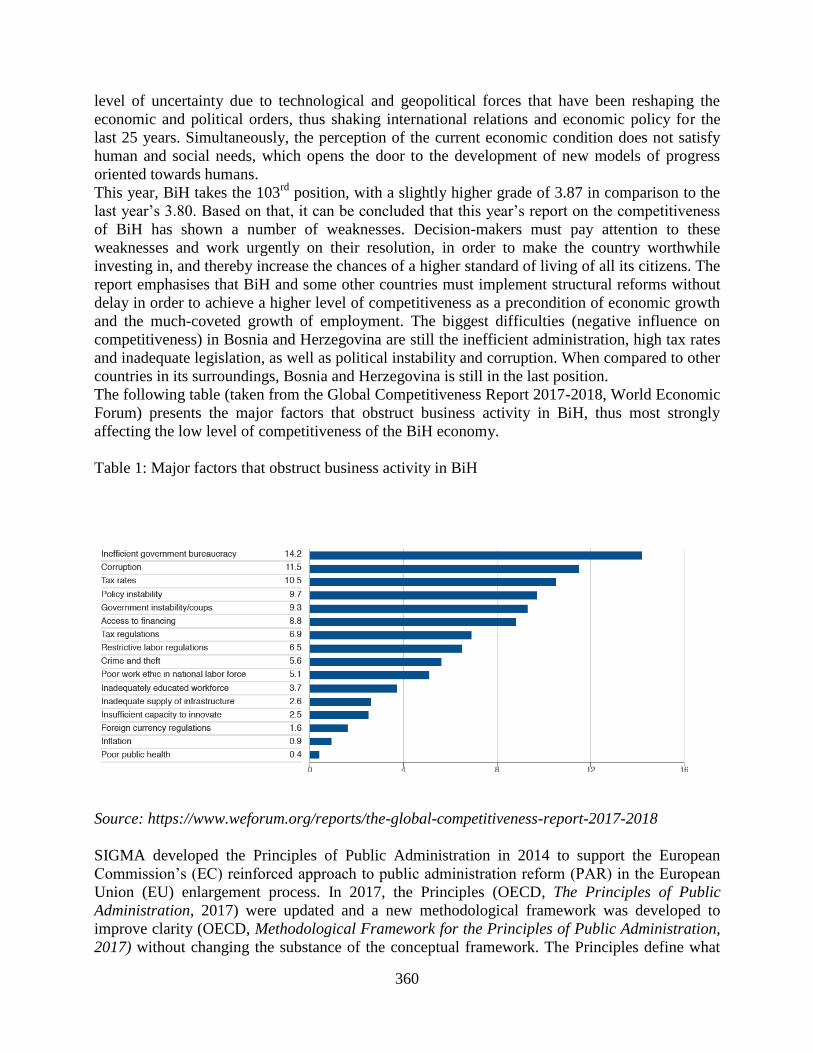
360
level of uncertainty due to technological and geopolitical forces that have been reshaping the
economic and political orders, thus shaking international relations and economic policy for the
last 25 years. Simultaneously, the perception of the current economic condition does not satisfy
human and social needs, which opens the door to the development of new models of progress
oriented towards humans.
This year, BiH takes the 103rd
position, with a slightly higher grade of 3.87 in comparison to the
last year’s 3.80. Based on that, it can be concluded that this year’s report on the competitiveness
of BiH has shown a number of weaknesses. Decision-makers must pay attention to these
weaknesses and work urgently on their resolution, in order to make the country worthwhile
investing in, and thereby increase the chances of a higher standard of living of all its citizens. The
report emphasises that BiH and some other countries must implement structural reforms without
delay in order to achieve a higher level of competitiveness as a precondition of economic growth
and the much-coveted growth of employment. The biggest difficulties (negative influence on
competitiveness) in Bosnia and Herzegovina are still the inefficient administration, high tax rates
and inadequate legislation, as well as political instability and corruption. When compared to other
countries in its surroundings, Bosnia and Herzegovina is still in the last position.
The following table (taken from the Global Competitiveness Report 2017-2018, World Economic
Forum) presents the major factors that obstruct business activity in BiH, thus most strongly
affecting the low level of competitiveness of the BiH economy.
Table 1: Major factors that obstruct business activity in BiH
Source: https://www.weforum.org/reports/the-global-competitiveness-report-2017-2018
SIGMA developed the Principles of Public Administration in 2014 to support the European
Commission’s (EC) reinforced approach to public administration reform (PAR) in the European
Union (EU) enlargement process. In 2017, the Principles (OECD, The Principles of Public
Administration, 2017) were updated and a new methodological framework was developed to
improve clarity (OECD, Methodological Framework for the Principles of Public Administration,
2017) without changing the substance of the conceptual framework. The Principles define what

361
good public governance entails in practice, and outline the main requirements to be followed by
countries during European integration (EI). The monitoring framework enables regular analysis
of progress made in applying the Principles and setting country benchmarks. In 2015, SIGMA
undertook comprehensive Baseline Measurement assessments for the seven EU enlargement
candidate countries and potential candidates against the Principles, and has continued to monitor
the progress of PAR since. The 2017 Monitoring Report, for the period May 2015 to June 2017,
covers six key areas of reform: strategic framework for public administration reform, policy
development and co-ordination, public service and human resource development, accountability,
service delivery and public financial management, including public procurement and external
audit (SIGMA, 2017:5)
The aim of this paper is to present the potential and necessary long-term development of
Regulatory Impact Assessment (RIA) and reduction of administrative obstacles (RAO) in the
legislative procedure, with the goal of adopting better and more purposeful laws and regulations
for the society, citizens and businesses. This has direct positive effects on the competitiveness of
Bosnia and Herzegovina, particularly on the identified factor that presents the greatest obstacle to
doing business in BiH: “Inefficient government bureaucracy”. (See table above: Major factors
that obstruct business activity in BiH, Global Competitiveness Report 2017-2018). The need for a
strategic orientation of the Government of the Federation of Bosnia and Herzegovina (FBiH
Government) towards the increase of quality of legislation in the Federation of Bosnia and
Herzegovina (FBiH) is evident.
In accordance with that, the review of the tools of RIA and RAO assessments will be provided
below, followed by the elaboration of why the systems of RIA and RAO were established, and
including recommendations for a potential strategic orientation of the development of this system
in the Federation of Bosnia and Herzegovina. These tools represent the basis for improving the
quality of legislation. This paper is based on the research within the project “Establishment and/or
Strengthening of Capacities of the Institution/s for Control of Regulations and Establishment of
the System of Reduction of Administrative Barriers”. By using legislation and literature analysis
of best practices, this paper attempts to present fresh research efforts and RIA perspectives of
both the practitioners and academia in the FBiH, in order to improve the practice of RIA in the
FBiH.
The paper is organised in the following manner. Section 2 lays out the importance of Regulatory
Impact Assessment and its correlation to quality of regulatory decision making and legal
efficiency. Section 3 presents the obstacles for efficient Regulatory Impact Assessment in
Federation of Bosnia and Herzegovina. This is why it is essential to provide long-term planning,
activities and follow-up of the system of Regulatory Impact Assessment and reduction of
administrative obstacles, which implies the existence of a strategic document on such. Priority
goals to overcome the obstacles of efficient Regulatory Impact Assessment at the level of the
Federation of Bosnia and Herzegovina is described in Section 4. Finally, Section 5 provides
concluding observations.
2. Definition and meaning of Regulatory Impact Assessment
In the contemporary society and economy, there is a constant need for new legislation. The
creation of new legislation requires a different perspective of the procedure of drafting and
compilation of legislation. The contemporary (“smart”) regulation is based on the principle that
new legislation must not create additional barriers to the development of the society and
economy. New legislation needs to reflect quality, responsible and transparent public policy that

362
supports the development of the society, the growth of the economy and the creation of new
values without unnecessary barriers to business activity (see more in Radaelli, 2005; Radaelli
2010; Radaelli, Dunlopa& Fritsch 2013)
The goals of governments are usually formulated in the form of public policies, and legislation is
an instrument used to achieve political visions and objectives. The creation of new legislation
inevitably produces costs and benefits for those that the legislation refers to, as well as for the
society as a whole. In an attempt for the new regulation to bring more benefits than costs,
governments use various tools for improving the quality of regulation and other acts. The
governments that apply different tools for the improvement of quality of regulation implement the
principles of better regulation, “smart” regulation. It is indisputable that the legal environment
directly affects (both positively and negatively) the business environment, and that the business
environment affects the competitiveness of a state and its attractiveness to investors.
Regulatory Impact Assessment (RIA) represents a systematic process of identification,
examination and testing of expected outcomes of the proposed regulations. It represents an
analytical document which is supposed to help in the process of decision-making. It does not
represent a replacement of political decisions, but merely a quality basis for adopting such
decisions. RIA is a particularly fascinating case for the analysis of the role of knowledge in
policy-making because it has quasi-scientific ambitions, but also takes place at the heart of a
government where political decisions are transformed into laws, regulations and other policy
instruments (J. Hertin et al., 2009:413)
The fundamental goal of Regulatory Impact Assessment is to examine all available solutions in
order to create a picture of their efficiency, which would enable selection of the best solution.
RIA is the process from which we get the following:
Quality analysis of the current state (lack of ex-post analyses),
Legislator is provided with an impartial, precise and reliable analytical basis for adopting
quality legislative provisions,
Elaboration of how the proposed regulations should improve business environment and
enable easier business activity (obligation from the reform agenda) and
Construction of a factual foundation of options based on relevant evidence.
This is yet another reason why the issues of RIA must be given much more significance. They
are, among other things, an unavoidable factor of legislative seriousness. Unfortunately, in
Bosnia and Herzegovina they are usually taken superficially, not given the appropriate relevance,
i.e. their application is of insufficient quality, very often done hastily and through urgent
procedures.
The enactment of good legal regulations represents a challenge for the state and its authorities, at
all the levels of government, which is supposed to provide the citizens and consumers the legal
security that they expect, simultaneously creating the conditions that enable the companies to
compete more effectively and be innovative in a very competitive global environment. Better
regulation must become smart regulation, and this goal, at the stage of drafting and adopting
regulation, must be a guideline to all those who participate in the process of adopting regulation
in any capacity. In this sense, the EU system is broader and not exclusively oriented to the
economic dimension. According to some economic analysis (Fritsch, Radaelli, Schrefler & Renda
2013:451) to specific items of cost-benefit analysis, results show that quantification and
monetization were still relatively problematic areas.
363
In the European Economic Recovery Plan (COM 2008 800), it is indicated that, in the present
context of economic and financial difficulties, with an increasing pressure on companies and
households, the quality of regulatory environment is more important than ever before. Also
recommendations in some policy papers are (Pickova, 2016:3) that the EU should aim for truly
systematic process of legislative burden reduction by trying the knots of original impact
assessment and the ex-post review, using unified methodology. Burden reduction targets should
be set out at the beginning of the legislative process so the later evaluation of the legislation's
impact can be measured against concrete data.
In OECD Regulatory Policy Working Paper is presented the potential contribution of a specific
regulatory policy tool - Regulatory Impact Assessment. It does this - promoting inclusive growth
through better regulation - by combining analyses of the nature of the inclusive growth and its
relationship with other policy goals and the role of RIA within the regulatory process (Deighton-
Smith, Erbacci, Kauffmann 2016:47).
To this extent, for the question and research that this paper tries to address, very important is a
case study analysis of the World Bank Group30
which presented a global unique data on RIA
implementation worldwide, highlighting best practices and identifying areas for improvement.
Regulatory Impact Assessment (RIA) is recognized by most developed countries as a key
instrument to improve the quality of regulatory decision making. RIAs are widely used within the
member countries of the Organisation for Economic Co-operation and Development (OECD).
Nowadays, an increasing number of developing countries implement new RIA procedures in their
regulatory governance systems as well. According to the abovementioned case study, RIA plays a
crucial role in improving rule making quality and promoting good governance. Authors of this
study concluded that even if assessments of a potential impact of regulatory changes are more
highly concentrated in richer countries than in the poorer ones, a quality RIA can be achieved at
all income levels.
In the Key Findings of the 2016 Global Indicators of Regulatory Governance (WB, 2016) among
the 185 countries sampled by the Global Indicators of Regulatory Governance, regulators in 90 of
the 185 economies surveyed do not conduct Regulatory Impact Assessment for the proposed
regulations. For those that do, the impact assessments vary in scope, charting the administrative
cost to the government of enforcing the new regulation and expected compliance costs for the
private sector. Survey results show that the scope and purpose of impact assessments encompass
a wide range of practices and methods.
It is an internationally accepted opinion that better regulation is vital for the economic
competitiveness of a country. Overly burdensome regulations and public institutions that
discourage the creation or expansion of business obstruct economic growth. This is particularly
relevant in the context of BiH, considering that, in the World Bank’s publication “Doing Business
2018” (index of ease of doing business in the world), BiH is in the 86th
position out of 190
countries, which is a low ranking as compared to other European countries.
According to some research and predictions from Open Europe, the cumulative cost of regulation
introduced between 1998 and 2008 for all 27 EU member states is € 1.4 trillion. Of this, 66%, or
€928 billion, is EU-sourced. If current trends continue, by 2018, the cost of EU regulation
introduced since 1998 will have risen to more than €3.017 trillion. This is over
€15,000 per household in the EU (Mats Persson, Stephen Booth & Sarah Gaskell, 2009:7)
30
This case study was written by Joseph Lemoine; the data was collected by the GIRG team under the general
supervision of Melissa Johns and Valentina Saltane. All the data used for this case study are available on the GIRG
website: rulemaking.worldbank.org.
364
Various regulatory and administrative burdens, restrictions, disproportionate legal obligations,
requirements and conditions for being granted licences, the long waiting period, bureaucratic
corruption, the obligation to publish data and information and specific legal regulations represent
obstacles to the competitiveness of FBiH. The conditions for the growth and competitiveness of
the economy may only be created in the circumstances where the public administration improves
the legislation in order to achieve as good a framework for business freedom as possible (see
more in: Annoni, Dijkstra, 2017). This is particularly important for the growing service sector, as
well as for the development of contemporary manufacturing production. In practice, numerous
European countries have civil servants who work explicitly on the detection and advocacy of
obstacle elimination, which is unfortunately not the practice in FBiH.
The top five most competitive economies in the world remain the same as in the previous year,
but their order changes. The United States returns to the first spot, followed by Hong Kong,
Singapore, the Netherlands and Switzerland. The Netherlands moves one place to the 4th
position, swapping with Switzerland which moves down to the 5th (IMD World Competitiveness
Rankings 2018 Results).
In a cross-country analysis, Jalilian, Kirkpatrick and Parker (2006:99) tested the hypothesis that
the efficiency and quality of regulation affects the economic performance of an economy. Two
proxies for regulatory effectiveness were included separately and then combined as the
determinants of economic growth performance, using both cross-sectional and panel data
methods. The results from both sets of modelling suggest a strong causal link between regulatory
quality and economic growth and confirm that the standard of regulation matters for economic
performance.
Arguably, however, the performance of the new regulatory state remains underresearched,
especially in the context of developing countries with their own peculiar economic and social
problems and institutional characteristics. Building effective regulatory structures in the
developing countries is not simply an issue of the technical design of regulatory instruments, it is
also concerned with the quality of supporting regulatory institutions and capacity (see more
in: Arndt, 2015). Many of the institutions that support markets are publicly provided, and the
effectiveness of these regulatory institutions will be an important determinant of how well
markets function. The quality of regulatory governance will affect regulatory outcomes, which in
turn can be expected to impact economic growth.
3. Regulatory Impact Assesment and reduction of administrative obstacles in FBiH: de lege
lata
Contemporary and modern public administration supports the development of the society and
market economy by creating quality legislation which is flexible and suits the needs of the
society, economy and citizens. Quality legislation is a precondition of development, and RIA is
one of the tools for drafting better policies and quality legislation.
Fundamentally, RIA is the most important tool that increases the quality of regulation through an
open, transparent and active search for more effective methods of resolving problems and
achieving the set goals without the creation of additional barriers for the citizens, civil society
organisations and business community, by the creation of more positive impacts, i.e. benefits in
relation to the expected negative effects, i.e. costs.
365
In SIGMA’s report for 2017, the implementation of the Principle 10: The policy-making and
legal-drafting process is evidence-based, and impact assessment is consistently used across
ministries, it is concluded that"Despite RIA requirements and availability of relevant
methodologies and guidelines at the Entity level, the overall quality of the analyses supporting
policy proposals is very poor across all levels of the administration. There are serious
shortcomings and the final decision making on policy proposals across all levels is not based on
evidence and analysis. The requirement to assess the financial implications of policy proposals
has been regulated at all levels of the administration but, in practice, this is not implemented
consistently." (SIGMA 2017:61). As it is clearly stated in SIGMA’s report for 2017, "The quality
of the policy-development process remains low. A recommendation in SIGMA’s 2015 Baseline
Measurement Report with regard to RIA has not been implemented." (SIGMA 2017:29)
At the level of FBiH, the Regulation on the Secretariat General of the Government of FBiH
(Official Gazette of FBiH, 40/13) was adopted, pursuant to which the Secretariat General, among
other things, performs the following tasks: coordinating the tasks that refer to the reform of public
administration and preparing appropriate reports for the Government; ensuring professional and
organisational foundations for the introduction of the methodology of Regulatory Impact
Assessment; coordinating the cooperation of the FBiH ministries and other FBiH administrative
authorities and the FBiH administrative organisations, as well as organisations that implement
public authorisations with the business community and civil society, in order to conduct the
procedures of Regulatory Impact Assessment; establishing and maintaining the electronic register
of administrative procedures in the Federation of Bosnia and Herzegovina; as well as
coordinating the cooperation of the Government with the civil society organisations. The
normative framework for RIA in the FBiH consists of the Decree on Regulatory Impact
Assessment Procedure, which was adopted in 2014.
The level of application of RIA in practice is still in infancy and is not sufficient, primarily
because there are no specific knowledges and skills in all the institutions that would appropriately
implement the adopted methodology, apply analytical methods and conduct the assessments of
potential effects of policies/regulations in their daily work. Accordingly, significant progress in
the substantial quality of the adopted policies/regulations has not yet been made, which would be
the result of the previous assessment of potential effects of the most relevant solutions contained
in the regulations/policies, systematic oversight of the application of the adopted
policies/regulations and the periodic audit (ex post) evaluation of the adopted
policies/regulations.
According to SIGMA's report,an overall indicator value for professional development and
training for civil servants is 2. This indicator measures the extent to which the legal framework
and the organisation of training, performance appraisal, mobility and promotion support fair
professional development in the civil service (SIGMA 2017:94). "The HR development of civil
servants is regulated in the legislation at all levels, but in practice the resources for training are
limited, in some cases the training budget was reduced to zero. Performance appraisal regulations
are in place, but grade inflation indicates that it is carried out only as a paper exercise or it is not
being used. The mobility and transfer of civil servants are regulated at all levels, but rarely used
in practice." (SIGMA 2017:94)
Considering this lack of experience and practice of RIA at the level of FBiH, and for the purpose
of identification and elimination of potential risks, upon the analyses which have

366
been or are being conducted at the level of FBiH, the following were identified as common
problems in the practice of RIA implementation:
a low level of application of analytical procedures that precede the drafting of regulations,
unsystematic and sporadic approach to the substantial examination of regulatory impact,
RIA is used to justify the decisions that had already been made,
RIA is seen as merely a new bureaucratic procedure, and
appropriate means (measures) for their implementation are not provided for.
In accordance with this, as a proposition of priority goals, there have been attempts to eliminate
the identified risks in the application of RIA.
One of the major causes of low competitiveness of the FBiH economy is a high level of
administrative burdens. Regulations significantly burden the business sector in the creation of
value and they make doing business difficult. Therefore, the main goals of the FBiH should be to
administratively disburden the economy for ca. 30% and eliminate administrative barriers to
doing business in the time period from 2018 to 2021. According to the indicative calculations of
employers in both entities, nearly a billion BAM is taken by parafiscal levies from the BiH
economy.
According to certain existing research, there are over 200 different parafiscal levies in BiH. Out
of those, 68 parafiscal levies are at the level of FBiH. Relevant research shows that the burden on
employers in BiH is the highest in the region and amongst the highest in Europe and amounts to
72.2%. For every BAM, 0.72 BAM must be paid to the state. With all the parafiscal levies at the
lower levels, depending on the canton or the municipality, employers must pay up to 0.90 BAM
for each BAM of salaries paid up. A separate matter of parafiscal levies concerns the problem
with investors. One of the key measures of the FBiH Government must be the Register of
Parafiscal Levies and the model of reduction and rationalisation of such burdens on the economy.
This will mark the beginning of administrative economy and the creation of competitive economy
in the FBiH.
In order to implement the SCM method which would precede such measures, it is necessary to
select regulatory areas which are assessed to have significant burdens on the economy. The
selection of such areas needs to be the result of consultations with the business sector. Taking
into consideration the experiences of the neighbouring countries in similar activities, as well as
the existing consultations with the business community, the SCM measurements and
administrative relief in the following eight regulatory areas are proposed: establishment of
business entities, sole proprietorships, sanitary and health conditions, trade, real estate brokerage,
occupational safety, public procurement and parafiscal levies.
4. Priority goals: de lege ferenda
An active role of all key players in the procedure of RIA and RAO will contribute to the quality
of the RIAs created and enable the adoption of legal regulations which will be of better quality
and clarity, and will not generate administrative barriers. This is why it is essential to provide
long-term planning, activities and follow-up of the system of Regulatory Impact Assessment and
reduction of administrative obstacles, which implies the existence of a strategic document on
such. The development of this system relies on the vision, mission and objectives which are
intended to be accomplished.
As previously mentioned, the objective of this paper is to present the potential orientation of the
FBiH Government towards the increase of the quality of legislation at the level of FBiH, through
367
appropriate application of RIA and RAO in legislative procedures, and in accordance with the
adopted Methodology of Impact Assessment and SCM Method. A potential strategic orientation
of the development of RIA and RAO is provided below.
Through appropriate application of RIA, better legislation needs to be ensured, so that legislation
achieves the set objectives with low costs and without unnecessary barriers. Through the
development of RIA, the FBiH Government lays the foundation for the creation of better and
“smart” regulation. The principle of “smart” regulation is to create flexible, simple, intelligible
regulation of good quality, which provides the basis for the development of the economy and
society. The existing and new legislation is a product consumed by business entities, civil society
organisations and citizens in daily operations and life.
Through appropriate reduction of administrative barriers, the development of the economy and
society needs to be ensured. The purpose is to create an incentive investment climate and simpler
business requirements. One of the main causes of low competitiveness of the FBiH economy is a
high level of administrative burdens. Regulations significantly burden the business sector in the
creation of value and hinder business activity. Therefore, it is recommended to administratively
relieve the economy for ca. 30% and eliminate administrative barriers to business activity.
Legislative framework needs to provide stability and simplicity of regulation, with low costs of
the use of legal rules and without the unnecessary daily barriers for those that such rules refer to.
Such a legislative framework is the foundation for stability and market development, the creation
of equal market opportunities for entrepreneurship, development of different initiatives of civil
society organisations to create and strengthen social equity and equality, along with the protection
and preservation of the living and natural environment.
An active cooperation and expertise of all participants in the legislative procedure and the RIA
and RAO procedures are a precondition for the development and successful implementation of
RIA and RAO. To create quality and “smart” legislation, it is necessary to plan regulation in
order to achieve an optimal usage of the limited resources and disburden the economy from
unnecessary administrative barriers. To achieve such legislation, the impacts of the new
regulations must be assessed, taking the economic, social and financial factors in consideration,
as well as the effects on the environment, and the reductions of administrative barriers must be
duly identified.
The mission of the FBiH Government should be to “ensure the development of an effective
system of RIA and RAO” through an active role of all the authorities responsible for the RIA and
RAO system, as well as with the participation of other authorities of state administration.
The priority goals of the FBiH Government should ensure the implementation of the RIA
procedure in accordance with the Methodology of Impact Assessment contained within the
Unified Rules and develop the good practice of RIA application. This goal encompasses several
activities that are aimed at reciprocal communication and exchange of acquired knowledge in the
implementation of RIA with the experts from the region and the EU. In addition, activities in this
priority goal include regular collection of data on the application of RIA which will identify
problems and risks of application. By analysing them, appropriate corrective measures will be
proposed, to eliminate problems in the application or analysis of good practice by proposing
measures for the improvement of the RIA procedure.

368
5. Final considerations and conclusions
An important segment of adopting better regulation is to have a “big picture” of their
economic, social and environmental impacts. Regulatory Impact Assessment, as a tool for
creating a better legal framework, and therefore also business framework, ensures for the
regulation to be based on the best possible facts, hence making it more efficient. In addition,
the reduction of administrative barriers is a priority part of the overall reform process aimed at
improving business environment and increasing competitiveness. In order to achieve this, the
Government of the Federation of Bosnia and Herzegovina should take the following steps as
strategic priorities and potential courses of action, with clear operational plans: 1. work
intensively on the reduction of administrative barriers by the application of the SCM method
(standard cost model); 2. implement a regulatory “guillotine” – which would imply the
analysis in accordance with the priorities of the existing legislation (laws and regulations),
and the provisions considered unnecessary would be abolished or simplified; 3. implement the
steps of a normative reconstitution – the procedure in which every part of legislation (laws
and regulations) is re-examined in reference to the question whether it should be regulated by
other existing acts: 4. implement the consolidation of legislation – based on the proposal,
consolidated texts of legislation (laws and regulations) are drafted based on all the
amendments made in the past or consolidated texts of regulations; 5. continuously follow the
enforcement of regulations and, to that effect, collect the necessary data in accordance with
the previously set time periods; and based on that,as the last activity, propose the amendments
to the regulations if the set goals of the regulations have not been accomplished. Better
regulation does not imply “more” or “less” regulation; better regulation is the regulation that
contributes to the achievement of the adopted policies, i.e. common goals of governments,
citizens and all influential interest groups.
References
A European Economic Recovery Plan 2008. Brussels, COM (2008) 800.
Annoni, P. & Dijkstra, L. 2017. Measuring and monitoring regional competitiveness in the
European Union, in R. Huggin 2017. Handbook of regions and competitiveness contemporary
theories and perspectives on economic development. Edward Elgar Publishing.
Arndt, C. et al. 2015. 2015 Indicators of Regulatory Policy and Governance: Design,
Methodology and Key Results. OECD Regulatory Policy Working Papers, No. 1, OECD
Publishing, Paris.
Decree on Regulatory Impact Assessment Procedure, Official Gazette FBiH, 55/2014
Deighton-Smith, R., A. Erbacci & C. Kauffmann 2016. Promoting inclusive growth through
better regulation: The role of regulatory impact assessment. OECD Regulatory Policy
Working Papers, No. 3, OECD Publishing, Paris, https://doi.org/10.1787/5jm3tqwqp1vj-en.
Accessed 8 August 2018

369
Fritsch, O., Radaelli, C.M., Schrefler, L. & Renda, A. 2013. Comparing the content of
regulatory impact assessments in the UK and the EU. Public Money & Management, 33(6):
445-452
Global Indicators of Regulatory Governance 2016, The World Bank
www.rolemaking.worldbank.org Accessed 8 August 2018
Global Indicators of Regulatory Governance: Worldwide practices of Regulatory Impact
Assessments, World Bank Group, Case study
http://pubdocs.worldbank.org/en/905611520284525814/GIRG-Case-Study-Worldwide-
Practices-of-Regulatory Impact-Assessments.pdf Accessed 8 August 2018
Hertin, J., Jacob, K., Pesch, U. & Pacchi, C. 2009. The production and use of knowledge in
regulatory impact assessment – An empirical analysis. Forest Policy and Economics, 11:
413–421
IMD World Competitiveness Rankings 2018 Results, https://www.imd.org/wcc/world-
competitiveness-center-rankings/world-competitiveness-ranking-2018 Accessed 8 August
2018
Jalilian, H., Kirkpatrick, C. & Parker, D. 2006. The Impact of Regulation on Economic
Growth in Developing Countries: A Cross-Country Analysis. World Development, 35(1): 99
OECD 2017. Methodological Framework for the Principles of Public Administration, OECD
Publishing, Paris, http://sigmaweb.org/publications/Methodological-Framework-for-the-
Principles-of-Public-Administration-November-2017.pdf Accessed 8 August 2018
OECD 2017. The Principles of Public Administration, OECD, Paris:
http://www.sigmaweb.org/publications/Principles-of-Public-Administration_Edition-
2017_ENG.pdf Accessed 8 August 2018
OECD/SIGMA 2017. Monitoring report: The principles of Public Administration, Bosnia and
Herzegovina, OECD Publishing: Paris
Persson, M., Booth, S. & Gaskell, S. 2009. Out of Control, Europe: Measuring a decade of
EU regulation, ed. by Lorraine Mullally, Open Europe
Pickova, Z. 2016. Policy paper: EU Better Regulation Agenda: Contested Policy in Central
European Perspective, Institute for European Policy
Radaelli, C.M. 2005. Diffusion without convergence: how political context shapes the
adoption of regulatory impact assessment. Journal of European Public Policy, 12(5): 924-
943.
Radaelli, C.M. 2010. Regulating Rule-Making via Impact AssessmentGovernance. An
International Journal of Policy, Administration, and Institutions, 23(1): 89–108.

370
Radaelli, C.M., Dunlopa, C.A. & Fritsch, O. 2013. Narrating impact assessment in the
European Union. European Political Science 12
Regulation on the Secretariat General of the Government of FBiH, Official Gazette of FBiH,
40/13
Siedel, J. George & Haapio, H. 2010. Using Proactive Law for Competitive Advantage,
American Business Law Journal, 47.
The Global Competitiveness Report 2017-2018 World Economic Forum
The proactive law approach: a further step towards better regulation at EU
level http://www.eesc.europa.eu/?i=portal.en.press-releases.400 Accessed 8 August 2018
Trivun, V. (ed.), Trivun, V., Silajdzic, V., Ademovic, K., Mahmutcehajic, F. 2017.
Methodology for Impact Assessment - Guide, Project “Establishment and/or Strengthening of
Capacities of the Institution/s for Control of Regulations and Establishment of the System of
Reduction of Administrative Barriers”, State Office for Public Administration, Bosnia and
Herzegovina (2016-2018).
Web sites:
http://archive.openeurope.org.uk/Content/documents/Pdfs/outofcontrol.pdf
http://ec.europa.eu/economy_finance/publications/publication13504_en.pdf
http://www.doingbusiness.org/data/exploreeconomies/bosnia-and-herzegovina
http://www.doingbusiness.org/reports/global-reports/doing-business-2018
371
LINKING STUDENTS' SATISFACTION WITH COMMUNICATION AND
THEIR OVERALL SATISFACTION: STUDENT AS A CUSTOMER
APPROACH
Emina Terzic
University of Travnik
Aleja konzula 5, Travnik
+387 61 748 680
Amna Ascic
Insitute for statistics of the FB&H
Zelenih beretki 26, Sarajevo
+387 62 144 276
Abstract
The higher education sector has been growing rapidly in recent decades. The impact of
globalization has not been bypassed by higher education. The emergence of privately
owned higher education institutions in contrast to those owned by the state has led to the
creation of harsh competition in the higher education market and the necessity for applying
the general theoretical principles of management and marketing in the governance of these
institutions. In such an academic environment where students have many options available
to them, factors that enable educational institutions to attract and retain students should be
seriously studied This study is designed to examine whether satisfaction with informal
communication and communication with teaching staff significantly contributes to the
overall satisfaction and to assess the impact of three factors (satisfaction with informal
communication, communication with teaching staff and type of the faculty) on the
likelihood that respondents would respond in order to recommend the same faculty to
others. Students’ responses were measured through an adapted questionnaire based on the
Likert scale from 1 to 7. The research sample includes 519 students from the public and
private higher education institutions. The results of the regression analysis revealed a
significant and positive impact of students' satisfaction with communication with the
teaching staff on the overall satisfaction. However, students' satisfaction with informal
communication does not contribute in explaining students’ overall satisfaction. Logistical
regression was conducted to assess the impact of three factors on the likelihood that
respondents would recommand the faculty to others. Satisfaction with informal
communication and satisfaction with communication with teaching staff have made a
statistically significant contribution to the model. Type of the faculty did not give a
statistically significant contribution to the model.
Keywords: Higher education, student-as-customer, student' satisfaction, communication
JEL classification: I23, M29

372
1. Introduction
Higher education is considered to be one of the most important components for the
development of an individual but also of the economic and social development of any
nation (Mukhtar et al., 2015). Knowledge, as a result of the process of education and as a
new type of capital, has an increasing impact on economic development of a country in
contemporary world economic trends, such as globalization and transition into post-
industrialized countries society (Cizmic and Cizmic, 2007).
The higher education sector has been growing rapidly in recent decades. The impact
of globalization has not been bypassed by higher education. The emergence of privately
owned higher education institutions in contrast to those owned by the state has led to the
creation of harsh competition in the higher education market and the necessity for applying
the general theoretical principles of management and marketing in the governance of these
institutions. Higher education institutions must apply market-oriented management
strategies, concepts, formulas and techniques in order to distinguish themselves from
competition and attract as many students as possible while meeting their needs and
expectations, and thus increase their income. In this competitive environment in which they
operate, today's higher education institutions face the challenge of retaining existing
students, attracting new ones and ensuring their satisfaction with academic experience
(Grossman and Rhodes, 2002, Thomas and Galambos, 2004). As a result, universities must
consider themselves as a “profit-making organisation” that is operating in a competitive
marketplace (Oldfield and Baron, 2000). Academics have noted the marketing of higher
education as a “necessary evil” that has relatively little to do with the ultimate goal of a
university (Bush et al. 1998). When it comes to university staff, there is a need to develop
awareness of the necessity of satisfying the needs of students in a way that meets
customers' expectations in the same manner as meeting customers' expectations in business
organizations (Kanji et al., 1999).
The concept of a student as a customer is not new. It was used by many authors
(Crawford, 1991; Hill, 1995; Narasimhan, 2001). Students pay tuition and expect the
greatest possible equivalent for the money they give, and for this reason, students are
viewed as costumers whose satisfaction is extremely important to keep existing and
attracting new students. The goal of a higher education institution must not be profit but the
satisfaction of customers, in other words, students. A satisfied customer will come again,
spread the word about his/her content and stay loyal. Hence, the higher education
institution will maximize its profit (Scott, 1999).
In such an academic environment where students have many options available to
them, factors that enable educational institutions to attract and retain students should be
seriously studied. .
2. Literature review and theoretical framework
Appleton-Knapp and Krentler (2006) imply that students' satisfaction with their
educational experience should be the desired outcome in the management of higher
education institutions. Satisfied customers often become loyal, repeat customers, meaning
373
they will continue to purchase the products and/or services and recommend them to others.
In other words, students' satisfaction will result in recommendations of that certain faculty
to friends, neighbors and colleagues (Blackmore et al., 2006). A large number of potential
students decide on a particular faculty based on the experience of others. The application of
the Bologna Declaration in higher education systems enabled student mobility from one
university to another and that imposed on universities the necessity of treating a student as
a customer, making their voices heard and for them to be respected (William, 2002).
Keeping existing students is as important as bringing new ones because it is much
more expensive to attract new students than to retain existing ones (Helgesen and Nesset,
2007). Satisfaction is the feeling of happiness that people obtain when they have fulfilled
his or her needs and desires (Saif, 2014). Customer satisfaction is achieved when a product
or service meets customers' expectations (Petruzzellis, 2006).
Students' satisfaction can be defined as the perception of enjoyment and
accomplishment in the learning environment (Sweeney and Ingram, 2001). It is a positive
predecessor of student loyalty, but also a result of the education system (Navarro, 2005).
When it comes to students' satisfaction, one cannot ignore the Self-Efficacy Theory
(Bandura, 1977). This theory relates to beliefs about one's capabilities to learn or to
perform certain activities. Essentially, students set academic and personal goals based on
their own self-assessment. Students with a high self-assessment level visualize positive
outcomes and set high goals for themselves. Those with lower self-assessment levels are
constantly doubting themselves. They visualize scenarios that contain obstacles to
achieving their goals and predict failure. Communication between a student and a professor
plays a key role in helping students achieve greater success and a higher level of self-
efficacy.
According to Maslow (1943), humans need to feel a sense of belonging and
acceptance and these needs come right after their physiological and safety needs. The
hierarchy of the need developed by Abraham Maslow (1943) is focused on the influence of
motivation on people. There are five different levels of Maslow’s hierarchy of needs:
physiological needs, security and safety needs, social needs, the need for appreciation and
respect (esteem needs), and self-actualization needs. In order to achieve ultimate goals,
however, a number of more basic needs must be met. The hierarchy of needs can serve as a
conceptual framework for communication at the faculty. Specifically, the physiological
needs of students include the need for books, computers, internet connection. Security and
safety needs are met in a way that colleagues, professors, teaching assistants and other
faculty staff make the student feel comfortable at the university. Social needs are met
through communication with the teaching staff and other faculty members, as well as with
colleagues. Positive and intensified interaction at the faculty will ensure that the needs for
appreciation and respect are met. Meeting the need for self-actualization is achieved by
allowing students to demand the knowledge they deem necessary; allowing them to
personalize the learning process and allowing students the opportunity to give their own
opinions on how to transfer knowledge.
Student satisfaction is linked with students' perception of enjoyment and
accomplishment in the learning environment (Sweeney and Ingram, 2001). The sense of
belonging to the group and being accepted by other students are key factors in achieving
success and completing studies (Kumar, Johnson, and Hardemon, 2013). Therefore, in
374
order to achieve success in studies which determine the satisfaction of students, it is
necessary, according to the Hierarchy of needs (Maslow, 1943), to develop a sense of
belonging to the faculty and satisfaction with the communication with colleagues and
faculty staff.
Student satisfaction is a multidimensional process conditioned by various factors
(Weerasinghe et al., 2017). Numerous studies were dealing with factors that influence
students' satisfaction and their retention. In these studies, factors that were often
underestimated are related to communication within the faculty. On a global scale, interest
has been shown to explore the importance of effective communication in organizations and
in educational institutions (Bush, 2011; Gorton and Alston, 2010, OECD, 2008). Informal
contacts of students with faculty staff are connected with the retention of students
(Terenzini and Pascarella, 1980) and the retention of students is conditioned by students’
satisfaction (Druzdzel and Glymor, 1995). Garcia-Aracil (2009) has conducted a survey in
eleven European countries and the results show that contact with colleagues has a positive
impact on students' satisfaction. According to research conducted by Yusoff et al. (2015),
students' relationship with professors and teaching assistants, assistance provided by the
faculty staff and received feedback all have a significant impact on student satisfaction.
Nasser et al. (2008) investigated students' knowledge of services and programs in relation
to their satisfaction. The study found that great knowledge about university procedures,
rules and reputation raises the level of student satisfaction. The quality of feedback, the
relationship between teachers and students and the interaction with colleagues have a great
impact on students' satisfaction with the university (Kuh and Hu, 2001;Sojkin, 2012).
Douglas et al (2008) concluded that communication is one of the most important
sources of satisfaction and dissatisfaction among students at the faculty.
3. Methodology
3.1. Research objectives and questions
This study is designed to examine whether satisfaction with informal communication and
communication with teaching staff significantly contributes to the overall satisfaction and
to assess the impact of three factors (satisfaction with informal communication,
communication with teaching staff and type of the faculty) on the likelihood that
respondents would respond in order to recommend the same faculty to others.
The following are the research questions in this study:
Q1. Is possible to explain the variance of student’s overall satisfaction with faculty by the
influence of satisfaction with informal communication?
Q2. Is possible to explain the variance of student’s overall satisfaction with faculty by the
influence of satisfaction with communication with teaching staff?
Q3. Does satisfaction with informal communication, communication with teaching staff
and type of the faculty predict probablity that respondents would respond in order to
recommend the faculty to others?
375
3.2. Research sample
The questionnaire was distributed to 600 undergraduate students in private and public (self-
financing students) sector faculties in Bosnia and Herzegovina. Out of 600 distributed
questionnaires, 552 completed questionnaires were received. 519 of them were usable.
Prior to completing the questionnaire, the respondents received information on the purpose
of the research and instructions on how to fill in the questionnaire accurately.
3.3. Data collection instrument
A questionnaire as a method of collecting data was used in this survey. The questionnaire
consists of five sections: demographic characteristics of the respondents, overall
satisfaction with faculty, satisfaction with communication and a single item question,
„Would you recommand this study to others“. Overall satisfaction with faculty was
measured by single-item question, „ How well are you satisfied with your faculty“, on a
Licert scale of 1 (extremly dissatisfied) to 7 (extremly satisfied). The questionnaire used
for measuring satisfaction with communication is based on the questionnaire developed by
Ana Tkalac Vercic (2009), called UPZIK, which uses the Likert scale from 1 to 7, with 1
being extremely dissatisfied and 7 extremely satisfied. The questionnaire was modified for
research purposes at a higher education institution. The question, „Would you recommand
this faculty to others“, had two possible answers, yes and no.
3.4. Data analysis
The data were analyzed using the Statistical Package for the Social Sciences (SPSS). A
principal component analysis (PCA) was conducted on 9 items of the satisfaction with
communication scale with direct oblimin rotation. Regression analysis was used to examine
whether satisfaction with informal communication and communication with teaching staff
significantly contributes to the overall satisfaction. Logistical regression was conducted to
assess the impact of three factors on the likelihood that respondents would respond in order
to recommand the faculty to others.
4. Results And Discussion
4.1. Profile of the respondents
Demographic information includes the following characteristics of the respondents: gender,
age, year of study and faculty type(private/public). Demographic characteristics presented
in Table 1. are based on frequencies and percentages.
In this study, there were 195 (38,2%) male students and 316 female students
(61,8%). 8 (1,5%) students did not respond about gender.
This study included 423 (81,8%) students between the age of 18-25; 33 (6,4%)
students between the age 25-30; 41 (7,9%) betweenthe age 31-40; 17 (3,3%) students
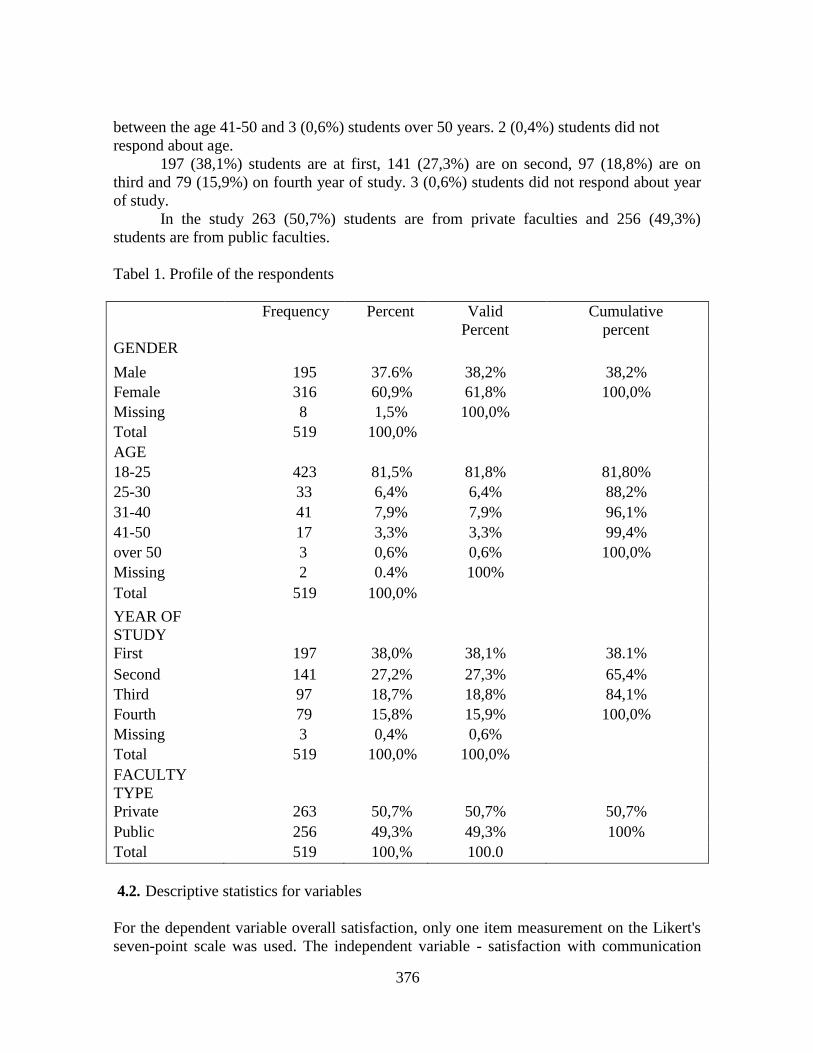
376
between the age 41-50 and 3 (0,6%) students over 50 years. 2 (0,4%) students did not
respond about age.
197 (38,1%) students are at first, 141 (27,3%) are on second, 97 (18,8%) are on
third and 79 (15,9%) on fourth year of study. 3 (0,6%) students did not respond about year
of study.
In the study 263 (50,7%) students are from private faculties and 256 (49,3%)
students are from public faculties.
Tabel 1. Profile of the respondents
Frequency Percent Valid
Percent
Cumulative
percent
GENDER
Male 195 37.6% 38,2% 38,2%
Female 316 60,9% 61,8% 100,0%
Missing 8 1,5% 100,0%
Total 519 100,0%
AGE
18-25 423 81,5% 81,8% 81,80%
25-30 33 6,4% 6,4% 88,2%
31-40 41 7,9% 7,9% 96,1%
41-50 17 3,3% 3,3% 99,4%
over 50 3 0,6% 0,6% 100,0%
Missing 2 0.4% 100%
Total 519 100,0%
YEAR OF
STUDY
First 197 38,0% 38,1% 38.1%
Second 141 27,2% 27,3% 65,4%
Third 97 18,7% 18,8% 84,1%
Fourth 79 15,8% 15,9% 100,0%
Missing 3 0,4% 0,6%
Total 519 100,0% 100,0%
FACULTY
TYPE
Private 263 50,7% 50,7% 50,7%
Public 256 49,3% 49,3% 100%
Total 519 100,% 100.0
4.2. Descriptive statistics for variables
For the dependent variable overall satisfaction, only one item measurement on the Likert's
seven-point scale was used. The independent variable - satisfaction with communication
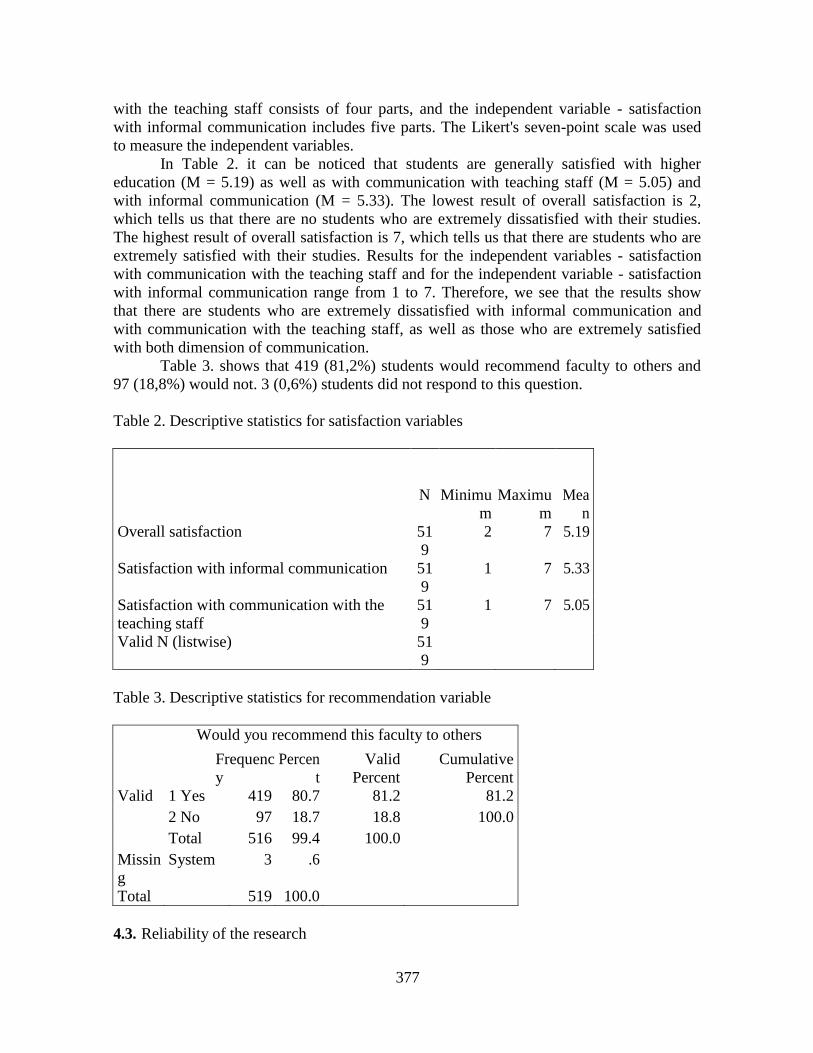
377
with the teaching staff consists of four parts, and the independent variable - satisfaction
with informal communication includes five parts. The Likert's seven-point scale was used
to measure the independent variables.
In Table 2. it can be noticed that students are generally satisfied with higher
education (M = 5.19) as well as with communication with teaching staff (M = 5.05) and
with informal communication (M = 5.33). The lowest result of overall satisfaction is 2,
which tells us that there are no students who are extremely dissatisfied with their studies.
The highest result of overall satisfaction is 7, which tells us that there are students who are
extremely satisfied with their studies. Results for the independent variables - satisfaction
with communication with the teaching staff and for the independent variable - satisfaction
with informal communication range from 1 to 7. Therefore, we see that the results show
that there are students who are extremely dissatisfied with informal communication and
with communication with the teaching staff, as well as those who are extremely satisfied
with both dimension of communication.
Table 3. shows that 419 (81,2%) students would recommend faculty to others and
97 (18,8%) would not. 3 (0,6%) students did not respond to this question.
Table 2. Descriptive statistics for satisfaction variables
N
Minimu
m
Maximu
m
Mea
n
Overall satisfaction 51
9
2 7 5.19
Satisfaction with informal communication 51
9
1 7 5.33
Satisfaction with communication with the
teaching staff
51
9
1 7 5.05
Valid N (listwise) 51
9
Table 3. Descriptive statistics for recommendation variable
Would you recommend this faculty to others
Frequenc
y
Percen
t
Valid
Percent
Cumulative
Percent
Valid 1 Yes 419 80.7 81.2 81.2
2 No 97 18.7 18.8 100.0
Total 516 99.4 100.0
Missin
g
System 3 .6
Total 519 100.0
4.3. Reliability of the research
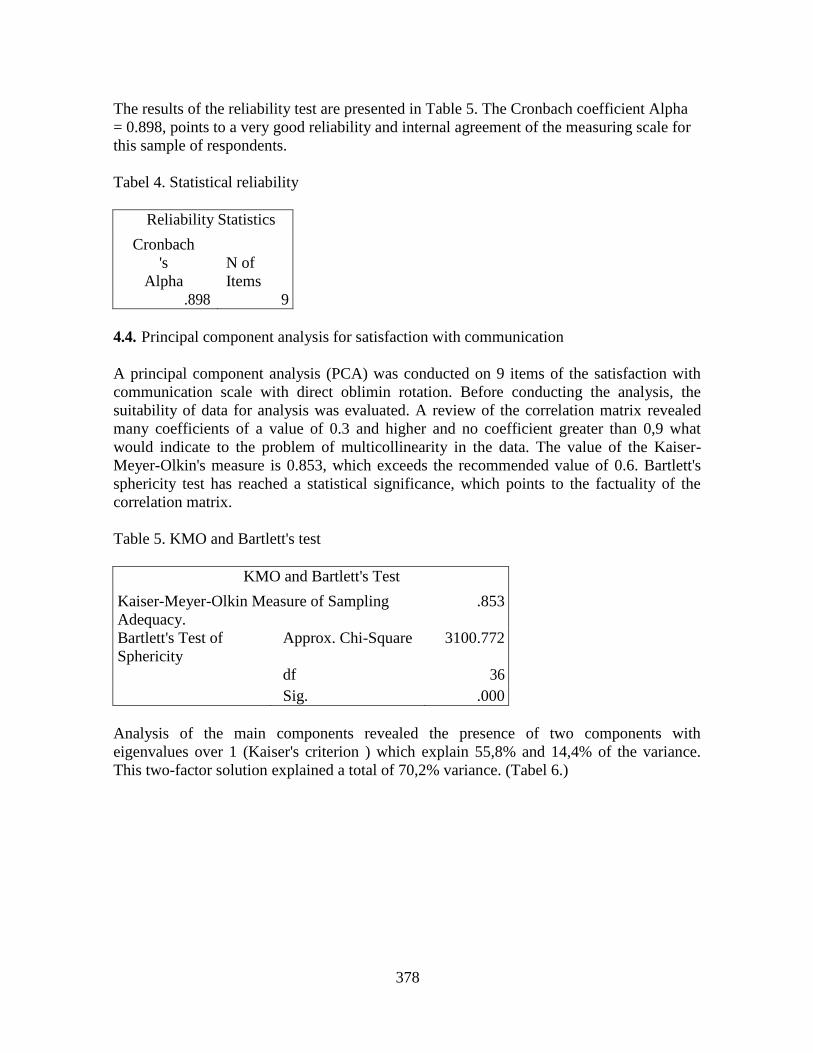
378
The results of the reliability test are presented in Table 5. The Cronbach coefficient Alpha
= 0.898, points to a very good reliability and internal agreement of the measuring scale for
this sample of respondents.
Tabel 4. Statistical reliability
Reliability Statistics
Cronbach
's
Alpha
N of
Items
.898 9
4.4. Principal component analysis for satisfaction with communication
A principal component analysis (PCA) was conducted on 9 items of the satisfaction with
communication scale with direct oblimin rotation. Before conducting the analysis, the
suitability of data for analysis was evaluated. A review of the correlation matrix revealed
many coefficients of a value of 0.3 and higher and no coefficient greater than 0,9 what
would indicate to the problem of multicollinearity in the data. The value of the Kaiser-
Meyer-Olkin's measure is 0.853, which exceeds the recommended value of 0.6. Bartlett's
sphericity test has reached a statistical significance, which points to the factuality of the
correlation matrix.
Table 5. KMO and Bartlett's test
KMO and Bartlett's Test
Kaiser-Meyer-Olkin Measure of Sampling
Adequacy.
.853
Bartlett's Test of
Sphericity
Approx. Chi-Square 3100.772
df 36
Sig. .000
Analysis of the main components revealed the presence of two components with
eigenvalues over 1 (Kaiser's criterion ) which explain 55,8% and 14,4% of the variance.
This two-factor solution explained a total of 70,2% variance. (Tabel 6.)

379
Table 6. Results of PCA
Total Variance
Explained
Initial Eigenvalues
Extraction Sums of
Squared
Loadings
Rotatio
n Sums
of
Squared
Loading
sa
Component
Total
% of
Varian
ce
Cumulati
ve
%
Total
% of
Varian
ce
Cumulati
ve
%
Total
1 5,019 55,764 55,764 5,019 55,764 55,764 4,312
2 1,297 14,411 70,175 1,297 14,411 70,175 3,931
3 ,910 10,112 80,286
4 ,467 5,188 85,474
5 ,405 4,503 89,977
6 ,299 3,320 93,298
7 ,275 3,056 96,354
8 ,193 2,143 98,497
9 ,135 1,503 100,000
Extraction Method: Principal Component Analysis.
a. When components are correlated, sums of squared loadings cannot be added
to obtain a total variance.
In order to better understand these two factors, the oblique rotation was used. The rotation
revealed the existence of a simple structure. The first factor has five factor loadings and the
second factor has four factor loadings.
Table 7. shows the factor loadings of all variables and the proportion of common variance
within a variable. The items that cluster on the same components suggest that component 1
represents students’ satisfaction with informal communication. Component 2 represents
students' satisfaction with communication with the teaching staff . In the part of the table
that refers to the part of the variance explained by the common factors, we see that all
variables fit well into their factor with other variables because they have a value greater
than 0.3.
Respecting Kaiser's criterion (retaining components with eigenvalues over 1), these two
components will be retained for further analysis. This criterion is accurate when the sample
size exceeds 250 and the average communality is greater than 0,6 what we have in our
sample.
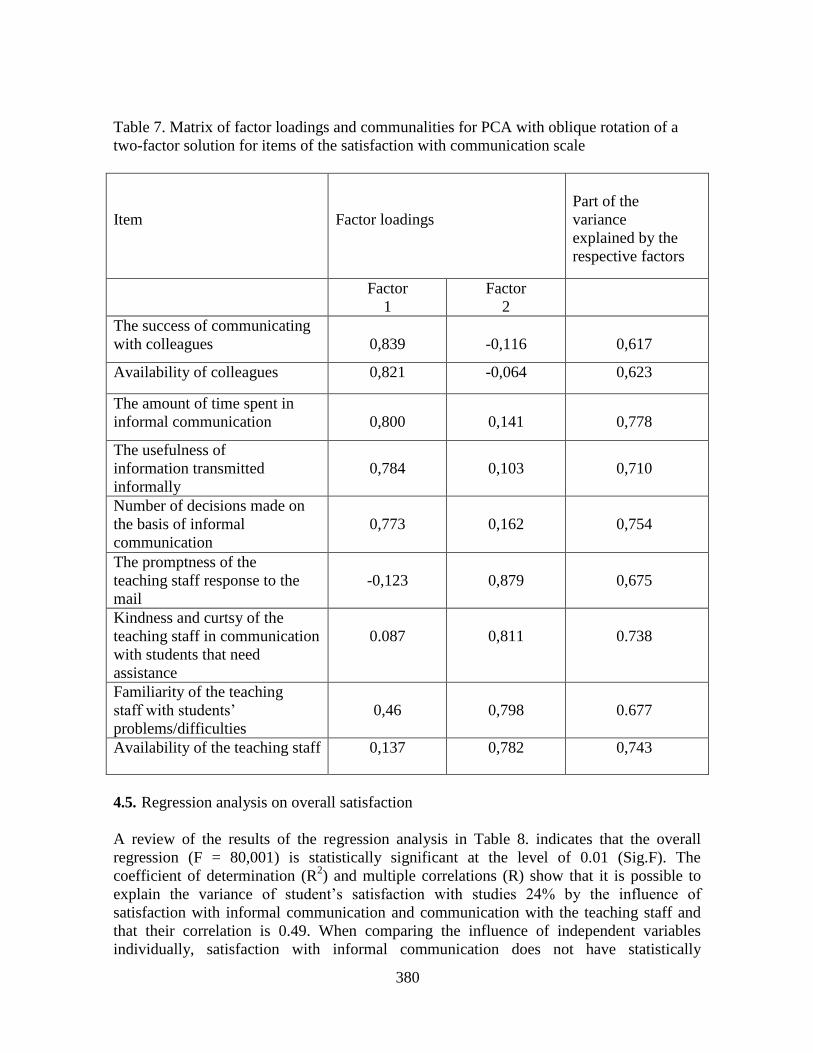
380
Table 7. Matrix of factor loadings and communalities for PCA with oblique rotation of a
two-factor solution for items of the satisfaction with communication scale
Item
Factor loadings
Part of the
variance
explained by the
respective factors
Factor
1
Factor
2
The success of communicating
with colleagues
0,839
-0,116
0,617
Availability of colleagues 0,821 -0,064 0,623
The amount of time spent in
informal communication
0,800
0,141
0,778
The usefulness of
information transmitted
informally
0,784
0,103
0,710
Number of decisions made on
the basis of informal
communication
0,773
0,162
0,754
The promptness of the
teaching staff response to the
-0,123
0,879
0,675
Kindness and curtsy of the
teaching staff in communication
with students that need
assistance
0.087
0,811
0.738
Familiarity of the teaching
staff with students’
problems/difficulties
0,46
0,798
0.677
Availability of the teaching staff 0,137 0,782 0,743
4.5. Regression analysis on overall satisfaction
A review of the results of the regression analysis in Table 8. indicates that the overall
regression (F = 80,001) is statistically significant at the level of 0.01 (Sig.F). The
coefficient of determination (R2) and multiple correlations (R) show that it is possible to
explain the variance of student’s satisfaction with studies 24% by the influence of
satisfaction with informal communication and communication with the teaching staff and
that their correlation is 0.49. When comparing the influence of independent variables
individually, satisfaction with informal communication does not have statistically

381
significant impact on satisfaction with studies and communication with teaching staff have
statistically significant impact on student’s satisfaction. The values of Beta coefficient
(0.07) and t - value (1,475) for satisfaction with informal communication are not
statistically significant at the level of 0.01.
The values of Beta coefficient (0,44) and t - value (9,312) for satisfaction with
communication with the teaching sty are statistically significant at the level of 0.01.
Table 8. Relation of students’ satisfaction with informal communication and
communication with the teaching staff and their overall satisfaction
R=0,49 R2=0,24 F - relation=80,001 Sig. F=0,000
Beta Part t-value p
Student’s satisfaction with informal communication 0,07 0,0
6
1,475 0,14
1
Students’ satisfaction with communication with the
teaching staff
0,44 0,3
6
9,312 0,00
0
4.6. Logistical regression on the probability that students would recommend the faculty to
others
Logistical regression was conducted to assess the impact of three factors on the likelihood
that respondents would recommend the faculty to others. The model contains three
independent variables (satisfaction with informal communication, satisfaction with
communication with the teaching staff and type of faculty). The whole model is statistically
significant χ2 (3, N=516)=38,38, p=0,000, which shows that the model distinguishes
respondents who did and also those who did not respond that they would recommend the
faculty to others. The model as a whole explains between 7,2% (Cox and Snell R square)
and 11,6% (Nagelkerke R square) variance in the choice of the same faculty and accurately
classifies 82,4% cases.
As shown in the Table 9., two independent variables (satisfaction with informal
communication and satisfaction with communication with teaching staff) have made a
statistically significant contribution to the model. Satisfaction with informal
communication has probability quotient 1,45. This shows that respondents who are more
satisfied with informal communication, respond 1,49 times more often that they would
recommand faculty to others, with all the other factors in the model equal. Probability
quotient of the satisfaction with communication with teaching staff is 1,33. This shows that
respondents who are more satisfied with communication with the teaching staff respond
1,33 times more often that they would recommand faculty to others, with all the other
factors in the model equal. Type of the faculty did not give a statistically significant
contribution to the model.

382
Table 9. Predicting the likelihood that a student would recommand faculty to others
95% C.I.for EXP(B)
B S.E
.
Wald df Sig Exp(B
)
Lowe
r
Upper
Satisfaction with informal
communication
0,3
7
0,1
3
8,55 1 0,0
0
1,45 1,13 1,86
Satisfaction with
communication with
teaching staff
0,2
9
0,1
1
6,61 1 0,0
0
1,33 1.07 1,65
Type of faculty 0,11 0,2
4
0,20 1 0,65 1,11 0,70 1,78
Constant -1,87 0,5
5
11,3
1
1 0.00 0,15
5. Conclusion
The first focus of this paper was on analysis of the relationships among two dimensions of
communication (informal communication and communication with the teaching staff) and
students overall satisfaction with studies. The second focus was on assessing the impact of
three factors (satisfaction with informal communication, satisfaction with communication
with the teaching staff and type of the faculty) on the likelihood that respondents would
respond in order to recommend the same faculty to others.
Results of the research conducted on students of the private and public sector
faculties in Bosnia and Herzegovina showed that satisfaction with informal communication
does not have statistically significant impact on overall sastisfaction which is also the
answer to our first research question. Results revealed a significant and positive impact of
students' satisfaction with communication with the teaching staff and overall satisfaction.
Satisfaction with communication with the teaching staff uniquely explains 13% of the
variance in the value of a variable overall satisfaction which is also the answer to our
second research question. Logistical regression model with three independent variables
(satisfaction with informal communication, satisfaction with communication with the
teaching staff and type of the faculty) was statistically significant wich shows that model
distinguishes respondents who did and also those who did not respond that they would
recommend the faculty to others. Ssatisfaction with informal communication and
satisfaction with communication with the teaching staff have made a statistically significant
contribution to the model. Type of the faculty did not give a statistically significant
contribution to the model. It is the answer to our third research question.
Economic circumstances in Bosnia and Herzegovina in the future could lead to even
stronger competition among faculties in order to attract and retain students. Unemployment,
slow economic growth, outflows of the population and a fall in birth rates will lead to a
reduction in the number of students at faculties. In such an academic environment students
have many options available to them. Students' satisfaction is one of the factor wich will
result in their attraction, retention and in recommendations of that certain faculty to others.
This paper analyzed only satisfaction with communication as a sources of satisfaction and
dissatisfaction among students at the faculty. This could be considered as a limitation of

383
this study, but also as a recommendation for future researchs. Factors with influence on
attraction and retention of students should be in detail studied.
References
Appelton-Knapp, S.I. & Krentler, K. A. 2006. Measuring students expectations and their
effects on satisfaction: the importance of managing student expectations. Journal of
Marketing Education, 28(3): 254-264.
Bandura, A. 1977. Self-efficacy: Toward a unifying theory of behavioral change.
Psychological Review, 84(2):191-215.
Bush, V., Ferrell, O. & Thomas, J., Jr.1998. Marketing the Business School; An
Exploratory Investigation. Journal of Service Marketing, 11 (1): 66-80.
Bush, T. 2011. Theories of Educational Leadership and Management (4th
edition). London:
Sage Publications Inc.
Crawford, F. 1991. Total quality management. Committee of Vice-Chancellors and
Principals, Occasional paper, London.
Cizmic, E. & Imamovic-Cizmic, K. 2007. Uloga obrazovanja i znanstvenih radnika u
procesu ekonomskog razvoja - Role of education and scientists in economic
development process. Pregled – Casopis za drustvena pitanja Univerziteta u
Sarajevu (Periodical for social Issues University of Sarajevo), 1-2:137-174.
Douglas, J., McClelland, R. & Davies, J. 2008. The development of conceptual model of
student satisfaction with their expirience in higher education. Quality Assurance in
Education, 16(1), pp.19-35.
Druzdzel, M. J. & Glymour, C. 1995. Application of the TETRAD II program to the study
of student retention in US colleges. Procedia of the AAAI-94 KDD Workshop, 419-
430.
Garcl a-Aracil, A. 2009. European graduates’ level of satisfaction with higher
education. Journal of Higher Education, 57(1):1-21.
Gorton, R. & Alston , J. A. 2011. School Leadership and Administration: Important
Concepts, Case Studies, and Simulations. New York.
Grossman, J. & Rhodes, J. 2002. The test of time: Predictors and effects of duration in
youth mentoring. American Journal of Community Psychology, 30:199-219.
Helgesen, O. & Nesset, E. 2007. What accounts for students loyality? Some field study
evidence. International Journal of Education Management, 21(2):126-143.
Hill, F.M. 1995. Managing service quality in higher education: the role of the student as
primary consumer. Quality Assurance in Education, 3 (3):10-21.
Kanji, G.K, Abdul Malek bin A. Tambi & Wallace, W. 1999. A comparative study of
quality practices in higher education institutions in the US and Malaysia. Total
quality management, 10(3):357-371.
Kuh, G. & Hu, S. 2001. The effects of student-faculty interaction in the 1990s. Review of
Higher Education, 24(3):309-332.
Kumar, S., Johnson, M. & Hardemon, T. 2013. Dissertations at a distance: Students’
perceptions of online mentoring in a doctoral program. International Journal of E-
Learning and Distance Education, 27(1).

384
Mukhtar, U., Anwar, S., Ahmed, U. & Baloch, M. A. 2015. Factors effecting the service
quality of public and private sector universities comparatively: an empirical
investigation. Arts, Science & Commerce, 132-142.
Narasimhan, K. 2001. Improving the climate of teaching sessions: the use of evaluations by
students and instructors. Quality in Higher Education, 7(3):53-65.
Nasser, R., Khoury, B. & Abouchedid, K. 2008. University students’ knowledge of services
and programs in relation to satisfaction. Quality Assurance in Education, 16(1): 80-
97.
Navarro, M. M., Iglesias, M. P. & Torres, P. R. 2005. A new management element for
universities: satisfaction with the offered courses. International Journal of
Educational Management, 19(6):505-526.
OECD. 2008. Improving School Leadership Project. Paris
Oldfield, B.M. and Baron, S. 2000. Student perception of service quality in a UK university
business and management faculty. Quality Assurance in Education, 8(2):85-95.
Petruzzellis, L., D’Uggento, A. M. & Romanazzi, S. 2006. Student satisfaction and quality
of service in Italian universities. Managing Service Quality, 349-364.
Saif, N. I. 2014. The Effect of Service Quality on Student Satisfaction: A Field Study for
Health Services Administration Students. International Journal of Humanities and
Social Science,172-181.
Scott, S. V. 1999. The academic as a service provider: is the customer always right?
Journal of Higher Education Policy and Management, 21(2):193-202.
Sojkin, B., Bartkowiak, P. & Skuza, A. 2012. Determinants of higher education choices and
student satisfaction: the case of Poland. Higher Education, 63 (5):565-81.
Sweeney,J. & Ingram, D. 2001. A comparison of traditional and web-based tutorials in
marketing education: An exploratory study. Journal of Marketing Education,
23(1):55-62.
Teo, C.L. (2001). Realities of private institution. New Strait time, 4.
Terenzini, P. T. & Pascarella, E. T. 1980. Toward the validation of Tinto’s model of college
student attrition: A review of recent studies. Research in Higher Education, 12(3):
271-282.
Thomas, E.H. & Galambos, N. 2004. What satisfies students? Mining student-opinion data
with regression and decision tree analysis. Research in Higher Education, 45
(3):251-269.
Weerasinghe, S., Lalitha, R. and Fernando, S. 2017. Students satisfaction in higher education
literature review. American Journal of Educational Research, 5(5): 533- 539.
William, J. 2002. The student satisfaction approach: student feedback and its potential role
in quality assessment and enhacement. 24th
EAIR Forum, Prague, 8-11 Septembar.
Yusoff, M., McLeay, F. & Woodruffe-Burto, H. 2015. Dimensions driving business student
satisfaction in higher education. Quality Assurance in Education, 86-104.
385
GOOD COMMUNICATION – THE ANTECEDENT OF ORGANIZATIONAL
IDENTIFICATION AND JOB SATISFACTION
Lejla Turulja
School of Economics and Business
Sarajevo Trg oslobodjenja – Alija
Izetbegovic 1
Phone: ++ 387 33 275 970; Fax: ++ 387 33 275 900
E-mail: [email protected]
Nijaz Bajgoric
School of Economics and Business
Sarajevo Trg oslobodjenja – Alija
Izetbegovic 1
Phone: ++ 387 33 275 950; Fax: ++ 387 33 275 900
E-mail: [email protected]
Abstract
In this study, we investigate the relationships between supervisory communication and
horizontal and informal communication on one hand and job satisfaction and organizational
identification on the other using sample of 230 employees in BH companies. Besides, the
relationship between job satisfaction and organizational identification is analyzed. Both
supervisory communication and horizontal and informal communication are positively
related to job satisfaction and organizational identification. Also, job satisfaction is
positively related to organizational identification. With regard to communication media,
there is a significant difference in the job satisfaction concerning the use of face-to-face or
computer-mediated communication by supervisors. On the other hand, there is no significant
difference in job satisfaction regarding face-to-face or computer-mediated communication in
horizontal and informal communication.
Keywords: communication, face-to-face communication, computer-mediated
communication, job satisfaction, organizational identification
JEL classification: D83
Acknowledgments
We acknowledge Ilma Kavazovic for assistance in data collection.
1. Introduction
For the past 20 years, firms are facing increased challenges when it comes to the business
environment. These business challenges are a result of the development of information

386
technology, market globalization, increased competition, unpredictable and turbulent
markets and changes in social trends (Akkirman and Harris, 2005).
Communication is a crucial factor in the achievement of all organizational goals
(Sadia et al., 2016; Ruck and Welch, 2012). The role of management in developing effective
internal communication is critical, as well as to be able to assess internal communication
(Ruck and Welch, 2012). Besides, the satisfaction of employees in communication is
essential for organizational development and fulfillment of organizational goals (Sadia et al.,
2016).
Schulze et al. (2017) emphasize that effective communication inevitably determine the
prediction of some essential organizational results, like leadership, individual and team
performance.
With the advancement of technology, traditional forms of interpersonal
communication are changing significantly. New forms of communication are emerging,
virtual teamwork and collaboration in the dispersed geographic area have added additional
challenges for employees of a contemporary business environment (Schulze et al., 2017).
The development of information technology has contributed to the change in many business
operating aspects, including communication. CM communication has become overwhelming
in today's workplace interactions.
Do face-to-face (FtF) and computer-mediated (CM) communication have the same
impact on employees' job satisfaction? The current study addresses this question with the
goal of contributing to i) a deeper understanding of the relationships between
communication and job satisfaction and organizational identification among employees, and
ii) a more detailed understanding of the relationship between the type of communication
(FtF and CM) and employees’ job satisfaction.
2. Literature review
2.1. Organizational communication
The role of communication is an essential factor in understanding the value of intangible
organizational assets, primarily the generation of social and communication capital (Ruck
and Welch, 2012).
Vertical communication helps in achieving the organizational strategy and goals.
Vertical communication represents a top-down and bottom-up communication. Top-down
communication is the communication type where different management levels inform
employees about organizational strategy, mission, and goals, as well as their expectations
regarding employees working activities. Bottom-up communication represents the ability for
employees to participate in decision-making (Bartels et al., 2010). Supervisory
communication involves communication with superiors.
Horizontal communication refers to formal and informal communication that takes
place among people who are at the same hierarchy regarding organizational levels. Formal
communication refers to task-related communication. On the other hand, informal
communication involves communication between employees on privacy issues that are not
particularly important for the performance of tasks (Bartels et al., 2010).
387
2.2. Job satisfaction
Job satisfaction is the degree to which people like their jobs (Chiva and Alegre, 2009) or “an
employee’s affective reactions to a job based on a comparison of desired outcomes and
actual outcomes” (Chiva and Alegre, 2008).
Authors of previous studies have been studying a lot of job satisfaction for a number
of reasons. When employees are satisfied with the job, their behavior at the workplace will
be directed towards achieving the goals of the company, which will affect the company's
performance (Rowden, 2002). Job satisfaction is mainly influenced by working and
organizational conditions (Chiva and Alegre, 2008).
2.3. Organizational identification
Bartels et al. (2010) define organizational identification as "the perception of oneness with
or belongingness to an organization, where the individual defines him or herself in terms of
the organization(s) in which he or she is a member”. When employees identify themselves
with their organization, this results in an increase in job satisfaction (Bartels et al., 2010).
They see themselves as being at one with the organization, and they make no differentiation
between their own and organizational activities (De Ridder, 2004).
Edwards (2005) states that OI is a crucial psychological condition that reflects the
relationship between employee and organization and therefore potentially can explain and
predict many important attitudes and behaviors in the workplace.
OI increases the likelihood that an employee will remain in the organization and
perform work activities following the strategic interests of the organization (Edwards, 2005;
Van Dick et al., 2005). One of the dominant approaches to OI in literature is the social
identity theory (SIT) that suggests that individuals identify themselves with a particular
group by personal or social identities. In other words, people tend to categorize the human
race into specific social groups, and then assign themselves to one of the groups (Edwards,
2005).
3. Theory and hypotheses development
Schulze et al. (2017) list several theories in the area of CM communication:
Media richness theory determines communication along the continuum of richness.
FtF communication is the highest in richness, while textual communication is much
lower in the hierarchy. The reason for this is that FtF communication potentially
includes the body language and facial expression.
Media naturalness theory presumes that FtF communication is the evolutionary
oldest mode of interaction and that it is perceived as the most natural way of
communication, as it permits the transmission of facial expressions and the
observation of the body language.
Electronic propinquity theory recognizes the reduced bandwidth of CM
communication and assumes that these channel constraints create a diminished sense
388
of proximity to the communicators.
Social information processing theory emphasizes the shortcomings of CM
communication. However, this theory holds that individuals can use specific proxies,
such as smileys, to supplement CM communication.
Carrière and Bourque (2009) note that the relationship between communication and
job satisfaction is positive, i.e., employees reporting higher levels of communication
satisfaction tend to be more satisfied with their jobs. The most initial research was focused
on the relationship between supervisory communication and job satisfaction. However,
horizontal communication has been confirmed as a significant antecedent of job satisfaction
(Carrière and Bourque, 2009). Therefore, we propose the following hypotheses:
H1. Satisfaction with supervisory communication is positively related to job
satisfaction.
H2. Satisfaction with horizontal and informal communication is positively related to
job satisfaction.
Earlier studies proposed and empirically proved that higher levels of organizational
communication lead to higher levels of organizational identification (Smidts, Pruyn and Van
Riel, 2001). Based on the findings from previous research the following research hypotheses
were proposed:
H3. Satisfaction with supervisory communication is positively related to
organizational identification.
H4. Satisfaction with horizontal and informal communication is positively related to
organizational identification.
Organizational identification positively influences job satisfaction because
employees with a strong organizational identity perceive their job as proof of their
organizational membership (Van Dick et al., 2004). The stronger an employees’
identification with their organization, the more likely it is that they will act in accordance
with the organization’s expectations (Karanika-murray et al., 2015). Thus, we propose the
following hypothesis:
H5. Organizational identification is positively related to job satisfaction.
Compared to face-to-face interaction, computer-mediated communication reduces a
social context such as non-verbal information and status signals. Accordingly, participants
are more anonymous and more focused on themselves and less on others (Wilson, Straus and
McEvily, 2006). Consequently, it can lead to differences in the perception of communication
and satisfaction with it concerning FtF and CM communication. Accordingly, we suggest
the following hypotheses:
H6. There is a significant difference in the job satisfaction with regard to FtF or CM
communication with supervisors.
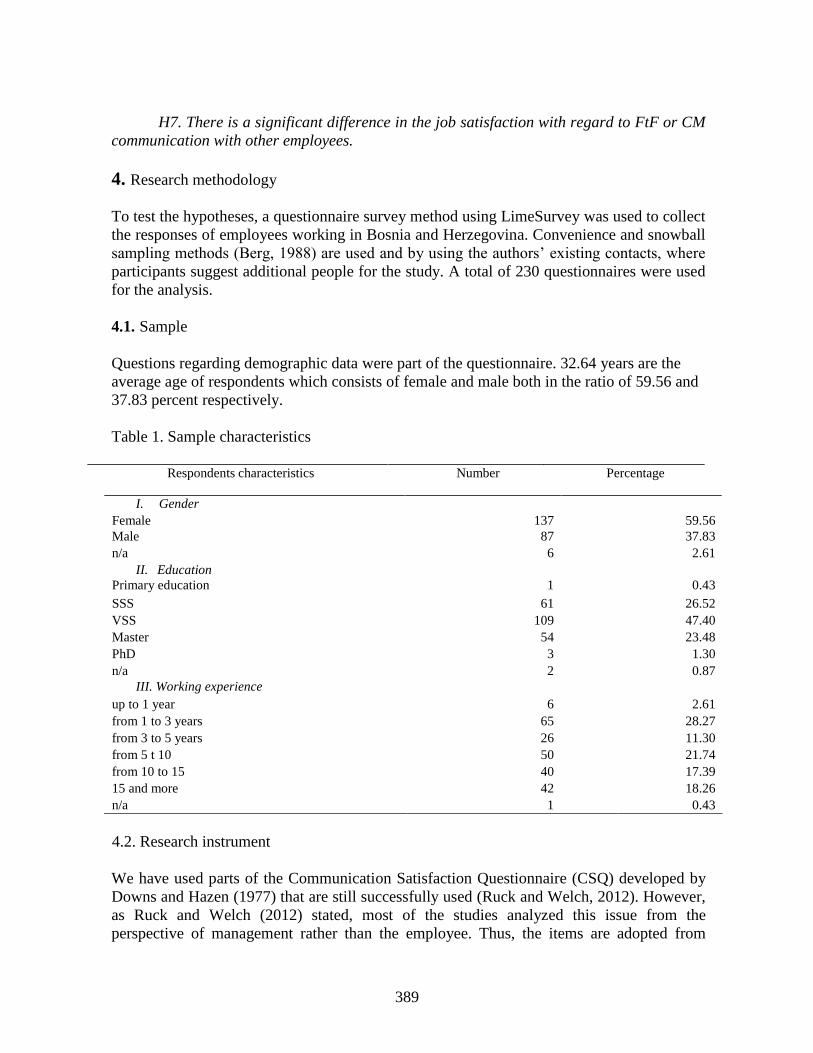
389
H7. There is a significant difference in the job satisfaction with regard to FtF or CM
communication with other employees.
4. Research methodology
To test the hypotheses, a questionnaire survey method using LimeSurvey was used to collect
the responses of employees working in Bosnia and Herzegovina. Convenience and snowball
sampling methods (Berg, 1988) are used and by using the authors’ existing contacts, where
participants suggest additional people for the study. A total of 230 questionnaires were used
for the analysis.
4.1. Sample
Questions regarding demographic data were part of the questionnaire. 32.64 years are the
average age of respondents which consists of female and male both in the ratio of 59.56 and
37.83 percent respectively.
Table 1. Sample characteristics
Respondents characteristics Number Percentage
I. Gender
Female 137 59.56
Male 87 37.83
n/a 6 2.61
II. Education
Primary education
1
0.43
SSS 61 26.52
VSS 109 47.40
Master 54 23.48
PhD 3 1.30
n/a 2 0.87
III. Working experience
up to 1 year 6 2.61
from 1 to 3 years 65 28.27
from 3 to 5 years 26 11.30
from 5 t 10 50 21.74
from 10 to 15 40 17.39
15 and more 42 18.26
n/a 1 0.43
4.2. Research instrument
We have used parts of the Communication Satisfaction Questionnaire (CSQ) developed by
Downs and Hazen (1977) that are still successfully used (Ruck and Welch, 2012). However,
as Ruck and Welch (2012) stated, most of the studies analyzed this issue from the
perspective of management rather than the employee. Thus, the items are adopted from
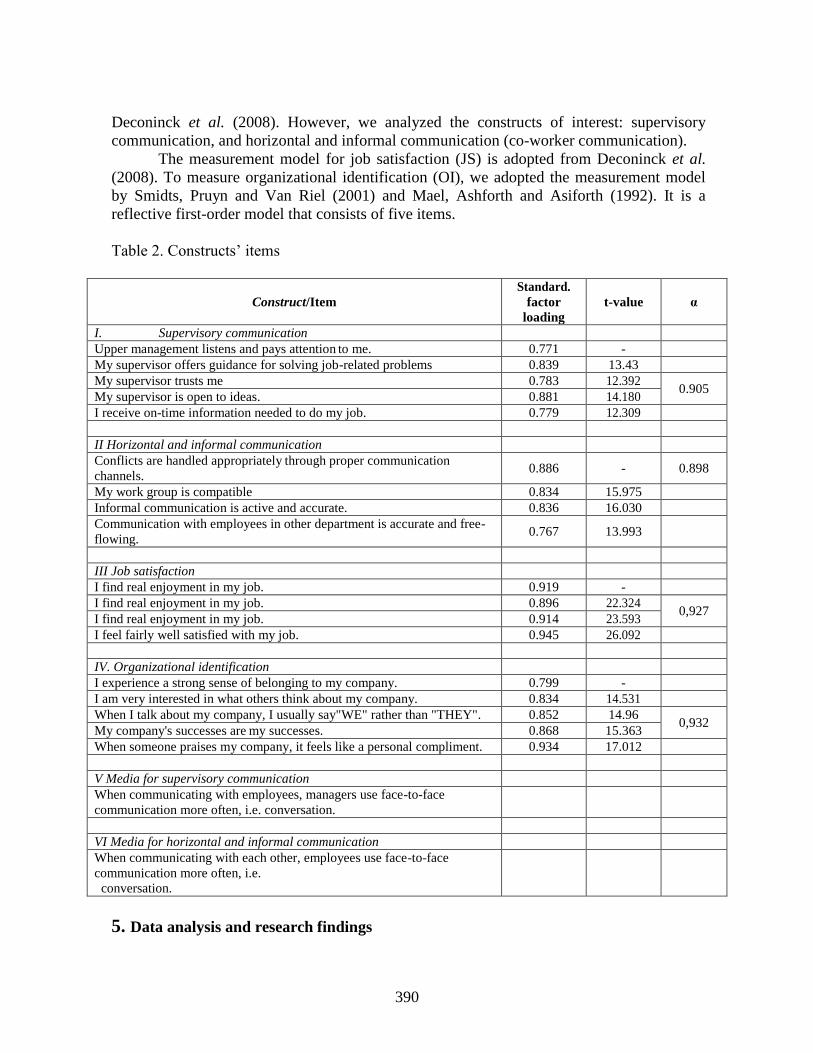
390
Deconinck et al. (2008). However, we analyzed the constructs of interest: supervisory
communication, and horizontal and informal communication (co-worker communication).
The measurement model for job satisfaction (JS) is adopted from Deconinck et al.
(2008). To measure organizational identification (OI), we adopted the measurement model
by Smidts, Pruyn and Van Riel (2001) and Mael, Ashforth and Asiforth (1992). It is a
reflective first-order model that consists of five items.
Table 2. Constructs’ items
Construct/Item
Standard.
factor
loading
t-value α
I. Supervisory communication
Upper management listens and pays attention to me. 0.771 -
My supervisor offers guidance for solving job-related problems 0.839 13.43
My supervisor trusts me 0.783 12.392 0.905
My supervisor is open to ideas. 0.881 14.180
I receive on-time information needed to do my job. 0.779 12.309
II Horizontal and informal communication
Conflicts are handled appropriately through proper communication
channels. 0.886 - 0.898
My work group is compatible 0.834 15.975
Informal communication is active and accurate. 0.836 16.030
Communication with employees in other department is accurate and free-
flowing. 0.767 13.993
III Job satisfaction
I find real enjoyment in my job. 0.919 -
I find real enjoyment in my job. 0.896 22.324 0,927
I find real enjoyment in my job. 0.914 23.593
I feel fairly well satisfied with my job. 0.945 26.092
IV. Organizational identification
I experience a strong sense of belonging to my company. 0.799 -
I am very interested in what others think about my company. 0.834 14.531
When I talk about my company, I usually say"WE" rather than "THEY". 0.852 14.96 0,932
My company's successes are my successes. 0.868 15.363
When someone praises my company, it feels like a personal compliment. 0.934 17.012
V Media for supervisory communication
When communicating with employees, managers use face-to-face
communication more often, i.e. conversation.
VI Media for horizontal and informal communication
When communicating with each other, employees use face-to-face
communication more often, i.e.
conversation.
5. Data analysis and research findings
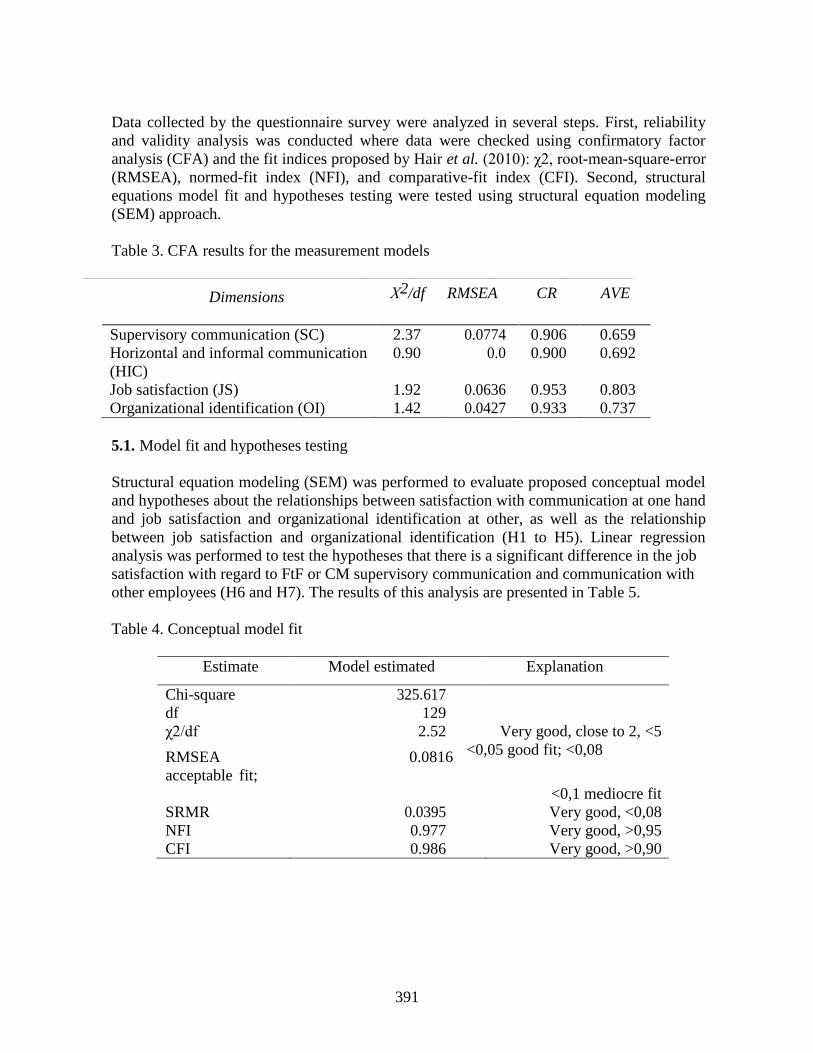
391
Data collected by the questionnaire survey were analyzed in several steps. First, reliability
and validity analysis was conducted where data were checked using confirmatory factor
analysis (CFA) and the fit indices proposed by Hair et al. (2010): χ2, root-mean-square-error
(RMSEA), normed-fit index (NFI), and comparative-fit index (CFI). Second, structural
equations model fit and hypotheses testing were tested using structural equation modeling
(SEM) approach.
Table 3. CFA results for the measurement models
Dimensions Χ2/df RMSEA CR AVE
Supervisory communication (SC) 2.37 0.0774 0.906 0.659
Horizontal and informal communication
(HIC)
0.90 0.0 0.900 0.692
Job satisfaction (JS) 1.92 0.0636 0.953 0.803
Organizational identification (OI) 1.42 0.0427 0.933 0.737
5.1. Model fit and hypotheses testing
Structural equation modeling (SEM) was performed to evaluate proposed conceptual model
and hypotheses about the relationships between satisfaction with communication at one hand
and job satisfaction and organizational identification at other, as well as the relationship
between job satisfaction and organizational identification (H1 to H5). Linear regression
analysis was performed to test the hypotheses that there is a significant difference in the job
satisfaction with regard to FtF or CM supervisory communication and communication with
other employees (H6 and H7). The results of this analysis are presented in Table 5.
Table 4. Conceptual model fit
Estimate Model estimated Explanation
Chi-square 325.617
df 129
χ2/df 2.52 Very good, close to 2, <5
RMSEA 0.0816 <0,05 good fit; <0,08
acceptable fit;
<0,1 mediocre fit
SRMR 0.0395 Very good, <0,08
NFI 0.977 Very good, >0,95
CFI 0.986 Very good, >0,90

392
Table 5. Hypotheses testing
Proposed model fits the data well. Satisfaction with both supervisory and horizontal
and informal communication positively impact job satisfaction and organizational
identification. In other words, employees who are satisfied with the company's
communication system will have a higher level of job satisfaction, but also identification
with the organization. In addition, organizational identification also enhances job
satisfaction.
The regression coefficients for supervisory communication was significant (β=-
0.151, t=-1.790, p<0.1). Thus, communication media impact the satisfaction with the
supervisory communication. However, communication media has no impact on the
satisfaction with the horizontal and informal communication (β=0.068, t=0.807, p>0.1).
Table 6. Conclusion on hypotheses testing
Hypothesis Result
H1. Satisfaction with supervisory communication is positively related to job satisfaction. Accepted
H2. Satisfaction with horizontal and informal communication is positively related to job satisfaction. Accepted
H3. Satisfaction with supervisory communication is positively related to organizational identification. Accepted
H4. Satisfaction with horizontal and informal communication is positively related to
organizational identification. Accepted
H5. Job satisfaction is positively related to organizational identification. Accepted
H6. There is a significant difference in the job satisfaction with regard to FtF and CM communication
with supervisors. Accepted
H7. There is a significant difference in the job satisfaction with regard to FtF and CM Rejected
6. Conclusion, limitations and recommendations
It was hypothesized that employees who a higher level of satisfaction with both supervisory
and horizontal and informal communication will be more satisfied with their work and have
higher levels of organizational identification. The proposed conceptual model consisted of
five hypotheses is confirmed. Results showed that satisfaction with both supervisory and
horizontal and informal communication has a strong and positive effect on job satisfaction
and organizational identification and corroborates the findings of Carrière and Bourque
(2009). Besides, organizational identification has a strong and positive effect on job
satisfaction and corroborates the findings of Karanika-murray et al. (2015).
393
Expanding on this, the effect of both supervisory and horizontal and informal
communication on job satisfaction considering the used media, i.e., face-to-face or
computer- mediated communication is analyzed. The results showed that there is a
significant difference in job satisfaction with regard FtF or CM supervisory communication
showing that FtF is the preferable type. However, when it comes to horizontal and informal
communication, there is no significant difference in job satisfaction whether FtF or CM
communication is used.
Internal communication systems that succeed in resulting in employee identification
will have a positive impact on the job satisfaction.
References
Akkirman, A. D. and Harris, D. L. (2005) ‘Organizational communication satisfaction in the
virtual workplace’, Journal of Management Development, 24(5), pp. 397–409.
Bartels, J. et al. (2010) ‘Horizontal and vertical communication as determinants of
professional and organisational identification’, Personnel Review, 39(2), pp. 210–
226.
Berg, S. (1988) Snowball sampling—I, Encyclopedia of statistical sciences. Edited by S.
Kotz et al. Wiley online library.
Carrière, J. and Bourque, C. (2009) ‘The effects of organizational communication on job
satisfaction and organizational commitment in a land ambulance service and the
mediating role of communication satisfaction’, Career Development International,
14(1), pp. 29–49.
Chiva, R. and Alegre, J. (2008) ‘Emotional intelligence and job satisfaction: the role of
organizational learning capability’, Personnel Review, 37(6), pp. 680–701.
Chiva, R. and Alegre, J. (2009) ‘Organizational Learning Capability and Job Satisfaction:
An Empirical Assessment in the Ceramic Tile’, British Journal of Management, 20,
pp. 323–340.
Deconinck, J. I. M. et al. (2008) ‘An Examination of the Validity of the Downs and Hazen
Communcation Satisfaction Questionnaire’, Marketing Management Journal, 18(2),
pp. 145–153.
Van Dick, R. et al. (2004) ‘Should I Stay or Should I Go? Explaining Turnover Intentions
with Organizational Identi cation and Job Satisfaction’, British Journal of
Management, 15, pp. 351–360.
Van Dick, R. et al. (2005) ‘Category salience and organizational identification’, Journal of
Occupational and Organizational Psychology, 78(2), pp. 273–285.
Downs, C. W. and Hazen, M. D. (1977) ‘A Factor Analytic Study of Communication
Satisfaction’, The Journal of Business Communication, 14(3), pp. 63–73.
Edwards, M. R. (2005) ‘Organizational identification: A conceptual and operational review’,
International Journal of Management Reviews, pp. 207–230.
Hair, J. F. J. et al. (2010) Multivariate Data Analysis. 7th editio. Pearson Prentice Hall.
Karanika-murray, M. et al. (2015) ‘Organizational indentification, work engagement, and
job satisfaction’, Journal of Managerial Psychology, 30(8), pp. 1019–1030.
Mael, F., Ashforth, B. E. and Asiforth, B. E. (1992) ‘Alumni and Their Alma Mater: A
Partial Test of the Reformulated Model of Organizational identification’, Journal of
Organizational Behavior, 13(13), pp. 103–123.
394
De Ridder, J. A. (2004) ‘Organisational communication and supportive employees’, Human
Resource Management Journal, 14(3), pp. 20–30.
Rowden, R. W. (2002) ‘The relationship between workplace learning and job satisfaction in
U.S. small to midsize businesses’, Human Resource Development Quarterly, 13(4),
pp. 407–425.
Ruck, K. and Welch, M. (2012) ‘Valuing internal communication; management and
employee perspectives’, Public Relations Review, 38(2), pp. 294–302.
Schulze, J. et al. (2017) ‘The Knowledge, Skills, Abilities, and Other Characteristics
Required for Face-to-Face Versus Computer-Mediated Communication: Similar or
Distinct Constructs?’, Journal of Business and Psychology. Springer US, 32(3), pp.
283–300.
Smidts, A., Pruyn, A. T. H. and Van Riel, C. B. M. (2001) ‘The impact of employee
communication and perceived external prestige on organizational identification’,
Academy of Management Journal, 44(5), pp. 1051–1062.
Wilson, J. M., Straus, S. G. and McEvily, B. (2006) ‘All in due time: The development of
trust in computer-mediated and face-to-face teams’, Organizational Behavior and
Human Decision Processes, 99(1), pp. 16–33.
395
LIFE AFTER SCRUM – WHERE NEXT IN FRAMEWORK DEVELOPMENT
Zaimovic Tarik
School of Economic and Business, University of Sarajevo
71000 Sarajevo
Phone: +38733251882
E-mail: [email protected]
Galijasevic Mirano
Authority Partners, Inc
200 Spectrum Center Dr., Suite 300
Irvine, Los Angeles, California 92618, USA
E-mail: [email protected]
Efendic Amina
School of Economic and Business, University of Sarajevo
71000 Sarajevo
E-mail: [email protected]
Abstract
For decades the standardization of the model used to develop an information solution remains an
important question for professional. Application of standardized methods and techniques
introduces "order" in the development process. At the same time, this often leads to "rigid"
understanding of the methodology and suboptimal end result. Although we have had both
structured and agile methods in use for number of decades, today we still have a number of
development models. Often, the debate is either advocating for the development of new all-
inclusive framework or defending irreplaceability of some despite the overwhelming evidence of
difficulties in providing solutions for long/term or complex information systems products. Still,
we are more focused on overall information solution development process, and less on the
framework. Putting overall development processes in forefront of any new framework discussion
should be one of the guiding principles and focusing on processes has lead companies towards
efficient build and deployment process, as the same time making sure that continuous integration
and delivery are paramount to flexible and high quality software development. We should be
more focused on overall information solution development process. The result should be a
platform, a different approach to information solution development – not a new framework.
Finally, the intention of this paper is not to provide the overview or the critique of Scrum, nor it
intends to discuss Agile methods in general. Our intention is to address some of the practical
limitations and suitability of Scrum methodology in today development requirements. Also, we
would like to complement anticipated debate and to emphasize some of the open questions in
software development processes.
Keywords: agile method, system development, software development framework
JEL classification: M15, O33

396
1. Introduction
Standardization of the model used to develop an information solution/system/application is an
important question. The application of standardized development methods, techniques, and tools
introduces "order" in the development process and structures it, thus making it more subject to
control and more efficient. However, on the other hand, standardization could produce too "rigid"
understanding of the methodology under which parts of the system develop. Traditional methods
and development models for information systems often suffer from such problem while the
standard becomes the meaning for itself.
On the other hand, the approaches that differ from the traditional structured approach have been
existing for a long time, so although the life cycle model itself finds its place in the new methods
– at least in the methodological sense – today there are a number of new, mainly "agile"
development models for information systems. Ultimately, all approaches are more or less
oriented toward improving the development process in terms of obtaining a better final product
and optimizing efforts and costs invested in the development.
The intention of this paper is not to provide the comprehensive overview or the critique of agile
approach or Scrum, nor does it intend to discuss advantages of agile methods in general. Though
short overview of agile methods, as well as Scrum as most commonly used, we would like to
address some of the practical limitations and suitability of any software development
methodology. Also, we would like to complement ongoing debate on the need for new software
development framework, and to emphasize some of the open questions present in day-to-day
software development processes.
2. Agile software development methods
Agile software development constitutes a new approach to the IT project planning and
management (Moe et al., 2008). Among different agile methods, the most known are Dynamic
Systems Development Method (DSDM), Feature-Driven Development (FDD), Extreme
Programming (XP), Crystal, Adaptive Software Development (ASD), and Scrum (Chow & Cao,
2008; Sverrisdottir et al., 2014; El Hameed et al., 2016).
The concept "agile development" refers to many different approaches, methods, or techniques
intended for various problem situations and not necessarily originated because of a common
influence or any kind of collaboration.
Following the approach given by Abrahamsson et al. (2002.), Sabic & Zaimovic (2009) list the
main characteristics of different agile methods without further elaborating the components of
each method. The goal of this review is to point to the essential characteristics of agile methods
and the trend of unifying a series of good practices into the Scrum method – the most popular
agile method today (Versione, 2017).
Understanding agile methods that are used today implies overall framework development
evolution and how the most popular frameworks today are actually combination of trails/errors
and best practices of software development over the past decades. In this paper we will review
selected agile methods individually and their key characteristics.
Dynamic Systems Development Method (DSDM) represents a framework for rapid application
development (RAD). After it emerged in mid-1990s, DSDM has gradually become the most
accepted framework for RAD in Great Britain (Agile Business Consortium, 2014; Beynon-
Davies & Williams, 2002; Boehm & Turner, 2003; Stapleton, 1997). The fundamental idea
397
behind DSDM is that instead of fixing the amount of functionality in a system, and then adjusting
time and resources to reach that functionality, it is preferred to fix time and resources, and then
adjust the amount of functionality accordingly (Abrahamsson et al., 2002).
Based on own researches of iterative development methods, James A. Highsmith III has
developed and published the Adaptive Software Development (ASD) (Highsmith, 2000). ASD
focuses on the problems in developing large and complex systems. Essentially, ASD is
"balancing on the edge of chaos" because it tries to provide a framework to prevent a project
from falling into the state of chaos but at the same time to minimize it to prevent the flexibility of
response to changes and creativity (Abrahamsson et al., 2002; Boehm & Turner, 2003).
Extreme Programming appeared as a result of simple efforts to complete the
programming/application development successfully while attempting to shorten the traditional
software development process (Beck, 2000). The practitioners have simply tried to push ordinary
development practices to the extreme (Beck, 2000; Ellis, 2016). The idea is that there is not a
single process suitable for all situations but that a set of available principles and techniques has to
be adapted to each specific situation.
Crystal family method is a set of methods that are more or less applicable to some specific
development situations (Boehm & Turner, 2003). The most appropriate method is taken for the
given situation and adapted additionally to respond to the situation challenges. Cockburn (2002),
the concept author, associates different colors with each method to emphasize their adequacy for
individual typical development situations under the principle "the darker the color, the more
'difficult' the method" (Boehm & Turner, 2003). Crystal methods are essentially based on the
incremental development with direct cooperation and communication as one of major principles,
which is at the same time their limitation.
Feature Driven Development (FDD) is an adaptive approach to system development. Although it
covers the entire life cycle, it is mostly focused on the phases of software design and construction
(Palmer and Felsing, 2002; Boehm & Turner, 2003). FDD is based on a frequent delivery of a
smaller amount of products with emphasis on the quality and monitoring of the project progress.
FDD requires the simultaneous use of as many "best experiences" as possible in a way that none
of them dominate the development process. Many authors recommend FDD benefits for the
development of "business critical" systems.
The Rational Unified Process (RUP) is a refined generic framework called Unified Process (UP).
The Unified Process is an interactive and incremental software development process (Kendall,
2001). According to the UP, the system is being developed in four phases: Inception, Elaboration,
Construction, and Transition, which are further broken down into time-limited iterations
(Pilemalm et al., 2007). The important thing is that the UP includes in every phase all types of
tasks related to system development (defining requirements, design, implementation, testing, and
project management), in which the relative effort and focus on different tasks changes from phase
to phase (Kendall, 2001). The RUP is based on the iterative approach for object-oriented systems
and is inseparably connected with the use case technique of defining requirements (Cooper et al.,
2006).
It has become an often practice in agile approach to software development to visualize the project
progress and make it available by posting it on a wall in the form of a board with tasks. Kanban
literally means "visual card", "blackboard", or "billboard" (Ahmad et al., 2017). Kanban is based
on three main principles: (i) visualize what you do today (the flow of work): seeing all items in
the context of each other can be very informative, (ii) limit the amount of work in progress (WIP
limits): this helps balancing the approach based on flows, so the teams do not begin at the same

398
time and with too much work at the same time, and (iii) improving the flow: when a work item is
finished, the next work item off the top of the comes to play (Ahmad et al., 2017; Dagli, 2012;
Nikitina et al., 2012).
The fundamental idea is to use visual signals to synchronize the flow of work with process
capacity, limit the waste of work interruption, minimize excess inventory or delay due to
shortage, prevent unnecessary rework, and provide a means of tracking work progress (Dagli,
2012). Annual ‘State of Agile’ reports show that the use of Kanban increased from 31% to 39%
in 2015 and from 39% to 50% in 2016 (VersionOne, 2015, 2016).
Lean Software Development (LSD) is a methodology inspired by the production system in the
Japanese car manufacturers Toyota and Honda. Lean is a collection of operational techniques
focused on productive use of resources (Soltan & Mostafa, 2015). Balle (2005) states that the
development time in Toyota is twice shorter with the workers' productivity four times higher and
with a considerably less percentage of errors than in the U.S. factories. This is achieved through:
maximal elimination of waste in the production process; avoidance of waiting, i.e. achieving the
constant flow from order to delivery, production on demand, maximal delay of irreversible
decisions until the necessary information are collected, and authorizing production staff for
decision making. LSD has seven principles: elimination of everything unnecessary, enhanced
learning, decision making as late as possible, delivery as quick as possible, team strengthening,
integrity building, and overviewing the whole (Milosavljevic, 2010).
According to the State of Agile annual report, 94% of the surveyed organizations confirmed that
they use agile methods, 58% of which use the Scrum method (Versione, 2017). According to
Schwaber and Beedle (2002), the term "Scrum" in methodological context was first used in a
presentation of a Japanese adaptive, rapid, and self-organizing process of product development
(Takeuchi & Nonaka, 1986). Scrum is an empirical approach that applies to the system
development the ideas from the theory of control of industrial processes with emphasis on
flexibility, adaptability, and productivity. It does not define any particular software development
techniques for the implementation phase but concentrates more on how the team members should
act to flexibly produce a system in a constantly changing environment (Sabic & Zaimovic, 2009;
Lei et al., 2015).
Within Scrum, software development is a task of a self-managing team performed through so-
called sprints (Moe et al., 2008). Within a sprint, four formal events are prescribed for inspection
and adaptation (Ellis, 2016; Schwaber & Sutherland, 2013, 2017): Sprint Planning, Daily Scrum
(or briefing), Sprint Review, and Sprint Retrospective. The Scrum Team consists of a Product
Owner, the Development Team, and a Scrum Master (Moe, Dingsøyr & Dybå, 2008; Rubin,
2012; Bach- Dąbrowska & Pawlewski, 2014; Dönmez & Gudela, 2017; Overeem, 2016;). The
Scrum Master ensures that the team members adhere to agile values, principles, and rules (Noll et
al., 2017). In addition, the Scrum Master is tasked with coordinating meetings and removing any
impediments encountered by the team during its work (Mundra et al., 2013). The Product Owner
represents a client and instructs the self-managing team what will be produced and in which order
(Sverrisdottir et al., 2014). Self-managing teams are groups of individuals that self-manage the
work tasks (Monteiro et al., 2011). The common focus, mutual trust and respect, and the ability
to quickly adapt to new challenges are the most important characteristics of the self-managing
teams (Cockburn & Highsmith, 2001).
Because it relies on the direct communication and adaptation as one goes, Scrum can be
efficiently applied within small, 5–9 member teams (Schwaber & Beedle, 2002; Mundra et al.,
2013). In the event of a larger project that requires a bigger team, several small teams need to be

399
established, each of which uses Scrum, while the team leaders must meet regularly to agree on
the activities. This way of the team organization is called the Scrum of Scrums.
3. Hybrid methods
Every project has different needs. For those finding themselves in a mostly plan-driven
environment, a hybrid approach can be a transition to more adaptability and delivery. For those
already delivering and adapting aggressively, blending in some new techniques can raise your bar
even higher (Agile Alliance).
Scrum and eXtreme Programming (XP) were the first generation of Agile approaches and
Kanban was the second generation. Each of these are consistent with subsets of Lean-Thinking;
each emphasizes different Lean principles and each manifests Lean to different degrees (Net
Objectives White Paper: An Introduction to Leanban). In text below we will define and explain
some of most popular hybrid agile methods.
A new approach called Leanban uses Lean thinking as a guide to incorporate the best of Scrum
and Kanban into Agile software development practices (Shalloway, 2016). Leanban was designed
both to improve current Scrum and Kanban teams as well as to provide the most effective team-
level Agile approach for those just adopting Agile. Leanban roles are Product Owner, Team
Agility Master and Development Team (Net Objectives, 2016; Shalloway & Trott, 2016).
Borrowing from Scrum, Kanban, and XP, Leanban prescribes these core practices: small batches,
self-organizing teams, daily stand-ups, focus on completion of work items not starting new ones,
make all work visible, include management in what the team is doing and make all workflow
rules explicit (Net Objectives White Paper: An Introduction to Leanban; Scrum to Leanban:
Leanban Practices).
Scrumban combines two Agile approaches (Scrum and Kanban) to create a management
framework for improving software engineering practices (Banijamali et al., 2017). Scrumban is a
simplified version of Scrum, keeping the daily Scrum meeting and the Kanban board, but
eliminating the planning activities and velocity measurement (Ellis, 2016). Scrumban focuses on
smooth flow and minimizing WIP. Scrumban is oriented toward simpler projects. Scrumban
incorporates the iterative planning of Scrum but is more responsive and adaptive to changes in
user requirements (Banijamali et al., 2016).
4. Where next …
Often defined as a process framework for product development, consisting of a minimal set of
immutable roles, artifacts, and events, usually accompanied by constraints, Scrum has been the
most used information solution development model. But, as many have noted – it is barely a
process, only a framework. Companies still have to provide all the development, management,
product management, and people practices. Scrum only provides a framed-environment within
companies can successfully manage complex development. It provides short-time tailored titled-
boxes that allow teams to focus on one aspect of a complex problem at a time so that risk can be
managed.
Still, most within the professional community already hint at the need-driven possibility of a new
system development framework. Even one of the Scrum founders, Ken Schwaber, five years ago
in his article "What comes after Scrum?" listed four key principles that will be necessary for any

400
framework to replace Scrum: (i) self-organization, (ii) bottom-up intelligence, (iii) empiricism, as
well as (iv) transparency. A quick look at each one of them.
Understating the concept of self-organization has been a subject for many decades with authors
broadly on opposite side of the discussion. Complex work usually involves people that are best
capable of managing themselves. Still, it has to include management of the processes they use. So
we are faced with conceptual dilemma. Creating a framework which facilitates team self-
organization but also provides a mechanics for process management has proved to be a
formidable challenge. At the same time, understanding that there is no difference between the
practices defining a framework and the practices inside the framework should be a guiding
principle. Putting a development processes in forefront of any new framework discussion should
be one of the guiding principles and "self-organization" should be applied to the framework itself.
Today, organizations have access to number of different good practices, from many sources,
which they use to create their own custom-made processes - to make their own custom
framework.
There is no point in hiring smart people only to tell them what to do, and most will agree that
understating the importance of "bottom-up intelligence" can often be a key for success in many
industries. This especially relates to creative workers who often make better decisions than
managers. Accepting the premise that IT industry environment is unpredictable and dynamic, the
developers will often make more coherent and better decision about the work they do then
supervisors. It should be only up to the team to determine which processes will be best for the
work that must be done. Still, a framework implies that some constraints and guidelines on the
work processes have to exist. The assumption that might conflict with the principle of "bottom up
intelligence". Also, by accepting the premise that everything changes all the time the evolution of
the process framework will be forced to embrace a number of twists and turns – in the end
looking more like the early system development model "start coding while I go and see what they
want". In the end, as with the concept of self-organization, the development companies will have
to deal primarily with the processes itself and less with the framework as such – to some extent
living Scrum in void space of further upgrade.
The third notion of key principles necessary for any framework to replace Scrum is the
"empiricism", i.e. emphasizing the role of empirical evidence in the formation of new framework.
For a number of years, the systems analysts have been trying to define a software development
framework, and still they often miss a key logic. The best prediction about the future are the ones
derived from continuous evaluation of what they accomplished and then deciding what to do
next. Same applies to information solutions/product. Instead of trying to anticipate which product
features customers will need next, the focus should be on process framework. Instead of focusing
on strictly define people's roles, artifacts, or events that team will need in the future – we should
focus on work processes and by using iterations, feedback, and result data develop a tailored
process framework that fits our organization and company profile.
Finally, there is a "transparency" – to make well founded decisions, you need good information.
Similar to any successful project management lessons, in software solution development we have
to secure access to data about the features, the artifacts, the work that is in progress, and the ideas
that are still under evaluation to all involved. Today, many companies have managed to achieve
this level of transparency in product development. Still, this should also be applied to
frameworks, i.e. consumers should have information about results achieved with delivered
processes, new processes in development or ideas for future processes.

401
In all, we have to accept that Scrum framework is itself just another product and we should in the
end apply the Scrum principles to Scrum itself, i.e. we have to acknowledge that "framework has
to stop being a static framework". It has to evolve to a dynamic ecosystem where all processes
are operated by self-organizing teams, with comprehensive bottom-up approach subjected to
empirical evidence, and with shared community sense.
Still, to achieve this we also have to understand that Agile approach, like most of system
development models, was aimed at software development. But software development is only one
side of IT solutions coin. Despite being the most visible and tangible, most professionals will
agree that "agile development" without "agile maintenance" will produce suboptimal results.
Often minimized role of operations employees in software developed results in longer feedback
cycles. Companies which understand that the operations are an important stakeholder have starter
involving them early in the development process. Also, since developers and testers have
profound knowledge of the functionality they have developed, it’s a logical step to involve them
more and more in operations issues. This cooperation between development and operations has
increased substantially over the past decade, i.e. developers, testers and operations are operating
as team responsible for software development and software maintenance.
Focusing on processes, not on the framework, has led to the increased application of DevOps
approach in many companies. Securing intense ability to deploy products, high availability in
production, rigorous testing process, up-to-date version control as well as configuration
management – is now a business paradigm for majority of IT companies. Integrating
development with operations provides companies with efficient build and deployment process,
making sure that continuous integration and delivery are paramount to flexible and high quality
software development.
Even though DevOps brings a lot to the table, it is still an improvement that relates much more to
the overall Application Lifecycle Management, than to boosting the Scrum process itself, or
being an attempt to rectify some of its most apparent deficiencies. The Scrum itself made a
significant role in improving the way we were building the software 10 or more years ago, but if
we want to move forward, as we always do, we need to clearly outline its disadvantages and then
to make a plan on how to improve it.
For that matter, the sound approach would be if we now briefly move on to the practical aspect of
Scrum and where it falls short in a real life of software development, where we may assert that
there are some of the painful disadvantages that could not be foreseen at the very beginning when
agile methodology was in its inception, but were sort of distilled over the time we learned how to
use Scrum and implement it with real projects. Let us try to mention some of the most important
shortcomings of the Scrum methodology that creep up in the practice, since knowing that can
trigger the search for correcting those issues and updating the Scrum and Agile approach in
overall in order to improve it:
Reduced long vision: when using Scrum, teams usually plan for the duration of the sprint (usually
2 weeks), and are focused on delivering a fully running version of the software by the end of the
sprint, that has the functionality that the product owner has request. It is very hard to see 8 month
in the future, and this is discouraged by design in the Scrum. At most, the architects and Project
Managers will plan for features that are just a grouping of certain product backlog items that
represent a certain well-rounded functionality that makes sense to the product owner who mostly
sees the business side of what he is looking to get, so it may as well span over several sprint, but
certainly not 8 month or more. For this matter, some companies that produce larger projects are
mixing the waterfall with Scrum, which is unfortunate and show one clear point of possible

402
improvement in the Scrum methodology. It is also clear that because of this, the client cannot
easily estimate how much money and effort will be required to complete some projects,
especially if the project is of medium or bigger size.
Less predictable: with reduced time for planning and gathering requirements, since Scrum does
not prescribe that all requirements have to be very detailed and never changing, but quite the
opposite in order to foster the agility, it is much harder to properly estimate the effort required to
complete some work, and this presents a constant challenge that may adversely affect the whole
sprint. There are always inconsistencies in the components of the system being built, hidden
complexity that is very hard to foresee in the very beginning, and such.
Communication challenges: in order for Scrum to be effective, the communication is a
paramount, as it solves most of the issues. This was not just by a chance and was also prescribed
in the very beginning: “Individuals and interactions over processes and tools” (Agile Manifesto,
2001). This means that Scrum relies on having a team of individuals (Software Developers, QA,
Project Managers, etc.) who are very good in communicating, and this is something that does not
happen so often in a real life.
Client interaction: without a client who acts as a product owner, and who is knowledgeable and
devoted to the Scrum process, it is often the case that the projects begin to suffer from the lack of
information; too frequent changes of requirements and in the end start to slide off the track.
Meeting hangover: the process itself is poised to very easily ruin the rhythm of the development
team, since there are too many meeting and ceremonies prescribed, and most of them are being
implemented on a daily bases: daily scrums, sprint planning, sprint review, sprint retrospective,
backlog grooming, sprint demos, other company meetings, trainings etc.
Balance: with many meetings and other activities, and also a constant need to communicate at
various levels, the inevitable fact is that the productivity actually goes lower. In order to solve
issues, something that blocks the team from working, and this has its roots in cutting down the
time for planning in the very beginning, the need to have more meetings and communication
arises and so the team falls into a vicious circle.
Finally, after pointing out some of the disadvantages of Scrum process, we may still confidently
say that it has certainly been a huge improvement in comparison with what different development
methodologies we had in the past, and it provided us with much healthier approach to software
development which also yielded much better results. So it is clear that the software development
companies did not make a mistake by adopting and introducing Scrum in their development
process or going with various Agile methodologies, hence the way to go in the future would be to
build on the foundations that Scrum and Agile Methodologies in overall have set forth. It is
certainly not the case that we need to search for something altogether new and have a significant
change of the direction, but we do need to recognize that there is a huge room for improvement.
Some of the tangible improvement paths should be geared toward pursuing making the
improvements on the points laid out above when we talked about the disadvantages of the Scrum
methodology.
In the conclusion, we should be more focused on overall information solution development
process, and less on the framework. It seems that we are missing the key point in managing any
product development – reliably delivering high quality solutions on time. Instead of looking or
advocating for the replacement of Scrum or on the other side its irreplaceability despite the
overwhelming evidence of difficulties in providing solutions for long/term or complex
information systems products – we should be looking more towards corporate-tailored solutions
accepting the premise that as in any business the information solution consumers appreciate a

403
comprehensive approach. The result should be a platform, a different approach to information
solution development – not a new framework.
References
Abd El Hameed, T., Abd EL Latif, M., & Kholief, S. (2016). Identify and Classify Critical
Success Factor of Agile Software Development Methodology Using Mind Map.
(IJACSA) International Journal of Advanced Computer Science and Applications vol. 7,
no. 5.
Abrahamsson P, Salo O., Ronkainen J., and Warsta J. (2002), Agile Software Development
Methods: Review and Analysis, VTT Publications, VTT, Finland.
Agile Alliance. from What is Hybrid Agile, Anyway? (2018) https://www.agilealliance.org/what-
is-hybrid-agile-anyway, Accessed 17.6.2018.
Agile Business Consortium. (2014). Retrieved 25.05.2018., from
https://www.agilebusiness.org/resources/dsdm-handbooks/the-dsdm-agile-project-
framework-2014-onwards
Ahmad, M., Dennehy, D., Conboy, K., & Oivo, M. (2017). Kanban in software engineering: A
systematic mapping study. The Journal of Systems and Software, 96–113.
Bach-Dąbrowska, I., & Pawlewski, P. (2014). Optimization model of agile team’s cohesion.
Procedia Computer Science 35, 1577-1585.
Ballé F., Ballé M. (2005), Lean development, Business Strategy Review. Autumn 2005
Banijamali, A., Dawadi, R., Ahmad, M., Similä, J., Oivo, M., & Liukkunen, K. (2017). Empirical
Investigation of Scrumban in Global Software Development. Springer International
Publishing AG, 229–248.
Banijamali, A., Dawadi, R., Ahmad, M., Similä, J., Oivo, M., & Liukkunen, K. (2016). An
Empirical Study on the Impact of Scrumban on Geographically Distributed Software
Development. In Proceedings of the 4th International Conference on Model-Driven
Engineering and Software Development (MODELSWARD 2016), 567-577
Beck K. (2000), Extreme Programming Explained: Embrace Change, Addison-Wesley.
Beynon-Davies, P., & Williams, M. D. (2003). The diffusion of information systems
development. Journal of Strategic Information Systems 12, 29-46.
Boehm, B., & Turner, R. (2003). Balancing Agility and Discipline: a Guide for the Perplexed.
Boston, MA, USA: Addison-Wesley Longman Publishing Co., Inc.
Chow, T., & Cao, D.-B. (2008). A survey study of critical success factors in agile software
projects. The Journal of Systems and Software 81, 961-971.
Cockburn A. (2002), Agile Software Development, The Agile Software Development Series,
Pearson Education.
Cockburn, A., & Highsmith, J. (2001). Agile software development, the people factor. Computer,
131- 133
Cooper, K., Abraham, S., Unnithan, R., Chung, L., & Courtney, S. (2006). Integrating visual goal
models into the Rational Unified Process. Journal of Visual Languages and Computing &
Computing, 551–583.
Dagli, C. (2012). Effectiveness of kanban approaches in systems engineering within rapid
response environments. New Challenges in Systems Engineering and Architecting
Conference on Systems Engineering Research (CSER) (pp. 309-314). St. Louis, MO:
Procedia Computer Science.
404
Dönmez, D., & Gudela, G. (2017). Two sides of the same coin –how agile software development
teams approach uncertainty as threats and opportunities. Information and Software
Technology, 94–111.
Ellis, G. (2016). Project Management in Product Development Leadership Skills and
Management Techniques to Deliver Great Products. Elsevier Inc.
Highsmith J. A. (2000), Adaptive Software Development: A Collaborative Approach to
Managing Complex Systems, Dorset House Publishing, New York, NY.
Kendall S. (2001), "The Unified Process Explained", Addison-Wesley
Lei, H., Ganjeizadeh, F., Jayachandran, P. K., & Ozcan, P. (2015). A statistical analysis of the
effects of Scrum and Kanban on software development projects. RoboticsandComputer-
IntegratedManufacturing.
Milosavljevic G., (2010), Prilog metodama brzog razvoja adaptivnih poslovnih informacionih
sistema, doktorska disertacija, Univerzitet u Novom Sadu, Fakultet tehnickih nauka
Moe, N. B., Dingsøyr, T., & Dybå, T. (2008). Understanding Self-managing Teams in Agile
Software Development. 19th Australian Conference on Software Engineering. Perth, WA,
Australia: IEEE.
Monteiro, C., Silva, F., Santos, I., Farias, F., Cardozo, E., Leitão, A., i dr. (2011). A Qualitative
Study of the Determinants of Self-managing Team Effectiveness in a Scrum Team.
Proceedings - International Conference on Software Engineering.
Mundra, A., Misra, S., & Dhawale, C. (2013). Practical Scrum-Scrum Team: Way to Produce
Successful and Quality Software. Computational Science and Its Applications (ICCSA).
Net Objectives White Paper: An Introduction to Leanban (2016) Seattle, USA: Net Objectives
Press.
Net Objectives. (2016). from Leanban- The Next Step in the Evolution of Agile:
http://www.netobjectives.com/leanban, Accessed 17.06.2018.
Nikitina, N., Kajko-Mattsson, M., & Stråle, M. (2012). From Scrum to Scrumban: A Case Study
of a Process Transition. Software and System Process (ICSSP).
Noll, J., Razzak, M. A., Bass, J. M., & Beecham, S. (2017). A Study of the Scrum Master’s Role.
Product-Focused Software Process Improvement: 18th International Conference, (str. 16).
Austria.
Overeem, B. (July 2016). Preuzeto od https://www.scrum.org/resources/characteristics-great-
scrum-team-0
Palmer S. R., and Felsing J. M. (2002), A Practical Guide to Feature-Driven Development,
Prentice-Hall.
Pilemalm, S., Lindell, P.-O., Hallberg, N., & Eriksson, H. (2007). Integrating the Rational
Unified Process and participatory design for development of socio-technical systems: a
user participative approach. Elsevier, 263-288.
Rubin, K. (2012). Essential Scrum - A practical guide to the most popular agile process. Pearson
Education, Inc.
Sabic Z., Zaimovic T., (2009), Towards Better Integration of Performing and Managing the
Information Systems Development, XXII International Symposium on Information,
Communication and Automation Technologies, ISBN: 978-1-4244-4220-1
Schwaber K., & Beedle M. (2002), Agile Software Development With Scrum, Prentice-Hall,
Upper Saddle River, NJ.
Schwaber K., & Sutherland J., (2013), Scrum vodic, scrumguides.org

405
Schwaber K., and Beedle M. (2002), Agile Software Development With Scrum, Prentice-Hall,
Upper Saddle River, NJ.
Scrum to Leanban; Leanban Practices, (2018) http://rkb-netobj.azurewebsites.net/topics/topic-
extendingscrumtoleanban-practices, Accessed 17.06.2018.
Shalloway , A., & Trott, J. (2016). The Leanban Primer. Seattle: Net Objectives Press.
Shalloway, A. (2016). Planview LeanKit. from Incorporating Lean and Kanban with Leanban,
https://leankit.com/blog/2016/07/incorporating-lean-and-kanban-leanban, Accessed
15.06.2018.
Soltan, H., & Mostafa, S. (2015). Lean and agile performance framework for manufacturing
enterprises. Procedia Manufacturing 2 , 476-484 .
Stapleton J. (1997), "Dynamic systems development method – The method in practice", Addison
Wesley
Sverrisdottir, H. S., Ingason, H. T., & Jonasson, H. I. (2014). The role of the product owner in
scrum - comparison between theory and practices. Procedia - Social and Behavioral
Sciences 119, 257-267.
Takeuchi H., and Nonaka I. (1986), "The New Product Development Game", Harvard Business
Review Jan./Feb.
Versione. (2015). 9th annual state of agileTM survey. VersionOne, Inc.
Versione. (2016). 10th annual state of agileTM survey. VersionOne, Inc.
Versione. (2017). 11th annual state of agileTM survey. VersionOne, Inc.

406
ACCEPTANCE OF CLOUD COMPUTING IN EDUCATION
Kemal Kačapor
School of Economics and Business Sarajevo
Trg oslobođenja – Alija Izetbegović 1
Phone: + 387 33 275 929; Fax: +387 33 251 881
E-mail: [email protected]
Amra Kapo
School of Economics and Business Sarajevo
Trg oslobođenja – Alija Izetbegović 1
Phone: + 387 33 253 769; Fax: + 387 33 251 881
E-mail: [email protected]
Emir Hadžić
School of Economics and Business Sarajevo
Trg oslobođenja – Alija Izetbegović 1
Phone: + 387 62 621 077
E-mail: [email protected]
Abstract
The use of cloud computing today is ubiquitous. Lately, its application has gained
significance in the education sector. In order to examine the reasons for its acceptance among the
student population, a technology acceptance model was used and test were performed of the
influence of subjective norm, computer self-efficacy, trust, software functionality and perceived
practicality, in addition to the basic variables (perceived ease of use, perceived usefulness, intent
to use and use). According to results of this research, the ease of use determinant has the most
significant impact on the intent to use. Students will use cloud computing if they think that its use
is effortless. Structural equation modelling is employed in order to offer an integrated model with
interdependences and interrelations of the above-mentioned constructs.
Keywords: cloud computing, information technology, education, technology acceptance model
JEL classification: I21

407
1. Introduction
Cloud computing technology can be adopted in all areas of society. In terms of education,
the e learning solutions based on the cloud promote a new era of learning, in which lectures and
labs are based on a cloud platform through virtualization (Isăilă, 2014). On the other hand,
various cloud services are available to students free of charge, and enable them to collaborate,
share or store documents.
The cloud computing benefits are available both to educational institutions and to
students. In terms of educational institutions, companies such as Microsoft and Google offer
students and staff free emails, calendars and document storage. Users can also create and share
documents such as spreadsheets and presentations, in addition to creating websites which can be
accessed via the Web (Sclater, 2009).
Over the past decades, there have been many studies which analyze technology
acceptance by users with a special focus on the technology acceptance in education
(Alrawashdeh, 2011; Cheng, Wang, Yang, & Peng, 2011; Escobar-Rodríguez & Carvajal-
Trujillo, 2014; Kim, Park, & Lee, 2007; Oliveira, Faria, Thomas, & Popovič, 2014; Oye, N.a, &
Rabin, 2011). Studies treating initiators of cloud computing use by the student population,
however, are rare. Therefore, the primary goal of this study is to evaluate students’ opinions and
beliefs in relation to the determinants of cloud computing application to education.
To the best of our knowledge, similar studies are very limited, especially in the SEE
region. An empirical study was conducted among the student population. In total, 219 students
took part in the study during the summer semester 2018. For the purpose of the analysis, we
followed the two-step procedure suggested by (Anderson & Gerbing, 1988). We first examined
the measurement model in order to test convergent and discriminant validity. The second step
included testing of the structural model with the primary goal of testing the strength and direction
of the relationships among theoretical constructs. Consequently, we defined two research
questions:
1. What are the determinants of cloud computing acceptance in education?
2. Is it possible to recommend to universities, software companies and decision
makers to accept cloud computing?
Additionaly, this study is intended to bridge the gap in the previous research of cloud
computing by providing answers to the research questions as stated above.
2. Literature review and research model
Davis (1989) proposes a model which tests the users’ acceptance and use, and thanks to
its application and continuous upgrades it has become one of the most used theoretical models in
the area of information and communications technology. Furthermore, the research which tests
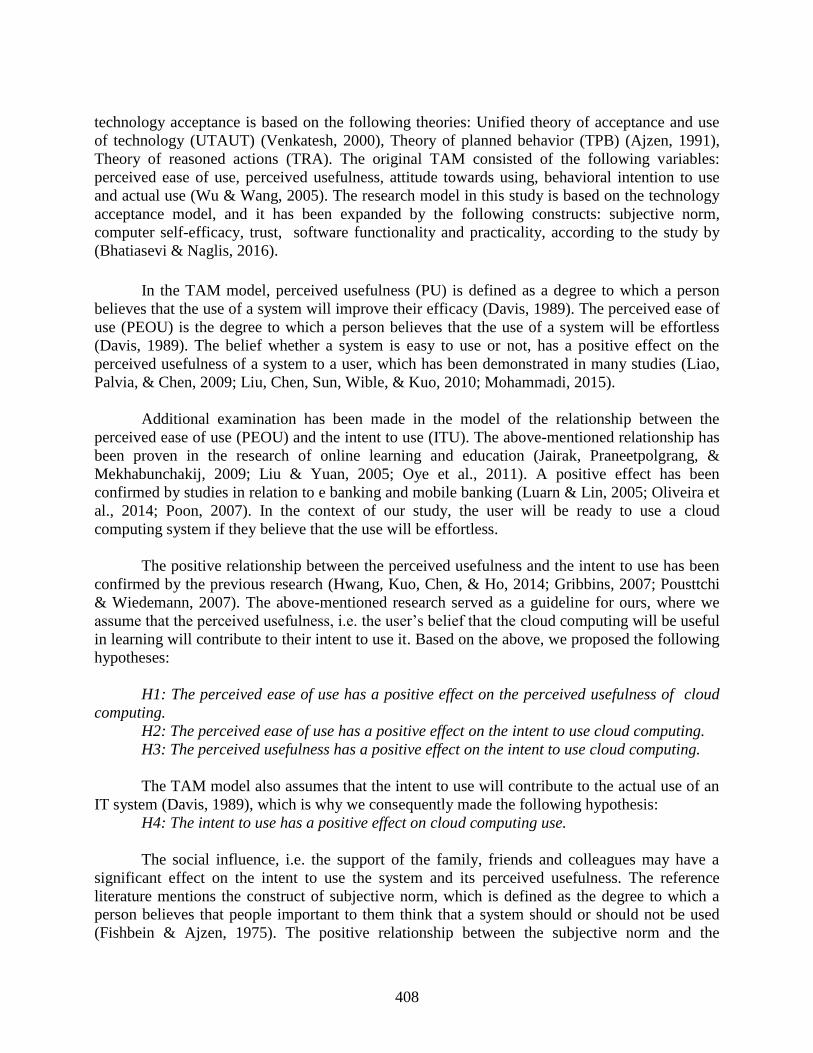
408
technology acceptance is based on the following theories: Unified theory of acceptance and use
of technology (UTAUT) (Venkatesh, 2000), Theory of planned behavior (TPB) (Ajzen, 1991),
Theory of reasoned actions (TRA). The original TAM consisted of the following variables:
perceived ease of use, perceived usefulness, attitude towards using, behavioral intention to use
and actual use (Wu & Wang, 2005). The research model in this study is based on the technology
acceptance model, and it has been expanded by the following constructs: subjective norm,
computer self-efficacy, trust, software functionality and practicality, according to the study by
(Bhatiasevi & Naglis, 2016).
In the TAM model, perceived usefulness (PU) is defined as a degree to which a person
believes that the use of a system will improve their efficacy (Davis, 1989). The perceived ease of
use (PEOU) is the degree to which a person believes that the use of a system will be effortless
(Davis, 1989). The belief whether a system is easy to use or not, has a positive effect on the
perceived usefulness of a system to a user, which has been demonstrated in many studies (Liao,
Palvia, & Chen, 2009; Liu, Chen, Sun, Wible, & Kuo, 2010; Mohammadi, 2015).
Additional examination has been made in the model of the relationship between the
perceived ease of use (PEOU) and the intent to use (ITU). The above-mentioned relationship has
been proven in the research of online learning and education (Jairak, Praneetpolgrang, &
Mekhabunchakij, 2009; Liu & Yuan, 2005; Oye et al., 2011). A positive effect has been
confirmed by studies in relation to e banking and mobile banking (Luarn & Lin, 2005; Oliveira et
al., 2014; Poon, 2007). In the context of our study, the user will be ready to use a cloud
computing system if they believe that the use will be effortless.
The positive relationship between the perceived usefulness and the intent to use has been
confirmed by the previous research (Hwang, Kuo, Chen, & Ho, 2014; Gribbins, 2007; Pousttchi
& Wiedemann, 2007). The above-mentioned research served as a guideline for ours, where we
assume that the perceived usefulness, i.e. the user’s belief that the cloud computing will be useful
in learning will contribute to their intent to use it. Based on the above, we proposed the following
hypotheses:
H1: The perceived ease of use has a positive effect on the perceived usefulness of cloud
computing.
H2: The perceived ease of use has a positive effect on the intent to use cloud computing.
H3: The perceived usefulness has a positive effect on the intent to use cloud computing.
The TAM model also assumes that the intent to use will contribute to the actual use of an
IT system (Davis, 1989), which is why we consequently made the following hypothesis:
H4: The intent to use has a positive effect on cloud computing use.
The social influence, i.e. the support of the family, friends and colleagues may have a
significant effect on the intent to use the system and its perceived usefulness. The reference
literature mentions the construct of subjective norm, which is defined as the degree to which a
person believes that people important to them think that a system should or should not be used
(Fishbein & Ajzen, 1975). The positive relationship between the subjective norm and the

409
perceived usefulness was also found in the research (Kreijns, Van Acker, Vermeulen, & Van
Buuren, 2013; Lee, 2010; Lee, Hsieh, & Ma, 2011; Park, 2009). In the context of our research,
users will use cloud computing if they believe that people who are important to them think that
they should use it.
H5: Social influence has a positive effect on the perceived usefulness of cloud computing.
The users appreciate the advantages offered by technology only if they believe that the
technology makes their lives more efficient and that it eliminates difficulties in the execution of
their tasks (Bhatiasevi & Naglis, 2016; Obe & Balogun, 2007). The reference literature defines
perceived practicality as agility and availability of service which is flexible in terms of time and
location (Okazaki, Skapa, & Grande, 2008). In the context of cloud computing, users will most
likely be ready to use cloud computing if they believe that it is appropriate and that it makes their
every day lives easier. An added reason to use the IT technology is the users’ trust. Trust is
defined as the users’ expectation that individuals or companies with which they interact will not
take advantage of their dependence (Gefen, Karahanna, & Straub, 2003). If a user trusts a system,
i.e. believes a system to be safe to use, they will consider it useful (Abushanab, Michael Pearson,
& Setterstrom, 2010; Gefen et al., 2003; Jarvenpaa, Tractinsky, & Saarinen, 1999; Wu & Chen,
2005). Based on the above, we defined the following hypotheses:
H6: The perceived practicality has a positive effect on the perceived usefulness.
H7: Trust has a positive effect on the perceived usefulness.
The remaining hypotheses refer to the technological component: the independent
assessment of the ability to use a software and the functionality of the software. Self-efficacy is
defined as the person’s assessment of their ability to use a computer (Higgins & Compeau, 1995).
Users will be more ready to use cloud computing if they believe that they will be able to use the
system, which then will have a positive effect on the perceived usefulness and the ease of use.
Finally, an important factor in estimating the speed of technology adoption is represented by the
technological characteristics (Rogers, 2003). It is necessary to understand how a software works
and how to coordinate it with the needs of end-users. The software functionality means the
totality of basic functions offered by the software (Bhatiasevi & Naglis, 2016). In the context of
our research, users will be ready to use cloud computing if they are certain that it is easy to use.
Therefore, the following hypotheses were defined:
H8: The computer self-efficacy has a positive effect on the perceived usefulness.
H9: The computer self-efficacy has a positive effect on the perceived ease of use.
H10: The software functionality has a positive relationship with the perceived ease of use.
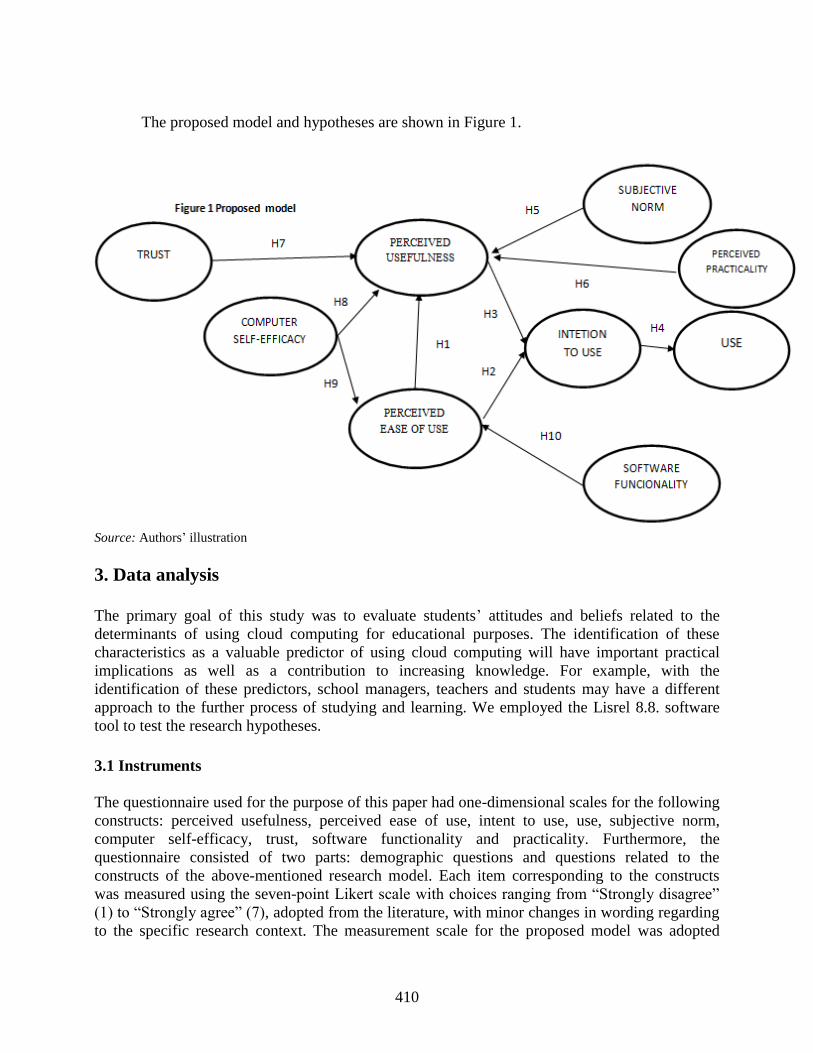
410
The proposed model and hypotheses are shown in Figure 1.
Source: Authors’ illustration
3. Data analysis
The primary goal of this study was to evaluate students’ attitudes and beliefs related to the
determinants of using cloud computing for educational purposes. The identification of these
characteristics as a valuable predictor of using cloud computing will have important practical
implications as well as a contribution to increasing knowledge. For example, with the
identification of these predictors, school managers, teachers and students may have a different
approach to the further process of studying and learning. We employed the Lisrel 8.8. software
tool to test the research hypotheses.
3.1 Instruments
The questionnaire used for the purpose of this paper had one-dimensional scales for the following
constructs: perceived usefulness, perceived ease of use, intent to use, use, subjective norm,
computer self-efficacy, trust, software functionality and practicality. Furthermore, the
questionnaire consisted of two parts: demographic questions and questions related to the
constructs of the above-mentioned research model. Each item corresponding to the constructs
was measured using the seven-point Likert scale with choices ranging from “Strongly disagree”
(1) to “Strongly agree” (7), adopted from the literature, with minor changes in wording regarding
to the specific research context. The measurement scale for the proposed model was adopted
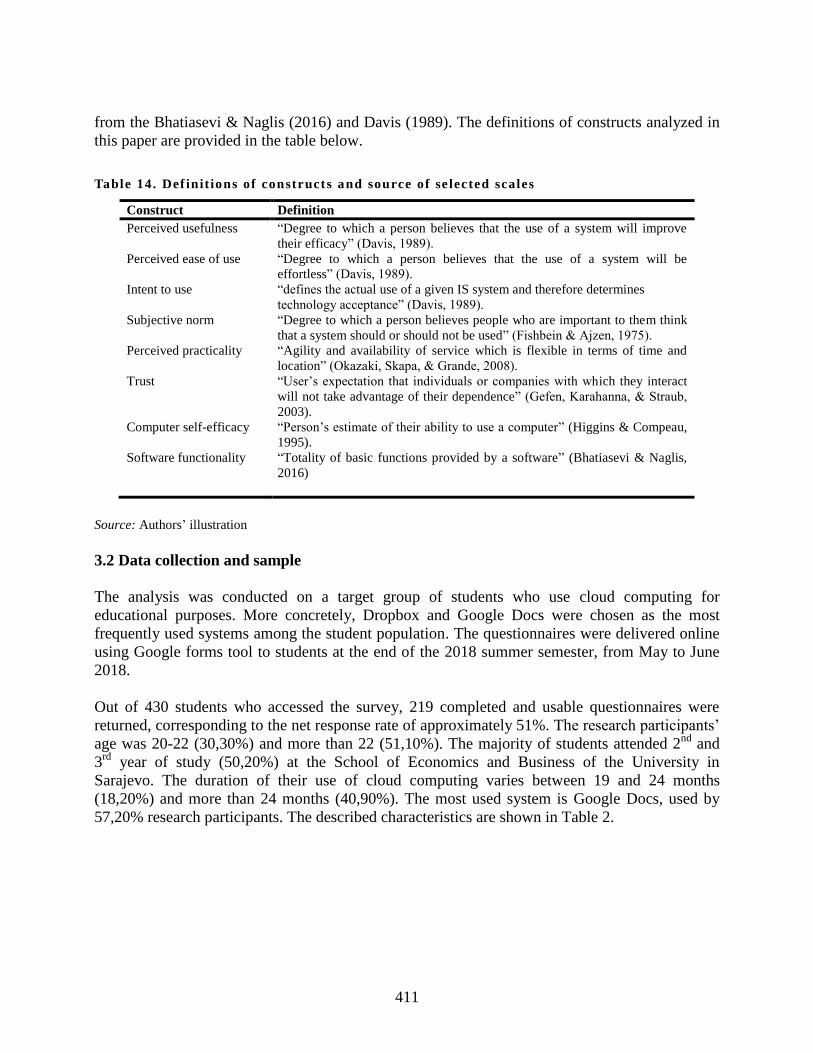
411
from the Bhatiasevi & Naglis (2016) and Davis (1989). The definitions of constructs analyzed in
this paper are provided in the table below.
Table 14. Def init ions of constructs and source of se lected scales
Construct Definition
Perceived usefulness “Degree to which a person believes that the use of a system will improve
their efficacy” (Davis, 1989).
Perceived ease of use
“Degree to which a person believes that the use of a system will be
effortless” (Davis, 1989).
Intent to use “defines the actual use of a given IS system and therefore determines
technology acceptance” (Davis, 1989).
Subjective norm
Perceived practicality
Trust
Computer self-efficacy
Software functionality
“Degree to which a person believes people who are important to them think
that a system should or should not be used” (Fishbein & Ajzen, 1975).
“Agility and availability of service which is flexible in terms of time and
location” (Okazaki, Skapa, & Grande, 2008).
“User’s expectation that individuals or companies with which they interact
will not take advantage of their dependence” (Gefen, Karahanna, & Straub,
2003).
“Person’s estimate of their ability to use a computer” (Higgins & Compeau,
1995).
“Totality of basic functions provided by a software” (Bhatiasevi & Naglis,
2016)
Source: Authors’ illustration
3.2 Data collection and sample
The analysis was conducted on a target group of students who use cloud computing for
educational purposes. More concretely, Dropbox and Google Docs were chosen as the most
frequently used systems among the student population. The questionnaires were delivered online
using Google forms tool to students at the end of the 2018 summer semester, from May to June
2018.
Out of 430 students who accessed the survey, 219 completed and usable questionnaires were
returned, corresponding to the net response rate of approximately 51%. The research participants’
age was 20-22 (30,30%) and more than 22 (51,10%). The majority of students attended 2nd
and
3rd
year of study (50,20%) at the School of Economics and Business of the University in
Sarajevo. The duration of their use of cloud computing varies between 19 and 24 months
(18,20%) and more than 24 months (40,90%). The most used system is Google Docs, used by
57,20% research participants. The described characteristics are shown in Table 2.
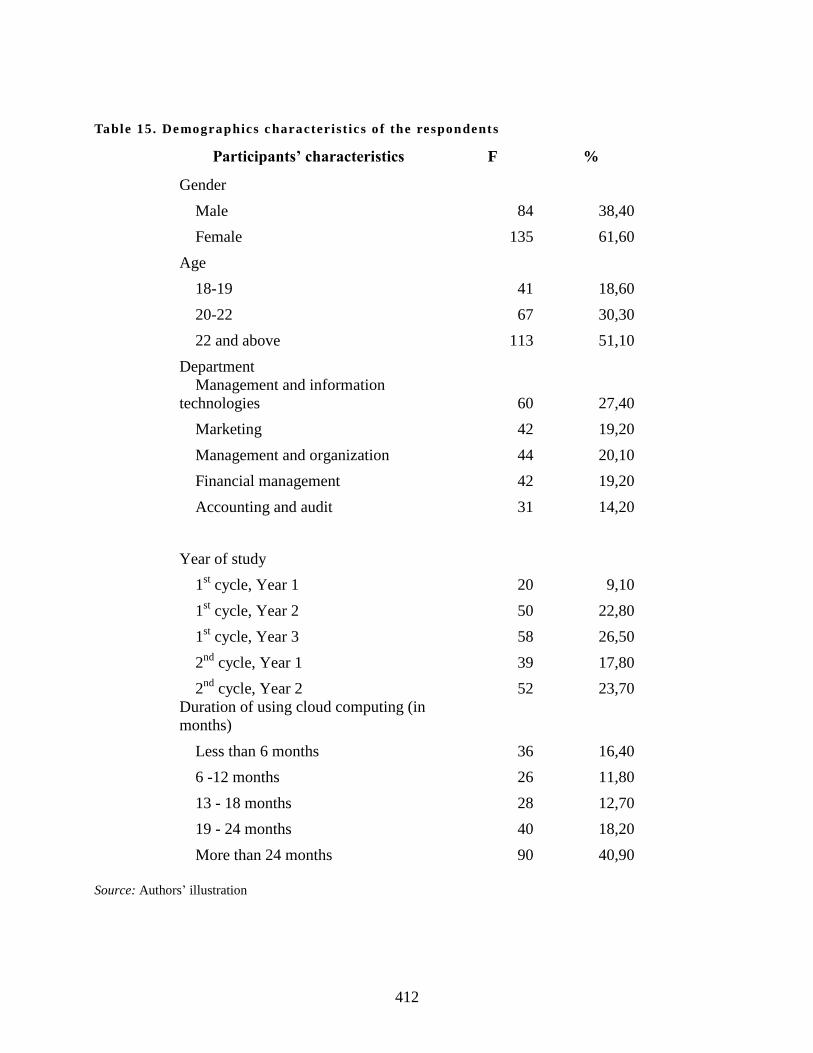
412
Table 15. Demographics c haracter ist ics o f the respondents
Participants’ characteristics F %
Gender
Male 84 38,40
Female 135 61,60
Age
18-19 41 18,60
20-22 67 30,30
22 and above 113 51,10
Department
Management and information
technologies 60 27,40
Marketing 42 19,20
Management and organization 44 20,10
Financial management 42 19,20
Accounting and audit 31 14,20
Year of study
1st cycle, Year 1 20 9,10
1st cycle, Year 2 50 22,80
1st cycle, Year 3 58 26,50
2nd
cycle, Year 1 39 17,80
2nd
cycle, Year 2 52 23,70
Duration of using cloud computing (in
months)
Less than 6 months 36 16,40
6 -12 months 26 11,80
13 - 18 months 28 12,70
19 - 24 months 40 18,20
More than 24 months 90 40,90
Source: Authors’ illustration

413
4. Analysis and results
For the analysis, we followed a two-step procedure suggested by Anderson & Gerbing (1988). At
the beginning, we examined the measurement model in order to test convergent and discriminant
validity. In the second step, we tested the structural model with the primary goal of testing the
strength and direction of the relationships among theoretical constructs.
4.1 Analysis of the measurement models
The convergent validity shows the degree to which instrument items are related, assessed
according to the Fornell & Larcker (1981) criteria, as follows:
1. All factor loadings (Alpha coefficient) should exceed 0.5;
2. Construct reliabilities (CR) should exceed 0.8;
3. Average variance extracted (AVE) should exceed 0.5.
The measurement model reliability was tested, as represented in Table 3. As the Table 3 shows,
the Cronbach alpha values exceeded the recommended value of 0.5, which suggests good scale
reliability (Hair, J.F., Black, W.C., Babin, B.J., Anderson, 2010). Additionally, all results of
confirmatory factor analysis for all research variables are presented in Table 3 and they verify the
theoretical measurement model.
Table 16. Results of convergent analysis
Dimensions Code Item St.
loadings Mean SD
Cronbach
Alpha
Subjective
norm
SN1
People who affect my behaviour
believe that I should use Google Docs /
Dropbox
0,914 4,7477 1,65848
0,879 SN2 People who matter to me think that I
should use Google Docs / Dropbox 0,930 4,8468 1,61553
SN3 Professor believes that I should use
Google Docs / Dropbox 0,686 5,0586 1,50751
Perceived
practicality
PC1 Using Google Docs / Dropbox enables
me to complete my tasks on time 0,721 5,2182 1,32335
0,843
PC2 I can execute my tasks anywhere using
Google Docs / Dropbox 0,783 5,3318 1,34602
PC3 Using Google Docs/ Dropbox makes it
practical to execute my tasks 0,804 5,5273 1,19519
PC4 I consider Google Docs/ Dropbox
practical 0,746 5,8545 1,08822
Software
functionality SF1
Google Docs / Dropbox can deliver
required tasks 0,738 5,3973 1,20099 0,798
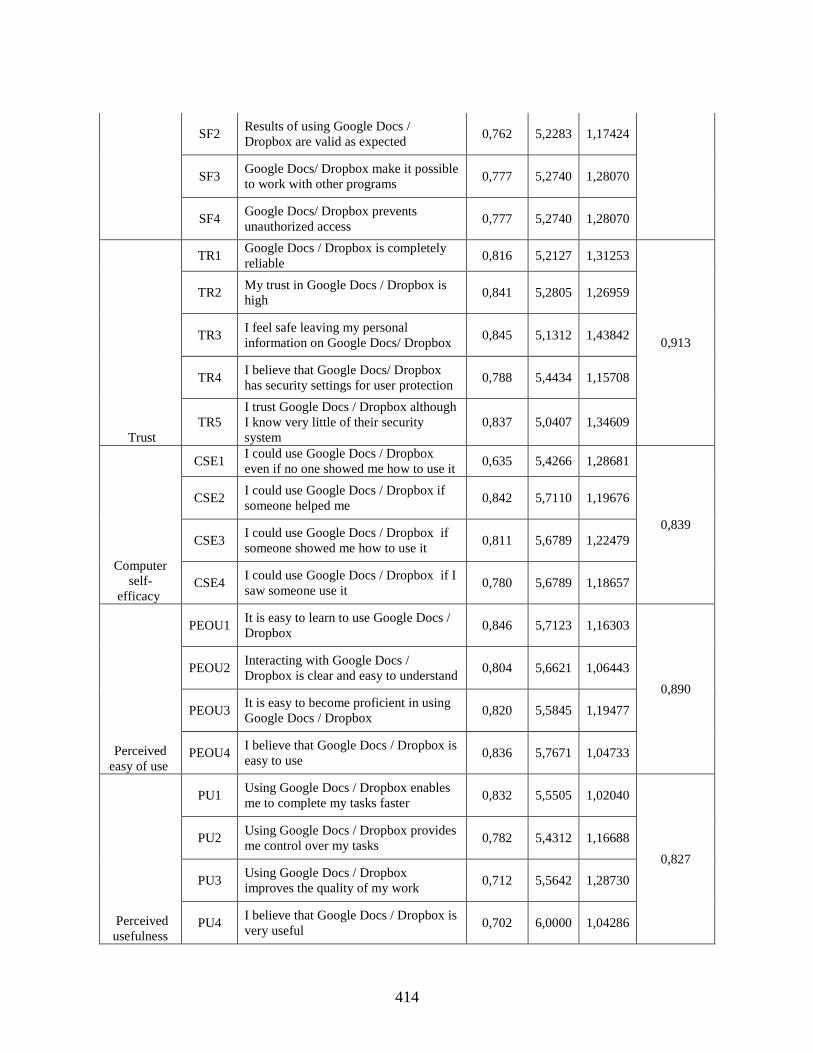
414
SF2 Results of using Google Docs /
Dropbox are valid as expected 0,762 5,2283 1,17424
SF3 Google Docs/ Dropbox make it possible
to work with other programs 0,777 5,2740 1,28070
SF4 Google Docs/ Dropbox prevents
unauthorized access 0,777 5,2740 1,28070
Trust
TR1 Google Docs / Dropbox is completely
reliable 0,816 5,2127 1,31253
0,913
TR2 My trust in Google Docs / Dropbox is
high 0,841 5,2805 1,26959
TR3 I feel safe leaving my personal
information on Google Docs/ Dropbox 0,845 5,1312 1,43842
TR4 I believe that Google Docs/ Dropbox
has security settings for user protection 0,788 5,4434 1,15708
TR5
I trust Google Docs / Dropbox although
I know very little of their security
system
0,837 5,0407 1,34609
Computer
self-
efficacy
CSE1 I could use Google Docs / Dropbox
even if no one showed me how to use it 0,635 5,4266 1,28681
0,839
CSE2 I could use Google Docs / Dropbox if
someone helped me 0,842 5,7110 1,19676
CSE3 I could use Google Docs / Dropbox if
someone showed me how to use it 0,811 5,6789 1,22479
CSE4 I could use Google Docs / Dropbox if I
saw someone use it 0,780 5,6789 1,18657
Perceived
easy of use
PEOU1 It is easy to learn to use Google Docs /
Dropbox 0,846 5,7123 1,16303
0,890
PEOU2 Interacting with Google Docs /
Dropbox is clear and easy to understand 0,804 5,6621 1,06443
PEOU3 It is easy to become proficient in using
Google Docs / Dropbox 0,820 5,5845 1,19477
PEOU4 I believe that Google Docs / Dropbox is
easy to use 0,836 5,7671 1,04733
Perceived
usefulness
PU1 Using Google Docs / Dropbox enables
me to complete my tasks faster 0,832 5,5505 1,02040
0,827
PU2 Using Google Docs / Dropbox provides
me control over my tasks 0,782 5,4312 1,16688
PU3 Using Google Docs / Dropbox
improves the quality of my work 0,712 5,5642 1,28730
PU4 I believe that Google Docs / Dropbox is
very useful 0,702 6,0000 1,04286
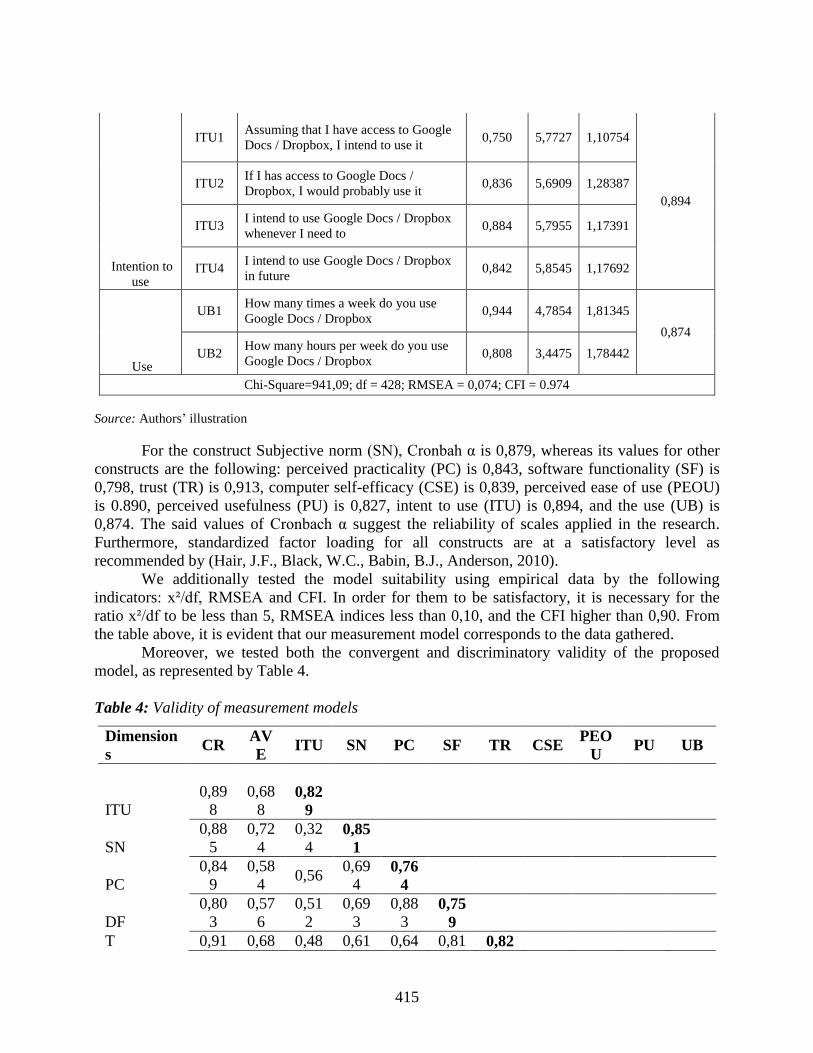
415
Intention to
use
ITU1 Assuming that I have access to Google
Docs / Dropbox, I intend to use it 0,750 5,7727 1,10754
0,894
ITU2 If I has access to Google Docs /
Dropbox, I would probably use it 0,836 5,6909 1,28387
ITU3 I intend to use Google Docs / Dropbox
whenever I need to 0,884 5,7955 1,17391
ITU4 I intend to use Google Docs / Dropbox
in future 0,842 5,8545 1,17692
Use
UB1 How many times a week do you use
Google Docs / Dropbox 0,944 4,7854 1,81345
0,874
UB2 How many hours per week do you use
Google Docs / Dropbox 0,808 3,4475 1,78442
Chi-Square=941,09; df = 428; RMSEA = 0,074; CFI = 0.974
Source: Authors’ illustration
For the construct Subjective norm (SN), Cronbah α is 0,879, whereas its values for other
constructs are the following: perceived practicality (PC) is 0,843, software functionality (SF) is
0,798, trust (TR) is 0,913, computer self-efficacy (CSE) is 0,839, perceived ease of use (PEOU)
is 0.890, perceived usefulness (PU) is 0,827, intent to use (ITU) is 0,894, and the use (UB) is
0,874. The said values of Cronbach α suggest the reliability of scales applied in the research.
Furthermore, standardized factor loading for all constructs are at a satisfactory level as
recommended by (Hair, J.F., Black, W.C., Babin, B.J., Anderson, 2010).
We additionally tested the model suitability using empirical data by the following
indicators: x²/df, RMSEA and CFI. In order for them to be satisfactory, it is necessary for the
ratio x²/df to be less than 5, RMSEA indices less than 0,10, and the CFI higher than 0,90. From
the table above, it is evident that our measurement model corresponds to the data gathered.
Moreover, we tested both the convergent and discriminatory validity of the proposed
model, as represented by Table 4.
Table 4: Validity of measurement models
Dimension
s CR
AV
E ITU SN PC SF TR CSE
PEO
U PU UB
ITU
0,89
8
0,68
8 0,82
9
SN
0,88
5
0,72
4
0,32
4 0,85
1
PC
0,84
9
0,58
4 0,56
0,69
4 0,76
4
DF
0,80
3
0,57
6
0,51
2
0,69
3
0,88
3 0,75
9
T 0,91 0,68 0,48 0,61 0,64 0,81 0,82

416
5 2 2 5 3 6 6
CSE
0,85
3
0,59
5
0,64
7
0,48
2
0,66
4
0,48
7
0,53
1 0,82
6
PEOU
0,86
1
0,67
4
0,77
7
0,51
7 0,74
0,67
2 0,66
0,84
2 0,82
1
PU
0,82
0
0,60
4
0,66
7
0,52
6
0,73
1
0,85
1
0,68
6
0,60
5
0,83
4 0,77
7
UB
0,88
2
0,71
5
0,53
8
0,44
5
0,44
5
0,46
2
0,48
5
0,44
6 0,45
0,48
2 0,84
6 Source: Author’s illustration
In general, this model indicates that each measurement model has a strong internal
reliability and that it is appropriate in comparison to all generally recommended standards. All
our measures fulfilled the recommended levels of composite reliability and average variance
extracted. The composite reliability (CR) and average variance extracted (AVE) for each
construct is higher than 0,50 which suggests an acceptable scale validity (Fornell & Larcker,
1981). The standard loadings for each research variable are significant (t>1.96) (Anderson &
Gerbing, 1988).
The discriminant validity may be achieved if the AVE square root of each construct
exceeds the construct correlations. Table 4 shows the results of discriminant validity of latent
variables based on square root of their respective average variance extracted (Fornell & Larcker,
1981). As the table shows, the square root of average variance extracted for most of the variables
is greater than the off-diagonal correlations, suggesting satisfactory discriminant validity among
variables.
4.2 Analysis of the structural model
In the second step, we tested the structural model with the primary goal of testing the strength
and direction of the relationships among theoretical constructs. According to Schumacker &
Lomax (2004), no single index can serve as the only standard for judging the quality of a model.
We adopted and followed recommended indices and their respective values from Bentler (1989)
and Hair et al. (2010) which we presented in Table 5.
Table 5 . Results of f it indices for structural model
Goodness-of-fit measure Recommended
value*
Structural
model
Chi square/degree of freedom ≤3.000 2.260
Comparative fit index (CFI)
Normed fit index (NFI)
≥0.900
≥0.900 0.973
0.952
Root mean square error of
approximation (RMSEA)
≤0.100 0.076
SRMR ≤0.050 0.072
* Recommended values have been adopted from Hair et al. (2010) and Bentler (1989).
Source: Authors’ illustration
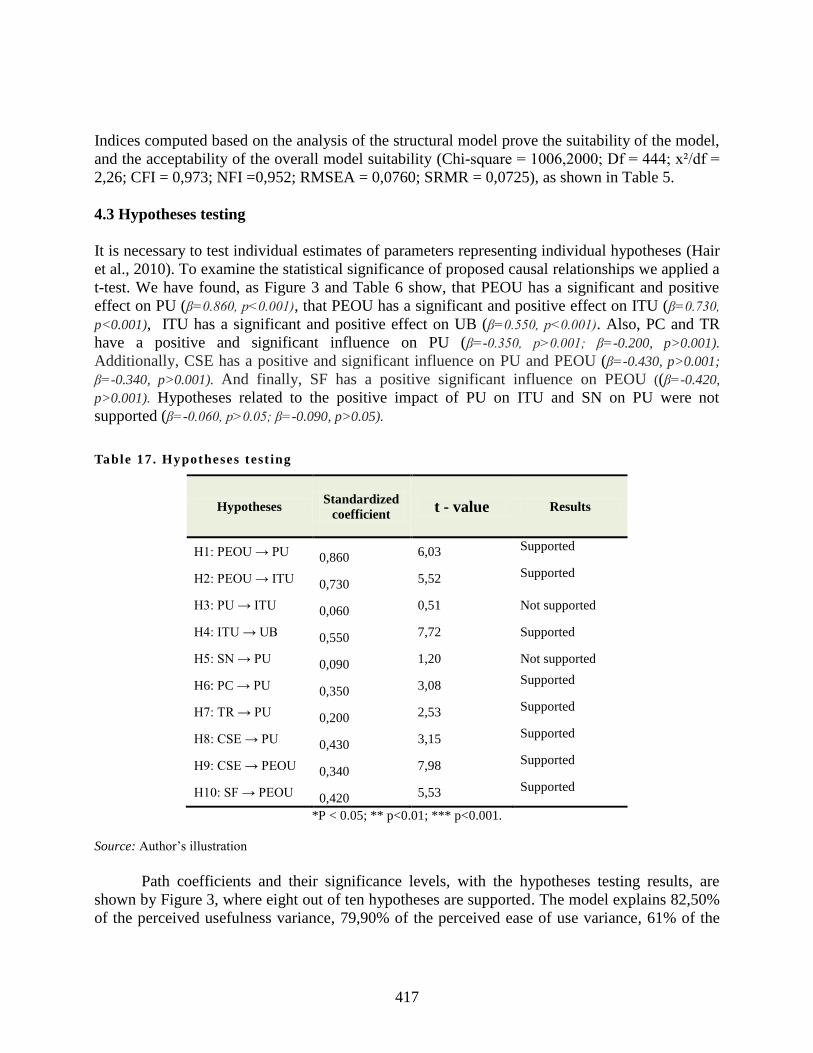
417
Indices computed based on the analysis of the structural model prove the suitability of the model,
and the acceptability of the overall model suitability (Chi-square = 1006,2000; Df = 444; x²/df =
2,26; CFI = 0,973; NFI =0,952; RMSEA = 0,0760; SRMR = 0,0725), as shown in Table 5.
4.3 Hypotheses testing
It is necessary to test individual estimates of parameters representing individual hypotheses (Hair
et al., 2010). To examine the statistical significance of proposed causal relationships we applied a
t-test. We have found, as Figure 3 and Table 6 show, that PEOU has a significant and positive
effect on PU (β=0.860, p<0.001), that PEOU has a significant and positive effect on ITU (β=0.730,
p<0.001), ITU has a significant and positive effect on UB (β=0.550, p<0.001). Also, PC and TR
have a positive and significant influence on PU (β=-0.350, p>0.001; β=-0.200, p>0.001).
Additionally, CSE has a positive and significant influence on PU and PEOU (β=-0.430, p>0.001;
β=-0.340, p>0.001). And finally, SF has a positive significant influence on PEOU ((β=-0.420,
p>0.001). Hypotheses related to the positive impact of PU on ITU and SN on PU were not
supported (β=-0.060, p>0.05; β=-0.090, p>0.05).
Table 17. Hypotheses test ing
Hypotheses Standardized
coefficient t - value Results
H1: PEOU → PU 0,860 6,03 Supported
H2: PEOU → ITU 0,730 5,52 Supported
H3: PU → ITU 0,060 0,51 Not supported
H4: ITU → UB 0,550 7,72 Supported
H5: SN → PU 0,090 1,20 Not supported
H6: PC → PU 0,350 3,08 Supported
H7: TR → PU 0,200 2,53 Supported
H8: CSE → PU 0,430 3,15 Supported
H9: CSE → PEOU 0,340 7,98 Supported
H10: SF → PEOU 0,420 5,53 Supported
*P < 0.05; ** p<0.01; *** p<0.001.
Source: Author’s illustration
Path coefficients and their significance levels, with the hypotheses testing results, are
shown by Figure 3, where eight out of ten hypotheses are supported. The model explains 82,50%
of the perceived usefulness variance, 79,90% of the perceived ease of use variance, 61% of the
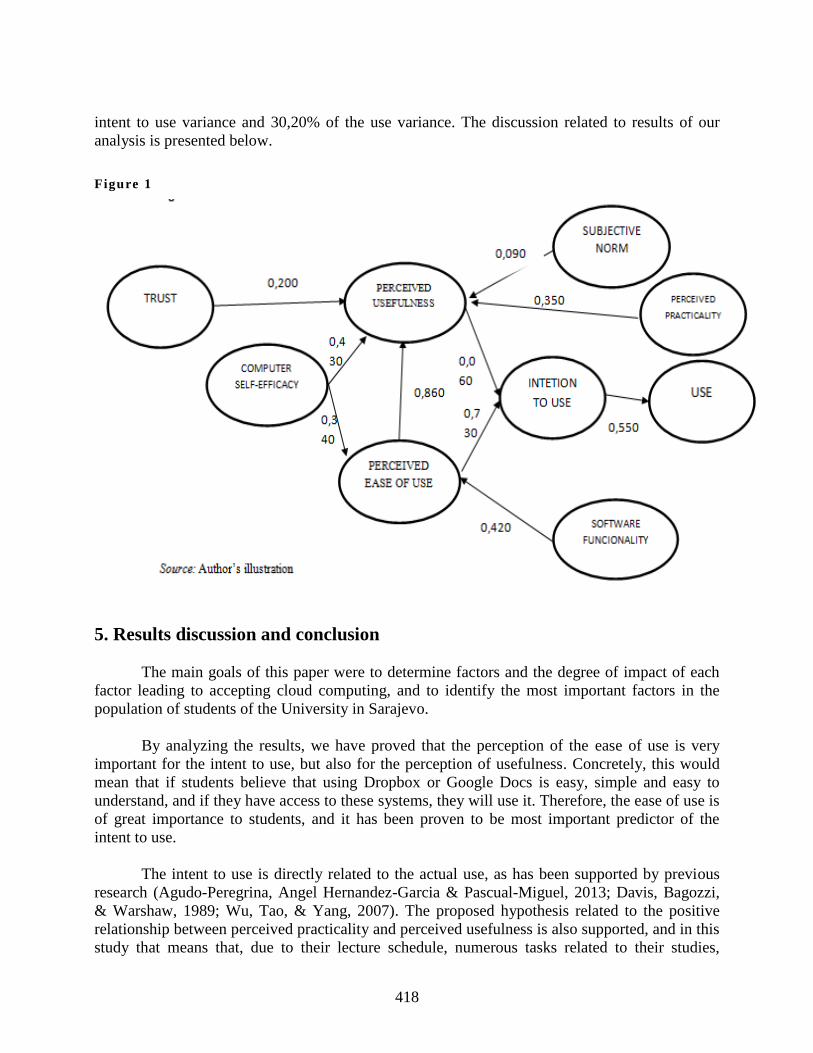
418
intent to use variance and 30,20% of the use variance. The discussion related to results of our
analysis is presented below.
Figure 1
5. Results discussion and conclusion
The main goals of this paper were to determine factors and the degree of impact of each
factor leading to accepting cloud computing, and to identify the most important factors in the
population of students of the University in Sarajevo.
By analyzing the results, we have proved that the perception of the ease of use is very
important for the intent to use, but also for the perception of usefulness. Concretely, this would
mean that if students believe that using Dropbox or Google Docs is easy, simple and easy to
understand, and if they have access to these systems, they will use it. Therefore, the ease of use is
of great importance to students, and it has been proven to be most important predictor of the
intent to use.
The intent to use is directly related to the actual use, as has been supported by previous
research (Agudo-Peregrina, Angel Hernandez-Garcia & Pascual-Miguel, 2013; Davis, Bagozzi,
& Warshaw, 1989; Wu, Tao, & Yang, 2007). The proposed hypothesis related to the positive
relationship between perceived practicality and perceived usefulness is also supported, and in this
study that means that, due to their lecture schedule, numerous tasks related to their studies,

419
students will choose a more flexible method of collaboration and cooperation with colleagues to
finish their tasks. For a technology to be perceived as useful, we need to believe, among other,
that it is safe and reliable to use. Students’ perception of reliability and security while using cloud
systems affects their opinion as to whether the technology will be useful to them. Accuracy,
ability to interact with other programs and preventing unauthorized access also lead to a positive
opinion on the system usefulness (Bhatiasevi & Naglis, 2016). Furthermore, students’ opinions
on their ability to use cloud computing without anyone’s help is related to their belief that cloud
computing is useful or easy to use. Moreover, the belief that the software functionalities are
simple, and that the software is easy to use is an added motive to use it.
In our research we did not come across the validation of social influence, i.e. family and
friends on the students’ perception of usefulness, notwithstanding the fact that such relationship
was confirmed by previous research. Also, relationship between perceived usefulness and the
intention to use was not supported. This means that drivers for students to use such technology
are not among the family or friend nor among sense of usefulness. Among other determinantas,
they will use it only if they trust it and if its effortless.
This study may have practical use for universities and their professors to include more
technology tools into classrom where students can collaborate and activly participate in some
tasks and activities outside of classroom. Also, software companies my use this research to
upgrade Google and Dropbox in terms of their functionality and easier interface to increase the
number of users within this population.
The main limitation of this study is that it included predominantly students from the
School of Economics and Business at the University of Sarajevo. Future research should examine
these propositions within a longitudinal research design to examine the propositions among a
number of student of different areas of study. The key challenge for future research should be the
development of a model which will include additional variables such as grade average or
student’s innovation performance as a predictor of the intent to use technology. Future research
may be directed at analyzing the remaining cloud computing dimensions and their impact on
students’ trust, and to testing inter-dependence of various elements. Since this research was based
on the adoption of software as a service cloud computing, future research may deal with other
factors relevant to the adoption of cloud computing with an emphasis on platform or
infrastructure as a service on institutional level.

420
References
Abushanab, E., Michael Pearson, J., & Setterstrom, A. J. (2010). Internet banking and customers’
acceptance in Jordan: The unified model’s perspective. Communications of the Association
for Information Systems, 26(1), 493–524. https://doi.org/10.1.1.184.5188&
Agudo-Peregrina, Angel Hernandez-Garcia, F. J., & Pascual-Miguel. (2013). Behavioral
intention, use behavior and the acceptance of electronic learning systems: Differences
between higher education and lifelong learning. Computers in Human Behavior, 34, 301–
314. https://doi.org/10.1016/j.chb.2013.10.035
Ajzen, I. (1991). The theory of planned behavior. Orgnizational Behavior and Human Decision
Processes, 50, 179–211. https://doi.org/10.1016/0749-5978(91)90020-T
Alrawashdeh, T. A. (2011). The Extended UTAUT Acceptance Model of Computer-Based
Distance Training System Among Public Sector ’ s Employees in Jordan A Thesis submitted
to the UUM College of Arts and Science in fulfillment of the requirements for the degree of
Doctor of Philosophy. Universiti Utara Malaysia.
Anderson, J. C., & Gerbing, D. W. (1988). Structural Equation Modeling in Practice : A Review
and Recommended Two-Step Approach. Psychological Bulletin, 103(3), 411–423.
Bentler, P. M. (1989). EQS, Structural Equations, Program Manual, Program Version 3.0. Los
Angeles: BMDP Statistical Software, Inc.
Bhatiasevi, V., & Naglis, M. (2016). Investigating the structural relationship for the determinants
of cloud computing adoption in education. Education and Information Technologies, 21(5),
1197–1223. https://doi.org/10.1007/s10639-015-9376-6
Cheng, B., Wang, M., Yang, S. J. H., & Peng, J. (2011). Acceptance of competency-based
workplace e-learning systems: Effects of individual and peer learning support. Computers &
Education, 57(1), 1317–1333. https://doi.org/10.1016/j.compedu.2011.01.018
Davis, F. (1989). Perceived usefulness, perceived ease of use, and user acceptance of information
technology. MIS Quarterly, 13(3), 319–340.
Davis, F. D., Bagozzi, R. P., & Warshaw, P. R. (1989). User acceptance of computer technology:
a comparison of two theoretical. Management Science, 35(8), 982–1003.
Escobar-Rodríguez, T., & Carvajal-Trujillo, E. (2014). Online purchasing tickets for low cost
carriers: An application of the unified theory of acceptance and use of technology (UTAUT)
model. Tourism Management, 43, 70–88. https://doi.org/10.1016/j.tourman.2014.01.017
Fishbein, M., & Ajzen, I. (1975). Belief, Attitude, Intention, and Behavior: An Introduction to
Theory and Research. Addison-Wesley.
Fornell, C., & Larcker, Da. F. (1981). Evaluating Structural Equation Models with Unobservable
Variables and Measurement Error. Journal of Marketing Research, 18(1), 39–50.
Gefen, Karahanna, & Straub. (2003). Trust and TAM in Online Shopping: An Integrated Model.
MIS Quarterly, 27(1), 51. https://doi.org/10.2307/30036519
Gribbins, M. (2007). The Perceived Usefulness of Podcasting in Higher Education : A Survey of
Students ’ Attitudes and Intention to Use. Proceedings of the Second Midwest United States
Association for Information Systems, Springfield, IL, 7. Retrieved from
https://edocs.uis.edu/mgribbin/www/MWAIS2007paper.pdf
Hair, J.F., Black, W.C., Babin, B.J., Anderson, R. E. (2010). Multivariate Data Analysis (7th
Edition). Prentice Hall; 7 edition.
Higgins, C., & Compeau, D. (1995). Development of a Measure and Initial Test, 19(2), 189–211.
421
Retrieved from http://www.jstor.org/stable/249688?seq=7
Hwang, G. J., Kuo, F. R., Chen, N. S., & Ho, H. J. (2014). Effects of an integrated concept
mapping and web-based problem-solving approach on students’ learning achievements,
perceptions and cognitive loads. Computers and Education, 71, 77–86.
https://doi.org/10.1016/j.compedu.2013.09.013
Isăilă, N. (2014). Cloud Computing in Education. Knowledge Horizons - Economics, 6(2), 100–
103.
Jairak, K., Praneetpolgrang, P., & Mekhabunchakij, K. (2009). An acceptance of mobile learning
for higher education students in Thailand. The Sixth International Conference on ELearning
for Knowledge-Based Society, Thailand, (December), 17–18. Retrieved from
http://ijcim.th.org/SpecialEditions/v17nSP3/36_Full_Kallaya Jairak_Online.pdf
Jarvenpaa, S. L., Tractinsky, N., & Saarinen, L. (1999). Consumer Trust in an Internet Store: A
Cross-Cultural Validation. Journal of Computer-Mediated Communication, 5(2).
https://doi.org/10.1111/j.1083-6101.1999.tb00337.x
Kim, B. G., Park, S. C., & Lee, K. J. (2007). A structural equation modeling of the Internet
acceptance in Korea. Electronic Commerce Research and Applications, 6(4), 425–432.
https://doi.org/10.1016/j.elerap.2006.08.005
Kreijns, K., Van Acker, F., Vermeulen, M., & Van Buuren, H. (2013). What stimulates teachers
to integrate ICT in their pedagogical practices? the use of digital learning materials in
education. Computers in Human Behavior, 29(1), 217–225.
https://doi.org/10.1016/j.chb.2012.08.008
Lee, M. C. (2010). Explaining and predicting users’ continuance intention toward e-learning: An
extension of the expectation-confirmation model. Computers and Education, 54(2), 506–
516. https://doi.org/10.1016/j.compedu.2009.09.002
Lee, Y. H., Hsieh, Y. C., & Ma, C. Y. (2011). A model of organizational employees’ e-learning
systems acceptance. Knowledge-Based Systems, 24(3), 355–366.
https://doi.org/10.1016/j.knosys.2010.09.005
Liao, C., Palvia, P., & Chen, J. L. (2009). Information technology adoption behavior life cycle:
Toward a Technology Continuance Theory (TCT). International Journal of Information
Management, 29(4), 309–320. https://doi.org/10.1016/j.ijinfomgt.2009.03.004
Liu, I. F., Chen, M. C., Sun, Y. S., Wible, D., & Kuo, C. H. (2010). Extending the TAM model to
explore the factors that affect Intention to Use an Online Learning Community. Computers
and Education, 54(2), 600–610. https://doi.org/10.1016/j.compedu.2009.09.009
Liu, S., & Yuan, C. (2005). Applying The Technology Acceptance Model and Flow Theory to
Online E-Learning Users’ Acceptance Behavior. International Association for Computer
Information Systems, VI(2), 175–181. https://doi.org/10.1108/09590550610660297
Luarn, P., & Lin, H. H. (2005). Toward an understanding of the behavioral intention to use
mobile banking. Computers in Human Behavior, 21(6), 873–891.
https://doi.org/10.1016/j.chb.2004.03.003
Mohammadi, H. (2015). Investigating users’ perspectives on e-learning: An integration of TAM
and IS success model. Computers in Human Behavior, 45, 359–374.
https://doi.org/10.1016/j.chb.2014.07.044
Obe, O. O., & Balogun, V. F. (2007). Practice, trends and challenges of mobile commerce in
Nigeria. Information Technology Journal. https://doi.org/10.3923/itj.2007.448.456
Okazaki, S., Skapa, R., & Grande, I. (2008). Capturing global youth: Mobile gaming in the U.S.,
Spain, and the Czech Republic. Journal of Computer-Mediated Communication, 13(4), 827–
422
855. https://doi.org/10.1111/j.1083-6101.2008.00421.x
Oliveira, T., Faria, M., Thomas, M. A., & Popovič, A. (2014). Extending the understanding of
mobile banking adoption: When UTAUT meets TTF and ITM. International Journal of
Information Management, 34(5), 689–703. https://doi.org/10.1016/j.ijinfomgt.2014.06.004
Oye, N. D., N.a, L., & Rabin, Z. A. (2011). A Model of ICT Acceptance and Use for Teachers in
Higher Education Institutions. International Journal of Computer Science &
Communication Networks, 1(October), 22–40.
Park, S. Y. (2009). An Analysis of the Technology Accept ance Model in Understanding
University Students’ Behavioral Intention to Use e-Learning. Educational Technology &
Society, 12, 150–162. https://doi.org/10.1007/s00340-009-3513-0
Poon, W.-C. (2007). Users’ adoption of e-banking services: the Malaysian perspective. Journal
of Business & Industrial Marketing, 23(1), 59–69.
https://doi.org/10.1108/08858620810841498
Pousttchi, K., & Wiedemann, D. G. (2007). What Influences Consumers ’ Intention to Use
Mobile Payments ? LA Global Mobility Round Table, 1–16. Retrieved from
http://www.marshall.usc.edu/assets/025/7534.pdf
Rogers, E. M. (2003). Diffusion of innovations. New York: Free Press, 5th edition.
Schumacker, R. E., & Lomax, R. G. (2004). A beginner’s guide to structural equation modeling,
Second edition. Mahwah, NJ: Lawrence Erlbaum Associates.
Sclater, N. (2009). eLearning in the Cloud. Retrieved from
http://cloudworks.ac.uk/cloud/view/2430/
van Schaik, P. (2009). Unified Theory of Acceptance and use for Websites used by Students in
Higher Education. Journal of Educational Computing Research, 40, 229–257.
https://doi.org/10.2190/EC.40.2.e
Venkatesh, V. (2000). Determinants of Perceived Ease of Use : Integrating Control , Intrinsic
Motivation , Acceptance Model. Information Systems Research, 11(4), 342–365.
Wu, I. L., & Chen, J. L. (2005). An extension of Trust and TAM model with TPB in the initial
adoption of on-line tax: An empirical study. International Journal of Human Computer
Studies, 62(6), 784–808. https://doi.org/10.1016/j.ijhcs.2005.03.003
Wu, J. H., & Wang, S. C. (2005). What drives mobile commerce? An empirical evaluation of the
revised technology acceptance model. Information and Management, 42(5), 719–729.
https://doi.org/10.1016/j.im.2004.07.001
Wu, Y. L., Tao, Y. H., & Yang, P. C. (2007). Using UTAUT to explore the behavior of 3G
mobile communication users. IEEM 2007: 2007 IEEE International Conference on
Industrial Engineering and Engineering Management, 199–203.
https://doi.org/10.1109/IEEM.2007.4419179