6. improvement of distribution system
TRANSCRIPT

6-1
6. Improvement of Distribution System Western Area network has a lot of weak points because of not only old facilities but also insufficient planning, rehabilitation and maintenance.
Considering present situation of the system, this master plan shall be divided into three terms, i.e. the short, medium and long terms.
Especially, in the short term, the aim is the urgent rehabilitation of existing facilities and the main objectives are to secure the power supply to consumers and to improve old facilities. ① Current Situation of Distribution System (6.1) STEP-1:Study of Current Situation
Data collection (specification of distribution facility, quantity, faulty condition, etc.) Operation and maintenance conditions (fault and repair information of the system) Demand on major distribution station (load current, voltage, power factor, etc.)
STEP-2:Preparation of Preliminary Database for Distribution Network Facility Register (11/ 33 kV lines, transformer, Ring Main Unit (RMU)) Related documents (single line diagram of the system and S/S, location and route map)
STEP-3:Preliminary System Analysis to the end of 2008 Demand study at major distribution stations Preparation of system diagram System analysis (Voltage drop and energy losses) Obstruction of weak points and countermeasures
② Basic Policy (6.2) Development plan in Western Area (infrastructural, industrial, housing, etc.) Consideration of countermeasure to the current system Improvement of distribution system
Securing of a safe and economical system Promotion of rural electrification Establishment of optimal distribution system
③ Demand Forecast and Distribution Network (6.3) Demand forecast at major distribution stations Preparation of preliminary system diagram and route map for 2015/2020/2025
④ System Analysis (6.4) Outline of analysis and preparation of data System analysis on year 2015/2020/2025 Results and Conclusion
⑤ Optimal Distribution System (6.5) Recommendations for the system in 2015/2020/2025 Projects for rehabilitation, reinforcement and expansion of distribution network Project cost for rehabilitation, reinforcement and expansion of distribution network
⑥ Recommendations (6.6) Recommendations for planning and O&M of distribution network Recommendations for transmission and distribution system (10.2.2)
[Source] JICA Study Team

6-2
6.1 Collection of Data (1) Current Status of Distribution Facilities Since there are not enough existing data, data on existing facilities such as generators, transformers and lines are collected based on the detailed work flow shown in Fig. 6.1-1. These facility data are summarized as the preliminary facility registers shown in Chapter-2 of Supplemental Volume-1. Location of facilities and 11 kV line route shall be provided considering existing data and latest information shown in item-3 of the Appendices in this volume. Regarding constants for generators, transformers and lines which are necessary to conduct system analysis, these are also investigated and shown in item 6.7 with some assumptions, and the constants of future facilities are adopted as ordinary values.
Start
(Existing records)No No No 1. Maintenance & Fault Records
2. Consumers by category[A] Yes Yes Yes 3. Population for each area
Yes 4. No. of Household for each area(Prepare later stage) (Prepare later stage) (Minimum Past five years)
NoNo
Yes[B]
Yes 1. Road 6. Ambient conditions1. 11/ 33 kV Systems 2. Communication2. LV Trunk Lines 3. City water & Drainage
4. ArchitecturalNo 5. City/ Council Laws
No 6. Public facilities[C] Yes
1: Generators 1. Power Project Yes 2: Transformers 2. Development Plan
3: Lines
[A] [B] [C] P/S & S/S: 1End 2
33. Harmonic component (If necessary) 4
56789 Freetown S/S
Congo Cross S/SBrookfields S/SWilberforce S/SWellington S/S
Kingtom P/SFalcon Bridge S/SBlackhall Road P/S
Regent S/S
5. Relay settings of 11/ 33 kV SWGR
1. Key Plan2. Detail Plan
Future Plan
1. Distribution Substation2. 11/ 33 kV Transformer3. 11/ 33 kV Lines
1. Each P/S and S/S2. P, Q, A (3-phase), V & pf. (Every half hour interval for a week)
4. Erection
Environmental Law
JICA Standards
4. LV Lines
2. Distribution Transformer
Power Flow
Other Laws
Measure Power Flow
Prepare Registers
Route Map
Provide Maps
Constants
3. LV System
Detail Data
On going Power Project Assistedby the Donors
Draw System Diagram
System Diagram
Facility Register
5. Maintenance records sheet
Electrical Standards
Preparation of outline
Electrical Law
1. 11/ 33 kV System
[Source] JICA Study Team
Fig. 6.1-1 Work Flow of Data Collection
(2) Demand at the End of 2008 The 11 kV power supply system in Western Area can be divided into seven (7) major power distribution stations. Power flow on 11 kV network as of the end of 2008 is estimated considering; (i) actual measurement of current at major substations, (ii) capacity of transformers connected to each feeder, and (iii) records of peak load on each feeder. The peak demand is adopted as residential because the peak demand was recorded at night time. There are two independent power supply sources in Western Area: One is Kingtom P/S and the other is Blackhall Road P/S but these are not synchronized. The estimated maximum power demand is 45.3 MW at the end of 2008 and flow, assuming power factor to be 0.9, is shown in Fig. 6.1-2.

6-3
Kingtom P/S (1)By Kingtom P/S By Blackhall Road P/S (Unit: MW)
4.2 Present Load 1.7 3.5Not Supplied 1.3
Total 3.0
(4) 7.2 (2)
Present Load 4.2 Present Load 3.5Not Supplied 0.2 Not Supplied 3.9 0
Total 4.4 Total 7.40 (5) Blackhall Road P/S (3)
Present Load 3.1 Present Load 1.0Not Supplied 4.3 Not Supplied 6.8
4.1 Total 7.4 Total 7.81.0
(6) (7)
Present Load 4.1 Main Line: Red: Energized Present Load 1.0Not Supplied 5.1 Black: Faulty Not Supplied 5.1
Total 9.2 Dotted: Under construction Total 6.1
Remarks: 1) Estimated Power Factor: 0.9 2) Not Supply: 26.7 [MW] 3) Total Load: 45.3 [MW]
Congo Cross Area
Wilberforce Area
Kingtom Area
Falcon Bridge Area
6) Black numerical value shows the power which can not supply because of load sharing. 5) Red numerical values are present peak load on each area. Therefore, time difference shall be considered for the study of actual system demand.
Blackhall Road Area
Wellington Area
Brookfields Area
4) Arrow shows power flow and No. of 11 kV main line which capacity is about 5 MW.
[Source] JICA Study Team
Fig. 6.1-2 Power Flow on 11 kV Network in 2008 (3) Analysis of Existing System The existing distribution system at the end of 2008 is operated with emergency conditions far from the normal system, i.e. shortage of power supply and temporary power supply route because of line faults. However, to find out existing weak points and abstraction of policy, it is necessary to conduct preliminary study. Considering Fig. 6.1-2, Falcon Bridge is an important station which distributes power to the centre of Freetown and also to major commercial areas and there are four weak points for voltage drop located at the end of 11 kV radial systems. Preliminary system analysis is applied to the following five points which are shown by red letters in Fig. 6.1-3.
① Falcon Bridge S/S, ② Lakka No. 2, ③ Cape Sierra, ④ Guma pumping station, and ⑤ Waterloo.
1) Assumptions and conditions
Assumptions and conditions to be used for the preliminary system analysis are as follows;
① Assume the load by connected transformer capacity on each line based on the field investigation and information by NPA,
② The peak demand is assumed to occur during night time when residential electricity consumption is dominant based on the daily load curve in 2002 when all DEG units at Kingtom P/S were available,
③ Power factor is selected considering actual measurements at Kingtom and Blackhall Road

6-4
P/S as 0.9 and 0.8 respectively and sending voltage as 11 kV, ④ It is assumed that each area peak occurs at the same time for the simple study. ⑤ Short circuit analysis is neglected because the power system is small at 20 MW, and ⑥ Protection coordination analysis is omitted.
2) Result of Analysis:
Based on the above assumptions and conditions, preliminary analysis was conducted at the end of 2008 and highlighted as follows;
① Voltage drop at Lakka No. 2 area is beyond permissible voltage range, and ② Energy losses are high.
The result of voltage drop analysis is shown in Table 6.1-1, and Fig. 6.1-3 shows voltage at each point.
Table 6.1-1 Voltage Drop in Western Area (2008) Bus bar Drop [%] Bus bar Drop [%]
A:1 To Lakka No. 2 line 2 To Pumping Station line
1) Kingtom 11.00 1) Kingtom 11.002) Brookfield 10.88 0.12 1.1 2) Brookfield 10.88 0.12 1.13) Wilberforce 10.75 0.25 2.3 3) River Side Drive 10.83 0.17 1.64) Lumley 10.62 0.38 3.5 4) Hill Station 10.73 0.27 2.55) Peninsular 10.41 0.59 5.6 5) Pumping Station 10.69 0.31 2.96) Lakka No. 2 10.39 0.61 5.9
Power losses on the above lines 173 kW 112 kW
3 To Cape Sierra line 4 To Falcon Bridge line1) Kingtom 11.00 1) Kingtom 11.002) Congo Cross 10.83 0.17 1.5 2) Falcon Bridge 10.81 0.19 1.73) Cape Sierra 10.61 0.39 3.6
Power losses on the above lines 97 kW 56 kW
B: Blackhall Road System (pf=0.8) Total Power Losses: 471 [kW]1 To Waterloo line
1) Blackhall Road 11.002) Wellington 10.88 0.12 1.13) FTC 10.83 0.17 1.64) Waterloo 10.73 0.27 2.5
Power losses on the above lines 33 kW
Remarks: Power factor at Blackhall Road P/S was considered actual record.
Kingtom System (pf=0.9)
Voltage [kV] RemarksNo. From No. FromRemarksVoltage [kV]
[Source] JICA Study Team 3) Countermeasures:
As preliminary steps to counter weak points, the following countermeasures shall be taken urgently;
① Increase sending voltage to 11.5 kV at power stations, ② Power factor shall be more than 0.9 (0.95 is preferable), ③ Select adequate tap for distribution transformers in voltage problem areas, ④ Add new trunk lines to reduce line impedance, ⑤ Select adequate power flow to reduce power losses, and ⑥ Consider reactive power supplier.

6-5
[Source] JICA Study Team
Fig. 6.1-3 Voltage Analysis in Western Area (2008)
① Falcon Bridge S/S
⑤ Waterloo
④ Guma Pumping Station
③ Cape sierra
② Lakka No.2

6-6
6.2 Basic Strategy and Policy Optimal distribution system to be studied up to 2025 shall be conducted in three phases considering i) current situation of the distribution system, ii) future plans, iii) new technology and establishment of high reliability and quality from emergency rehabilitation implemented as first priority. Basic strategy is divided into three phases as follows;
• Short Term (2010 ~ 2015 year): Emergency Program, • Medium Term (2016 ~ 2020 year): Improvement and Rural Electrification, and • Long Term (2021 ~ 2025 year): Secure Reliability and Quality.
The contents of basic policy are selected considering clear-off of the present weak points on power supply network and upgrading of living standards.
∗ Secure stable distribution System ∗ Promote Rural Electrification ∗ Establish Optimal Distribution System
Detailed items to be taken into considerations in formulating the plans that accord with the above mentioned policies are as follows. 1) Secure Stable Distribution System
① Secure main power supply line ② Ensure back-up power supply line ③ Preparation of design and installation standards
2) Promote Rural Electrification
① Establish 33 kV distribution network ② Secure safety power supply ③ Consider load density
3) Establish Optimal Distribution System
① Capacity building for distribution system including 33 kV system ② No excessively over loaded facilities ③ Provide adequate protection system ④ Secure quality of supplied power ⑤ Standardization of design, operation and maintenance ⑥ Establish Central Dispatching Centre and economical operation
Based on site investigation and considering energy strategy of the MEWR and the NPA, the key index to be set in order to approach the goal is shown in Table 6.2-1.
Table 6.2-1 Key Index to each Phase (Year 2015/2020/2025) Index Unit 2008 2015 2020 2025
Energy Losses [%] 42.0 30> 20> 10> Power Outage [Hours] >5,000 500> 50> 1> No. of Fault [Times] 981 600> 300> 100> Electrification Rate [%] 22.9 >40 >60 >95 New Consumers [Houses] 3,664 >56,000 >88,000 >136,000
[Remarks] 1. Above key index applied Western Area only. 2. Energy losses are only for distribution network. Not including transmission line including 161 kV S/S. 3. Energy losses are including technical and non-technical losses. [Source] JICA Study Team

6-7
6.3 Demand Forecast and Distribution System 6.3.1 Demand Forecast Demand forecast as a basis for this study in Western Area is assumes based on area demand as shown in item 6.1 and taking into consideration energy strategy and future development plans in Western Area. The peak demand in major distribution stations depends on the load conditions, for example, daytime demand is high in commercial areas, whereas nighttime demand is high in residential areas which are also affected by weekends. That is, the total of peak demand for distribution stations is different to the overall Western Area demand. For example, area peak demand mentioned in section 4 in 2015 is 67.4 MW. However, the total of distribution stations is 80 MW as shown in Fig. 6.3-1 which is always larger than area peak demand. Peak demand to be used for system analysis shall be peak demand in each major distribution station which is based on data in 2008 as mentioned in Fig. 6.1-2 and also considering energy strategy of power sector, future development plans such as rural electrification, housing plans, availability of land and average annual rate of increase rate of the demand in each area. Considering above conditions and peak demand of each distribution station in 2015/2020/2025, preliminary power flow is shown in Fig. 6.3-1.
(Unit: MW)
XLPE2-500 (1) (2) ACSR500 (3)(9) ACSR500: 51 MVA MXLPE2-500 MXLPE2-500
0.5 km 2015 3.7 2 km 2015 12.1 4 km 2015 14.02020 4.3 2020 14.8 2020 17.1
0.5 km 2025 4.7 2.9 km 2025 17.2 4.2 km 2025 19.9 3.8 km 2.4 km 10 km
13 km AAAC150: 23 MVA, XLPE185 AAAC150: 23 MVA 3 km XLPE185
(4) (5) (7)
3.4 km 2015 6.9 2015 11.5 2015 6.2AAAC150 3.4 km 2020 8.8 2020 14.7 2020 7.9
23 MVA 2025 11.2 2025 18.8 10 km 2025 9.7XLPE183 3 km AAAC150: 23 MVA 7 km
2.5 km XLPE185 ACSR240 33 MVA
(6) (8) (11)
2015 10.8 4.5 km 2015 3.0 13 km 2015 5.72020 13.3 ACSR120: 22 MVA 2020 3.5 ACSR120: 22 MVA 2020 5.02025 15.4 XLPE185 2025 4.0 XLPE185 2025 7.5
XLPE185 XLPE185 7 km ACSR240: 33 MVA ACSR240: 33 MVA 15 km
(10) (13) (12)
2015 6.1 49 km 2015 --- 17 km 2015 ---2020 10.5 ACSR120: 22 MVA 2020 2.0 ACSR120: 22 MVA 2020 6.02025 13.6 XLPE185 2025 2.9 XLPE185 2025 12.1
Legend: Abbreviation Total [MW] : 33 kV Trunk Line J/S: Junction Station 2015 80.0 : 11 kV Trunk Line P/S: Power Station 2020 107.9
S/S: Substation 2025 137.0
Lumpa S/STombo S/SGoderich S/S
Brookfields J/SCongo Cross J/S
Regent S/SWilber Force S/S
Wellington S/S
Jui S/S
Blackhall Road P/SKingtom P/S Falcon Bridge S/S
Freetown S/S
[Source] JICA Study Team
Fig. 6.3-1 Peak Demand Forecast in each Area (2015/2020/2025)

6-8
6.3.2 Distribution Network Rehabilitation, reinforcement and expansion plan of the distribution network shall have close relation ship to generation and transmission planning. Generation plan shall be applied to the Hydro Dominant Scenario shown in Table 5.3-8 and 161 kV, single circuit from Bumbuna P/S shall be considered as transmission line. The optimal distribution system shall be planned taking into consideration the basic policy mentioned in item 6.2, considering clear-off of the weak points on existing system and minimization of the modification of the existing facilities, and also considering future requirements to the system. The conceptual plan shall be provided considering the following points:
a) New facilities shall be used until year 2025. b) Location of new substations shall be determined considering load density and coverage
area. c) Loop system shall be adapted to 33 kV system. d) Reduce energy losses on the distribution network. e) Consider environmental aspect to facility planning. f) Promote rural electrification. g) Consider ongoing project by the WB. h) Power from international line comes from Bumbuna 161 kV, 1-circuit line
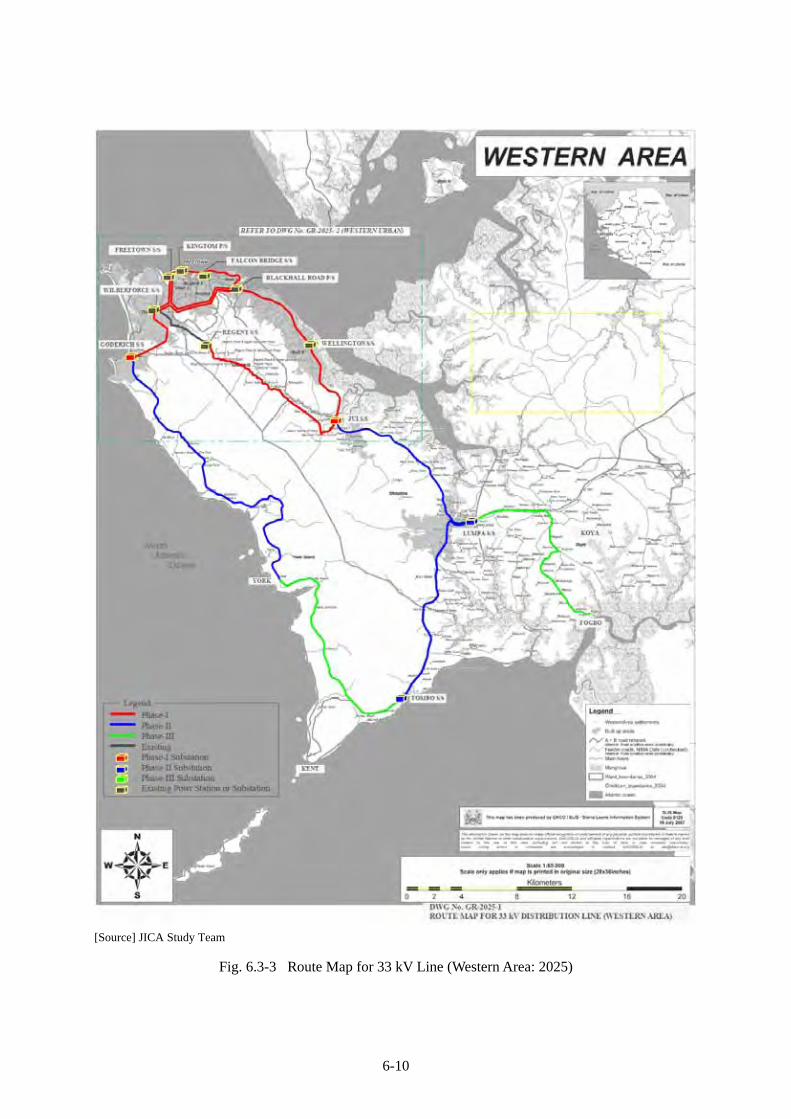
Preliminary distribution system to be used for the system analysis shall be provided considering rehabilitation of the 11 kV system, reinforcement of distribution system to adopt the 33 kV system and expansion of distribution network. Considering the above requirements, preliminary power system up to 2025 is shown in Fig. 6.3-2 and location of new substation and line route is shown in Fig. 6.3-3 and Fig. 6.3-4 respectively. Location of Goderich S/S with new 33 kV line shall be planned considering environmental aspects. Preliminary new 33 kV line route is shown in Fig. RM-D05 and also 11 kV and 33 kV SWGR systems are shown in item 3 of Appendices.

6-9
[Source] JICA Study Team Fig. 6.3-2 Western Area Power System 2025
6-10
[Source] JICA Study Team
Fig. 6.3-3 Route Map for 33 kV Line (Western Area: 2025)

6-11
[Source] JICA Study Team Fig. 6.3-4 Route Map for 33 kV Line (Urban Area: 2015/ 2020)
AbbrevationP/S : Power StationS/S : Substation
Symbol: Existing Power Station or Substation: Substation for phase‐1: Substation for phase‐2: Existing 33 kV Line: 33kV Phase‐1 Line: 33 kV Phase‐2 Line
DWG No. GR-2025-2 ROUTE MAP FOR 33 kV DISTRIBUTION LINE (WESTERN URBAN)
Freetown S/S
Wilberforce S/S
Regent S/S
Blackhall Road P/S
Wellington S/S
Jui S/S
To Lumpa S/S
To York
Kingtom P/S Falcon Bridge S/S
Goderich S/S
WB Project line(Under Construction)
WB Project line(Under Construction)
WB Project line(Under Construction)
Japan's Grant Aid Project
WB Project line(Under Construction)

6-12
6.4 System Analysis System analysis shall be conducted based on the demand forecast in each area and system configuration described in item 6.3. Major components of the analysis are: (1) Outline of analysis, (2) Preparation of analysis data, (3) Result of the analysis, and (4) Conclusion which is as follows. (1) Outline of Analysis Outline of the analysis consists of five items, namely 1) Scope of analysis, 2) Analyzing year, 3) Contents of analysis, 4) Prerequisite and 5) Methodology of analysis, and is as follows. 1) Scope of Analysis
The scope is Above 11 kV system connected to Western Area network except radial system. 2) Analyzed Year
Peak demand in each year 2015, 2020 and 2025 (Refer to Fig. 6.3-1). 3) Contents of Analysis
The following six items shall be analyzed using software of Japanese institute as follows.
a) Calculation of Power Flow b) Calculation of Short Circuit Capacity c) Calculation of Power Flow at N-1 system Fault d) Analysis of Voltage Stability e) Calculation of Frequency f) Analysis of Stability
4) Prerequisite
a) Generator output shall be according to Table 5.3-8, b) Peak demand in each area shall be as per Fig. 6.3-1 and load on Bus [A] and [B] of 11 kV
and 33 kV SWGR shall be divided equally, c) Generator voltage shall be rated voltage of generator which shall be 1 power unit (p.u.), d) Power factor shall be 0.9, e) 11 kV bus-tie CB shall be open in Freetown S/S and Kingtom P/S and others are close
conditions, f) System losses shall be calculated according to balancing method of generator output
(Refer to Appendix 6.4-1). Minimum output of DEG shall be 1.0 MW, g) When voltage adjustment is required for power flow, first, transformer tap shall be
adjusted and if it is not enough then reactive power suppliers shall be considered. Voltage adjustment range shall be within 1.00 p.u. +/- 0.05 p.u.,
h) 11 kV radial systems are not included in this analysis, and i) Study of optimal system is only for 2015.
5) Methodology
① Power flow in Base case (Transformer tap is 1.00 p.u. and without phase regulator) ② Power flow after adjustment of transformer tap changing ③ Power flow after installation of preliminary phase regulator ④ Re-calculation of power flow with proposed SC to 2015 ⑤ Calculation of short circuit capacity ⑥ Confirmation of countermeasure to excessive short circuit capacity
Changing the system configuration and reconfirmation of above item ① ~ ⑤

6-13
⑦ Power flow on N-1 system fault condition Apply one circuit fault on double circuits on loop system and identify the faulty points in the power flow
⑧ Analysis of voltage stability Confirm P-V curve on 11 kV SWGR at Kingtom P/S
⑨ Calculation of frequency Confirmation of frequency at Kingtom P/S when Bumbuna 161 kV line fault and advice load shedding.
⑩ Analysis of stability Confirmation of stability of generators at Kingtom P/S when load shedding is applied to the above item ⑨.
(2) Preparation of Analytical Data It is necessary to provide technical data for transmission/ distribution lines, transformer and generator which were collected during site survey. Similar technical data and conditions of standard line arrangement in Japan shall be applied if electrical facilities, line specifications and arrangement of lines are unclear. 1) Transmission and distribution line data
Facility resister of lines, Western Area power system 2025 (DWG No. GE-2025) and Fig. 6.3-1 shall be used for impedance and admittance calculation (Refer to Table 6.4-1 of section 6.7). 2) Transformer data
Facility resister of transformer shall be used to determine the reactance (Refer to Table 6.4-2 of section 6.7). 3) Generator data
Using existing generator data and some data were assumed (Refer to Table 6.4-3 of section 6.7).
(3) Analysis and Result System analysis based on Fig. 6.3-1 consists of 1) Power flow calculation, 2) Re-calculation of power flow with proposed SC, 3) Calculation of short circuit capacity, 4) Power flow calculation at N-1 fault, 5) Voltage stability analysis, 6) Frequency calculation, and 7) Stability analysis. Detail calculation results are as follows. 1) Calculation of power flow There are three steps to the analysis: First, step ① is to calculate without any voltage adjustment and if bus bar voltage is not within 0.95 to 1.05 p.u., then step ② shall be applied which is apply tap changing of transformer, and if voltage is still not within permissible range, then step ③ shall be applied as a last solution which is considered static condenser. Following points as a basis shall be considered for the voltage adjustment;
a) Voltage adjustment range of transformer shall be considered margin in which highest and lowest tap shall not be used,
b) SC shall be installed on 11 kV systems and unit capacity shall be 2 MVA as three phase capacity. The capacity of SC shall be selected as about 1/3 of installed transformer capacity, and
c) Assume reactive power of generator shall be within rated power factor of generator.

6-14
Table 6.4-4 Calculation Result of Power Flow in 2015 Power flow①
(Base) Power flow②
Tap Adjustment Power flow③
Installation of SC Name of Station
Bus Voltage
[kV] V [p.u.] Tap V [p.u.] Tap Capacity [MVA] V [p.u.]
33 0.98 1.02 1.00 11 (A) 0.98 0.99 1.00 Kingtom 11 (B) 1.00
3 1.00
- 1.00
33 0.98 1.02 1.00 Falcon Bridge 11 0.98 3 0.98 -
+6 0.99 33 0.97 1.02 1.00 Blackhall
Road 11 1.00 7 1.00 - 1.00 Congo Cross 11 0.98 0.98 +6 0.99 Brookfields 11 0.97 0.98 +8 0.99
33 0.97 1.00 0.99 Wilberforce 11 0.95 - 0.96 - +6 0.98
33 0.94 0.99 0.98 Wellington 11 0.90 +3 0.98 - +4 0.98
33 0.96 1.00 0.99 Regent 11 0.92 +2 0.99 - +2 0.99
161 0.98 1.01 1.00 33 0.98 1.02 1.00
11 (A) 1.00 1.00 1.00 Freetown
11 (B) 0.98
-
0.99
-
1.00 33 0.95 0.99 0.98 Goderich 11 0.93 +1 0.99 -
+2 0.97 33 0.94 0.98 0.97 Jui 11 0.91 +1 0.98 -
+2 0.96 33 Lumpa 11 33 Tombo 11
161 1.01 1.05 1.04 Bumbuna 13.8 1.00 1 1.00 1 1.00 Loss of active power 3 MW 3 MW 2 MW
Loss of reactive power 2 MVar*1 3 MVar*1 5 MVar*1 Active 4.4 MW 4.4 MW 4.4 MW
Reactive 37.4 MVar 29.7 MVar 2.2 MVar Kingtom Power factor Lead 0.12 Lag 0.15 Lag 0.89
Active 17.4 MW 17.1 MW 16.6 MW Reactive 14.5 MVar 19.9 MVar 8.4 MVar Blackhall
Road Power factor Lead 0.77 Lag 0.65 Lag 0.89 Active 50 MW 50 MW 50 MW
Reactive 3.3 MVar 1.6 MVar 0.1 MVar Bumbuna Power factor Lead 1.00 Lead 1.00 Lag 1.00
Active Reactive YIBEN-I
Power factor Reference Drawings Fig. 6.4-1 Fig. 6.4-2 Fig. 6.4-3
(* Red letters means out of adjustable range of voltage and power factor of generator) (* Output of P/S is the total value at generator terminal in each P/S) (*1: means minus reactive power because of charging current to line is too large rather than losses) [Source] JICA Study Team

6-15
Table 6.4-5 Calculation Result of Power Flow in 2020 Power flow①
(Base) Power flow②
Tap Adjustment Power flow③
Installation of SC Name of Station
Bus Voltage
[kV] V [p.u.] Tap V [p.u.] Tap Capacity [MVA] V [p.u.]
33 0.95 0.99 0.99 11 (A) 0.97 0.98 1.00 Kingtom 11 (B) 1.00
3 1.00
- 1.00
33 0.95 0.99 0.99 Falcon Bridge 11 0.97 3 0.97 -
+10 0.99 33 0.94 0.99 0.99 Blackhall
Road 11 1.00 7 1.00 - 1.00 Congo Cross 11 0.96 0.97 +12 0.99 Brookfields 11 0.95 0.96 +12 0.99
33 0.93 0.97 0.98 Wilberforce 11 0.93 - 0.94 - +10 0.98
33 0.88 0.93 0.97 Wellington 11 0.82 +4 0.93 - +6 0.97
33 0.91 0.95 0.98 Regent 11 0.87 +2 0.94 - +2 0.97
161 0.95 0.99 0.99 33 0.95 0.99 0.99
11 (A) 0.99 1.00 1.00 Freetown
11 (B) 0.97
-
0.98
-
1.00 33 0.90 0.94 0.98 Goderich 11 0.85 +2 0.94 -
+8 0.98 33 0.87 0.91 0.97 Jui 11 0.84 +2 0.93 -
+4 0.97 33 0.82 0.87 0.96 Lumpa 11 0.79 +2 0.88 -
+6 0.97 33 0.81 0.85 0.96 Tombo 11 0.77 +2 0.84 -
+2 0.97 161 1.00 1.04 1.04 Bumbuna 13.8 1.00 1 1.00 1 1.00 161 1.00 1.04 1.04 YIBEN-I 15 1.00 1 1.00 1 1.00
Loss of active power 9 MW 8 MW 6 MW Loss of reactive power 25MVar 21MVar 13 MVar
Active 4.3 MW 4.3 MW 4.3 MW Reactive 68.1 MVar 58.9 MVar 0.6 MVar Kingtom
Power factor Lag 0.06 Lag 0.07 Lag 0.99 Active 20.6 MW 19.7 MW 17.8 MW
Reactive 23.9 MVar 29.5 MVar 12.5 MVar Blackhall Road
Power factor Lag 0.65 Lag 0.55 Lag 0.82 Active 36.8 MW 36.8 MW 36.8 MW
Reactive 2.9 MVar 3.2 MVar 2.6 MVar Bumbuna Power factor Lag 1.00 Lag 1.00 Lag 1.00
Active 45.3 MW 45.3 MW 45.3 MW Reactive 1.2 MVar 1.7 MVar 1.0 MVar YIBEN-I
Power factor Lag 1.00 Lag 1.00 Lag 1.00 Reference Drawings Fig. 6.4-4 Fig. 6.4-5 Fig. 6.4-6
(* Red letters means out of adjustable range of voltage and power factor of generator) (* Output of P/S is the total value at generator terminal in each P/S) [Source] JICA Study Team

6-16
Table 6.4-6 Calculation Result of Power Flow in 2025 Power flow①
(Base) Power flow②
Tap Adjustment Power flow③
Installation of SC Name of Station
Bus Voltage
[kV] V [p.u.] Tap V [p.u.] Tap Capacity [MVA] V [p.u.]
33 0.93 0.96 0.99 11 (A) 1.00 0.96 0.99 Kingtom 11 (B) 1.00
3 1.00
- 1.00
33 0.93 0.96 0.99 Falcon Bridge 11 0.98 3 0.96 -
+12 0.99 33 0.92 0.95 0.99 Blackhall
Road 11 1.00 7 1.00 - 1.00 Congo Cross 11 0.96 0.95 +18 0.99 Brookfields 11 0.96 0.94 +18 0.99
33 0.90 0.92 0.98 Wilberforce 11 0.93 - 0.91 - +18 0.98
33 0.82 0.86 0.96 Wellington 11 0.74 +7 0.86 - +8 0.97
33 0.87 0.90 0.98 Regent 11 0.82 +3 0.89 - +4 1.00
161 0.94 0.95 0.98 33 0.93 0.96 0.99
11 (A) 0.99 0.99 1.00 Freetown
11 (B) 0.99
-
0.96
-
1.00 33 0.85 0.88 0.98 Goderich 11 0.77 +3 0.98 -
+12 0.99 33 0.79 0.83 0.96 Jui 11 0.75 +3 0.85 -
+8 0.98 33 0.71 0.75 0.95 Lumpa 11 0.62 +3 0.74 1
+12 0.98 33 0.72 0.76 0.96 Tombo 11 0.66 +3 0.74 2
+4 1.00 161 0.99 1.03 1.03 Bumbuna 13.8 1.00 1 1.00 1 1.00 161 1.00 1.02 1.04 YIBEN-I 15 1.00 1 1.00 1 1.00
Loss of active power 18 MW 17 MW 12 MW Loss of reactive power 64 MVar 59 MVar 40 MVar
Active 5.2 MW 4.2 MW 4.2 MW Reactive 125.9 MVar 102.6 MVar 1.7 MVar Kingtom
Power factor Lag 0.04 Lag 0.04 Lag 0.93 Active 47.1 MW 47.5 MW 41.7 MW
Reactive 8.5 MVar 22.9 MVar 1.3 MVar Blackhall Road
Power factor Lag 0.98 Lag 0.90 Lag 1.00 Active 50 MW 50 MW 50 MW
Reactive 8.0 MVar 10.0 MVar 6.3 MVar Bumbuna Power factor Lag 0.99 Lag 0.98 Lag 0.99
Active 54.6 MW 54.6 MW 54.6 MW Reactive 5.7 MVar 8.0 MVar 4.2 MVar YIBEN-I
Power factor Lag 0.99 Lag 0.99 Lag 1.00 Reference Drawings Fig. 6.4-7 Fig. 6.4-8 Fig. 6.4-9
(* Red letters means out of adjustable range of voltage and power factor of generator) (* Output of P/S is the total value at generator terminal in each P/S) [Source] JICA Study Team

6-17
As a result of calculation of power flow, the system shall not be able to operate within the voltage adjustment range and permissible power factor range of generator which are shown in Tables 6.4-4, 6.4-5 and 6.4-6. However, it is possible to maintain the system voltage within the permissible range, if the adequate static condenser (SC) shall be installed considering power flow and demands on each substation. Then the voltage on the 11 kV and 33 kV systems can be maintained within permissible range.
2) Re-calculation of power flow Power flow calculation at year 2015 on item 1), Table 6.4-4 shows calculation result considering with estimated SC after adjustment of voltage taps of transformer. Considering this estimated SC capacity and calculation result, and also taking into consideration of future system improvement plan, installation space of SC in the substation and easy operation and maintenance, proposed SC is shown on Table 6.4-7.
Table 6.4-7 Proposed installation Plan of SC by year 2015
Name of station Capacity of SC [MVA] Target of installation
Falcon Bridge 6 By 2015 Brookfields 6 By 2015 Congo Cross 6 By 2015 Wilberforce 4 By 2015 Wellington 4 By 2015 Goderich 6 Including plan Jui 6 Including plan [Source] JICA Study Team
Based on the above proposed plan and re-calculation of power flow, 11 kV and 33 kV SWGR at each power station and substation can maintain the voltage within adjustable range and also generator can be operated by adjustable range of power factor. Re-calculation results are shown in Table 6.4-8 and system diagram in Fig. 6.4-10. The number of static condensers in each station shall be more than two (2) banks considering load conditions, maintainability and operability. New substations such as Goderich and Jui S/S should be taken into consideration of these SC from the planning stage. Regarding re-calculation of power flow to 2020 and 2025, it shall be omitted because of a lot of unknown factors concerning distribution system, specification of lines and generators and also international transmission lines. Therefore, reference SC capacity is as shown in Table 6.4-5 and Table 6.4-6. It is recommendable that the new substations such as Lumpa S/S and Tombo S/S shall be considered to have adequate SC capacity from the planning stage.

6-18
Table 6.4-8 Re-calculation Result of Power Flow with Proposed SC by 2015 Power flow ③
Installation of SC (Preliminary)Re-calculation of Power flow
with proposed SC Name of Station
Bus Voltage
[kV] Tap SC [MVA] V [p.u] Tap SC [MVA] V [p.u]
33 1.00 1.00 11 (A) 1.00 1.00 Kingtom 11 (B)
- 1.00
- 1.00
33 1.00 1.00 Falcon Bridge 11 -
+6 0.99 - +6 0.99
33 1.00 1.00 Blackhall Road 11 - 1.00 - 1.00
Congo Cross 11 +6 0.99 +6 0.99 Brookfields 11 +8 0.99 +6 0.99
33 0.99 0.99 Wilberforce 11 - +6 0.98 -
+4 0.98 33 0.98 0.99 Wellington 11 -
+4 0.98 - +4 0.99
33 0.99 0.99 Regent 11 - +2 0.99 -
- 0.96 161 1.00 1.01 33 1.00 1.00
11 (A) 1.00 1.00 Freetown
11 (B)
-
1.00
-
1.00 33 0.98 0.99 Goderich 11 -
+2 0.97 - +6 0.99
33 0.97 0.99 Jui 11 - +2 0.96 -
+6 1.00 33 Lumpa 11 33 Tombo 11
161 1.04 1.04 Bumbuna 13.8 1 1.00 1 1.00 161 YIBEN-I 15
Loss of active power 2 MW 2 MW Loss of reactive power 5 MVar*1 5 MVar*1
Active 4.4 MW 4.4 MW Reactive 2.2 MVar 2.5 MVar Kingtom
Power factor Lag 0.89 Lag 0.87 Active 16.6 MW 16.6 MW
Reactive 8.4 MVar 7.9 MVar Blackhall Road
Power factor Lag 0.89 Lag 0.90 Active 50 MW 50 MW
Reactive 0.1 MVar 0.2 MVar Bumbuna Power factor Lag 1.00 Lead 1.00
Reference Drawings Fig. 6.4-3 Fig. 6.4-10 (* Output of P/S is the total value at generator terminal in each P/S) (*1: means minus reactive power because of charging current to line is too large rather than losses) [Source] JICA Study Team

6-19
3) Calculation of short circuit capacity Based on the above power flow calculation, short circuit capacity shall be calculated and it shall be confirmed that the permissible current of lines and short circuit current of circuit breaker are not beyond the rating of facilities (Methodology ⑤) . If the result is abnormal, then the following countermeasures shall be considered (Methodology ⑥);
a) Open the abnormal circuits in which short circuit current is more than the permissible one. Replace the circuit breaker if the rated short circuit current of CB for transformer feeder is less than the calculated one.
b) Conduct power flow calculation based on revised system configuration and confirm the system condition. Recheck the transformer taps and additional SC considering Methodology ① ~ ④.
【2015】 <Base system configuration (Methodology ⑤)>
Table 6.4-9 Confirmation of short circuit capacity of base system (Refer to Fig. 6.4-11) Short circuit current [kA] No. Facility below short circuit current of
the system Line spec. CB Analysis Falcon Bridge 20.0 13.6 1 11 kV line: L203 Blackhall Road 11.0 20.0 14.8 Kingtom 25.0 14.6 2 11 kV line: L120 Congo Cross 11.0 20.0 9.0
(*Red value shows that the calculated short circuit current is more than the permissible one of facilities)
<System configuration after open circuits (Methodology ⑥)>
Table 6.4-10 Confirmation of short circuit capacity after open circuit (Refer to Fig. 6.4-12) Short circuit current [kA] No. Facility below short circuit current of
the system Line spec. CB Analysis 1 11 kV line: L203 Open circuit 2 11 kV line: L120 Open circuit
Table 6.4-11 Confirmation of voltage after open circuit (after adjustment)
Name of station after adjustment of Tap and add
SC
Bus voltage [kV]
Tap SC
Non adjustment Total losses: Active/ Reactive power 2 MW/5 MVar*1
Active/ Reactive power 4.4 MW/2.9 MVar Kingtom Power factor Lag 0.83 Active/ Reactive power 16.6 MW/7.8 MVar Blackhall Road Power factor Lag 0.90 Active/ Reactive power 50 MW/0.1 MVar Bumbuna Power factor Lag 1.00
Reference Drawings Fig. 6.4-13 (*1: means minus reactive power because of charging current to line is too large rather than losses)
Table 6.4-12 Confirmation of power flow with modified system configuration
Facility below required thermal capacity to the distribution lines
Continuous current of
line Rated short circuit
current of CB Power flow
No thermal capacity problems

6-20
<Facilities after consideration of countermeasure to short circuit capacity>
・No facility
【2020】 <Base system configuration (Methodology ⑤)>
Table 6.4-13 Confirmation of short circuit capacity of base system (Refer to Fig. 6.4-14) Short circuit current [kA] No. Facility below short circuit current of
the system Line spec. CB Analysis Falcon Bridge 20.0 17.7 1 11kV line: L203 Blackhall Road
11.0 20.0 22.6
Kingtom 25.0 18.7 2 11kV line: L120 Congo Cross
11.0 20.0 10.6
Congo Cross 20.0 10.2 3 11kV line: L450 Freetown
22.3 16.0 18.3
Brookfields 20.0 14.1 4 11kV line: L550 Freetown
22.3 16.0 18.0
Brookfields 20.0 14.1 5 11kV line: L551 Freetown
22.3 16.0 18.1
Falcon Bridge 20.0 14.8 6 11kV line: L202 Blackhall Road
26.6 20.0 20.6
33kV 25.0 5.0 7
Blackhall Road 33/11kV Transformer 11kV
20.0 22.3
(*Red value shows that the calculated short circuit current is more than the permissible one of facilities)
<System configuration after open circuits (Methodology ⑥)>
Table 6.4-14 Confirmation of short circuit capacity after open circuit (Refer to Fig. 6.4-15) Short circuit current [kA]
No. Facility below short circuit current of the system Line spec. CB Analysis
1 11kV line: L203 Open circuit 2 11kV line: L120 Open circuit 3 11kV line: L450 Open circuit 4 11kV line: L550 Open circuit 5 11kV lineL551 Open circuit
Falcon Bridge 20.0 12.3 6 11kV line: L202 Blackhall Road
26.6 20.0 19.0
33kV 25.0 4.7 7
Blackhall Road 33/11kV Transformer 11kV
20.0 21.3
(*Red value shows that the calculated short circuit current is more than the permissible one of facilities)
6-21
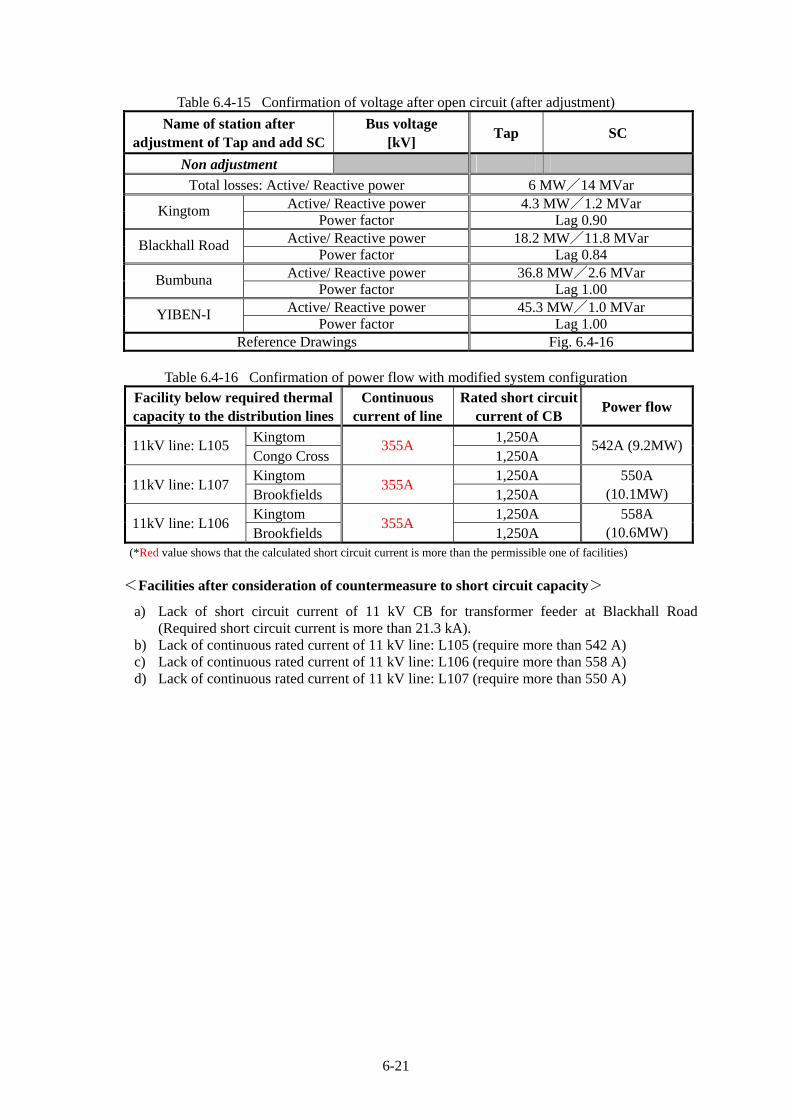
Table 6.4-15 Confirmation of voltage after open circuit (after adjustment) Name of station after
adjustment of Tap and add SC Bus voltage
[kV] Tap SC
Non adjustment Total losses: Active/ Reactive power 6 MW/14 MVar
Active/ Reactive power 4.3 MW/1.2 MVar Kingtom Power factor Lag 0.90 Active/ Reactive power 18.2 MW/11.8 MVar Blackhall Road Power factor Lag 0.84 Active/ Reactive power 36.8 MW/2.6 MVar Bumbuna Power factor Lag 1.00 Active/ Reactive power 45.3 MW/1.0 MVar YIBEN-I Power factor Lag 1.00
Reference Drawings Fig. 6.4-16
Table 6.4-16 Confirmation of power flow with modified system configuration Facility below required thermal capacity to the distribution lines
Continuous current of line
Rated short circuit current of CB Power flow
Kingtom 1,250A 11kV line: L105 Congo Cross
355A 1,250A
542A (9.2MW)
Kingtom 1,250A 11kV line: L107 Brookfields
355A 1,250A
550A (10.1MW)
Kingtom 1,250A 11kV line: L106 Brookfields
355A 1,250A
558A (10.6MW)
(*Red value shows that the calculated short circuit current is more than the permissible one of facilities) <Facilities after consideration of countermeasure to short circuit capacity>
a) Lack of short circuit current of 11 kV CB for transformer feeder at Blackhall Road (Required short circuit current is more than 21.3 kA).
b) Lack of continuous rated current of 11 kV line: L105 (require more than 542 A) c) Lack of continuous rated current of 11 kV line: L106 (require more than 558 A) d) Lack of continuous rated current of 11 kV line: L107 (require more than 550 A)

6-22
【2025】 <Base system configuration (Methodology ⑤)>
Table 6.4-17 Confirmation of short circuit capacity of base system (Refer to Fig. 6.4-17)
Short circuit current [kA] No. Facility below short circuit current of the system Line spec. CB Analysis
Falcon Bridge 20.0 17.7 1 11kV line: L203 Blackhall Road
11.0 20.0 22.6
Kingtom 25.0 18.7 2 11kV line: L120 Congo Cross
11.0 20.0 10.6
Congo Cross 20.0 10.2 3 11kV line: L450 Freetown
22.3 16.0 18.3
Brookfields 20.0 14.1 4 11kV line: L550 Freetown
22.3 16.0 18.0
Brookfields 20.0 14.1 5 11kV line: L551 Freetown
22.3 16.0 18.1
Falcon Bridge 20.0 14.8 6 11kV line: L202 Blackhall Road
26.6 20.0 20.6
33 kV 25.0 5.0 7 Blackhall Road
33/11 kV Transformer 11 kV
20.0 22.3 (*Red value shows that the calculated short circuit current is more than the permissible one of facilities) <System configuration after open circuits (Methodology ⑥)>
Table 6.4-18 Confirmation of short circuit capacity after open circuit (Refer to Fig. 6.4-18) Short circuit current [kA]
No. Facility below short circuit capacity of the system Line spec. CB Analysis
1 11kV line: 203 Open circuit 2 11kV line: L120 Open circuit 3 11kV line: L450 Open circuit 4 11kV line: L550 Open circuit 5 11kV line: L551 Open circuit
Falcon Bridge 20.0 12.3 6 11kV line: L202 Blackhall Road
26.6 20.0 19.0
33kV 25.0 4.7 7 Blackhall Road
33/11kV Transformer 11kV
20.0 21.3 (*Red value shows that the calculated short circuit current is more than the permissible one of facilities)

6-23
Table 6.4-19 Confirmation of voltage after open circuit (after adjustment) Name of station after
adjustment of Tap and add SC Bus voltage
[kV] Tap SC
33 Brookfields 11 - +20(+2)
Total losses: Active/ Reactive power 13 MW/ 41 MVar Active/ Reactive power 4.2MW/ 2.5 MVar Kingtom Power factor Lag 0.86 Active/ Reactive power 43.3MW/ 0.9 MVar Blackhall Road Power factor Lag 1.00 Active/ Reactive power 50MW/ 6.5 MVar Bumbuna Power factor Lag 0.99 Active/ Reactive power 54.6MW/ 4.4 MVar YIBEN-I Power factor Lag 1.00
Reference Drawings Fig. 6.4-19 (*Numerical values in ( ) shows additional capacity of SC calculated by ③ of item-1).
Table 6.4-20 Confirmation of power flow with modified system configuration
Facility below required thermal capacity to the distribution lines
Continuous current of
line
Rated short circuit current of
CB Power flow
Wilberforce 1,250A 33kV line: L3901 Freetown 407A 1,250A 573A(32.2MW)
Kingtom 1,250A 11kV line: L105 Congo Cross 355A 1,250A 854A(13.0MW)
Kingtom 1,250A 11kV line: L107 Brookfields 355A 1,250A 883A(14.1MW)
Kingtom 1,250A 11kV line: L106 Brookfields 355A 1,250A 796A(14.2MW)
Falcon Bridge 1,250A 11kV line: L202 Blackhall Road 430A 1,250A 972A(13.3MW)
(*Red value shows that the calculated short circuit current is more than the permissible one of facilities) <Facilities after consideration of countermeasure to short circuit capacity>
a) Lack of short circuit current of 11 kV CB for transformer feeder at Blackhall Road (Required short circuit current is more than 21.3 kA).
b) Lack of continuous rated current of 11 kV line: L3901 (require more than 573 A) c) Lack of continuous rated current of 11 kV line: L105 (require more than 854 A) d) Lack of continuous rated current of 11 kV line: L106 (require more than 796 A) e) Lack of continuous rated current of 11 kV line: L107 (require more than 883 A) f) Lack of continuous rated current of 11 kV line: L202 (require more than 972 A)
The problem can be solved taking into consideration “open circuit of some distribution lines“ and “replacement of the 11 kV transformer CB to break the actual short circuit current“ in 2015, 2020 and 2025 as is shown in Table 6.4-10, Table 6.4-14 and Table 6.4-18 respectively. Regarding requirement of SC in 2015 and 2020, the distribution system can be operated without additional SC judging from Table 6.4-11 and Table 6.4-15 which show the results of voltage confirmation after adjustment. It is necessary to add additional SC on 11 kV system at Brookfields J/S in 2025 to have adequate voltage adjustment. However, actual capacity and location shall be decided considering total system losses and operability.

6-24
Regarding overbalance of thermal capacity of the facilities, it is not faulty in year 2015 as is shown in Table 6.4-12, however, 2020 and 2025 shall have a lack of short circuit current of CB and a lack of thermal capacity on some lines as is shown in Table 6.4-16 and Table 6.4-20. It is recommendable to re-calculate after re-checking of;
a) Specification of installed generators and number of synchronized generators (to the lack of short circuit current of CB).
b) Actual line specification, especially from Freetown to Congo Cross S/S line (L450) and Freetown to Brookfields J/S (L550 and L551), concerning which size shall be larger than estimated specifications (to solve lack of continuous thermal capacity).
4) Power flow calculation at N-1 fault As analysis ⑦, this calculation is to confirm that there exists over thermal capability when circuit fault happens on dual lines and/or loop systems on condition that there is no feeder of lack of thermal capacity when short circuit fault happens. Load shedding shall be applied if voltage drop of bus bar comes to more than 10%. After load shedding, bus voltage is confirmed within adjustable range. Then re-confirmation of overloaded facilities shall be conducted.
【2015】 Table 6.4-21 Assumption of fault in 2015
No. Facility Faulty lines (Line No.) Result and Remarks 1 Kingtom~Falcon Bridge (L3101) No thermal capacity problem 2 Kingtom~Freetown (L3903) No thermal capacity problem 3 Falcon Bridge~Blackhall Road (L3201) No thermal capacity problem 4 Blackhall Road~Wilberforce (L3301) No thermal capacity problem 5 Blackhall Road~Wellington (L3302) No thermal capacity problem 6 Blackhall Road~Freetown (L3902) No thermal capacity problem 7 Wilberforce~Regent (L3601) No thermal capacity problem 8 Wilberforce~Freetown (L3901) Faulty (See Table 6.4-22) 9 Wilberforce~Goderich (L3602) Radial system 10 Wellington~Jui (L3701) No thermal capacity problem 11 Regent~Jui (L3804・L3604) No thermal capacity problem 12 Goderich~Tombo (L31001) York~Tombo: not connected 13 Jui~Lumpa (L31101) Radial system 14
33 kV line
Lumpa~Tombo (L31201) Radial system 15 Kingtom(A-Bus)~Falcon Bridge (L103) No thermal capacity problem 16 Kingtom(A-Bus)~Falcon Bridge (L104) No thermal capacity problem 17 Kingtom(B-Bus)~Falcon Bridge (L103A) No thermal capacity problem 18 Kingtom(B-Bus)~Falcon Bridge (L102) No thermal capacity problem 19 Kingtom(A-Bus)~Congo Cross (L120) Open circuit 20 Kingtom(B-Bus)~Congo Cross (L105) Faulty (See Table 6.4-23) 21 Kingtom(A-Bus)~Brookfields (L107) Faulty (See Table 6.4-24) 22 Kingtom(B-Bus)~Brookfields (L106) Faulty (See Table 6.4-25) 23 Kingtom(A-Bus)~Freetown (L150) No thermal capacity problem 24 Kingtom(B-Bus)~Freetown (L151) No thermal capacity problem 25 Falcon Bridge~Blackhall Road (L203) Open circuit 26 Falcon Bridge~Blackhall Road (L202) No thermal capacity problem 27 Congo Cross~Wilberforce (L440) No thermal capacity problem 28 Congo Cross~Freetown(A-Bus) (L450) No thermal capacity problem 29 Brookfields~Wilberforce (L523) No thermal capacity problem 30 Brookfields~Wilberforce (L522) No thermal capacity problem 31 Brookfields~Freetown(A-Bus) (L550) Faulty (See Table 6.4-26) 32
11 kV line
Brookfields~Freetown(B-Bus) (L551) Faulty (See Table 6.4-27) [Source] JICA Study Team

6-25
<Fault No. 8(L3901)> Table 6.4-22 Neck point on fault No. 8
Facility below required thermal capacity to the distribution lines
Continuous current of line
Rated short circuit current of CB Power flow
Kingtom 1,250A 11 kV line: L106 Brookfields 355A 1,250A 356 A (6.8 MW)
(*Red value shows that the calculated short circuit current is more than the permissible one of facilities)
<Fault No. 20(L105)> Table 6.4-23 Neck point on fault No. 20
Facility below required thermal capacity to the distribution lines
Continuous current of line
Rated short circuit current of CB Power flow
Kingtom 1,250A 11 kV line: L106 Brookfields 355A 1,250A 364 A (6.9MW)
(*Red value shows that the calculated short circuit current is more than the permissible one of facilities)
<Fault No. 21(L107)> Table 6.4-24 Neck point on fault No. 21
Facility below required thermal capacity to the distribution lines
Continuous current of line
Rated short circuit current of CB Power flow
Kingtom 1,250A 11 kV line: L106 Brookfields 355A 1,250A 425A (8.1 MW)
(*Red value shows that the calculated short circuit current is more than the permissible one of facilities)
<Fault No. 22(L106)> Table 6.4-25 Neck point on fault No. 22
Facility below required thermal capacity to the distribution lines
Continuous current of line
Rated short circuit current of CB Power flow
Kingtom 1,250A 11 kV line: L107 Brookfields 355A 1,250A 417A (7.9 MW)
(*Red value shows that the calculated short circuit current is more than the permissible one of facilities)
<Fault No. 31(L550)> Table 6.4-26 Neck point on fault No. 31
Facility below required thermal capacity to the distribution lines
Continuous current of line
Rated short circuit current of CB Power flow
Kingtom 1,250A 11kV line: L106 Brookfields 355A 1,250A 364A (6.9MW)
(*Red value shows that the calculated short circuit current is more than the permissible one of facilities)
<Fault No. 32(L551)> Table 6.4-27 Neck point on fault No. 32
Facility below required thermal capacity to the distribution lines
Continuous current of line
Rated short circuit current of CB Power flow
Kingtom 1,250A 11kV line: L107 Brookfields 355A 1,250A 367A (6.8MW)
(*Red value shows that the calculated short circuit current is more than the permissible one of facilities) <Normal: Countermeasure to have reliability and capability to short circuit at N-1 fault>
a) Lack of continuous rated current of 11 kV line: L106 (require more than 425 A) b) Lack of continuous rated current of 11 kV line: L107 (require more than 417 A)

6-26
【2020】 Table 6.4-28 Assumption of fault at year 2020
No. Facility Faulty lines (Line No.) Result and Remarks 1 Kingtom~Falcon Bridge (L3101) Faulty (See Table 6.4-29) 2 Kingtom~Freetown (L3903) Faulty (See Table 6.4-30) 3 Falcon Bridge~Blackhall Road (L3201) Faulty (See Table 6.4-31) 4 Blackhall Road~Wilberforce (L3301) Faulty (See Table 6.4-32) 5 Blackhall Road~Wellington (L3302) Faulty (See Table 6.4-33) 6 Blackhall Road~Freetown (L3902) No thermal capacity problem 7 Wilberforce~Regent (L3601) Faulty (See Table 6.4-34) 8 Wilberforce~Freetown (L3901) Faulty (See Table 6.4-35) 9 Wilberforce~Goderich (L3602) Radial system 10 Wellington~Jui (L3701) No thermal capacity problem 11 Regent~Jui (L3804・L3604) Faulty (See Table 6.4-36) 12 Goderich~Tombo (L31001) York~Tombo Not installed 13 Jui~Lumpa (L31101) Radial system 14
33 kV line
Lumpa~Tombo (L31201) Radial system 15 Kingtom(A-Bus)~Falcon Bridge (L103) Faulty (See Table 6.4-37) 16 Kingtom(A-Bus)~Falcon Bridge (L104) Faulty (See Table 6.4-38) 17 Kingtom(B-Bus)~Falcon Bridge (L103A) Faulty (See Table 6.4-39) 18 Kingtom(B-Bus)~Falcon Bridge (L102) Faulty (See Table 6.4-40) 19 Kingtom(A-Bus)~Congo Cross (L120) Open circuit 20 Kingtom(B-Bus)~Congo Cross (L105) Faulty (See Table 6.4-41) 21 Kingtom(A-Bus)~Brookfields (L107) Faulty (See Table 6.4-42) 22 Kingtom(B-Bus)~Brookfields (L106) Faulty (See Table 6.4-43) 23 Kingtom(A-Bus)~Freetown (L150) Faulty (See Table 6.4-44) 24 Kingtom(B-Bus)~Freetown (L151) Faulty (See Table 6.4-45) 25 Falcon Bridge~Blackhall Road (L203) Open circuit 26 Falcon Bridge~Blackhall Road (L202) No thermal capacity problem 27 Congo Cross~Wilberforce (L440) Faulty (See Table 6.4-46) 28 Congo Cross~Freetown(A-Bus) (L450) Open circuit 29 Brookfields~Wilberforce (L523) Faulty (See Table 6.4-47) 30 Brookfields~Wilberforce (L522) Faulty (See Table 6.4-48) 31 Brookfields~Freetown(A-Bus) (L550) Open circuit 32
11 kV line
Brookfields~Freetown(B-Bus) (L551) Open circuit [Source] JICA Study Team
<Fault No. 1(L3101)> Table 6.4-29 Neck point on fault No. 1
Facility below required thermal capacity to the distribution lines
Continuous current of line
Rated short circuit current of CB Power flow
Wilberforce 1,250A 33kV line: L3901 Freetown 407A 1,250A 493A (28.2MW)
Kingtom 1,250A 11kV line: L105 Congo Cross 355A 1,250A 546A (9.3MW)
Kingtom 1,250A 11kV line: L106 Brookfields 355A 1,250A 577A (10.9MW)
(*Red value shows that the calculated short circuit current is more than the permissible one of facilities)
<Fault No. 2(L3903)> Table 6.4-30 Neck point on fault No. 2
Facility below required thermal capacity to the distribution lines
Continuous current of line
Rated short circuit current of CB Power flow
Wilberforce 1,250A 33kV line: L3901 Freetown 407A 1,250A 513A (29.2MW)
Kingtom 1,250A 11kV line: L107 Brookfields 355A 1,250A 573A (10.6MW)
(*Red value shows that the calculated short circuit current is more than the permissible one of facilities)

6-27
<Fault No. 3(L3201)> Table 6.4-31 Neck point on fault No. 3
Facility below required thermal capacity to the distribution lines
Continuous current of line
Rated short circuit current of CB Power flow
Wilberforce 1,250A 33kV line: L3901 Freetown 407A 1,250A 481A (27.5MW)
Kingtom 1,250A 11kV line: L105 Congo Cross 355A 1,250A 547A (9.4MW)
Kingtom 1,250A 11kV line: L107 Brookfields 355A 1,250A 556A (10.3MW)
Kingtom 1,250A 11kV line: L106 Brookfields 355A 1,250A 572A (10.8MW)
(*Red value shows that the calculated short circuit current is more than the permissible one of facilities)
<Fault No. 4(L3301)> Table 6.4-32 Neck point on fault No. 4
Facility below required thermal capacity to the distribution lines
Continuous current of line
Rated short circuit current of CB Power flow
Kingtom 1,250A 11kV line: L107 Brookfields 355A 1,250A 553A (10.2MW)
Kingtom 1,250A 11kV line: L106 Brookfields 355A 1,250A 563A (10.7MW)
(*Red value shows that the calculated short circuit current is more than the permissible one of facilities)
<Fault No. 5(L3302)> 33 kV bus voltage will go down to more than 10% at Wellington S/S when line No. L3302 fault makes the open loop of 33 kV network. In order to prevent this voltage drop, 33 kV line No. L3701 shall be immediately opened when L3302 has fault and also load shedding shall be applied. This solution makes the system voltage within permissible range. However, the following thermal capacity problems shall be considered.
Table 6.4-33 Neck point on fault No. 5 Facility below required thermal capacity to the distribution lines
Continuous current of line
Rated short circuit current of CB Power flow
Wilberforce 1,250A 33 kV line: L3901 Freetown 407A 1,250A 422A
(24.2MW) Kingtom 1,250A 11 kV line: L105 Congo Cross 355A 1,250A 543A (9.3MW)
Kingtom 1,250A 11 kV line: L106 Brookfields 355A 1,250A 560A
(10.6MW) (*Red value shows that the calculated short circuit current is more than the permissible one of facilities)
<Fault No. 7(L3601)> Table 6.4-34 Neck point on fault No. 7
Facility below required thermal capacity to the distribution lines
Continuous current of line
Rated short circuit current of CB Power flow
Blackhall Road 1,250A 33 kV line: L3302 Wellington 407A 1,250A 409A (23.2MW)
(*Red value shows that the calculated short circuit current is more than the permissible one of facilities)

6-28
<Fault No. 8(L3901)> Table 6.4-35 Neck point on fault No. 8
Facility below required thermal capacity to the distribution lines
Continuous current of line
Rated short circuit current of CB Power flow
Blackhall Road 1,250A 33 kV line: L3302 Wellington 407A 1,250A 409A (23.2MW)
Kingtom 1,250A 11 kV line: L105 Congo Cross 355A 1,250A 573A (10.2MW)
Kingtom 1,250A 11 kV line: L107 Brookfields 355A 1,250A 633A (11.8MW)
Kingtom 1,250A 11 kV line: L106 Brookfields 355A 1,250A 652A (12.4MW)
(*Red value shows that the calculated short circuit current is more than the permissible one of facilities)
<Fault No. 10(L3701)> Table 6.4-36 Neck point on fault No. 10
Facility below required thermal capacity to the distribution lines
Continuous current of line
Rated short circuit current of CB Power flow
Wilberforce 1,250A 33kV line: L3901 Freetown 407A 1,250A 425A (24.3MW)
Kingtom 1,250A 11kV line: L105 Congo Cross 355A 1,250A 543A (9.3MW)
Kingtom 1,250A 11kV line: L107 Brookfields 355A 1,250A 553A (10.2MW)
Kingtom 1,250A 11kV line: L106 Brookfields 355A 1,250A 568A (10.8MW)
(*Red value shows that the calculated short circuit current is more than the permissible one of facilities)
<Fault No. 15(L103)> Table 6.4-37 Neck point on fault No. 15
Facility below required thermal capacity to the distribution lines
Continuous current of line
Rated short circuit current of CB Power flow
Kingtom 1,250A 11 kV line: L107 Brookfields 355A 1,250A 569A (10.4MW)
(*Red value shows that the calculated short circuit current is more than the permissible one of facilities)
<Fault No. 16(L104)> Table 6.4-38 Neck point on fault No. 16
Facility below required thermal capacity to the distribution lines
Continuous current of line
Rated short circuit current of CB Power flow
Kingtom 1,250A 11kV line: L107 Brookfields 355A 1,250A 571A (10.5MW)
(*Red value shows that the calculated short circuit current is more than the permissible one of facilities)
<Fault No. 17(L103A)> Table 6.4-39 Neck point on fault No. 17
Facility below required thermal capacity to the distribution lines
Continuous current of line
Rated short circuit current of CB Power flow
Kingtom 1,250A 11kV line: L105 Congo Cross 355A 1,250A 545A (9.3MW)
Kingtom 1,250A 11kV line: L106 Brookfields 355A 1,250A 573A (10.8MW)
(*Red value shows that the calculated short circuit current is more than the permissible one of facilities)

6-29
<Fault No. 18(L102)> Table 6.4-40 Neck point on fault No. 18
Facility below required thermal capacity to the distribution lines
Continuous current of line
Rated short circuit current of CB Power flow
Kingtom 1,250A 11 kV line: L105 Congo Cross 355A 1,250A 546A (9.3MW)
Kingtom 1,250A 11 kV line: L106 Brookfields 355A 1,250A 580A (11.0MW)
(*Red value shows that the calculated short circuit current is more than the permissible one of facilities)
<Fault No. 20(L105)> Table 6.4-41 Neck point on fault No. 20
Facility below required thermal capacity to the distribution lines
Continuous current of line
Rated short circuit current of CB Power flow
Kingtom 1,250A 11 kV line: L107 Brookfields 355A 1,250A 700A (12.8MW)
Kingtom 1,250A 11 kV line: L106 Brookfields 355A 1,250A 845A (15.8MW)
Congo Cross 1,250A 11 kV line: L440 Wilberforce 351A 1,250A 490A (8.4MW)
(*Red value shows that the calculated short circuit current is more than the permissible one of facilities)
<Fault No. 21(L107)> Table 6.4-42 Neck point on fault No. 21
Facility below required thermal capacity to the distribution lines
Continuous current of line
Rated short circuit current of CB Power flow
Kingtom 1,250A 11 kV line: L105 Congo Cross 355A 1,250A 604A (10.5MW)
Kingtom 1,250A 11 kV line: L106 Brookfields 355A 1,250A 950A (17.7MW)
(*Red value shows that the calculated short circuit current is more than the permissible one of facilities)
<Fault No. 22(L106)> Table 6.4-43 Neck point on fault No. 22
Facility below required thermal capacity to the distribution lines
Continuous current of line
Rated short circuit current of CB Power flow
Kingtom 1,250A 11 kV line: L105 Congo Cross 355A 1,250A 662A (11.7MW)
Kingtom 1,250A 11 kV line: L107 Brookfields 355A 1,250A 911A (17.0MW)
(*Red value shows that the calculated short circuit current is more than the permissible one of facilities)
<Fault No. 23(L150)> Table 6.4-44 Neck point on fault No. 23
Facility below required thermal capacity to the distribution lines
Continuous current of line
Rated short circuit current of CB Power flow
Kingtom 1,250A 11 kV line: L105 Congo Cross 355A 1,250A 561A (9.7MW)
Kingtom 1,250A 11 kV line: L106 Brookfields 355A 1,250A 740A (14.0MW)
(*Red value shows that the calculated short circuit current is more than the permissible one of facilities)

6-30
<Fault No. 24(L151)> Table 6.4-45 Neck point on fault No. 24
Facility below required thermal capacity to the distribution lines
Continuous current of line
Rated short circuit current of CB Power flow
Kingtom 1,250A 11kV line: L107 Brookfields 355A 1,250A 698A (12.5MW)
(*Red value shows that the calculated short circuit current is more than the permissible one of facilities)
<Fault No. 27(L440)> Table 6.4-46 Neck point on fault No. 27
Facility below required thermal capacity to the distribution lines
Continuous current of line
Rated short circuit current of CB Power flow
Kingtom 1,250A 11 kV line: L107 Brookfields 355A 1,250A 563A (10.5MW)
Kingtom 1,250A 11 kV line: L106 Brookfields 355A 1,250A 594A (11.3MW)
(*Red value shows that the calculated short circuit current is more than the permissible one of facilities)
<Fault No. 29(L523)> Table 6.4-47 Neck point on fault No. 29
Facility below required thermal capacity to the distribution lines
Continuous current of line
Rated short circuit current of CB Power flow
Kingtom 1,250A 11 kV line: L105 Congo Cross 355A 1,250A 576A (9.9MW)
(*Red value shows that the calculated short circuit current is more than the permissible one of facilities)
<Fault No. 30(L522)> Table 6.4-48 Neck point on fault No. 30
Facility below required thermal capacity to the distribution lines
Continuous current of line
Rated short circuit current of CB Power flow
Kingtom 1,250A 11 kV line: L105 Congo Cross 355A 1,250A 576A (9.9MW)
(*Red value shows that the calculated short circuit current is more than the permissible one of facilities) <Neck facilities on normal operation and at N-1 fault after taking into consideration countermeasures to short circuit problems>
a) Lack of short circuit current of 11 kV CB for transformer feeder at Blackhall Road (Required short circuit current is more than 21.3 kA).
b) Lack of continuous rated current of 11 kV line: L3302 (require more than 409 A) c) Lack of continuous rated current of 11 kV line: L3901 (require more than 513 A) d) Lack of continuous rated current of 11 kV line: L105 (require more than 662 A) e) Lack of continuous rated current of 11 kV line: L106 (require more than 950 A) f) Lack of continuous rated current of 11 kV line: L107 (require more than 911 A) g) Lack of continuous rated current of 11 kV line: L440 (require more than 490 A)
6-31
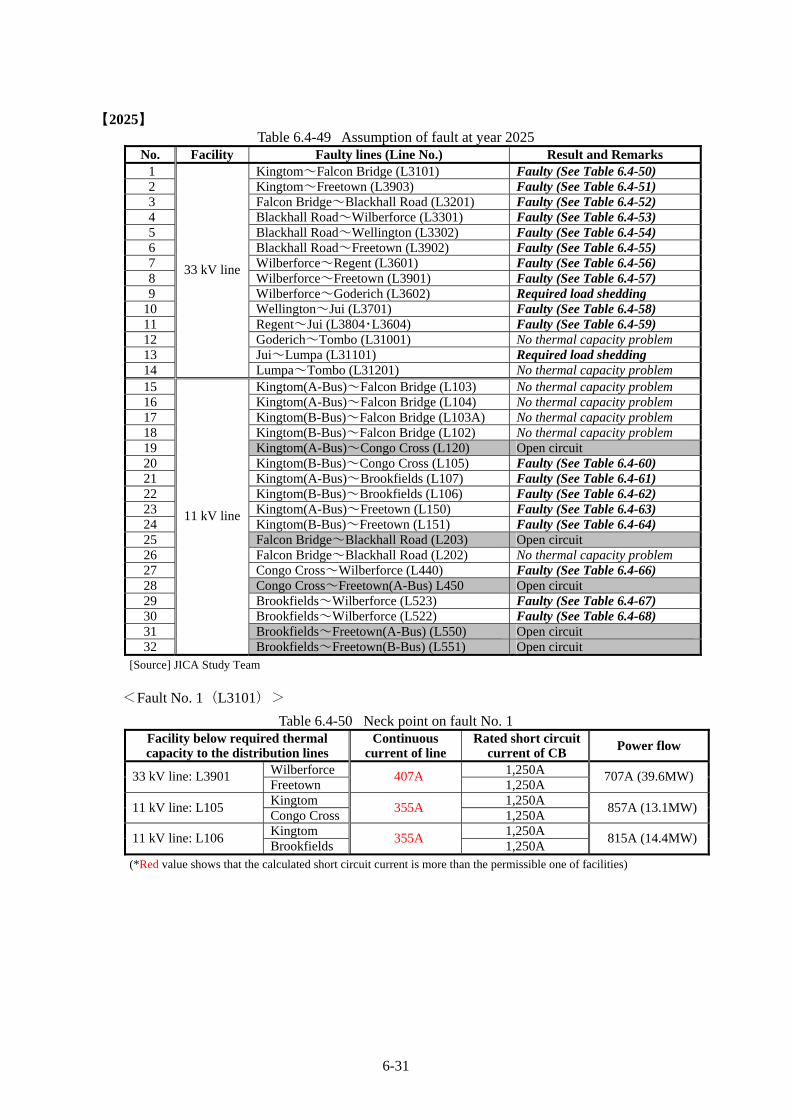
【2025】 Table 6.4-49 Assumption of fault at year 2025
No. Facility Faulty lines (Line No.) Result and Remarks 1 Kingtom~Falcon Bridge (L3101) Faulty (See Table 6.4-50) 2 Kingtom~Freetown (L3903) Faulty (See Table 6.4-51) 3 Falcon Bridge~Blackhall Road (L3201) Faulty (See Table 6.4-52) 4 Blackhall Road~Wilberforce (L3301) Faulty (See Table 6.4-53) 5 Blackhall Road~Wellington (L3302) Faulty (See Table 6.4-54) 6 Blackhall Road~Freetown (L3902) Faulty (See Table 6.4-55) 7 Wilberforce~Regent (L3601) Faulty (See Table 6.4-56) 8 Wilberforce~Freetown (L3901) Faulty (See Table 6.4-57) 9 Wilberforce~Goderich (L3602) Required load shedding 10 Wellington~Jui (L3701) Faulty (See Table 6.4-58) 11 Regent~Jui (L3804・L3604) Faulty (See Table 6.4-59) 12 Goderich~Tombo (L31001) No thermal capacity problem 13 Jui~Lumpa (L31101) Required load shedding 14
33 kV line
Lumpa~Tombo (L31201) No thermal capacity problem 15 Kingtom(A-Bus)~Falcon Bridge (L103) No thermal capacity problem 16 Kingtom(A-Bus)~Falcon Bridge (L104) No thermal capacity problem 17 Kingtom(B-Bus)~Falcon Bridge (L103A) No thermal capacity problem 18 Kingtom(B-Bus)~Falcon Bridge (L102) No thermal capacity problem 19 Kingtom(A-Bus)~Congo Cross (L120) Open circuit 20 Kingtom(B-Bus)~Congo Cross (L105) Faulty (See Table 6.4-60) 21 Kingtom(A-Bus)~Brookfields (L107) Faulty (See Table 6.4-61) 22 Kingtom(B-Bus)~Brookfields (L106) Faulty (See Table 6.4-62) 23 Kingtom(A-Bus)~Freetown (L150) Faulty (See Table 6.4-63) 24 Kingtom(B-Bus)~Freetown (L151) Faulty (See Table 6.4-64) 25 Falcon Bridge~Blackhall Road (L203) Open circuit 26 Falcon Bridge~Blackhall Road (L202) No thermal capacity problem 27 Congo Cross~Wilberforce (L440) Faulty (See Table 6.4-66) 28 Congo Cross~Freetown(A-Bus) L450 Open circuit 29 Brookfields~Wilberforce (L523) Faulty (See Table 6.4-67) 30 Brookfields~Wilberforce (L522) Faulty (See Table 6.4-68) 31 Brookfields~Freetown(A-Bus) (L550) Open circuit 32
11 kV line
Brookfields~Freetown(B-Bus) (L551) Open circuit [Source] JICA Study Team
<Fault No. 1(L3101)> Table 6.4-50 Neck point on fault No. 1
Facility below required thermal capacity to the distribution lines
Continuous current of line
Rated short circuit current of CB Power flow
Wilberforce 1,250A 33 kV line: L3901 Freetown 407A 1,250A 707A (39.6MW)
Kingtom 1,250A 11 kV line: L105 Congo Cross 355A 1,250A 857A (13.1MW)
Kingtom 1,250A 11 kV line: L106 Brookfields 355A 1,250A 815A (14.4MW)
(*Red value shows that the calculated short circuit current is more than the permissible one of facilities)

6-32
<Fault No. 2(L3903)> Table 6.4-51 Neck point on fault No. 2
Facility below required thermal capacity to the distribution lines
Continuous current of line
Rated short circuit current of CB Power flow
Wilberforce 1,250A 33 kV line: L3901 Freetown 407A 1,250A 738A (41.4MW)
Kingtom 1,250A 11 kV line: L107 Brookfields 355A 1,250A 906A (14.6MW)
Kingtom 1,250A 11 kV line: L151 Freetown 1,210A 1,250A 1,354A (25.2MW)
(*Red value shows that the calculated short circuit current is more than the permissible one of facilities)
<Fault No. 3(L3201)> Table 6.4-52 Neck point on fault No. 3
Facility below required thermal capacity to the distribution lines
Continuous current of line
Rated short circuit current of CB Power flow
Wilberforce 1,250A 33 kV line: L3901 Freetown 407A 1,250A 707A (39.9MW)
Kingtom 1,250A 11 kV line: L105 Congo Cross 355A 1,250A 858A (13.1MW)
Kingtom 1,250A 11 kV line: L107 Brookfields 355A 1,250A 885A (14.3MW)
Kingtom 1,250A 11 kV line: L106 Brookfields 355A 1,250A 811A (14.4MW)
(*Red value shows that the calculated short circuit current is more than the permissible one of facilities)
<Fault No. 4(L3301)> Table 6.4-53 Neck point on fault No. 4
Facility below required thermal capacity to the distribution lines
Continuous current of line
Rated short circuit current of CB Power flow
Wilberforce 1,250A 33 kV line: L3901 Freetown 407A 1,250A 664A (37.5MW)
Kingtom 1,250A 11 kV line: L105 Congo Cross 355A 1,250A 855A (13.1MW)
Kingtom 1,250A 11 kV line: L107 Brookfields 355A 1,250A 889A (14.2MW)
Kingtom 1,250A 11 kV line: L106 Brookfields 355A 1,250A 805A (14.3MW)
Falcon Bridge 1,250A 11 kV line: L202 Blackhall Road 430A 1,250A 985A (13.5MW)
(*Red value shows that the calculated short circuit current is more than the permissible one of facilities)
<Fault No. 5(L3302)> 33 kV loop system will be open system because of fault on 33 kV line No. L3302 and end voltage at Wellington S/S will drop to more than 20 %. In order to prevent this voltage drop, when L3302 was faulty, then L3701 shall be immediately opened and Wellington line disconnected from the network (apply load shedding). Try to get voltage stability to take above solution. Voltage drop can be kept within 10% to take above action. However, the following thermal capacity problems shall be solved.

6-33
Table 6.4-54 Neck point on fault No. 5 Facility below required thermal capacity to the distribution lines
Continuous current of line
Rated short circuit current of CB Power flow
Wilberforce 1,250A 33 kV line: L3601 Regent 388A 630A 403A (22.8MW)
Wilberforce 1,250A 33 kV line: L3901 Freetown 407A 1,250A 683A (38.9MW)
(*Red value shows that the calculated short circuit current is more than the permissible one of facilities)
<Fault No. 6(L3902)> Table 6.4-55 Neck point on fault No. 6
Facility below required thermal capacity to the distribution lines
Continuous current of line
Rated short circuit current of CB Power flow
Wilberforce 1,250A 33 kV line: L3901 Freetown 407A 1,250A 579A (32.5MW)
(*Red value shows that the calculated short circuit current is more than the permissible one of facilities)
<Fault No. 7(L3601)> Table 6.4-56 Neck point on fault No. 7
Facility below required thermal capacity to the distribution lines
Continuous current of line
Rated short circuit current of CB Power flow
Blackhall Road 1,250A 33 kV line: L3302 Wellington 407A 1,250A 569A (32.5MW)
Falcon Bridge 1,250A 11 kV line: L202 Blackhall Road 430A 1,250A 988A (13.9MW)
(*Red value shows that the calculated short circuit current is more than the permissible one of facilities)
<Fault No. 8(L3901)> Table 6.4-57 Neck point on fault No. 8
Facility below required thermal capacity to the distribution lines
Continuous current of line
Rated short circuit current of CB Power flow
Blackhall Road 1,250A 33 kV line: L3301 Wilberforce 407A 1,250A 462A (26.2MW)
Blackhall Road 1,250A 33 kV line: L3302 Wellington 407A 1,250A 459A (26.2MW)Kingtom 1,250A 11 kV line: L105 Congo Cross 355A 1,250A 892A (14.5MW)Kingtom 1,250A 11 kV line: L107 Brookfields 355A 1,250A 1,000A (16.8MW)Kingtom 1,250A 11 kV line: L106 Brookfields 355A 1,250A 929A (17.2MW)Kingtom 1,250A 11 kV line: L151 Freetown 1,210A 1,250A 1,281A (23.2MW)Falcon Bridge 1,250A 11 kV line: L202 Blackhall Road 430A 1,250A 1,003A (14.0MW)
(*Red value shows that the calculated short circuit current is more than the permissible one of facilities)
<Fault No. 9(L3602)> 33 kV loop system will be opened because of the fault of 33 kV line No. L3602 and end voltage at Goderich S/S will be down more than 30 % which may cause the voltage collapse. In order to prevent this fault, 33 kV line No. L31001 shall be immediately opened and Goderich line shall be disconnected from the loop when L3602 has a fault. To take this solution, voltage drop can be kept within 10 % and there are not any thermal capacity problems.

6-34
<Fault No. 10(L3701)> Table 6.4-58 Neck point on fault No. 10
Facility below required thermal capacity to the distribution lines
Continuous current of line
Rated short circuit current of CB Power flow
Wilberforce 1,250A 33 kV line: L3601 Regent 388A 630A 402A (22.8MW)
Wilberforce 1,250A 33 kV line: L3901 Freetown 407A 1,250A 687A (39.1MW) Kingtom 1,250A 11 kV line: L107 Brookfields 355A 1,250A 893A (14.2MW) Kingtom 1,250A 11 kV line: L106 Brookfields 355A 1,250A 804A (14.5MW) Falcon Bridge 1,250A 11 kV line: L202 Blackhall Road 430A 1,250A 1,019A (14.1MW)
(*Red value shows that the calculated short circuit current is more than the permissible one of facilities)
<Fault No. 11(L3804・L3604)> Table 6.4-59 Neck point on fault No. 11
Facility below required thermal capacity to the distribution lines
Continuous current of line
Rated short circuit current of CB Power flow
Blackhall Road 1,250A 33 kV line: L3302 Wellington 407A 1,250A 501A (28.6MW)
(*Red value shows that the calculated short circuit current is more than the permissible one of facilities)
<Fault No. 13(L31101)> 33 kV loop system will be opened because of the fault on 33 kV line No. L31101 and end voltage at Lumpa S/S will be down more than 30% which may cause the voltage collapse. In order to prevent this fault, 33 kV line No. L31201 shall be immediately disconnected from the loop when L31101 has a fault. Voltage drop can be kept within 10% to take above action and there are no thermal capacity problems.
<Fault No. 20(L105)> Table 6.4-60 Neck point on fault No. 20
Facility below required thermal capacity to the distribution lines
Continuous current of line
Rated short circuit current of CB Power flow
Wilberforce 1,250A 33 kV line: L3901 Freetown 407A 1,250A 618A (35.0MW)
Kingtom 1,250A 11 kV line: L107 Brookfields 355A 1,250A 1,115A (18.1MW)
Kingtom 1,250A 11 kV line: L106 Brookfields 355A 1,250A 1,245A (21.7MW)
Falcon Bridge 1,250A 11 kV line: L202 Blackhall Road 430A 1,250A 1,060A (14.8MW)
Congo Cross 1,250A 11 kV line: L440 Wilberforce 351A 1,250A 771A (12.4MW)
Brookfields 1,250A 11 kV line: L523 Wilberforce 455A 1,250A 632A (9.4MW)
Brookfields 1,250A 11 kV line: L522 Wilberforce 455A 1,250A 631A (9.4MW)
33kV 630A 177A (10.0 MW) Wilberforce 33/11 kVTransformer 11kV 10MVA 630A 532A (10.1 MVA) (*Red value shows that the calculated short circuit current is more than the permissible one of facilities)
6-35
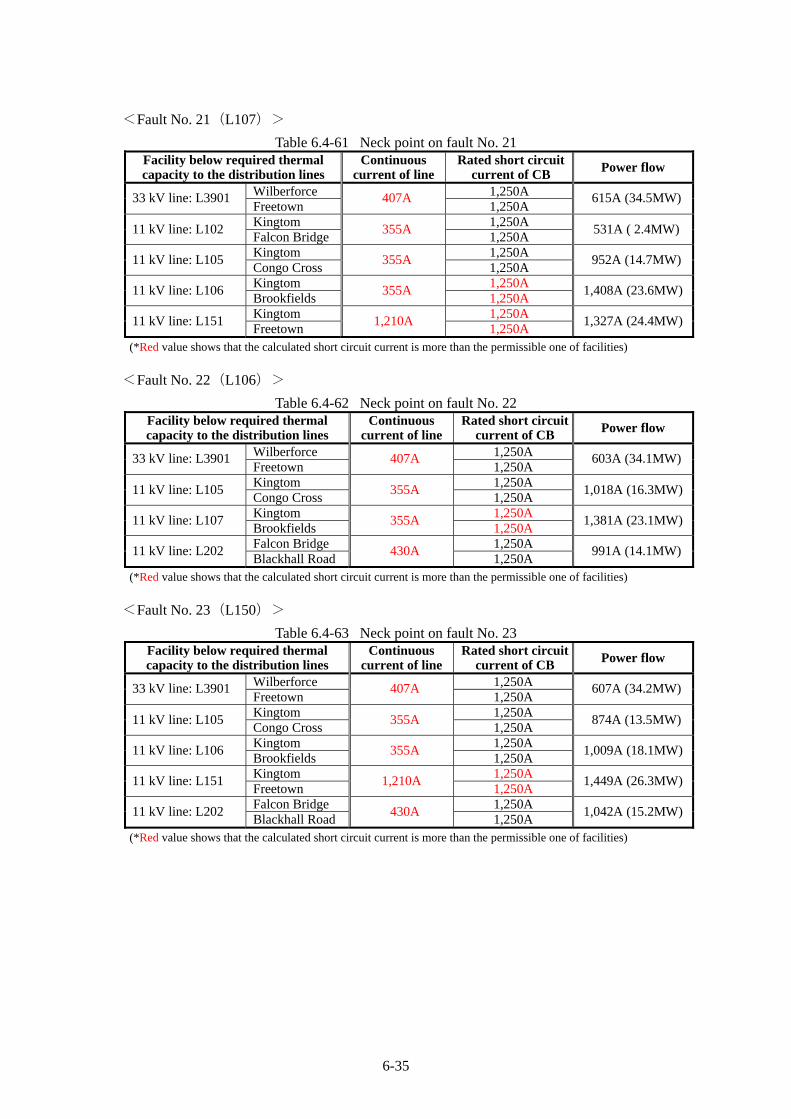
<Fault No. 21(L107)> Table 6.4-61 Neck point on fault No. 21
Facility below required thermal capacity to the distribution lines
Continuous current of line
Rated short circuit current of CB Power flow
Wilberforce 1,250A 33 kV line: L3901 Freetown 407A 1,250A 615A (34.5MW)
Kingtom 1,250A 11 kV line: L102 Falcon Bridge 355A 1,250A 531A ( 2.4MW)
Kingtom 1,250A 11 kV line: L105 Congo Cross 355A 1,250A 952A (14.7MW)
Kingtom 1,250A 11 kV line: L106 Brookfields 355A 1,250A 1,408A (23.6MW)
Kingtom 1,250A 11 kV line: L151 Freetown 1,210A 1,250A 1,327A (24.4MW)
(*Red value shows that the calculated short circuit current is more than the permissible one of facilities)
<Fault No. 22(L106)> Table 6.4-62 Neck point on fault No. 22
Facility below required thermal capacity to the distribution lines
Continuous current of line
Rated short circuit current of CB Power flow
Wilberforce 1,250A 33 kV line: L3901 Freetown 407A 1,250A 603A (34.1MW)
Kingtom 1,250A 11 kV line: L105 Congo Cross 355A 1,250A 1,018A (16.3MW)
Kingtom 1,250A 11 kV line: L107 Brookfields 355A 1,250A 1,381A (23.1MW)
Falcon Bridge 1,250A 11 kV line: L202 Blackhall Road 430A 1,250A 991A (14.1MW)
(*Red value shows that the calculated short circuit current is more than the permissible one of facilities)
<Fault No. 23(L150)> Table 6.4-63 Neck point on fault No. 23
Facility below required thermal capacity to the distribution lines
Continuous current of line
Rated short circuit current of CB Power flow
Wilberforce 1,250A 33 kV line: L3901 Freetown 407A 1,250A 607A (34.2MW)
Kingtom 1,250A 11 kV line: L105 Congo Cross 355A 1,250A 874A (13.5MW)
Kingtom 1,250A 11 kV line: L106 Brookfields 355A 1,250A 1,009A (18.1MW)
Kingtom 1,250A 11 kV line: L151 Freetown 1,210A 1,250A 1,449A (26.3MW)
Falcon Bridge 1,250A 11 kV line: L202 Blackhall Road 430A 1,250A 1,042A (15.2MW)
(*Red value shows that the calculated short circuit current is more than the permissible one of facilities)

6-36
<Fault No. 24(L151)> Table 6.4-64 Neck point on fault No. 24
Facility below required thermal capacity to the distribution lines
Continuous current of line
Rated short circuit current of CB Power flow
Wilberforce 1,250A 33 kV line: L3901 Freetown 407A 1,250A 612A (34.4MW)
Kingtom 1,250A 11 kV line: L102 Falcon Bridge 355A 1,250A 486A (3.7MW)
Kingtom 1,250A 11 kV line: L107 Brookfields 355A 1,250A 1,087A (17.2MW)
Kingtom 1,250A 11 kV line: L150 Freetown 1,210A 1,250A 1,300A (23.6MW)
Falcon Bridge 1,250A 11 kV line: L202 Blackhall Road 430A 1,250A 1,125A (14.5MW)
(*Red value shows that the calculated short circuit current is more than the permissible one of facilities)
<Fault No. 27(L440)> Table 6.4-65 Neck point on fault No. 27
Facility below required thermal capacity to the distribution lines
Continuous current of line
Rated short circuit current of CB Power flow
Kingtom 1,250A 11 kV line: L107 Brookfields 355A 1,250A 894A (14.4MW)
Kingtom 1,250A 11 kV line: L106 Brookfields 355A 1,250A 829A (14.8MW)
(*Red value shows that the calculated short circuit current is more than the permissible one of facilities)
<Fault No.29(L523)> Table 6.4-66 Neck point on fault No. 29
Facility below required thermal capacity to the distribution lines
Continuous current of line
Rated short circuit current of CB Power flow
Wilberforce 1,250A 33 kV line: L3901 Freetown 407A 1,250A 588A (33.1MW)
Kingtom 1,250A 11 kV line: L105 Congo Cross 355A 1,250A 906A (13.7MW)
Brookfields 1,250A 11 kV line: L522 Wilberforce 455A 1,250A 502A (6.6MW)
(*Red value shows that the calculated short circuit current is more than the permissible one of facilities)
<Fault No. 30(L522)> Table 6.4-67 Neck point on fault No. 30
Facility below required thermal capacity to the distribution lines
Continuous current of line
Rated short circuit current of CB Power flow
Wilberforce 1,250A 33 kV line: L3901 Freetown 407A 1,250A 588A (33.1MW)
Kingtom 1,250A 11 kV line: L105 Congo Cross 355A 1,250A 906A (13.7MW)
Brookfields 1,250A 11 kV line: L523 Wilberforce 455A 1,250A 502A (6.6MW)
(*Red value shows that the calculated short circuit current is more than the permissible one of facilities)
<Neck facilities on normal operation and at N-1 fault after taking into consideration countermeasures to short circuit problems>
a) Lack of short circuit current of 11 kV CB for transformer feeder at Blackhall Road (Required short circuit current is more than 21.3 kA).

6-37
b) Lack of continuous rated current of 11 kV line: L3301 (require more than 462 A) c) Lack of continuous rated current of 11 kV line: L3302 (require more than 569 A) d) Lack of continuous rated current of 11 kV line: L3601 (require more than 403 A) e) Lack of continuous rated current of 11 kV line: L3901 (require more than 738 A) f) Lack of continuous rated current of 11 kV line: L102 (require more than 531 A) g) Lack of continuous rated current of 11 kV line: L105 (require more than 1,018 A) h) Lack of continuous rated current of 11 kV line: L107 (require more than 1,381 A) i) Lack of continuous rated capacity of 11 kV line: L106 and CB of both sides (require more
than 1,408A) j) Lack of continuous rated capacity of 11 kV line: L150 and CB of both sides (require more
than 1,300A) k) Lack of continuous rated capacity of 11 kV line: L202 (require more than 1,125A) l) Lack of continuous rated current of 11 kV line: L440 (require more than 771 A) m) Lack of continuous rated current of 11 kV line: L523 (require more than 632 A) n) Lack of continuous rated current of 11 kV line: L522 (require more than 631 A) o) Lack of capacity of Blackhall Road 33/ 11 kV transformer (required capacity is more than
21.3 MVA) p) Lack of capacity of Wilberforce 33/ 11 kV transformer (required capacity is more than 10.1
MVA)
It is obvious that the lack of thermal capacity of the lines and countermeasure to voltage drop is increasing according to the increase in demand and it is necessary to implement an adequate solution. And also thermal capacity problems are increasing from 2015 to 2020 because of the countermeasures to the lack of short circuit capacity. Meanwhile, replacement of CB incurs a lot of cost and power stoppages and should be avoided as much as possible. It is recommendable to provide basic conditions to the system such as short circuit current, 20 kA for 11 kV and 25 kA for 33 kV systems respectively. However, Lumpa S/S which may be connected to the international transmission line from Kenema – Mokango - Lumpa, shall be considered 25 kA for 11 kV and 31 kA for 33 kV. It is also recommendable to establish adequate system by 2015 including setting of SC; a) Countermeasures to short circuit capacity;
Re-check the countermeasures to the 11 kV CB in Blackhall Road P/S Actual number of new generator sets with actual technical specifications, and Line constant of 11 kV and 33 kV lines (length, specification, route and arrangement).
b) Countermeasures to the lack of line capacity
There is a lack of line capacity between Kingtom P/S and Brookfields J/S. Re-check the following items;
The size of new trunk lines between Freetown S/S and Brookfields J/S shall be more than 185 sq which was supposed in this study to consider cables as much as possible considering the capital of Sierra Leone,
Re-check continuous rated current of all 11 kV and 33 kV lines to use manufacturers information,
Re-check peak demand at Brookfields J/S, and Re-check actual power flow on 11 kV radial systems between Brookfields J/S and
Kingtom P/S/ Congo Cross S/S/ Brackhall Road P/S/ Wilberforce S/S.

6-38
5) Analysis of Voltage Stability Voltage stability study shall normally be conducted after taking adequate countermeasures on the faulty points. However, there are a lot of unknown factors until year 2015, such as the number of new generator sets and 11 kV/ 33 kV lines and also international connections. Therefore, the voltage stability analysis shall be conducted based on the present assumptions to year 2015. Analysis shall be applied at Kingtom P/S. There is an enough operation margin and generator can operate at stable conditions in 2015 as shown in Fig. 6.4-20.
【Peak in 2015】
[Source] JICA Study Team
Fig. 6.4-20 P-V curve at 11 kV Bus of Kingtom P/S 6) Calculation of Frequency
The power supply to Western Area in 2015, with peak demand supposed as 67 MW, consists of 50 MW from Bumbuna P/S by 161 kV, single circuit of about 205 km long.
It is necessary to know the system conditions when this 161 kV system has fault, and it is required to minimize the power outage area when faults happen.
Frequency calculation shall be applied to the above severe conditions.
P-V Curve Graph
8.5
9.0
9.5
10.0
10.5
11.0
11.5
12.0
0.0 1.0 2.0 3.0 4.0 5.0
Active power (MW)
Voltage (kV)
Kingtom 11kV_B-Bus (generator’s connection side) Kingtom 11kV_A-Bus (generator’s non-connection side)
0.0
Stability limit
Operation point at 2015 peak section
1.55(Kingtom total: 3.1 MW)

6-39
【Year 2015】 <Frequency when Bumbuna 161 kV line has a fault>
Fig. 6.4-21 Bumbuna 161 kV Transmission line
The relation between imbalance of supply/ demand and variation of frequency can be calculated with characteristic of system frequency: K [MW/0.1 Hz],
FKP ∆⋅=∆
Where; ( P∆ :Imbalance of supply/ demand [MW], F∆ :variation of frequency [0.1 Hz])
Generally, system frequency constant K [MW/0.1 Hz] is from 1 to 2 [% MW/0.1 Hz] of the capacity of the system,
K = System capacity: 71 MW (total generated capacity) x 1~2 % = 0.7~1.4[MW/0.1 Hz]
Therefore, when Bumbuna 161 kV line has a fault, power supply from Bumbuna to Kingtom system (48.5 MW) shall be reduced, and frequency drop will be:
3.5Hz9.6z1.4MW/0.1H7.0
5.48~
~
==
∆=∆
MWKPF
Therefore, system frequency will drop from 50 Hz to 46.5~43.1 Hz. This calculation shall be applied to the system so that the variation of the frequency is within 1 Hz. Therefore, actual frequency drop shall be more than the above calculation. This frequency change is more than the adjustable range of the generator as is shown in Table 6.4-68. It seems that the generator connected to Kingtom system will drop out when 161 kV system is at fault.
Table 6.4-68 Requirements for frequencies of rotating electrical machines
Frequency range Requirements at voltage values from 0.95 ~ 1.03 [p.u.] 0.98 ~ 1.02 [p.u.] No practical problems should be caused by continuous operation. 0.95 ~ 1.03 [p.u.] No practical problems should occur.
[Source] JIC C4034-1
Kingtomsystem
Total Output: 50 MW Station use and losses: 1.5 MW
Total Output: 21 MW Station use and losses: 2.1 MW
48.5 MW Bumbunasystem

6-40
<Kingtom system operation when Bumbuna 161 kV has a fault>
Fig. 6.4-21 shows Kingtom System after 161 kV line fault.
Name of Station Demand [MW] Name of Station Supply [MW]
Kingtom A-Bus 1.55 Kingtom B-Bus 1.55 Station of Kingtom 0.3 Falcon Bridge 10.2 Blackhall Road 11.8 Station of Blackhall Road 1.2 Congo Cross 5.8
Kingtom P/S 4.4
Brookfields 9.7 Wilberforce 9.1 Wellington 5.2 Regent 2.5 Goderich 5.1 Jui 4.8 System losses 0.6
Blackhall Road P/S 16.6
Total 69.4 21.0
Fig. 6.4-22 Kingtom System after 161 kV transmission line fault It can be seen that the demand and supply balance will be dropout as is shown in Fig. 6.4-22 which shows lack of supply causing the drop of frequency. To prevent this frequency problem, it is necessary to reduce the demand in Kingtom system to 21 MW. Priority demand was assumed around Kingtom P/S and considering system configuration in 2015, and estimated demand is shown in Table 6.4-69.
Table 6.4-69 Demand to be supplied by Kingtom system Name of Station Demand [MW] Remarks
Kingtom B-Bus 1.55 Station of Kingtom 0.3 Half of Falcon Bridge 5.1 Blackhall Road 11.8 Station of Blackhall Road 1.2 System losses -
Total 19.95 Supply by Kingtom: 21 MW It is necessary to make adequate load shedding in order to fulfill the above load requirement and some of the CBs shall be opened. After considering load shedding as mentioned in Table 6.4-69, Kingtom System has an excess supply which is about 1 MW and system frequency will go up. This frequency variation is,
supply21.0MW
Demand 69.5MW
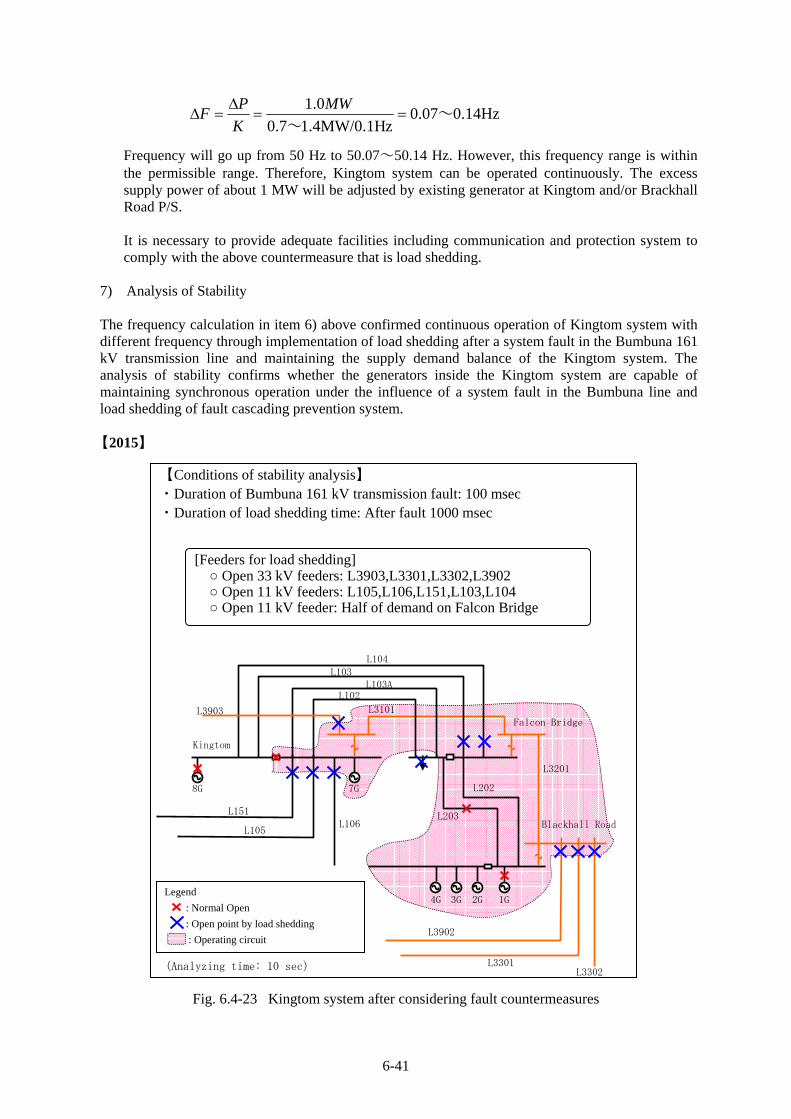
6-41
14Hz.00.07z1.4MW/0.1H7.0
1.0~
~==
∆=∆
MWKPF
Frequency will go up from 50 Hz to 50.07~50.14 Hz. However, this frequency range is within the permissible range. Therefore, Kingtom system can be operated continuously. The excess supply power of about 1 MW will be adjusted by existing generator at Kingtom and/or Brackhall Road P/S. It is necessary to provide adequate facilities including communication and protection system to comply with the above countermeasure that is load shedding.
7) Analysis of Stability The frequency calculation in item 6) above confirmed continuous operation of Kingtom system with different frequency through implementation of load shedding after a system fault in the Bumbuna 161 kV transmission line and maintaining the supply demand balance of the Kingtom system. The analysis of stability confirms whether the generators inside the Kingtom system are capable of maintaining synchronous operation under the influence of a system fault in the Bumbuna line and load shedding of fault cascading prevention system.
【2015】
Fig. 6.4-23 Kingtom system after considering fault countermeasures
【Conditions of stability analysis】 ・Duration of Bumbuna 161 kV transmission fault: 100 msec ・Duration of load shedding time: After fault 1000 msec
(Analyzing time: 10 sec)
[Feeders for load shedding] Open 33 kV feeders: L3903,L3301,L3302,L3902 Open 11 kV feeders: L105,L106,L151,L103,L104 Open 11 kV feeder: Half of demand on Falcon Bridge
1G 2G 3G 4G
Blackhall Road
Falcon Bridge
Kingtom
7G 8G
L104L103
L103AL102
L3903 L3101
L3201
L151
L105 L106
L203
L202
L3902
L3301L3302
Legend : Normal Open : Open point by load shedding : Operating circuit

6-42
Fig. 6.4-24 Phase angle of generator
Fig. 6.4-25 Positive power of generator
Kingtom system can continue the operation to take adequate load shedding during161 kV Bumbuna transmission line fault. Fig. 6.4-24 and fig. 6.4-25 shows these operating conditions.
-10
-5
0
5
10
15
20
25
30
35
0 1 2 3 4 5 6 7 8 9 10Time [sec]
Phase angle
[degree]
Kingtom_G7 BlackhallRoad_G2 BlackhallRoad_G3 BlackhallRoad_G4
Graph of phase angles of generators in the Kingtom system when load shedding is implemented by fault cascading prevention system at time of
system fault in Bumbuna 161 kV transmission line
0.0
2.0
4.0
6.0
8.0
10.0
12.0
14.0
0 1 2 3 4 5 6 7 8 9 10Time [sec]
Active output [MW]
Kingtom_G7 BlackhallRoad_G2BlackhallRoad_G3BlackhallRoad_G4
Graph of active outputs of generators in the Kingtom system when load shedding is implemented by fault cascading prevention system at time of system fault in Bumbuna 161 kV transmission line

6-43
【Conclusion】 Peak demand from 2015 to 2025 at Western Area is increasing about 7 to 8% of average annual increasing rate that is Demand at 2025 is more than ten times of 2015 as is shown on Table 6.4-70. Based on the above assumption, the result of system analysis up to analysis ⑦ [N-1 fault] is shown in Table 6.4-71.
Table 6.4-70 Transition of Power System Development Description Unit 2015 2020 2025
Peak demand [MW] 67.4 97.0 136.3 11 kV Lines (Except feeder) [Lines] 18 18 18 33 kV Lines [Lines] 11 13 14 161 kV Lines [Lines] 1 2 2 No. of power stations [station] 3 4 4 Total of output [MW] 76.4 156.2 154.6 11 kV substation [station] 2 2 2 33 kV substation [station] 6 8 8 161 kV substation [station] 1 1 1
[Source] JICA Study Team
Table 6.4-71 List of the Outcome on each Phase Items of analysis Unit 2015 2020 2025
① Required capacity of SC [MVA] 36 72 114 ② Open lines for countermeasure to short
circuit [circuit] 2 5 5
③ Lines which have no adequate countermeasures
[circuit] 0 1 1
④ No. of lines less capacity to the requirement at normal conditions
[circuit] 0 3 7
⑤ Countermeasures to voltage drop in case of N-1 fault
[case] 0 1 3
⑥ Thermal capacity problem in case of N-1 fault
[case] 6 20 19
⑦ Voltage drop and/or thermal capacity problem in case of N-1 fault
[case] 6 20 21
⑧ Number of thermal faulty facility in case of N-1 fault
[No.] 2 6 15
[Source] JICA Study Team
Table 6.4-71 shows that the required phase regulator capacity, facilities that exceed heat capacity in normal configuration and at times of N-1 fault, and problematic N-1 system faults will increase as the demand increases in the later years. Since three diesel generators will start operating in Kingtom P/S and the Yiben-I HPP will be on line between 2015 and 2020, it is clear that the number of measures to suppress short circuit capacity and facilities with inadequate rated short circuit capacity is also increasing. Adequate SC capacity was studied up to 2015 which is calculated based on a lot of assumptions. And it seems that there are a lot of alternative systems to 2020 and 2025, therefore in this study, system analysis to 2020 and 2025 is omitted. It is recommendable that the system analysis to 2020 and 2025 be conducted after installation of
6-44
new DEG sets and 33 kV system. Distribution system in this study is the loop system which has reliable power supply but it is a little bit complicated. Also, the loop system can dispatch the power when N-1 fault happens. However, it shall be noted that initial cost is higher than the radial system and power flow is complicated. It shall be noted that the load on some sound lines will increase during N-1 fault in the loop system. That is, the facility capacity shall be installed considering these overload factor to prevent serious faults. And also note that it is necessary to study all cases which may be occur during N-1 faults. It is recommendable to promote capacity building and provision of supporting systems to the power flow analysis in order to operate the distribution system adequately.
6.5 Optimal Distribution System It is necessary to install SC as shown in Table 6.4-7 in the major distribution stations by 2015 according to increasing demand and 33 kV system configuration as a loop system. Also, it is necessary to take adequate countermeasures to solve the N-1 fault as mentioned in Table 6.4-21 such as lack of line capacity on L106 and L107, which can be solved by replacing these cables. However, before applying the above solution, following items shall be studied. 1) Review of ongoing project
Upgrading of 11 kV lines (L550 and L551) between Freetown and Brookfields with size upgrading from 3c-185 sq to 1c-300 sq x 3
2) Re-check peak demand at Brookfields J/S Present open points on sub-trunk lines between Brookfields and Kingtom/Congo Cross/Wilberforce/ Falcon Bridge is decided based on experience. It shall be recommended that the open points on sub-trunk line between Brookfields and other major distribution stations shall be decided considering coverage area and minimum energy loss points based on actual power flow.
3) Data for system analysis There are a lot of assumed data in this analysis. These data shall be checked and actual data used as much as possible. Also, actual data to ongoing projects such as the 11 kV and 33 kV distribution systems and new generating facilities shall be used.
When 161 kV transmission line has fault, it is necessary to minimize the blackout area and prevent blackout of the capital. It is necessary to conduct load shedding to keep the system stability. In this connection, it is strongly recommended to establish operating rules including priority order for load shedding and to install frequency relay in the 11 kV and 33 kV SWGRs. Optimal system by 2015 is shown in Fig. 6.5-5 in item 6.7 and single line diagrams for each major distribution station are shown in item-3: Drawings in Appendices. Regarding the distribution system by 2020 and 2025, there are a lot of unclear factors including connection points of international transmission line and it is very complicated to have adequate optimal systems in each year. Therefore, preliminary system study is conducted for reference and future consideration. As a result, it is recommendable that the 33 kV overhead line conductor for which specification is AAAC 150 sq may be upgraded to AAAC 240 sq, then the lack of line capacity problems mentioned in Table 6.4-28 can be solved. As for other problems in 2020 and 2025, peak demand and data shall be

6-45
reviewed and also design standards including standard short circuit current should be decided as soon as possible to prevent further trouble. There are three power sources to Western Area, i.e. Kingtom P/S, Blackhall Road P/S and Freetown S/S, which do not seem to be enough for the capital area. Lumpa S/S seems to be an adequate location as new power source which can be considered as a future Load Dispatching Center. It is necessary to conduct new power projects to establish adequate distribution system as shown in Fig. 6.3-2 by 2025. Table 6.5-1 shows an outline of new projects with target year and project cost in each phase and objectives and results are shown in Table 6.5-2. Details are shown in Item-1 of Appendices.
Table 6.5-1 Rehabilitation, Reinforcement and Expansion of Distribution System
No. Name of Project Outline of the Project Cost
[106US$] Target Year
Phase-I:(2010~2015)
1. Rehabilitation and Reinforcement of 11/33 kV systems
・ Rehabilitation of 11 kV, SWGR ・ Reinforcement of 33 kV facilities
(Kingtom P/S, Blackhall Road P/S, Falcon Bridge S/S)
・ Reinforcement of 33 kV lines (6 km)
25.6 2012
2. Construction of 33 kV lines and S/S
・ Reinforcement of 33 kV facilities (Construction of Goderich S/S, Jui S/S and 33 kV lines)
・ Reinforcement of 33 kV line (20 km)
35.4
2014
A.
3. Rehabilitation of 11 kV facilities
・ Rehabilitation of distribution transformer ・ Reinforcement of LV lines
32
2015
Phase-II:(2016 ~2020) 1. Reinforcement of 33 kV
lines
・ Construction of Lumpa and Tombo S/S ・ Reinforcement of 33 kV lines (32 km)
33.7
2017
B.
2. Reinforcement and expansion of 33 kV lines
・ Reinforcement of 33 kV facilities (New 161/33 kV trans. at Freetown S/S)
・ Expansion of 33 kV lines (33 kV line from Goderich to York town:
about 29 km)
31.4
2020
C. Phase-III:(2021~2025) 1. Reinforcement and
Expansion of Distribution network
・ Reinforcement of 11 kV lines ・ Expansion of 33 kV lines (36 km) ・ Expansion of LV network
16.3
2025
[Source] JICA Study Team

6-46
Table 6.5-2 Objectives and Result Phase Present situation and objectives Result
I- (1) [Name of Project]: Rehabilitation and Reinforcement of 11/33 kV systems
[Present Situations] It is urgently required to install new 33 kV system to meet increasing
demand inWestern Area. Especially, Falcon Bridge, Brackhall Road, Wilberforce and Brookfields area will have serious demand increases and 33 kV system shall be established in these areas. [Objectives]
In order to secure the power supply to the capital of Freetown, it is necessary to install 33 kV system from Kingtom P/S to Brackhall Road P/S through Falcon Bridge. This is because Falcon Bridge S/S is supplying power to the center of Freetown. Also, it is necessary to install 33/ 11 kV substation at Falcon Bridge.
In order to minimize the fault area, it is necessary to rehabilitate existing 11 kV SWGR, such as protection and metering systems, and this will also help with providing actual records.
Secure power supply system and minimize the fault area and reduce energy losses.
I- (2) [Name of Project]: Construction of 33 kV lines and S/S [Present situation]
It is observed that the demand in Jui area will increase largely and Goderich will not have enough power supply lines. Especially, Goderich area suffers terrible voltage drop problems compared to the demand, only one 11 kV line is coming from Wilberforce S/S and many consumers cannot access the electricity. Also, this area is the base of power supply to Sussex and York town where there are a lot of development plans and demand is expected to increase. [Objectives] (1) To secure the reliability of the distribution system. Complete 33 kV
loop from Kingtom, Falconbridge, Brackhall Road, Wellington, Regent, Wilberforce, Freetown
(2) Construct Goderich S/S with 33 kV line from Wilberforce S/S
Secure reliability and improve quality
I- (3) [Name of Project]: Rehabilitation of 11 kV facilities [Present Situation]
There are a lot of faults because of old transformers and SWGRs. [Objectives]
Replace old transformers and SWGRs which are more than 30 years old.
Secure stable power supply and reduce energy losses
II-(1) [Name of Project]: Reinforcement of 33 kV lines [Present Situation]
Present 11 kV system is connected up to Waterloo, and Koya rural does not have distribution system. Lumpa and Tombo are also not connection to the grid.
Secure reliable power supply and promote rural electrification

6-47
Phase Present situation and objectives Result
II-(2) [Name of Project]: Reinforcement and expansion of 33 kV lines [Present situation]
Present 33 kV capacity is not enough to cover the demand in 2025. Therefore, new 161/ 33 kV transformer needs to be installed at Freetown S/S.
Reinforce 33 kV system and secure reliable power supply
III-(1) [Name of Project]: Reinforcement and Expansion of Distribution network [Objectives]
There is no 33 kV loop from Wilberforce, Regent, Jui, Lumpa, Tombo, York and Goderich. This route shall be connected by 33 kV lines to have adequate power supply.
33 kV lines shall be installed from York to Tombo and Lumpa to Fogbo for promotion of rural electrification.
Promote rural electrification
[Source] JICA Study Team 6.6 Others It is recommendable to take into consideration e reliability, quality and safety, operation and maintenance following improvement. (1) Preparation of Operation Rules Before connection to Bumbuna system in the existing Freetown system, it is necessary to establish operation rules such as; 1) Grounding protection system, 2) Operation conditions of incoming and bus-tie circuit breaker, 3) Normal and emergency power distribution on each trunk line, 4) Minimum required interlocking on trunk line feeders, and 5) Preparation of operation rules including load shedding.
Considering the above, some modifications shall be required to the existing systems. This step is also required when new DEGs at Kingtom and Blackhall Road P/S are completed and also 33 kV lines from Freetown S/S. (2) Rules for Electrification Basic conditions to connect new branch lines to the customers shall be established, such as new connections shall be limited to registered customers in order to reduce work volume to the uncertain connections and also to reduce non-collection of electric tariff. (3) Preparation of facility registers It is strongly recommended that the electrical facility registers should be provided. Refer to preliminary facility registers attached in this report. Missing information shall be filled in the registers and they shall be reviewed and modified every end of month and reported every year in annual report; 1) Facility resister for transformers 2) Facility register for 11 kV and 33 kV Lines

6-48
3) Facility register for ring main unit (RMU)
In addition to the above registers, it is necessary to provide the same but for low voltage systems which should clearly mention phase connection and each consumer to meet three phase four wire methods and/or three phase five wire method where it is applied to street lighting system. (4) Standardization of design, installation and O&M In order to secure easy installation and maintenance, standardization of design, installation and operation & maintenance are required. Proposed design basis is shown on attachment of Part-3 of Chapter-1 in Supplemental Volume-1. (5) Establishment of 11 kV operation rules It is recommendable to establish operation rules on 11 kV distribution systems to reduce energy losses, to minimize fault area and to have high reliability. Major items to be concsidered are as follows. 1) Normal conditions; It is necessary to have open point on 11 kV sub-trunk lines between substations and/or junction stations where there is minimum energy losses and without voltage problems. 2) Abnormal conditions; It is necessary to have adequate protection coordination between substations and/or junction stations to minimize the fault area. Also it is required to set back-up lines to the black-out area which can be separated from fault points. It seems that auto-recloser is useful to install in substations and on the long 11 kV line where it is also necessary to consider protection coordination.
(6) Capacity building to engineers and technicians for the above items (3) and (4). After establishment of organization for T&D, adequate capacity building shall be conducted considering future development. Major contents are planning, design, construction, operation and maintenance. (7) Expedite IT and prepare reliable communication system It is required that the computerization for not only data sorting but also for general purposes is urgently required since this will be useful for supervision/control of systems, future system analysis and so on.

6-49
6.7 Power System Analysis Data and Result of Analysis (Figures and Tables)
1. Table 6.4-1 : Line Constants 2. Table 6.4-2 : Transformer Constants 3. Table 6.4-3 : Generator Constants 4. Fig. 6.4-1 : Power Flow: 2015 (Base) 5. Fig. 6.4-2 : Power Flow: 2015 (Adjusting of Transformer Tap) 6. Fig. 6.4-3 : Power Flow: 2015 (Adjusting Tap and Installation of SC) 7. Fig. 6.4-4 : Power Flow: 2020 (Base) 8. Fig. 6.4-5 : Power Flow: 2020 (Adjusting of Transformer Tap) 9. Fig. 6.4-6 : Power Flow: 2020 (Adjusting Tap and Installation of SC) 10. Fig. 6.4-7 : Power Flow: 2025 (Base) 11. Fig. 6.4-8 : Power Flow: 2025 (Adjusting of Transformer Tap) 12. Fig. 6.4-9 : Power Flow: 2025 (Adjusting Tap and Installation of SC) 13. Fig. 6.4-10 : Power Flow: 2015 (with proposed Static Condenser) 14. Fig. 6.4-11 : Short Circuit Calculation: 2015 (Base) 15. Fig. 6.4-12 : Short Circuit Calculation: 2015 (Selection of Open Circuit) 16. Fig. 6.4-13 : Power Flow: 2015 (After Open Circuit) 17. Fig. 6.4-14 : Short Circuit Calculation: 2020 (Base) 18. Fig. 6.4-15 : Short Circuit Calculation: 2020 (Selection of Open circuit) 19. Fig. 6.4-16 : Power Flow: 2020 (After Open Circuit) 20. Fig. 6.4-17 : Short Circuit Calculation: 2025 (Base) 21. Fig. 6.4-18 : Short Circuit Calculation: 2025 (Selection of Open circuit) 22. Fig. 6.4-19 : Power Flow: 2025 (After Open Circuit) 23. Fig. 6.5-1 : Western Area Power System 2015 24. Appendix 6.4-1 : Balancing Method of Generator Output

6-50
Table 6.4-1 Line Constants Base capacity= 1 MVA
Length TYPE Voltage Status Resistance Reactance Capacitance
SustainedCurrent
ShortCircuit Resistance Reactance admittance Sustained
CurrentShort
Circuit[m] Materials Core Size (mm2) [kV] [µΩ/m] [µΩ/m] [pF/m] [A] [kA] p.u. p.u. p.u. [MW] [MW]
0915611 Freetown Bumbuna O/H 204,750 Al 1*3 400 ACSR 161 83.2 395.4 9.18 810 37.2 0.00066 0.00312 7.65311 225.9 10374 Operation: 2009
1516611 Bumbuna YIBEN O/H 26,000 Al 1*3 400 ACSR 161 83.2 395.4 9.18 810 37.2 0.00008 0.00040 0.97182 225.9 10374 Operation: 2019
0102331 Kingtom Falcon Bridge L3101 Marine 2,000 Cu 3*2 500 M-XLPE 33 18.3 55.6 720 1080 67 0.00003 0.00010 0.24633 61.7 3830 Operation: 2012U/G 100 Cu 1*3*2 500 XLPE 33 18.45 67.65 1300 1200 67 0.00000 0.00001 0.02224 68.6 3830O/H 400 Al 1*3 500 ACSR 33 56.8 303.8 12.13 904 46.5 0.00002 0.00011 0.00083 51.7 2658
0.00002 0.00012 0.02307 51.7 2658Marine 3,000 Cu 3*2 500 M-XLPE 33 18.3 55.6 720 1080 67 0.00005 0.00015 0.36949 61.7 3830
O/H 1,000 Al 1*3 500 ACSR 33 56.8 303.8 12.13 904 46.5 0.00005 0.00028 0.00207 51.7 26580.00010 0.00043 0.37156 51.7 2658
U/G 1,000 Cu 3 185 XLPE 33 110 127.2 240 420 26.6 0.00010 0.00012 0.04105 24.0 1520O/H 9,000 Al 1*3 150 AAAC 33 198 343.7 10.66 407 14 0.00164 0.00284 0.01641 23.3 800
0.00174 0.00296 0.05747 23.3 800U/G 1,000 Cu 3 185 XLPE 33 110 127.2 240 420 26.6 0.00010 0.00012 0.04105 24.0 1520O/H 9,000 Al 1*3 150 AAAC 33 198 343.7 10.66 407 14 0.00164 0.00284 0.01641 23.3 800
0.00174 0.00296 0.05747 23.3 800U/G 1,000 Cu 3 185 XLPE 33 110 127.2 240 420 26.6 0.00010 0.00012 0.04105 24.0 1520O/H 12,000 Al 1*3 150 AAAC 33 198 343.7 10.66 407 14 0.00218 0.00379 0.02188 23.3 800
0.00228 0.00390 0.06294 23.3 800U/G 3,200 Cu 3 185 XLPE 33 110 127.2 240 420 26.6 0.00032 0.00037 0.13137 24.0 1520O/H 1,300 Al 1*3 120 ACSR 33 250 338.1 10.84 388 11.1 0.00030 0.00040 0.00241 22.2 634
0.00062 0.00078 0.13378 22.2 634U/G 1,000 Cu 3 185 XLPE 33 110 127.2 240 420 26.6 0.00010 0.00012 0.04105 24.0 1520O/H 2,400 Al 1*3 150 AAAC 33 198 343.7 10.66 407 14 0.00044 0.00076 0.00438 23.3 800
0.00054 0.00087 0.04543 23.3 800U/G 1,000 Cu 3*2 185 XLPE 33 55 63.6 480 714 26.6 0.00005 0.00006 0.08211 40.8 1520O/H 6,000 Al 1*3 240 ACSR 33 120 322.6 11.39 593 22.3 0.00066 0.00178 0.01169 33.9 1275
0.00071 0.00184 0.09380 33.9 12750711331 Wellington Jui L3701 O/H 7,000 Al 1*3 240 ACSR 33 120 322.6 11.39 593 22.3 0.00077 0.00207 0.01364 33.9 1275 Operation: 2013
L3804 U/G 1,000 Cu 3 185 XLPE 33 110 127.2 240 420 26.6 0.00010 0.00012 0.04105 24.0 1520L3604 O/H 12,000 Al 1*3 120 ACSR 33 250 338.1 10.84 388 11.1 0.00275 0.00373 0.02225 22.2 634
0.00286 0.00384 0.06331 22.2 6341016331 Goderich York L31001 O/H 29,000 Al 1*3 120 ACSR 33 250 338.1 10.84 388 11.1 0.00666 0.00900 0.05377 22.2 634 Operation: 2016
U/G 1,000 Cu 3*2 185 XLPE 33 55 63.6 480 714 26.6 0.00005 0.00006 0.08211 40.8 1520O/H 14,000 Al 1*3 240 ACSR 33 120 322.6 11.39 593 22.3 0.00154 0.00415 0.02728 33.9 1275
0.00159 0.00421 0.10939 33.9 1275U/G 1,000 Cu 3 185 XLPE 33 110 127.2 240 420 26.6 0.00010 0.00012 0.04105 24.0 1520O/H 16,000 Al 1*3 120 ACSR 33 250 338.1 10.84 388 11.1 0.00367 0.00497 0.02967 22.2 634
0.00377 0.00508 0.07072 22.2 6341314331 Tombo York L31001 O/H 20,000 Al 1*3 120 ACSR 33 250 338.1 10.84 388 11.1 0.00459 0.00621 0.03709 22.2 634 Operation: 2022
0102111 Kingtom Falcon Bridge L103 U/G 2,880 Cu 3 185 PILC 11 Faulty 118 80 580 355 22.0 0.00281 0.00190 0.03175 6.8 4190102112 Kingtom Falcon Bridge L104 U/G 2,750 Cu 3 185 PILC 11 Faulty 118 80 580 355 22.0 0.00268 0.00182 0.03032 6.8 419 Operation: 20140102113 Kingtom Falcon Bridge L103A U/G 2,880 Al 1*3 240 XLPE 11 161 109 460 405 22.3 0.00383 0.00259 0.02518 7.7 4250102114 Kingtom Falcon Bridge L102 U/G 2,880 Cu 3 185 PILC 11 Faulty 118 80 580 355 22.0 0.00281 0.00190 0.03175 6.8 419 Operation: 2014
U/G 500 Cu 3 185 XLPE 11 128 93.1 430 430 26.6 0.00053 0.00038 0.00409 8.2 507O/H 3,300 Al 1*3 120 AAAC 11 270 354 10.3 351 11.0 0.00736 0.00965 0.00065 6.7 210
0.00789 0.01004 0.00473 6.7 2100104112 Kingtom Congo Cross L105 U/G 2,862 Cu 3 185 PILC 11 118 80 580 355 22.0 0.00279 0.00189 0.03155 6.8 4190105111 Kingtom Brookfield L107 U/G 2,360 Cu 3 185 PILC 11 118 80 580 355 22.0 0.00230 0.00156 0.02602 6.8 4190105112 Kingtom Brookfield L106 U/G 2,360 Cu 3 185 PILC 11 118 80 580 355 22.0 0.00230 0.00156 0.02602 6.8 4190109111 Kingtom Freetown L150 U/G 500 Cu 1*2*3 500 XLPE 11 18.5 67.6 1300 1210 72.3 0.00008 0.00028 0.01235 23.1 1378 Operation: 20100109112 Kingtom Freetown L151 U/G 500 Cu 1*2*3 500 XLPE 11 18.5 67.6 1300 1210 72.3 0.00008 0.00028 0.01235 23.1 1378 Operation: 2010
U/G 2,700 Cu 3 185 XLPE 11 128 93.1 430 430 26.6 0.00286 0.00208 0.02207 8.2 507O/H 1,500 Al 1*3 120 AAAC 11 270 354 10.3 351 11.0 0.00335 0.00439 0.00029 6.7 210
0.00620 0.00647 0.02236 6.7 2100203112 Falcon Bridge Blackhall Road L202 U/G 3,400 Cu 3 185 XLPE 11 128 93.1 430 430 26.6 0.00360 0.00262 0.02779 8.2 5070406111 Congo Cross Wilberforce L440 O/H 2,500 Al 1*3 120 AAAC 11 270 354 10.3 351 11.0 0.00558 0.00731 0.00049 6.7 2100409111 Congo Cross Freetown L450 O/H 3,400 Al 1*3 240 ACSR 11 120 322.6 11.39 593 22.3 0.00337 0.00906 0.00074 11.3 425 Operation: 20140506111 Brookfield Wilberforce L523 U/G 3,000 Al 3 300 PILC 11 Faulty 123 103 490 455 22.5 0.00305 0.00255 0.02794 8.7 429 Operation: 20140506112 Brookfield Wilberforce L522 U/G 3,000 Al 3 300 PILC 11 123 103 490 455 22.5 0.00305 0.00255 0.02794 8.7 429
U/G 500 Cu 3 185 XLPE 11 128 93.1 430 430 26.6 0.00053 0.00038 0.00409 8.2 507O/H 2,500 Al 1*3 240 ACSR 11 120 322.6 11.39 593 22.3 0.00248 0.00667 0.00054 11.3 425
0.00301 0.00705 0.00463 8.2 425U/G 500 Cu 3 185 XLPE 11 128 93.1 430 430 26.6 0.00053 0.00038 0.00409 8.2 507O/H 2,500 Al 1*3 240 ACSR 11 120 322.6 11.39 593 22.3 0.00248 0.00667 0.00054 11.3 425 Operation: 2014
0.00301 0.00705 0.00463 8.2 425
Line No. From To
For Analysis: 1 MVA Base, pu value)
RemarksLayingMetho
d
Spec. of Conductor
Freetown L3903
Line Information Line Constant
Operation: 2011Total
0203331 Falcon Bridge Blackhall Road L3201 Operation: 2013Total
0109331 Kingtom
0306331 Blackhall Road Wilberforce L3301
Operation: 2010Total
0307331 Blackhall Road Wellington L3302
Operation: 2010Total
Operation: 2010Total
Total
0309331 Blackhall Road
0608331 Wilberforce Regent L3601
Freetown L3902
0609331 Wilberforce Freetown L3901
0610331 Wilberforce Goderich L3602
Operation: 2013Total
Operation: 2010Total
Operation: 2013Total
Lumpa L31101
0811331 Regent Jui
Operation: 2017Total
1213331 Lumpa Tombo L31201 Operation: 2017Total
1112331 Jui
0104111 Kingtom Congo Cross L120
Operation: 2014Total
0203111 Falcon Bridge Blackhall Road L203
Total
Total
Total
0509111 Brookfield Freetown
0509112 Brookfield Freetown L551
L550
[Source] JICA Study Team

6-51
Table 6.4-2 Transformer Constants
No.1 MTr No.2 MTr No.3 MTr No.1 MTr No.2 MTr No.1 MTr No.2 MTr No.3 MTrCapacity
1) HV/LV [MVA] 20 20 10 10 10 5 - - 80 15 15 15 5 33.7 33.7 30 30 302) H1/H2 [MVA] - - - - - - 40 40 - - - - - - - - - -3) H1/H3 [MVA] - - - - - - 35 35 - - - - - - - - - -4) H2/H3 [MVA] - - - - - - 15 15 - - - - - - - - - -
Impedance1) HV/LV [%] 9.49 9.49 9.49 9.32 9.49 8.04 - - 13.5 9.49 9.49 9.49 9.49 11.45 11.45 11.45 11.45 11.452) H1/H2 [%] - - - - - - 13.50 13.50 - - - - - - - - - -3) H1/H3 [%] - - - - - - 10.02 9.95 - - - - - - - - - -4) H2/H3 [%] - - - - - - 5.00 5.00 - - - - - - - - - -
Impedance at 1 MVA base1) HV/LV [%] 0.4745 0.4745 0.949 0.932 0.9490 1.608 - - 0.1688 0.6327 0.6327 0.6327 1.898 0.3398 0.3398 0.3817 0.3817 0.38172) H1/H2 [%] - - - - - - 0.3375 0.3375 - - - - - - - - - -3) H1/H3 [%] - - - - - - 0.2863 0.2843 - - - - - - - - - -4) H2/H3 [%] - - - - - - 0.3333 0.3333 - - - - - - - - - -
%Z converted to Delta-Star1) Between HV-LV [%] 0.4745 0.4745 0.949 0.932 0.9490 1.608 - - 0.1688 0.6327 0.6327 0.6327 1.898 0.3398 0.3398 0.3817 0.3817 0.38172) H1 [%] - - - - - - 0.1452 0.1442 - - - - - - - - - -3) H2 [%] - - - - - - 0.1923 0.1933 - - - - - - - - - -4) H3 [%] - - - - - - 0.1411 0.1401 - - - - - - - - - -
Rated Voltage1) HV [kV] 33 33 33 33 33 33 - - 161 33 33 33 33 165 165 165 165 1652) LV [kV] 11 11 11 11 11 11 - - 34.5 11 11 11 11 13.8 13.8 15 15 153) H1 [kV] - - - - - - 161 161 - - - - - - - - - -4) H2 [kV] - - - - - - 11.5 11.5 - - - - - - - - - -5) H3 [kV] - - - - - - 34.5 34.5 - - - - - - - - - -
Base voltage for analysis1) HV [kV] 33 33 33 33 33 33 - - 161 33 33 33 33 161 161 161 161 1612) LV [kV] 11 11 11 11 11 11 - - 33 11 11 11 11 13.8 13.8 15 15 153) H1 [kV] - - - - - - 161 161 - - - - - - - - - -4) H2 [kV] - - - - - - 11 11 - - - - - - - - - -5) H3 [kV] - - - - - - 33 33 - - - - - - - - - -
%Z to Base Voltage1) Between HV-LV [%] 0.4745 0.4745 0.949 0.932 0.9490 1.608 - - 0.1688 0.6327 0.6327 0.633 1.898 0.357 0.357 0.401 0.401 0.4012) H1 [%] - - - - - - 0.145 0.144 - - - - - - - - - -3) H2 [%] - - - - - - 0.210 0.211 - - - - - - - - - -4) H3 [%] - - - - - - 0.154 0.153 - - - - - - - - - -
P.U. value1) Between HV-LV [p.u.] 0.00475 0.00475 0.00949 0.00932 0.00949 0.01608 - - 0.00169 0.00633 0.00633 0.00633 0.01898 0.00357 0.00357 0.00401 0.00401 0.004012) H1 [p.u.] - - - - - - 0.00145 0.00144 - - - - - - - - - -3) H2 [p.u.] - - - - - - 0.00210 0.00211 - - - - - - - - - -4) H3 [p.u.] - - - - - - 0.00154 0.00153 - - - - - - - - - -
Tr No.1) Between HV-LV [p.u.] 0101331 0202331 0303331 0606331 0707331 0808331 - - 0909613 1010331 1111331 1212331 1313331 1515611 1515612 1616611 1616612 16166132) H1 [p.u.] - - - - - 0909611 0909612 - - - - - - - - - -3) H2 [p.u.] - - - - - - 0909111 0909112 - - - - - - - - - -4) H3 [p.u.] - - - - - - 0909331 0909332 - - - - - - - - - -
Operationby 2015
Operationby 2015
Operationby 2015
Operationby 2015
Operationby 2015
Operationby
Operationby 2015
Operationby 2015
Operationby
Operationby
Operationby
Operationby
Operationby
1-tap range [p.u.] 0.025 0.025 0.0125 0.0125 0.0125 0.0125 0.0125 0.0125 0.0125 0.025 0.025 0.025 0.0125 0.0375 0.0375 0.0375 0.0375 0.0375No. of up-Tap [Tap] +4 +4 +8 +8 +8 +4 +10 +10 +10 +4 +4 +4 +4 +2 +2 +2 +2 +2No. of down-Tap [Tap] -4 -4 -8 -8 -8 -12 -10 -10 -10 -4 -4 -4 -12 -2 -2 -2 -2 -2
Wilber-force Wellington RegentDescription Unit Kingtom Falcon
Bridge
Tap
Tombo Bumbuna HPP Yiben-I HPP
Remarks
Freetown (161 kV) Goderich Jui LumpaBlackhallRoad
[Source] JICA Study Team

6-52
Table 6.4-3 Generator Constants
Transient Transient Sub-transientLeakage
ReactanceTime
constant Zero Negative
Xd Xq Xd'(=Xq') Xd" Xq" Td' Td" Xl Ta X0 X2 AVR Governor
【Kingtom P/S(Diesel)】
Sulzer4 011114 11.50 0.80 9.20 11.0 To be retired by 2011
New DEG-7(Japan's Grant) 011117 6.25 0.80 5.00 11.0 750 NA 6,544 3.60 1.400 0.810 0.320 0.230 0.270 0.980 0.029 0.200 0.130 0.130 0.250 NA NA Operation by 2010
New DEG-8(Japan's Grant) 011118 6.25 0.80 5.00 11.0 750 NA 6,544 3.60 1.400 0.810 0.320 0.230 0.270 0.980 0.029 0.200 0.130 0.130 0.250 NA NA Operation by 2010
【Blackhall Road P/S(Diesel)】
New DEG-1(BADEA-I) 031111 10.90 0.80 8.72 11.0 750 NA NA 3.60 1.400 0.810 0.320 0.230 0.270 0.980 0.029 0.200 0.130 0.130 0.250 NA NA Same as No. 7 & 8 of Kingtom, Operation by 2010
New DEG-2(BADEA-II) 031112 10.90 0.80 8.72 11.0 750 NA NA 3.60 1.400 0.810 0.320 0.230 0.270 0.980 0.029 0.200 0.130 0.130 0.250 NA NA Same as No. 7 & 8 of Kingtom, Operation by 2010
New DEG-3(BADEA-III) 031113 10.90 0.80 8.72 11.0 750 NA NA 3.60 1.400 0.810 0.320 0.230 0.270 0.980 0.029 0.200 0.130 0.130 0.250 NA NA Same as No. 7 & 8 of Kingtom, Operation by 2011
New DEG-4(mid-speed) 031114 10.00 0.80 8.00 11.0 750 NA NA 3.60 1.400 0.810 0.320 0.230 0.270 0.980 0.029 0.200 0.130 0.130 0.250 NA NA Same as No. 7 & 8 of Kingtom, Operation by 2015
New DEG-5(mid-speed) 031115 10.00 0.80 8.00 11.0 750 NA NA 3.60 1.400 0.810 0.320 0.230 0.270 0.980 0.029 0.200 0.130 0.130 0.250 NA NA Same as No. 7 & 8 of Kingtom, Operation by 2016
New DEG-6(mid-speed) 031116 10.00 0.80 8.00 11.0 750 NA NA 3.60 1.400 0.810 0.320 0.230 0.270 0.980 0.029 0.200 0.130 0.130 0.250 NA NA Same as No. 7 & 8 of Kingtom, Operation by 2017
New DEG-7(mid-speed) 031117 10.00 0.80 8.00 11.0 750 NA NA 3.60 1.400 0.810 0.320 0.230 0.270 0.980 0.029 0.200 0.130 0.130 0.250 NA NA Same as No. 7 & 8 of Kingtom, Operation by 2018
【Bumbuna P/S(Hydraulic)】
No.1 151311 33.70 0.90 30.33 13.8 333.33 NA 700,000 6.32 0.940 0.570 0.210 0.170 0.180 1.160 0.030 0.160 0.160 0.100 0.175 NA NA
No.2 151312 33.70 0.90 30.33 13.8 333.33 NA 700,000 6.32 0.940 0.570 0.210 0.170 0.180 1.160 0.030 0.160 0.160 0.100 0.175 NA NA
【YIBEN-I P/S(Hydraulic)】
No.1 161511 28.20 0.90 25.38 15.0 NA NA NA 6.32 0.940 0.570 0.210 0.170 0.180 1.160 0.030 0.160 0.160 0.100 0.175 NA NA
No.2 161512 28.20 0.90 25.38 15.0 NA NA NA 6.32 0.940 0.570 0.210 0.170 0.180 1.160 0.030 0.160 0.160 0.100 0.175 NA NA
No.3 161513 28.20 0.90 25.38 15.0 NA NA NA 6.32 0.940 0.570 0.210 0.170 0.180 1.160 0.030 0.160 0.160 0.100 0.175 NA NA
Armature ReactanceTechnical Data
GD2 [Kg・m2]
Turbine GeneratorSynchronous Sub-transient
Reactance Time Constant
Assumed as same as Bumbuna. Operation by 2019
Powerfactor
Output[MW]Unit Node No.
Capacity
[MVA]RemarksVoltage
[kV]
Revolu-tion
[rpm]
Inertiaconstant
[s]
[Source] JICA Study Team

6-53
[Source] JICA Study Team
Fig. 6.4-1 Power Flow: 2015 (Base)

6-54
[Source] JICA Study Team
Fig. 6.4-2 Power Flow: 2015 (Adjusting of Transformer Tap)

6-55
[Source] JICA Study Team
Fig. 6.4-3 Power Flow: 2015 (Adjusting Tap and Installation of SC)

6-56
[Source] JICA Study Team
Fig. 6.4-4 Power Flow: 2020 (Base)

6-57
[Source] JICA Study Team
Fig. 6.4-5 Power Flow: 2020 (Adjusting of Transformer Tap)

6-58
[Source] JICA Study Team
Fig. 6.4-6 Power Flow: 2020 (Adjusting Tap and Installation of SC)

6-59
[Source] JICA Study Team
Fig. 6.4-7 Power Flow: 2025 (Base)

6-60
[Source] JICA Study Team
Fig. 6.4-8 Power Flow: 2025 (Adjusting of Transformer Tap)

6-61
[Source] JICA Study Team
Fig. 6.4-9 Power Flow: 2025 (Adjusting Tap and Installation of SC)

6-62
[Source] JICA Study Team
Fig. 6.4-10 Power Flow: 2015 (with proposed Static Condenser)
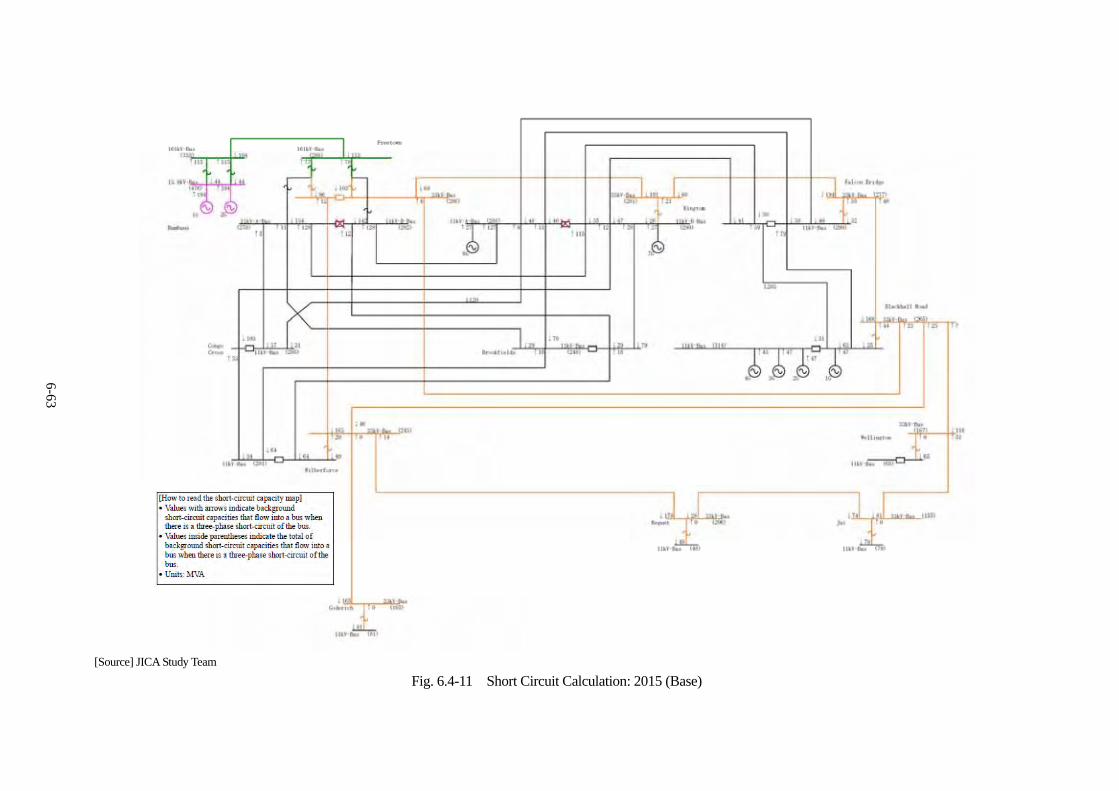
6-63
[Source] JICA Study Team
Fig. 6.4-11 Short Circuit Calculation: 2015 (Base)

6-64
[Source] JICA Study Team
Fig. 6.4-12 Short Circuit Calculation: 2015 (Selection of Open Circuit)

6-65
[Source] JICA Study Team
Fig. 6.4-13 Power Flow: 2015 (After Open Circuit)

6-66
[Source] JICA Study Team
Fig. 6.4-14 Short Circuit Calculation: 2020 (Base)

6-67
[Source] JICA Study Team
Fig. 6.4-15 Short Circuit Calculation: 2020 (Selection of Open Circuit)

6-68
[Source] JICA Study Team
Fig. 6.4-16 Power Flow: 2020 (After Open Circuit)

6-69
[Source] JICA Study Team
Fig. 6.4-17 Short Circuit Calculation: 2025 (Base)

6-70
[Source] JICA Study Team
Fig. 6.4-18 Short Circuit Calculation: 2025 (Selection of Open circuit)

6-71
[Source] JICA Study Team
Fig. 6.4-19 Power Flow: 2025 (After Open Circuit)

6-72
[Source] JICA Study Team
Fig. 6.5-1 Western Area Power System 2015

6-73
[Source] JICA Study Team
Appendix-6.4-1 Balancing Method of Generator Output

7-1
7. Environmental and Social Considerations 7.1 Legal and Institutional Framework of Environmental and Social Considerations 7.1.1 Organizations for Environmental Protection and Regulation (1) Environment Protection Agency The Environment Protection Agency was newly established in December 2008, based on the Environment Protection Agency Act 2008, under the Ministry of Lands, Country Planning and the Environment. Before the establishment of the Environment Protection Agency, the Department of Environment under the Ministry of Lands, Country Planning and the Environment was in charge of protection of the environment. The main reason for the establishment of the Agency is to give more autonomy to carry out its activities. The Agency has a board consisting of representatives from Ministry of Land, Country Planning and the Environment, Ministry of Local Government, Ministry of Mineral Resources, Ministry of Marine Resources, Ministry of Agriculture, Forestry and Food Security, Ministry of Tourism and Cultural Affairs, Ministry of Trade and Industry, Ministry of Transport, Ministry of Health and Petroleum Unit. The Board supervises the Agency. The roles of the Agency are to advise ministries in formulating policies concerning the environment, harmonize the activities of concerned bodies to control pollution and protect the environment, coordinate and monitor the implementation of national environmental policies and so on. The Agency is also in charge of issuing EIA licenses as described in the next part. The agency, however, has currently only eight staff. Although the agency has a plan to increase the number of staff, this shortage of manpower and capacity make it difficult to carry out the expected roles. Since there is no national environmental regulation or standard, Sierra Leone uses the regulations or standards of international organizations such as WHO (water, air) or other countries. One of the agency’s new functions is to establish national environmental standards and prescribe guidelines relating to ambient air, water and soil quality, the pollution of air, water, land and other forms of environmental pollution including the discharge of wastes and the control of toxic substances. It is though it takes time to establish the national environmental standards, considering the capacity of the agency. Thus, it is necessary to use international environmental standards for some time. (2) Forestry Division, Ministry of Agriculture, Forestry and Food Security The forestry division under the Ministry of Agriculture, Forestry and Food Security is in charge of management and protection of forests and wildlife. The forestry division has branches in districts. There are two relevant laws, namely the Forestry Act 1988 and the Wild Life Conservation Act 1972. According to the Forestry Act, a chief conservator compiles a national inventory of forest resources, and prepares a management plan based on the inventory for each forest. Nobody is allowed to cut down trees, construct structures, cultivate and mine in protected forests without authorization. However, in practice, the government does not have enough personnel and budget to prepare such an inventory and management plan or patrol to stop illegal activities in forests. When somebody wants to cut trees in a protected forest, he/she is required to submit a letter to the director of the forestry division to obtain his permission. Even though there is the Wild Life Conservation Act, the lack of budget makes the Forestry Division unable to conduct a survey and protect wild animals from illegal hunting.

7-2
7.1.2 Procedures of Environmental Impact Assessment (EIA) Projects mentioned in the First Schedule below are required to apply for an EIA license to the Agency before starting the projects. The sections from 23 to 39 of the Environment Protection Agency Act explain the procedures of EIA. The flow of the EIA procedures is summarized in Fig. 7.1-1. 1) Any person who will undertake a project under the First Schedule (Please refer to the First
Schedule: Project Requiring Environmental Impact Assessment Licenses-in the box below) needs to apply for a license to the Agency with a description of the project.
2) The Agency decides whether EIA is required in fourteen days after the agency receives an application. The Second Schedule (Please refer to the Second Schedule:Factors for Determining Whether a Project Requires an Environmental Impact Assessment) is considered when a decision of EIA requirement is taken.
3) If EIA is not required, the Executive Director informs the applicant in written form.
4) When an applicant is required to submit EIA, the applicant needs to prepare and submit EIA including the information set out in the Third Schedule (Please refer to the Third Schedule: Contents of EIA)to the Agency.
5) The Agency circulates a received EIA to professional bodies or associations, Government Ministries and NGOs for their comments. In addition, the Agency makes the EIA open to the public for their comments and inspection in Gazette or newspaper.
6) After receiving the comments, the EIA is submitted to the Board. Then, the Board decides whether a) to issue a license b) to require additional information from the applicant in 21 days, or c) to reject the EIA which has adverse impacts on the environment, people and society.
7) When the EIA has been approved, the Board directs the Executive Director to issue a license to the applicant.
8) The Agency will monitor all projects which licenses have been issued to assess the effects on the environment.

7-3
First Schedule: Projects Requiring Environmental Impact Assessment Licenses
(a) Substantial changes in renewable resource use (e.g. conversion of land to agricultural production, forestry or to pasture land, rural development, timber production)
(b) Substantial changes in farming and fisheries practices (e.g. introduction of new crops, large scale mechanization or use of chemicals in agriculture)
(c) Exploitation of hydraulic resources (e.g. dams, drainage and irrigation project, water basin development, water supply)
(d) Infrastructure (e.g. roads, bridges, airports, harbors, transmission lines, pipelines, railways) (e) Industrial activities (e.g. metallurgical plants, wood processing plants, chemical plants, power
plants, refinery and petro-chemical plants, agro-industries) (f) Extractive industries(e.g. mining quarrying extraction of sand, gravel, salt, peat, oil and gas) (g) Waste management and disposal (e.g. sewerage systems and treatment plants, landfills,
treatment plants for household and hazardous waste) (h) Housing construction and development schemes (i) Establishment of places of entertainment, motor repair garages and welding shops (j) Importation of second hand vehicles
Second Schedule: Factors for Determining Whether a Project Requires an Environmental Impact Assessment
(a) The environment impact on the community (b) The location of the project (c) Whether the project transforms the locality (d) Whether the project has or is likely to have substantial impact on the ecosystem of the
locality (e) Whether the project results in the diminution of the aesthetic, recreational, scientific,
historical, cultural or other environmental quality of the locality (f) Whether the project will endanger any species of flora or fauna or the habitat of the flora and
fauna (g) The scale of the project (h) The extent of the degradation of the quality of the environment (i) Whether the project will results in an increase in demand for natural resources in the locality (j) The cumulative impact of the project together with other activities or projects on the
environment
Third Schedule: Contents of Environmental Impact Assessment (EIA)
(a) The location of the project and its surroundings (b) The principle, concept and purpose of the project (c) The direct or indirect effects that the project is likely to have on the environment (d) the social, economic and cultural effect that the project is likely to have on people and society(e) The communities, interested parties and government ministries consulted (f) Any actions or measures which may avoid, prevent, change, mitigate or remedy the likely
effect on people and society (g) Any alternatives to the proposed project (h) Natural resources in the locality to be sued in the project (i) The plans for decommissioning of the project (j) Such other information as may be necessary for a proper review of the potential impact of the
project
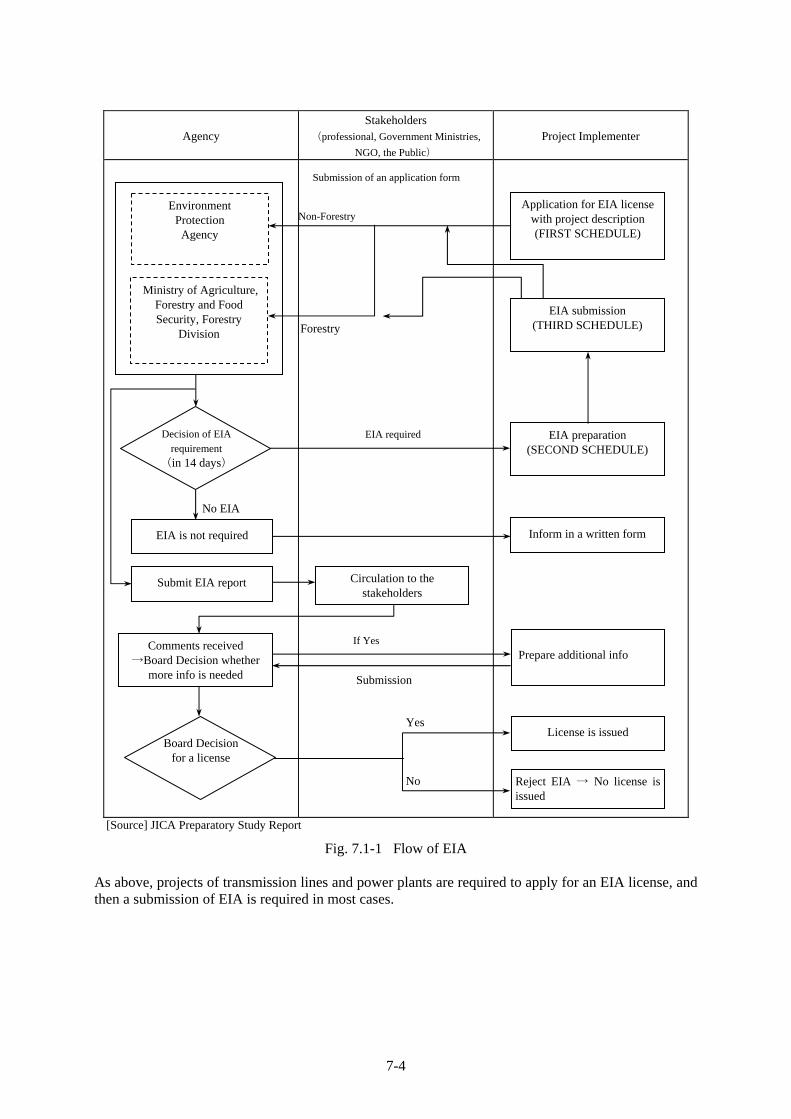
7-4
Agency Stakeholders
(professional, Government Ministries, NGO, the Public)
Project Implementer
[Source] JICA Preparatory Study Report
Fig. 7.1-1 Flow of EIA As above, projects of transmission lines and power plants are required to apply for an EIA license, and then a submission of EIA is required in most cases.
Environment Protection Agency
Ministry of Agriculture, Forestry and Food Security, Forestry
Division
Application for EIA license with project description (FIRST SCHEDULE)
EIA submission (THIRD SCHEDULE)
EIA preparation (SECOND SCHEDULE)
Inform in a written form EIA is not required
Submit EIA report Circulation to the stakeholders
Comments received →Board Decision whether
more info is needed
Prepare additional info
License is issued
Reject EIA → No license is issued
Decision of EIA requirement
(in 14 days)
Board Decision for a license
Non-Forestry
Forestry
No EIA
EIA required
If Yes
Submission
Yes
No
Submission of an application form

7-5
7.1.3 Legal Framework for Land Acquisition and Compensation (1) Land Tenure System There are two land tenure systems in Sierra Leone. One is the customary land tenure system, which is controlled by paramount chiefs, who are traditional rulers in Sierra Leone, and land is owned by communities, families and individuals. This is practiced in provinces outside Western Area. The Provinces Land Act regulates the ownership of land by non-natives in the provinces other than Western Area. According to the definition in the act, “non-natives” are any person who is not entitled by customary law to have land rights in the provinces. Section 4 of the Province Land Act provides that non-natives are able to acquire only rights of leasehold of land for 50 years. The other one is the modern freehold land tenure system governed by law and practiced in Western Area. Land in Western Area is either state land or private land, and it can be sold, purchased or leased. Therefore, the procedures of land acquisition and the way how to compensate land differ between Western Area and the other provinces. (2) Land Acquisition and Compensation To implement this Master Plan, land acquisition for a new power plant, sub station, and transmission and distribution lines will be needed. The Constitution 1991 states that the state can acquire land compulsorily for public interest if the state pays adequate compensation. The Public Lands Act (the Public Lands Ordinance 1961) stipulates that land can be acquired by agreement or compulsory for public work, and then how to compensate the taken land and damages incurred to owners, occupiers and other persons who have interest in the land. The act also provides settlement of disputes, judicial procedures and grievance procedures. However, the Public Lands Act applies only in Western Area. Section 18 of the Act explains the matters which should be considered in determining the amount of compensation as follows. 1) The market value of the land 2) Increase in the value of other land likely to accrue from the use to which the land acquired will
be put 3) Damage incurred by the person who possesses the land caused by separating the land from
his/her other land 4) Damage to other property and his/her actual earnings when the land is taken 5) Expense if the person is forced to change his residence and place of business
The Compulsory Acquisition of Property (Constitutional Safeguards) 1961 provides the procedure of compulsory acquisition. A person who does not hold land title is not entitled to receive compensation under the national laws. In practice, however, if a person has settled in some land without land title for certain years, he/she can receive some compensation in some cases. The Ministry of Lands, Country Planning and the Environment (MLCPE) is the main body to acquire land for public use and valuate assets. In case of in-kind compensation, MLCPE finds alternative land and prepares necessary documents. In case of cash compensation, a project implementer (NPA) in collaboration with MLCPE negotiates with affected people. The government prefers in-kind compensation as it costs less.

7-6
(3) National Power Authority Act (NPA Act) The National Power Authority Act 1982 explains the two different cases for Western Area and the other provinces. According to section 40 (1) (a) of the NPA Act, if the authority cannot acquire land by private treaty or agreement in Western Area, land can be obtained in a compulsory manner for public use in accordance with the Public Lands Act (Ordinance). Section 40 (1) (b) provides that if the authority cannot acquire leasehold of any land by private treaty or agreement in the provinces, the Minister of Interior may authorize any person to execute a lease of any land to the Authority under fair and reasonable conditions. In either case, all expenses and compensation for the acquisition is paid by the authority. There are sections for Bumbuna hydro project in the NPA Act. Section 49(1) provides that the Authority may acquire any land either permanently or temporarily and either by agreement or compulsorily. Section 33 of the NPA Act provides that when any trees or structures interfere the supply line, a Magistrate can order it to be removed only if appropriate compensation is paid to the owners. Section 42 of the NPA Act explains that if the NPA thinks it is necessary, the NPA may lay supply lines at any height along, across and under any streets or roads, erect structures such as posts and poles in or on streets and roads, and sometimes break up any streets and roads in previous consultation with concerned ministries. 7.2 Natural and Social Environment of the Target Area 7.2.1 Natural Environment The climate of Sierra Leone is tropical. The rainy season is from May to October, and the dry season is from November to April. The monthly temperature is around 27ºC in Freetown. Freetown, being near the ocean, has high rainfall, about 3,000 mm/ year. Humidity is high, especially in the rainy season when it is about 80%, and 60-70% in the dry season. The target area of the study, Western Area, is located in Western Area Peninsula. Even though urbanization and deforestation have destroyed the environment, there is still beautiful nature in Western Area, such as forests, beaches, ocean, and wetlands (mangrove forests). It is estimated 85% of energy sources in the urban and rural areas for heating and cooking are fuel wood and charcoal due to lack of other energy sources such as electricity. They come from forests or mangrove swamps. A thin costal line can be seen around the peninsula in the north, west and south. There are beautiful white sand beaches along the coastal line in the west. Foreign tourists used to visit these beaches before the civil war. Still, there are hotels and restaurants along the beaches. The beaches are potential sites for tourism development. (1) Flora and Fauna Sierra Leone is rich in terms of biodiversity, both flora and fauna. But lack of intensive and comprehensive surveys especially after 90’s makes it difficult to grasp the current status of biodiversity. In addition, the ten-year civil war degraded its rich biodiversity as people cleared forests and ate bush meats. In the 2008 IUCN (International Union for Conservation of Nature and Natural Resources) Red List, 1051 species are categorized as Critically Endangered (CR), Endangered (EN), Vulnerable (VU), Near

7-7
Threaded (NT), Data Deficient (DD), and Least Concerned (LC) in Sierra Leone. Out of 1051 species, 94 species are categorized as CR, EN, and VU. The number of animal species is 47 and plant species is 47.
Table 7.2-1 Critically Endangered Species in Sierra Leone 1 Epinephelus itajara (Goliath Grouper) 2 Pristis pectinata (Wide Sawfish) 3 Pristis perotteti (Largetooth Sawfish) 4
Animal (fish)
Pristis pristis (Common Sawfish) 5 Plant Triclisia macrophylla Occurs in lowland and
submontane forest; 0–1,500 m altitude
[Source] IUCN (International Union for Conservation of Nature and Natural Resources) Red List
Table 7.2-2 Endangered Species in Sierra Leone 1 Animal Cardioglossa aureoli (Freetown long-fingered frog) 2 Cephalophus jentinki (Jentink's Duiker) 3 Chelonia mydas (Green Turtle) 4 Choeropsis liberiensis (Pygmy Hippopotamus) 5 Epinephelus marginatus (Dusky Grouper) 6 Hylomyscus baeri (Baer's Hylomyscus) 7 Lycaon pictus (African Wild Dog) 8 Malimbus ballmanni (Gola Malimbe) 9 Pan troglodytes (Common Chimpanzee) 10 Procolobus badius (West African Red Colobus) 11 Rhinobatos cemiculus (Blackchin Guitarfish) 12 Rhinobatos rhinobatos (Common Guitarfish) 13 Rhynchobatus luebberti (Lubbert’s Guitarfish) 14 Rostroraja alba (Bottlenose Skate) 15 Scotopelia ussheri (Rufous Fishing-owl) 16 Neolemonniera clitandrifolia 17 Placodiscus pseudostipularis 18 Tieghemella africana 19
Plant
Tieghemella heckelii (Cherry Mahogany) [Source] IUCN (International Union for Conservation of Nature and Natural Resources) Red List
However, the Government of Sierra Leone has not carried out any national surveys to develop a database. So no detailed national information is available. (2) Protected Areas There are two protected areas in Western Area. One is a part of Sierra Leone River Estuary (the total area is 300,000ha), which is one of the wetlands in the list of the Ramsar Convention. The other one is rainforest, Western Area Peninsular Forest Reserve (WAPF), located in the center of the peninsula. In addition, there is an unprotected wetland called Yawri Bay area in the south of the peninsula. The area is undergoing work to be designated a national protected area and to be a registered site of the Ramsar Convention.

7-8
[Remarks] The red lines show the road network [Source] DACO / SLIS
Fig. 7.2-1 Map of Protected Areas in Western Area 1) Sierra Leone River Estuary
Sierra Leone River Estuary is characterized as mangrove swamp and it is a protected area under international convention, but it is not under the domestic laws. This has led to virtually no study and management of the estuary by the government, although the area is important as a habitat of birds and tree species as well as breeding ground for fish. Studies in the 80’s and 90’s found that the estuary held over 20,000 birds. The estuary also is an important site for Palaearctic1 migratory birds which winter in the estuary. Five species of marine turtle live here, and Green Turtle out of the five is an endangered species. It is said that African Manatees live in the estuary.
Mangrove swamp near Jui , Sierra Leone River Estuary
Mangrove swamp near Jui , Sierra Leone River Estuary
1 A zoogeographical region comprising Eurasia north of the Himalayas and North Africa
1.Sierra Leone River Estuary
2.Western Area Peninsula Forest Reserve 3.Yawri
Bay Area

7-9
The clear demarcation of the area is not available. People cut mangrove trees for farmland, housing or for fuel wood. It is said that the size of area has become small. It is prohibited to fish by large fishing vessels in the estuary to protect the environment and to avoid depletion of fish. It has been proposed that Sierra Leone River Estuary become a marine protected area.
[Source] Conservation Society of Sierra Leone
Fig. 7.2-2 Map of Sierra Leone River Estuary
As in the above map, the mangrove swamp stretches from Wellington through Hastings to Waterloo. The road network keeps away from the mangrove swamp, but the road is very close to the mangrove swamp in several parts like Jui and Waterloo. 2) Western Area Peninsula Forest, WAPF (Non hunting forest reserve) The Western Area Peninsular Forest Reserve is moist forest. WAPF is protected area under a domestic law, and has been proposed to acquire national park status. The range of quite steep hills between 150m to 900m with the highest Picket Hill in the south is covered by closed moist forest. WAPF is unique and the only place in West Africa where mountains occur near the coast. WAPF is an important water catchment area for the population in Freetown who depend on water supply from Guma valley dam located in WAPF. Two reservoirs are in WAPF, that is, Guma Valley and Congo dams.

7-10
Forest near River No.2 Hills Covered by Forest near River No.2 WAPF has heavy rainfall with annual mean rainfall from 3000 to 7000mm. Daily temperatures vary from 25 to 30ºC in the dry season and 22-27ºC in the rainy season. Humidity is from 45% to 80%. In Fig. 7.2-3, the areas in orange show the already extinct parts and the areas in yellow show the actual stretch of the forest. For instance, Regent area used to be in the forest reserve. But it was developed as a housing area. Consequently, the area has been deforested. Not only in Regent area, but in other areas, in particular, the areas along the road running along the western coast line trees have been cut down.
Regent Area No Trees on Hill Slope near Lakka There is no detailed information regarding flora in WAPF, as no comprehensive survey for flora has been carried out before. A sample survey in 2003 recorded 53 tree species and 47 shrub species. The forest vegetation is interrupted by natural grassland in laterite plain along the coastal line. Although WAPF is a non-hunting forest under law, local people or people who belong to hunting societies do hunting in WAPF. This has driven some precious animals to the edge of extinction. It is believed leopards that used to inhabit WAPF are now extinct and the red colobus monkey is nearly extinct.

7-11
[Remarks] Note The red lines show the existing roads. [Source] DACO / SLIS
Fig. 7.2-3 Western Area Peninsula Forest Reserve
Extinct Forest
Remaining Forest
Regent
Lakka
River No2.
Jui
Waterloo
Tokeh
Kent
Tumbo
Lumley
Sussex
York

7-12
As for animals, over 50 mammal species have been recorded so far. But no comprehensive survey has been carried out since the 1990’s. According to 2008 ICUN Red List and past surveys, there are several animals which are believed to have their habitats in WAPF, that is, Cardioglossa aureole (Freetown Long-fingerd Flog, EN), Chephalophus jentinki (Jentingk’s Duiker, EN), Cercocebus atys (Sooty/white-naped Mangabey, VU), Cercopithecus diana (Diane/roloway Monkey,VU), Pan Troglodytes (Common Chimpanzee, EN), Panthera pardus (Leopard, NT), and Procolobus badius (West African Red Colobus, EN). Regarding birds, 374 bird species have been recorded so far. According to 2008 IUCN Red list and past surveys, Bleda eximius (Green-tailed Bristlebill, VU) and Picathartes gymnocephalus (White-necked Picathartes, VU) have their habitat in WAPF. As the original boundary of WAPF by law has been disregarded, the government is now trying to re-demarcate WAPF to protect the forest (its catchments and biodiversity), considering the current condition of degradation and local people’s dependence on the forest. The Forestry Division, the Ministry of Lands, County Planning and the Environment, the Police, the Army, and the Guma Valley Water Company are cooperating for this demarcation. EU started a project called “Conservation of the Sierra Leonean Western Area Peninsula Forest Reserve and its Watersheds” in March 2009 to help the demarcation and preparation of management plans for the benefit of the adjacent population (about 50,000).
3) Yawri Bay Area This is an unprotected coastal wetland of mangroves swamp. The area is important for birds and fish. The bay is estimated to hold over 20,000 birds and Palaearctic migratory birds occur in the bay. Surveys on animals except birds have not been carried out. But, it is thought that African Manatee and Green Turtle occur in the bay area.
7.2.2 Social Environment Sierra Leone was suffering from insufficient provision of social and public services and deterioration of economy due to power game and corruption after achieving independence in 1961. The civil war that started in 1991 made the situation worse. Since the end of war in 2002, peace has been kept. The country is now in the stage of development after the reconstruction stage. However, basic infrastructure such as water, electricity, roads is not yet developed enough even in the capital, Freetown, which is a negative factor for economic development. The lack of social services such as education or health makes the lives of people more difficult. The unemployment rate and poverty rate are high. The country is ranked at 177, bottom in the Human Development Index (2007/2008) published by UNDP
The size of population is becoming bigger and bigger in Western Area, as refugees or internally displaced persons during the war have been moving in, and people from rural areas have also migrated to seek a better life. The population of Western Area is 950,000 according to the statistics in 2004 (urban 785,000 and rural 165,000).This growth of population has caused heavy congestion in Freetown. Especially, the poor have encroached along bay, river and hilltop areas informally. These kinds of slums with no proper infrastructure and sanitation facilities are scattered in the town. Of them, slums in Kroo Bay, Susan’s Bay, Granville Brook, Cline Bay near Fisher Lane and Wellington Creek are big.

7-13
[Source] JICA Study Team
Fig. 7.2-4 Location of Big Slums in Freetown In Western Rural, towns and villages are located along the roads. People have encroached the Right of Way (ROW) of the roads and the forest reserve in some cases. New housing development can be seen in Goderich, Grafton and Waterloo in Western Rural. Sierra Leone has two poverty lines. One is the food/extreme poverty line, which is translated to expenditure of 1,000 leones per day. The other one is the full poverty line, which is expenditure of 2,100 leones per day. Western area is rich compared to the other areas in Sierra Leone. But, poverty still prevails. According to the Annual Statistics Digest 2005/2006, the ratio of people who live under the two poverty lines is 3.2% and 17.1% respectively in Western Urban, and 26.3% and 70.1% respectively in Western Rural. (National average is 14.7% and 54.3% in urban, and 32.8% and 78.9% in rural.) The employment pattern in Western Area differs vastly from the other areas. While over 60% of the national population depends on agriculture, only 6.5% in Western Area does. 60% of people in Western Area have their jobs in the service sector. From this, it can be said that power demand in Western Area is higher than the other areas.
Kroo Bay K B
Susan’s Bay
Granville Brook
Cline Bay
Wellington Creek

7-14
Table 7.2-3 Share of Employment by Sector Nation South East North West 2007 2007 2007 2007 2007Crop farming 61.3 68.1 71.7 75.7 1.7Livestock/poultry 0.4 0.1 0.8 0.1 0.1Forestry/logging 0.4 0.3 0.1 0.2 1.3Fishing 1.7 0.4 2.0 1.5 3.4Agriculture total 63.8 69.0 74.6 77.6 6.5Mining/quarrying 2.6 7.1 0.4 2.0 0.9Manufacturing/processing 1.9 1.0 1.0 1.6 6.0Electricity/gas/water 0.8 0.6 0.5 0.2 2.8Construction 1.9 1.6 1.0 1.2 6.0Industry total 7.1 10.3 2.9 5.0 15.6Wholesale/retail/ hotel/restaurant 19.8 14.8 16.8 12.0 48.0Transport/storage/com. 1.6 0.7 0.5 0.9 6.7Banking/finance 0.7 0.1 0.1 0.0 4.4Services total 22.1 15.6 17.4 12.9 59.2Community/ government (*) 5.0 4.1 3.0 3.1 14.8Others 1.9 1.1 2.0 1.4 4.0TOTAL 100.0 100.0 100.0 100.0 100.0[Source] Poverty Reduction Strategy 2008-2012
7.3 Case Study of Environmental and Social Considerations for Power Project in Sierra
Leone The World Bank project “Power and Water Project” will be reviewed to learn lessons. 7.3.1 33kv Distribution Line in Freetown One of the components of the Power and Water Project assisted by the World Bank is rehabilitation, reinforcements and extension of the transmission and distribution system in the Western Area. The planned line is from Kingtom Power Station through Tengbeh Town to Wilberforce Sub Station and Blackhall Sub Station for 9.2km in total. The work had to be stopped due to the civil war in 1997 with 60% of the work unfinished. The network was damaged during the war, and people settled in under and along the line sometimes without formal land titles during and after the war. After the end of war, an EIA was conducted, and a resettlement action plan was prepared to continue the work. However, the work did not go straightforward since the government did not release the counter fund to NPA to implement the action plan and a contract between the WB and a contractor was not made. This rehabilitation, reinforcement and extension of the network system finally re-started in April 2009 after the contract was made. The WB has decided to finance the whole budget for the resettlement as a special case due to the emergency conditions. The increase of settlers under the lines is being reviewed as of June to implement the second resettlement action plan. After compensation for the resettlement to the project affected persons is paid, the construction work will start. (1) EIA An EIA was conducted in 2004 by a Ghanaian consulting company, referring to the Environmental Protection Act 2000 and World Bank procedures and guidelines (OP 4.01 Environmental Assessment and EA Source Book). The main adverse impacts are summarized in the next table.

7-15
Table 7.3-1 Summary of EIA Pre-
Construction Phase
Construction Phase
Operational and Maintenance Phase
Project Activities Mitigation Measures
To clean up substations
Provide waste disposal site by NPA
Waste Generation
Replace cables/ conductors
Segregate and dispose, reuse, recycle as appropriate by NPA and a contractor
Vegetation Vegetation Control Replant as necessary Visual Intrusion/ Aesthetics
Erecting Towers/Poles and Stringing Lines
Improve alignment and tensioning
Tourism
Erecting Towers/Poles and Stringing Lines
[Source] Power and Water Project EIA of the 33kV and 161kV Transmission and Distribution Network of the Western Area in Sierra Leone 2004
In addition, the followings were raised as special issues.
Table 7.3-2 Summary of Special Issues
Impact Remarks Mitigation Measures PCB in Insulating oils Health hazard Tests to be carried out
to determine if PCB exists in NPA systems.
Safe handling procedures and personnel protection
Transformer Oil Leaks
Pollution Health and safety hazards
Construct bunds around transformers
[Source] Power and Water Project EIA of the 33kV and 161kV Transmission and Distribution Network of the Western Area in Sierra Leone 2004
The Study Team made an inspection of the existing substations, referring the Power and Water Project EIA. It was observed that rubbish, old cables and so on were scattered and oil leaked from transformers. The covers of several switch boards were removed so that electrodes were dangerously exposed, which may lead to accidents. It is required to keep the substations clean by implementing waste management and to take preventive measures for oil leak and operate and maintain the equipment properly. As the distribution network of NPA is old and old transformers are still used, the possibility of PCB inclusion in the transformers is very high. The old transformers will be disposed with the renewal of the distribution network. Therefore, appropriate measures should be taken. (2) Resettlement Action Plan (RAP) A first survey to develop a resettlement action plan for 9.2 km of 33kV line was conducted in 2004. But, the WB requested to review it, as the scale of resettlement was relatively large, and the total amount of compensation was big. The second survey was conducted by another consulting company in 2007 to minimize the number of affected people and the cost of compensation. Both RAPs were prepared to meet the WB Operation Policy 4.12 on Involuntary Resettlement, which is more favorable to protect affected people than national laws in Sierra Leone. Even people who do not have land title can receive some kind of cash or in-kind compensation. Therefore, the differences between the amount payable under the national laws in Sierra Leone and amount payable under the WB policy were
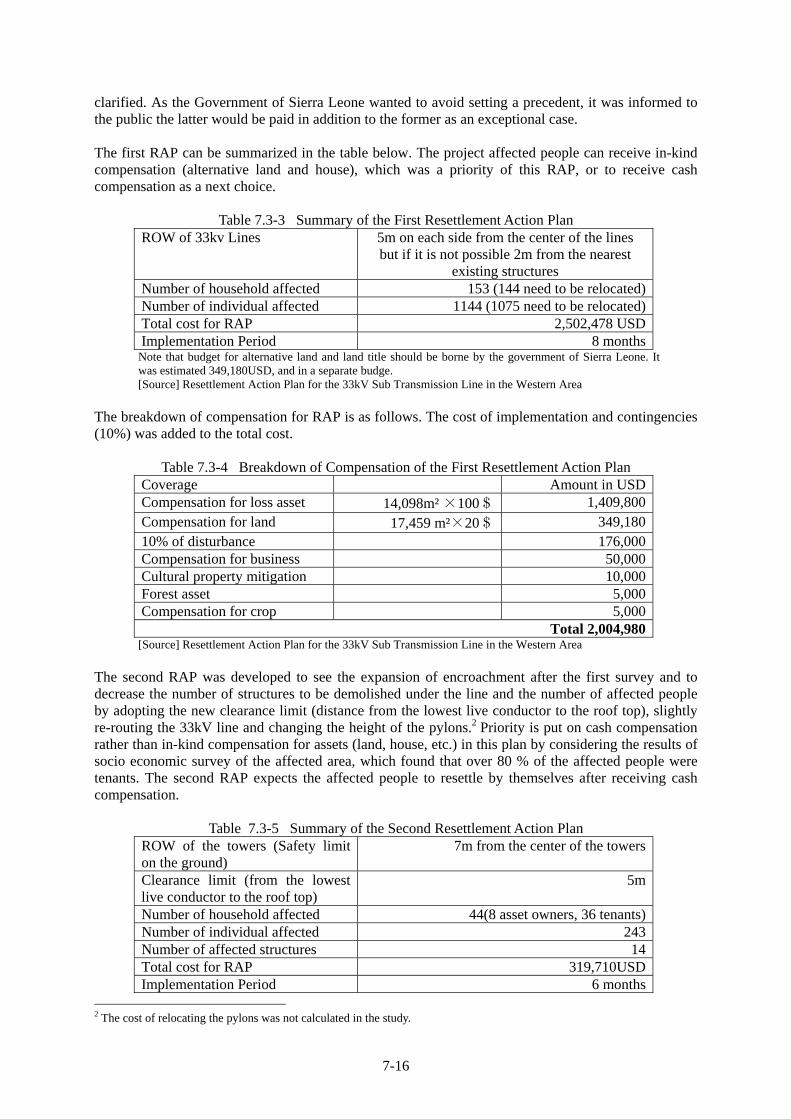
7-16
clarified. As the Government of Sierra Leone wanted to avoid setting a precedent, it was informed to the public the latter would be paid in addition to the former as an exceptional case. The first RAP can be summarized in the table below. The project affected people can receive in-kind compensation (alternative land and house), which was a priority of this RAP, or to receive cash compensation as a next choice.
Table 7.3-3 Summary of the First Resettlement Action Plan ROW of 33kv Lines 5m on each side from the center of the lines
but if it is not possible 2m from the nearest existing structures
Number of household affected 153 (144 need to be relocated) Number of individual affected 1144 (1075 need to be relocated) Total cost for RAP 2,502,478 USD Implementation Period 8 months
Note that budget for alternative land and land title should be borne by the government of Sierra Leone. It was estimated 349,180USD, and in a separate budge. [Source] Resettlement Action Plan for the 33kV Sub Transmission Line in the Western Area
The breakdown of compensation for RAP is as follows. The cost of implementation and contingencies (10%) was added to the total cost.
Table 7.3-4 Breakdown of Compensation of the First Resettlement Action Plan Coverage Amount in USD Compensation for loss asset 14,098m² ×100$ 1,409,800 Compensation for land 17,459 m²×20$ 349,180 10% of disturbance 176,000 Compensation for business 50,000 Cultural property mitigation 10,000 Forest asset 5,000 Compensation for crop 5,000
Total 2,004,980 [Source] Resettlement Action Plan for the 33kV Sub Transmission Line in the Western Area
The second RAP was developed to see the expansion of encroachment after the first survey and to decrease the number of structures to be demolished under the line and the number of affected people by adopting the new clearance limit (distance from the lowest live conductor to the roof top), slightly re-routing the 33kV line and changing the height of the pylons.2 Priority is put on cash compensation rather than in-kind compensation for assets (land, house, etc.) in this plan by considering the results of socio economic survey of the affected area, which found that over 80 % of the affected people were tenants. The second RAP expects the affected people to resettle by themselves after receiving cash compensation.
Table 7.3-5 Summary of the Second Resettlement Action Plan ROW of the towers (Safety limit on the ground)
7m from the center of the towers
Clearance limit (from the lowest live conductor to the roof top)
5m
Number of household affected 44(8 asset owners, 36 tenants) Number of individual affected 243 Number of affected structures 14 Total cost for RAP 319,710USD Implementation Period 6 months
2 The cost of relocating the pylons was not calculated in the study.

7-17
[Source] Review of the Resettlement Action Plan-33kV Sub-Transmission Line from Kingtom to Wilberforce and Blackhall Road
The breakdown of the total cost is in the next table.
Table 7.3-6 Breakdown of the Total Cost of the Second Resettlement Action Plan 1.Compensation USD Value of affected assets 86,840 Tenant compensation ( rent for six months, transportation cost, disturbance allowance, 10% contingencies)
43,470
Income restoration 32,000 2.Operational Budget 157,400
Total 319,710 [Source] Review of the Resettlement Action Plan-33kV Sub-Transmission Line from Kingtom to
Wilberforce and Blackhall Road The lesson we can learn from the two action plans is that it is possible to minimize the scale of involuntary resettlement by changing the route of distribution line and location of pylons and poles, increasing the height of pylons and so on. It is ideal that there are no structures in the ROW of distribution lines. But if it is difficult to secure ROW due to the high number of structures to be resettled, the scale of resettlement can be slimmed down by alternatively introducing the clearance limit (distance from the lowest live conductor to the roof) which is able to maintain the safety of people. This can be a model example when a distribution network is constructed in an already developed housing area. 7.4 Environmental and Social Considerations for Power Development Plan This Master Plan consists of two components which need environmental and social considerations. One is the plan for power development and the other one is rehabilitation, reinforcement and extension of distribution lines. There are several types of power generation. The environmental impacts of each type are summarized in the next table.

7-18
Table 7.4-1 Comparison of Environmental and Social Impacts of Various Power Generation Methods Hydropower Thermal Power
Steam-Power Generation Internal Combustion Power Generation Environmental
Factors
Dam type
Flow-in type
Micro hydro
Coal Heavy Oil Gas Gas
Turbine Diesel
Wind Power
Solar Power
Involuntary resettlement A B C B B B B B B C
Local economy, such as employment and livelihood
A B C B B B C C C C
Land use and utilisation of local resources
A B B B B B B B B B
Social institutions, such as social infrastructure and local decision-making system
B C C C C C C C C C
Existing social infrastructure and services
C C C C C C C C C C
The poor, indigenous and ethnic people
A B B B B B C C C C
Erroneous communication of interests
C C C C C C C C C C
Cultural heritage B C C B B B C C C C Local conflict of interests B C C C C C C C C C
Water usage or water rights and rights in common
A B C B B B C C C C
Public hygiene B C C C C C C C C C
Soci
al E
nviro
nmen
t
Infectious diseases B C C C C C C C C C Topography and geographical features
A B C C C C C C C C
Soil erosion B C C B B B B B C C Groundwater C C C C C C C C C C Hydrogical conditions A B C C C C C C C C
Coastal zone C C C C C C C C C C Flora, fauna and biodiversity A B C B B B B B B C
Meteorology C C C C C C C C C C Landscape A B C B B B B B B B
Nat
ural
Env
ironm
ent
Global warming C C C A B B B B C C Air pollution C C C A B B B B C C Water pollution A B C A A A C C C C Soil contamination C C C B B B B B C C Waste B B C B B C B B C C Noise and vibration B B C B B B B B B C Ground subsidence C C C C C C C C C C Offensive odour C C C C C C C C C C
Pollu
tion
Bottom sediment A B C C C C C C C C Accident B B C B B B B B C C Rating A:Serious impact is expected
B:Some impact is expected C:No or minimal impact is expected
[Source] JICA Study Team

7-19
Power generation by clean energy such as solar and wind can minimize impacts on the environment. However, solar or wind power is dependent on the weather. For the time being, solar and wind energy is not an optimal option for the Western Area which is facing serious power shortages. Stable and reliable supply of electricity is necessary in this emergency stage. Thus, the Study Team suggests two types of power generation, that is, hydro power and thermal power in this Master Plan. 7.4.1 Thermal Power Development If the above five types of thermal power generation methods are compared, it can be said that the environmental impact of diesel generator is smaller than the others’. In addition, diesel power generation is the easiest to operate and maintain. Since NPA has only experience of operating diesel engine generators, it is considered the diesel power generation method is the optimal option. Therefore, the diesel power generation method is recommended. In this Master Plan, it is proposed to use the Blackhall Road sub-station as a new power plant as well as the Kingtom power station to avoid adverse environmental impact by developing a new power plant at a new site. However, if the “Thermal Dominant Scenario” is chosen, it is required to construct another new power plant. (1) Adverse Environmental and Social Impact Identified Adverse environmental and social impacts identified for the thermal plant development are summarized in the next table. The natural and social environment in the target area and the condition of the existing power plan was taken into consideration to identify the impacts.
Table 7.4-2 Assessment of Adverse Environmental and Social Impacts of Thermal Plant (Diesel Generation)
Assessment Results Evaluation Items
General Construction
Stage Operating
Stage
Expected Environmental and Social Impact
Involuntary Resettlement B B C Construction of a new power plant may require land acquisition.
Local Economy, Employment and Livelihood C C C
Use of Land and Other Local Resources B B C
It may be necessary to acquire land for a new power plant and change the use of land.
Social Institutions such as Social Infrastructure and Local Decision-Making Institutions
C C C
Existing Social Infrastructure/Services C C C
The Poor, Indigenous of Ethnic People C C C
Misdistribution of Benefit and Damage C C C
Cultural Heritage C C C
Although there are cultural heritages in Western Area, most of them are small monuments.
Conflict of Local Interests C C C Water Rights and Rights of Common C C C
Public Health C C C
Soci
al E
nviro
nmen
t
Infectious Diseases C C C
En vir
on
Topographical and Geographical Features C C C

7-20
Assessment Results Evaluation Items
General Construction
Stage Operating
Stage
Expected Environmental and Social Impact
Soil Erosion
B B C
Construction of a power plant and installation of generators may cause soil erosion caused by site preparation.
Groundwater C C C Hydro geological Conditions C C C Coastal Zone
B B B
If a power plant is located near the coast or mangrove swamp, it carries risk of polluting the areas without necessary auxiliary facilities.
Flora, Fauna and Bio-Diversity B B B
If a power plant is located near the important protected sites, it may give impact to the flora and fauna.
Meteorology C C C Landscape
B B B A power plant may not be in harmony with the surrounding environment.
Global Warming B C B
New diesel engine generators will discharge CO².
Air Pollution B C B
New diesel engine generators will discharge NOx and SOx.
Water Pollution B C B
New diesel engine generators may pollute water without necessary auxiliary facilities
Soil Contamination
B C B
New diesel engine generators may contaminate soil by oil leak without necessary auxiliary facilities.
Waste
B B B
Increase of the capacity of power supply by adding diesel-engine generators increases the amount of waste oil.
Noise and Vibration
B B B
New diesel-engine generators will discharge noise and cause vibration. Construction noise and vibration are usually observed.
Ground Subsidence C C C Bad Odour C C C Benthic Sediment C C C
Pollu
tion
Accidents B C B There is a risk of fire. Rating A: serious impact is expected B: some impact is expected C: minimum or hardly any impact is expected [Source] JICA Study Team (2) Mitigation Measures To mitigate the expected impacts in the table above, the following measures are recommended. 1) Involuntary Resettlement
Careful consideration of the location of a new power plant can avoid or minimize involuntary resettlement.

7-21
2) Use of Land and Other Local Resources To choose a site which does not change the use of land widely as much as possible or to avoid a site where people depend on their lives is necessary.
3) Soil Erosion
Before site preparation of a new diesel engine generator or a power plant, survey of geological condition should be conducted to take necessary measures to avoid soil erosion.
4) Coastal Zone
It is better to avoid constructing a new plant near the Sierra Leone River Estuary and Yawri Bay area in order not to cut mangrove forests and give adverse impact on the environment. When a new generator is installed in the Kingtom Power station, it is a must to install necessary auxiliary facilities not to pollute the sea around the power station or give impacts on marine animals and plants, because effluent from the power plant used to be discharged to the sea.
5) Flora, Fauna and Bio-Diversity
Threatened species of flora and fauna can be observed in Western Area. The location of a new plant has to be decided carefully to avoid interference to threatened species of animals and plants in particularly in WAPF and the Sierra Leone River Estuary.
6) Landscape Planting trees in a power plant and designing a power plant in harmony with the surrounding environment is necessary. 7) Global Warming
New diesel engine generators to be installed should have high thermal efficiency and keep the emissions of CO² low.
8) Air Pollution
An exhaust gas system, which meets the international standards for the emissions of NOx, SOx and dust, for the generators and an engine with low NOx emissions should be installed. Installing a higher stack is also effective. 9) Water Pollution
A new diesel generator should have a sludge treatment system to meet the international standards for oil content emission to avoid water pollution. Water containing waste oil used to be discharged to the ocean in the Kingtom Power Station when the generators were operating, as the sludge treatment system was not working. Currently, the Moroccan government is trying to fix one of the broken down generators in the Kingtom power station. If the generator operates again, it is recommended to install a new sludge treatment system or at least clean up the pond of the existing sludge treatment system to boost efficiency.
10) Soil Contamination
Oil stains by lubricant or oil leaks from the waste oil tanks or from the sludge treatment system are observed on the ground and in the drains of Kingtom Power Station. When the Sulzer 4 is fixed by Morocco and starts operation again, the present sludge treatment system in the Kingtom Power

7-22
Satiation, which is not working properly, should be changed to a new one, and proper maintenance system should be introduced. Not only for the sludge treatment system, but proper operation and maintenance of generators and other facilities and equipment should be introduced to avoid oil leak. Oil retaining bunds should be installed around waste oil tanks. And the ground surface should be covered by concrete to avoid penetration of oil to the ground.
11) Waste
Oil is one of the major wastes generated from a power plant, and it has a risk to pollute the environment. The NPA used to give waste oil to an oil treatment company for reuse. It was reported that oil spill was observed everywhere in the treatment facility. Since this company stopped its business and the NPA is not generating electricity by their generators, waste oil has been kept in waste oil tanks in the Kingtom power plant. If an oil treatment facility which operates in an environment-friendly manner cannot be found, it will be necessary to install an incinerator to burn waste oil when a new generator is installed. There is no separate waste collection system in Sierra Leone. Wastes are not separated in two dump sites in Freetown either. A separate waste collection system for normal solid waste, hazardous waste and recyclable should be established in the NPA. No landfill or treatment facilities for hazardous waste are available in Sierra Leone. The NPA, as a generator of wastes, should be responsible for all types of wastes. If there is no landfill to dump hazardous wastes such as oil or chemicals, the NPA should separate them and secure a safe place to keep them as a temporary solution.
12) Noise and Vibration
A new diesel engine generator and a power house should be designed to reduce noise and vibration by choosing a low noise level type generator or installing necessary auxiliary facilities and equipment such as sound proof walls. And generators should be installed in a powerhouse with strong platform, roof and walls with certain distance from the surrounding houses.
13) Accidents
Currently no training for fire fighting is held for NPA workers in the power plant. And there are not enough fire extinguishers in good condition. Procedures in case of fire should be taught to NPA workers and the power plants need to equip necessary fire extinguishers.
7.4.2 Hydro Power Development Potential sites for hydro power development were already identified in the master plan study in 1995 as explained in Chapter 5. As all the volumes of the master plan are not available, environmental and social conditions of the potential sites cannot be compared by using the information in the master plan in 1995. Alternatively, for the comparison of environmental impacts of each site, the proposed location of each hydro power plant and proximity of protected areas around was checked in the map. The next table shows the protected areas near the potential sites.

7-23
Table 7.4-3 Potential Sites for Hydro Power Development and Nearby Protected Areas
Site Location (Name of district)
Rated Output
(MW)
Utilisation Rate (%)
Electric Energy Generated (GWh/yr)
Construction Cost
(million USD)
Unit Generating Cost
(US¢/kWh)
Protected Areas near the site
Benkongor III Kenema 85.5 70.9 513.1 77.4 3.72 Tama Forest Reserve ( 30-40km Away ) in the upstream
Mange I Port Loko 35.2 75.3 244.1 84.8 5.72 The Rhombe Swamp site in the downstream (about 40 km away). This swamp is now under process to be a protected site.
Kuse II Koinadugu 91.8 83.1 679.7 298.0 5.90 Adjacent to Outamba -Killimi National Park
Kambatimbo Koinadugu 65.7 56.1 322.1 81.2 4.93 Adjacent to Outamba -Killimi National Park
Yiben-I Koinadugu 61.5 78.9 442.9 90.6 2.89 Yiben-II Koinadugu 62.1 75.8 430.2 122.4 3.94 Betmai I Tonkolili 52.5 57.7 268.5 69.0 5.88 Betmai III Tonkolili 36.6 72.4 249.5 84.5 4.92
Tonkoli Forest Reserve in the upstream
[Source] JICA Study Team Yiben is recommended as the next site to be developed after the Bumbuna hydro dam in the master plan 1995, because Yiben is advantageous in terms of costs and efficiency. The Yiben hydro dam, located the upstream of the Bumbuna dam, will stabilize the water flow to the Bumbuna dam. This will enable the Bumbuna dam to generate electricity even in the dry season at the same level as in the rainy season. The development of Yiben has already been regarded as the stage two of the development of the hydropower potential of the Seri River in Sierra Leone. As for transmission lines from a new hydro dam to Western Area, the transmission line of Bumbuna can be used if Yiben is developed, which can minimize the environmental impacts of transmission lines. It may be said that Yiben has less environmental impacts, because it is not located near protected sites. But no detailed data on forest coverage, wild animals are available in the Forestry Division. Social impacts are unknown since there are no detailed data on population and location of villages which would be affected by development of the hydro dams in the master plan 1995. It was said that Yiben-II would require less resettlement than Yiben-I in the master plan 1995. However, the study was conducted about 15 years ago, and the condition is changing especially after the end of war. Even though population census was conducted in 2004, population data at each village are not available. District maps were prepared after the population census, but the maps show only the locations of big settlements. Therefore, it is difficult to estimate a scale of resettlement from the information available. According to the Bumbuna Project Implementation Unit (PIU), the natural environment around Yiben and Bunbuna is similar. The vegetation and kinds of wild animals in the two areas are almost the same. But the hunting of wild animals and clearing the forest for farmlands are observed in Yiben, which means the number of animals has decreased and the forest coverage has become small. As for the social environment, there are villages around, but it can be said that it is less populated than Bumbuna in terms of size of villages and population density. They mainly engage in subsistence shifting cultivation. There is no access road to the site yet, so villages are scatted in remote areas where they have no social infrastructure such as schools and health centers. Detailed biodiversity surveys in Bumbuna by the Bumbuna PIU found that the area is rich in
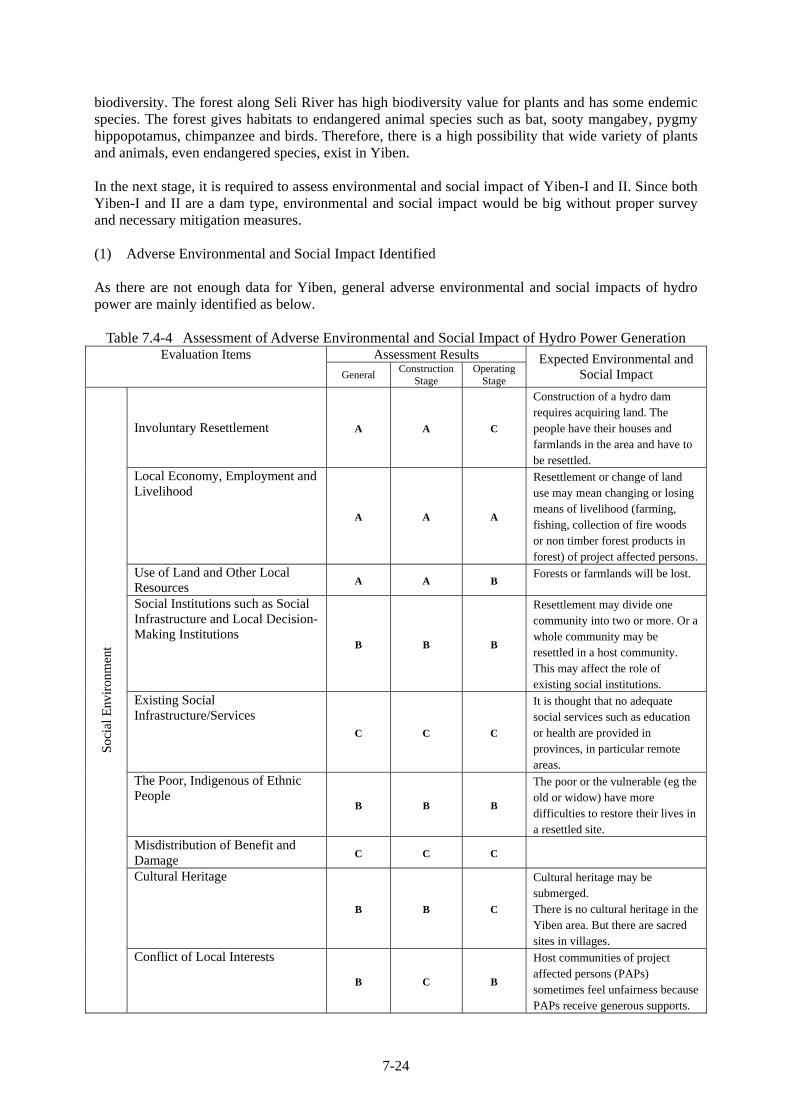
7-24
biodiversity. The forest along Seli River has high biodiversity value for plants and has some endemic species. The forest gives habitats to endangered animal species such as bat, sooty mangabey, pygmy hippopotamus, chimpanzee and birds. Therefore, there is a high possibility that wide variety of plants and animals, even endangered species, exist in Yiben. In the next stage, it is required to assess environmental and social impact of Yiben-I and II. Since both Yiben-I and II are a dam type, environmental and social impact would be big without proper survey and necessary mitigation measures. (1) Adverse Environmental and Social Impact Identified As there are not enough data for Yiben, general adverse environmental and social impacts of hydro power are mainly identified as below.
Table 7.4-4 Assessment of Adverse Environmental and Social Impact of Hydro Power Generation
Assessment Results Evaluation Items General Construction
Stage Operating
Stage
Expected Environmental and Social Impact
Involuntary Resettlement A A C
Construction of a hydro dam requires acquiring land. The people have their houses and farmlands in the area and have to be resettled.
Local Economy, Employment and Livelihood
A A A
Resettlement or change of land use may mean changing or losing means of livelihood (farming, fishing, collection of fire woods or non timber forest products in forest) of project affected persons.
Use of Land and Other Local Resources A A B
Forests or farmlands will be lost.
Social Institutions such as Social Infrastructure and Local Decision-Making Institutions
B B B
Resettlement may divide one community into two or more. Or a whole community may be resettled in a host community. This may affect the role of existing social institutions.
Existing Social Infrastructure/Services
C C C
It is thought that no adequate social services such as education or health are provided in provinces, in particular remote areas.
The Poor, Indigenous of Ethnic People
B B B
The poor or the vulnerable (eg the old or widow) have more difficulties to restore their lives in a resettled site.
Misdistribution of Benefit and Damage C C C
Cultural Heritage
B B C
Cultural heritage may be submerged. There is no cultural heritage in the Yiben area. But there are sacred sites in villages.
Soci
al E
nviro
nmen
t
Conflict of Local Interests
B C B
Host communities of project affected persons (PAPs) sometimes feel unfairness because PAPs receive generous supports.

7-25
Assessment Results Evaluation Items General Construction
Stage Operating
Stage
Expected Environmental and Social Impact
Water Rights and Rights of Common A B A
The change of water flow and volume may have some impacts.
Public Health B B B Infectious Diseases
B B B
The influx of construction workers and newcomers seeking an economic opportunity after the completion of a dam will raise the risk of the spread of infectious diseases such as sexual transmission diseases, AIDS/HIV. A reservoir will be a good breeding site for mosquitoes and raise a risk of spread of infectious diseases by mosquitoes.
Topographical and Geographical Features A A C
Construction work of a dam may change topographical and geographical features in the area.
Soil Erosion B B B
Landslide or earth fall might happen by making a reservoir and change of water level.
Groundwater C C C Hydrogeological Conditions
A A A A dam might have impact on hydro geological conditions.
Coastal Zone C C C Flora, Fauna and Bio-Diversity
A A A
Habitats of animals and plants will be lost by construction of a dam. Even though there is no protected area nearby Yiben, animals and plants occurring in the dam area will lose their habitats.
Meteorology C C C Landscape
A A A
A dam type hydro power generation leads to a big scale construction. This causes loss of the environment in the surrounding area and drastic change in landscape.
Nat
ural
Env
ironm
ent
Global Warming C C C Air Pollution C C C Water Pollution
A B A
Eutrophication in the reservoir and decayed plants under reservoir may cause water pollution. Construction works and mishandling of wastes may pollute water.
Soil Contamination C C C Waste
B B C Excavated earth of sand and construction wastes will be discharged.
Noise and Vibration B B C
Construction noise and vibration are usually observed.
Ground Subsidence C C C Bad Odour C C C
Pollu
tion
Benthic Sediment A B A
Sedimentation may happen in the

7-26
Assessment Results Evaluation Items General Construction
Stage Operating
Stage
Expected Environmental and Social Impact
reservoir. The level of riverbed in the upstream of the river may be increased.
Accidents
B B B
Accidents in the construction site may happen. There is a risk of accident in the downstream of the dam caused by discharged water.
Rating A: serious impact is expected B: some impact is expected C: minimum or hardly any impact is expected [Source] JICA Study Team (2) Mitigation Measures To mitigate the expected impacts in the table above, the following measures are recommended. 1) Involuntary Resettlement
To change the location of a dam slightly or to lower the full supply water level of the reservoir could minimize involuntary resettlement. 2) Local Economy, Employment and Livelihood
Livelihood assistance project or income generation projects for example agriculture extension services to teach the skills to produce new agricultural products, vocational training, micro finance service and so on should be implemented to assist projected affected people during and after the construction period. 3) Use of Land and Other Local Resources
During and after the construction of a dam, a project of the watershed management should be implemented to conserve the environment. 4) Social Institutions such as Social Infrastructure and Local Decision-Making Institutions
Consultation with communities and households should be held with host communities to discuss how to keep or modify the existing institutions in a resettled site. 5) The Poor, Indigenous and Ethnic People
It is necessary to identify the vulnerable groups by economic and social survey, and special assistance should be given to them. 6) Cultural Heritage
To avoid cultural heritages in deciding the location of a dam is required. If it is difficult, heritages should be moved to another site. Communities sometimes have sacred sites in a community. The Bumbuna dam project relocated these sacred sites after consultation with the communities and organizing a ceremony. It is necessary to give such consideration.

7-27
7) Conflicts of Local Interests A supporting program which will benefit host communities, such as construction of footpath, community center, school, health center should be implemented too. 8) Water Rights and Rights of Common
A survey of water use and water rights should be conducted in advance to take countermeasures. 9) Public Health and Infectious Diseases
Health education to construction workers during the construction period and to communities and new comers during and after the construction period should be held. 10) Soil Erosion
To conduct a comprehensible geological survey is required to avoid the landslide or earth fall-prone areas. Planting trees around the area is a measure to retain soil. 11) Hydro geological Conditions
A hydro geological survey should be conducted in advance to take countermeasures. 12) Flora, Fauna and Bio-Diversity
To change the location of a dam slightly or to lower the full supply water level of a reservoir could minimize the impacts on flora and fauna. If endangered species or endemic species are found in the planned site, to create a protected area in near places or other habitats, then to conduct careful monitoring is required. Education programs for the community in the area should be organized to raise their awareness to protect the biodiversity. 13) Landscape It is necessary to design in harmony with the surrounding environment and to plant trees in the area.
14) Water Pollution
Plants should be removed before impoundment to avoid water pollution caused by decayed plants. It is necessary to provide necessary sanitation facilities to construction workers and to implement waste management to avoid pollution caused by waste generated during the construction period After the construction period, to install a fraction fence or aerator to avoid eutrophication in the reservoir can be effective. And to do monitoring of water quality and take necessary measures to avoid water pollution, which may affect the ecosystem in watershed areas and water use of people living in the downstream area, is necessary. 15) Waste
Waste management should be undertaken for waste generated during the construction period such as construction wastes.

7-28
16) Noise and Vibration To give information regarding noise and vibration caused by construction work to the neighboring community to gain understanding is necessary. 17) Benthic Sediment
In the design stage, the amount of expected sediment should be considered to provide enough capacity of a reservoir. If necessary, sand discharge facilities should be installed. 18) Accidents
Contractors should be responsible for occupational health and safety of construction workers. After a power plant starts operation, to raise awareness of people who live in the downstream about the danger of discharged water and how to act is necessary. And to build an alarm system with sirens or speakers to give notice of discharge schedule is also necessary.
(3) Lessons Learned from the Bumbuna Hydro Project 43 households (186 people) in five villages in the dam area had to relocate because of the project. The project affected people (214 people and communities) received in-kind compensation (house, land, and farmland), cash compensation for economic trees, disturbance allowance, and moving allowance. The total cost of resettlement and compensation was 950,000USD, which excluded the cost for a livelihood and income restoration program. It was very difficult to identify project affected villages and people because there was no accurate and reliable map or census data. For example, there was no exact data as to where villagers were located and how many people lived there. In addition, for names of villages, the information on a map, names in the census, or locally used names were all different. It is necessary to take enough time to conduct a survey to identify project affected villages and people. As Bumbuna hydro dam is located in Northern Province, how to acquire land and compensate the land was considered by respecting the customary law. Each tribe or even each locality has different customary law. Thus, consultation at several levels, chiefdom, community, family, and individual are required. When negotiations and consultation are needed with project affected people, a chief, a representative from district council, which is in charge of providing social services, and councilor should be invited. The Public Lands Act was referred to as the guiding principal by the project for compensation although the act is not applied to the provinces outside Western Area. The pressure on the natural environment is high even without a project, because people cut trees for farmlands, and hunt wild animals for bush meats and for ceremonies. The Bumbuna Hydro Project faced difficulties in asking cooperation to people as people in Sierra Leone are not yet aware of the importance of environmental protection. Therefore, the project established a semi-autonomous government authority called the Bumbuna Watershed Management Authority to protect the environment in the watershed. The authority will raise awareness of community members and enhance community participation. And the project will create a sanctuary for wild animals in the watershed and protect the biodiversity in the Loma Mountain where similar species occur as an offset. This will be a good example for the next hydro dam project.

7-29
7.5 Environmental and Social Considerations for Substations, Transmission and Distribution Lines
7.5.1 Strategic Environmental Assessment (SEA) for the Renewal, Reinforcement and
Extension of the Distribution Line Considering the natural and social environment in Western Area, it is required in this Master Plan to conduct SEA regarding the renewal, reinforcement and extension of the distribution lines. The government of Sierra Leone expresses that the development of energy sector, in particular the provision of constant and reliable power supply, is one of the top priorities for poverty reduction and economic growth in the Second Poverty Reduction Strategy (2008-2012). According to Energy Sector Policy 2008, the government sets the target of electrification rate by 2025 as follows.
• 100% of the urban and peri-urban population • 45% of the rural population
As described in the chapter 7.2 Natural and Social Environment in the Target Area, there are two main environmental and social concerns regarding the renewal, reinforcement and extension of the distribution lines. The first one is to avoid or mitigate adverse impact on the protected areas and its flora and fauna and the second one is to avoid or minimize involuntary resettlement. (1) Options for Distribution Network Route in Western Area Firstly, three options will be compared to determine the route of distribution lines for renewal, reinforcement and extension in the whole Western Area. 1) Without Option
This will not give any adverse impact in Western Area. But, the target in PRSP (2008-2012) and the Energy Sector Policy will not be met. This option also means most of people in Sierra Leon will have no power supply as basic infrastructure, nor will economy grow. NPA has many problems, but one of them is insufficient capacity of the distribution lines. Even if the capacity of electricity generation increases, electricity energy will be lost during transmission and distribution without reliable line capacity and network. 2) Only North to East Part of the Peninsula Option Large-scale settlements can be seen mainly along the road connecting from the north to east. And, as it can be seen in Fig. 7.2-3 Western Area Peninsula Forest Reserve, western part of the peninsula is covered by WAPF. So, the second option is to renew, reinforce and extend the distribution lines only in the north-east part of the peninsula. Again, this plan cannot meet the target of the government. And, this plan will miss a chance to develop tourism, such as eco-tourism, utilizing the beauty of nature along the coast and the forest in the west. Importance of tourism development is now recognized. Tourism development has been newly added as a topic in PRSP (2008-2012). Power supply is required for tourism development, especially for hotels and restaurants. In addition, there are fishing villages along the coastal line in the west. They use fuel wood to smoke fish as they do not own refrigerators or freezers, which cannot be used without cheap and stable power supply. Smoking consumes fuel wood, and this causes more deforestation in the forest. Stable power supply enables people to preserve or process fish and to have more stable income.

7-30
3) Around the Peninsula Option (Ring Trunk Network) This option is to renew, reinforce and extend the distribution lines around the peninsula. It can increase the electrification rate and stability of electricity supply by making a ring network in case of accident. But, this plan means the lines run near the two protected areas. It was confirmed by a field survey that some ROW of the roads for public infrastructure and expansion of roads is secured (not always all ROW is secured as planned). If the distribution line is erected along the existing road, no mangrove cutting is required in the Sierra Leone River Estuary as the road runs away from the mangrove forest and there is certain distance from the road to the mangrove swamp. However, Sierra Leone River Estuary is an important wetland for birds. Mitigation measures to avoid electrification of birds should be taken. As for WAPF, if we follow the original boundary, the existing road runs along the boundary in many parts in the south-west. But the road runs inside WAPF only around the branch point to go to Kent. But if we see the forest extent from the satellite image in 2006 as in Fig. 7.2-3, the boundary has been moved to the mountain side away from the road. But in some parts such as River No.2 and Black Jonh Son, the forest has expanded across the road toward the coastal line. The existing road running in the southern peninsula from Tokeh through York, Jonh Obey, Tombo to Waterloo is already paved with two lanes as in the next picture. The road runs on the foot of the hills, so both sides of the road is cleared in most of parts. To erect distribution line along this road will not require large scale tree cutting nor give serious impacts to the forests and its biodiversity. But, mitigation measures need to be taken as explained in the next part to minimize the impacts.
Road near York (This paved road runs from Tokeh to Waterloo)
The part from River No.2 to Tokeh was a concern because the existing road is very narrow and runs through the forest. But, Sierra Leone Road Authority (SLRA) is now constructing a new road near the coastal line. Using this road will not require tree cutting. Only where enough ROW is not secured, it may need to cut some trees, branches or bushes. SLRA is now also constructing a paved road from Lumley to Tokeh with 15m ROW on each side. As for involuntary resettlement, some people have constructed structures in the ROW. The Ministry of Lands, Country Planning and the Environment and SLRA are now cooperating to demolish all illegal structures in ROW and compensate them, in particular from Lumley to Sussex, and Wellington to Koya. The SLRA intends to secure ROW for the future expansion of the roads, and wants public infrastructure installed on the edge of ROW. But, if it is difficult, public infrastructure can be installed in ROW. In this case, there is a possibility that existing structures will be on the planned route of distribution lines. But resettlement can been avoided and mitigated by determining the location of each pole carefully as the second RAP of the WB project decreased the number of the affected people dramatically from the first RAP by re-routing the pylon positions.

7-31
People living near the forest dependon WAPF for their livelihood. Power supply can expand their job opportunities and stop illegal activities. As a consequence, this can protect the forest and its biodiversity. But it needs a decent management plan for WAPF by the government. The Study Team proposes the third “Around the Peninsula Option (Ring Trunk Network)” among the three options, because the third option is in accordance with the policy of the government, it can contribute to economic development of the country and improve life of people, and build a ring distribution network which is able to easily back up in cases of accidents. Also it is possible mitigate expected adverse impacts by taking proper mitigation measures.
(2) Options for Distribution Network in Freetown City Secondly, two options will be compared to determine the route in Freetown. The number of slum areas is increasing as explained in the previous part. People have encroached on hill sides, bay or river areas without formal land title. The Kingtom Power station and Falcon Bridge Sub-station are surrounded by slum areas, which make it difficult to erect distribution facilities. People engage in small trading or retailing along the narrow streets especially in the downtown, where the Kingtom Power station and Falcon Bridge Sub-station are located. In addition, encroachment within ROW is common. ROW of road or street is set 5-7.5m on each side from the centre. But ROW is often not secured because of congestion of the city. People have their houses or small shops within ROW. The renewal, reinforcement and extension of the lines may require involuntary resettlement of them. Resettlement of slum dwellers in the big slums is a big challenge. Thus, it is necessary to determine the route which can minimize involuntary resettlement. 1) Rehabilitate Only the Lines which Need Emergency Rehabilitation Option
This option can avoid resettlement at minimum. But even now, the fragility of the network increases the workload of NPA workers because the weak network system causes many accidents. And hundreds people are always on the waiting lists to be connected. 2) Ring Trunk Network Option
This option is to develop a ring network in Freetown to increase the reliability of power supply. This option can contribute to meet the target set by the government, 100% electrification rate in urban area by 2025. There is a possibility of occurrence of involuntary resettlement, as the city is very congested. Necessary mitigation measures should be considered. There are several mitigation measures. One measure is to use high towers instead of normal electric poles for distribution lines and stretch the lines over the crowded area. Especially in slum areas near bay or river, the line will be over the slums (over across river or bay) rather than by locating poles along the slum area on the ground. Even if this measure is taken, people in slums can still connect to electricity from secondary sub station nearby. Secondary, careful determination of location of each pole can decrease the number of affected people. The next option is to use marine cable along the coastal line. This can avoid involuntary resettlement especially in the most congested area along the northern coastal line, but the cost of marine cable installation is much higher than overhead line. The northern costal area is not an important marine site. No coral reefs have been observed before. No threatened marine animal species have been observed near the coast. Therefore, it is though that marine cable will not give adverse impact to the marine environment. However, enough data on marine animals and plants are not available. To conduct a survey on marine animals and plants is needed before installation.
The Study Team proposes the second option “Ring Trunk Network Option” between the two options. The current distribution network is so old that many accidents happen. To make matters worse, the

7-32
response to such accidents is temporary repairs and this has resulted in high distribution loss. The distribution loss is one of the reasons for the NPA’s bad financial condition. This is the reason we propose a ring trunk network, which is able to back up in case of accidents and to increase electrification ratio. Regarding involuntary resettlement, it is considered that mitigation is possible if necessary measures explained above are taken. As the population of Freetown is increasing, if a plan of renewal, enforcement and extension of a distribution network is postponed, resettlement will be more complicated. 7.5.2 Plan for Rehabilitation, Reinforcement and Extension of Distribution Lines Based on the SEA, the study team proposes the distribution network as is shown in Fig. 6.3-3 and Fig. 6.3-4. Fig.6.3-3 shows the routes of 33kV lines in Western Area. Basically, distribution lines are to be constructed along the existing road network except the urban area. Only for a vertical part from Lampa to Fogbo, the road is unpaved and narrow, running from village to village. The road running along the western coast laps over the boundary of WAPF in some parts. The road is quite wide and paved, so expected adverse impacts will be mitigated with proper mitigation measures. The road runs through mountains from Regent and Jui. The area is not in WAPF but surrounded by forests. Therefore, it is necessary to take mitigation measures. Since Jui is adjacent to mangrove forests, the location of a new substation should be carefully decided. Fig.6.4-4 shows the routes of 33kV lines in the urban area. The routes were determined to avoid densely-populated areas as much as possible in order not to resettle people involuntarily. The Study Team proposes the use of marine cable from Kingtom power station to Falcon Bridge sub station, a part of from Falcon Bridge sub station to Blackhall Road sub station as there are many slums along the northern coastal line and the area is very congested because of proximity to the centre of the town. The distribution line from Wilberforce to Goderich was originally planned to take a route along the coastal road, but the distribution line has to run through densely-populated areas and congested commercial areas by taking this route. Thus, the route has been changed to the hill side. Although the planned area on the hill is already developed as a housing area, some parts are in the original boundary of WAPF. It is necessary to consult with the Forestry Division whether they have any forestation plans before detailed design. There was no concrete forestation plan near the planned route during the Study. (1) Adverse Environmental and Social Impact Identified Adverse environmental and social impacts identified for the planned substations, transmission and distribution lines can be summarized in the next table. The natural and social environment in the target area and the current conditions of the existing substations and distribution lines were considered to identify the impacts. Regarding the transmission line from a new hydro dam to Western Area, the route is not determined in this Master Plan. Therefore, general impacts are assessed.

7-33
Table 7.5-1 Assessment of Adverse Environmental and Social Impact for Substations, Transmission and Distribution Lines
Assessment Results Evaluation Items
General Construction
Stage Operating
Stage
Expected Environmental and Social Impact
Involuntary Resettlement B B C
Construction of a substation (50m×50m) and transmission and distribution lines require land acquisition. The congestion and existence of big slums in Freetown and encroachment in ROW of roads in the whole Western Area raise a concern of involuntary resettlement.
Local Economy, Employment and Livelihood
B B C
There are many small shops along the streets in Freetown. The construction of distribution lines may require them to relocate or affect their livelihood.
Use of Land and Other Local Resources B B C
It is necessary to acquire land for substations and transmission and distribution lines.
Social Institutions such as Social Infrastructure and Local Decision-Making Institutions
C C C
Existing Social Infrastructure/Services C C C
The Poor, Indigenous of Ethnic People C C C
Misdistribution of Benefit and Damage C C C
Cultural Heritage C C C Conflict of Local Interests
B C B There is a possibility of conflict of local interests between electrified and non-electrified areas.
Water Rights and Rights of Common C C C
Public Health C C C
Soci
al E
nviro
nmen
t
Infectious Diseases C C C Topographical and Geographical Features C C C
Soil Erosion
B B C
Construction of substations and transmission and distribution lines may cause soil erosion by site preparation and cutting tree.
Groundwater C C C Hydrogeological Conditions C C C
Nat
ural
Env
ironm
ent
Coastal Zone
B B B
Sierra Leone River Estuary, a wetland registered in the Ramsar Convention is located in north-east of the peninsula. The extension of distribution lines in this area may give some impact.

7-34
Assessment Results Evaluation Items
General Construction
Stage Operating
Stage
Expected Environmental and Social Impact
Flora, Fauna and Bio-Diversity
B B B
Distribution lines run near Western Area Peninsular Forest Reserve and Sierra Leone River Estuary, which may give some impact on flora, fauna and biodiversity. Transmission lines from a new hydro dam might pass through forests.
Meteorology C C C Landscape
B C B Transmission/distribution lines may not harmonize with the scenery.
Global Warming C C C Air Pollution C C C Water Pollution C C C Soil Contamination
B C B Oil leak from transformers at sub stations may happen.
Waste B B B
Insulating oil in old transformers may contain Poly Chlorinated Biphenyl (PCB).
Noise and Vibration C C C Ground Subsidence C C C Bad Odour C C C Benthic Sediment C C C Accidents
B C B
There are many structures under the unused existing power distribution lines. There is a risk of accidents to the public if electricity is turned on. Safety rules and maintenance methods are not usually observed at NPA. There is a risk of accidents to NPA workers and the general public.
Pollu
tion
Electromagnetic field C C C Rating A: serious impact is expected B: some impact is expected C: minimum or hardly any impact is expected [Source] JICA Study Team (2) Mitigation Measures To mitigate the expected impacts in the table above, the following measures are recommended to take. 1) Involuntary Resettlement
Routes of transmission and distribution lines and location of each electric tower (pylon) and pole should be carefully determined to avoid unnecessary involuntary resettlement when overhead line is used. High towers for the distribution lines should be used in the crowded areas in Freetown to minimize resettlement.
For the peninsula, distribution will be basically along the existing road. However, people have

7-35
encroached within ROW of the road. ROW is controlled by SLRA. SLRA intends to secure ROW and to have electric poles on the edge of ROW, but it is not always possible due to the existence of structures in ROW. If the distribution lines happen to be within ROW, consultation with SLRA is needed to avoid involuntary resettlement.
It is ideal to secure ROW of transmission and distribution lines, and to have no structures under the line. But to avoid involuntary resettlement, the safety clearances limit, i.e. “the distance from the lowest conductor to a roof top of a structure,” has been adapted in Sierra Leone by the World Bank assisting projects. This is 7m for 161kV line, and 5m for 33kV line which is consistent with European and American safety standards. If it is possible, ROW should be secured. But if it is difficult, this safety clearance limit can be applied. Marine cable can avoid involuntary resettlement in the most congested areas in Freetown, although the installation costs are higher than for overhead line and marine survey is needed. As in the case of WB 33kV RAP, even though the plan was made, it was not implemented because the government did not provide its counterpart funding. Considering the financial capability of the government to provide funds for resettlement is low, resettlement should be avoided and minimized as much as possible. 2) Local Economy, Employment and Livelihood
Many people in Freetown are engaged in the service sector, in particular, petty trading. So along the streets, many small shops can be seen. If relocation of those small shops is needed, compensation should be paid or assistance for income generation should be given to them. 3) Use of Land and Other Local Resources
In case the NPA needs to acquire land, it should choose land which has least impact and avoid acquiring land inside the protected areas in consultation with the Ministry of Lands, Country Planning and the Environment. 4) Conflict of Local Interests
The government and the NPA should disclose the electrification plan to the public to gain their understanding. 5) Soil Erosion
As for the distribution lines, if the lines go along the existing roads, there will be minimum tree cutting. For site preparation of substations or electric towers, survey of geological condition should be conducted to take necessary measures to avoid soil erosion. 6) Coastal Zone
As far as the new distribution lines run along the existing road, which run with certain distance from the wetland, there will be minimum adverse impact. For the future secondary distribution lines to the new points, the lines should also along the existing roads not to cut down mangrove trees or any other plants in the future. A substation should be constructed away from the mangrove swamp. 7) Flora, Fauna and Bio-Diversity
To avoid interference to threatened species of animals and plants in WAPF and the Sierra Leone River Estuary, substations will not be constructed inside WAPF and in Sierra Leone River Estuary.

7-36
The distribution line should be along the existing roads to avoid going deeper in the protected areas. According to the Forestry Division, it is acceptable to extend the distribution lines along the existing road although one part of the road passes inside the original boundary of WAPF, unless the line goes across WAPF without following the existing roads. The existing roads run along the foot of hills, so they will not have serious adverse impact on flora and fauna. However, as overhead transmission/distribution facilities (lines, poles and conductors) give negative impact on birds, such as electrocution and collision3, necessary measures should be taken. Large birds with long wings, particularly raptors and storks, are most vulnerable to electrocution, because they roost and nest on power poles. Even small birds only 25cm in height can be threatened. A threatened bird species, Falco naumanni (Lesser Kestrel) and Scotopelia ussheri (Rufous Fishing –owl) which are believed to have their habitat in Western Area are vulnerable to electrification. In particular, badly designed medium voltage (1kV to 60 kV) power poles pose a risk of electrocution. The best way to avoid electrocution of birds is to use underground cables. But this is costly, so another option is firstly to consider how to attach insulators on power poles, for instance to avoid upright insulators on power poles and use suspended insulators, to use insulting caps, or to insulate power lines with tubing. The second measure is to keep safe distance between power cables and other energized and grounded parts. It is recommended to keep the distance of 140cm between conductors, and 60cm between a perch site and energized elements. The third option is to take measures to stop birds roosting on poles or install platforms for birds to perch on power poles in a safe place. These measures can also prevent bird-caused electrical outages. Big birds, particularly migratory birds flying at night, are most vulnerable to collision with power lines of all voltages. Although there is no threatened big migratory bird species reported to have their habitat in Western Area, the best way to avoid collision of birds again is underground cables. The next option is to increase power line visibility to birds. It is recommended to conduct a detailed bird survey to know their flying routes to take above measures in necessary areas. Other animals which are at risk of electrocution are primates, who climb power poles and use the poles as pathways to move in forest. One solution to avoid electrocution is to trim branches giving access to power lines. Next one is to attach some contrivances which prevent primates to climb the poles such as barbed wires. Again, it is recommended to conduct a habitat survey. Marine cables give adverse impacts on coral reefs. It is reported there are no coral reefs in the planned northern coast of the peninsula. But it is necessary to conduct a survey before installation. 8) Landscape
Transmission/distribution lines should be designed in an environmental conscious manner. 9) Soil Contamination
Oil leaks can be observed in the existing substations. Oil retaining bands or pits should be installed around transformers. And the earth surface should be covered by concrete to avoid penetration of oil to the ground. Then, an adequate operation and maintenance system for substations should be established.
3 For details of the negative impacts, refer to “Position Statement on Birds and Power Lines” by BirdLife
International. For mitigation measures, refer to Caution: Electrocution- Suggested Practices for Bird Protection on Power Lines” by Dieter Haas & Markus Nipkow, NABU.

7-37
10) Waste There is no regulation on PCB disposal or treatment facilities in Sierra Leone. Thus, the NPA, as a generator of waster, should safely store the old transformers in a properly controlled storage for the time being as a temporary solution, and establish a safety handling procedures to protect NPA staff. And it is desirable to establish a recycling system as recyclable waste will be discharged after renewing the distribution line. 11) Accidents
To avoid electrocution or fires caused by distribution facilities, to keep minimal safety clearance between the line and structures is needed. Also to enhance safety factors of distribution line is needed. The current safety rules should be followed by the NPA. The NPA should raise awareness of people on potential accidents.
7.6 Stakeholder Consultation The Study Team held three workshops to listen to opinions from stakeholders and reflect their opinions in this Master Plan. The Study Team explained the expected environmental and social impacts caused by the Master Plan and mitigation measures for the impacts in the workshops. Several opinions raised in the workshops are summarized below. The opinions were examined in the Master Plan. (1) The First Workshop to Present the Inception Report This workshop was held on December 3, 2008 with 40 participants. Representatives from the former Ministry of Power and Energy, the NPA, the Ministry of Finance and Economic Development, the National Commission for Privatisation, donors, and the media attended the workshop. Several comments on electricity tariff were offered from the NPA. They understood that the generation costs were high so that it was difficult to make a profit. So they continued that the demand for renewal of the power plant and introduction of another hydro power station was high. (2) The Second Workshop to Present the Interim Report This workshop was held on February 5, 2009 with 41 participants. Representatives from the former Ministry of Power and Energy, the NPA, the Ministry of Finance and Economic Development, the Environmental Protection Agency, the Forestry Division under the Ministry of Agriculture and Food Security, donors, the private sector, and NGOs (environment and rural development) attended the workshop. A private bio energy company commented that it was essential to develop capacity of the NPA and the Ministry of Energy and Power. The NPA commented that the Study needed to consider renewable energy, and it wanted to contribute to economic development in rural areas through rural electrification, using money gained from collection of arrears. (3) The Third Workshop to Present the Draft Final Report This workshop was held on August 5, 2009 with 50 participants. Representatives from the Ministry of Energy and Water Resources, the NPA, the National Commission for Privatisation, the Freetown City Council, donors, NGO, the private sector, and the media attended. An environmental NGO commented that the NPA should implement the Master Plan while they protect the environment, taking the mitigation measures presented. In addition to the workshops, the Study Team exchanged information with concerned organizations from time to time. In particular, exchange of information and opinions with the Forestry Division

7-38
which is in charge of protection of the natural environment and the Ministry of Lands, Country Planning and the Environment which is in charge of land acquisition was often done and the results were referred to in formulating the Master Plan. 7.7 Recommendation for Environmental and Social Considerations in the Future 7.7.1 Important Points in the Next Step of Feasibility Study or Project Implementation This Master Plan presents the plans of power development and renewal, enforcement and extension of distribution lines from now on. To implement the Master Plan, in the next step, feasibility study or project implementation, it is necessary to consider the following points. (1) To Avoid Involuntary Resettlement Involuntary resettlement has to be avoided as much as possible since the financial capacity of the government to pay such costs is very weak. Thus, routes or height and position of pylons and poles for distribution lines need to be carefully considered, and the location of a power plant and dam is also carefully considered. (2) To Conduct Environmental Survey There are forest reserves and mangrove swamps in Western Area, and the possibility that endangered species live there is very high. It is necessary to conduct survey on the protected areas and its ecosystem, and then consider mitigation measures again after the current conditions become clear. As for a new dam, it is necessary to start field survey at an early stage and collect basic information as there are no data on the environment in rural areas. (3) To Have Enough Time and Budget for Study Unfortunately, there are few reliable data in Sierra Leone. It is not realistic to depend on only the existing data. Data on protected areas and ecosystem for environmental protection are necessary, for example, population data or accurate maps for resettlement. Therefore, it is necessary to have enough time and budget to conduct field survey and collect necessary data. (4) To Work with the Forestry Division, NGOs, etc. in a Coordinated Manner The Forestry Division under the Ministry of Agriculture and Food Security is implementing the project to protect WAPF assisted by a donor, and there is a forestation plan in some areas in WAPF. It is necessary to obtain update information before the start of projects in Western Area. Local environmental NGOs have more detailed information on protected areas and ecosystem through their activities than the government. It is worth cooperating with them. 7.7.2 Recommendations to NPA on Environmental and Social Considerations (1) Current System of Environmental and Social Considerations in the NPA The NPA does not have an organizational and institutional framework for environmental and social considerations, which are needed before the NPA starts a new project. Nor does the NPA have environmental management system to monitor and manage their activities. There is no department or section to deal with environmental and social issues. A safety specialist under the safety division of the technical department is also assigned as an environmental officer. An acting commercial director under the customer services section of the commercial department is assigned as a social/resettlement officer. Except for these two officers, no one has been involved in environmental and social considerations.
7-39
There is no environmental department or division. So when the officers in charge have some problems, they consult with the deputy general manager. As there is no formal organizational structure to deal with environmental and social issues, no budget is available. When they need budget for their work, they request to the general manager, but the weak financial standing of the NPA hinders allocation of money. The two officers do not have enough formal background in the field of the environment and social considerations. No training has been organized in the NPA. Therefore, they have been learning through their works and acquire necessary knowledge from practical experiences As for the environmental officer, he helped an environmental audit study of the Kingtom PowerStation done by a German consulting company funded by the World Bank in 2004, which was his first experience. Then he participated in a study to prepare EIA for 33kV line done by a Ghanaian consultant company under the Power and Water project of the World Bank in 2004. He prepared a simple EIA for a mini hydro dam in 2008. That’s all his experience as an environmental officer As for the social/resettlement officer, he had the first experience when the RAP for 33kV line under the Power and Water Project of the World Bank was prepared in 2004. This was led by the World Bank and international consultants were hired to conduct the study. The RAP was revised and updated in 2007, and he was also involved in the study. And he is now supervising the implementation of the RAP. Even though the two of them participated in the projects above, the role of them was still limited because it was not the NPA who took initiative but it was the World Bank and the consultants. The two officers think their knowledge and capacity are not adequate enough to carry out their work. The workload of their main posts makes it difficult for them to concentrate on their secondary posts of the environmental and social/resettlement officers. In the first place, there are no environmental regulations or standards in Sierra Leone which regulate the activities of the NPA. The NPA does not have an environmental management system or plan. Consequently, environmental monitoring has never been conducted at the only Kingtom power station. No monitoring equipment or budget has been available. As well, waste management and cleaning of the power station or substations are not carried out. Waste management has not properly been handled, and a harmful waste such as waste oil is discharged without proper treatment to the sea. All kinds of wastes are discharged to the landfills, which have no facilities to separate wastes. The ground of the power plant is contaminated by waste oil or leaked oil. Substations are also contaminated by leaked transformer oil and several types of waste are scattered in the substations.

7-40
(2) Recommendation It is recommended that NPA introduce an environmental management system. The “Plan, Do, Check and Act management cycle” is often used.
[Source] JICA Study Team
Fig. 7.7-1 PDCA Cycle
Table 7.7-1 PDCA Cycle Plan To develop environmental policy, set environmental targets and prepare an
environmental management plan Do To implement the plan to protect the environment Check To monitor and evaluate the results of actions regularly Act Review the original plan for improvement
[Source] JICA Study Team To operate this management system, the following steps will be needed. 1) Establish an environmental unit It is ideal to have an environmental department consisting of several qualified staff in the future. But it is not feasible to create this kind of environmental department from the current condition of the NPA. As a first step, it is recommended to create an environmental unit under the direct supervision of the general manager in order to deal with the environmental and social issues seriously as an authority. This unit consists of at least two environmental officers and two social/ resettlement officers. They work with all the other concerned departments. TOR of the officers is as follows. It is encouraged to hire new staff who have basic knowledge and qualifications.
Plan
Action
Check
Do

7-41
Table 7.7-2 TOR of Officers TOR Environmental officer ・Develop an environmental policy
・Set internal environmental targets ・Prepare an environmental management plan ・Conduct EIA or contract out EIA and supervise it ・Organize training for NPA staff ・Conduct the environmental monitoring ・Analyze the results of the environmental monitoring ・Report the results to the management ・Take necessary counter measures ・Coordinate with concerned ministries and agencies ・ Supervise activities of and coordinate with other
departments, especially the generation division and transmission & distribution division
Social and resettlement officer
・Develop a land acquisition and resettlement policy ・Conduct EIA or contract out EIA and supervise it ・Prepare a resettlement action plan or contract out the plan
to consultants and supervise them ・Coordinate with donors ・Coordinate with concerned ministries and agencies for
land acquisition and resettlement ・Give information to the public and negotiate with project
affected people ・ Report the progress of land acquisition and
implementation of a resettlement action plan to the management
[Source] JICA Study Team One officer each in the transmission and distribution division, generation division and the power stations should be assigned as the person in charge of the environment and supervise their activities in each office.
[Source] JICA Study Team
Fig. 7.7-2 Organization Chart of NPA
General Manager
Deputy General Manager
Corporate Planning
Department
Commercial Department
Administration Department
GenerationDepartment
Finance Department
EnvironmentalUnit
Social/ Resettlement Officer
Environmental Officer
Transmission & Distribution Division
Generation Division
Person in Charge of the Environment
Person in Charge of the Environment

7-42
2) Develop environmental policy and management plan The environmental officers in collaboration with the management are expected to develop an environmental policy of the NPA. Then minimal environmental targets will be set and management plan will be developed. Although no national environmental standards are available, the NPA should develop an internal reference by referring to environmental standards of international organizations, developed counties or neighboring countries. It is important to set the feasible targets to the NPA, which has no experience of environmental considerations and monitoring. The environmental management plan should include environmental pollution control measures for and monitoring plan of power plants, environmental and social monitoring plan for distribution lines, waste management plan and chemical control plan. In the future when the NPA has a hydro plant, it is expected to monitor environmental and social impacts of the hydro plant. Harmful wastes, such as oil or chemicals, should be collected separately and discharged in a proper manner. Since no landfill or treatment facilities for industrial wastes exist in Sierra Leone, the NPA as the generator of wastes should take adequate measures. In addition, to develop an EIA guideline to help NPA officers to assess environmental and social impacts of a new project is badly needed since the NPA will implement many new projects in the coming years. It is believed that donors will fund those projects. Thus, it is required to study the guidelines of donors and explain them in the the NPA EIA guideline. In particular, the standards of donors for resettlement are more favorable to project affected people than the national law. This NPA guideline for EIA should include a part for resettlement. 3) Allocate necessary budget A budget to take action for environmental protection needs to be secured. The budget should include not only recurrent cost of the environmental unit, but also the procurement costs of necessary equipment, costs of environmental monitoring and so on. As the NPA’s financial status is very weak, it is difficult to allocate budgets. But this is necessary cost that the NPA should bear to protect the environment. 4) Procure monitoring equipment
The NPA does not have any monitoring equipment. So it is recommended to procure monitoring equipment as follows for the thermal plant.
・ Gas emission monitoring equipment (NOx, SOx, dust) ・ Noise emission monitoring equipment ・ Vibration monitoring equipment ・ Water quality monitoring equipment
And a laboratory at each power plant is expected to be created for monitoring purposes. When the NPA has a hydro power plant, it is necessary to buy additional monitoring equipment. 5) Participate and organize training It is required to give a chance to take technical trainings for the environmental officers and social/ resettlement officers to equip advanced knowledge. A seminar or training on EIA or environmental monitoring is recommended for an environmental officer. A seminar or training to learn other cases of resettlement, EIA or social-economic survey is recommended for social/resettlement officers. And environmental education training to all the NPA staffs to raise their awareness should be held. The current environmental disaster in the power plant is caused partly by poor operation and

7-43
maintenance practices. To train the workers how to operate and maintain the generating facilities and incidental facilities is also needed. 6) Monitoring, reporting and evaluation Monitoring according to the environmental management plan should be conducted and reported to the management regularly. Monitoring should cover
1. Gas emission 2. Noise emission 3. Vibration 4. Water quality 5. Waste 6. Soil contamination 7. Ecosystem
In case of a project which needs involuntary resettlement of people, monitoring of the progress of rebuilding of lives of project affected people even after the construction stage is needed. The results of the monitoring are compared to the targets set by the environmental management plan and evaluated. If the results are not satisfactory, necessary measures should be taken. Introduction of this environmental management system is to improve the operation structure of the NPA in order to take environmental and social issues into consideration.