performance improvement of airflow distribution and ... · performance improvement of airflow...
TRANSCRIPT
Performance improvement of airflow distribution and contamination
control for an unoccupied operating room F.J. Wang1,*, T.B. Chang2, C.M. Lai3, Z.Y. Liu1
1Department of Refrigeration, Air Conditioning and Energy Engineering, National Chin-Yi University of Technology, Taichung, Taiwan. 2Institute of Energy Engineering, Southern Taiwan University, Tainan, Taiwan. 3Department of Civil Engineering, National Cheng Kung University, Tainan, Taiwan. ABSTRACT
The HVAC systems for operating rooms are energy-intensive and sophisticated in that they operate 24 hours per day year-round and use large amount of fresh air to deal with infectious problems and to dilute microorganisms. However, little quantitative information has been investigated about trade-off between energy-efficient HVAC system and indoor environment quality especially when the operating room is not occupied. The objective of this study is to present the field measurement approach on performance evaluation of the HVAC system for an unoccupied operating room. Variable air volume terminal boxes were conducted to verify the compromise of energy-saving potential and indoor environment parameters including particle counts, microbial counts, pressurization, temperature and humidity. Field measurements of a full-scale operating room have been carried out at a district hospital in Taiwan. Numerical simulation has been applied to evaluate the air flow distribution and concentration contours while conducting the velocity reduction approach in the unoccupied operating room. The results reveal that it is feasible to achieve satisfactory indoor environment by reducing the supply air volume (or velocity) in the unoccupied operating room. Optimal face velocity of HEPA filter and percentage of damper opening for the variable air volume terminal boxes could be obtained through compromising of indoor environment quality control and energy consumption.
KEYWORDS Operating room, Airflow simulation, Variable air volume, Field measurements INTRODUCTION
The purpose of the HVAC system for an operating room is not only to achieve thermal comfort but also to control airborne contamination. It is vital and significant to consider energy-efficient strategy as well as to achieve an acceptable performance for contaminations control. A review of distribution patterns and air movement at operating room describing the importance of airborne particles in the infectious process were provided by Pereira et al. (2005). Comparative analysis of the efficiency of microbiological control of airflow system were demonstrated to identify the control strategy that could reduce the risk of contamination in operating infection. Chow et al.
(2005) investigated the ventilating performance against airborne infection on an extra-clean operating room. They also reported that the flow velocity at the supply diffuser was identified as one of the most important factors in governing the dispersion of airborne infectious particles.
Field tests are essential to assure the operating room performs satisfactorily and achieves the contamination standards. The performance investigation for the contamination control strategy in an operating room was conducted in our previous study (Wang et al., 2010). Both numerical simulation and field measurement of a full-scale operating room were carried out comprehensively. Optimal face velocity of high efficiency particulate air (HEPA) filter could be obtained through compromising of contamination control and energy consumption. Balaras et al. (2007) reported that there were still opportunities for energy conservation without sacrificing overall thermal comfort through the summarized field test data of indoor thermal conditions from 20 operating rooms. Besides, the common variable air volume (VAV) system was based on the constant static pressure in the main duct and the VAV units including the controller, air flow measureing equipment and the dampers. The fundamentals for a pressure controlled VAV system design which took good indoor environment, and energy efficiency into account were presented comprehensively (Engdahl et al., 2003).
Computational fluid dynamics (CFD) techniques were used routinely to predict airflow patterns and distributions of temperature and concentration for indoor environments (Sorensen et al., 2003). Wang et al. (2009) improved airflow distribution for cleanroom configuration using CFD simulation. Some options under a limited budget were identified with less trial-and-error effort when modifications of clearooms had to be conducted. Besides, Zhang et al. (2008) conducted the investigation of biological contaminant control stratgies under different ventilation models in the operating room by using CFD simulation. Results showed that improving airflow distribution could reduce particle deposition on certain critical surface. Furthermore, Chow et al. (2005) investigated the effect of medical lamp position and diffuser supply velocity on ventilation performance in an operating room. The dispersion of infectious particles from both surgical staff and patient was simulated through CFD analysis as well.
Although many researches have been done on field measurement as well as for CFD simulation for operating rooms, little quantitative information was available on compromise of indoor environment quality and energy saving potential especially when the operating room was not occupied. In this study, the field measurement approach on performance evaluation of the HVAC system for an unoccupied operating room will be investigated. Fan-powered variable air volume terminal boxes were conducted to verify the compromise of energy-saving potential and indoor environment parameters including particle counts, microbial counts, pressurization, temperature and humidity.
HVAC SYSTEM DESCRIPTION
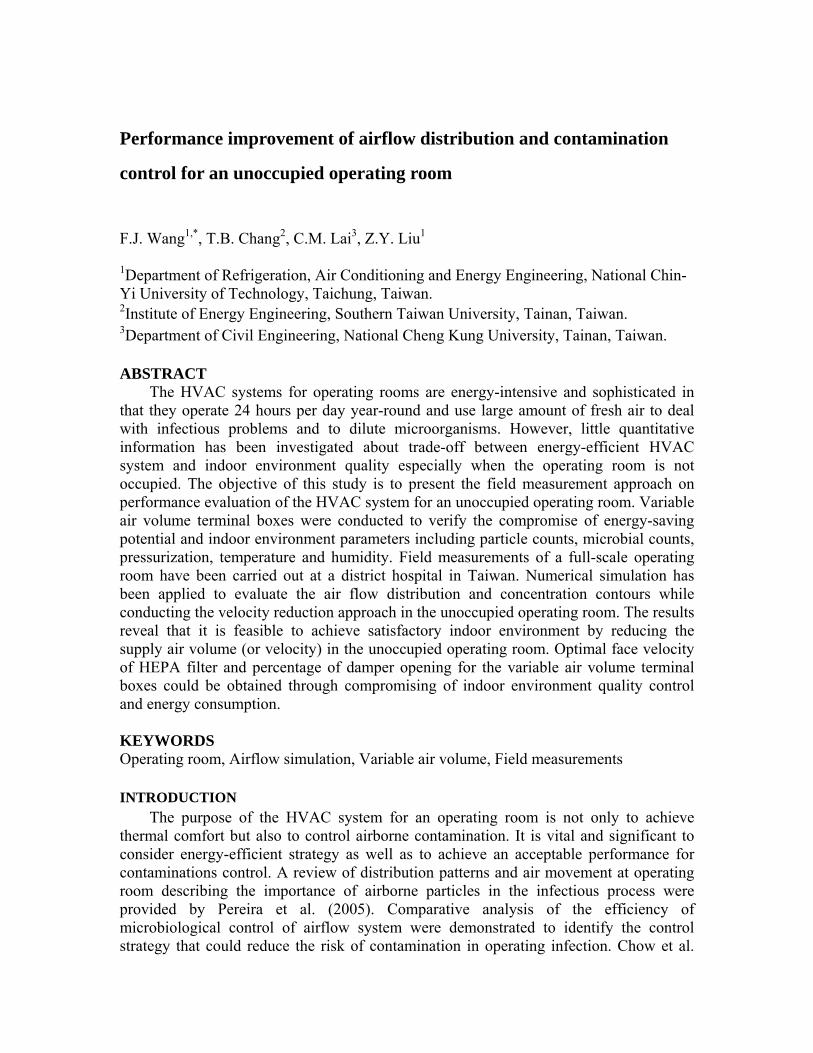
The schematic diagram of HVAC system for the investigated operating room area is shown in Figure 1. There are 9 operating rooms which connected to an air handling unit (AHU) through main duct at 3rd floor of the hospital. Supply air flow from AHU is provided to each branch duct of the operating room. Fan-powered VAV terminal box is equipped at each branch duct to regulate the thermal environment requirements for the operating rooms. The opening percentage of regulating damper is modulated according to
the set point of operating room under various cooling load condition. An variable speed driven fan of the AHU is equipped to provide energy-saving operation specific for various operating room occupancy. The inverter of supply fan can be regulated based on the static pressure sensor installed at the outlet of AHU in the main duct system.
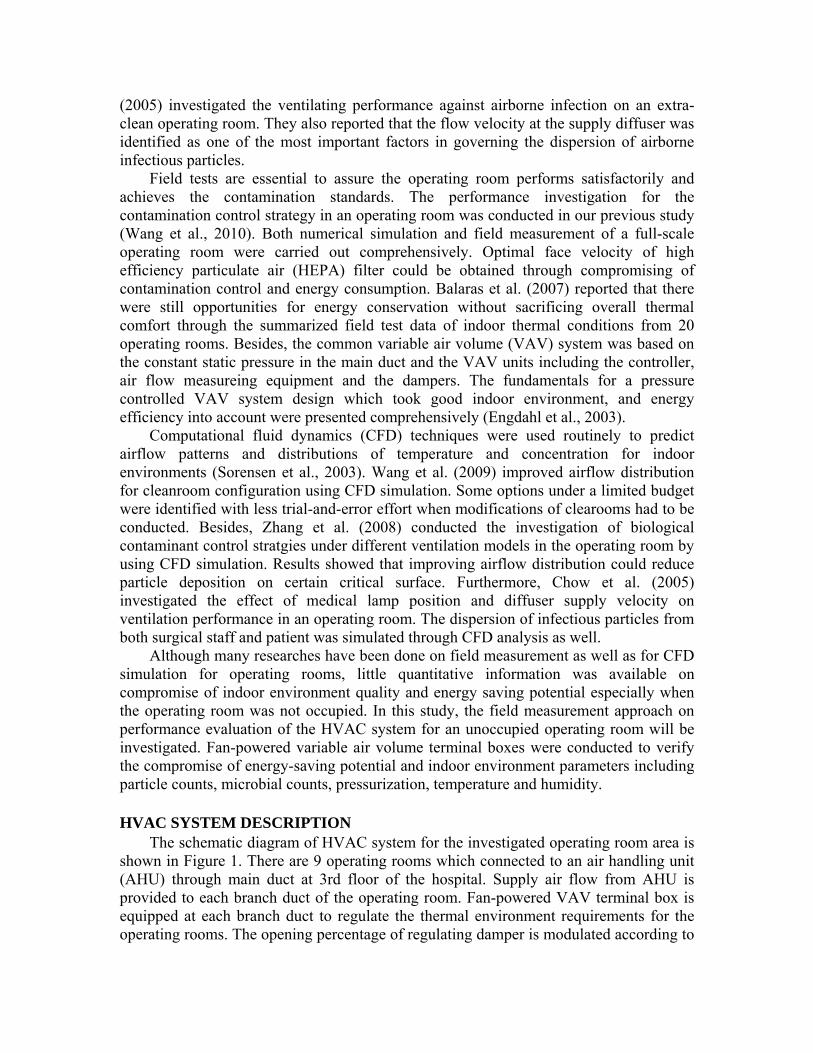
The layout of the investigated operating room is shown in Figure 2. The dimension of the operating room is at length of 6.0m, width of 5.1m, and height of 3.0m respectively. The investigated operating room with cleanliness level 10,000(ISO class 7) is equipped with 6 pieces of high efficiency particulate air(HEPA) filters at the filtration efficiency over 99.97% (above 0.5μm). The supply air coverage area at the dimension of 3.8m×2.4m consists of 6 pieces of HEPA filters with a medical lamp located at the center of HEPA filter coverage at the dimension of 0.6m× 0.6m for lamp holder. Specified design condition for the operating room temperature 22±2 , humidity 45±5(%RH) and ℃the pressurization of 6±2 Pa. The colony forming unit(cfu) for microbial counts less than 100 cfu/m³ is specified.
Figure 1. Schematic diagram of the HVAC system for operating room
Figure 2. Layout of the investigated operating room
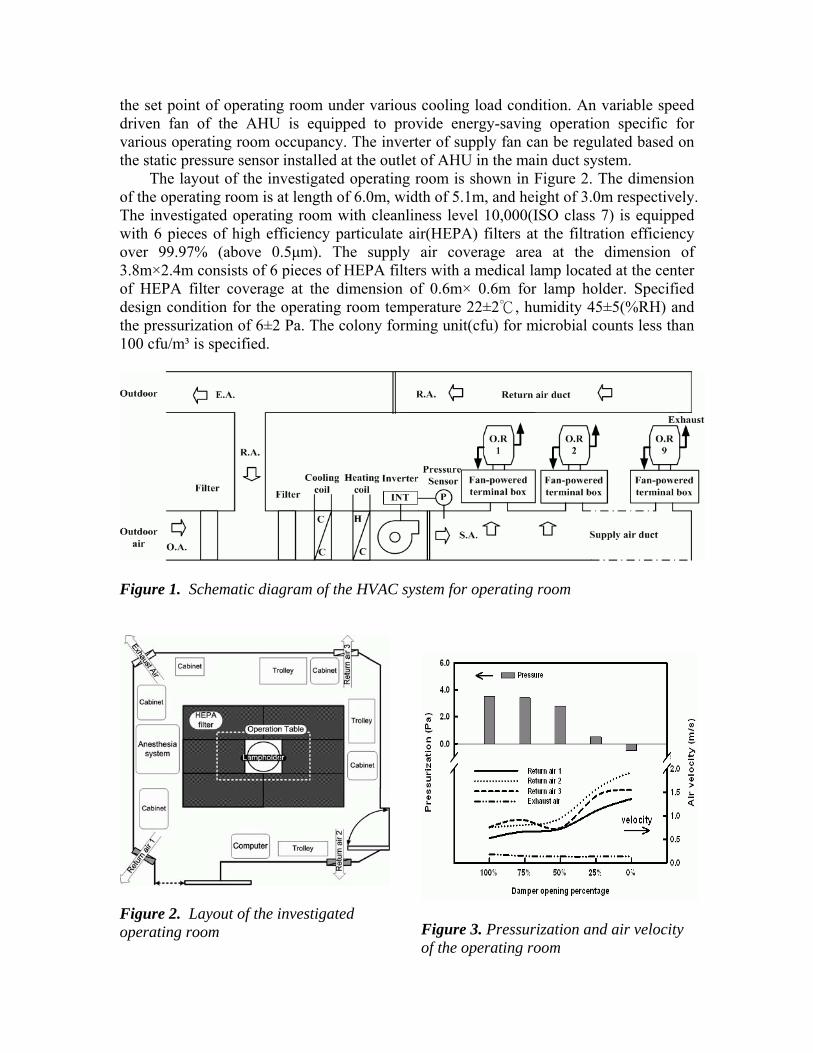
Figure 3. Pressurization and air velocity of the operating room
FIELD MEASUREMENT To examine the indoor environmental parameters including temperature, humidity,
pressurization particle count and microbial counts of this investigated operating room during unoccupied period, comprehensive field measurements were carried out at specified sampling locations. It was quite common for the HVAC system of operating room operated at full load condition even when it was unoccupied. By adjusting the opening percentage of damper for fan-powered unit, the filed measurement of energy consumption for AHU as well as the field test data of operating room were recorded simultaneously to evaluate the energy saving potential without sacrificing contamination control and indoor thermal requirement. All of the experiments were done during holiday in order not to interfere the normal operation procedure of the hospital.
The specifications of apparatus for field measurement were summarized in Table 1. The particle counts and microbial counts of ten sampling points were carried out at specified sample locations of the operating room. Quantities tests of airborne particle counts were performed with a particle counter, sensitive to particles larger than 0.5μm. Three times of measuring at each sampling location were conducted for accuracy and repeatability. The sampling flow rate for particle counter operated at 28.3 l/min with sampling period of 1 minute. Microbial counts were conducted as well with a impaction sampler. The active sampling methods impacted the microbe-carrying particles onto an agar surface with 100 liters of sampling air per minute. Bacteria were incubated for 48 hours at 35 in an incubator, colo℃ nies were counted and hence the number of colony forming unit (cfu) could be ascertained accordingly. A digital manometer was employed to monitor the pressure difference of the operating room closure for contamination control concern during conducting the face velocity reduction approach. The variation of temperature and humidity at return air grille were recorded by a multi-channel data logger with several temperature and humidity transmitters. Tests of temperature at accuracy of 0.2 and humidity at accuracy of 2% RH were performed continuously for ℃at least one hour under different measurement case. The power consumption of the AHU system was measured using a power meter with an uncertainty of 0.2% of the full scale. Table 1. Apparatus for field measurement
Apparatus Model Probe Operative range Accuracy
TSI-9555-P Anemometer and manometer 0.25 -30 (m/s) -1245-3735 Pa
1% 1 Pa
ALNOR-8386A Array anemometer 25 – 2500 (ft³/min) 3%
YOKOGAWA-MV100 PT-100 and humidity sensor 0 - 100 ( ), ℃ 0 - 100 (%RH)
0.2 , ℃2%RH
Met One-3313 Air dust particle counter 0.3,0.5,1,3,5,10 μm 5% Merck-MAS-100 Impact microbial sampling 0 - 1000(liters/min) 4% HIOKI-3169-20/21 Power meter 0 - 600 V, 0.5A~5000A 0.2% NUMERICAL SIMULATION
A commercial CFD code, STAR-CD (2001), was used to simulate the airflow distribution and concentration contour of the operating room. The governing equations
solved by STAR-CD include the three-dimensional time-dependent incompressible Navier-Stokes equation, time dependent convection diffusion equation and k-ε turbulence equations. These formulated equations can be found in the STAR-CD user’s manual (2001) as well as any CFD text books and will not be repeated here. The well-known finite control volume method with a Pressure Implicit with Splitting of Operator (PISO) algorithm was adopted to solve all the governing equations simultaneously. After solving the velocity field, the transient simulations of concentration field were conducted and concentration decay method based on mass concentration equation could be obtained accordingly.
It was assumed that the air flow field is homogenous and three-dimensional. The temperature and face velocity of the HEPA filters were measured through field tests using a multi-function hot-wired anemometer which provided reliable measurement data as the boundary conditions of CFD simulation. Furthermore, all of the boundary conditions for solution domain were clearly defined corresponding to the actual field tests data. The face velocities of HEPA filter were kept at 0.2 m/s, 0.15 m/s and 0.1 m/s and could be achieved by the on-site adjusting damper opening percentage and the frequency of inverter at field test stage. The supply air temperature was maintained at 293 K (20°C). Typically, the no-slip condition was applied on the solid walls and physical partition curtain around HEPA filter since they were not permeable. RESULTS AND DISCUSSION
As shown in Figure 3, the pressurization of the operating room kept at 3.9 Pa when the opening percentage of damper was fully opened (100%). The pressurization decreased slightly from 3.9 Pa to 2.9 Pa as the damper opening percentage decreased from 100% to 50%. However, the pressurization reduced to less than 1 Pa when the opening percentage of damper reached about 25%. It revealed the possible risk of contamination control due to pressurization failure. The wrost case scenario happened when the damper was fully closed (0%) which caused the negative pressure in the operating room. Therefore, all of the following measurements were conducted at the opening percentage above 25%. Furthermore, the face velocities of three returned air grilles and one exhaust air grille were recorded to evaluate the air flow rate of recirculating air of the operating room.
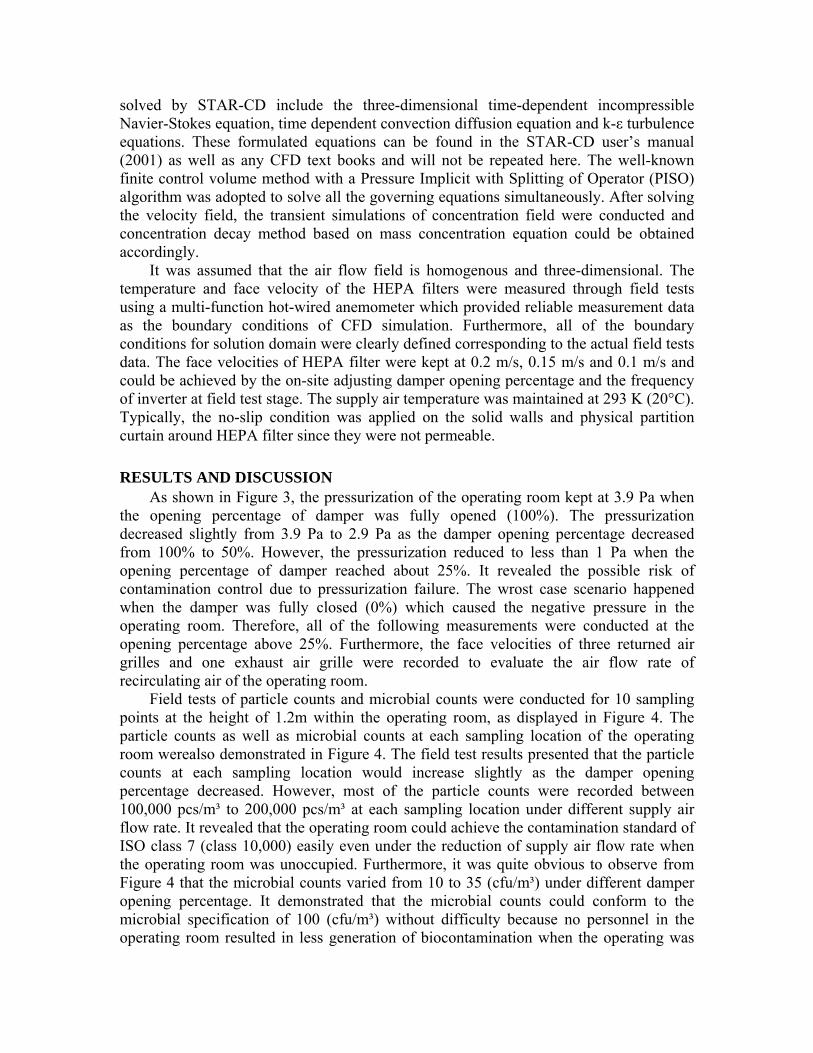
Field tests of particle counts and microbial counts were conducted for 10 sampling points at the height of 1.2m within the operating room, as displayed in Figure 4. The particle counts as well as microbial counts at each sampling location of the operating room werealso demonstrated in Figure 4. The field test results presented that the particle counts at each sampling location would increase slightly as the damper opening percentage decreased. However, most of the particle counts were recorded between 100,000 pcs/m³ to 200,000 pcs/m³ at each sampling location under different supply air flow rate. It revealed that the operating room could achieve the contamination standard of ISO class 7 (class 10,000) easily even under the reduction of supply air flow rate when the operating room was unoccupied. Furthermore, it was quite obvious to observe from Figure 4 that the microbial counts varied from 10 to 35 (cfu/m³) under different damper opening percentage. It demonstrated that the microbial counts could conform to the microbial specification of 100 (cfu/m³) without difficulty because no personnel in the operating room resulted in less generation of biocontamination when the operating was
unoccupied. The energy-saving potential became feasible by reducing the supply air flow rate without sacrificing of particle contamination as well as biocontamination.
Figure 4. Field tests data of particle microbial count
Time (min)
0 10 20 30 40 50 60 70 80 90 100
Tem
pera
ture
(OC
)
15
20
25
30
35
40
45
50
Hum
idity
(%)
30
35
40
45
50
55
60
25% 50% 75% 100%
Temperature
Humidity
Damper opening percentage
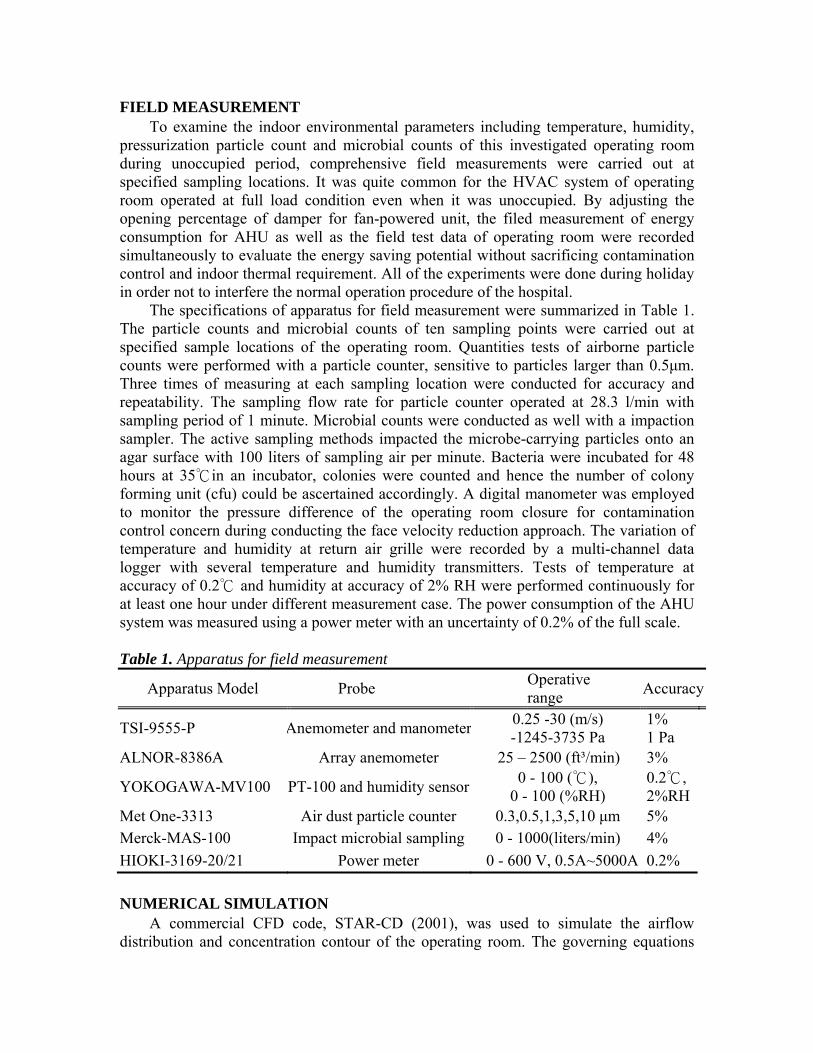
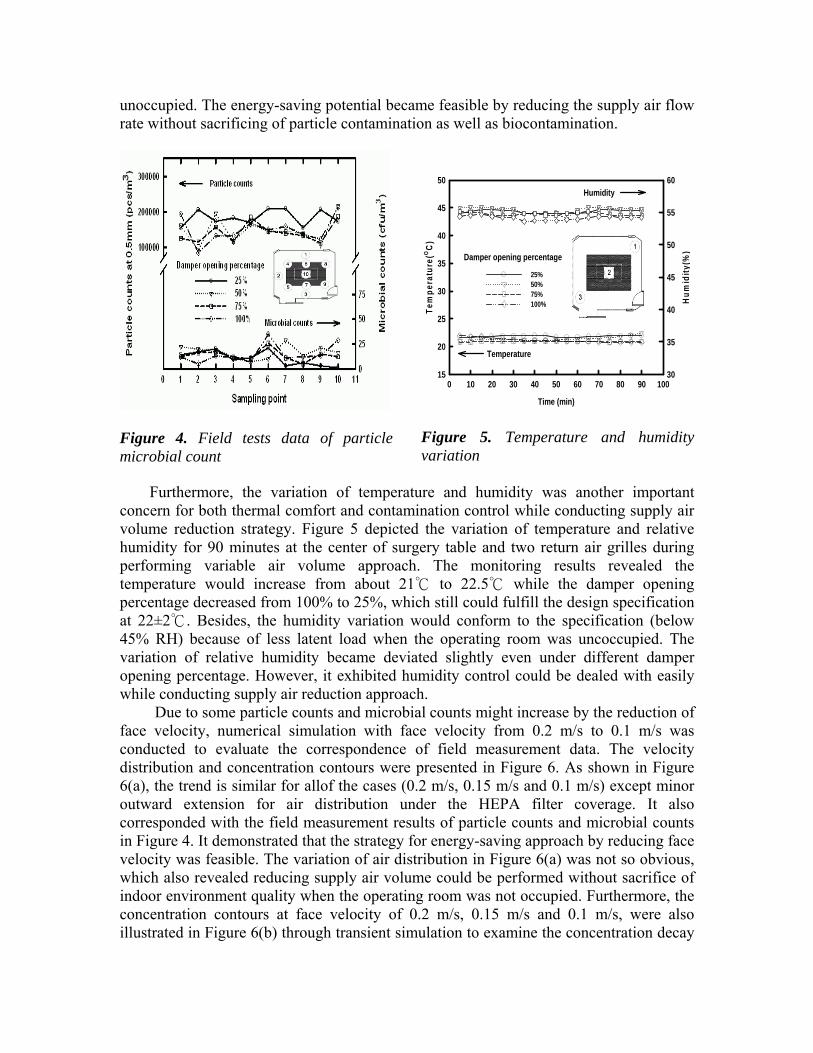
Figure 5. Temperature and humidity variation
Furthermore, the variation of temperature and humidity was another important
concern for both thermal comfort and contamination control while conducting supply air volume reduction strategy. Figure 5 depicted the variation of temperature and relative humidity for 90 minutes at the center of surgery table and two return air grilles during performing variable air volume approach. The monitoring results revealed the temperature would increase from about 21 to 22.5 while the damper opening ℃ ℃percentage decreased from 100% to 25%, which still could fulfill the design specification at 22±2 . Besides, the humidity variation℃ would conform to the specification (below 45% RH) because of less latent load when the operating room was uncoccupied. The variation of relative humidity became deviated slightly even under different damper opening percentage. However, it exhibited humidity control could be dealed with easily while conducting supply air reduction approach.
Due to some particle counts and microbial counts might increase by the reduction of face velocity, numerical simulation with face velocity from 0.2 m/s to 0.1 m/s was conducted to evaluate the correspondence of field measurement data. The velocity distribution and concentration contours were presented in Figure 6. As shown in Figure 6(a), the trend is similar for allof the cases (0.2 m/s, 0.15 m/s and 0.1 m/s) except minor outward extension for air distribution under the HEPA filter coverage. It also corresponded with the field measurement results of particle counts and microbial counts in Figure 4. It demonstrated that the strategy for energy-saving approach by reducing face velocity was feasible. The variation of air distribution in Figure 6(a) was not so obvious, which also revealed reducing supply air volume could be performed without sacrifice of indoor environment quality when the operating room was not occupied. Furthermore, the concentration contours at face velocity of 0.2 m/s, 0.15 m/s and 0.1 m/s, were also illustrated in Figure 6(b) through transient simulation to examine the concentration decay
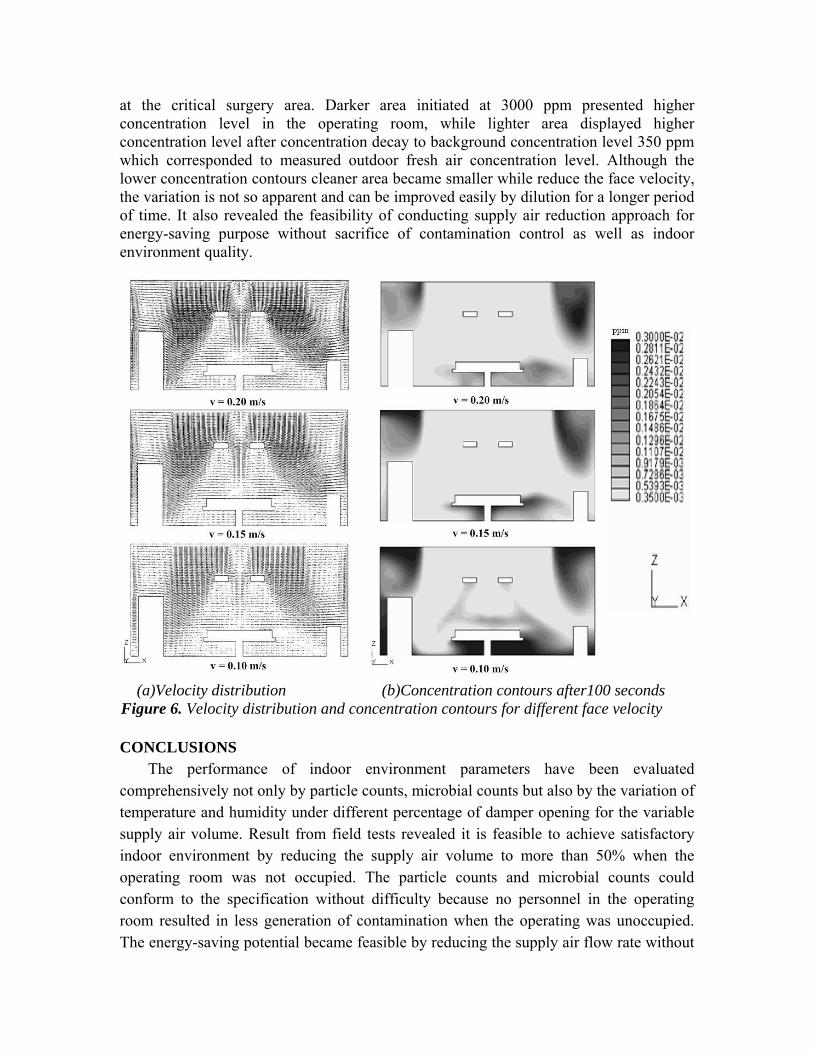
at the critical surgery area. Darker area initiated at 3000 ppm presented higher concentration level in the operating room, while lighter area displayed higher concentration level after concentration decay to background concentration level 350 ppm which corresponded to measured outdoor fresh air concentration level. Although the lower concentration contours cleaner area became smaller while reduce the face velocity, the variation is not so apparent and can be improved easily by dilution for a longer period of time. It also revealed the feasibility of conducting supply air reduction approach for energy-saving purpose without sacrifice of contamination control as well as indoor environment quality.
(a)Velocity distribution (b)Concentration contours after100 seconds
Figure 6. Velocity distribution and concentration contours for different face velocity CONCLUSIONS
The performance of indoor environment parameters have been evaluated comprehensively not only by particle counts, microbial counts but also by the variation of temperature and humidity under different percentage of damper opening for the variable supply air volume. Result from field tests revealed it is feasible to achieve satisfactory indoor environment by reducing the supply air volume to more than 50% when the operating room was not occupied. The particle counts and microbial counts could conform to the specification without difficulty because no personnel in the operating room resulted in less generation of contamination when the operating was unoccupied. The energy-saving potential became feasible by reducing the supply air flow rate without
sacrificing of particle contamination as well as biocontamination. Besides, the utilization of CFD simulation for airflow distribution and the concentration contours as well as concentration decay calculation was presented. Simulation results corresponded to the trend of field measurement data and presented it was accessible to conduct the velocity reduction strategy without sacrifice of thermal comfort and contamination control. Results in this study should provide valuable information to the facility engineer facing the compromise between energy saving strategy and infection control consideration in the unoccupied operating room. ACKNOWLEDGMENTS
The authors would like to express their great appreciation to the financial support by the National Science Council under the grant No. NSC-98-2221-E-167-021-MY2. REFERENCES Balaras, C. A., E. Dascalaki, and A. Gaglia. 2007. HVAC and indoor thermal conditions
in hospital operating rooms. Energy and Buildings, 39: 454-470. CD Adapco Group. 2001. Methodology STAR-CD, Version 3.06, Computational
Dynamics Limited Corporation. Chow. T. T., and X. Y. Yang. 2005. Ventilation performance in the operating theatre
against airborne infection: numerical study on an ultra-clean system. Journal of Hospital Infection. 59: 138-147.
Chow, T. T., Z. Lin, and W. Bai. 2006. The integrated effect of medical lamp position and diffuser discharge velocity on ultra-clean ventilation performance in an operating theatre. Indoor and Built Environment, 15: 315-331.
Engdah1, F., and A. Svensson. 2003. Pressure controlled variable air volume system. Energy and Buildings, 35: 1161-1172.
Pereira, M. L., and A. Tribess. 2005. A review of air distribution patterns in surgery rooms under infection control focus. Thermal Engineering, 4: 113-121.
Sorensen, D. N., and P. V. Nielsen. 2003. Quality control of computational fluid dynamics in indoor environments. Indoor Air, 13: 2-17.
Wang F. J., C. M. Lai, T. J. Cheng, and Z. R. Liu. 2010. Performance investigation for the cleanroom contamination control strategy in an operating room. ASHRAE Transactions, 116(1): 74-80.
Wang F. J., C. M. Lai, and Y. R. Zheng. 2009. The influence of the air-circulation layout alternatives on air flow patterns in the processing area of a cleanroom, Indoor and Built Environment, 18(1): 24-31.
Zhang, R., G. Tu, and J. Ling. 2008. Study on biological contaminant control strategies under different ventilation models in hospital operating room. Building and Environment. 43: 793-803.