power quality improvement of distribution system by optimal location and size of dgs using...
TRANSCRIPT

8/20/2019 Power Quality improvement of Distribution System by Optimal Location and Size of DGs Using Particle Swarm Opti…
http://slidepdf.com/reader/full/power-quality-improvement-of-distribution-system-by-optimal-location-and-size 1/7
www.ijsret.org
International Journal of Scientific Research Engineering & Technology (IJSRET), ISSN 2278 – 0882
Volume 3 Issue 1, April 2014
Power Quality improvement of Distribution System by Optimal Location
and Size of DGs Using Particle Swarm Optimization
Ankita Mishra1, Arti Bhandakkar
2
1(PG Scholar, Department of Electrical & Electronics Engineering, SRIT, Jabalpur)
2(Associate Professor, Department of Electrical & Electronics Engineering, SRIT, Jabalpur)
Abstract: Increasing application of DG on distributionnetworks is the direct impact of development of
technology and the energy disasters that the world is
encountering. To obtain these goals the resources
capacity and the installation place are of a crucial
importance. Line loss reduction is one of the majorbenefits of DG, amongst many others, when
incorporated in the power distribution system. The
quantum of the line loss reduction should be exactly
known to assess the effectiveness of the distributed
generation. In this paper, a optimization method isproposed to find the optimal and simultaneous place and
capacity of these DG units to reduce losses, improve
voltage profile too the total loss of IEEE 30 bus test
system is calculated with and without DG placement and
quantifying the total line loss reduction is proposed. .
The results showed a considerable reduction in the total
power in the system and improved voltage profiles of the
Buses.
Keywords— DG, PSO, Power Loss, Voltage Profile
1 .INTRODUCTION
Distributed generation is any electricity generating
technology installed by a customer or independent
electricity producer that is connected at the distributionsystem level of the electric grid [1].
With the increasing expanding of network construction
in the modern power system and the rapid development
of renewable energy resource, distributed generation
(DG) has become an important form of electrical source.More and more DGs are connected into the power
distribution system. It is predicted that DG would have a
share of about 20% of new generating units being on
lined [2]. DG effects in distribution network depend on
several factors such as the DG place, technology issues,Capacity and the way it operates in the network. DG can
significantly increase reliability, reduce losses and save
energy while is cost effective, though it Suffers from
some disadvantages because of the isolated power
quality functioning, and voltage control problems.
Generally, planners assess DG functioning in two
respects: costs and benefits. Cost is one of the most
important factors that should be considered regarding
DG application [3]. So, to reach to these targets, lossreduction and voltage profile improvement of the electric
system with the presence of DG requires the definition
of several factors such as, the best technology to be used
the number and the capacity of the units, the best
location, the type of network connection and etc. Theproblem of DG allocation and sizing is of great
importance. The installation of DG units at non-optimal
places and with non-optimal sizing can result in an
increase in system losses, damaging voltage state
voltage flicker, protection, harmonic, stability andimplying in an increase in costs and, therefore, having an
effect opposite to the desired [4,5]. Several optimization
techniques have been applied to DG placement and
sizing, such as genetic algorithm [6], tabu search [7]
heuristic algorithms [8,9] and analytical based methods
[10], analytical method to place DG in radial as well as
meshed systems to minimize power loss of the system is
presented. In this method separate expressions for radia
and network system are derived and a complex
procedure based on phasor current is proposed to solve
the location problem. However, this method only
optimizes location and considers size of DG as fixed. In
this paper, Particle Swarm Optimization algorithm
(PSO) is presented as the optimization technique for the
allocation and sizing of DG in distribution networks in
order to loss reduction in distribution network with
minimum economic cost test system. The 30 bus test
feeder is selected to test proposed method [11].
A lot of technologies are used for DG sources such as
photovoltaic cells, wind generation, combustion engines
fuel cells etc.[12][13]. Usually, DGs are attached with
the already existing distribution system and lot of studies
are performed to find out the best location and size of
DGs to produce highest benefits [14],[15]. The different
characteristics that are considered to identify an optimal
DG location and size are the minimization oftransmission loss, maximization of supply reliability
maximization of profit of the distribution companies etc
[16].
Due to wide-ranging costs, the DGs are to be allocated
properly with best size to enhance the performance ofthe system in order to minimize the loss in the system
and to improve different voltage profiles, while

8/20/2019 Power Quality improvement of Distribution System by Optimal Location and Size of DGs Using Particle Swarm Opti…
http://slidepdf.com/reader/full/power-quality-improvement-of-distribution-system-by-optimal-location-and-size 2/7
www.ijsret.org
International Journal of Scientific Research Engineering & Technology (IJSRET), ISSN 2278 – 0882
Volume 3 Issue 1, April 2014
maintaining the stability of the system [17]. The effect of
placing a DG on network indices will be different based
upon its type and location and (predict) load at the
connection point [18]. There are lot of variety of
potential benefits to DG systems both to the consumer
and the electrical supplier that allow for both greater
electrical flexibility and energy security [19].
2. PARTICLE SWARM OPTIMIZATION
(PSO)
PSO was formulated by Edward and Kennedy in 1995.
The thought process behind the algorithm was inspired
by the social behavior of animals, such as bird flocking
or fish schooling. PSO is similar to the continuous GA in
that it begins with a random population matrix. Unlike
the GA, PSO has no evolution operators such as
crossover and mutation. The rows in the matrix are
called particles (same as the GA chromosome). They
contain the variable values and are not binary encoded.
Each particle moves about the cost surface with a
velocity. The particles update their velocities and
positions based on the local and global best solutions:
V , = V . + Γ × × (p . − p , ) + Γ × × (
p , − p , ) (1)
p , = p , + V ,
V , Particle velocity
P , Particle variables
Γ1=Γ2 Independent uniform random
numbers
G1 = G2 Learning factors
p , Best local solution
p , Best global solution
For each particle then adds that velocity to the particle
position or values. Velocity updates are influenced byboth the best global solution associated with the lowest
cost ever found by a particle and the best local solution
associated with the lowest cost in the present population.
If the best local solution has a cost less than the cost of
the current global solution, then the best local solution
replaces the best global solution.
The particle velocity is reminiscent of local minimizes
that use derivative information, because velocity is the
derivative of position. The constant G1 is called the
cognitive parameter. The constant G2 is called the social
parameter. The advantages of PSO are that it is easy to
implement and there are few parameters to adjust [20]-
[21].
The particle swarming becomes evident as the
generations pass. The largest group of particles ends up
in the vicinity of the global minimum and the next
largest group is near the next lowest minimum. A few
other particles are roaming the cost surface at some
distance away from the two groups. Figure (1) shows
plots of , and , as well as the
population average as a function of generation. The
particle , serves the same function as elite
chromosome in the GA. The chaotic swarming process
is best illustrated by following the path of one of the
particles until it reaches the global minimum in this
implementation the particles frequently bounce off the
boundaries.
Fig.1. Convergence of the PSO algorithm.
PSO is a optimization technique to evaluate the optimal
solution. Here PSO algorithm is used to calculate
optimal power flow in each bus of IEEE 30 bus systemand also calculate the losses in each bus ,based on the
PSO result we select the optimal location of DG and its
capacity.
3. PROBLEM FORMULATION
Optimal DG placement and sizing problem is formulatedas a constrained nonlinear integer optimization problem.
Objective Function: The objective function aimed at bes
location of DG in order to minimize economic losses of
buses due to interruption caused with voltage sag and
that of the DG installation and sum of active power of
DG injected to system.
Total real power is defined by

8/20/2019 Power Quality improvement of Distribution System by Optimal Location and Size of DGs Using Particle Swarm Opti…
http://slidepdf.com/reader/full/power-quality-improvement-of-distribution-system-by-optimal-location-and-size 3/7
www.ijsret.org
International Journal of Scientific Research Engineering & Technology (IJSRET), ISSN 2278 – 0882
Volume 3 Issue 1, April 2014
Ploss = Σ (2)
It should be pointed out that the cost of the real power
loss per unit is fixed. Also, the cost of the active power
injection per unit is constant.
Constraints: Another significant part of the
optimization model that needs to be defined is the
constraints. There are two types of constraints: equality
and inequality.
A. Equality Constraints
These constraints are related to the nonlinear power flow
equations. In many published papers, the power flow
equations are the real and reactive power mismatch
equations. The reason for this is that modified versions
of conventional power flow programs such as Newton
Raphson method and Gauss-Siedel method are widely
used. In this work, the power flow representation is
based on Backward-Forward sweep algorithm [22]. Theequality constraints are expressed in a vector form as
follows:
F ( , ) =0
Vector of state variables like voltage magnitude
Vector of DG size
Be equal to zero of F, is associated with satisfying all of the load flow of network.
B. Inequality Constraints
The inequality constraints are those associated with the
bus voltages and DG to be installed.
I: Bus Voltage Limits: The bus voltage magnitudes are
to be kept within acceptable operating limits throughout
the optimization process.
V ≤ |V | ≤ V (3)
Where
V Lower bound of bus voltage limits;
V Upper bound of bus voltage limits;
|V | rms value of the th bus voltage
II: Number and Sizes of DGs:
There are constraints associated with the DGs
themselves. DGs that are commercially available comein discrete sizes. That is, the DGs to be deal with are
multiple integers of the smallest capacitor size available
and this matter itself is because of coordination between
sizes of DGs to be installed with what is available in
practical method. This constraint is as follows:
≤ LP , L=1, 2 . . . n (4)
P Smallest DG size available
Also, the total active power injection is not to exceed the
total active power demand in radial distribution system
Σ < Τ
Where
Τ Total active power demand
This paper has two major goals: 1) Improvement of
voltage profile, 2) Loss reduction. There are also some
limitations based on which the destination functionshould be defined.
1) (Loss with DG) < (Loss without DG)
2) ≤ ≤
According to the first limitation the loss reduces when
DG exists. Also, second limitation states that theauthorized voltage of a certain bus depends on the
minimum and maximum voltages of the bus [23]
In the proposed work, in order to observe and
compare the results with those of the specifieddestination function, an IEEE 30-bus distribution
network has been selected as a sample. It should be
noted that the specified destination function can be
generalized to be used for all distribution networks with
any number of buses. Moreover, the optimizationalgorithm of the destination function is a PSO
Algorithm. The single line diagram of the network is
illustrated in Fig. 3
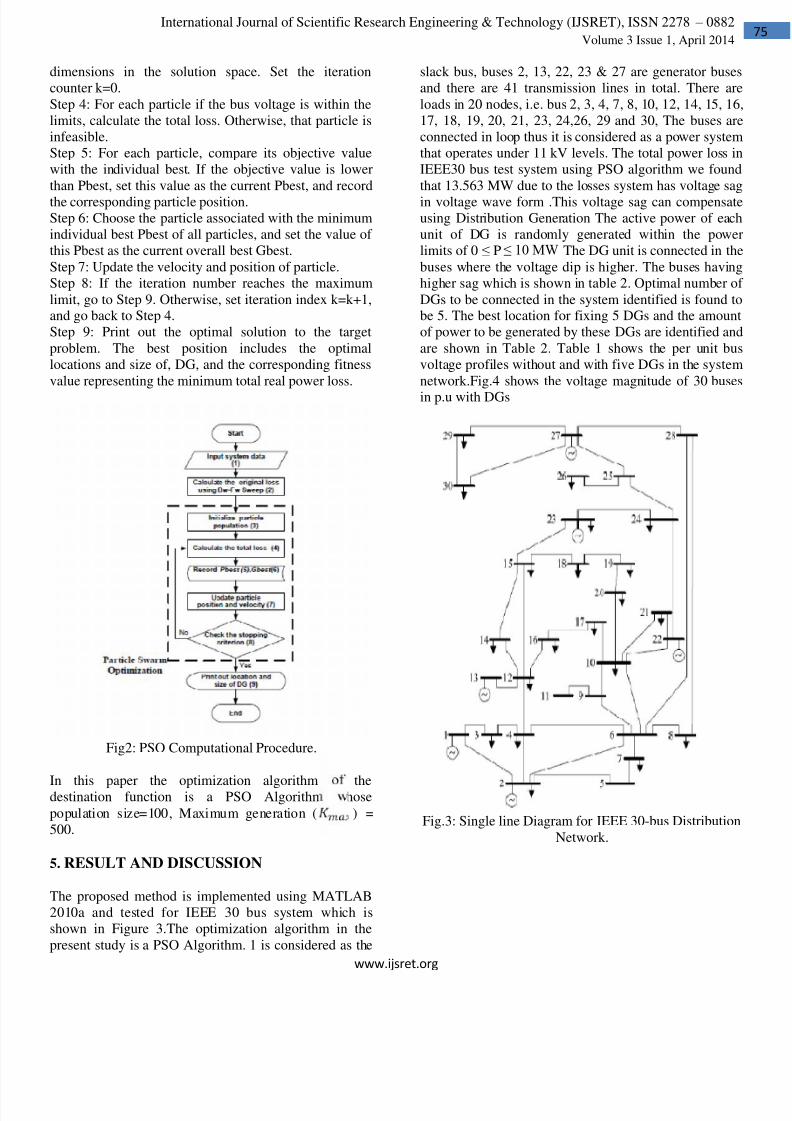
4. THE PSO ALGORITHM PROCEDURE
The particle swarm optimizer (PSO) algorithm is a
random evolution method based on intelligent search of
the group birds. It has quick convergence speed and
optimal searching ability for solving large-scale
optimization problems [24].
The PSO-based approach for solving OPDG problem
to minimize the loss takes the following steps:
Step 1: Input line and bus data, and bus voltage limits.
Step 2: Calculate the loss using distribution load flow
based on backward-forward sweep.
Step 3: Randomly generates an initial population (array)
of particles with random positions and velocities on
8/20/2019 Power Quality improvement of Distribution System by Optimal Location and Size of DGs Using Particle Swarm Opti…
http://slidepdf.com/reader/full/power-quality-improvement-of-distribution-system-by-optimal-location-and-size 4/7
www.ijsret.org
International Journal of Scientific Research Engineering & Technology (IJSRET), ISSN 2278 – 0882
Volume 3 Issue 1, April 2014
dimensions in the solution space. Set the iteration
counter k=0.
Step 4: For each particle if the bus voltage is within the
limits, calculate the total loss. Otherwise, that particle is
infeasible.
Step 5: For each particle, compare its objective value
with the individual best. If the objective value is lower
than Pbest, set this value as the current Pbest, and record
the corresponding particle position.
Step 6: Choose the particle associated with the minimum
individual best Pbest of all particles, and set the value of
this Pbest as the current overall best Gbest.
Step 7: Update the velocity and position of particle.
Step 8: If the iteration number reaches the maximum
limit, go to Step 9. Otherwise, set iteration index k=k+1,and go back to Step 4.
Step 9: Print out the optimal solution to the target
problem. The best position includes the optimal
locations and size of, DG, and the corresponding fitness
value representing the minimum total real power loss.
Fig2: PSO Computational Procedure.
In this paper the optimization algorithm of thedestination function is a PSO Algorithm whose
population size=100, Maximum generation ( ) =
500.
5. RESULT AND DISCUSSION
The proposed method is implemented using MATLAB
2010a and tested for IEEE 30 bus system which is
shown in Figure 3.The optimization algorithm in the
present study is a PSO Algorithm. 1 is considered as the
slack bus, buses 2, 13, 22, 23 & 27 are generator buses
and there are 41 transmission lines in total. There are
loads in 20 nodes, i.e. bus 2, 3, 4, 7, 8, 10, 12, 14, 15, 16
17, 18, 19, 20, 21, 23, 24,26, 29 and 30, The buses are
connected in loop thus it is considered as a power system
that operates under 11 kV levels. The total power loss in
IEEE30 bus test system using PSO algorithm we found
that 13.563 MW due to the losses system has voltage sag
in voltage wave form .This voltage sag can compensate
using Distribution Generation The active power of each
unit of DG is randomly generated within the power
limits of 0 ≤ P ≤ 10 MW The DG unit is connected in the
buses where the voltage dip is higher. The buses having
higher sag which is shown in table 2. Optimal number of
DGs to be connected in the system identified is found tobe 5. The best location for fixing 5 DGs and the amount
of power to be generated by these DGs are identified and
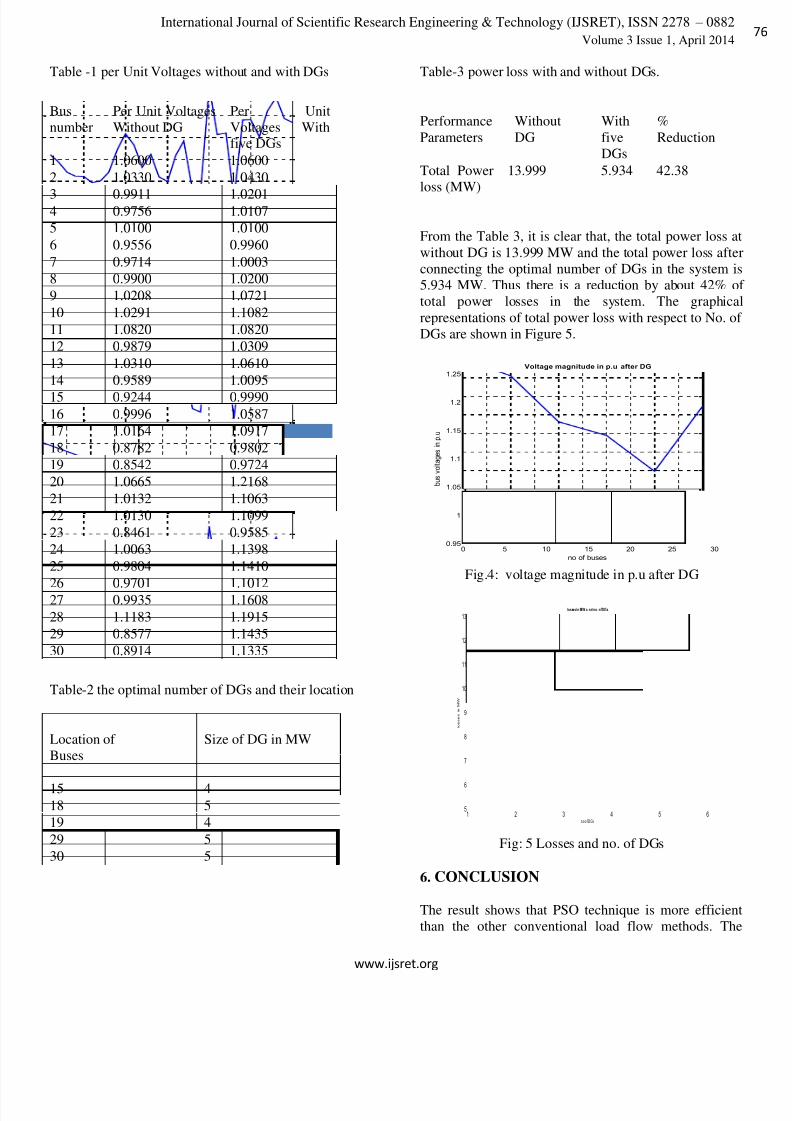
are shown in Table 2. Table 1 shows the per unit bus
voltage profiles without and with five DGs in the system
network.Fig.4 shows the voltage magnitude of 30 buses
in p.u with DGs
Fig.3: Single line Diagram for IEEE 30-bus Distribution
Network.
8/20/2019 Power Quality improvement of Distribution System by Optimal Location and Size of DGs Using Particle Swarm Opti…
http://slidepdf.com/reader/full/power-quality-improvement-of-distribution-system-by-optimal-location-and-size 5/7
www.ijsret.org
International Journal of Scientific Research Engineering & Technology (IJSRET), ISSN 2278 – 0882
Volume 3 Issue 1, April 2014
Table -1 per Unit Voltages without and with DGs
Table-2 the optimal number of DGs and their location
Location of
Buses
Size of DG in MW
15 418 5
19 4
29 5
30 5
Table-3 power loss with and without DGs.
Performance
Parameters
Without
DG
With
five
DGs
%
Reduction
Total Power
loss (MW)
13.999 5.934 42.38
From the Table 3, it is clear that, the total power loss at
without DG is 13.999 MW and the total power loss afte
connecting the optimal number of DGs in the system is
5.934 MW. Thus there is a reduction by about 42% o
total power losses in the system. The graphica
representations of total power loss with respect to No. of
DGs are shown in Figure 5.
Fig.4: voltage magnitude in p.u after DG
Fig: 5 Losses and no. of DGs
6. CONCLUSION
The result shows that PSO technique is more efficient
than the other conventional load flow methods. The
0 5 10 15 20 25 300.95
1
1.05
1.1
1.15
1.2
1.25
no of buses
b u s
v o l t a g e s
i n
p .
u
Voltage magnitude in p.u after DG
1 2 3 4 5 65
6
7
8
9
10
11
12
13
noo fDGs
l o s s e s i n M W
lossesin MW a nd no. ofDGs
Bus
number
Per Unit Voltages
Without DG
Per Unit
Voltages Withfive DGs
1 1.0600 1.0600
2 1.0330 1.0430
3 0.9911 1.02014 0.9756 1.0107
5 1.0100 1.0100
6 0.9556 0.9960
7 0.9714 1.0003
8 0.9900 1.0200
9 1.0208 1.0721
10 1.0291 1.1082
11 1.0820 1.0820
12 0.9879 1.0309
13 1.0310 1.0610
14 0.9589 1.0095
15 0.9244 0.999016 0.9996 1.0587
17 1.0164 1.0917
18 0.8782 0.9802
19 0.8542 0.9724
20 1.0665 1.2168
21 1.0132 1.1063
22 1.0130 1.1099
23 0.8461 0.9585
24 1.0063 1.1398
25 0.9804 1.1410
26 0.9701 1.101227 0.9935 1.1608
28 1.1183 1.1915
29 0.8577 1.1435
30 0.8914 1.1335
8/20/2019 Power Quality improvement of Distribution System by Optimal Location and Size of DGs Using Particle Swarm Opti…
http://slidepdf.com/reader/full/power-quality-improvement-of-distribution-system-by-optimal-location-and-size 6/7
www.ijsret.org
International Journal of Scientific Research Engineering & Technology (IJSRET), ISSN 2278 – 0882
Volume 3 Issue 1, April 2014
losses obtain by the PSO is more optimum and time
taken is very less to calculate the losses.
In this paper, optimal number of DGs and their
locations using Particle Swarm Optimization was tested
for an IEEE 30 bus system. The comparison was made
without and with DGs in terms of total power loss and
voltage profile of all the buses. The optimal number of
DGs to be connected in the system was identified as five
and these DGs should be located on the buses 15, 18, 19,
29, and 30 for minimization of total power loss. The
total power loss in without DG was 13.999MW and after
connecting DGs in the system, the power loss was
reduced to 5.934MW. Thus the total loss was reduced to
42% of total power losses in the system and the voltage
profile of the buses improved within the tolerable limits.Hence, the power quality of the system is improved.
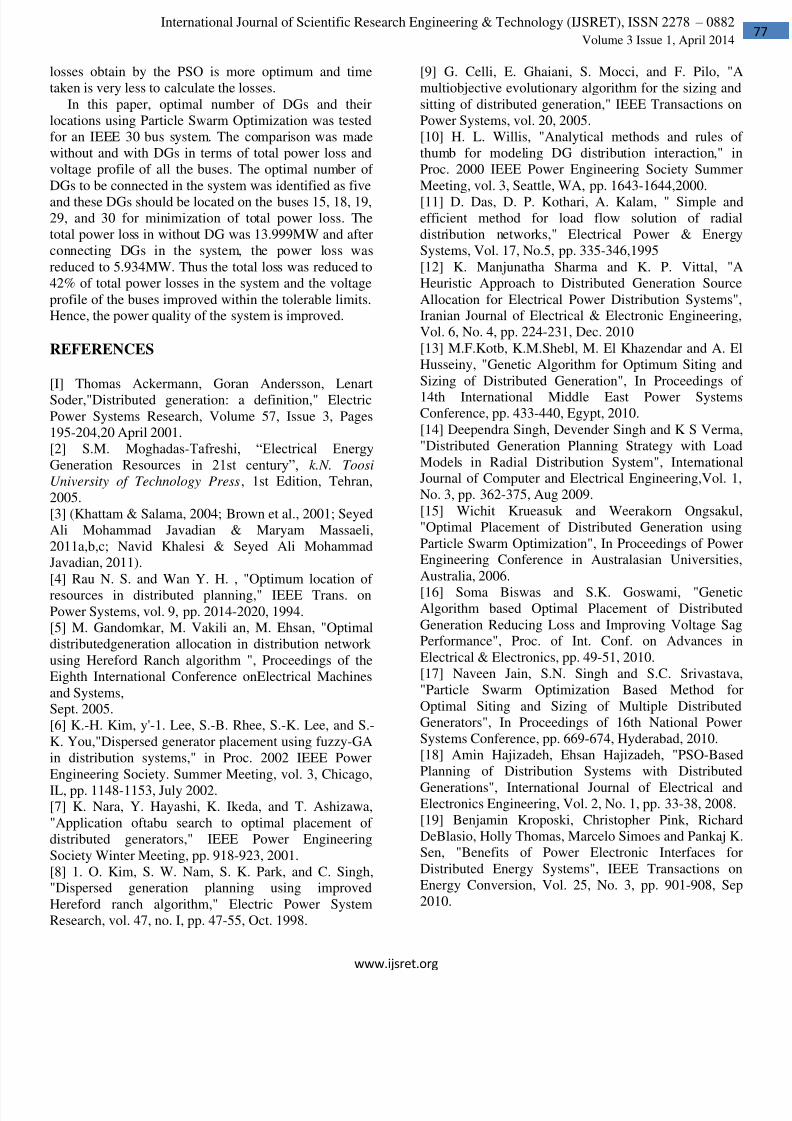
REFERENCES
[I] Thomas Ackermann, Goran Andersson, Lenart
Soder,"Distributed generation: a definition," Electric
Power Systems Research, Volume 57, Issue 3, Pages
195-204,20 April 2001.
[2] S.M. Moghadas-Tafreshi, “Electrical EnergyGeneration Resources in 21st century”, k.N. Toosi
University of Technology Press, 1st Edition, Tehran,
2005.
[3] (Khattam & Salama, 2004; Brown et al., 2001; Seyed
Ali Mohammad Javadian & Maryam Massaeli,
2011a,b,c; Navid Khalesi & Seyed Ali Mohammad
Javadian, 2011).
[4] Rau N. S. and Wan Y. H. , "Optimum location of
resources in distributed planning," IEEE Trans. on
Power Systems, vol. 9, pp. 2014-2020, 1994.[5] M. Gandomkar, M. Vakili an, M. Ehsan, "Optimal
distributedgeneration allocation in distribution network
using Hereford Ranch algorithm ", Proceedings of the
Eighth International Conference onElectrical Machines
and Systems,Sept. 2005.
[6] K.-H. Kim, y'-1. Lee, S.-B. Rhee, S.-K. Lee, and S.-
K. You,"Dispersed generator placement using fuzzy-GA
in distribution systems," in Proc. 2002 IEEE Power
Engineering Society. Summer Meeting, vol. 3, Chicago,
IL, pp. 1148-1153, July 2002.[7] K. Nara, Y. Hayashi, K. Ikeda, and T. Ashizawa,
"Application oftabu search to optimal placement of
distributed generators," IEEE Power Engineering
Society Winter Meeting, pp. 918-923, 2001.
[8] 1. O. Kim, S. W. Nam, S. K. Park, and C. Singh,"Dispersed generation planning using improved
Hereford ranch algorithm," Electric Power System
Research, vol. 47, no. I, pp. 47-55, Oct. 1998.
[9] G. Celli, E. Ghaiani, S. Mocci, and F. Pilo, "A
multiobjective evolutionary algorithm for the sizing and
sitting of distributed generation," IEEE Transactions on
Power Systems, vol. 20, 2005.
[10] H. L. Willis, "Analytical methods and rules of
thumb for modeling DG distribution interaction," in
Proc. 2000 IEEE Power Engineering Society Summer
Meeting, vol. 3, Seattle, WA, pp. 1643-1644,2000.
[11] D. Das, D. P. Kothari, A. Kalam, " Simple and
efficient method for load flow solution of radia
distribution networks," Electrical Power & Energy
Systems, Vol. 17, No.5, pp. 335-346,1995
[12] K. Manjunatha Sharma and K. P. Vittal, "A
Heuristic Approach to Distributed Generation Source
Allocation for Electrical Power Distribution Systems"Iranian Journal of Electrical & Electronic Engineering
Vol. 6, No. 4, pp. 224-231, Dec. 2010
[13] M.F.Kotb, K.M.Shebl, M. El Khazendar and A. El
Husseiny, "Genetic Algorithm for Optimum Siting and
Sizing of Distributed Generation", In Proceedings of
14th International Middle East Power SystemsConference, pp. 433-440, Egypt, 2010.
[14] Deependra Singh, Devender Singh and K S Verma
"Distributed Generation Planning Strategy with Load
Models in Radial Distribution System", InternationaJournal of Computer and Electrical Engineering,Vol. 1
No. 3, pp. 362-375, Aug 2009.
[15] Wichit Krueasuk and Weerakorn Ongsakul
"Optimal Placement of Distributed Generation using
Particle Swarm Optimization", In Proceedings of PowerEngineering Conference in Australasian Universities
Australia, 2006.
[16] Soma Biswas and S.K. Goswami, "GeneticAlgorithm based Optimal Placement of Distributed
Generation Reducing Loss and Improving Voltage SagPerformance", Proc. of Int. Conf. on Advances in
Electrical & Electronics, pp. 49-51, 2010.
[17] Naveen Jain, S.N. Singh and S.C. Srivastava
"Particle Swarm Optimization Based Method for
Optimal Siting and Sizing of Multiple Distributed
Generators", In Proceedings of 16th National Power
Systems Conference, pp. 669-674, Hyderabad, 2010.
[18] Amin Hajizadeh, Ehsan Hajizadeh, "PSO-Based
Planning of Distribution Systems with Distributed
Generations", International Journal of Electrical andElectronics Engineering, Vol. 2, No. 1, pp. 33-38, 2008.
[19] Benjamin Kroposki, Christopher Pink, Richard
DeBlasio, Holly Thomas, Marcelo Simoes and Pankaj K
Sen, "Benefits of Power Electronic Interfaces for
Distributed Energy Systems", IEEE Transactions on
Energy Conversion, Vol. 25, No. 3, pp. 901-908, Sep
2010.

8/20/2019 Power Quality improvement of Distribution System by Optimal Location and Size of DGs Using Particle Swarm Opti…
http://slidepdf.com/reader/full/power-quality-improvement-of-distribution-system-by-optimal-location-and-size 7/7
www.ijsret.org
International Journal of Scientific Research Engineering & Technology (IJSRET), ISSN 2278 – 0882
Volume 3 Issue 1, April 2014
[20] Y.Shi, Eberhart, "A modified particle swarm
optimization," IEEE Conference on computer
engineering, pp. 69-73, May 1998.
[21] Y.Shi, Eberhart, "Empirical study of particle swarm
optimization," IEEE Conf on computer engineering,pp.
1945-1950, 1999.
[22] Jen-Hao Teng, Chuo-Yean Chang,
"BackwardIForward SweepBased Harmonic Analysis
Method for Distribution Systems ", IEEE Transactions
on Power Delivery, pp. 1665-1672,2007
[23] J.-H. Teng, Y.-H. Liu, C.-Y. Chen, and C.-F, Chen,
”Value-Based Distributed Generator Placements for
Service Quality Improvements,” International Journal of
Electrical Power and Energy Systems, Vol. 29, No. 3,
2007, pp. 268-274. [25] M. Kaplan, ” Optimization of Number, Location, Size, Control Type, and Control
Setting of Shunt Capacitors on Radial Distribution
Feeders,” IEEE Power & Energy Society , Vol. 103,
Sept. 1984, pp.2659- 2665.
[24] J. Kennedy, R. Eberhart, ” Particle Swarm
optimizer,” IEEE International Conference on Neural Networks (Perth, Australia), IEEE Service Center
Piscataway, NJ, IV , 1995, pp1942-1984.