6 guidelines for how to use the 50 moving average
TRANSCRIPT

6 Guidelines for How to Usethe 50 Moving Average
The 50-day moving average indicator is one of the mostimportant and commonly used tools in stock trading. Consideredan “intermediate term” indicator, it is a multiple of thelonger-term 100 and 200 moving averages. It’s use isubiquitous on any time frame.
Therefore it goes without saying we need to unpack therelevance of this average and how you can use it when trading.
To this point, we will give a brief overview, elaborate on thesix tips, and then show some real trading examples using theindicator. Lastly, we will show you where the indicator canfail you, so you are prepared for when things do not go asplanned.
Why Use a Moving Average?The moving average is a trading indicator used to smooth theprice action on the chart. The moving average indicator takesinto account a certain number of periods when calculating itsvalue.
These periods can be adjusted, which also modifies theappearance of the line on the chart. The more periods it takesinto consideration, the smoother the line.
Let’s say we want to calculate the 5-period moving average forthe following values:
3.004.00

8.0010.0012.00
The 5-period simple moving average would equal:
(3+4+8+10+12)/5 = 7.4
For each new period, the formula accounts for the additionaldata point.
Therefore, the moving average is a lagging indicator. [1] Thereason for this is that the moving average needs a givennumber of data points based on prior periods to print a value.
5-Day SMA
The purple curved line on the chart is a 5-period simplemoving average. This line is not smooth at all. This isbecause five periods is such a small time frame and willresult in many trade signals; more signals than most wouldcare to track.
Now that we have provided a visual of a moving average let’sdig into the 50-day to see a longer time frame.
What is a 50-Day Moving
Average?The 50-day moving average indicator is one of the most commonSMAs in stock trading.
This makes trade signals around this line pretty reliablebased on the number of eyes monitoring the trading activity atthis level. Not only will retail traders be watching thisindicator, but professionals and institutions use it as wel.
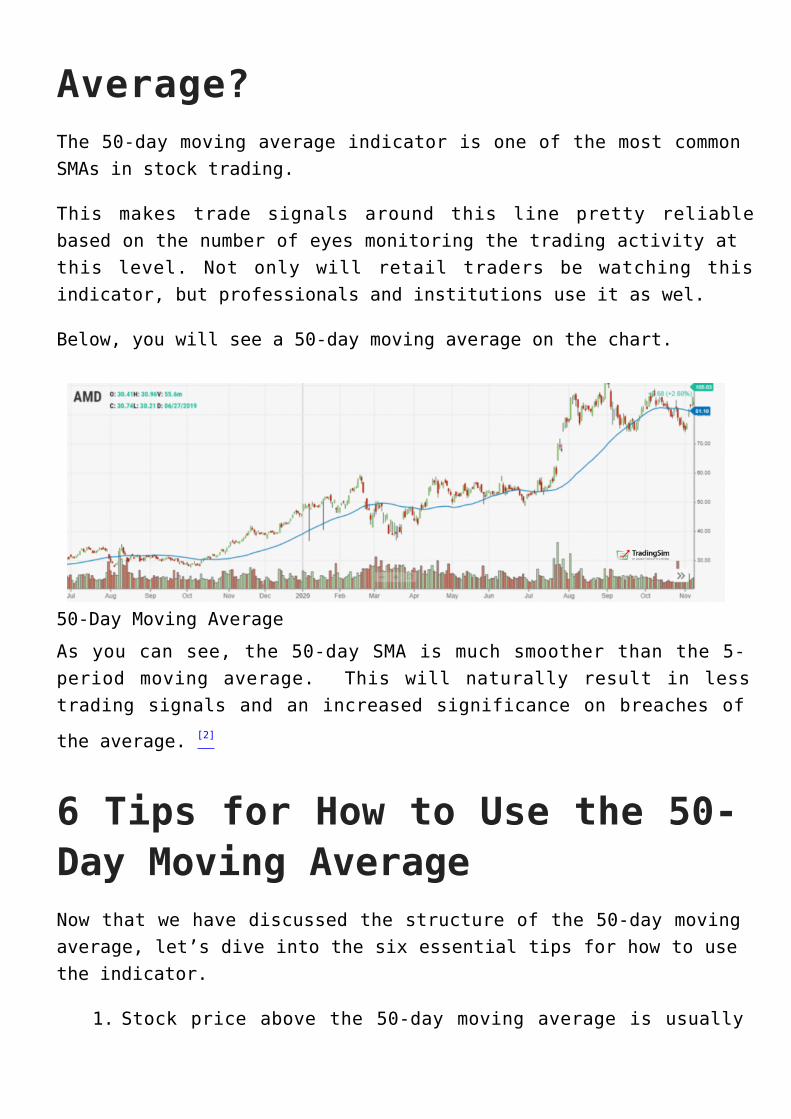
Below, you will see a 50-day moving average on the chart.
50-Day Moving Average
As you can see, the 50-day SMA is much smoother than the 5-period moving average. This will naturally result in lesstrading signals and an increased significance on breaches of
the average. [2]
6 Tips for How to Use the 50-Day Moving AverageNow that we have discussed the structure of the 50-day movingaverage, let’s dive into the six essential tips for how to usethe indicator.
Stock price above the 50-day moving average is usually1.

considered bullish.Stock price below the 50-day moving average is usually2.considered bearish.If the price meets the 50 day SMA as support and bounces3.upwards, consider a long entry.Stock price meets the 50-day SMA as resistance and4.bounces downwards, consider a short entry.If the price breaks the 50-day SMA downwards, you should5.switch your opinion to bearish.If the price breaks the 50-day SMA upward, you should6.switch your opinion to bullish.
These six rules are crucial for understanding the character ofthe 50-day simple moving average indicator. They may soundlike they are all saying the same thing, but they’re not.
Notice how we never said that you should just buy and sellbased on the 50 moving average. Trading doesn’t require anadvanced degree, but we are here to tell you that buying andselling solely on the 50 is not a strategy for success.
However, having a base understanding of these six principleswill help you better navigate how to trade with the average.Next, we will explore these strategies and areas where theindicator can fail you if not used properly.
50-Day Moving Average TradingStrategyIn this trading strategy, we will layout the entry, exit andstop loss when trading. You’ll likely notice that thisstrategy resembles a trend following strategy.
50-Day Moving Average Trade EntryTo enter a 50-day moving average trade, you should wait for abreakout.
Whenever the price breaks the 50-day SMA, you should open atrade in the direction of the breakout. In most cases, theprice action will continue in the direction of the breakout.
50-Day Moving Average Stop LossEvery 50-day moving average trade should be protected with astop-loss order. Nothing is sure in stock trading. The 50-daymoving average strategy is no different. In the long-term, weexpect the price action to continue in the direction of thebreakout. However, there will be cases when the price actionwill surprise us.
The price action could sometimes rapidly shoot in the oppositedirection with a big candle. This could happen due to therelease of some unexpected report.
The ideal place for our stop loss is beyond a price edgecreated prior to the signal we use to enter the trade.
If the price breaks the 50 SMA upwards, we need to go long,placing a stop below a bottom prior to the breakout. Theopposite is true for bearish trades.
If the price breaks the 50 SMA downwards, we need to short thestock placing a stop below the bottom prior to the breakout.
50-Day Moving Average ProfitTargetsThe rule to close 50-day moving average trades is very simple.Hold your trades until the price action breaks your 50-day

moving average in the direction opposite to your trade.
If you are long, you close the trade when the price breaks the50-day SMA downwards. If you are short, you close the tradewhen the price breaks the 50-day SMA upwards.
Trading Example with the 50-Day Moving AverageNow let’s approach a real 50-day moving average tradingexample:
50 Day Moving Average Trading Example
Above you see the 50-day moving average chart of Bank ofAmerica. The blue curved line on the graph is the 50-day SMA.
The action on the chart comes at the moment when the pricebreaks the 50-period SMA downwards. The breakout is shown inthe red circle on the image. See that the price first attemptsa couple of times to break the SMA downwards.

However, we need to wait until the price action breaks thelevel in order to get a valid bearish signal. Therefore, weshort the stock when we see a sharp decrease through the lasttwo price bottoms below the 50-day SMA.
Stop Loss OrderWe place a stop-loss order above the last big top on thechart. The right location of your stop-loss order is shownwith the red horizontal line on the chart.
See that the price creates a very sharp decrease afterward andenters a bearish trend. We need to stay in the trade as longas the price is located below the 50-period SMA.
The blue channel on the chart displays when the price breaksthe 50-day SMA and we close the trade.
However, this is also a long signal and we enter the marketwith a new trade, which is bullish. We place a stop-loss orderbelow the last major bottom on the chart as shown on theimage.
The price then returns and tests the SMA as support. A bullishbounce appears afterward, which resumes our bullish hopes. Theprice experiences a few bumps along the way, but the 50 SMAsustains the price action.
The price then creates a top, which is lower than the previouson the chart (pink line). Then we see a breakout through the50-day moving average. Therefore, we close the trade on theassumption that the price action will reverse and this isexactly what happens.
This case is an example of two 50 day moving average trades,which differ in terms of their profitability.
The first trade is short and it brings a solid profit of15.60% for three-and-a-half months. However, the second trade
brings only 0.22% for about three months.
Your trading results will vary. This is a cost of doingbusiness and is simply unavoidable in the market.
The key is knowing that your system will win in the long runand sticking to your convictions.
50-Day Moving Average vs.200-Day Moving AverageAnother important moving average is the 200-day movingaverage. We mention this tool because it creates a very strongsignal when used in conjunction with the 50-day movingaverage.
This signal is known as the golden cross.
The golden cross is a signal created by the 50-day movingaverage crossing through 200-day moving average to the upside[3].
A good golden cross trading strategy is to open trades in thedirection of the golden cross and to hold them until a breakin the opposite direction.

Golden Cross – Trading Example
Above is the daily chart of Google. The blue line on the chartis a 50-day moving average. The red line on the chart is the200-day moving average.
In the green circles, we have highlighted golden crosses.
The first golden cross is bullish and we use it to buy Google.
We place a stop-loss order below the bottom prior to thecross. The trade needs to be held until the two movingaverages create a bearish sell signal.
This long trade with Google generates a profit of 22.28% forone year.
50-Period Moving Average onIntraday ChartsThe one area you may not think of the 50-day moving averageindicator is on intraday charts. This is because when youthink of day trading, you think of fast-paced trades going in
and out of stocks all day.
And technically, it would no longer be called the 50-DayMoving Average. It would simply be called the 50-period SMA.
So, where does the 50-period moving average indicator comeinto play? Well, the 50 can be used as a larger time frame tokeep an eye on for support and or resistance intraday.
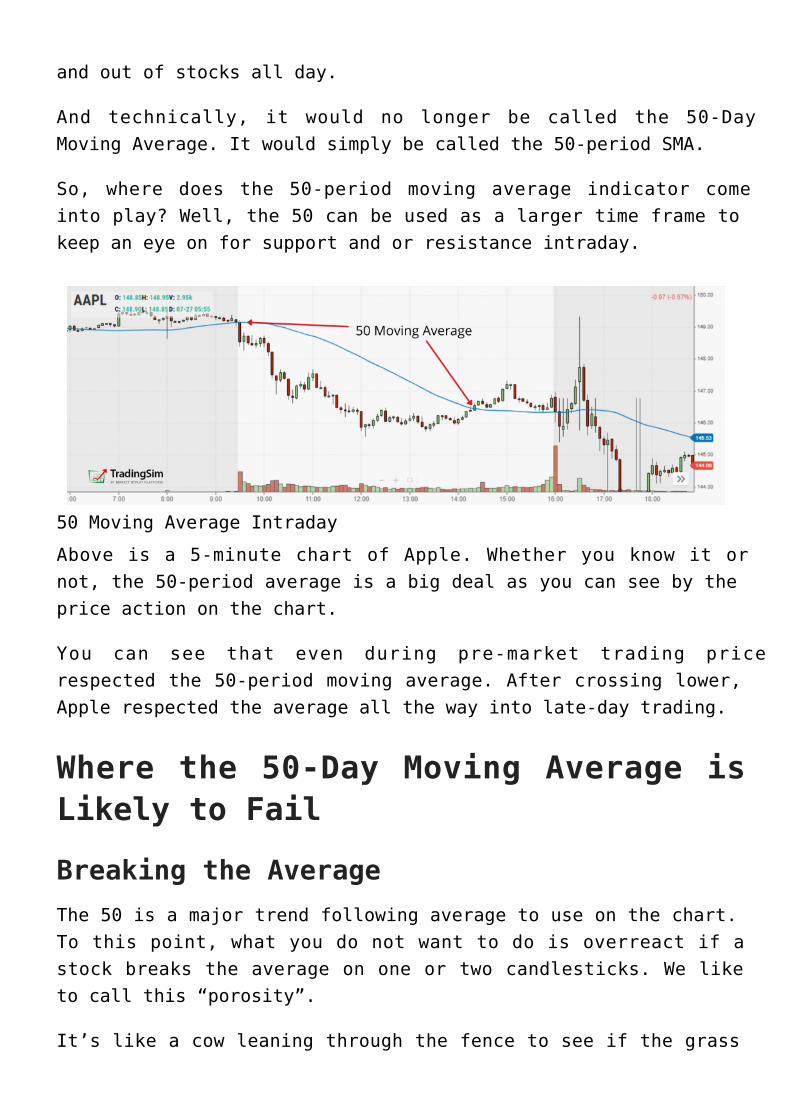
50 Moving Average Intraday
Above is a 5-minute chart of Apple. Whether you know it ornot, the 50-period average is a big deal as you can see by theprice action on the chart.
You can see that even during pre-market trading pricerespected the 50-period moving average. After crossing lower,Apple respected the average all the way into late-day trading.
Where the 50-Day Moving Average isLikely to Fail
Breaking the AverageThe 50 is a major trend following average to use on the chart.To this point, what you do not want to do is overreact if astock breaks the average on one or two candlesticks. We liketo call this “porosity”.
It’s like a cow leaning through the fence to see if the grass

is greener on the other side, only to return back to the samepasture.
This is often a rookie mistake to make as the stock willlikely recover and continue in the direction of the primarytrend.
Minor Breach of the Average
Do you see how the traders “in the know” might play thesesilly games with you? A way to handle these situations denotedby the circles on the chart is to give a certain amount ofwiggle room where you will allow the stock to go beyond themoving average and you stick to your guns.
Many traders will continue to hold as long as a stock does notclose beyond the average. This is also great advice. However,over time you will notice that stocks will close beyond theaverage literally one or two candlesticks, then return.
The real kicker is that after this close beyond the averageand subsequent continuation of the primary trend – this iswhere the lion share of the profits are made in the trade.Think of it like a shake out.
Day Trading Breakouts in the MorningIf you are trading volatile stocks in the morning, you have nobusiness trading with a moving average above 20, to be honest.The price action is so fast that you’ll want to use a lower
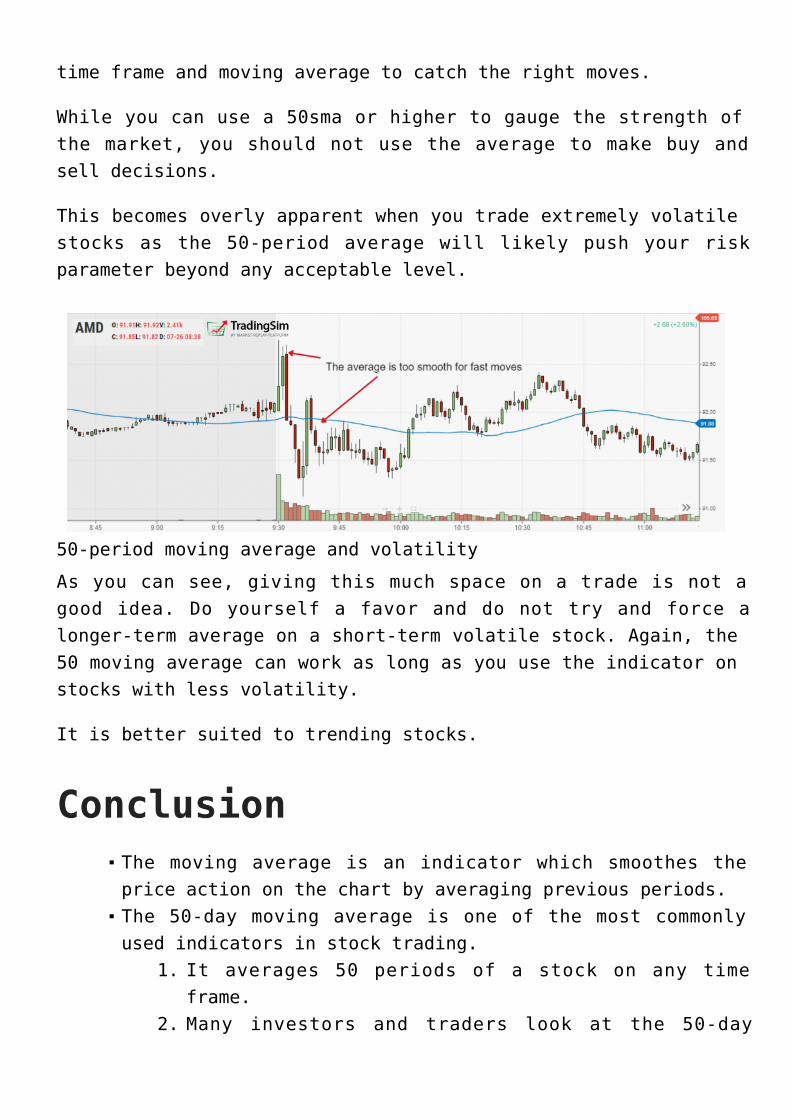
time frame and moving average to catch the right moves.
While you can use a 50sma or higher to gauge the strength ofthe market, you should not use the average to make buy andsell decisions.
This becomes overly apparent when you trade extremely volatilestocks as the 50-period average will likely push your riskparameter beyond any acceptable level.
50-period moving average and volatility
As you can see, giving this much space on a trade is not agood idea. Do yourself a favor and do not try and force alonger-term average on a short-term volatile stock. Again, the50 moving average can work as long as you use the indicator onstocks with less volatility.
It is better suited to trending stocks.
ConclusionThe moving average is an indicator which smoothes theprice action on the chart by averaging previous periods.The 50-day moving average is one of the most commonlyused indicators in stock trading.
It averages 50 periods of a stock on any time1.frame.Many investors and traders look at the 50-day2.
moving average.Therefore, the 50-day SMA is a psychological3.level, which can act as a support and resistance.
To trade with the 50-day SMA, you should remember theserules:
When the price breaks the 50-period SMA, you1.should trade in the direction of the breakout.You should place a stop-loss order beyond a bigger2.top/bottom before the breakout.You should stay in the trade until the price3.action breaks the 50-day moving average in theopposite direction.
The 50 day SMA combines well with the 200 day SMA:The crossover of the 50-day moving average vs.1.200-day moving average is called a golden cross.When you see a golden cross, you should look to2.get long.You should place a stop loss beyond a bigger3.top/bottom prior to the cross.You should hold the trade until the 50-period SMA4.is broken to the downside.
Additional ResourcesCheck out this great case study on both the 50-day and 200-daymoving averages on the S&P 500 if you want to learn more. Thestudy covers a longer-term view of the indicator but it isstill a great read and will provide some insights into yourtrading activity.
In addition, you can practice trading the strategies listed inthis article by using Tradingsim. You can apply the 50-daymoving average to both stocks and futures to get a feel forwhat works for you.
Better yet, we’ve added a new scan filter that allows you tofilter stocks to within a certain percentage of the 10, 20, 50or 200 moving averages.
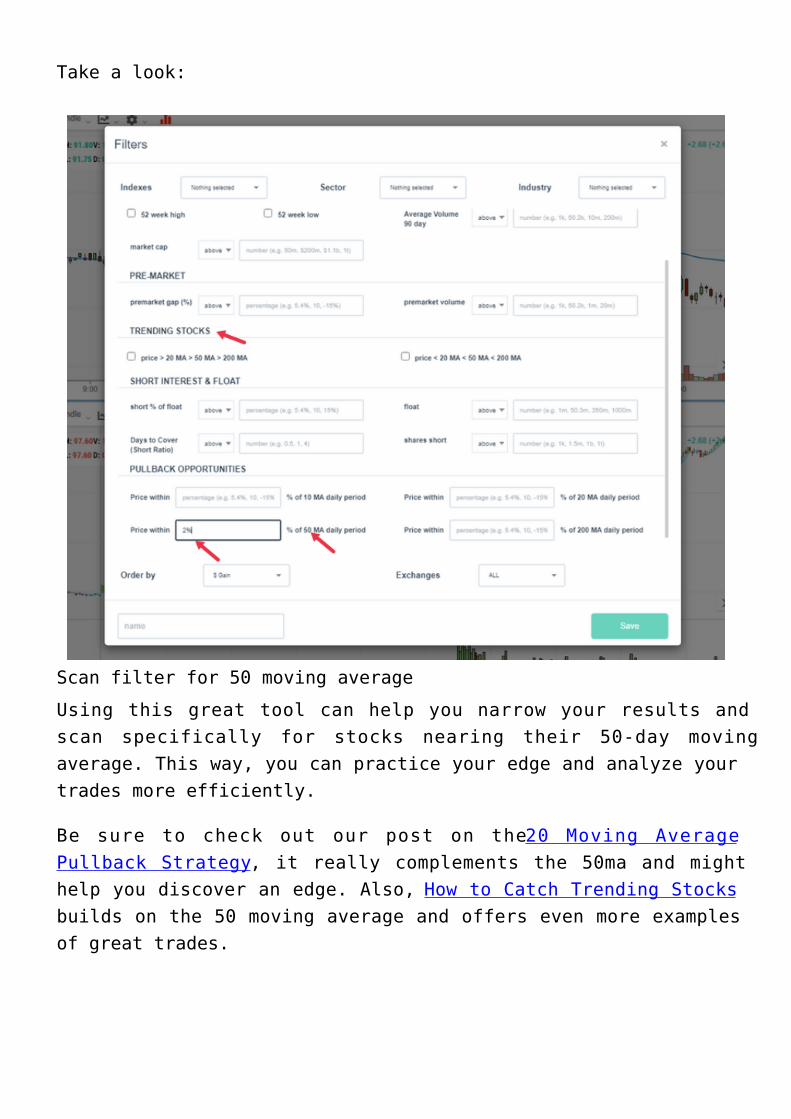
Take a look:
Scan filter for 50 moving average
Using this great tool can help you narrow your results andscan specifically for stocks nearing their 50-day movingaverage. This way, you can practice your edge and analyze yourtrades more efficiently.
Be sure to check out our post on the 20 Moving AveragePullback Strategy, it really complements the 50ma and mighthelp you discover an edge. Also, How to Catch Trending Stocksbuilds on the 50 moving average and offers even more examplesof great trades.

External ReferencesParets, JC. (2017). This is How I Use Moving Averages.1.allstarcharts.comMoving Averages. FinViz.com2.Golden Cross Signals. Yahoo Finance3.