moving average convergence
DESCRIPTION
MACDTRANSCRIPT
Moving Average Convergence-Divergence (MACD)
Introduction
Developed by Gerald Appel in the late seventies, the Moving Average Convergence-Divergence (MACD) indicator is one of the simplest and most effective momentum indicators available. The MACD turns two trend-following indicators, moving averages, into a momentum oscillator by subtracting the longer moving average from the shorter moving average. As a result, the MACD offers the best of both worlds: trend following and momentum. The MACD fluctuates above and below the zero line as the moving averages converge, cross and diverge. Traders can look for signal line crossovers, centerline crossovers and divergences to generate signals. Because the MACD is unbounded, it is not particularly useful for identifying overbought and oversold levels.
Note: MACD can be pronounced as either "MAC-DEE" or "M-A-C-D."
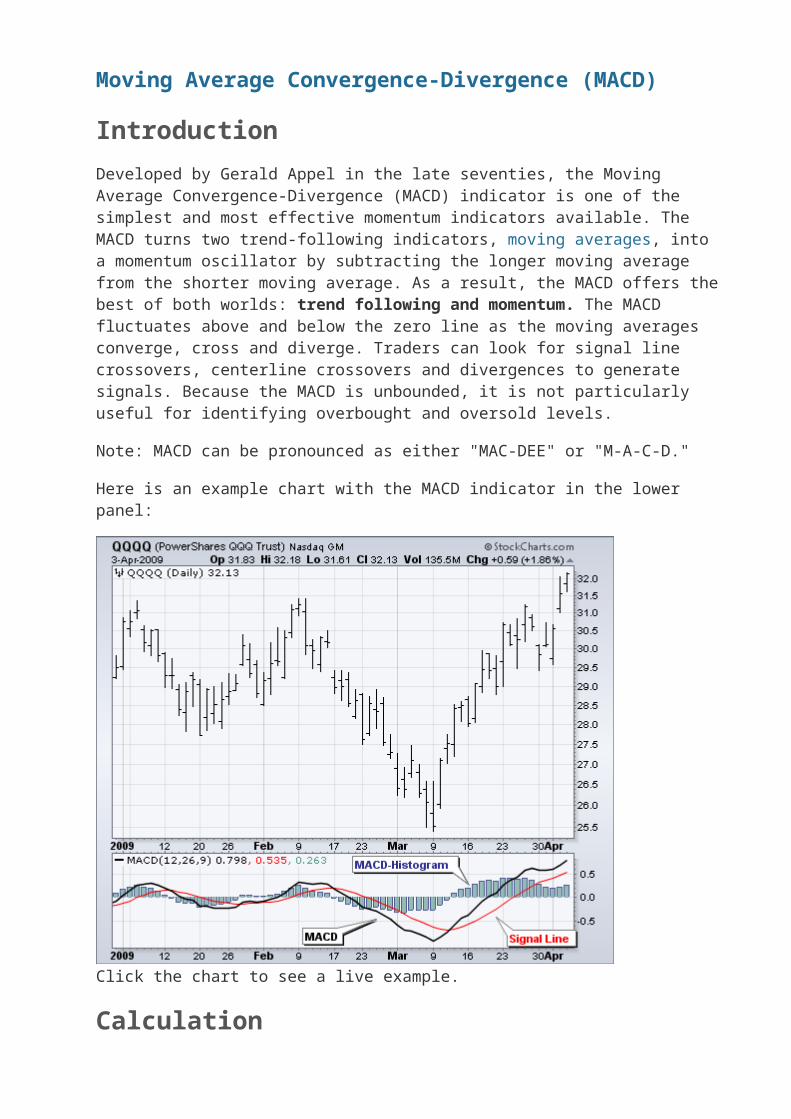
Here is an example chart with the MACD indicator in the lower panel:
Click the chart to see a live example.
CalculationMACD Line: (12-day EMA - 26-day EMA)
Signal Line: 9-day EMA of MACD Line
MACD Histogram: MACD Line - Signal Line
The MACD Line is the 12-day Exponential Moving Average (EMA) less the 26-day EMA. Closing prices are used for these moving averages. A 9-day EMA of the MACD Line is plotted with the indicator to act as a signal line and identify turns. The MACD Histogram represents the difference between MACD and its 9-day EMA, the Signal line. The histogram is positive when the MACD Line is above its Signal line and negative when the MACD Line is below its Signal line.
The values of 12, 26 and 9 are the typical setting used with the MACD, however other values can be substituted depending on your trading style and goals.
Interpretation
As its name implies, the MACD is all about the convergence and divergence of the two moving averages. Convergence occurs when the moving averages move towards each other. Divergence occurs when the moving averages move away from each other. The shorter moving average (12-day) is faster and responsible for most MACD movements. The longer moving average (26-day) is slower and less reactive to price changes in the underlying security.
The MACD Line oscillates above and below the zero line, which is also known as the centerline. These crossovers signal that the 12-day EMA has crossed the 26-day EMA. The direction, of course, depends on the direction of the moving average cross. Positive MACD indicates that the 12-day EMA is above the 26-day EMA. Positive values increase as the shorter EMA diverges further from the longer EMA. This means upside momentum is increasing. Negative MACD values indicates that the 12-day EMA is below the 26-day EMA. Negative values increase as the shorter EMA diverges further below the longer EMA. This means downside momentum is increasing.
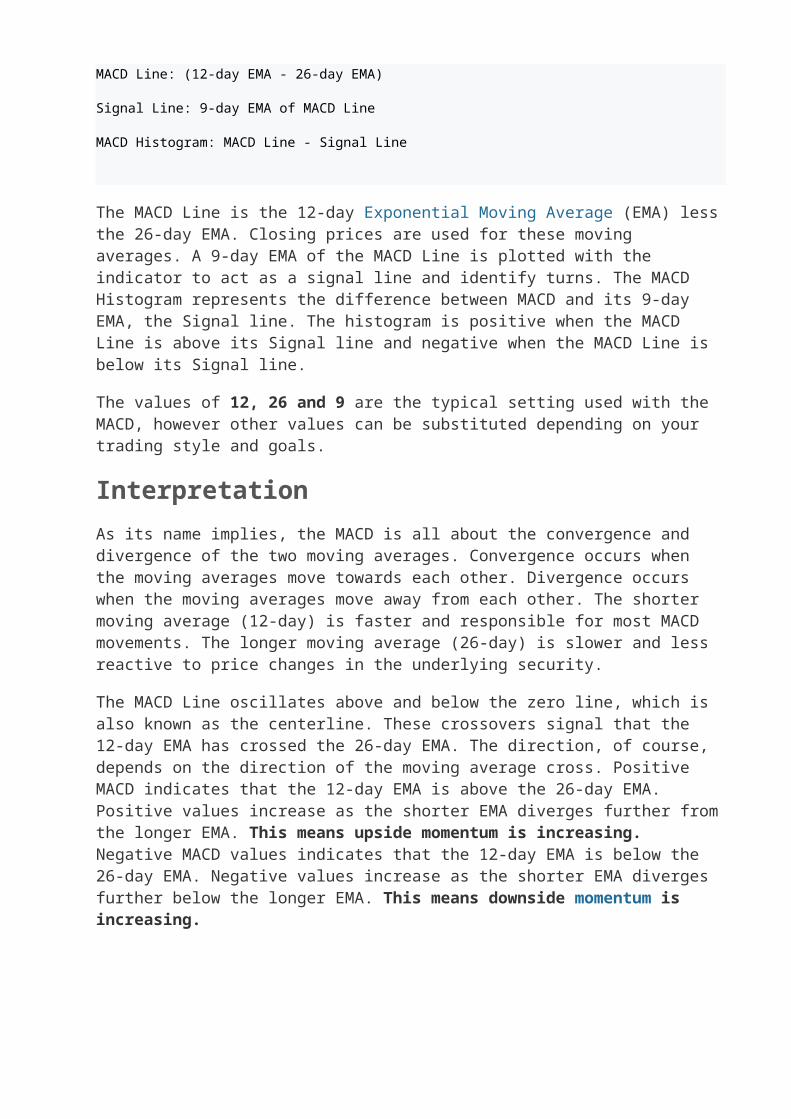
In the example above, the yellow area shows the MACD Line in negative territory as the 12-day EMA trades below the 26-day EMA. The initial cross occurred at the end of September (black arrow) and the MACD moved further into negative territory as the 12-day EMA diverged further from the 26-day EMA. The orange area highlights a period of positive MACD values, which is when the 12-day EMA was above the 26-day EMA. Notice that the MACD Line remained below 1 during this period (red dotted line). This means the distance between the 12-day EMA and 26-day EMA was less than 1 point, which is not a big difference.
Signal Line Crossovers
Signal line crossovers are the most common MACD signals. The signal line is a 9-day EMA of the MACD Line. As a moving average of the indicator, it trails the MACD and makes it easier to spot MACD turns. A bullish crossover occurs when the MACD turns up and crosses above the signal line. A bearish crossover occurs when the MACD turns down and crosses below the signal line. Crossovers can last a few days or a few weeks, it all depends on the strength of the move.
Due diligence is required before relying on these common signals. Signal line crossovers at positive or negative extremes should be viewed with caution. Even though the MACD does not have upper and lower limits, chartists can estimate historical extremes with a simple visual assessment. It takes a strong move in the underlying security to push momentum to an extreme. Even though the move may continue, momentum is likely to slow and this will usually produce a signal line crossover at the extremities. Volatility in the underlying security can also increase the number of crossovers.
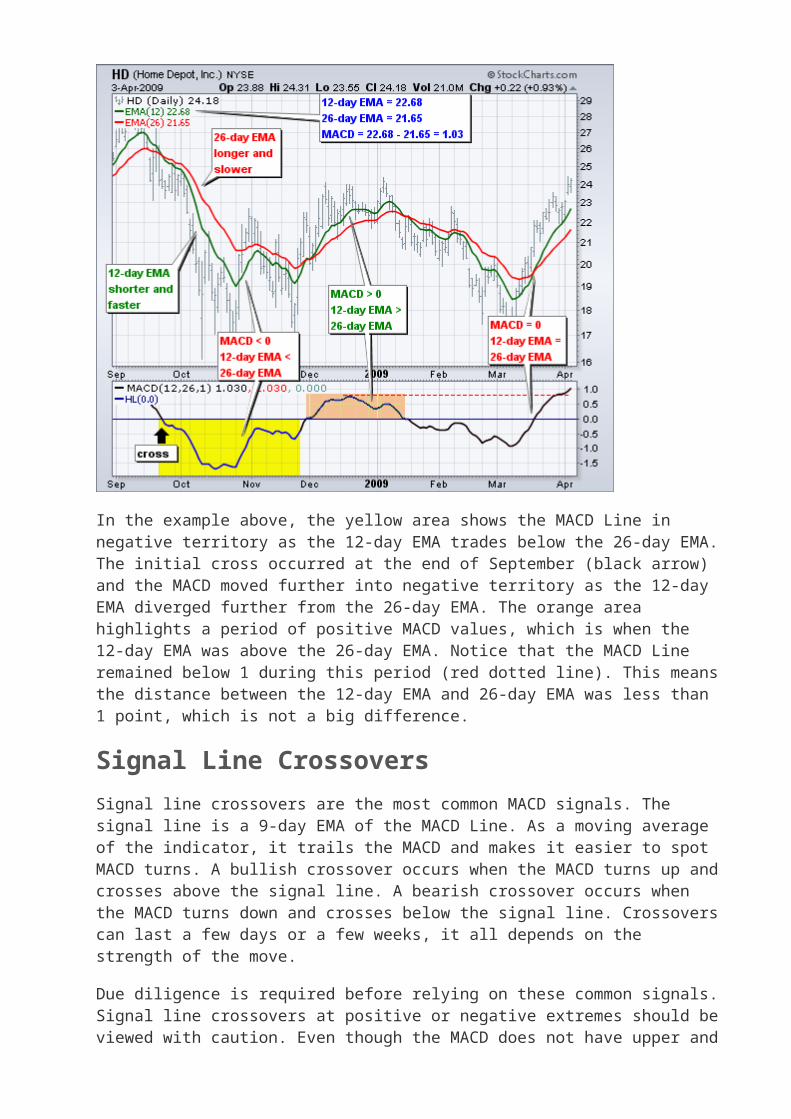
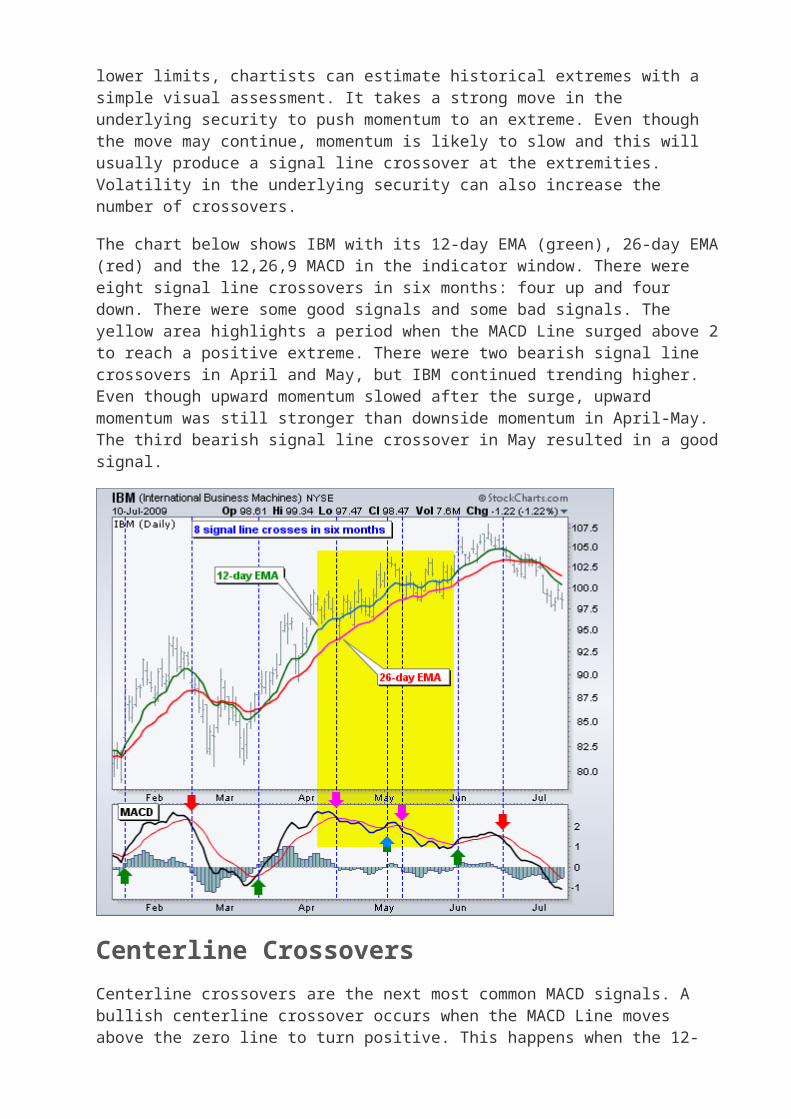
The chart below shows IBM with its 12-day EMA (green), 26-day EMA (red) and the 12,26,9 MACD in the indicator window. There were eight signal line crossovers in six months: four up and four down. There were some good signals and some bad signals. The yellow area highlights a period when the MACD Line surged above 2 to reach a positive extreme. There were two bearish signal line crossovers in April and May, but IBM continued trending higher. Even though upward momentum slowed after the surge, upward momentum was still stronger than downside momentum in April-May. The third bearish signal line crossover in May resulted in a good signal.
Centerline Crossovers
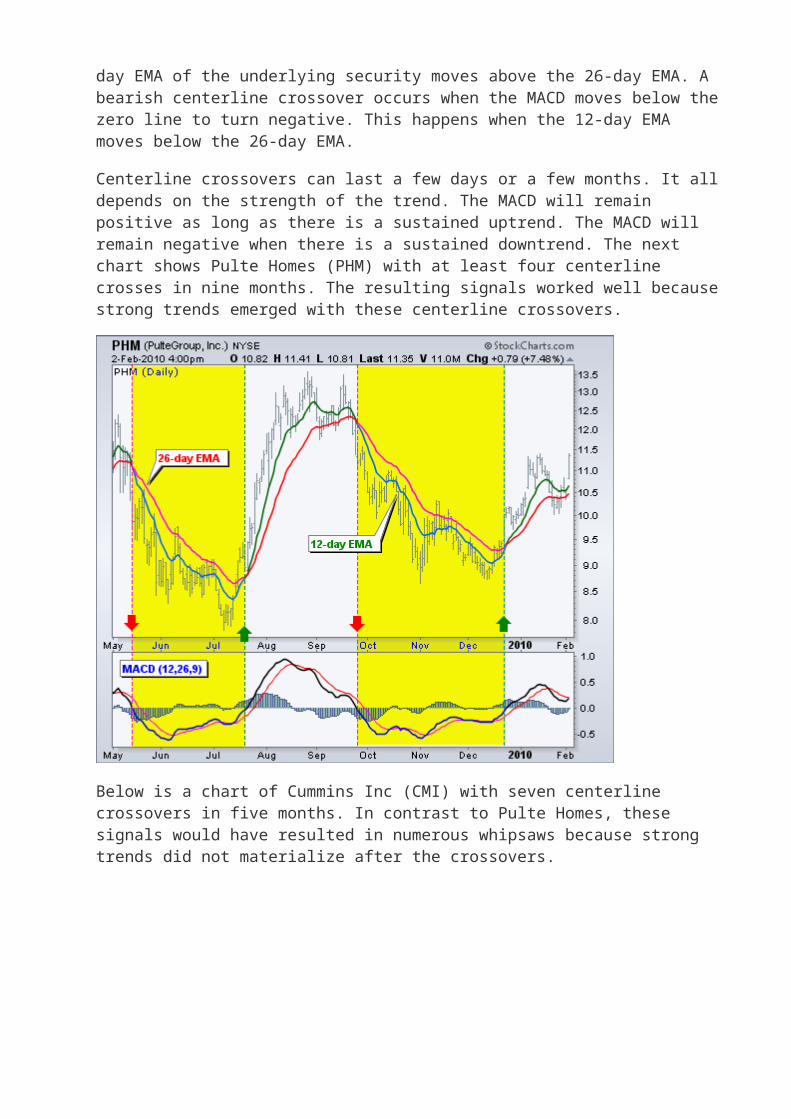
Centerline crossovers are the next most common MACD signals. A bullish centerline crossover occurs when the MACD Line moves above the zero line to turn positive. This happens when the 12-day EMA of the underlying security moves above the 26-day EMA. A bearish centerline crossover occurs when the MACD moves below the zero line to turn negative. This happens when the 12-day EMA moves below the 26-day EMA.
Centerline crossovers can last a few days or a few months. It all depends on the strength of the trend. The MACD will remain positive as long as there is a sustained uptrend. The MACD will remain negative when there is a sustained downtrend. The next chart shows Pulte Homes (PHM) with at least four centerline crosses in nine months. The resulting signals worked well because strong trends emerged with these centerline crossovers.
Below is a chart of Cummins Inc (CMI) with seven centerline crossovers in five months. In contrast to Pulte Homes, these signals would have resulted in numerous whipsaws because strong trends did not materialize after the crossovers.
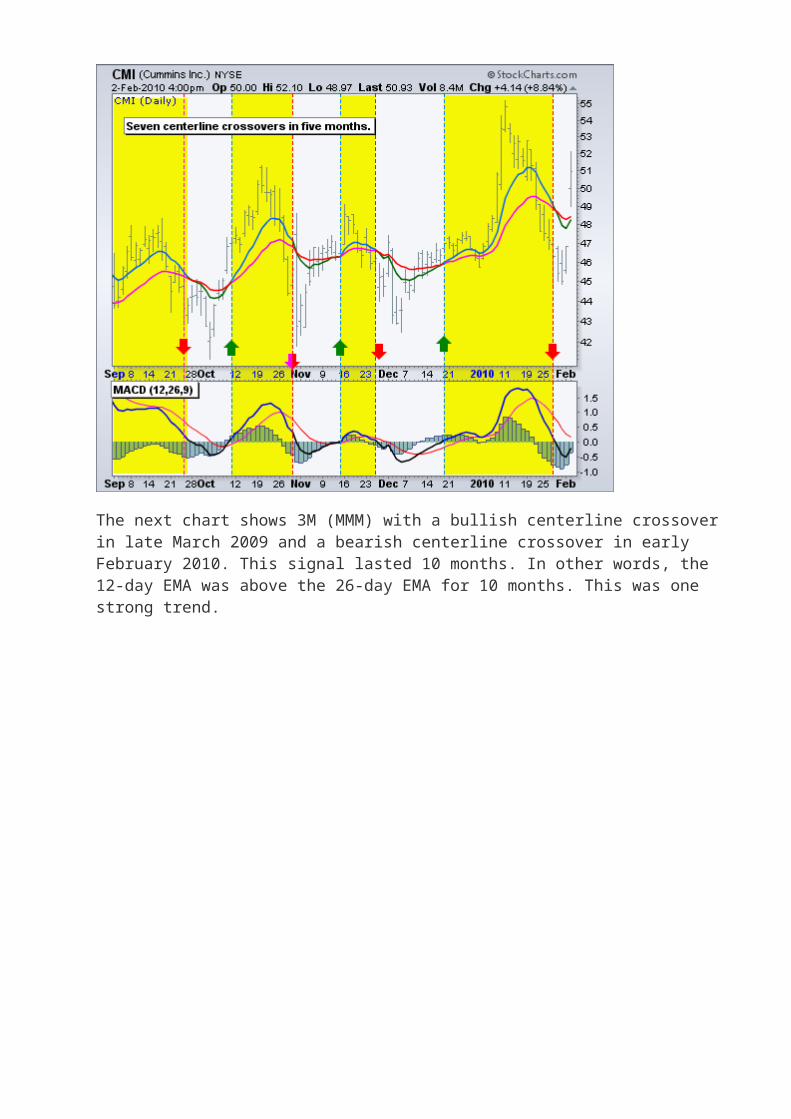
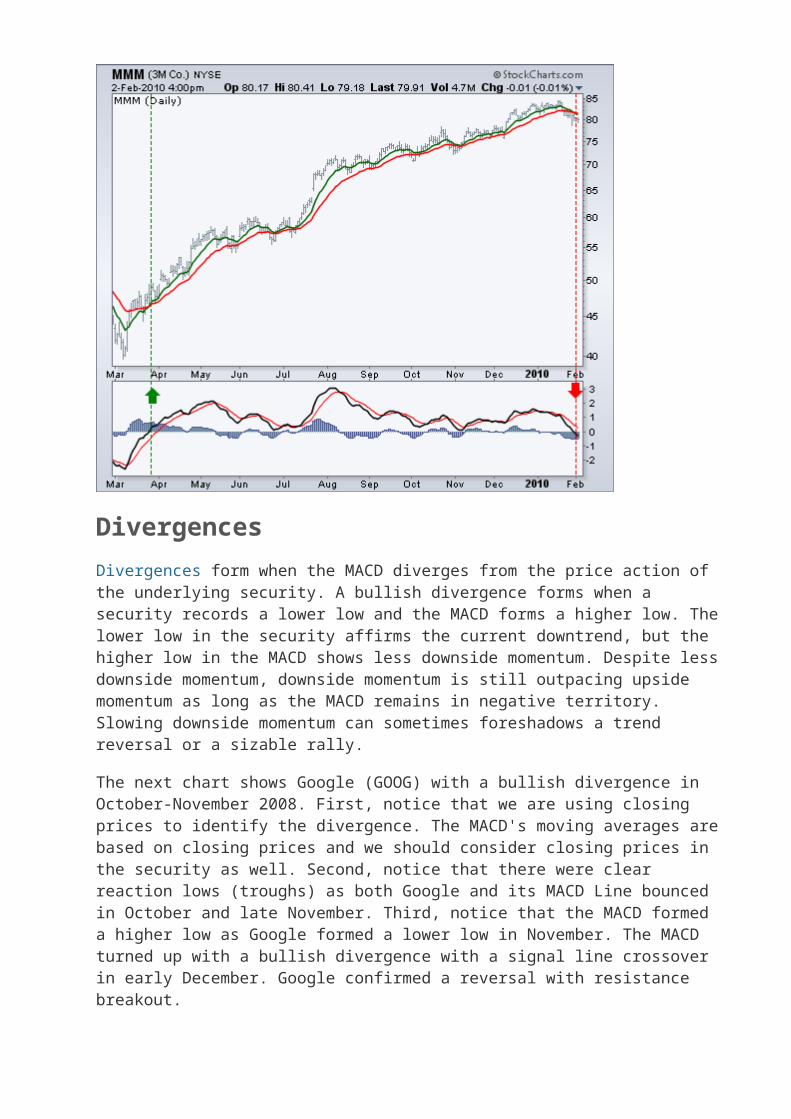
The next chart shows 3M (MMM) with a bullish centerline crossover in late March 2009 and a bearish centerline crossover in early February 2010. This signal lasted 10 months. In other words, the 12-day EMA was above the 26-day EMA for 10 months. This was one strong trend.
Divergences
Divergences form when the MACD diverges from the price action of the underlying security. A bullish divergence forms when a security records a lower low and the MACD forms a higher low. The lower low in the security affirms the current downtrend, but the higher low in the MACD shows less downside momentum. Despite less downside momentum, downside momentum is still outpacing upside momentum as long as the MACD remains in negative territory. Slowing downside momentum can sometimes foreshadows a trend reversal or a sizable rally.
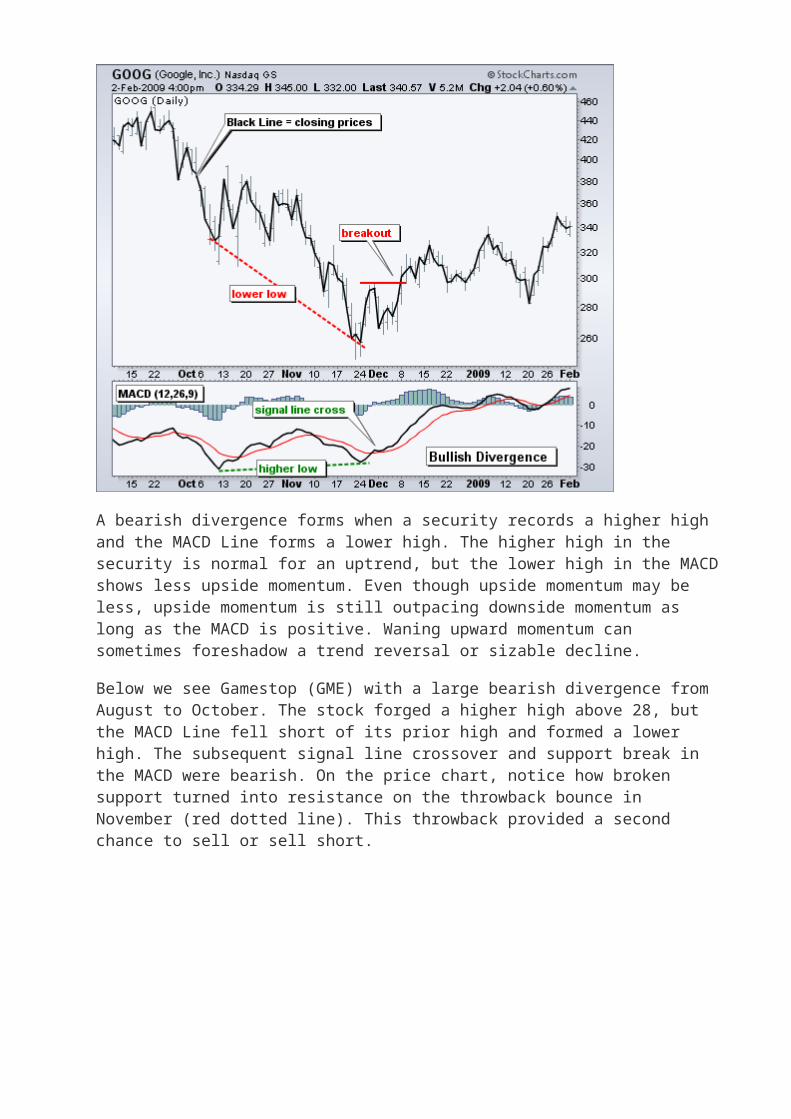
The next chart shows Google (GOOG) with a bullish divergence in October-November 2008. First, notice that we are using closing prices to identify the divergence. The MACD's moving averages are based on closing prices and we should consider closing prices in the security as well. Second, notice that there were clear reaction lows (troughs) as both Google and its MACD Line bounced in October and late November. Third, notice that the MACD formed a higher low as Google formed a lower low in November. The MACD turned up with a bullish divergence with a signal line crossover in early December. Google confirmed a reversal with resistance breakout.
A bearish divergence forms when a security records a higher high and the MACD Line forms a lower high. The higher high in the security is normal for an uptrend, but the lower high in the MACD shows less upside momentum. Even though upside momentum may be less, upside momentum is still outpacing downside momentum as long as the MACD is positive. Waning upward momentum can sometimes foreshadow a trend reversal or sizable decline.
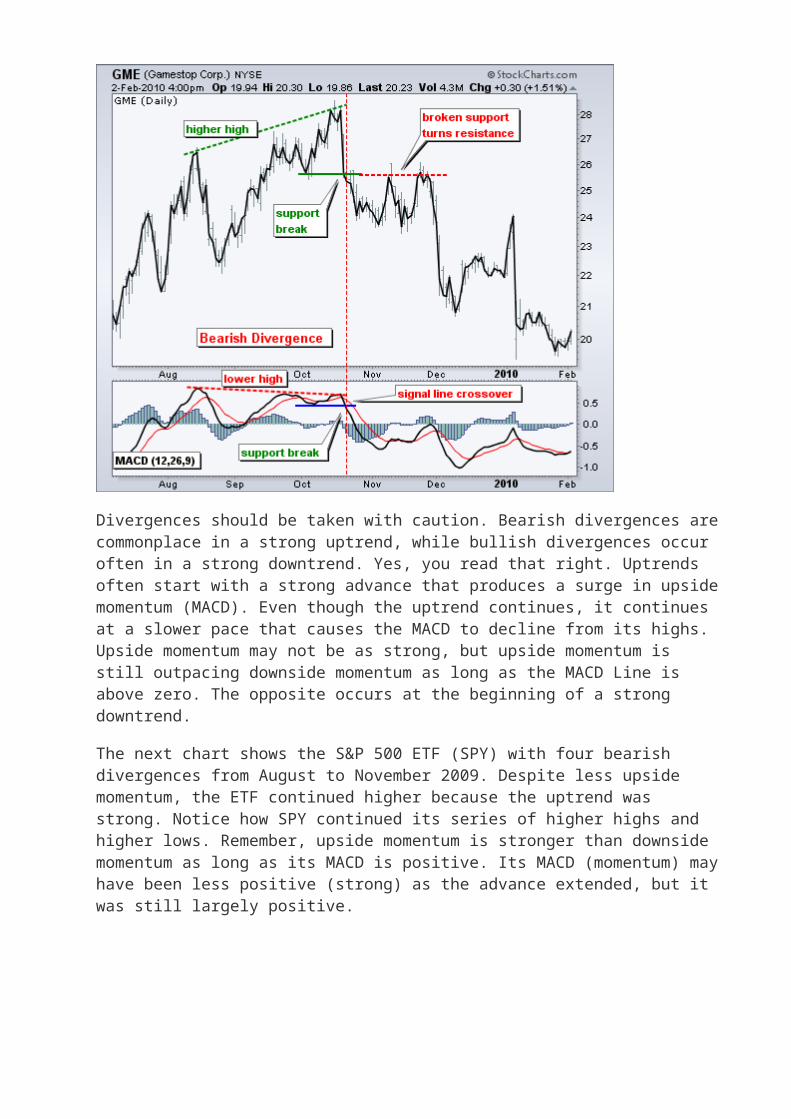
Below we see Gamestop (GME) with a large bearish divergence from August to October. The stock forged a higher high above 28, but the MACD Line fell short of its prior high and formed a lower high. The subsequent signal line crossover and support break in the MACD were bearish. On the price chart, notice how broken support turned into resistance on the throwback bounce in November (red dotted line). This throwback provided a second chance to sell or sell short.
Divergences should be taken with caution. Bearish divergences are commonplace in a strong uptrend, while bullish divergences occur often in a strong downtrend. Yes, you read that right. Uptrends often start with a strong advance that produces a surge in upside momentum (MACD). Even though the uptrend continues, it continues at a slower pace that causes the MACD to decline from its highs. Upside momentum may not be as strong, but upside momentum is still outpacing downside momentum as long as the MACD Line is above zero. The opposite occurs at the beginning of a strong downtrend.
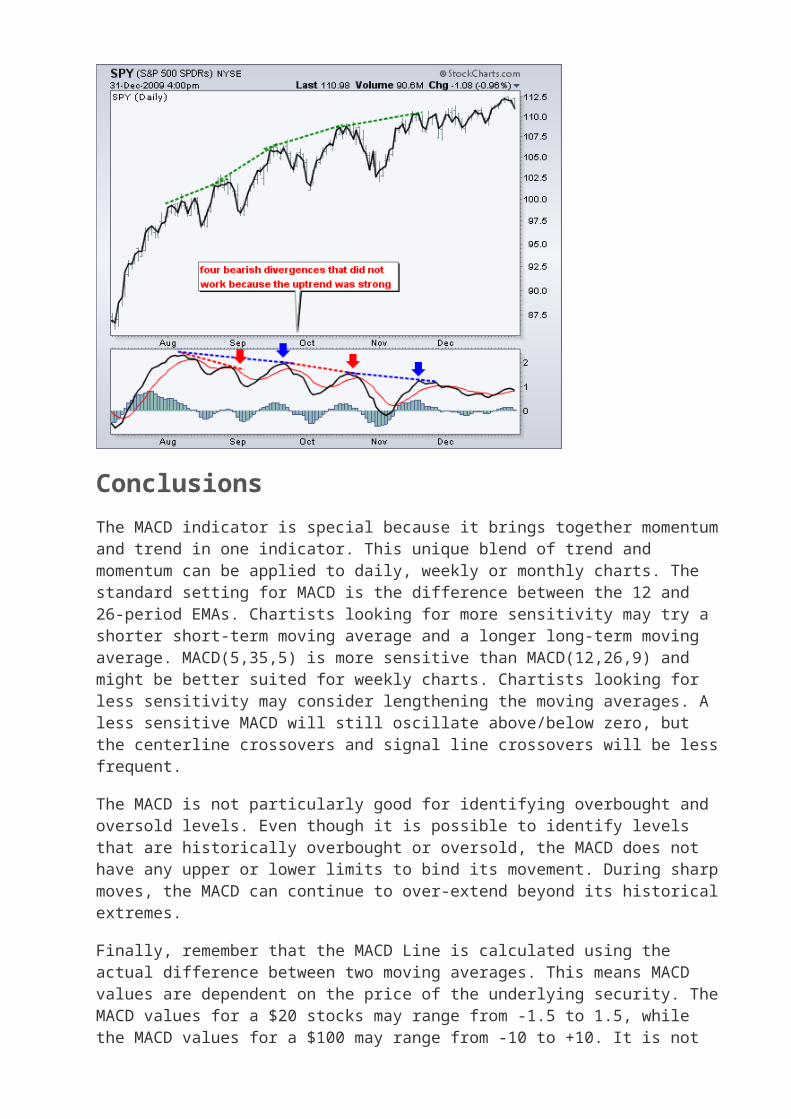
The next chart shows the S&P 500 ETF (SPY) with four bearish divergences from August to November 2009. Despite less upside momentum, the ETF continued higher because the uptrend was strong. Notice how SPY continued its series of higher highs and higher lows. Remember, upside momentum is stronger than downside momentum as long as its MACD is positive. Its MACD (momentum) may have been less positive (strong) as the advance extended, but it was still largely positive.
Conclusions
The MACD indicator is special because it brings together momentum and trend in one indicator. This unique blend of trend and momentum can be applied to daily, weekly or monthly charts. The standard setting for MACD is the difference between the 12 and 26-period EMAs. Chartists looking for more sensitivity may try a shorter short-term moving average and a longer long-term moving average. MACD(5,35,5) is more sensitive than MACD(12,26,9) and might be better suited for weekly charts. Chartists looking for less sensitivity may consider lengthening the moving averages. A less sensitive MACD will still oscillate above/below zero, but the centerline crossovers and signal line crossovers will be less frequent.
The MACD is not particularly good for identifying overbought and oversold levels. Even though it is possible to identify levels that are historically overbought or oversold, the MACD does not have any upper or lower limits to bind its movement. During sharp moves, the MACD can continue to over-extend beyond its historical extremes.
Finally, remember that the MACD Line is calculated using the actual difference between two moving averages. This means MACD values are dependent on the price of the underlying security. The MACD values for a $20 stocks may range from -1.5 to 1.5, while the MACD values for a $100 may range from -10 to +10. It is not possible to compare MACD values for a group of securities with varying prices. If you want to compare momentum readings, you should use the Percentage Price Oscillator (PPO), instead of the MACD.
Adding the MACD Indicator to SharpCharts
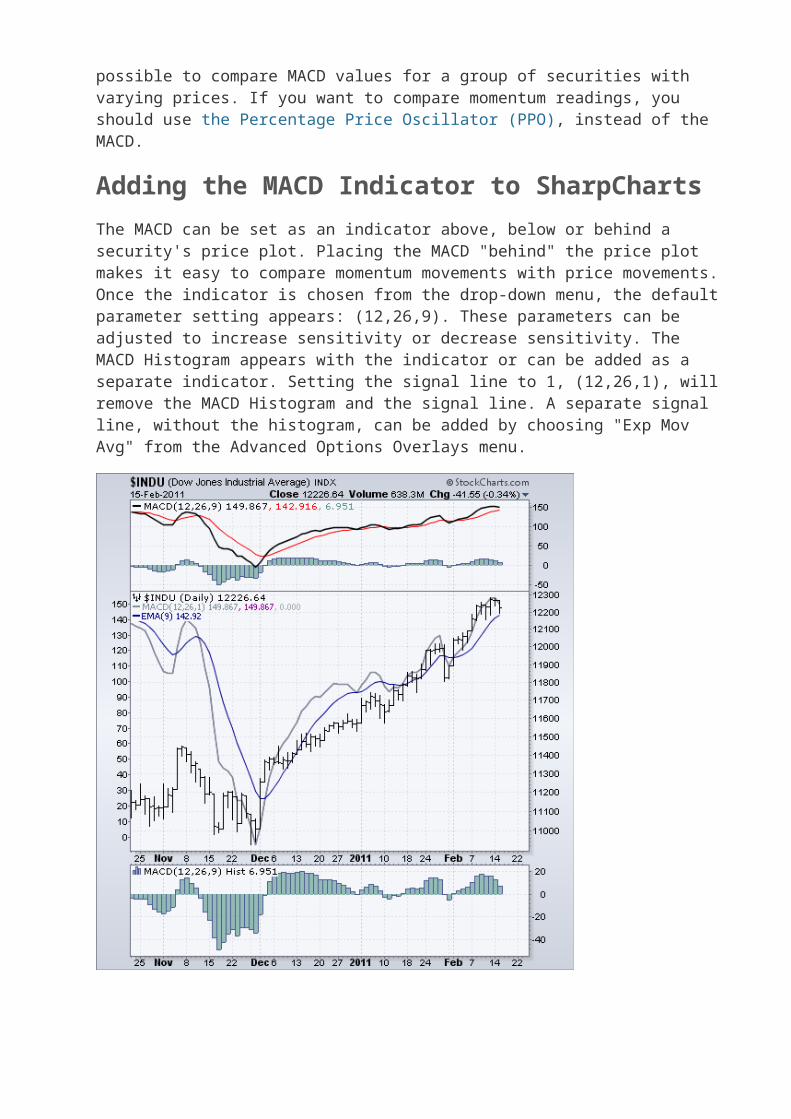
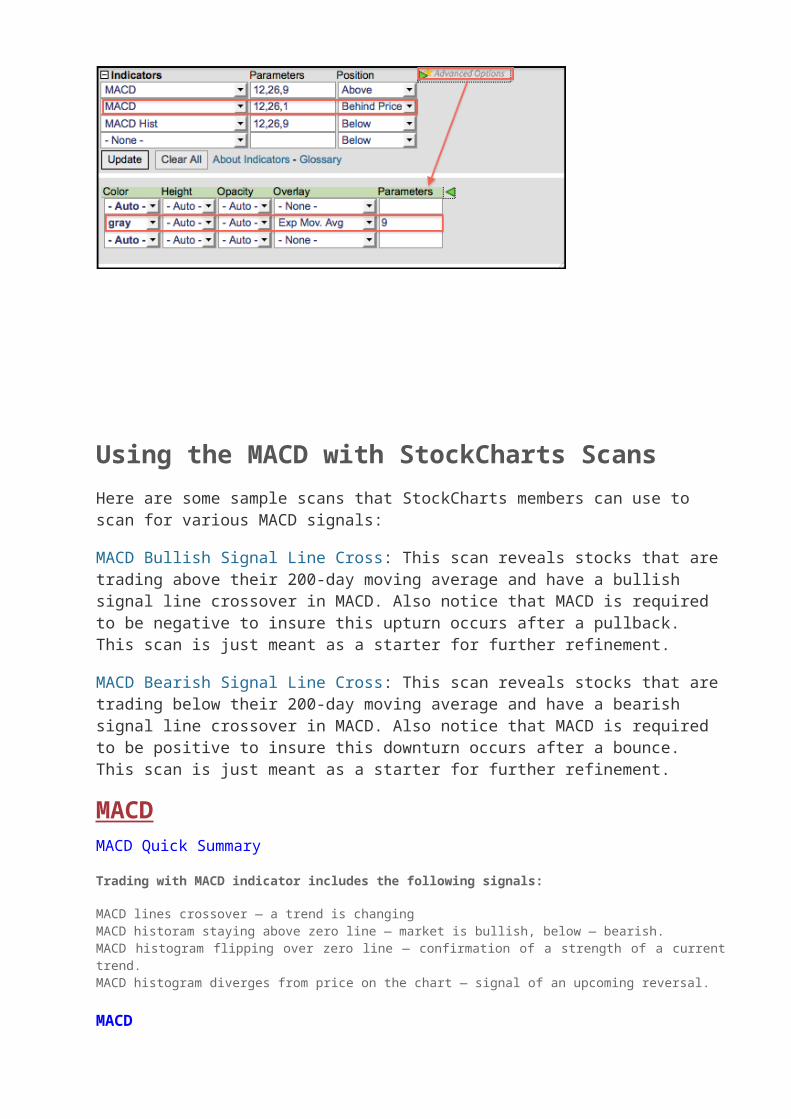
The MACD can be set as an indicator above, below or behind a security's price plot. Placing the MACD "behind" the price plot makes it easy to compare momentum movements with price movements. Once the indicator is chosen from the drop-down menu, the default parameter setting appears: (12,26,9). These parameters can be
adjusted to increase sensitivity or decrease sensitivity. The MACD Histogram appears with the indicator or can be added as a separate indicator. Setting the signal line to 1, (12,26,1), will remove the MACD Histogram and the signal line. A separate signal line, without the histogram, can be added by choosing "Exp Mov Avg" from the Advanced Options Overlays menu.
Using the MACD with StockCharts Scans
Here are some sample scans that StockCharts members can use to scan for various MACD signals:
MACD Bullish Signal Line Cross: This scan reveals stocks that are trading above their 200-day moving average and have a bullish signal line crossover in MACD. Also notice that MACD is required to be negative to insure this upturn occurs after a pullback. This scan is just meant as a starter for further refinement.
MACD Bearish Signal Line Cross: This scan reveals stocks that are trading below their 200-day moving average and have a bearish signal line crossover in MACD. Also notice that MACD is required to be positive to insure this downturn occurs after a bounce. This scan is just meant as a starter for further refinement.
MACDMACD Quick Summary
Trading with MACD indicator includes the following signals:
MACD lines crossover — a trend is changingMACD historam staying above zero line — market is bullish, below — bearish.MACD histogram flipping over zero line — confirmation of a strength of a current trend.MACD histogram diverges from price on the chart — signal of an upcoming reversal.
MACD
MACD is the simplest and very reliable indicators used by many Forex traders.
MACD (Moving Average Convergence/Divergence) has in its base Moving Averages.
It calculates and displays the difference between the two moving averages at any time. As the market moves, moving averages move with it, widening (diverging) when the market is trending and moving closer (converging) when the market is slowing down and possibility of a trend change arise.
Basics behind MACD indicator
Standard indicator settings for MACD (12, 26, 9) are used in many trading systems, and these are the setting that MACD developer Gerald Appel has found to be the most suitable for both faster and slower moving markets. In order to get a more responsive and faster performance from MACD one can can experiment with lowering MACD settings to, for example, MACD (6, 12, 5), MACD (7, 10, 5), MACD (5, 13, 8) etc.
These custom MACD settings will make indicator signal faster, however, the rate of false signals is going to increase.
MACD indicator is based on Moving Averages in their simplest form. MACD measures the difference between faster and slower moving average: 12 EMA and 26 EMA (standard).
MACD line is created when longer Moving Average is subtracted from shorter Moving Average. As a result a momentum oscillator is created that oscillates above and below zero and has no lower or upper limits. MACD also has a Trigger line. Combined in a simple lines crossover strategy, MACD line and trigger line crossover outperforms EMAs crossover.
Besides being early on crossovers MACD also is able to display where the chart EMAs have crossed: when MACD (12, 26, 9) flips over its zero line, if indicates that 12 EMA and 26 EMA on the chart have crossed.
How does MACD indicator work
If to take 26 EMA and imagine that it is a flat line, then the distance between this line and 12 EMA would represent the distance from MACD line to indicator's zero line.
The further MACD line goes from zero line, the wider is the gap between 12EMA and 26 EMA on the chart. The closer MACD moves to zero line, the closer are 12 and 26 EMA.
MACD histogram measures the distance between MACD line and MACD trigger line.
MACD indicator Formula
MACD = EMA(Close)period1 - EMA(Close)period2
Signal Line = EMA(MACD)period3
where
period1 = standard settings are 12 barsperiod2 = standard 26 barsperid3 = standard 9 bars
The following are the steps to calculate MACD1. Calculate the 12-days EMA of closing price2. Calculate the 26-days EMA of closing price3. MACD = 12-days EMA - 26-days EMA4. Signal Line = 9-days EMA of MACD
Formula for EMAEMA = (SC X (CP - PE)) + PESC = Smoothing Constant (Number of days)CP = Current PricePE = Previous EMA
Trading MACD Divergence
MACD indicator is famous for its MACD Divergence trading method.Divergence is found by comparing price shifts on the chart and MACD values.MACD Divergence phenomenon occur as a result of shifting forces on the Forex market.
For example, while Sellers may seem to be dominating the market at the moment and price continues to trend down, there already might be signals for an overall weakening of Sellers power. This key warning moments can be observed with MACD indicator. What Forex traders would see is that despite price making new Lower Lows, MACD doesn't confirm that and instead registers a Higher Low, signaling that Sellers are running out of steam and a trend change is on its way.
Opposite will be true for Buyers.
How to trade MACD Divergence
When MACD line (on our screenshot it is a blue line) crosses Signal line (red dotted line) - we have a point (top or bottom) to evaluate. With two most recent MACD line tops or bottoms find corresponding tops/bottoms on the price chart. Connect MACD tops/bottoms and chart tops/bottoms.
With MACD divergence spotted Enter the market when MACD line crosses over its zero point.
Another entry strategy is to find 2 most recent swings high or low on the chart and draw a trend line trough them; and then set an Entry order on the breakout of that trend line.
MACD divergence trading method used not only to predict trend turning points, but also for trend confirmation. A current trend has high potentials to continue unchanged in case no divergence between MACD and price was established after most recent tops/bottoms evaluation.