表インターフェースのための 属性付きグラフとアルゴリズム attribute...
DESCRIPTION
表インターフェースのための 属性付きグラフとアルゴリズム Attribute Graphs and Their Algorithms for Table Interface. ○ 本橋友江 ( 早稲田大学 ) 土田賢省 ( 東洋大学 ) 夜久竹夫 ( 日本大学 ) WAAP 110 May.11 th , 2002. 1. Introduction. Position and Scope Data Processing Number Character Strings Picture : Tables, Charts, Graphs, - PowerPoint PPT PresentationTRANSCRIPT
1
表インターフェースのための 属性付きグラフとアルゴ
リズムAttribute Graphs and Their Algorithms
for Table Interface
○ 本橋友江 ( 早稲田大学 )土田賢省 ( 東洋大学 )夜久竹夫 ( 日本大学 )
WAAP 110 May.11th, 2002
2
Position and ScopeData Processing
NumberCharacter StringsPicture : Tables, Charts, Graphs,
PicturesScope
Tables in Spread Sheet or WordEditing, Drawing, Calculation
1. Introduction
3
BackgroundEffectiveness of Table Processing depends on Representation Methods of Table. Known Representation Methods
Quad-Tree Representation For Search Algorithm
Rectangular Dual Graph Representation
For Plant Layout
4
ProblemsIn present table processing systems,
Editing operation often cause unexpected results.We do not know which Representation Methods is applied.
Quad-tree Rep. and Rectangular Dual Graph Rep. are not for table editing and drawing.
5
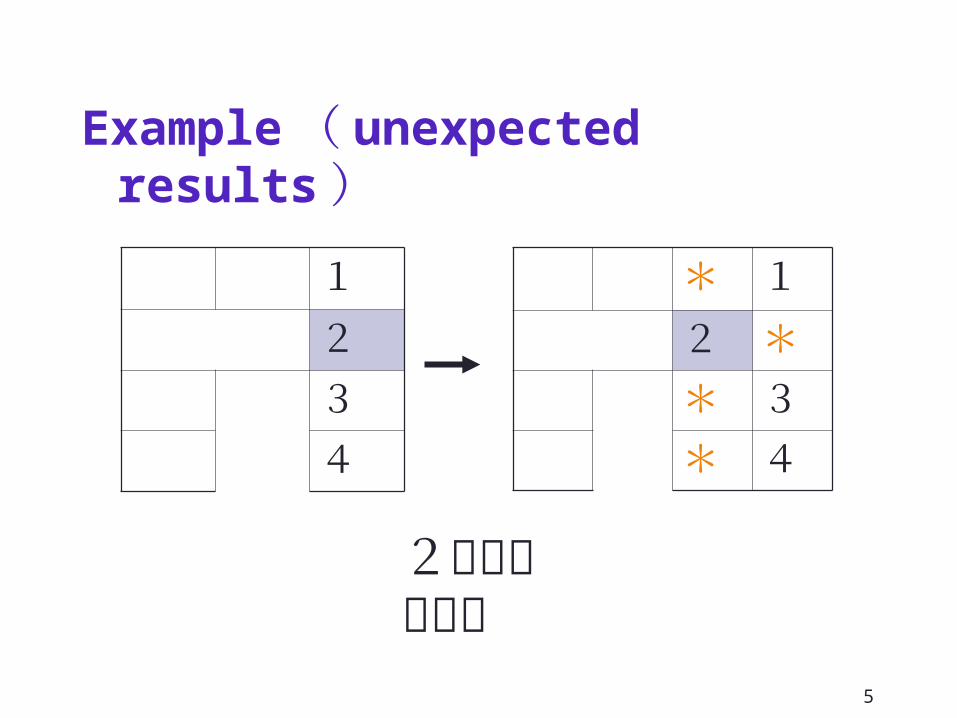
Example( unexpected results)
2を指定列挿入
1234
* 12 ** 3* 4
6
Our HistoryTree structured diagrams
Attributed marked treesCombinatorial drawing algorithms
Modular forms Attributed marked trees
7
Our Purpose1. To propose Graph
Representation Methods for tables in consideration of editing and drawing.
2. To investigate mathematical properties of the graphs in the representation methods.
3. To introduce typical algorithms on graphs and evaluate their complexity.
8
Our Results1. A Graph representation method
is proposed.2. Properties of the graph is shown
|nodes|in the graph = |cells| in the table.
The degrees of nodes ≦ 8.3. Algorithms for Wall move and
Column Insertion are introduced,
and runs in linear time.
9
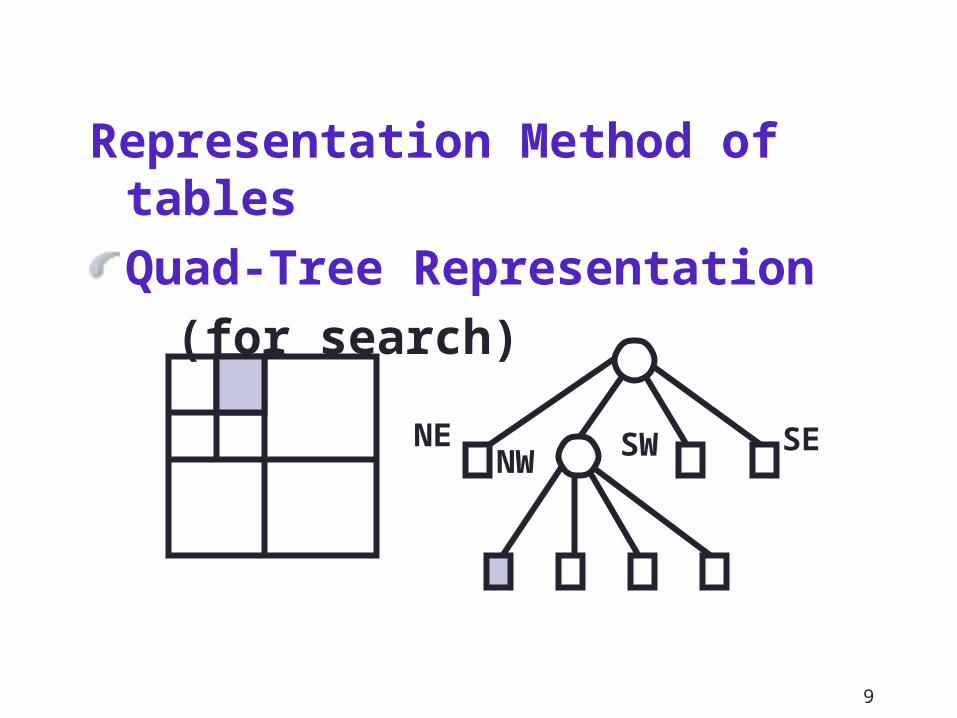
Representation Method of tablesQuad-Tree Representation
(for search)
NENW SW SE
10
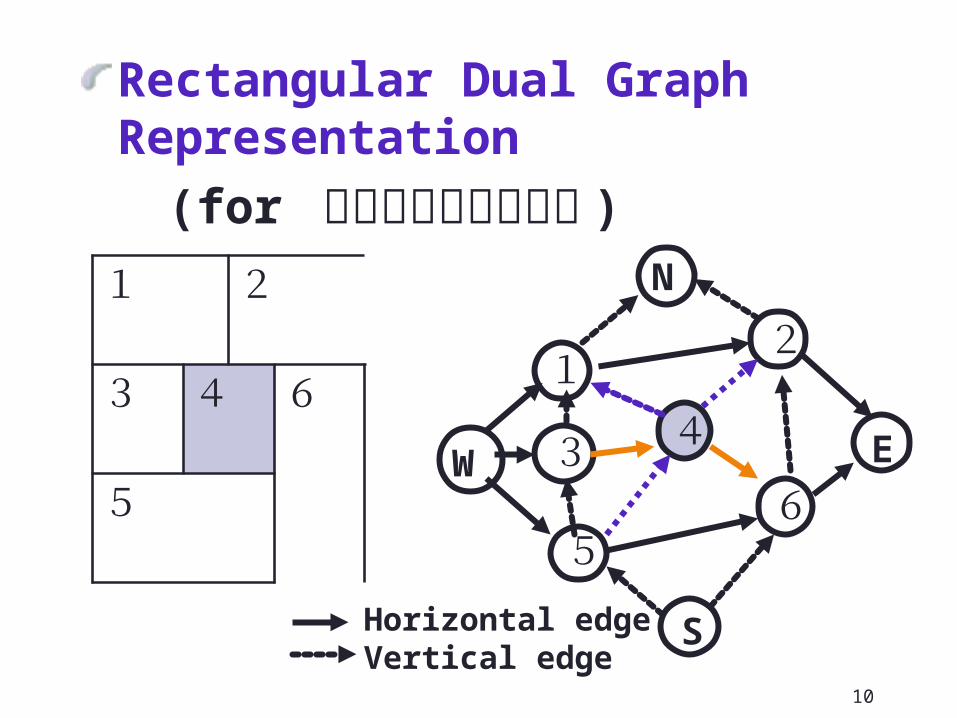
Rectangular Dual Graph Representation
(for プラントレイアウト )
Horizontal edgeVertical edge
12
3 4
56
W
N
E
S
1 2
3 4 6
5
11
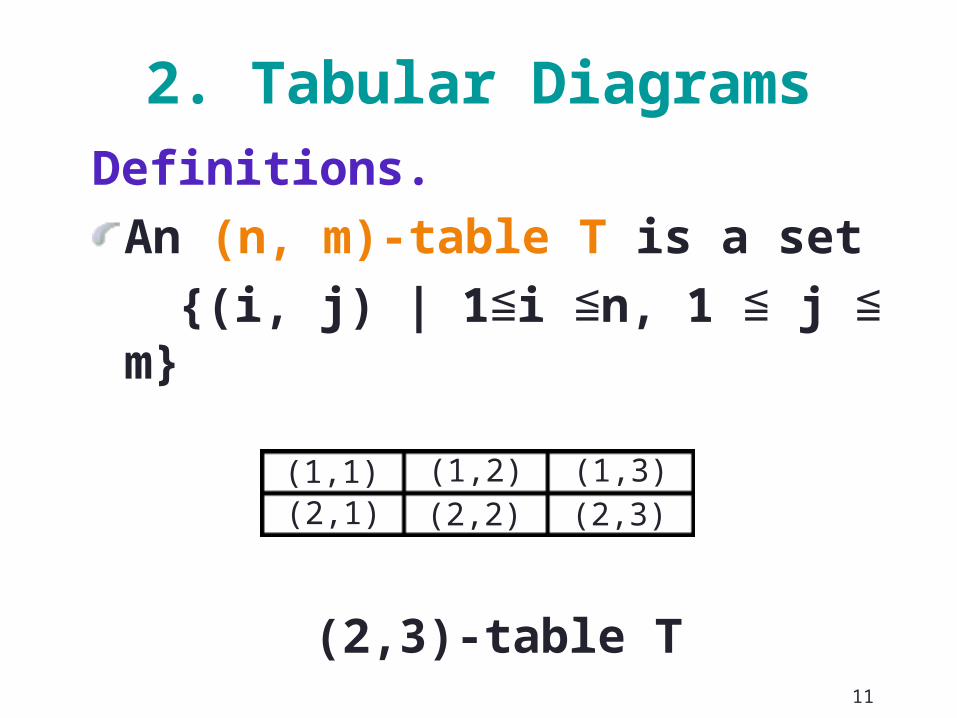
2. Tabular Diagrams
Definitions. An (n, m)-table T is a set
{(i, j) | 1≦i ≦n, 1 ≦ j ≦ m}
(2,3)-table T
(1,1) (1,2)(2,2)
(1,3)(2,1) (2,3)
12
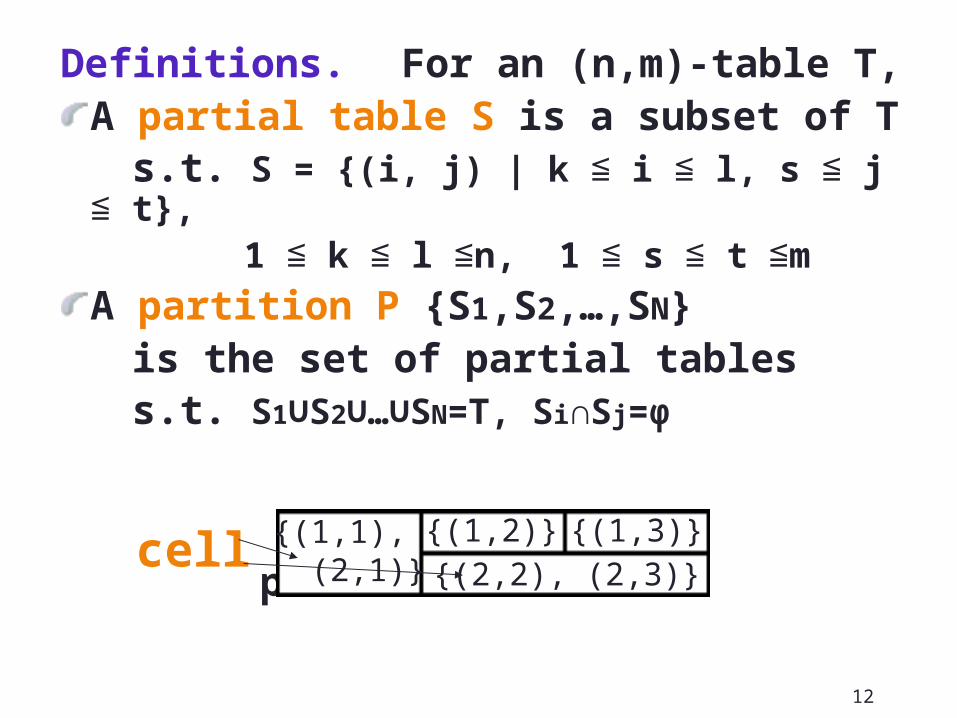
Definitions. For an (n,m)-table T, A partial table S is a subset of T
s.t. S = {(i, j) | k ≦ i ≦ l, s ≦ j ≦ t}, 1 ≦ k ≦ l ≦n, 1 ≦ s ≦ t ≦m
A partition P {S1,S2,…,SN} is the set of partial tables s.t. S1∪S2∪…∪SN=T, Si∩Sj=φ
partition P2 over T
cell {(1,1), (2,1)}
{(1,2)}{(2,2), (2,3)}
{(1,3)}
13
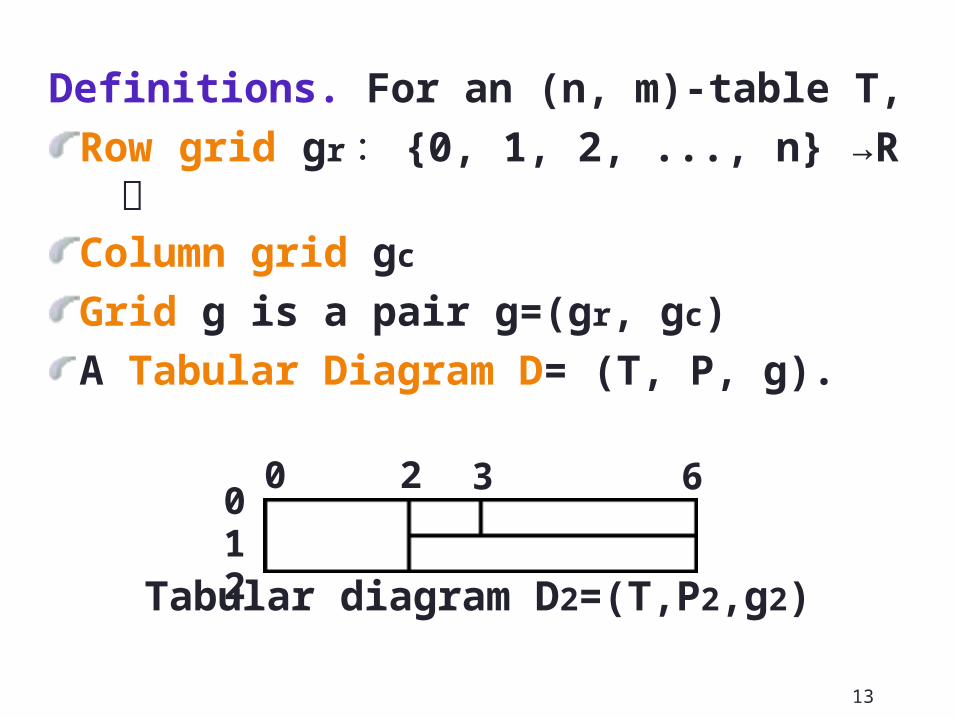
Definitions. For an (n, m)-table T,Row grid gr : {0, 1, 2, ..., n} →R 増Column grid gc
Grid g is a pair g=(gr, gc)A Tabular Diagram D= (T, P, g).
Tabular diagram D2=(T,P2,g2)
0 2 3 60
21
14
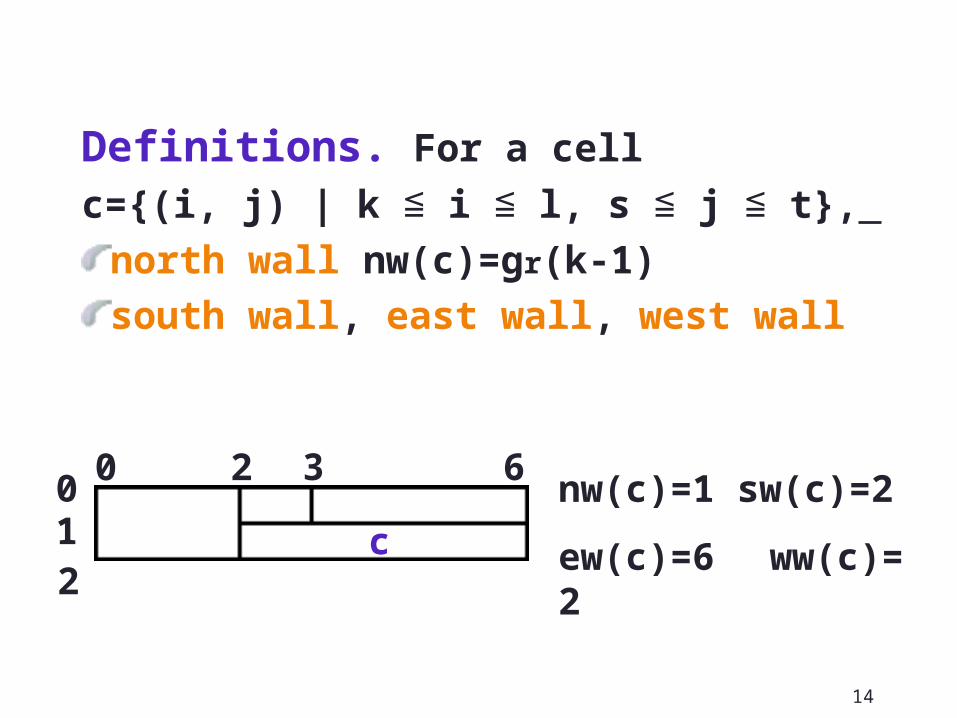
Definitions. For a cell c={(i, j) | k ≦ i ≦ l, s ≦ j ≦ t},
north wall nw(c)=gr(k-1)south wall, east wall, west wall
0 2 3 60
21 c
nw(c)=1 sw(c)=2
ew(c)=6 ww(c)=2
15
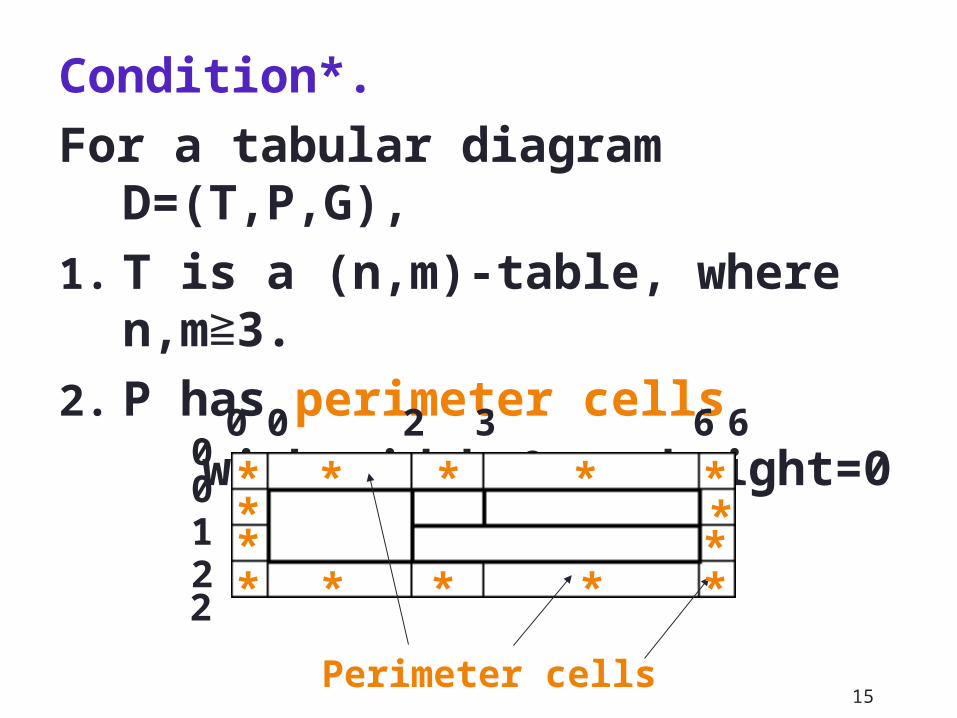
Condition*.For a tabular diagram
D=(T,P,G),1. T is a (n,m)-table, where
n,m≧3.2. P has perimeter cells with width=0 or height=0
Perimeter cells
0 2 3 6
0
21
2
00
6
*
* ******
* *
****
16
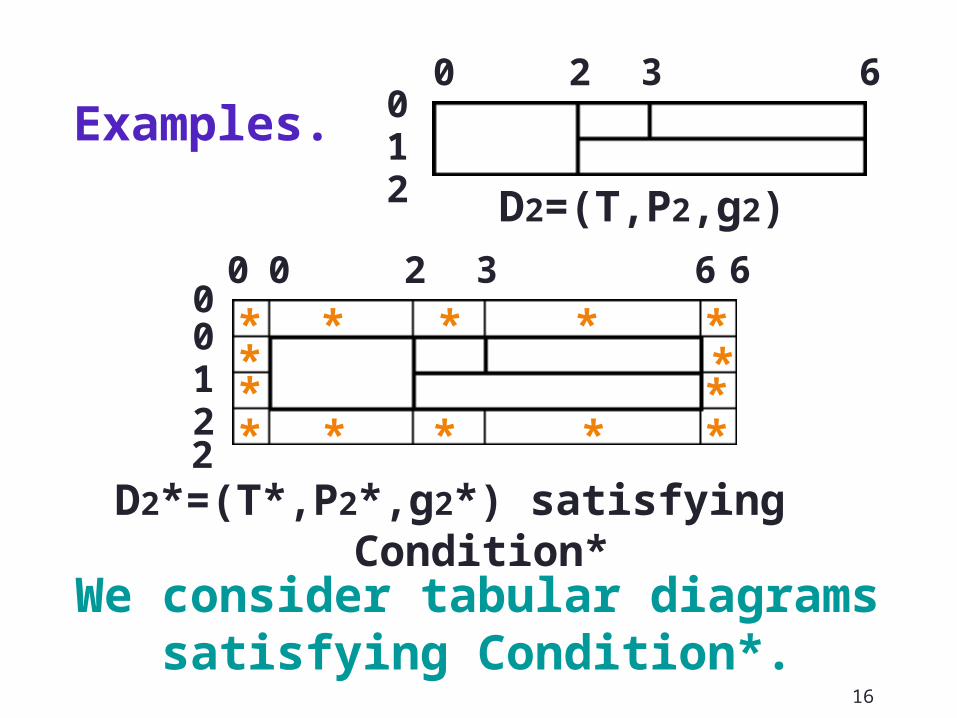
Examples.
D2=(T,P2,g2)
We consider tabular diagramssatisfying Condition*.
D2*=(T*,P2*,g2*) satisfying Condition*
0 2 3 60
21
0 2 3 6
0
21
2
00
6
*
* ******
* *
****
17
3. Graph Representation of Tables
Operations on Editing Tables Wall moving Insertion/deletion/unification
of Row/column/cell Requirements
computational complexitySuitable correspondence
18
Definitions.An attribute graph is a 6-tuple
G=(V,E,L,λ,A,α), where(V,E) : multi edge graph L : label set for edgesλ : E→L is the label functionA is the set of attributeα : V→A is the attribute map
19
Graph representation of tablesA Tabular Diagram D=(T,P,g) is repres
ented as an attribute graph GD=(VD,ED,L,λD,A,αD)
VD is identified by a partition Pnode⇔cell. We denote a node vc for the cell c,
20
L={enw,esw,eew,eww},Equal north wall, equal south wall, …
A = R4, αD : VD →R4 are defined for vc by αD(vc)=
(nw(c),sw(c),ew(c),ww(c)).
21
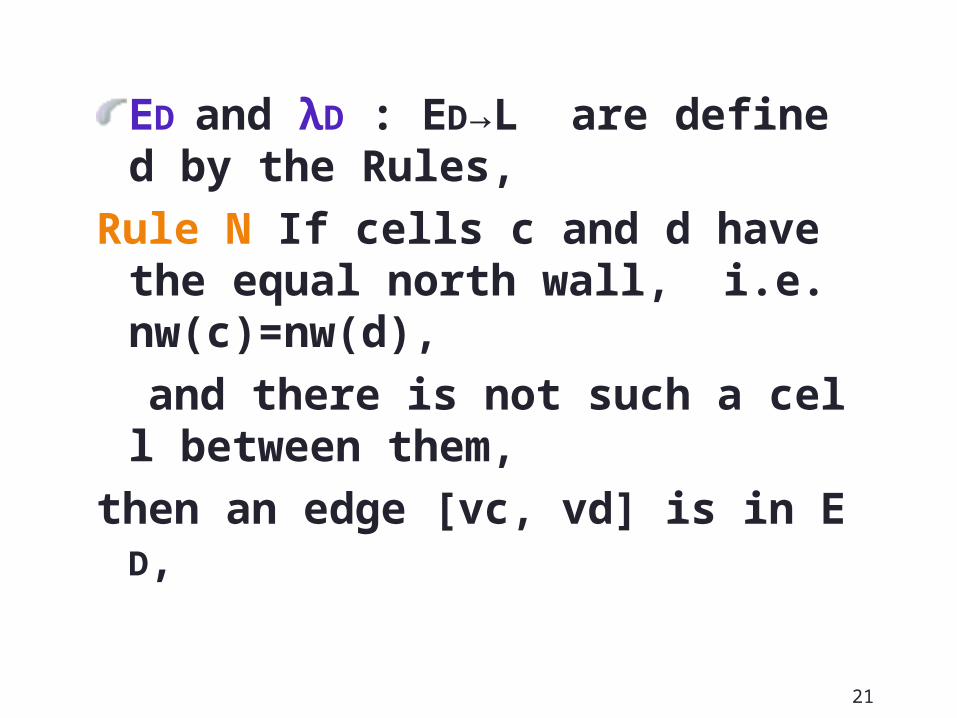
ED and λD : ED→L are defined by the Rules,
Rule N If cells c and d have the equal north wall, i.e. nw(c)=nw(d),
and there is not such a cell between them,
then an edge [vc, vd] is in ED,
22
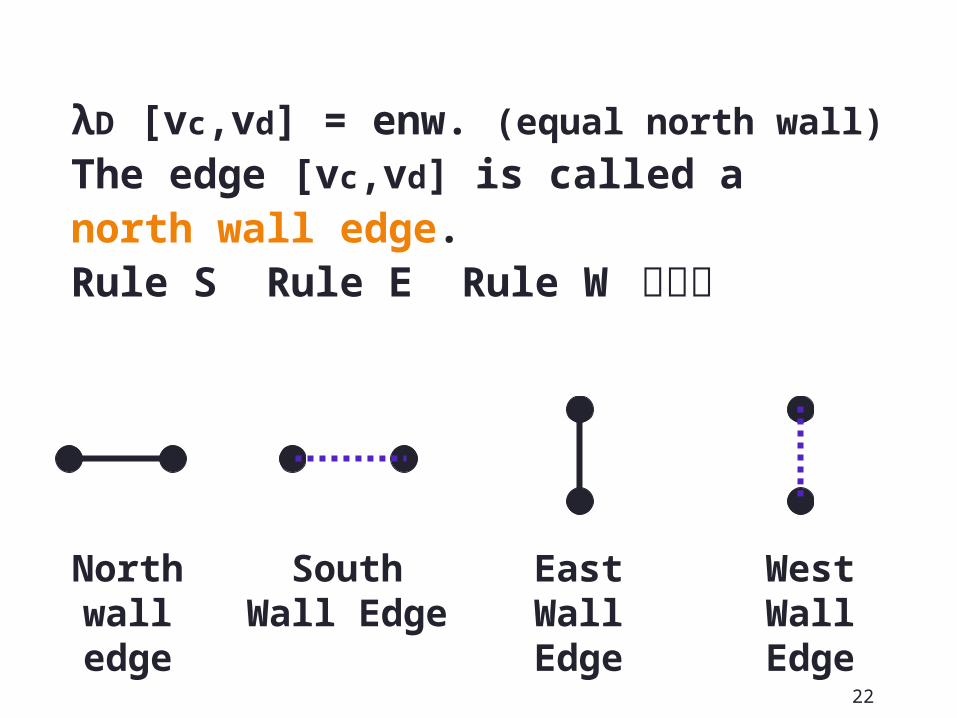
λD [vc,vd] = enw. (equal north wall)The edge [vc,vd] is called a north wall edge. Rule S Rule E Rule W も同様
North wall edge
South Wall Edge
East Wall Edge
West Wall Edge
23
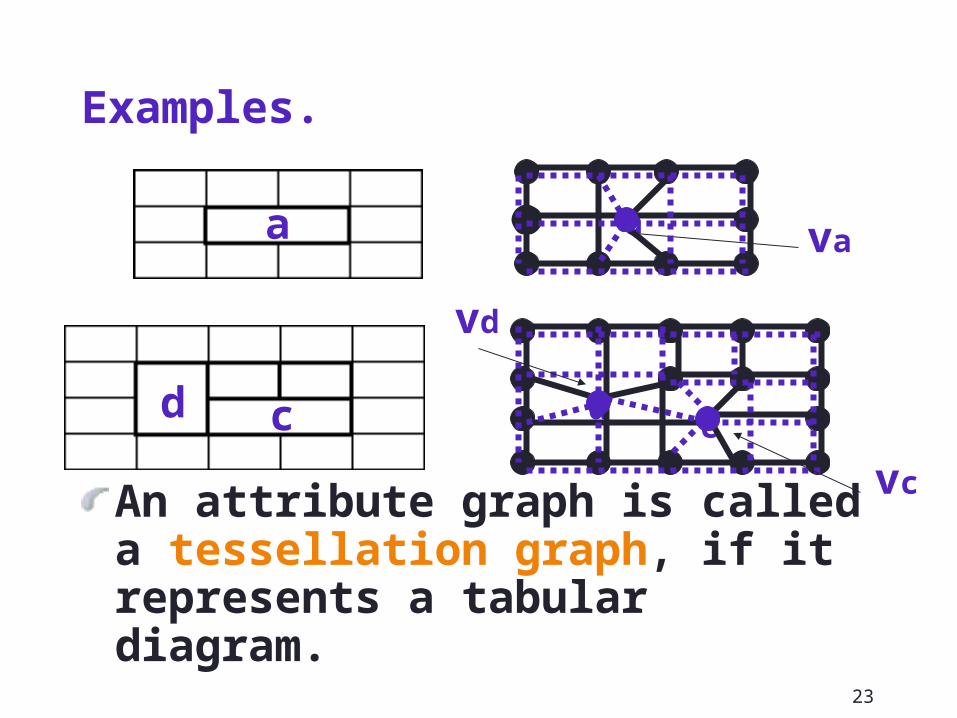
Examples.
An attribute graph is called a tessellation graph, if it represents a tabular diagram.
dc
vd
vc
a vaa
d c
24
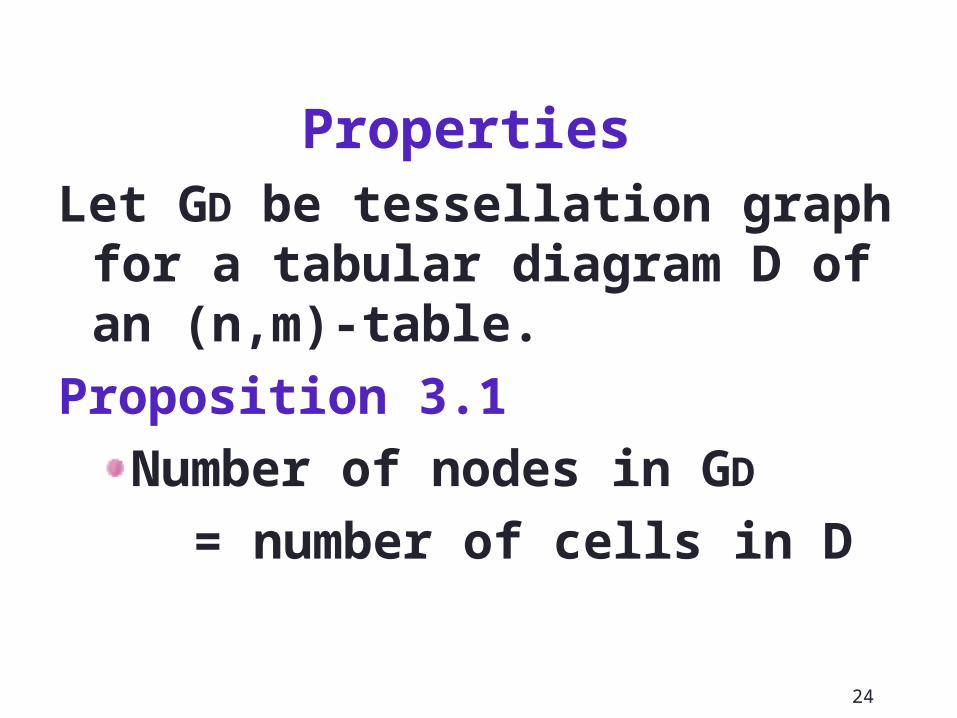
Properties
Let GD be tessellation graph for a tabular diagram D of an (n,m)-table.
Proposition 3.1Number of nodes in GD
= number of cells in D
25
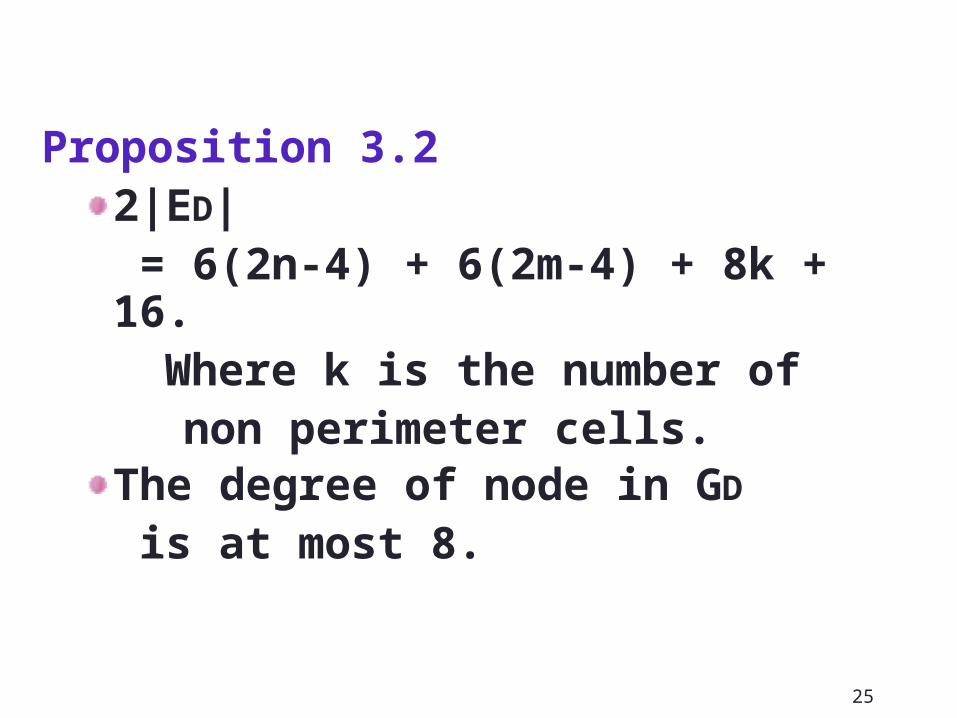
Proposition 3.22|ED| = 6(2n-4) + 6(2m-4) + 8k + 16.
Where k is the number of non perimeter cells.The degree of node in GD
is at most 8.
26
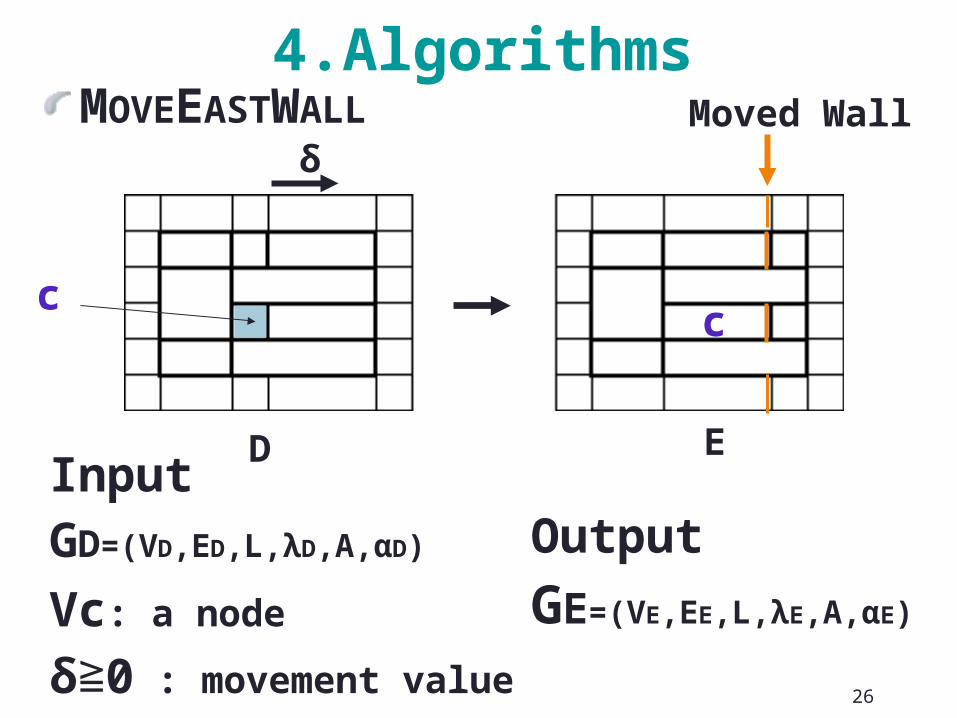
4.AlgorithmsMOVEEASTWALL
Output
GE=(VE,EE,L,λE,A,αE)
InputGD=(VD,ED,L,λD,A,αD)
Vc: a node δ≧0 : movement value
c
δ
D E
c
Moved Wall
27
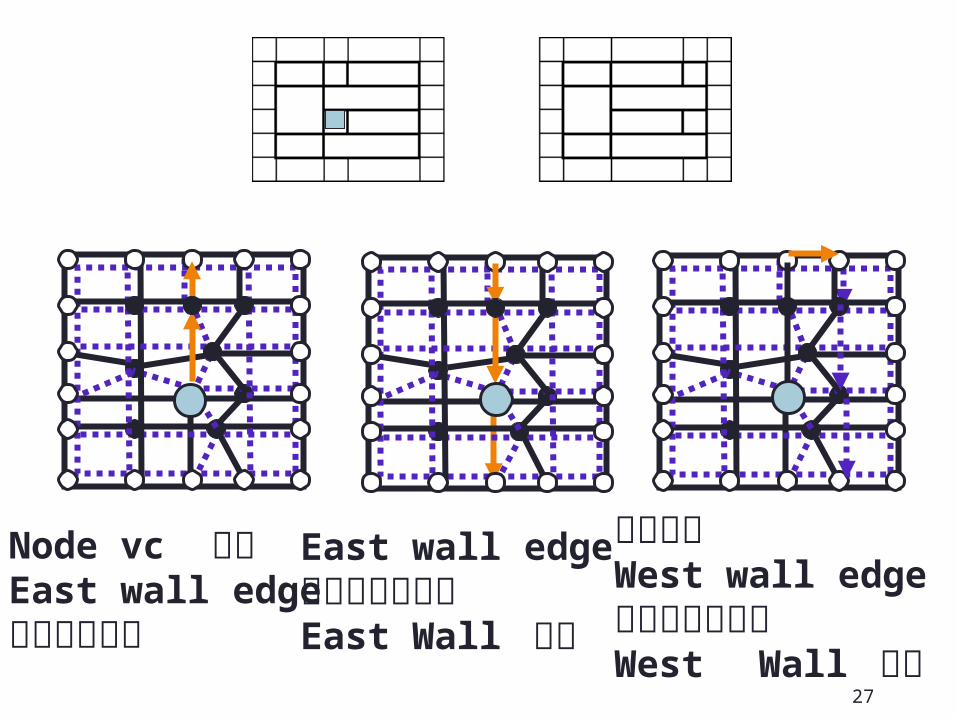
Node vc からEast wall edge を上にたどる
East wall edge をたどりながらEast Wall 変更
隣の列をWest wall edgeをたどりながらWest Wall 変更
28
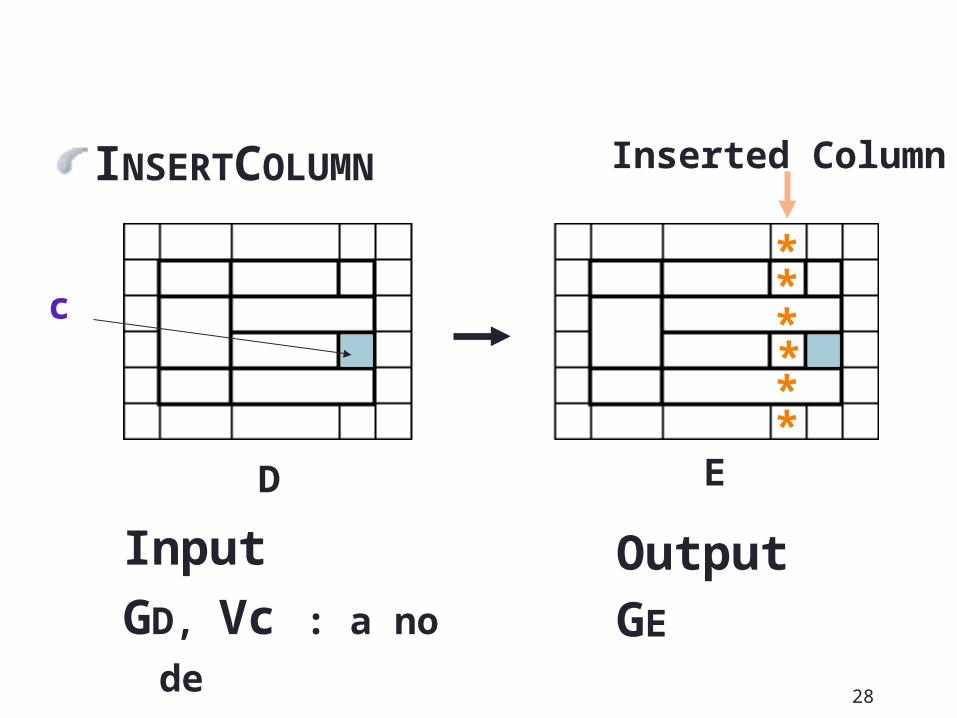
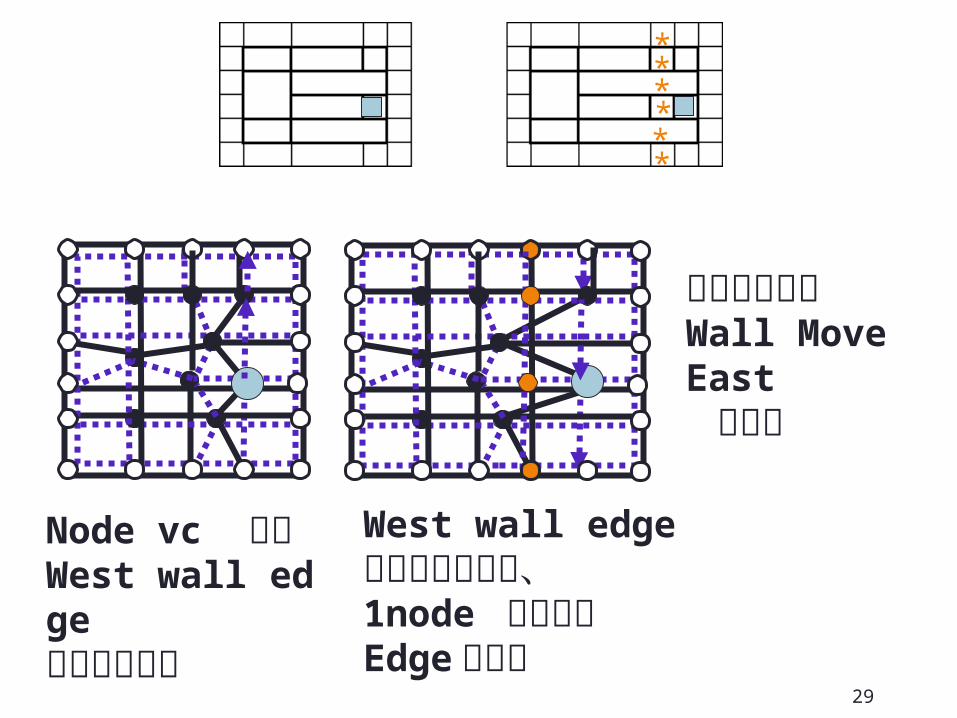
INSERTCOLUMN
OutputGE
Input GD, Vc : a node
c
D E
Inserted Column
**
**
**
29
Node vc からWest wall edge を上にたどる
West wall edge をたどりながら、1node ずつ追加Edge の更新
新しい列以東Wall Move East を行う
******
30
For a tabular diagram D of (n,m)-table,
Theorem4.1Algorithm MOVEEASTWALL
runs in O(n) time.
31
Theorem 4.2Algorithm INSERTCOLUMN runs in O(nm) time.
RemarkAlgorithm INSERTCOLUMN visits only nodes which needs to change attributes.
32
summary1. An attribute Graph rep. method
is proposed.2. Properties of the graph is
shown|nodes|in the graph
= |cells| in the table. The degrees of nodes ≦ 8.
3. Algorithms for Wall move and Column Insertion runs in linear time.
5. Conclusion
33
Future WorksXML Viewer for tessellation graph. Other Algorithms for Editing CommandsPractical Processing SystemsGraph Grammars for generate tessellation graphsConditions of tessellation graph
34
35
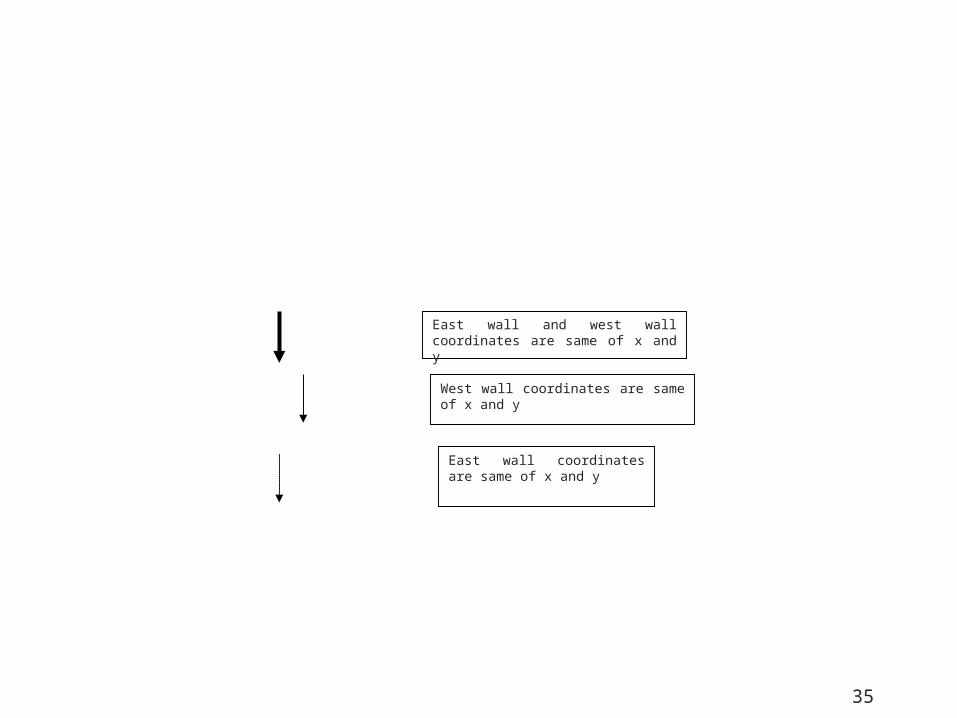
East wall and west wall coordinates are same of x and y
West wall coordinates are same of x and y
East wall coordinates are same of x and y
36
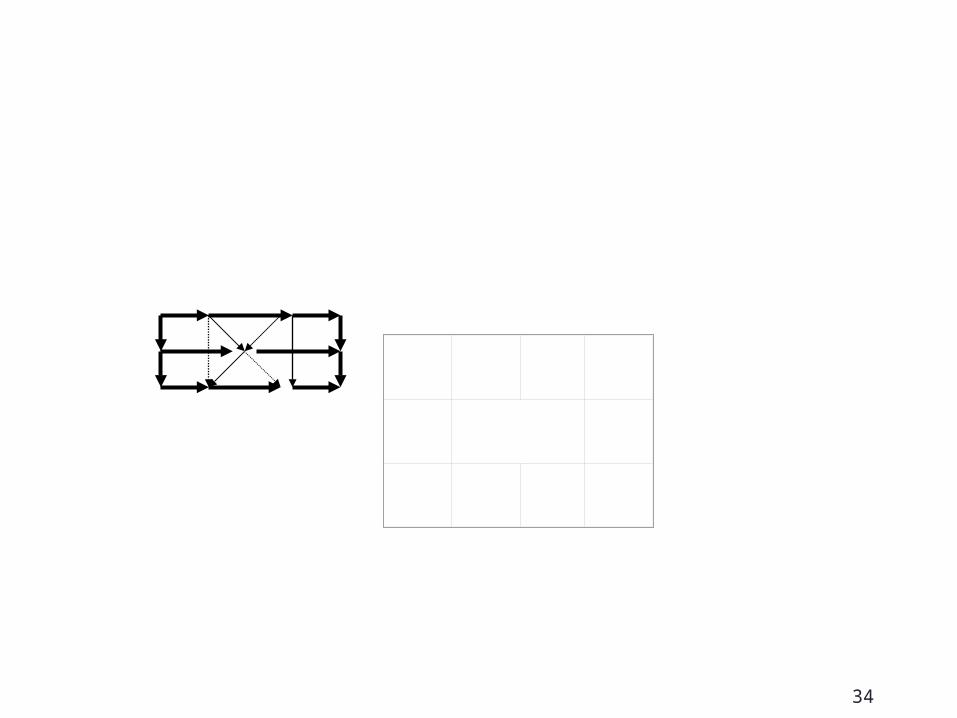
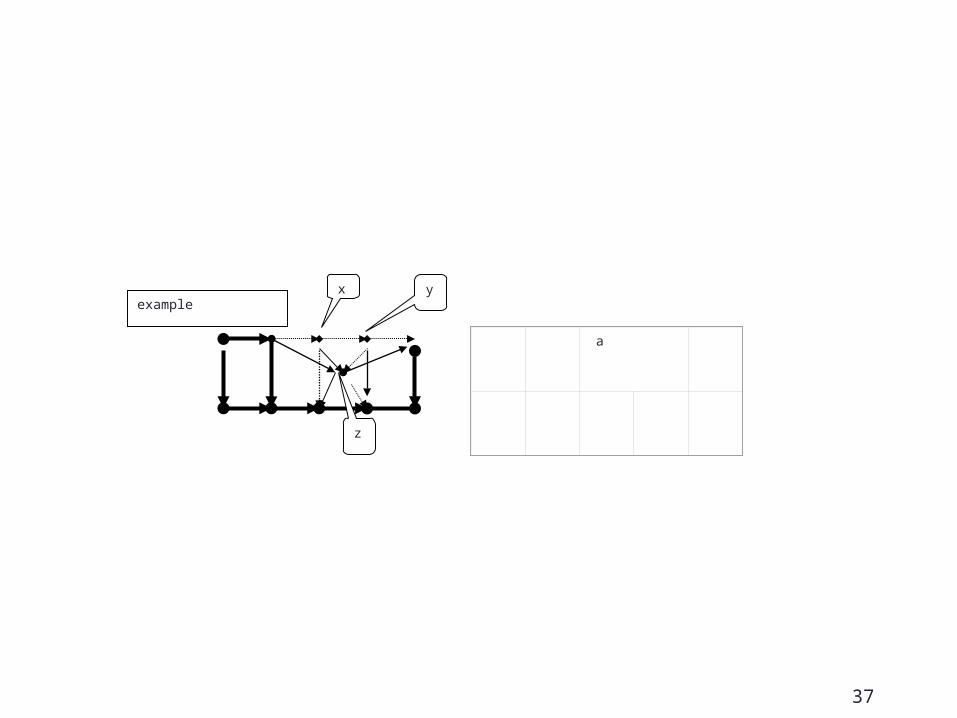
Representation of table by tessellation graphs (continued) Peripheral cells and corresponding nodes Cell a is represented by nodeCeiling of the cell a is represented by node zVirtual cells x and y has no valid heightsCeiling of the cell z is covered by cells x and y
37
x y
z
example
a
38
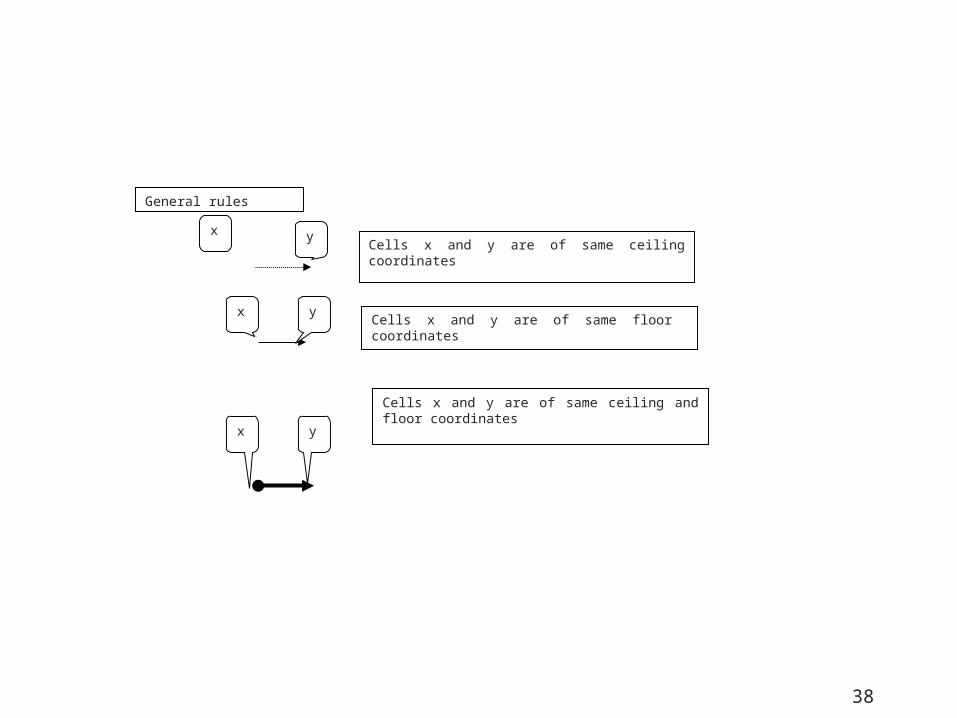
Cells x and y are of same ceiling coordinates
Cells x and y are of same floor coordinates
Cells x and y are of same ceiling and floor coordinates
x y
x y
x y
General rules
39
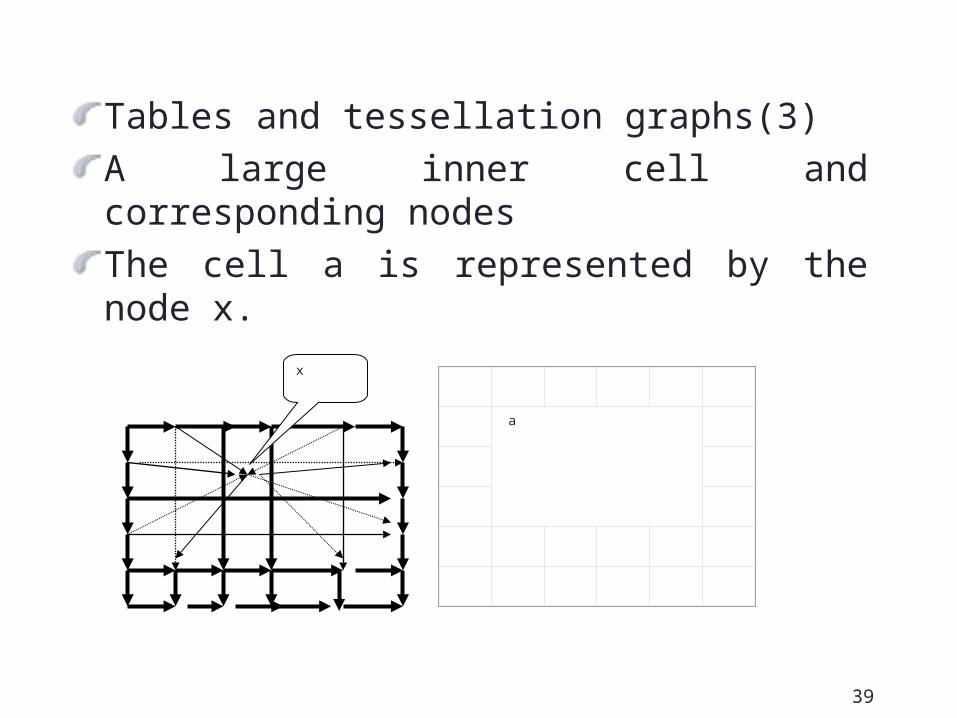
Tables and tessellation graphs(3)A large inner cell and corresponding nodesThe cell a is represented by the node x.
x
a
40
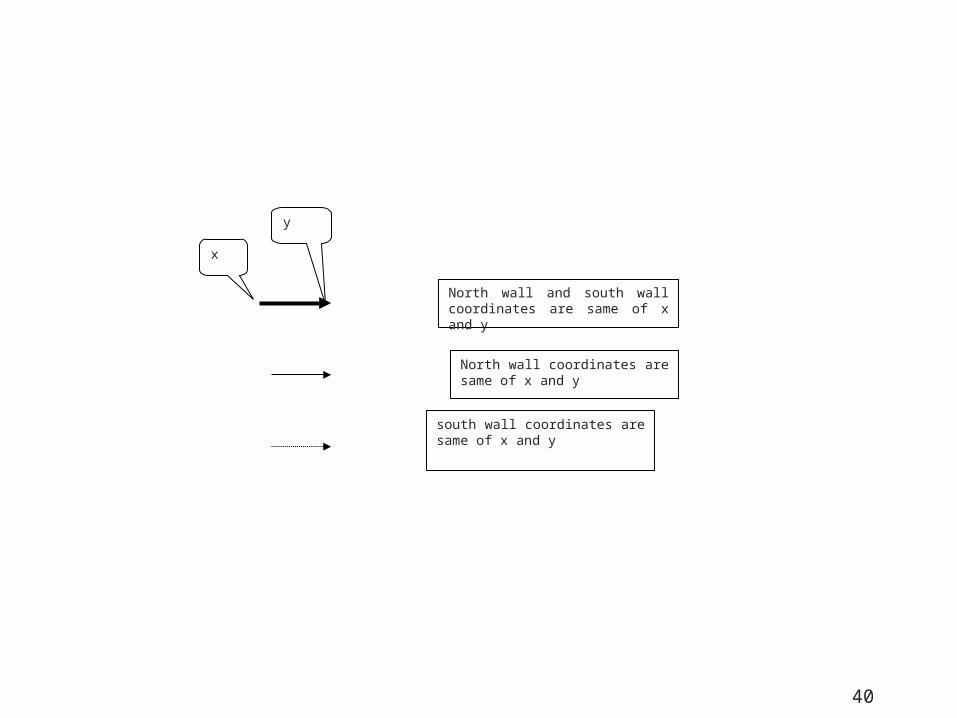
North wall coordinates are same of x and y
south wall coordinates are same of x and y
North wall and south wall coordinates are same of x and y
x
y
41
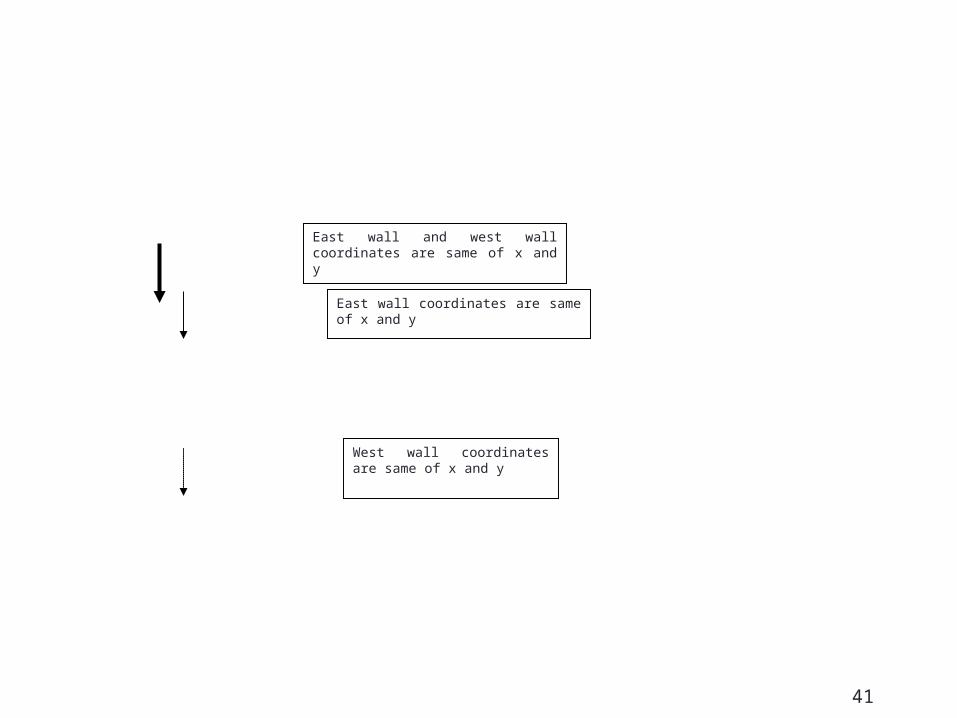
East wall and west wall coordinates are same of x and y
East wall coordinates are same of x and y
West wall coordinates are same of x and y
42
4. CONCLUSION
Future WorksOther MethodsRelation to Mathematical TheoryGraph Grammars
43
2. Known Results
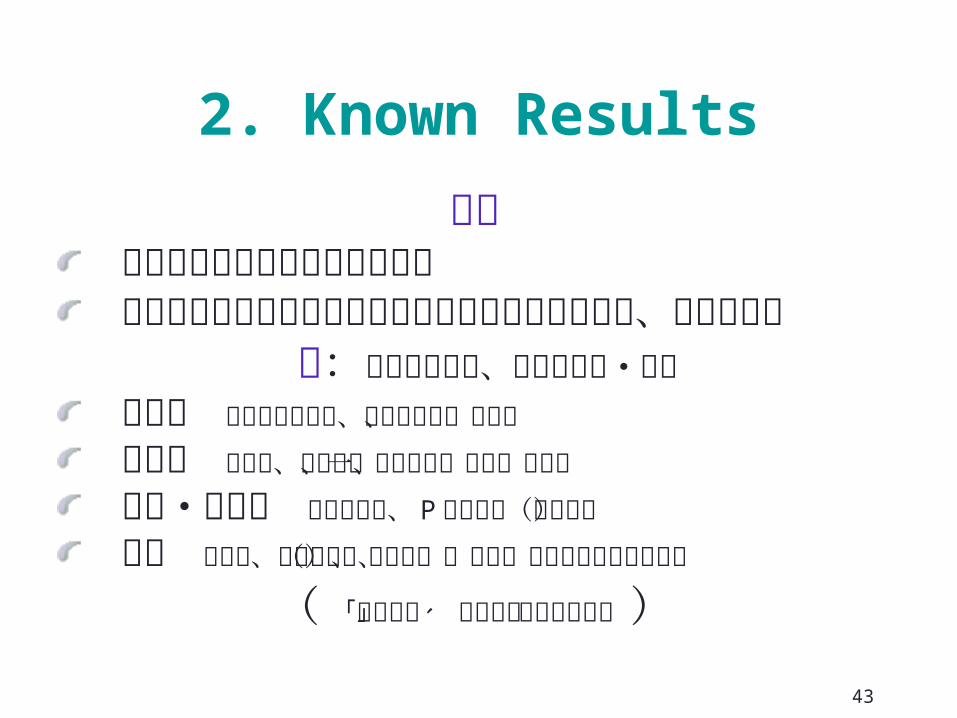
図表昔から重要な視覚的な情報媒介コンピュータの分野でも欠かせない情報の伝達手段、思考ツール
表:様々な分野で、数多く考案・開発相関表 生活行為相関表、リーグ戦表、九九表行列表 生命表、曜日表、履修科目一覧表、万年暦三角・多角表 要因分析表、 P 型相関表(五角形)配列 魔方陣、掛け算表(インド)、碁盤、ダイヤモンド・ゲーム
( 「図の体系」 出原他、日科技連より)
44
2. Known Results
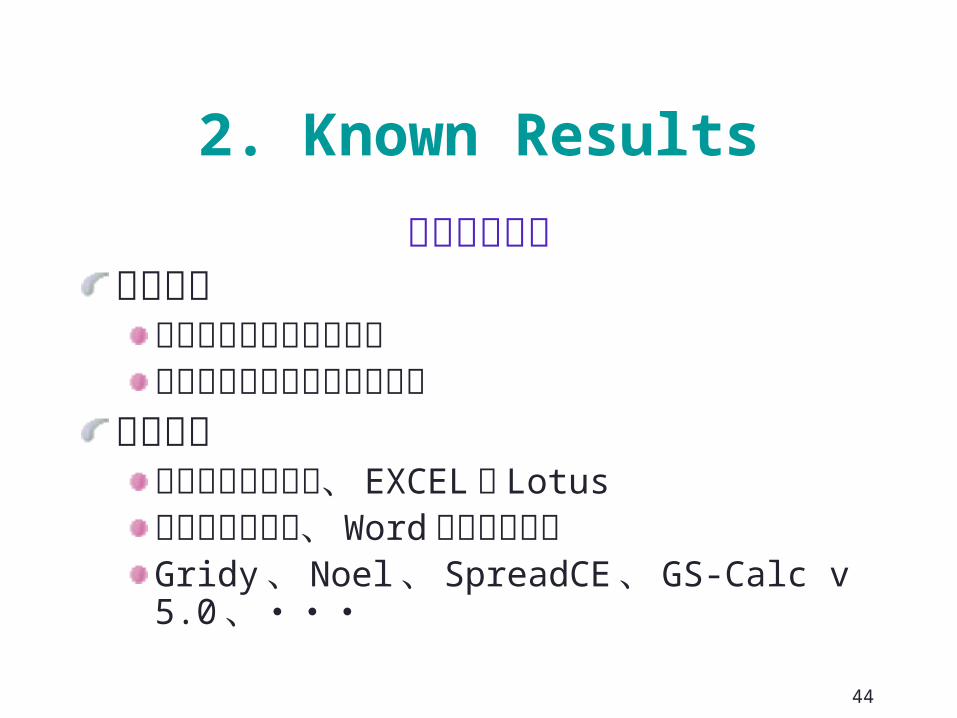
表計算ソフト利用目的
データ処理としての計算表形式の分かり易い資料作成
多数開発データ処理として、 EXCEL や Lotus資料作成として、 Word の表作成機能Gridy 、 Noel 、 SpreadCE 、 GS-Calc v5.0 、・・・
45
1. Introduction
対象:資料作成のための表作成機能主流: Word の表作成機能
問題点表計算ソフトでは、編集結果の予測がつかないことが起こる
対象と操作に対応するデータ構造とその変換結果が明示されない利用者が思考錯誤して推測している
46
1. Introduction
本研究の目標表に必要なデータをまとめ、形式的に定義表データに、属性付きグラフの構造を持たせる手法の提案表の編集操作のアルゴリズムをいくつか作成し、計算時間を評価
47
1. Introduction
本研究の目的編集・描画を考慮した、表のデータ構造を提案表を属性付きグラフを用いてあらわす手法の提案表の編集操作のアルゴリズムをいくつか作成し、計算時間を評価
48
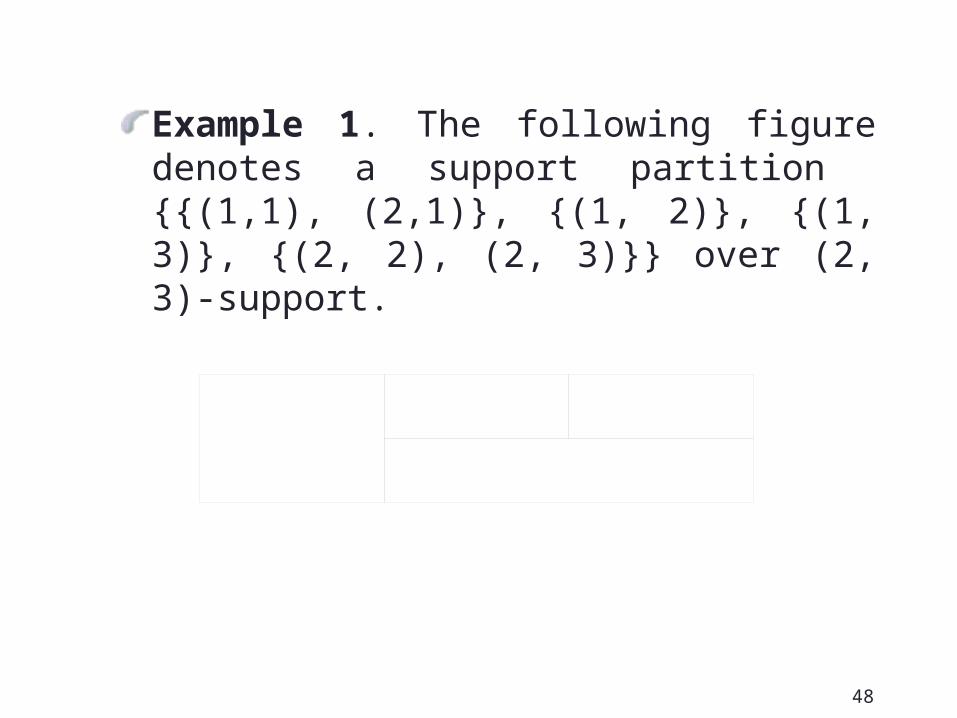
Example 1. The following figure denotes a support partition {{(1,1), (2,1)}, {(1, 2)}, {(1, 3)}, {(2, 2), (2, 3)}} over (2, 3)-support.
49
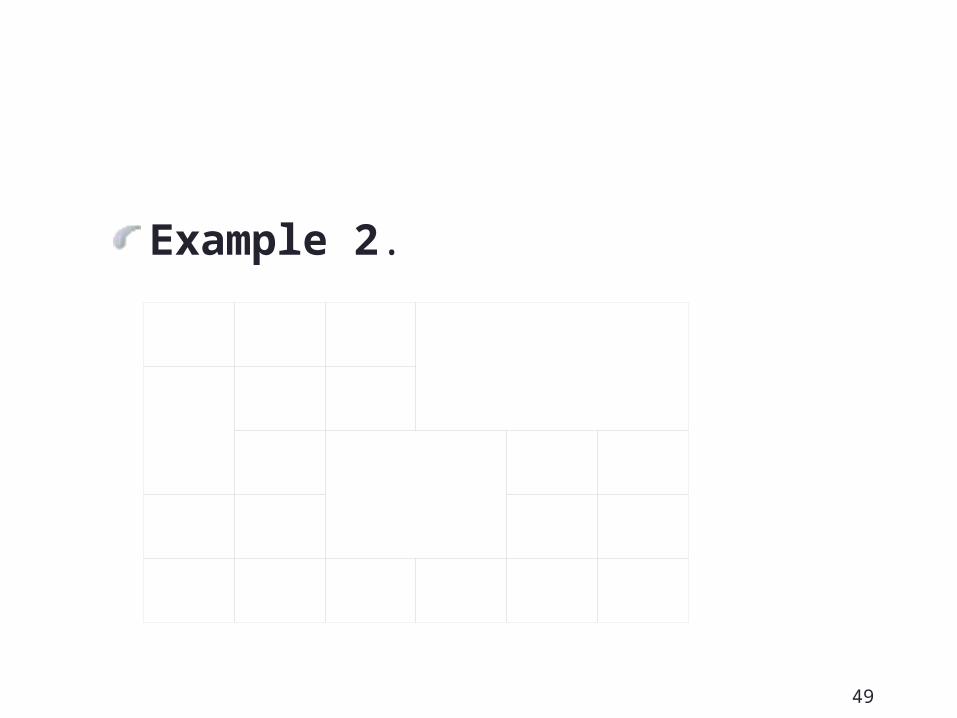
Example 2.
50
Applications of Tables計算幾何学、プラントレイアウト、回路設計、結晶群と離散構造、ソフトウェア工学(仕様書、表エディタ)
51
Application of Our ResultsOur concept may be applied to general table document processing in common spread sheet systems or common document processor.
52
Expectation of Our ResultsViewerOther algorithmsPractical processing systemsGraph grammars for generate our graphs
53
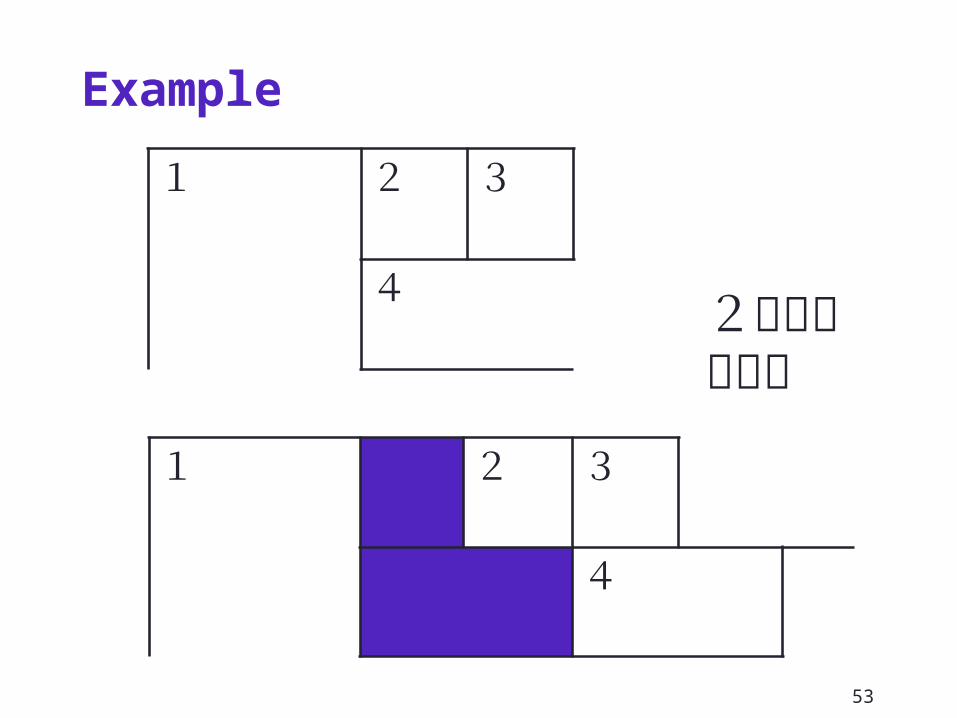
Example
1 2 3
4
1 2 3
4
2を指定列挿入
54
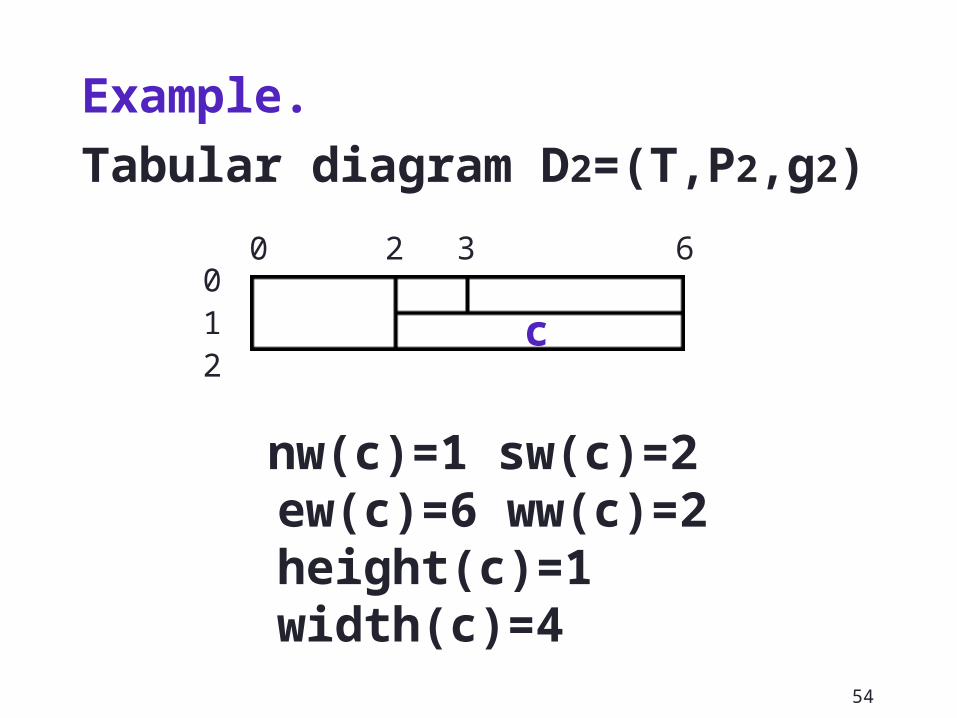
Example.Tabular diagram
D2=(T,P2,g2)
nw(c)=1 sw(c)=2 ew(c)=6 ww(c)=2 height(c)=1 width(c)=4
0 2 3 60
21 c
55
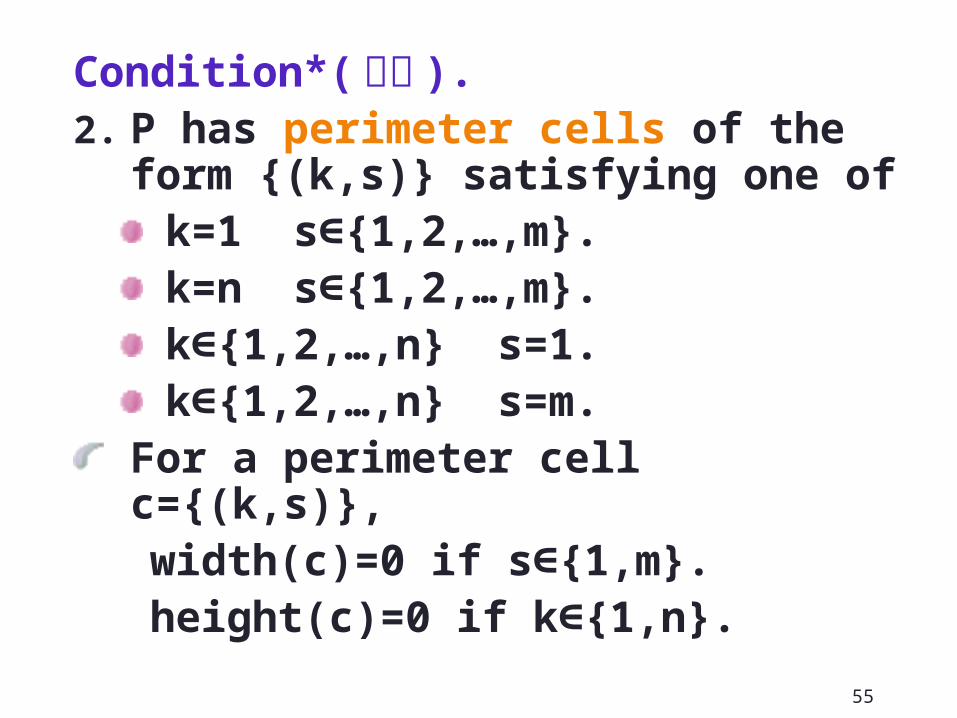
Condition*(続き ). 2. P has perimeter cells of the
form {(k,s)} satisfying one of k=1 s∈{1,2,…,m}.k=n s∈{1,2,…,m}.k∈{1,2,…,n} s=1.k∈{1,2,…,n} s=m.
For a perimeter cell c={(k,s)},
width(c)=0 if s∈{1,m}. height(c)=0 if k∈{1,n}.