2021 annual report state of the nonprofit sector
TRANSCRIPT

2 0 2 1 A N N U A L R E P O R T
State of the Nonprofit Sector
F E B R U A R Y 2 0 2 1

26C O N C L U S I O N
7F I N A N C I A L I M P A C T
4M E T H O D O L O G Y +K E Y F I N D I N G S
14P R O G R A M S & S E R V I C E S
5P A R T I C I P A N T S
3I N T R O D U C T I O N
22O P E R A T I O N S
24G O V E R N A N C E
3 | I N T R O D U C T I O N | 2 0 2 1 S T A T E O F T H E N O N P R O F I T S E C T O R R E P O R T | B K D
I N T R O D U C T I O NNonprofit organizations are the lifeblood of communities. They provide essential services for individuals, families, and neighborhoods. They are a voice for the vulnerable, addressing complex issues with passion and professionalism. They provide a large portion of the country’s health care, higher education, conservation, human services, and other essential services.
The COVID-19 pandemic has caused a major health and economic shock, propelling the nation into an unprecedented crisis. And as they often are, nonprofit organizations have been at the forefront, responding to increased demands.
To better understand the implications the pandemic has had on the nonprofit sector, BKD conducted a national study of nonprofit organizations. This report focuses on factors influencing organizations and actions they’re taking to stabilize their organizations.
This report displays various well-being indicators for the nonprofit sector. Each is an important gauge of organizational health. The four main areas examined include:
• Financial Impact• Programs & Services• Operations • Governance
The goal of this study is to highlight how organizations are adapting to the pandemic and what effect it’s having on their ability to provide programs and services. Funders, elected officials, and community leaders must understand the current condition of nonprofit organizations as they consider the scale of necessary intervention.
Dan PraterSenior Managing Consultant
“In the midst of the COVID-19 pandemic, nonprofits across the country have helped to propel our communities forward and respond to increasing demands. It’s our desire this report would offer leaders
insights to help stabilize their organizations and continue meeting the needs of those they serve.”
Tondeé Lutterman National Industry Partner

4 | M E T H O D O LOG Y + K E Y F I N D I N G S | 2 0 2 1 S T A T E O F T H E N O N P R O F I T S E C T O R R E P O R T | B K D
M E T H O D O L O G YThe survey comprised 18 questions or scenarios, including general questions about organization location, size, area of focus, and questions about the COVID-19 crisis.
We received responses from 319 organizations between September 23 and October 23, 2020.
K E Y F I N D I N G S
89%altered their delivery of programs and services.
61%experienced a decline in fees for programs and services.
70%experienced a decrease
in net income.
29%plan to eliminate current
programs/services.
Survey respondents were not required to answer every question.

5 | P A R T I C I P A N T S | 2 0 2 1 S T A T E O F T H E N O N P R O F I T S E C T O R R E P O R T | B K D
P A R T I C I P A N T SSurvey participants represented organizations across the United States. The geographic scope of respondents was divided into seven regions.
Reflective of the nonprofit sector composition, more than two-thirds (67.61 percent) of respondents were 501(c)(3) organizations.
Category Percentage Category Percentage501(c)(1) 1.6% 501(c)(9) 2.5%501(c)(2) 1.3% 501(c)(10) 1.6%501(c)(3) 67.6% 501(c)(11) 3.1%501(c)(4) 1.9% 501(c)(12) 1.9%501(c)(5) 3.1% 501(c)(14) 1.3%501(c)(6) 5.7% 501(c)(15) 1.3%501(c)(7) 4.1% 501(c)(16) 0.6%501(c)(8) 1.8% 501(c)(17) 0.6%
20.7%Plains 16.9%
Great Lakes
14.7%Northeast
4.4%Mid-Atlantic
15.1%South
15.7%Southwest
12.5%West

The three largest subsectors represented were education (21.0 percent), health (20.4 percent), and human services (17.9 percent).
Education 21.0%
20.4%Health
17.9%Human Services
13.8%Arts, Culture, and Humanities
8.5%Public, Societal Benefit
5.6%Religion
4.1%Environmental and Animal
3.4%Membership
3.1%Unclassified
2.2%International
34.5%Small
0 to $999,999
40.7%Midlevel
$1M–$24.9M
24.8%Large$25M+
Annual Revenue RangeParticipant revenue groups were evenly represented between small, midlevel, and large organizations.
Zero to $49,999 3.5%
$50,000 to $149,999 5.6%
$150,000 to $249,000 7.5%
$250,000 to $499,999 7.2%
$500,000 to $999,999 10.7%
$1M to $4.9M 15.7%
$5M to $9.9M 9.0%
$10M to $24.9M 16.0%
$25M to $49.9M 7.2%
$50M to $74.9M 7.9%
$75M to $99.9M 2.5%
$100M and Above 7.2%
6 | P A R T I C I P A N T S | 2 0 2 1 S T A T E O F T H E N O N P R O F I T S E C T O R R E P O R T | B K D

7 | F I N A N C I A L I M PA CT | 2 0 21 S TAT E O F T H E N O N P RO F I T S E CTO R R E P O RT | B K D
F I N A N C I A L I M P A C TThe COVID-19 pandemic has created a global health and economic crisis.
While trying to serve struggling families and communities, some nonprofits find themselves squeezed beyond their capacity. Government mandates and safety measures caused numerous organizations to temporarily cease all operations, while others operated in highly restrictive contexts.
When asked how they feel about their organization’s current financial position, more than one-quarter (28.2 percent) were somewhat or very concerned. As one executive director commented, “We’ve been in a bubble. Funding from the CARES Act has kept many of us afloat. But we know that those funds are going to run out. What then?”
It may take years to fully analyze the effects of the pandemic, but the immediate financial effects on the nonprofit sector are clear.
Feelings About Current Financial Conditions
Unsure Very pleased Somewhat pleased Somewhat concerned Very concerned
37.0%26.3%
14.4%
8.5% 13.8%

8 | F I N A N C I A L I M PA CT | 2 0 21 S TAT E O F T H E N O N P RO F I T S E CTO R R E P O RT | B K D
How has the organization’s revenue changed?
The decline in revenue is alarming. More than 70 percent of respondents lost revenue in 2020. About one-fourth decreased between 26 percent and 50 percent, and around one-tenth decreased anywhere from 51 percent to 100 percent of total revenue.
Net Income The global crisis and lockdowns have been devastating for organizations that rely on public gatherings. Museums were shuttered, orchestras and symphonies were not permitted to perform concerts with audiences, and performing theaters were shut down. Once they could reopen, audiences were limited due to social distancing.
The pandemic not only disrupted organizations’ programs, it caused the cancellation of most nonprofit fundraising events such as 5K walks and runs, as well as annual dinners and galas. It also caused some corporate sponsors to withhold support.
While some organizations have created digital experiences, most aren’t bringing in the level of revenue collected from in-person events.
1%–25% 26%–50% 51%–100% 1%–25% 26%–50% 51%–100% No Change
36.3%
25.4%
9.7%11.3%
8.6%
0.6%
8.1%
Decreased Increased

9 | F I N A N C I A L I M PA CT | 2 0 21 S TAT E O F T H E N O N P RO F I T S E CTO R R E P O RT | B K D
Revenue SourcesThe primary source of income for many nonprofits is fees for programs, services, and goods. National studies show that fees and contracts for services account for nearly 75 percent of all nonprofit income.
Table: Participating organizations’ main revenue sources
25% or Less of Overall Funding
About 50% of Overall Funding
About 65% of Overall Funding
More than 80% of Overall
FundingNone
Fees for programs, services, goods 31.8% 20.1% 10.2% 22.9% 15.0%Contributions from individuals 50.3% 17.3% 16.0% 6.3% 10.1%Membership dues 20.1% 13.7% 10.9% 6.3% 49.0%Foundation grants 51.0% 13.2% 13.2% 4.5% 18.1%Government grants 35.1% 17.2% 11.0% 6.8% 29.9%Special events/fundraisers 48.3% 15.3% 15.3% 5.2% 15.9%Corporate giving 44.8% 13.0% 14.0% 4.8% 23.4%Planned giving 38.8% 10.9% 12.5% 2.6% 35.2%Earned income 39.0% 10.3% 13.7% 8.3% 28.7%Investments 51.6% 11.6% 12.3% 6.8% 17.7%Other 30.6% 14.2% 12.7% 4.1% 38.4%
The forced closure of programs and services was a crushing blow for some organizations.
10 | F I N A N C I A L I M PA CT | 2 0 21 S TAT E O F T H E N O N P RO F I T S E CTO R R E P O RT | B K D
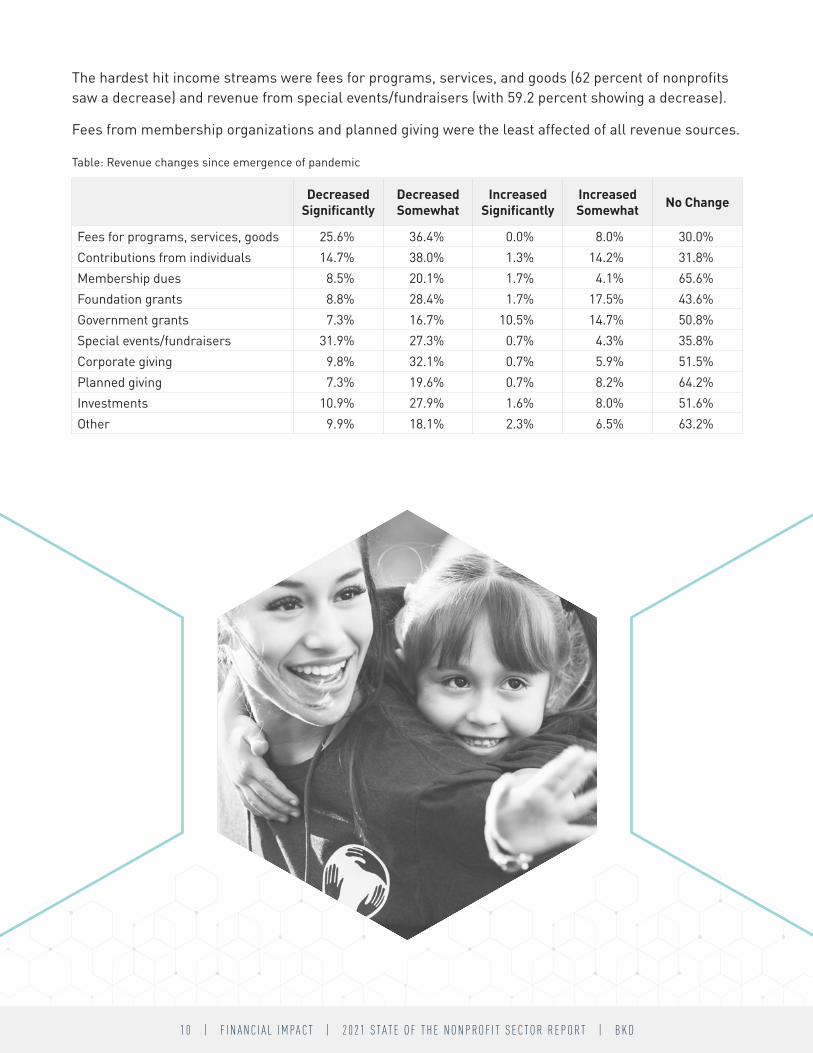
The hardest hit income streams were fees for programs, services, and goods (62 percent of nonprofits saw a decrease) and revenue from special events/fundraisers (with 59.2 percent showing a decrease).
Fees from membership organizations and planned giving were the least affected of all revenue sources.
Table: Revenue changes since emergence of pandemic
Decreased Significantly
Decreased Somewhat
Increased Significantly
Increased Somewhat No Change
Fees for programs, services, goods 25.6% 36.4% 0.0% 8.0% 30.0%Contributions from individuals 14.7% 38.0% 1.3% 14.2% 31.8%Membership dues 8.5% 20.1% 1.7% 4.1% 65.6%Foundation grants 8.8% 28.4% 1.7% 17.5% 43.6%Government grants 7.3% 16.7% 10.5% 14.7% 50.8%Special events/fundraisers 31.9% 27.3% 0.7% 4.3% 35.8%Corporate giving 9.8% 32.1% 0.7% 5.9% 51.5%Planned giving 7.3% 19.6% 0.7% 8.2% 64.2%Investments 10.9% 27.9% 1.6% 8.0% 51.6%Other 9.9% 18.1% 2.3% 6.5% 63.2%
11 | F I N A N C I A L I M PA CT | 2 0 21 S TAT E O F T H E N O N P RO F I T S E CTO R R E P O RT | B K D
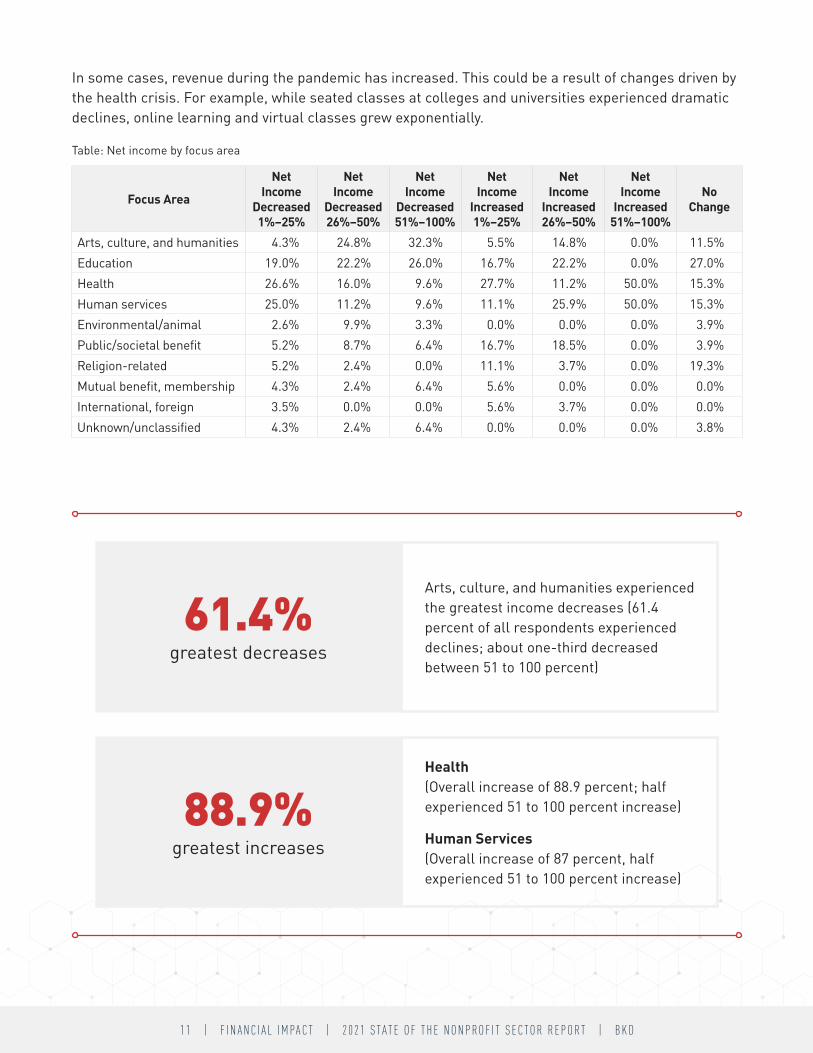
61.4%greatest decreases
Arts, culture, and humanities experienced the greatest income decreases (61.4 percent of all respondents experienced declines; about one-third decreased between 51 to 100 percent)
88.9%greatest increases
Health (Overall increase of 88.9 percent; half experienced 51 to 100 percent increase)
Human Services (Overall increase of 87 percent, half experienced 51 to 100 percent increase)
In some cases, revenue during the pandemic has increased. This could be a result of changes driven by the health crisis. For example, while seated classes at colleges and universities experienced dramatic declines, online learning and virtual classes grew exponentially.
Table: Net income by focus area
Focus Area
Net Income
Decreased 1% –25%
Net Income
Decreased 26% –50%
Net Income
Decreased 51% –100%
Net Income
Increased 1% –25%
Net Income
Increased 26% –50%
Net Income
Increased 51% –100%
No Change
Arts, culture, and humanities 4.3% 24.8% 32.3% 5.5% 14.8% 0.0% 11.5%Education 19.0% 22.2% 26.0% 16.7% 22.2% 0.0% 27.0%Health 26.6% 16.0% 9.6% 27.7% 11.2% 50.0% 15.3%Human services 25.0% 11.2% 9.6% 11.1% 25.9% 50.0% 15.3%Environmental/animal 2.6% 9.9% 3.3% 0.0% 0.0% 0.0% 3.9%Public/societal benefit 5.2% 8.7% 6.4% 16.7% 18.5% 0.0% 3.9%Religion-related 5.2% 2.4% 0.0% 11.1% 3.7% 0.0% 19.3%Mutual benefit, membership 4.3% 2.4% 6.4% 5.6% 0.0% 0.0% 0.0%International, foreign 3.5% 0.0% 0.0% 5.6% 3.7% 0.0% 0.0%Unknown/unclassified 4.3% 2.4% 6.4% 0.0% 0.0% 0.0% 3.8%

12 | F I N A N C I A L I M PA CT | 2 0 21 S TAT E O F T H E N O N P RO F I T S E CTO R R E P O RT | B K D
Expected Recovery TimeWhen asked how long they felt it would take their organization to recover financially from the crisis, a majority (71 percent) indicated it would take at least a year. A smaller percentage (30.8 percent) believe it will take from 1.5 years to more than three years for them to stabilize.
Time Needed to Recover Percentage0–5 months 13.0%6–11 months 16.0%12–17 months 40.2%18–23 months 14.0%2–3 years 14.8%3+ years 2.0%
Operational ExpensesTo further explore the effects of COVID-19, we asked organizations about changes to their operational costs. Many smaller nonprofits are financially fragile, with limited ability to absorb additional expenses.
The results suggest the pandemic has not caused a significant industrywide disruption to operational expenses. In fact, more than 45 percent of respondents said their costs had decreased and about 13 percent reported no change. Approximately 40 percent have experienced a slight or significant increase.
Decreases may be attributed to costs savings from canceled events, temporary closures and reduced office operations, or a reduction in workforce.
Significantly Increased Somewhat Increased No Change Somewhat Decreased Significantly Decreased
8.8% 6.9%
37.9% 33.5%
12.9%

13 | F I N A N C I A L I M PA CT | 2 0 21 S TAT E O F T H E N O N P RO F I T S E CTO R R E P O RT | B K D
Cash ReservesCash reserves can help stabilize organizations against unexpected events. The amount needed depends on many variables, but a common standard for organizations is to have at least enough to cover three to six months’ operating expenses. Additional amounts such as six to 12 months can provide stability during long-term events.
Among all reporting groups, education and health organizations have the least cash reserves. The arts, culture, and humanities group has the greatest reserves with 39 percent of its participants reporting “More than 12 months,” while the mutual and membership benefit group is close with 36 percent of its participants reporting “More than 12 months.”
Nearly 60 percent (59.5 percent) of education organizations have cash reserves for one month or less. One-third (33.3 percent) of health groups
have less than one month of reserves.
Less than 1 month 1 month 2–3 months 4–6 months 7–12 months 12+ months25.6%
21.7%
22.7%
1.9% 2.2%
25.9%
Organization Reserves
The education category includes private elementary and secondary schools, vocational and technical schools, private two-year and undergraduate colleges and universities, advocacy groups, student services, and parent/teacher groups.
The health category includes various types and sizes of hospitals and health care facilities, substance abuse/prevention services, mental health, research, and professional/managerial assistance.

14 | P ROG R A M S & S E RV I C E S | 2 0 21 S TAT E O F T H E N O N P RO F I T S E CTO R R E P O RT | B K D
P R O G R A M S & S E R V I C E SThe pandemic has had a profound effect on vulnerable populations, especially with the loss of jobs, food insecurity, and reduced access to services.
Nonprofits play a vital role in restoring and maintaining healthy communities. While attempting to respond to a demand for services, however, some organizations have been forced to reduce or close many of their offerings.
What impact has the COVID-19 crisis had on the individuals and communities your organization serves?
The numbers are clear—more than 80 percent report a negative impact, and about half believe the impact on individuals and communities is significant. Only 5.3 percent of the organizations surveyed say the crisis has not had a noticeable impact, and nearly 10 percent report a slight positive impact.
Data show that all individuals and communities in this study have been greatly affected by the COVID-19 crisis, with more than 40 percent of participants from six of the seven regions reporting “significant negative impact.”
Examined by geographic area, the hardest hit regions are the Mid-Atlantic (64 percent), Plains (61 percent), and Northeast (55 percent). The region with the least reported significant impact was the Southwest, with 32 percent of participants indicating “significant negative impact.”
Significant Negative Impact Slight Negative Impact No Change Significant Positive Impact Slight Positive Impact
49.1%35.8%
5.3%0.0%
9.8%
15 | P ROG R A M S & S E RV I C E S | 2 0 21 S TAT E O F T H E N O N P RO F I T S E CTO R R E P O RT | B K D
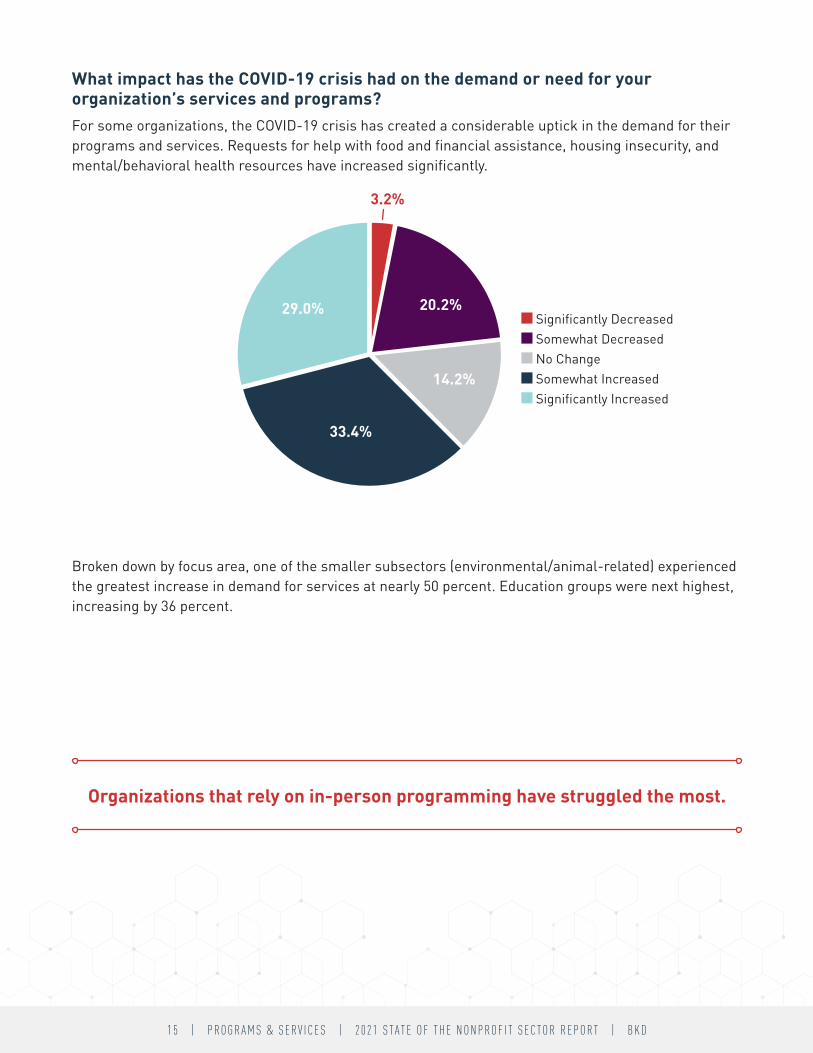
What impact has the COVID-19 crisis had on the demand or need for your organization’s services and programs?For some organizations, the COVID-19 crisis has created a considerable uptick in the demand for their programs and services. Requests for help with food and financial assistance, housing insecurity, and mental/behavioral health resources have increased significantly.
Broken down by focus area, one of the smaller subsectors (environmental/animal-related) experienced the greatest increase in demand for services at nearly 50 percent. Education groups were next highest, increasing by 36 percent.
Organizations that rely on in-person programming have struggled the most.
Significantly Decreased Somewhat Decreased No Change Somewhat Increased Significantly Increased
33.4%
14.2%
29.0%
3.2%
20.2%

16 | P ROG R A M S & S E RV I C E S | 2 0 21 S TAT E O F T H E N O N P RO F I T S E CTO R R E P O RT | B K D
As some subsectors experienced an increase, others reported a dramatic decrease in the demand for services. Stay-at-home orders and health concerns have resulted in a decline in consumer interaction. For instance, some organizations that serve senior citizens have halted programs.
In addition, some leaders express concern the effects health restrictions are having on domestic violence and child abuse. Groups have seen a sharp decline in the number of reported cases and are concerned that while heightened stress may lead to an increase in the number of incidents occurring, many go unnoticed as victims have less contact with mandated reporters.
Table: Demand for services
Focus Area Significantly Decreased
Somewhat Decreased
Significantly Increased
Somewhat Increased No Change
Arts, culture, and humanities 30.0% 15.2% 15.2% 12.3% 8.9%Education 10.0% 22.8% 17.1% 18.9% 33.3%Health 0.0% 3.1% 1.1% 4.7% 11.1%Human services 50.0% 36.4% 8.5% 20.7% 13.3%Environmental/animal 0.0% 6.0% 32.6% 17.0% 11.1%Public/societal benefit 0.0% 3.0% 2.8% 2.8% 0.0%Religion-related 0.0% 6.0% 12.0% 9.4% 4.5%Mutual benefit, membership 0.0% 1.5% 6.4% 7.5% 6.7%International, foreign 10.0% 3.0% 1.1% 5.7% 2.2%Unknown/unclassified 0.0% 3.0% 3.2% 1.0% 8.9%
17 | P ROG R A M S & S E RV I C E S | 2 0 21 S TAT E O F T H E N O N P RO F I T S E CTO R R E P O RT | B K D
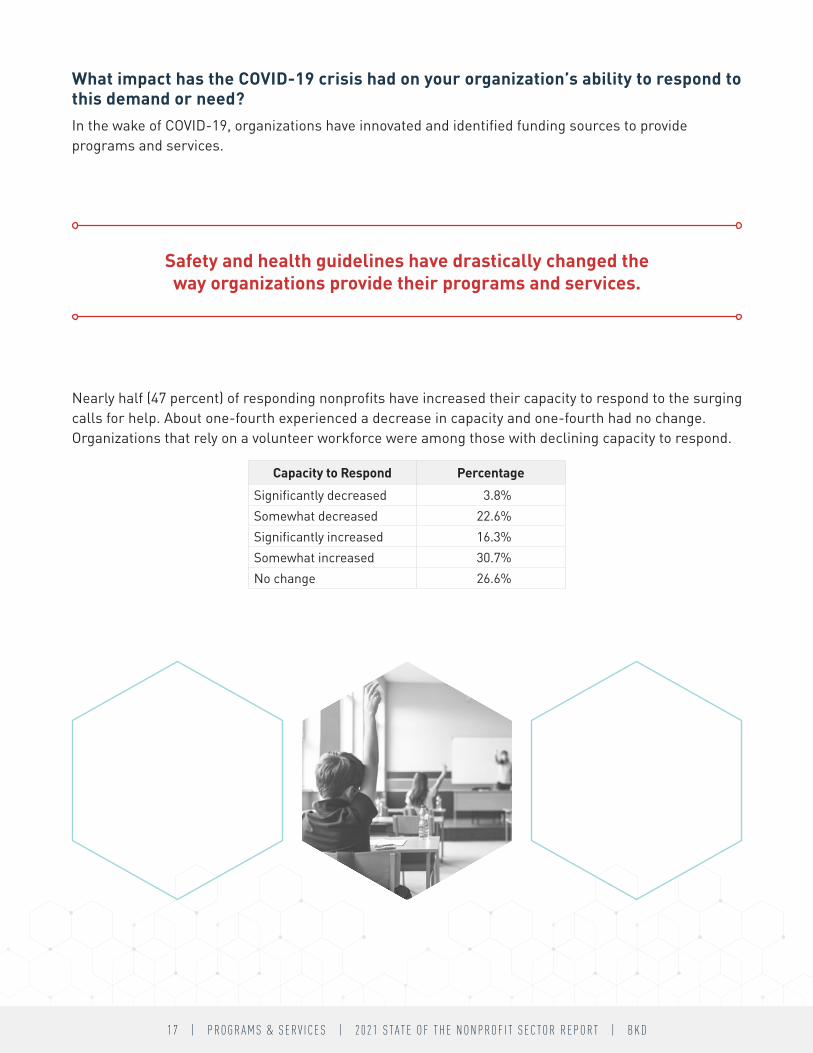
What impact has the COVID-19 crisis had on your organization’s ability to respond to this demand or need?In the wake of COVID-19, organizations have innovated and identified funding sources to provide programs and services.
Nearly half (47 percent) of responding nonprofits have increased their capacity to respond to the surging calls for help. About one-fourth experienced a decrease in capacity and one-fourth had no change. Organizations that rely on a volunteer workforce were among those with declining capacity to respond.
Capacity to Respond PercentageSignificantly decreased 3.8%Somewhat decreased 22.6%Significantly increased 16.3%Somewhat increased 30.7%No change 26.6%
Safety and health guidelines have drastically changed the way organizations provide their programs and services.

18 | P ROG R A M S & S E RV I C E S | 2 0 21 S TAT E O F T H E N O N P RO F I T S E CTO R R E P O RT | B K D
“We have struggled with engagement of families in virtual services due to the
competing pressures and demands of their home during the pandemic, from their work
from home jobs to managing the remote-learning experiences of their other children.”
Molly Turner, Executive Director
Children’s Center for the Visually Impaired Kansas City, Missouri

19 | P ROG R A M S & S E RV I C E S | 2 0 21 S TAT E O F T H E N O N P RO F I T S E CTO R R E P O RT | B K D
The crisis has forced organizations to reimagine the ways they engage with their clients. In some cases, the new methods restricted their reach. For others, the adjustment provided an opportunity to expand into new areas and reach more people.
89.4%Changed Delivery Method
10.6%No Change to Delivery Method
As expected, health organizations and education groups report having the most significant changes to delivery of programs and services.
Table: Altered delivery of programs/services
Focus Area Somewhat Altered Significantly Altered No Change
Arts, culture, and humanities 18.9% 7.8% 17.7%Education 16.7% 26.9% 14.7%Health 6.2% 1.4% 5.9%Human services 18.0% 24.8% 11.8%Environmental/animal 18.7% 19.2% 8.8%Public/societal benefit 2.1% 2.1% 2.9%Religion-related 10.4% 3.5% 20.7%Mutual benefit, membership 4.1% 7.1% 5.8%International, foreign 1.4% 5.7% 2.9%Unknown/unclassified 3.5% 1.5% 8.8%

20 | P ROG R A M S & S E RV I C E S | 2 0 21 S TAT E O F T H E N O N P RO F I T S E CTO R R E P O RT | B K D
To maintain stability and meet increasing demands, organizations are exploring options. In the process of contingency planning and scenario building for the next six to 12 months, some are facing the harsh reality of program reductions or closures. Conversely, nearly two-thirds (63.7 percent) are planning for expansion by adding new programs or services.
63.7%Likely to maintain current programs/
services and add some new.
29.3%Likely to eliminate some current
programs/services but not add any new.
Table: Consideration of actions
Considering the Following Actions: Somewhat Likely
Somewhat Unlikely
Very Likely
Very Unlikely
Expand current programs/services but not add any new 39.8% 20.0% 24.3% 15.9%Maintain current programs/services but not add any new 40.0% 26.4% 15.0% 18.6%Maintain current programs/services and add some new 41.5% 23.3% 22.3% 12.9%Scale back current programs/services and add some new 32.5% 28.7% 14.5% 24.3%Eliminate some current programs/services and add some new 29.9% 30.3% 10.9% 28.9%Eliminate some current programs/services but not add any new 24.5% 34.2% 4.8% 36.5%
Education organizations are the most likely to add new programs (39.2 percent), while arts, culture, and humanities organizations are most likely to eliminate programs without adding any new (33.3 percent).

21 | P ROG R A M S & S E RV I C E S | 2 0 21 S TAT E O F T H E N O N P RO F I T S E CTO R R E P O RT | B K D
Making a PivotWith the uncertainty of funding sources and an inability to meet demands for their services, organizations seek new ways to help ensure mission success while sustaining their operations.
To avoid cuts in services to clients, reductions in staff, or even dissolution, some nonprofits are considering strategic alliances or mergers. By pooling their resources with like-minded groups, organizations may increase their capacity and efficiency and become more attractive to funders that encourage collaborative impact.
To meet requests for help, nonprofits, businesses, and government entities are exploring new ways to engage with each other.
We asked organizations about the likelihood of taking one or more of these actions:
• Consolidation – Combining with another organization to form a new body• Strategic alliance – Sharing of administrative and programming services• Other types of partnerships
Most responding organizations are not pursuing any type of consolidation or merger currently. About 70 percent (69.7 percent) say it’s somewhat or very unlikely they’ll consolidate with another organization. Only 30 percent are considering this option.
Arts, culture, and humanities organizations are the most likely (64.1 percent), while health organizations are the least likely to form an alliance or merge with another nonprofit.
57.3%
12.4%
21.5%
Very Likely Somewhat Likely Somewhat Unlikely Very Unlikely
8.8%
42.2%
19.5%
25.6%
12.7%
38.2%
18.6%
26.8%
16.4%
Consolidation Strategic Alliance Other Partnership
22 | O P E R AT I O N S | 2 0 21 S TAT E O F T H E N O N P RO F I T S E CTO R R E P O RT | B K D
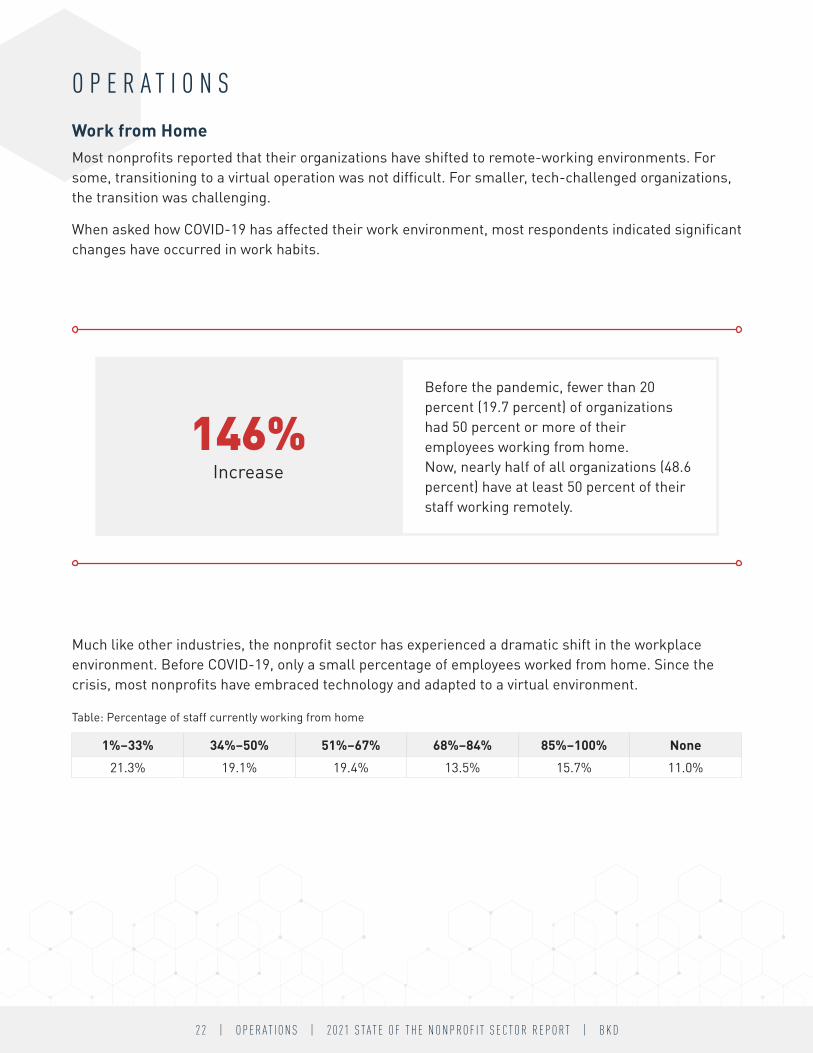
O P E R A T I O N SWork from HomeMost nonprofits reported that their organizations have shifted to remote-working environments. For some, transitioning to a virtual operation was not difficult. For smaller, tech-challenged organizations, the transition was challenging.
When asked how COVID-19 has affected their work environment, most respondents indicated significant changes have occurred in work habits.
Before the pandemic, fewer than 20 percent (19.7 percent) of organizations had 50 percent or more of their employees working from home. Now, nearly half of all organizations (48.6 percent) have at least 50 percent of their staff working remotely.
146%Increase
Much like other industries, the nonprofit sector has experienced a dramatic shift in the workplace environment. Before COVID-19, only a small percentage of employees worked from home. Since the crisis, most nonprofits have embraced technology and adapted to a virtual environment.
Table: Percentage of staff currently working from home
1%–33% 34%–50% 51%–67% 68%–84% 85%–100% None21.3% 19.1% 19.4% 13.5% 15.7% 11.0%
23 | O P E R AT I O N S | 2 0 21 S TAT E O F T H E N O N P RO F I T S E CTO R R E P O RT | B K D
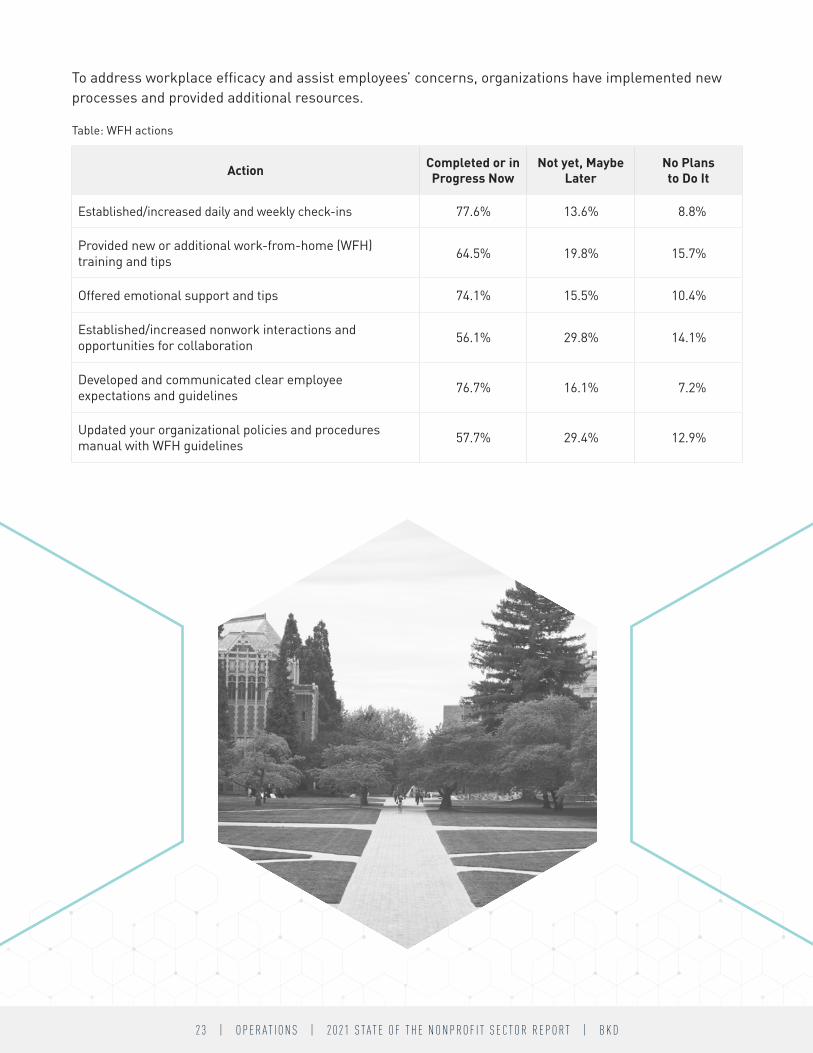
To address workplace efficacy and assist employees’ concerns, organizations have implemented new processes and provided additional resources.
Table: WFH actions
Action Completed or in Progress Now
Not yet, Maybe Later
No Plans to Do It
Established/increased daily and weekly check-ins 77.6% 13.6% 8.8%
Provided new or additional work-from-home (WFH) training and tips 64.5% 19.8% 15.7%
Offered emotional support and tips 74.1% 15.5% 10.4%
Established/increased nonwork interactions and opportunities for collaboration 56.1% 29.8% 14.1%
Developed and communicated clear employee expectations and guidelines 76.7% 16.1% 7.2%
Updated your organizational policies and procedures manual with WFH guidelines 57.7% 29.4% 12.9%

24 | GO V E R N A N C E | 2 0 21 S TAT E O F T H E N O N P RO F I T S E CTO R R E P O RT | B K D
G O V E R N A N C EThe COVID-19 crisis impacts organizations at all levels, including boards. The wisdom, connections, and engagement of boards are always vital to healthy organizations, but especially during times of upheaval.
The role of a nonprofit board depends on many variables, such as the size of the operation and type of work performed. During a crisis, the board provides support and guidance to the executive leadership, and may participate in analyzing risks, revising policies and procedures, and communicating to external stakeholders.
This section examines actions boards have taken to provide effective leadership.
Moved meetings from in-person to a virtual format:
Established COVID-19-related board bylaws and expectations for attendance, voting, etc.:
Established or activated a crisis management committee or team:
Conducted scenario or contingency planning:
Yes Mostly Undecided No
6.9%
19.7%
72.4%
1.0%
41.9%
Yes Mostly Undecided No
29.3%
25.2%
3.5%
Yes Mostly Undecided No
50.9%
18.6%
7.2%
23.3% Yes Mostly Undecided No
29.9%31.4%
34.6%4.1%
42.0%

25 | GO V E R N A N C E | 2 0 21 S TAT E O F T H E N O N P RO F I T S E CTO R R E P O RT | B K D
Updated or developed a strategic plan:
In closing, we asked organizations about the biggest challenges they currently face. The central themes were finance/funding, operations, and technology/resources.
Yes Mostly Undecided No
30.3%
32.5%
6.0%
31.2%
Economic Downturn 61.3%
54.1%Difficulty Cultivating Donors
53.1%Difficulty Acquiring/Retaining Donors
55.8%Lack of Adequate Resources
48.1%Software/Technology
56.6%Limited Staff Capacity
54.5%Providing Programs/Services Remotely
49.3%Maintaining Effectiveness While Working Remotely
36.9%Difficulty Recruiting/Retaining Quality Board Members
48.2%Difficulty Measuring Impact/Outcomes
47.0%Difficulty Recruiting/Retaining Quality Staff
42.0%High Staff Turnover
38.9%Lack of Engaged Board Members
52.2%Government Laws & Restrictions
44.5%Lack of Public Awareness/Communication
Finance/Funding Operations Technology/Resources Other

26 | CO N C LU S I O N | 2 0 21 S TAT E O F T H E N O N P RO F I T S E CTO R R E P O RT | B K D
C O N C L U S I O NThe data in this report demonstrate the profound effect the COVID-19 pandemic has had on the nonprofit sector.
As individuals, families, and communities continue to struggle with major issues, the nonprofit community will continue to lead the response by providing necessary resources. By partnering with health care, schools, and other essential services, organizations can be relied upon to serve vulnerable populations.
The CARES Act provided a lifeline for many organizations, allowing them to remain open during a time of high demand. But as funding dwindles, nonprofits are concerned about long-term survival in 2021 and beyond.
Policymakers and funders can assist nonprofits by:
1. Helping ensure they have access to adequate resources2. Giving them flexibility to carry out their programs and services3. Involving them in the decision-making process of critical community issues
Collaboration, planning, and adaptability are key to recovery. Combining resources, financial and in-kind, and forming partnerships can stabilize nonprofit organizations as they help communities recover and thrive.
Proactive and thoughtful planning, short-term and long-term, can help organizations identify and manage risks while unifying stakeholders around a shared vision.
Creating a culture on nimbleness and flexibility can help nonprofits respond as circumstances and opportunities arise.

27 | CO N C LU S I O N | 2 0 21 S TAT E O F T H E N O N P RO F I T S E CTO R R E P O RT | B K D
It’s time to stabilize.Nonprofits are under constant pressure to deliver outcomes with limited resources, especially during a global pandemic. Planning for the future requires strategy and innovative tools to equip your organization and staff. Working with an experienced, professional team of nonprofit advisors can help you evaluate and stabilize, increasing your peace of mind and long-term sustainability. Here’s how BKD Nonprofit Advisory Services can help:
Strategic Financial OutsourcingWhether you’re looking for managed services like outsourcing your accounting function or assistance in streamlining operations, BKD has tailored solutions to help your nonprofit succeed.
Budgeting & Cash Flow PlanningOur BKD Trusted Advisors™ have the tools and know-how to assist nonprofit leaders in creating and maintaining a cash flow plan to help predict and manage your top priorities.
Implementation of Accounting StandardsWhether you’re just starting or need help reaching the finish line, BKD can help your organization plan, prepare, and implement new accounting standards.
Policies, Procedures, & Internal ControlsYou can gain confidence in your policies and procedures as we help you navigate which procedures are needed and how to keep them up to date and evaluate whether your teams comply with your existing internal policies.
Accounting Support & Virtual CFO ServicesOur experienced professionals can assist you by providing project management related to crucial tasks, including monthly reporting dashboards and closing, audit preparation, reviewing and streamlining processes, cash flow forecasting, and more.
Grant Management & Compliance BKD can help you with grant management and compliance by providing consulting services that look at areas a regulator could scrutinize.
Financial Operational AssessmentsBKD can provide an assessment of your current operations by evaluating a number of areas, including vendor contracts, financial procedures, staffing and structure models, segregation of duties, financial metrics, allocation methodologies, and more.
Technologies ServicesBKD Technologies services go far beyond implementing new software. Our team offers a broad business perspective to help you be confident your technology investment is wisely spent.

28 | CO N C LU S I O N | 2 0 21 S TAT E O F T H E N O N P RO F I T S E CTO R R E P O RT | B K D
Accomplishing your mission requires demonstrating a clear message to the community and your donors.
BKD can help.
Dan Prater has an extensive background in nonprofit leadership and serves a variety of organizations
in areas of strategic planning, board governance, organizational assessments, and talent acquisition.
Reach out to Dan to schedule a meeting!
Dan PraterSenior Managing Consultant
417.865.8701 • [email protected]
bkd.com/nonprofit • @BKDNFP
Want more insights specific to the nonprofit industry?
Sign up for BKD Thoughtware®
bkd.com/thoughtware-subscription-center