nonprofit sector analysis
TRANSCRIPT

Nonprofit Sector Analysis 2021

Overview 1
Nonprofits 3
Governance 6
People 9
Funding 12
About the data 15
Contents

1
Benefacts Analysis 2021• 34,331 Organisations• 164,922 Employees• 93,451 Directors/charity trustees• €13.9bn Turnover• €6.2bn State funding
Ireland’s nonprofit sector has many very small organisations and relatively few larger ones.
This is the fifth annual Nonprofit Sector analysis prepared by Benefacts, using currently available data derived from more than 40 sources.
Use the report to learn more about Ireland’s Nonprofit Sector, its governance, people and funding.
Nonprofit sector Ireland’s nonprofit sector has 34,331 organisations. About 10,225 nonprofits are incorporated as companies, 3,965 are primary or secondary schools, 731 more are incorporated as friendly societies, cooperatives, industrial societies, political parties or charter bodies. The rest – including thousands of local, religious or sports organisations – are unincorporated associations.
Governance 93,451 people serve in the governance of Irish nonprofits and charities.
People The Nonprofit Sector in Ireland has at least 164,922 paid employees. This number doesn’t include teachers – who are paid directly by Government – or unpaid volunteers.
Funding At €6.2bn, Government was the biggest single source of funding to the Nonprofit Sector in 2019. This was 8.1% of all current Government spending that year – but the profile varies a lot from sector to sector.
Overview

2
Since our last reportIn the twelve months since we prepared the 2020 report,the number of registered charities grew by 998 (703 of these were schools)
• 91 charities were de-registered by the Charities Regulator under S.40 of the Charities Act. 6 of these are still to be found on the Companies Register
• the number of charities availing of tax relief increased from 7,184 to 7,314; 52 were removed from the list published by Revenue in the course of the year and 182 were added
• the number of charities permitted to receive tax-efficient gifts shrunk from 2,438 to 2,422, with 149 removed from the list published by Revenue and 133 added in the course of the year
• the number of sports bodies availing of tax relief grew from 2,597 to 2,668, with 1 removed from the list published by Revenue and 72 added in the course of the year
• the number of nonprofit companies grew with 465 new incorporations and 214 wind-ups
This report Benefacts Database of Irish Nonprofits is the source of all of the data and analysis on this website. We compile the database from more than 10 public sources, including the Companies Registration Office and the Charities Regulator, and the records of 27 Public Participation Networks. We clean and aggregate it and re-publish the public data here as a free service.
Information about individual nonprofits is updated regularly as they file fresh information with public regulators. Our 2021 analysis is a macro level snapshot of the whole sector, prepared with data that was available at the end of Q2.
Overview

3
NonprofitsAccording to the latest publicly available data, Ireland’s nonprofit sector has at least 34,331 organisations.
The financial data in this report is limited to 8,733 organisations whose accounts are publicly available. 53% of these are registered charities.
Missing from our financial analysis of the sector are more than 23,997 local nonprofits. These are mostly schools, parishes, associations and clubs (including unincorporated charities) for which there is no regulatory source of publicly available financial data.
Regulation of Irish nonprofits Some nonprofits are regulated as charities: at the end of 2020 the number was 11,394 including 3,553 schools, an increase of 998 (of which 703 were schools) over 2019. Here is the list of charities that were added to the register during 2020. During 2020, 91 nonprofits were removed from the register of charities – click here for the list.
This represents a net increase of 907 in the number of charities on the register since Q1 2020. Benefacts analysis excludes registered charities that are also State bodies, since these do not fall into our definition of nonprofits, that is, organisations that are not part of the private sector or the public sector.
Nonprofits
4
101
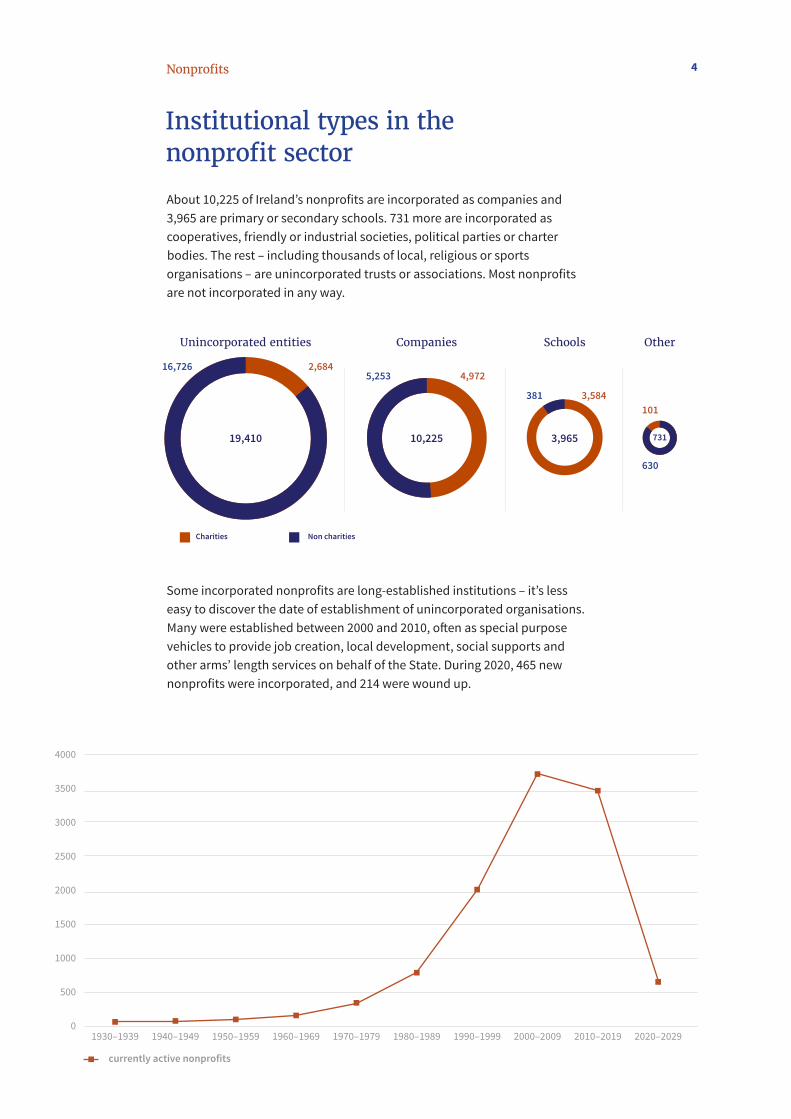
Institutional types in the nonprofit sector About 10,225 of Ireland’s nonprofits are incorporated as companies and 3,965 are primary or secondary schools. 731 more are incorporated as cooperatives, friendly or industrial societies, political parties or charter bodies. The rest – including thousands of local, religious or sports organisations – are unincorporated trusts or associations. Most nonprofits are not incorporated in any way.
Nonprofits
16,7265,253
381
630
3,584
2,6844,972
Some incorporated nonprofits are long-established institutions – it’s less easy to discover the date of establishment of unincorporated organisations. Many were established between 2000 and 2010, often as special purpose vehicles to provide job creation, local development, social supports and other arms’ length services on behalf of the State. During 2020, 465 new nonprofits were incorporated, and 214 were wound up.
Unincorporated entities Companies Schools Other
19,410
Charities Non charities
10,225 3,965 731
1930–19390
500
1000
1500
2000
2500
3000
3500
4000
1940–1949
currently active nonprofits
1950–1959 1960–1969 1970–1979 1980–1989 1990–1999 2000–2009 2010–2019 2020–2029

5
Geographic distribution of Irish nonprofits Nonprofit organisations – NGOs, religious bodies including churches, social enterprises, clubs, societies, associations – are to be found in every part of Ireland.
Nonprofits – breakdown by sector The greatest number of nonprofits are in the local development, recreation/sports, and education/research sectors. The smallest sectors are international and advocacy.
Nonprofits
Arts, Culture, Media 2,005
6,043
5,160
1,130
3,662
7,276
1,801
448
690
434
4,647
Recreation, Sports
Education, Research
Health
Social Services
Local Development, Housing
Environment
Advocacy, Law, Politics
Philanthroopy, Voluntarism
International
Religion
Professional, Vocational
0 6000 6500 7000 75005000400030002500200015001000500 3500 4500 5500 8000Non-charities Charities
Geographic distribution of Irish nonprofits
366 7,244
6
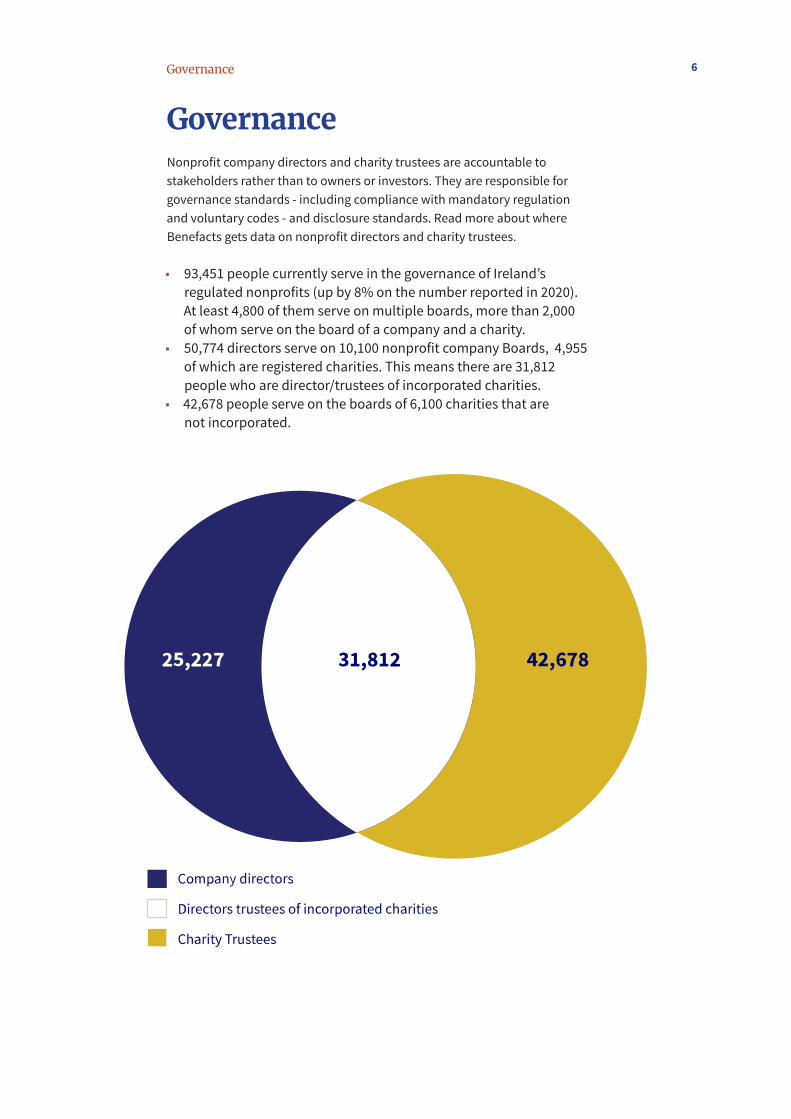
Governance Nonprofit company directors and charity trustees are accountable to stakeholders rather than to owners or investors. They are responsible for governance standards - including compliance with mandatory regulation and voluntary codes - and disclosure standards. Read more about where Benefacts gets data on nonprofit directors and charity trustees.
• 93,451 people currently serve in the governance of Ireland’s regulated nonprofits (up by 8% on the number reported in 2020). At least 4,800 of them serve on multiple boards, more than 2,000 of whom serve on the board of a company and a charity.
• 50,774 directors serve on 10,100 nonprofit company Boards, 4,955 of which are registered charities. This means there are 31,812 people who are director/trustees of incorporated charities.
• 42,678 people serve on the boards of 6,100 charities that are not incorporated.
Governance

7
Governance profile of Irish nonprofits While a nonprofit board typically has six members, the number is slightly higher for charities (seven) than non-charities (four). These averages are unchanged since our 2020 report. The largest boards are in education and research and the smallest in philanthropy and voluntarism, environment and international. Limited governance data is available for sports and religious organisations.
Profile of nonprofit board service On average, nonprofit directors/charity trustees serve for 6 consecutive years. The longest average term of service is in local development, and philanthropy and voluntarism (average 7 years) and the shortest is in health, and advocacy (average 4 years)
23% of the directors/charity trustees of Irish nonprofits have served for more than 9 years – considered the maximum appropriate term for good governance.
The sectors with the greatest number of long-serving directors/charity trustees are Local Development & Housing (38%) and Recreation & Sports (36%); the sector with the lowest is Education, Research at 10%
Governance

8
Gender balance on the boards of Irish nonprofits
Age Profile The average age of all nonprofit directors/charity trustees is 58.
Governance
While a nonprofit board typically has six members, the number is slightly higher for charities (seven) than non-charities (four). These averages are unchanged since our 2020 report. The largest boards are in education and research and the smallest in philanthropy and voluntarism, environment and international. Limited governance data is available for sports and religious organisations.
Arts, Culture, Media
Recreation, Sports
Education, Research
Health
Social Services
Local Development, Housing
Environment
Advocacy, Law, Politics
Philanthroopy, Voluntarism
International
Religion
Professional, Vocational
0% 90%80%70%60%50%40%30%20%10% 100%Female Male
Arts, C
ulture, M
edia
Recreation, S
ports
Education, R
esearchHealth
Social Services
Local Development, H
ousing
Environment
Advocacy, Law, P
olitics
Philanthroopy, V
oluntarism
Internatio
nal
Religion
Professional, V
ocational
0
10
20
30
40
50
60
70

9
Profile of nonprofit employment
People
People Irish nonprofits employ 164,922 people, up 3% on the number we reported in 2020, comparing like with like. Most of the increased employment is in large or medium-sized nonprofits.
In 55 higher education and major health and social care (“Section 38”) organisations, 67,544 employees are paid as though they were public servants.
48,668 people work in 1,734 nonprofits where the State is the principal source of income.
The remaining 48,710 work in nonprofits where the State is the minority funder or where there is no State funding at all.
Read more about where Benefacts gets data on nonprofit sector employment.
“Section38” & Universities
>50% State funded
<50% State funded or no State funding
All Charities Non Charities
Number of nonprofits
67,544
67,141
403
55
54
1
48,668
40,209
8,460
48,710
34,523
14,187
1,734
1,165
569
3,380
3,564
6,944
Number of employees

10
Employment profiles by sector
Higher pay in Irish nonprofits
Most people working in the nonprofit sector are employed in healthcare, social care including disability services, higher education and local development including social enterprise.
People
“Higher pay” means total remuneration of €70,000 or more. Most higher paid people in Irish nonprofits work in third level education and in “Section 38“-funded health and social care charities.
20.7%
1.0%
51,189 95,211
Number of employees
% of higher paid employees
“Section38” & universities All other nonprofits
Arts, Culture, Media 3,861
3,161
37,237
33,922
45,105
27,213
1,457
2,360
646
5,248
1,074
3,637
Recreation, Sports
Education, Research
Health
Social Services
Local Development, Housing
Environment
Advocacy, Law, Politics
Philanthroopy, Voluntarism
International
Religion
Professional, Vocational
0 45k40k35k30k25k20k15k10k5k 50kNon-charities Charities

11
Higher pay for nonprofit workers in context
Within the nonprofit sector 1% of people are highly paid.
People
Outside of quasi-State bodies (where pay and conditions are set by the State) only 1% of people working in Irish nonprofits are paid more than €70,000. In the economy at large, 14.6% of people are higher paid.
Within the same group of nonprofits, pension payments are recorded in the financial statements of only 10% of nonprofit companies .
Within the economy at large 14.6% of people are highly paid.

12
Income by sector in 2020 all nonprofits
Funding
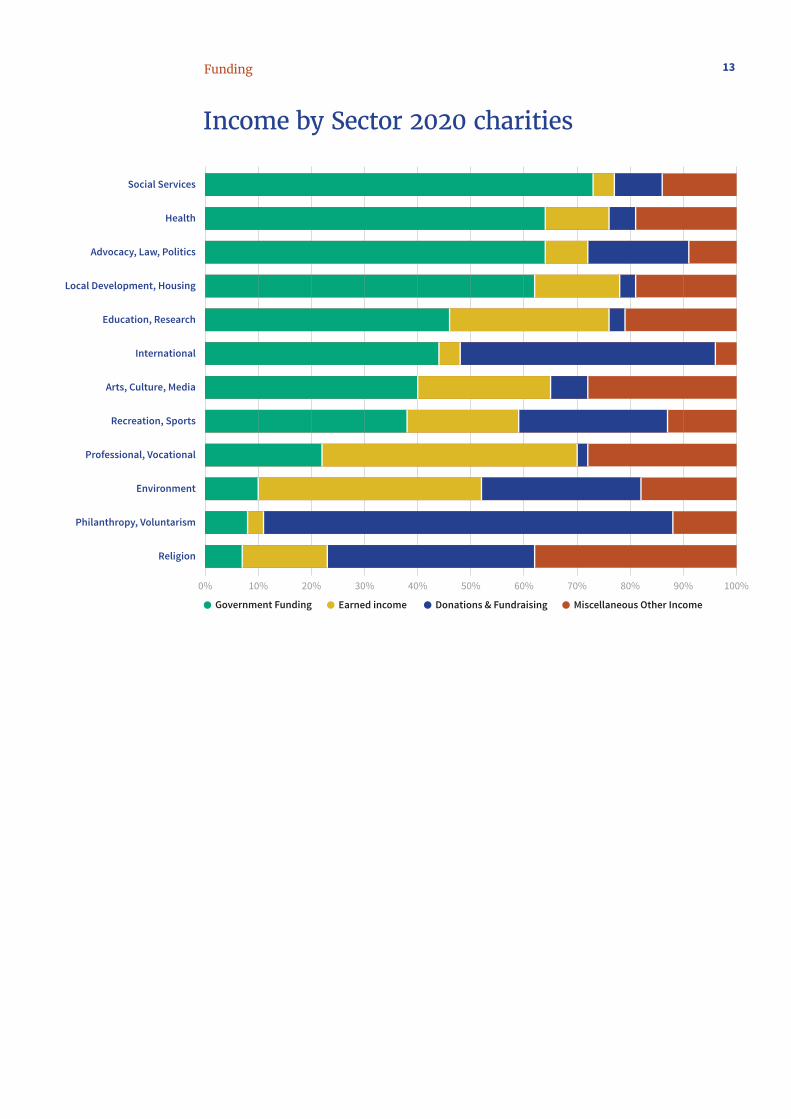
Funding The State is the biggest individual source of funding to the nonprofit sector, but nearly 80% of State funding is directed at just over 100 medium and large nonprofits, mostly in service fees to health and social care, higher education and local development.
In advocacy, law, politics, professional, and vocational organisations, the balance of income is mainly derived from earned revenues whereas philanthropy, voluntarism and international organisations are most heavily reliant on fund-raised income and philanthropic donations.
More than 220 Government departments or agencies including local authorities provided at least €6.2bn in fees or grants to nonprofits in Ireland during 2019.
Social Services
Health
Local Development, Housing
Advocacy, Law, Politics
Education, Research
International
Arts, Culture, Media
Environment
Recreation, Sports
Philanthropy, Voluntarism
Professional, Vocational
Religion
0% 90%80%70%60%50%40%30%20%10% 100%
Government Funding Earned income Donations & Fundraising Miscellaneous Other Income
13
Income by Sector 2020 charities
Funding
Social Services
Health
Local Development, Housing
Advocacy, Law, Politics
Education, Research
International
Arts, Culture, Media
Environment
Recreation, Sports
Philanthropy, Voluntarism
Professional, Vocational
Religion
0% 90%80%70%60%50%40%30%20%10% 100%
Government Funding Earned income Donations & Fundraising Miscellaneous Other Income

14Funding
Nonprofit sector fundraising costs Many nonprofits solicit donations from individuals, corporations and philanthropies, but only 52 are solely dedicated to fundraising year-round. There is no financial information available for 12 fundraising nonprofits that were included in last year’s report, for abridgement or other reasons. Using these indicators, professional fundraising costs are about 16% of the value of income raised.
Year Number of dedicated
fundraising charities
Total number of employees
Number of employees
whose remuneration
greater than €70,000
Total payroll €000
Total Income €000
2015 60 153 8 7,827 60,724
2016 61 132 9 7,114 58,027
2017 62 145 12 7,739 78,112
2018 64 146 10 8,060 52,947
2019 52 146 14 8,275 52,899

15About the data
About the dataThis year’s report Every year Benefacts publishes a sector analysis report using the most up to date data publicly available from a regulatory source for all of the nonprofit entities in its database. The financial data in this report relates to all incorporated nonprofits and charities with a financial year-end up to the end of December 2019.
Data sources Benefacts has accessed the available financial reports and other regulatory returns of 20,178 nonprofits (of which 11,342 are registered charities) in preparing this report. Data is frequently normalised and amalgamated from more than one source.
The data is derived from public disclosures to the Charities Regulator, the Companies Registration Office (CRO), the Library of the Oireachtas, the Registrar of Friendly Societies, Revenue, and the Standards in Public Office Commission. Published financial statements are the source for most of the financial and employment data in this report, and these are publicly available for 8,733 nonprofits (of which 4,598 are registered charities).
Still unavailable are the financial statements of 1,654 unincorporated charities whose combined turnover is about €1.79bn, despite the provisions of the Charities Act, S.54.
For the purpose of our analysis reports we also access the reported membership of local Public Participation Networks in 28 local authorities and the individual member entities of 2 Church bodies. These are not public regulatory sources which means the 14,153 local nonprofits in question are not given a listing on benefacts.ie.

16About the data
Data currency – change of policy The analysis is based on all of the data available for 2019 as at the first week of June 2021.
This year we have changed our policy in relation to estimating income in cases where this data is not available because the financial statements have been abridged or are not available for some other reason.
The 2014 reform of the Companies Act introduced a new provision for nonprofit companies to file abridged accounts. Each year since then, more of them have elected to do so, even in cases where they are also registered charities, although this trend is now levelling off. The Charities Regulator has sought to update the Charities Act to preclude this but this legislation has not yet been introduced.
Since 2017, we used the financial statements of prior years to estimate income sources, in cases where the latest set of financial statements had been filed in abridged form and pending new reporting standards for charities. This was because we considered that on balance it was more important to provide an estimate based on recent data than to report that there was no income – which we knew not to be the case.
However, the interval since the last available set of full accounts is now up to 3 years (or more in a small number of cases), so we have decided to stop estimating to compensate for gaps in the data. In this and future reports we will analyse only the data that is publicly available for the year in question. This means that the profile of income for the entire sector and its component sub-sectors in this 2021 report cannot be directly compared with the analysis in our 2020 report.
The impact of this change is to create an apparent reduction of 5% in sector income at large with 2,091 organisations with previously reported income of €719,788,710 now excluded.
Abridgement of accounts 2015 2016 2017 2018 2019
All companies limited by guarantee 26.5% 36.8% 44.2% 45.8% 45.8%
All charities incorporated as companies 23.8% 31.8% 36.6% 36.7% 36.3%
17About the data
Employment and governance data The number of reported employees in the nonprofit sector is derived from the published financial statements of 8,734 entities including 4,600 charities. This information is normally provided in the notes to the accounts.
In 189 cases where payroll costs have been reported but not numbers of employees, we have estimated employee numbers based on sector norms. We do not use the estimates of employee numbers reported on the public register of charities. There is no public source of data about employment numbers in primary and secondary schools (most of which are registered charities), so that is not included in this analysis.
The analysis of company directors including trustee-directors of charity companies is derived from compliance returns to the Companies Registration Office and information provided on the face of the register of charities but not published by the Charities Regulator as an open data file.