2020 property values and assessment practices report
TRANSCRIPT
Property Tax Division
March 1, 2020
2020 Property Values and Assessment Practices Report
Assessment Year 2019
This document is made available electronically by the Minnesota Legislative Reference Library as part of an ongoing digital archiving project. http://www.leg.state.mn.us/lrl/lrl.asp

Per Minnesota Statutes, section 3.197, any report to the Legislature must contain, at the beginning of the
report, the cost of preparing the report, including any costs incurred by another agency or another level of
government.
This report cost $8,100.
Commissioner’s Letter
2019 Property Values and Assessment Practices Report i
March 1, 2020
To Members of the Legislature of the State of Minnesota:
I am pleased to present to you this report on property values and assessment practices in Minnesota, the
18th annual version of this report. Since 2012, this report has been combined with the annual report
related to agricultural properties and Green Acres, satisfying the requirements of both Minnesota
Statutes, section 273.1108, and Minnesota Laws 2001, First Special Session, chapter 5, article 3,
section 92.
This report provides a summary of assessed property values and assessment practices in Minnesota,
with an emphasis on market values for 2a agricultural and 2b rural vacant land properties, and Green
Acres value methodology and determinations.
Sincerely,
Cynthia Bauerly Commissioner Minnesota Department of Revenue
600 N. Robert St., St. Paul, MN 55146 An equal opportunity employer
www.revenue.state.mn.us This material is available in alternate formats.
Contents
ii Minnesota Department of Revenue – Property Tax Division
Table of Contents Commissioner’s Letter ................................................................................................................... i
Table of Contents ......................................................................................................................... ii
Introduction .................................................................................................................................. 1
Overview of the Minnesota Department of Revenue’s Role ................................................................... 1
Estimated Market Values and the Sales Ratio Study ............................................................... 2
Sales Used for the 2019 Assessment Year ..................................................................................................... 2
Analysis of Sales Impacting Market Value Changes .................................................................................. 2
2019 Assessment Quality and Sales Ratio Studies on EMVs .................................................................. 3
Statewide Change in Value by Property Type .............................................................................................. 4
Taxable Market Value .................................................................................................................. 8
Taxable Market Value Trends ............................................................................................................................. 8
Green Acres and Rural Preserve ...................................................................................................................... 10
Tax Distribution .......................................................................................................................... 11
Taxable Value ......................................................................................................................................................... 11
2019 Trends ............................................................................................................................................................ 11
Appendix A – Summary of 2019 State Board Orders ............................................................. 13
Sales Ratios and Coefficients of Dispersion ................................................................................................ 13
State Board Orders by County for 2019 Assessment Year .................................................................... 14
Appendix B – Sales Ratio Studies ............................................................................................. 15
Appendix C – Classification Rates (2019 Assessment) ............................................................ 17
Appendix D – Green Acres and Rural Preserve Values .......................................................... 19
Taxable Green Acres Value ................................................................................................................................ 19
Rural Preserve ........................................................................................................................................................ 21
County Average Value Per Acre – Assessment Year 2019 ..................................................................... 22
Appendix E – Maps: Statewide Market Values and Assessment Practices Indicators ........ 25
Map 1: Percent Change in Total Estimated Market Value 2018-2019 ............................................... 26
Map 2: Real Property Sales Per 100 Parcels in 2019 ................................................................................ 27
Map 3: Taxable Tillable Green Acres/Rural Preserve Value (2019 Assessment) ........................... 28
Map 4: Taxable Non-Tillable Green Acres/Rural Preserve Value (2019 Assessment) .................. 29
Appendix F – Glossary ............................................................................................................... 30
Introduction
2019 Property Values and Assessment Practices Report 1
Introduction This is the 18th annual report to the Minnesota Legislature on property tax values and assessment
practices in the state. The Legislature mandated this report from the Minnesota Department of Revenue in
2001. Since 2012, this report has been combined with the annual report about agricultural properties and
Green Acres, satisfying the requirements of both Minnesota Statutes, section 273.1108, and Minnesota
Laws 2001, First Special Session, chapter 5, article 3, section 92.
As required by those mandates, this report contains:
▪ Information by major types of property on a statewide basis and at various jurisdictional levels
▪ Recent market value trends
▪ Trend analysis of excluded market value
▪ Assessment quality indicators, including sales ratios and coefficients of dispersion for counties
▪ A summary of State Board Orders issued in 2019
▪ Green Acres value methodology and determinations
▪ Assessment and classification practices for class 2a agricultural and 2b rural vacant land property
This report provides an accurate description of the current state of property tax assessment and an
overview of the department’s responsibility to oversee the state’s property tax assessment process. This
report collects property value data for the purpose of monitoring and analyzing underlying value trends
and assessment quality. This information and analysis informs government officials and the public about
valuation trends within the property tax system.
Overview of the Minnesota Department of Revenue’s Role Property taxes are an important source of revenue for all local units of government in Minnesota, including
counties, cities, townships, and school districts. The primary responsibility of the department’s Property Tax
Division is to ensure fair and uniform administration of, and compliance with, state property tax laws.
The Property Tax Division measures compliance with property tax laws through:
▪ The State Board of Equalization, which ensures that property taxpayers pay their fair share – no
more and no less. The Department of Revenue, acting as the State Board of Equalization, has the
authority to increase or decrease assessed market values in order to bring about equalization.
▪ Promotion of uniformity of administration among the counties to ensure that each taxpayer will be
treated in the same manner regardless of where the taxpayer lives.
▪ Delivery of accurate and timely aid calculations, certifications, and actual aid payments.
▪ Education and information for county officials, including technical manuals, bulletins, answers to
specific questions, and courses taught by division staff. These offerings provide county officials
the support and training necessary to administer property tax laws equitably and uniformly.
The classification system is another part of the Minnesota Department of Revenue’s efforts to measure
assessment quality. The sales ratio study and State Board of Equalization use property classifications to
Introduction
2 Minnesota Department of Revenue – Property Tax Division
study value trends and accuracy of assessors’ valuations. For the purposes of this report, the department
has focused on the following major classification types:
▪ Residential
▪ Seasonal recreational residential (cabins)
▪ Apartments
▪ Commercial
▪ Industrial
▪ Agricultural and rural lands
Estimated Market Values and the Sales Ratio Study Minnesota law requires that all property be valued at its market value. For property tax assessment
purposes, the market value is rounded to the nearest $100. Assessors are required to determine the value
of the land, the value of the structures and improvements to the land, and the resulting total market value.
The “market value” used for property tax purposes is the “open market value,” which is the price a
property would sell for under typical, normal, and competitive conditions. It is also called the estimated
market value (EMV). The most common method to determine EMVs is the comparable sales approach.
To evaluate the accuracy and uniformity of assessments within the state (and to ensure compliance with
property tax laws), the Minnesota Department of Revenue conducts annual sales ratio studies. These
studies measure the relationship between appraised values and the actual sales price.
Sales Used for the 2019 Assessment Year The number of sales decreased between the 2017 and 2018 sales ratio study years, though the number of
good sales increased for some property types. The data comes from sales that occurred October 1, 2017 –
September 30, 2018.
There were 139,803 Certificates of Real Estate Value (CRVs) received in the 2018 sales ratio study for
the 2019 State Board of Equalization.. Of these, 89,406 were considered good, current-year, open-market
sales. Both numbers decreased from the 2018 assessment (141,124 sales; 90,163 of them “good” sales).
Estimated market values increased for all major property types for the first time since the 2014
assessment. Overall estimated market values increased by 5.4%, continuing to increase at a faster rate
than the previous two years (5.3% from 2017-2018 and 4.6% from 2016-2017).
Analysis of Sales Impacting Market Value Changes Sales ratio studies measure the relationship between appraised values and the actual sales price. A sales
ratio is the assessor’s estimated market value of a property divided by its actual sales price, as seen here:
Sales Ratio = Assessor's Estimated Market Value
Sales Price
Equation 1
Estimated Market Values
2019 Property Values and Assessment Practices Report 3
For example, assume a home was valued by the assessor at $100,000. The home sold for $105,000. The
sales ratio would be calculated as follows:
Sales Ratio = $100,000
$105,000 = 95%
2019 Assessment Quality and Sales Ratio Studies on EMVs The two primary measures of assessment quality are the sales ratio and the “coefficient of dispersion”
(COD).1 Assessment quality improved between the 2017 and 2018 sales ratio studies, as evidenced by a
decrease in COD for all property types. (See Appendix A for the median sales ratios and CODs by
property type for the 2017 and 2018 sales ratio studies - assessment years 2018 and 2019.)
• Sales ratios measure the level of assessment (how close appraisals are to market value on an
overall basis). For the 2018 sales ratio study (for the 2019 assessment), the statewide median sales
ratios for all property types were in the acceptable targeted range of 90 to 105%.
• Coefficients of dispersion measure the uniformity of assessment (how close individual appraisals
are to the median ratio and each other). For the 2018 sales ratio study, the statewide coefficients
for most property classes except agricultural were within the International Association of
Assessing Officers’ (IAAO) acceptable ranges; a higher COD indicates a lack of uniformity in
assessments.2
State Board Orders The State Board of Equalization issues corrective orders when the median sales ratio for a property type is
outside the 90 to 105% acceptable range. For the 2018 sales ratio study for the 2019 assessment, 8
counties were issued State Board Orders. In comparison, 13 counties were issued State Board Orders for
the 2017 study for the 2018 assessment.
The Minnesota Department of Revenue’s appraisal staff works with assessors to identify areas of concern
for future assessments to help avoid State Board Orders. These issues usually fall into three categories:
1. Low sales ratios in areas with a history of few sales
2. Sales ratios near the 90 to 105% range boundaries
3. Areas with uniformity concerns
(See Appendix A for a list of State Board Orders by county for the 2019 assessment, and see Appendix B
for a detailed explanation of sales ratio studies used for these board orders.)
1 As a general rule, sales ratios and coefficients of dispersion are more accurate in classes with more sales activity because a
larger sales sample is more likely to reflect the range of values for all properties in the jurisdiction.
2 The lower the COD, the more uniform are the assessments. A high coefficient suggests a lack of equality among individual
assessments, with some parcels being assessed at a considerably higher ratio than others. Note that property types with smaller
sample sizes tend to have lower sales ratios and higher CODs. This is an area of concern with smaller sales samples. The
IAAO ranges are also provided in Appendix A.
Estimated Market Values
4 Minnesota Department of Revenue – Property Tax Division
Statewide Change in Value by Property Type
Recent Trends Apartments
For the fifth year in a row,
apartments’ estimated market
values (EMVs) grew faster
than all other property types,
increasing by 11.9% in 2019.
This continues a six-year
trend where apartment EMVs
rose by 10% or more
statewide.
Looking geographically,
much of this growth is driven
by apartments in the seven-
county metro area, where
81.8% of apartment EMV in
3 These property types are broad descriptions, and are based on statutory property tax classifications, which are described in
detail in Appendix C.
4 This property type represents only agricultural and rural vacant land, and excludes the house, garage, and first acre. In previ-
ous reports this property type included values for parcels no smaller than 34.5 acres. Since the 2019 Assessment Practices re-
port, all parcel acreages are included, except for the house, garage, and first acre.
5 Excluding the cities of Rochester, Duluth, and St. Cloud.
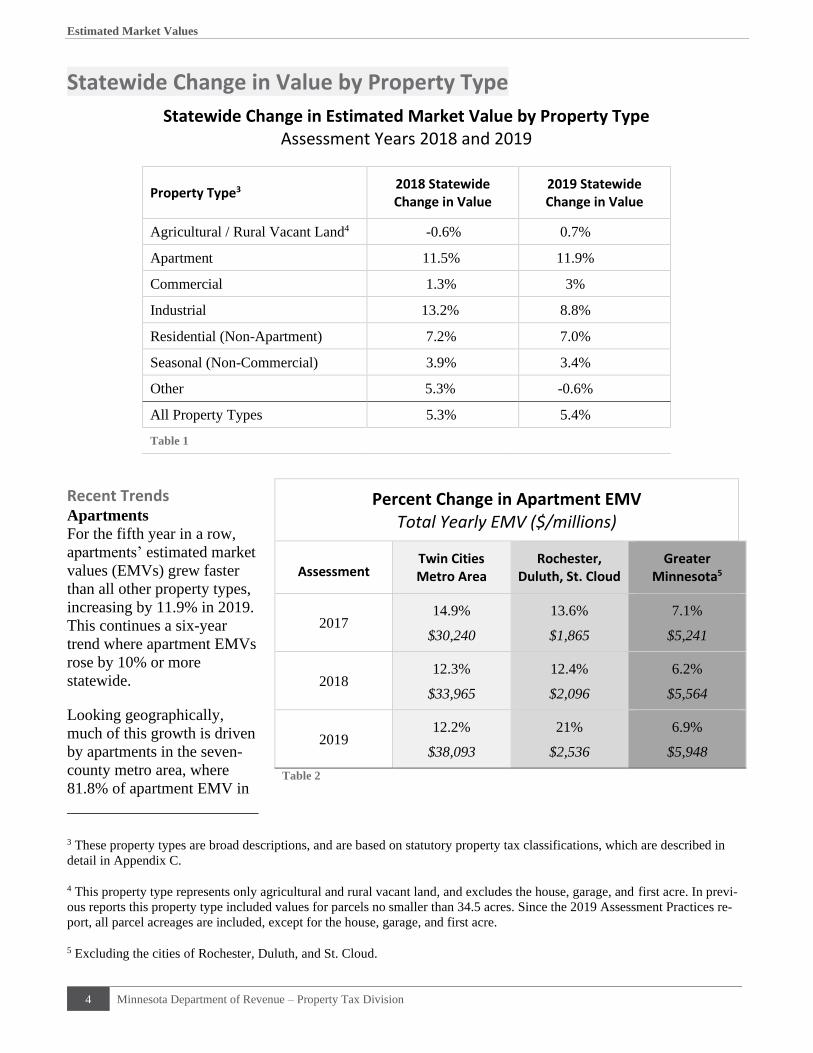
Statewide Change in Estimated Market Value by Property Type Assessment Years 2018 and 2019
Property Type3 2018 Statewide Change in Value
2019 Statewide Change in Value
Agricultural / Rural Vacant Land4 -0.6% 0.7%
Apartment 11.5% 11.9%
Commercial 1.3% 3%
Industrial 13.2% 8.8%
Residential (Non-Apartment) 7.2% 7.0%
Seasonal (Non-Commercial) 3.9% 3.4%
Other 5.3% -0.6%
All Property Types 5.3% 5.4%
Table 1
Percent Change in Apartment EMV Total Yearly EMV ($/millions)
Assessment Twin Cities Metro Area
Rochester, Duluth, St. Cloud
Greater Minnesota5
2017 14.9%
$30,240
13.6%
$1,865
7.1%
$5,241
2018 12.3%
$33,965
12.4%
$2,096
6.2%
$5,564
2019 12.2%
$38,093
21%
$2,536
6.9%
$5,948
Table 2

Estimated Market Values
2019 Property Values and Assessment Practices Report 5
the state is found. Apartment growth in Rochester, Duluth, and St. Cloud has also been high, though the
EMV share is much lower. Apartment EMV growth in the rest of Greater Minnesota has been steady and
similar to other residential property types.
Agricultural Property
Agricultural property values increased in 2019 for the first year since 2014, albeit by less than 1%.
The increase in value is limited exclusively to non-homesteaded agricultural property. Homesteaded agri-
cultural land EMV decreased by 0.7%, whereas non-homesteaded agricultural land EMV increased by
2.8%. This could be due to more agricultural homesteads owning more land over the first tier of value
($1.88 million in 2019), or fewer homesteaded agricultural parcels in general.
Residential Property
Residential non-apartment
EMV increased at a slightly
slower rate than last year,
though EMV is still
increasing faster than most
other property types.
Looking geographically, resi-
dential values grew at a simi-
lar rate across our three geo-
graphic areas. Metro values
increased at a lower rate than
last year, while EMV growth
in the other two regions
slowed.
Residential values are heavily
concentrated in the metro area, but in a smaller proportion compared to apartments.
Seasonal Recreational Residential Property
Seasonal properties’ market values continue to grow more slowly than residential homestead values.
Values increased slightly less than last year but still outpaced growth from 2015-2018.
Commercial/Industrial Property
For the 2020 Assessment Practices report, commercial property has been reviewed independently from
industrial property. This is because current and historical data has shown that commercial property EMV
is increasing at a much lower rate than that of industrial property.
Percent Change in Residential Non-Apartment EMV Total Yearly EMV ($/millions)
Assessment Twin Cities Metro Area
Rochester, Duluth, St. Cloud
Greater Minnesota5
2017
7.1%
$253,120
6.0%
$14,285
5.3%
$116,823
2018
7.5%
$272,100
7.0%
$15,281
6.5%
$124,360
2019
7.2%
$291,566
7.0%
$16,352
6.7%
$132,661
Table 3
Percent Change in Commercial and Industrial EMV for Assessment Year 2019
Class State Total
Twin Cities Metro
Area Rochester, Duluth,
St. Cloud Greater Minnesota5
Commercial 3% 3.2% 3.3% 2.3%
Industrial 8.8% 9.7% 4.3% 6%
Table 4

Estimated Market Values
6 Minnesota Department of Revenue – Property Tax Division
Commercial Property
Commercial EMV increased at a higher rate than last year, but still lags behind every other major property
type except for agricultural.
Properties that are considered commercial include properties such as office buildings, retail stores, malls,
hotels, banks, restaurants, and service outlets. In 2019, the majority of the $66 billion of statewide com-
mercial EMV (70.3%) was within the metro area, 7% in Rochester, Duluth, and St. Cloud, and the re-
maining 22.7% in the rest of Greater Minnesota.
Growth is lower in Greater Minnesota, however it is still an improvement from 2018, when commercial
EMV decreased. Overall, changes in commercial EMV have been varied over the past three years, both
statewide and within different geographic areas.
Percent Change in Commercial EMV
Assessment Year State Total
Twin Cities Metro
Area Rochester, Duluth,
St. Cloud Greater
Minnesota5
2017 5.1% 6.1% 1.3% 3.2%
2018 1.3% 1.6% 3.5% -0.3%
2019 3% 3.2% 3.3% 2.3%
Table 5
Industrial Property
While commercial EMV has been increasing at a relatively slow pace, industrial EMV has been growing
at one of the highest rates of all major property types over the last three years.
The statewide estimated market value is the smallest of the major property types at $23.9 billion in 2019,
with 76.3% of the value located in the metro area. Only 2.5% of statewide EMV is located in Rochester,
Duluth, and St. Cloud, which may result in more extreme yearly changes. The remaining 21.2% is located
in the rest of Greater Minnesota. This distribution is relatively similar to that of commercial properties.
Percent Change in Industrial EMV
Assessment Year State Total
Twin Cities Metro
Area Rochester, Duluth,
St. Cloud Greater
Minnesota5
2017 7.9% 7.6% 29% 6.8%
2018 13.2% 12.2% 8% 17.6%
2019 8.8% 9.7% 4.3% 6%
Table 6
Estimated Market Values
2019 Property Values and Assessment Practices Report 7
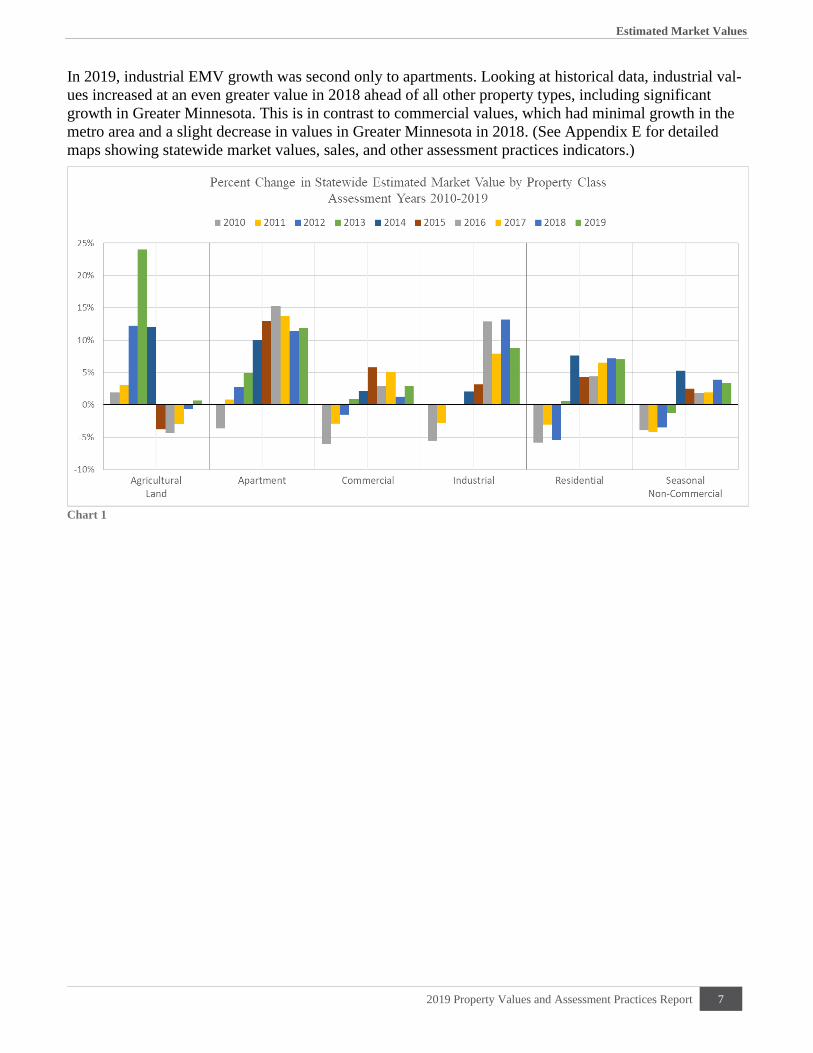
In 2019, industrial EMV growth was second only to apartments. Looking at historical data, industrial val-
ues increased at an even greater value in 2018 ahead of all other property types, including significant
growth in Greater Minnesota. This is in contrast to commercial values, which had minimal growth in the
metro area and a slight decrease in values in Greater Minnesota in 2018. (See Appendix E for detailed
maps showing statewide market values, sales, and other assessment practices indicators.)
Chart 1

Taxable Market Value
8 Minnesota Department of Revenue – Property Tax Division
Taxable Market Value In Minnesota, taxes are not directly based on the estimated market value. State property tax laws contain a
number of exclusions, value deferrals, and exemptions that decrease the amount of the EMV that is
subject to taxation.
Taxable Market Value (TMV) refers to the amount of value that is actually used in calculating property
taxes. This often differs from EMV due to special programs and exclusions. Sample TMV calculations
can be found in the Property Tax Administrator’s Manual, available at www.revenue.state.mn.us.
Taxable market value not only decreases an individual property’s tax burden, it also decreases the tax
base for the taxing jurisdiction. The taxable market value is used to determine the tax base for levying
authorities (cities, counties, towns, etc.).
For example, a given county’s levy (budget) is spread among all classes of taxable property by
determining the cumulative net tax capacity of all the properties. The net tax capacity (taxable market
value multiplied by the class rate) of all taxable properties in a jurisdiction is the tax base.
A simple illustration of how property tax rates are determined is shown below:
Step 1: Total proposed budget
− All non-property tax revenue (state aids and fees)
= Property tax revenue needed
Step 2: Property tax revenue needed
÷ Total tax capacity of all taxable properties
= Local tax rate
When taxable market values change, the tax burden is redistributed within the jurisdiction. If the levy
remains constant, property taxes for a single property may still change depending on changes in the
classification rate and/or taxable market value of other properties in the jurisdiction. See Table 7 (next
page) for some of the more common exclusions and deferrals that remove taxable value from the tax base.
Taxable Market Value Trends As indicated in Table 7, continued growth in residential homestead values has reduced eligibility for the
Homestead Market Value Exclusion. The exclusion has decreased consistently for the past six years, as
market values for residential properties has continued to increase during the same time period.
The Homestead Exclusion for Veterans with a Disability has continued to increase by approximately 10%
annually.
Plat Law exclusions continue to increase, indicating that there is continued development in Minnesota.
This is a larger increase than last year’s 7% increase and more in line with the more-than 10% increases
that had taken place the previous four years.
Green Acres deferrals are discussed further in the next section.
Taxable Market Value
2019 Property Values and Assessment Practices Report 9
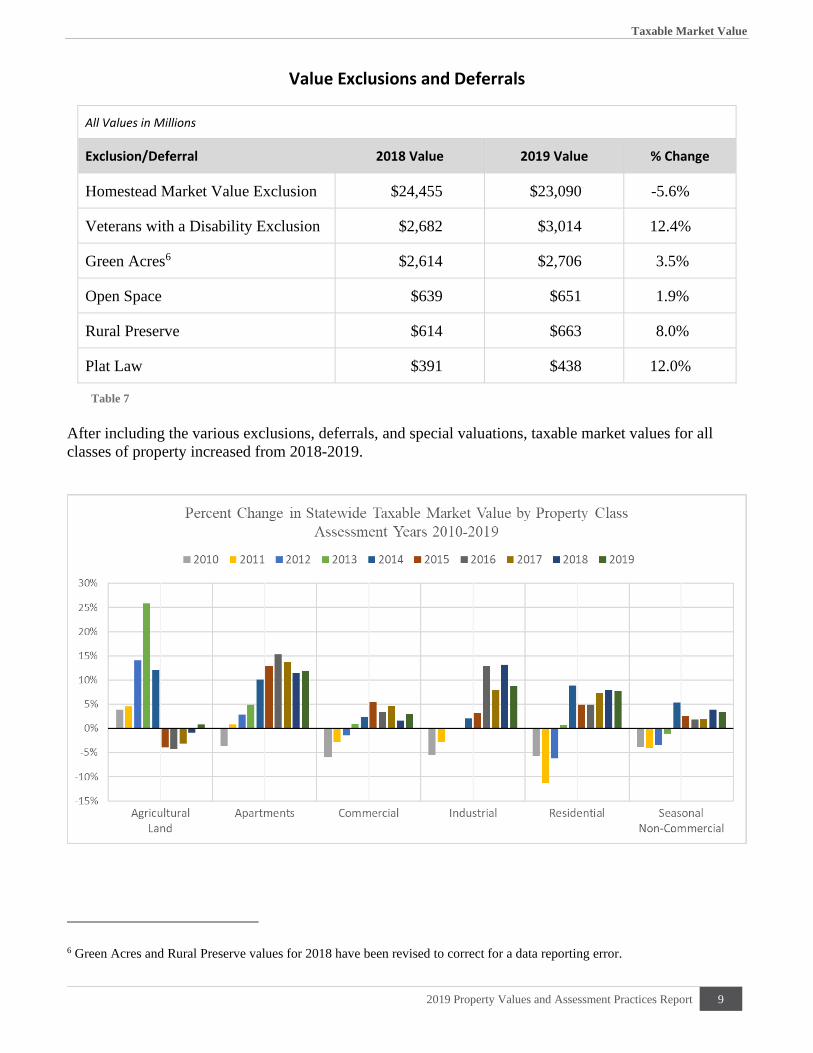
Value Exclusions and Deferrals
All Values in Millions
Exclusion/Deferral 2018 Value 2019 Value % Change
Homestead Market Value Exclusion $24,455 $23,090 -5.6%
Veterans with a Disability Exclusion $2,682 $3,014 12.4%
Green Acres6 $2,614 $2,706 3.5%
Open Space $639 $651 1.9%
Rural Preserve $614 $663 8.0%
Plat Law $391 $438 12.0%
Table 7
After including the various exclusions, deferrals, and special valuations, taxable market values for all
classes of property increased from 2018-2019.
6 Green Acres and Rural Preserve values for 2018 have been revised to correct for a data reporting error.
Chart 2

Tax Distribution
10 Minnesota Department of Revenue – Property Tax Division
Green Acres and Rural Preserve Green Acres and Rural Preserve are property tax deferral programs that help keep farm property values
from increasing due to non-agricultural influences such as development or recreational uses on nearby
properties. The taxable market value of qualifying farm land is based on its agricultural use, rather than its
highest and best use (which may be impacted by sales of nearby land for development or speculation).
The Department of Revenue determines a Green Acres value for tillable and non-tillable class 2a
agricultural land for each county to reflect market and agricultural conditions. Counties use the Green
Acres value when calculating property taxes. Rural Preserve provides a similar benefit for class 2b rural
vacant land that is part of a farm. (See Appendix D for details about Green Acres and Rural Preserve
values for the 2019 assessment.)
Green Acres taxable value increased for the first time since 2015, which is logical given the increasing
value of agricultural land. The deferred value also increased, reflecting the continued increase in value of
other property types and development pressure on agricultural land. However, deferred value increased by
a smaller amount than in the past, likely reflecting that agricultural EMV grew with other property types.7
Overall, the percentage of deferred value increased, as the increase in agricultural EMV was not large
enough to counteract the development pressure seen by the increases in EMV of other property types.
Rural Preserve taxable and deferred values both increased, resulting in an increase in percentage of value
deferred.
7 The percentage of deferred value typically has a negative correlation to agricultural property value (the deferred amount
decreases when agricultural property EMV increases and vice versa). Conversely, the deferred value has a positive correlation
to other property values (the deferred amount increases if other property EMV increases). Because all major property values
increased this last year, these factors are pointing in opposite directions.
8 Green Acres and Rural Preserve values for 2018 have been revised to correct for a data reporting error.
Green Acres and Rural Preserve Deferrals
All Values in Millions
Green Acres 2017 20188 2019
Taxable Value $12,069 $11,897 $12,180
Deferred Value $2,479 $2,614 $2,706
Percent Deferred* 17.0% 18.0% 18.2%
Rural Preserve 2017 2018 2019
Taxable Value $687 $688 $693
Deferred Value $593 $614 $663
Percent Deferred* 46.3% 47.2% 48.9%
* Percent Deferred = Percentage of Total EMV (Deferred Value + Taxable Value) that received deferral
Table 8

Tax Distribution
2019 Property Values and Assessment Practices Report 11
Green Acres Values: 2019 Assessment Year Impact For assessment year 2019 (taxes payable 2020), statewide taxable values of 2a agricultural land increased
by about 0.7%, while the amount of value deferred under Green Acres increased by 0.2%. Data from the
last three years is shown in Table 8.
Tax Distribution Minnesota’s property tax system has several components including classification, valuation, and special
programs that reduce taxable value, credits, and different levies. These components determine which
properties will pay a greater or lesser share of taxes.
Taxable Value The nature of Minnesota’s property tax system is that if the taxable value of one class of property
decreases, it pays a smaller share of the overall tax burden and other property classes pay a larger share.
For example, agricultural and homesteaded properties have typically received preferential property tax
treatment through classification rates and programs – such as Green Acres and the Homestead Market
Value Exclusion – and through homestead credits and school bonding credits,
Conversely, commercial/industrial properties typically pay a greater share of taxes than residential or
agricultural properties of equal value due to a higher class rate, lesser eligibility for special programs, and
being subject to additional levies such as the state general tax. (See Appendix C for details about the
classification rates used for the 2019 assessment.)
The impact of these components is clear when reviewing tax liability and effective tax rates. Based on
preliminary estimates from the 2019 assessment year (taxes payable 2020):
• Agricultural property and rural vacant land represent about 17% of taxable property value and pay
about 6% of net property taxes statewide. (See Table 9, next page.)
• Commercial property accounts for 9% of market value and pays 20% of property taxes.
• Industrial property accounts for 3% of market value and pays 7% of property taxes.
These numbers are affected by where the majority of each property type is located and the surrounding
tax base, but they still provide insight into how different classifications contribute to the tax base.
2019 Trends
Agricultural and Residential Property The market value share of agricultural property continued to decrease, as it has since 2014, despite the
increase in EMV. Agricultural property makes up 17.3% of statewide market value share, down from
18.2% in 2018 and 20.9% in 2017.
This decrease is logical – given the low increase in EMV compared to the large increases in apartments
and other residential properties – and corresponds with the decrease in net tax share of agricultural land
by 0.1% since 2018.
Tax Distribution
12 Minnesota Department of Revenue – Property Tax Division
Commercial and Industrial Property For commercial property, market value share and net tax both continue to decrease. The share of net taxes
paid by commercial properties decreased from 22.3% in 2017, to 20.7% in 2018, and 20% in 2019.
Similarly, market value share decreased from 9.5% in 2017 to 9.1% in 2018, and 8.9% in 2019. This
corresponds to the small increases of EMV in those years compared to other property types.
For industrial property, market value share and net tax share both fell in 2019 after increasing in 2018.
While industrial EMV increased in 2019, the total EMV still remains the lowest of all property types;
therefore even moderate increases in EMV may not significantly affect the overall share of market value
or net tax. For example, in 2018 industrial EMV increased by over 13% – more than any other property
type – but market value share only increased by 0.2%.
Both commercial and industrial property’s overall market value and net tax has increased in dollars in the
last two years as their EMVs have increased. Because there are no deferrals or exclusions dedicated to
commercial or industrial properties, it is reasonable that as long as their EMVs increase, their overall
market values and net taxes in dollars will also increase.
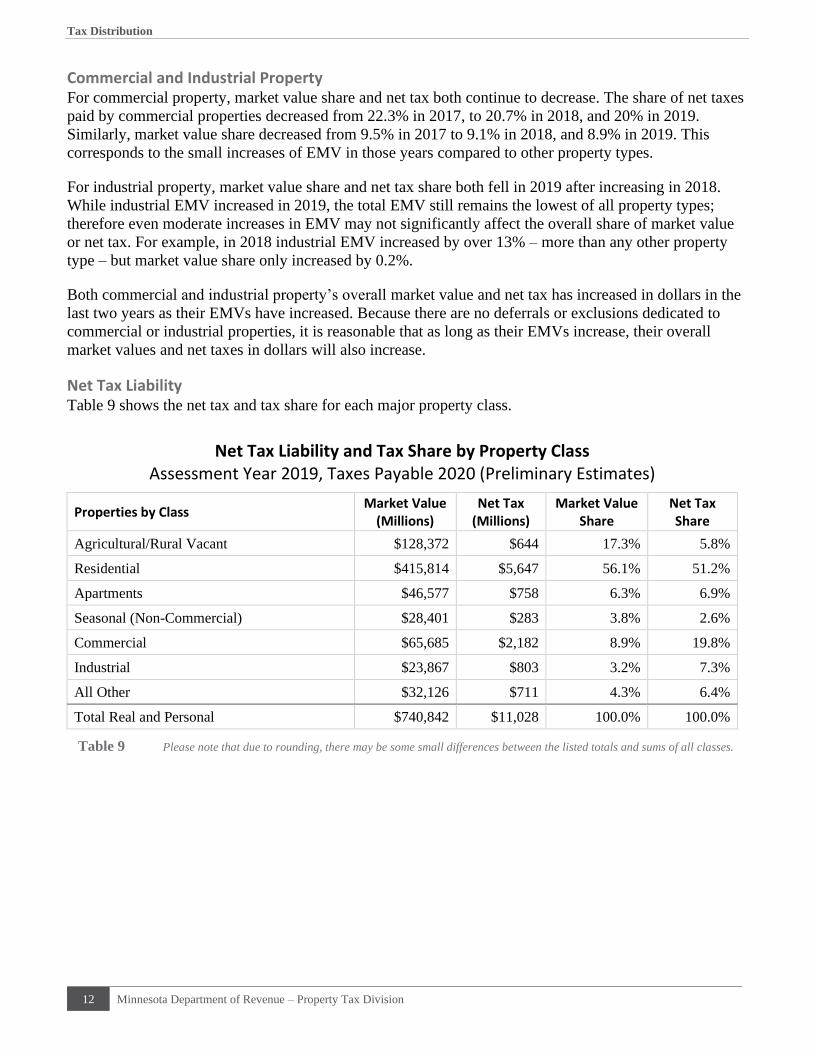
Net Tax Liability Table 9 shows the net tax and tax share for each major property class.
Net Tax Liability and Tax Share by Property Class Assessment Year 2019, Taxes Payable 2020 (Preliminary Estimates)
Properties by Class Market Value
(Millions) Net Tax
(Millions) Market Value
Share Net Tax Share
Agricultural/Rural Vacant $128,372 $644 17.3% 5.8%
Residential $415,814 $5,647 56.1% 51.2%
Apartments $46,577 $758 6.3% 6.9%
Seasonal (Non-Commercial) $28,401 $283 3.8% 2.6%
Commercial $65,685 $2,182 8.9% 19.8%
Industrial $23,867 $803 3.2% 7.3%
All Other $32,126 $711 4.3% 6.4%
Total Real and Personal $740,842 $11,028 100.0% 100.0%
Table 9 Please note that due to rounding, there may be some small differences between the listed totals and sums of all classes.

Appendix A ▪ Summary of 2018 State Board Orders
2019 Property Values and Assessment Practices Report 13
Appendix A – Summary of 2019 State Board Orders Sales Ratios and Coefficients of Dispersion
The International Association of Assessing Officers (IAAO) recommends trimming the most extreme
outliers from the sample before calculating the COD. The trimming method used by the Sales Ratio
excludes sales outside of an interquartile range determined by jurisdiction. This eliminates a few extreme
sales that would distort the COD. Per the IAAO, the acceptable ranges for the COD are as follows:
Coefficient of Dispersion (COD) Acceptable Ranges
by Property Type
Property Type Acceptable COD Range
Newer, homogenous residential properties 10.0 or less
Older residential areas 15.0 or less
Rural residential and seasonal properties 20.0 or less
Income producing: larger, urban area 15.0 or less
smaller, rural area 20.0 or less
Vacant land 20.0 or less
Depressed markets 25.0 or less
Table 11
Property Type Final Adjusted Median Ratio
Coefficient of Dispersion
Sample Size
State Board Year 2017 2018 2017 2018 2017 2018
Residential/Seasonal 94.62 94.59 8.96 8.44 79,233 78,178
Apartment 94.78 93.62 13.12 11.59 556 568
Commercial/Industrial 95.14 95.00 17.02 16.87 1,656 1,674
Resorts 100.85 94.59 19.79 15.78 20 27
Agricultural 2a / Rural Vacant
2b 96.53 95.74 28.84 21.49 3,442 3,668
Table 10
Appendix A ▪ Summary of 2018 State Board Orders
14 Minnesota Department of Revenue – Property Tax Division
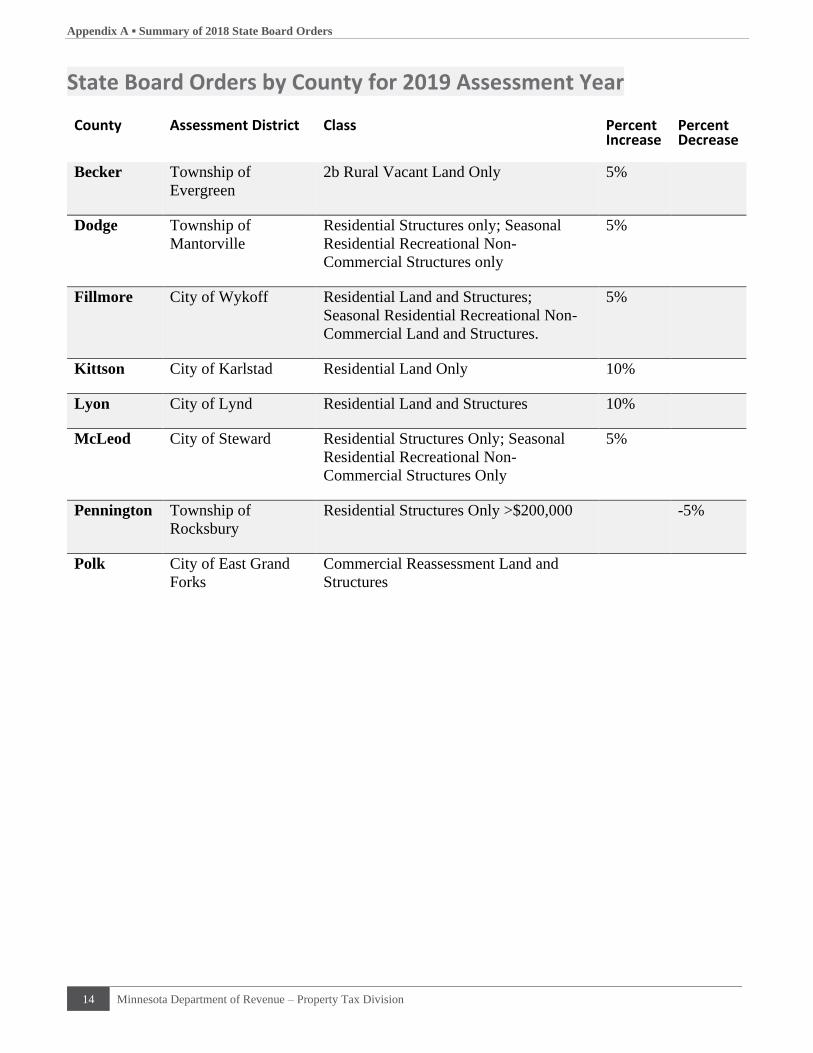
State Board Orders by County for 2019 Assessment Year
County Assessment District Class Percent Increase
Percent Decrease
Becker Township of
Evergreen
2b Rural Vacant Land Only 5%
Dodge Township of
Mantorville
Residential Structures only; Seasonal
Residential Recreational Non-
Commercial Structures only
5%
Fillmore City of Wykoff Residential Land and Structures;
Seasonal Residential Recreational Non-
Commercial Land and Structures.
5%
Kittson City of Karlstad Residential Land Only 10%
Lyon City of Lynd Residential Land and Structures 10%
McLeod City of Steward Residential Structures Only; Seasonal
Residential Recreational Non-
Commercial Structures Only
5%
Pennington Township of
Rocksbury
Residential Structures Only >$200,000
-5%
Polk City of East Grand
Forks
Commercial Reassessment Land and
Structures

Appendix B ▪ Sales Ratio Studies
2019 Property Values and Assessment Practices Report 15
Appendix B – Sales Ratio Studies 12-Month Study The 12-month study is mainly used to determine State Board of Equalization Orders. The 12 months
encompass the period from October 1 of one year through September 30 of the following year. The dates
are based on the dates of sale as indicated on the Certificate of Real Estate Value (CRV).
CRVs are filled out by the buyer or seller whenever property is sold or conveyed and filed with the
county. The certificates include the sales price of the property, disclosure of any special financial terms
associated with the sale, and whether the sale included personal property. The actual sales price from the
CRV is then compared to what the county has reported as the market value.
The data contained in the report is based upon the 12-month study using sales from October 1, 2017,
through September 30, 2018. These sales are compared with preliminary values for assessment year 2019,
taxes payable 2020. The sale prices are adjusted for time and financial terms to the date of the assessment,
which is January 2 of each year. For this study, the sales are adjusted to January 2, 2019.
In areas with few sales, it is very difficult to adjust for inflation or deflation because the sales samples are
used to develop time trends. For example, based on an annual inflation rate of 3% (.25% monthly), if a
house were purchased in August 2018 for $200,000, it would be adjusted to a January 2019 value of
$202,500, or the sales price would be adjusted upward by 1.25% for the 5-month timeframe to January.
The State Board of Equalization orders assessment changes when the level of assessment (as measured by
the median sales ratio) is below 90%, or above 105%. The orders are usually on a county-, city-, or
township-wide basis for a particular classification of property. All State Board Orders must be
implemented by the county. The changes will be made to the current assessment under consideration, for
taxes payable the following year.
The equalization process (including issuing State Board Orders) is designed not only to equalize values on
a county-, town-, or city-wide basis, but also to equalize values across county lines to ensure a fair
valuation process across taxing districts, county lines, and property types. State Board Orders are
implemented only after a review of values and sales ratios and discussions with the county assessors in
the county affected by the State Board Orders, county assessors in adjacent counties, and the department.
A separate 9-month study is used by the Tax Court and is based on sales occurring between January 1 and
September 30 of a given year. (It is the same as the 12-month study, but excludes the sales from October,
November, and December.)
21-Month Study The purpose of the 21-month study is to adjust values used for state aid calculations so that all
jurisdictions across the state are equalized. In order to build stability into the system, a longer term of 21
months is used, which allows for a greater number of sales. While the 9- and 12-month studies compare
the actual sales to the assessor’s estimated market value, the 21-month study compares actual sales to the
assessor’s taxable market value. As with the 9- and 12-month studies, the sale prices are adjusted for time
and terms of financing.
The 21-month study is used to calculate adjusted net tax capacities that are used in the foundation aid
formula for school funding. It is also used to calculate tax capacities for Local Government Aid (LGA)

Appendix B ▪ Sales Ratio Studies
16 Minnesota Department of Revenue – Property Tax Division
and various smaller aids such as library aid. This study is also utilized by bonding companies to rate the
fiscal capacity of different governmental jurisdictions.
The adjusted net tax capacity is used to eliminate differences in levels of assessment between taxing
jurisdictions for state aid distributions. All property is meant to be valued at its selling price in an open
market, but many factors make that goal hard to achieve. The sales ratio study can be used to eliminate
differences caused by local markets or assessment practices.
The adjusted net tax capacity is calculated by dividing the net tax capacity of a class of property by the
sales ratio for the class. For example, the net tax capacity for residential properties is divided by the
residential sales ratio to produce the residential adjusted net tax capacity. The process would be repeated
for all of the property types. The total adjusted net tax capacity would be used in state aid calculations.
Appendix C ▪ Classification Rates
2019 Property Values and Assessment Practices Report 17
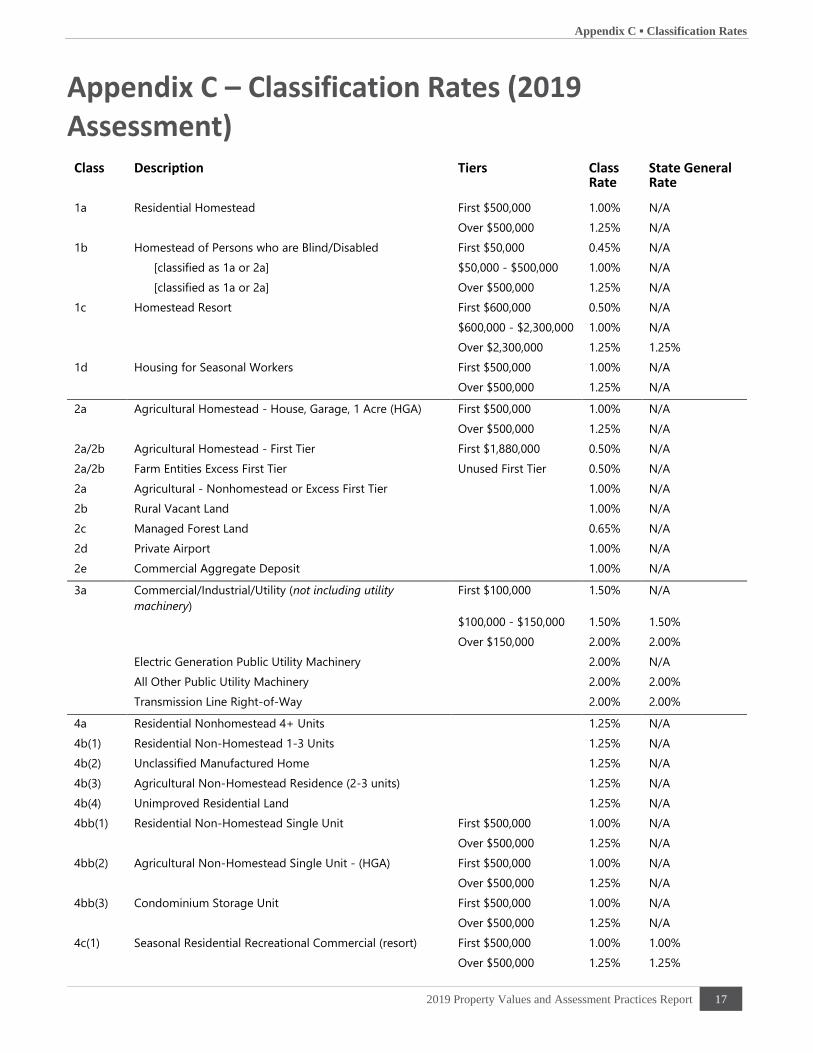
Appendix C – Classification Rates (2019 Assessment)
Class Description Tiers Class Rate
State General Rate
1a Residential Homestead First $500,000 1.00% N/A
Over $500,000 1.25% N/A
1b Homestead of Persons who are Blind/Disabled First $50,000 0.45% N/A
[classified as 1a or 2a] $50,000 - $500,000 1.00% N/A
[classified as 1a or 2a] Over $500,000 1.25% N/A
1c Homestead Resort First $600,000 0.50% N/A
$600,000 - $2,300,000 1.00% N/A
Over $2,300,000 1.25% 1.25%
1d Housing for Seasonal Workers First $500,000 1.00% N/A
Over $500,000 1.25% N/A
2a Agricultural Homestead - House, Garage, 1 Acre (HGA) First $500,000 1.00% N/A
Over $500,000 1.25% N/A
2a/2b Agricultural Homestead - First Tier First $1,880,000 0.50% N/A
2a/2b Farm Entities Excess First Tier Unused First Tier 0.50% N/A
2a Agricultural - Nonhomestead or Excess First Tier 1.00% N/A
2b Rural Vacant Land 1.00% N/A
2c Managed Forest Land 0.65% N/A
2d Private Airport 1.00% N/A
2e Commercial Aggregate Deposit 1.00% N/A
3a Commercial/Industrial/Utility (not including utility
machinery)
First $100,000 1.50% N/A
$100,000 - $150,000 1.50% 1.50%
Over $150,000 2.00% 2.00%
Electric Generation Public Utility Machinery 2.00% N/A
All Other Public Utility Machinery 2.00% 2.00%
Transmission Line Right-of-Way 2.00% 2.00%
4a Residential Nonhomestead 4+ Units 1.25% N/A
4b(1) Residential Non-Homestead 1-3 Units 1.25% N/A
4b(2) Unclassified Manufactured Home 1.25% N/A
4b(3) Agricultural Non-Homestead Residence (2-3 units) 1.25% N/A
4b(4) Unimproved Residential Land 1.25% N/A
4bb(1) Residential Non-Homestead Single Unit First $500,000 1.00% N/A
Over $500,000 1.25% N/A
4bb(2) Agricultural Non-Homestead Single Unit - (HGA) First $500,000 1.00% N/A
Over $500,000 1.25% N/A
4bb(3) Condominium Storage Unit First $500,000 1.00% N/A
Over $500,000 1.25% N/A
4c(1) Seasonal Residential Recreational Commercial (resort) First $500,000 1.00% 1.00%
Over $500,000 1.25% 1.25%

Appendix C ▪ Classification Rates
18 Minnesota Department of Revenue – Property Tax Division
Class Description Tiers Class Rate
State General Rate
4c(2) Qualifying Golf Course 1.25% N/A
4c(3)(i) Non-Profit Community Service Org. (non-revenue) 1.50% N/A
Congressionally Chartered Veterans Organization (non-revenue) 1.00% N/A
4c(3)(ii) Non-Profit Community Service Org. (donations) 1.50% 1.50%
Congressionally Chartered Veterans Organization
(donations)
1.00% 1.00%
4c(4) Post-Secondary Student Housing 1.00% N/A
4c(5)(i) Manufactured Home Park 1.25% N/A
4c(5)(ii) Manufactured Home Park (>50% owner-occupied) 0.75% N/A
4c(5)(ii) Manufactured Home Park (50% or less owner-occupied) 1.00% N/A
4c(5)(iii) Class I Manufactured Home Park 1.00% N/A
4c(6) Metro Non-Profit Recreational Property 1.25% N/A
4c(7) Certain Non-Comm. Aircraft Hangars and Land (leased
land)
1.50% N/A
4c(8) Certain Non-Comm. Aircraft Hangars and Land (private
land)
1.50% N/A
4c(9) Bed & Breakfast 1.25% N/A
4c(10) Seasonal Restaurant on a Lake 1.25% N/A
4c(11) Marina First $500,000 1.00% N/A
Over $500,000 1.25% N/A
4c(12) Seasonal Residential Recreational Non-Commercial First $76,000 1.00% 0.40%
$76,000 - $500,000 1.00% 1.00%
Over $500,000 1.25% 1.25%
4d Low Income Rental Housing (Per Unit) First $150,000 0.75% N/A
Over $150,000 0.25% N/A
5(1) Unmined Iron Ore and Low-Grade Iron-Bearing
Formations
2.00% 2.00%
5(2) All Other Property 2.00% N/A
Appendix D ▪ Green Acres and Rural Preserve Value
2019 Property Values and Assessment Practices Report 19
Appendix D – Green Acres and Rural Preserve Values The Minnesota Agricultural Property Tax Law (referred to as “Green Acres”) helps insulate farm owners
from rising land values due to non-agricultural influences on the land – such as nearby residential and
commercial development, or seasonal cabin and resort properties.
Property enrolled in the Green Acres program is valued at its agricultural value rather than its highest and
best use value (which may be impacted by development pressures). This provides a lower taxable value for
qualifying properties and redistributes the tax burden to other properties in the same jurisdiction.
Only property classified as class 2a agricultural land under Minnesota Statutes section 273.13, subdivision
23 can qualify for Green Acres, and at least 10 contiguous acres must be used (unless it is a qualifying
nursery or greenhouse).
Green Acres is a property tax deferral program. When a property is sold, transferred, or no longer qualifies
for the program, the owner has to pay the difference in tax for the last three years of enrollment. When a
property enrolled in Green Acres is sold to another person who may qualify for the program, the new
owner must apply to the county assessor within 30 days of the purchase for the program to continue on the
property.
Taxable Green Acres Value Green Acres requires assessors to look at qualifying agricultural property in two ways.
▪ First, the assessor must value the property according to its highest and best use (as is done for all
properties). This may include non-agricultural value influences.
▪ Then the assessor must determine the agricultural value of the property based on Department of
Revenue guidance.
▪ If the agricultural value is below the highest and best use value, the assessor must use the
agricultural value for tax purposes.
The Minnesota Department of Revenue establishes agricultural land values throughout the state in
consultation with the University of Minnesota. (See Minnesota Statutes, section 273.111, subdivision 4.)
Analyzing Agricultural Sales To establish these agricultural values, the department examines sales of agricultural land throughout the
state. (See Minnesota Statutes, section 273.111, subdivision 4.)
The department looks at agricultural sales in each of the 87 counties to determine Green Acres values that
reflect the agricultural economy in general. When determining Green Acres values, the department
attempts to identify pure agricultural sales – sales that were not influenced by developmental pressure or
other non-agricultural factors.
To identify pure agricultural sales, the department identifies areas where development pressure may affect
the sale price of agricultural land. Properties from these areas are removed from the sales data. The
remaining sales are used to determine Green Acres values for tillable and non-tillable land in each county.
Appendix D ▪ Green Acres and Rural Preserve Values
20 Minnesota Department of Revenue – Property Tax Division
Identifying Areas with Non-Agricultural Influences The department has identified three variables that may indicate non-agricultural influences in a particular
area, city, or town:
• Change in number of households
• Newly created non-agricultural parcels
• Annexations to cities and towns
These variables indicate the change in the previous three years for each city or town in Minnesota.9 Each
variable is assigned a threshold that may indicate development pressure:
• More than five households in a city or town
• More than five new non-agricultural parcels in a city or town
• Any annexations (for all cities and towns in and surrounding the annexation)
Agricultural sales in areas that meet any two of the thresholds are flagged as sales with potential non-
agricultural influence. These sales are referred to the department’s regional Property Tax Compliance
Officers (PTCOs) for further review.
Whenever a PTCO confirms that non-agricultural influence may have affected the price of a sale, it is
removed from the sales data used to determine the Green Acres value. Sales are also removed if they
include land on a lake or river, include non-agricultural land, or represent outliers in the data.
Determining Agricultural Values After sales with potential non-agricultural influences are removed from the sales data, the remaining sales
are used to determine each county’s agricultural value, used for Green Acres purposes.
These values are calculated using a basic regression and the county’s sales data from the previous 12
months – sale prices, tillable acres, and non-tillable acres. This regression estimates a value per acre for
tillable land (β1) and non-tillable land (β2).
𝑆𝑎𝑙𝑒 𝑃𝑟𝑖𝑐𝑒 = 𝛽1 ∗ 𝑇𝑖𝑙𝑙𝑎𝑏𝑙𝑒 𝐴𝑐𝑟𝑒𝑠 + 𝛽2 ∗ 𝑁𝑜𝑛 − 𝑇𝑖𝑙𝑙𝑎𝑏𝑙𝑒 𝐴𝑐𝑟𝑒𝑠 Equation 2
The size and representativeness of sales data can vary by county and year to year. As a result, the Green
Acres values calculated with a county’s data for the previous 12 months may not always be reliable.
To get more data, the regression is run using two additional data sets: the previous 21 months of sales in
each county, and the previous 12 months of sales in each agricultural region. If a county’s 12-month value
is questionable, the additional results are considered, prioritizing the 21-month results for the county over
the 21-month results for the agricultural regions.
9 Data for the three variables comes from the Minnesota State Demographic Center, Metropolitan Council, Market Value by
Parcel File, and Minnesota Geospatial Information Office.

Appendix D ▪ Green Acres and Rural Preserve Value
2019 Property Values and Assessment Practices Report 21
If all three regressions fail to yield a consistent Green Acres value, the Property Tax Division’s staff sets
Green Acres values based on surrounding counties, counties with similar agricultural markets, and
previous years’ Green Acres values.
Rural Preserve The Rural Preserve Property Tax Program complements Green Acres and provides similar property tax
benefits for class 2b rural vacant land that is part of a contiguous farm enrolled in Green Acres (see
Minnesota Statutes, section 273.114).
As with Green Acres, a portion of taxable value is deferred for qualifying land while it is enrolled in the
program. The assessor determines two values for the land: a “highest and best use value” based on market
conditions, and a value that is uninfluenced by non-agricultural factors such as residential or commercial
development. The assessor must use whichever value is lower for property tax purposes.
This provides a lower taxable value for qualifying properties and redistributes the tax burden to other
properties in the same jurisdiction. When a property is sold, transferred, or no longer qualifies for the
program, the owner has to pay the difference in tax for the last three years of enrollment.
Taxable Rural Preserve Value Rural Preserve values may be different than Green Acres values. Each year, the department issues a memo
to notify counties of their Green Acres values for tillable and non-tillable agricultural lands. The
department urges counties to use the following guidelines to calculate Rural Preserve values:
▪ For otherwise tillable lands, use the Green Acres tillable land value.
▪ For non-tillable lands that are otherwise pastureable, use their non-tillable Green Acres value.
▪ For unusable waste, wild land, swamp land, etc., use 50% of the non-tillable Green Acres value.
Examples 1. If the county has estimated the value of woods at $2500 per acre because of recreational or other
non-agricultural value influences, and the value for Rural Preserve is $2200, the deferral is based
on the $300 per acre difference.
2. If a county has estimated the value of a swamp at $1800 per acre because of recreational or other
non-agricultural market value influences, and the value for Rural Preserve is $2200, then the
recommended Rural Preserve value for the unusable swamp land is $1100 per acre (50% of
$2200), and the deferral is based on the $700 difference in value.
3. If a county has valued a swamp at $900 per acre due to lack of non-agricultural market influences,
and the recommended value for Rural Preserve is $2200 and 50% of that value is $1100, there is no
deferral. (The property may still be enrolled in the program, but the tax deferral only applies if the
EMV set by the county exceeds the Rural Preserve value.)
Unusable wasteland often carries a very low estimated market value, which may not be high enough to
receive a tax deferral under Rural Preserve (as shown in Example 3 above). However, there may be some
areas of the state where recreational uses are affecting the market value of these unusable wastelands that
are part of a farm.

Appendix D ▪ Green Acres and Rural Preserve Values
22 Minnesota Department of Revenue – Property Tax Division
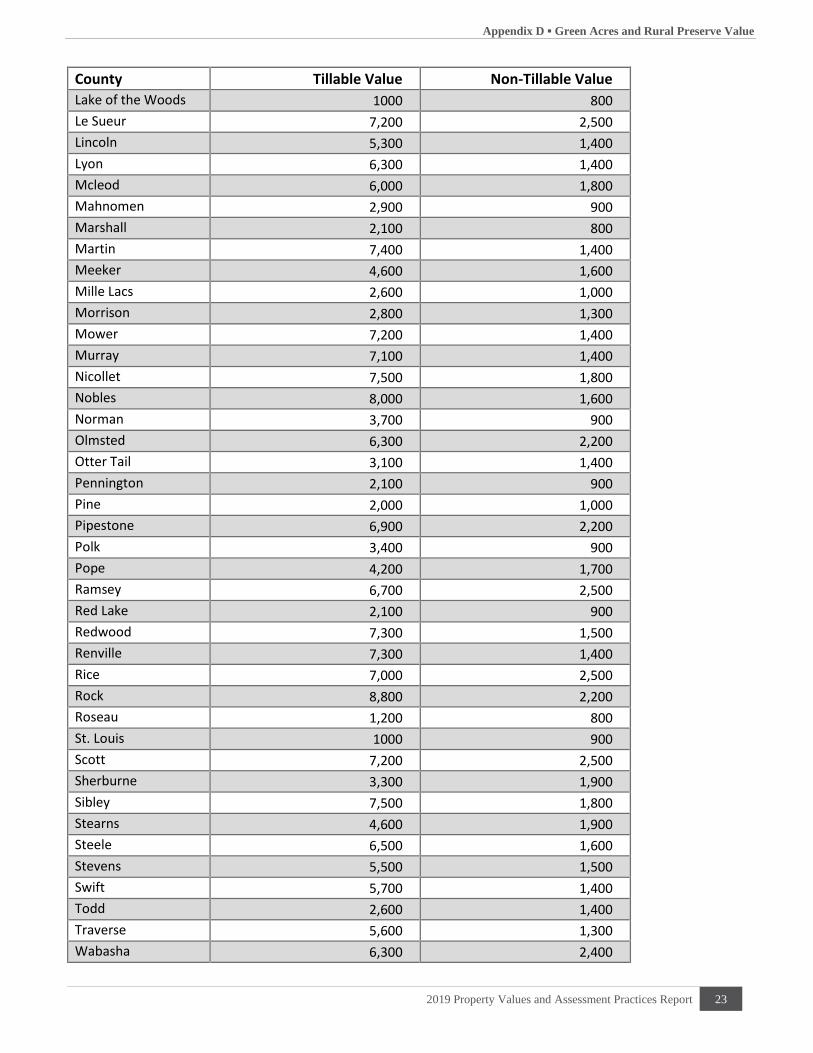
County Average Value Per Acre – Assessment Year 2019
County Tillable Value Non-Tillable Value
Aitkin 1,500 900
Anoka 3,200 1,900
Becker 3,100 1,200
Beltrami 1,300 1,000
Benton 3,300 1,400
Big Stone 5,300 1,400
Blue Earth 7,300 1,700
Brown 7,500 1,600
Carlton 1,500 900
Carver 6,900 2,400
Cass 1,500 1,300
Chippewa 6,800 1,400
Chisago 3,200 1,900
Clay 3,700 1,100
Clearwater 1,300 1,000
Cook 800 800
Cottonwood 7,900 1,400
Crow Wing 2,100 1,400
Dakota 6,700 2,500
Dodge 7,500 2,100
Douglas 4,100 1,700
Faribault 7,400 1,400
Fillmore 6,100 2,400
Freeborn 6,600 1,400
Goodhue 6,900 2,300
Grant 5,500 1,700
Hennepin 6,700 2,500
Houston 5,600 2,500
Hubbard 2,800 1,400
Isanti 3,100 1,900
Itasca 1,200 900
Jackson 7,400 1,400
Kanabec 2,400 1,100
Kandiyohi 6,300 1,400
Kittson 2,000 800
Koochiching 800 800
Lac Qui Parle 5,000 1,400
Lake 900 900
Appendix D ▪ Green Acres and Rural Preserve Value
2019 Property Values and Assessment Practices Report 23
County Tillable Value Non-Tillable Value
Lake of the Woods 1000 800
Le Sueur 7,200 2,500
Lincoln 5,300 1,400
Lyon 6,300 1,400
Mcleod 6,000 1,800
Mahnomen 2,900 900
Marshall 2,100 800
Martin 7,400 1,400
Meeker 4,600 1,600
Mille Lacs 2,600 1,000
Morrison 2,800 1,300
Mower 7,200 1,400
Murray 7,100 1,400
Nicollet 7,500 1,800
Nobles 8,000 1,600
Norman 3,700 900
Olmsted 6,300 2,200
Otter Tail 3,100 1,400
Pennington 2,100 900
Pine 2,000 1,000
Pipestone 6,900 2,200
Polk 3,400 900
Pope 4,200 1,700
Ramsey 6,700 2,500
Red Lake 2,100 900
Redwood 7,300 1,500
Renville 7,300 1,400
Rice 7,000 2,500
Rock 8,800 2,200
Roseau 1,200 800
St. Louis 1000 900
Scott 7,200 2,500
Sherburne 3,300 1,900
Sibley 7,500 1,800
Stearns 4,600 1,900
Steele 6,500 1,600
Stevens 5,500 1,500
Swift 5,700 1,400
Todd 2,600 1,400
Traverse 5,600 1,300
Wabasha 6,300 2,400

Appendix D ▪ Green Acres and Rural Preserve Values
24 Minnesota Department of Revenue – Property Tax Division
County Tillable Value Non-Tillable Value
Wadena 2,000 1,100
Waseca 7,400 1,600
Washington 6,700 2,500
Watonwan 7,400 1,400
Wilkin 4,100 1,100
Winona 6,300 2,400
Wright 6,100 2,300
Yellow Medicine 6,200 1,400
Appendix E ▪ Maps: Statewide Indicators
2019 Property Values and Assessment Practices Report 25
Appendix E – Maps: Statewide Market Values and Assessment Practices Indicators The following pages contain statewide charts and maps with information about Minnesota property
values, sales ratio measures, and the Green Acres and Rural Preserve programs.
MAP 1 displays the percent change in estimated market value for each county from assessment years 2018
to 2019.
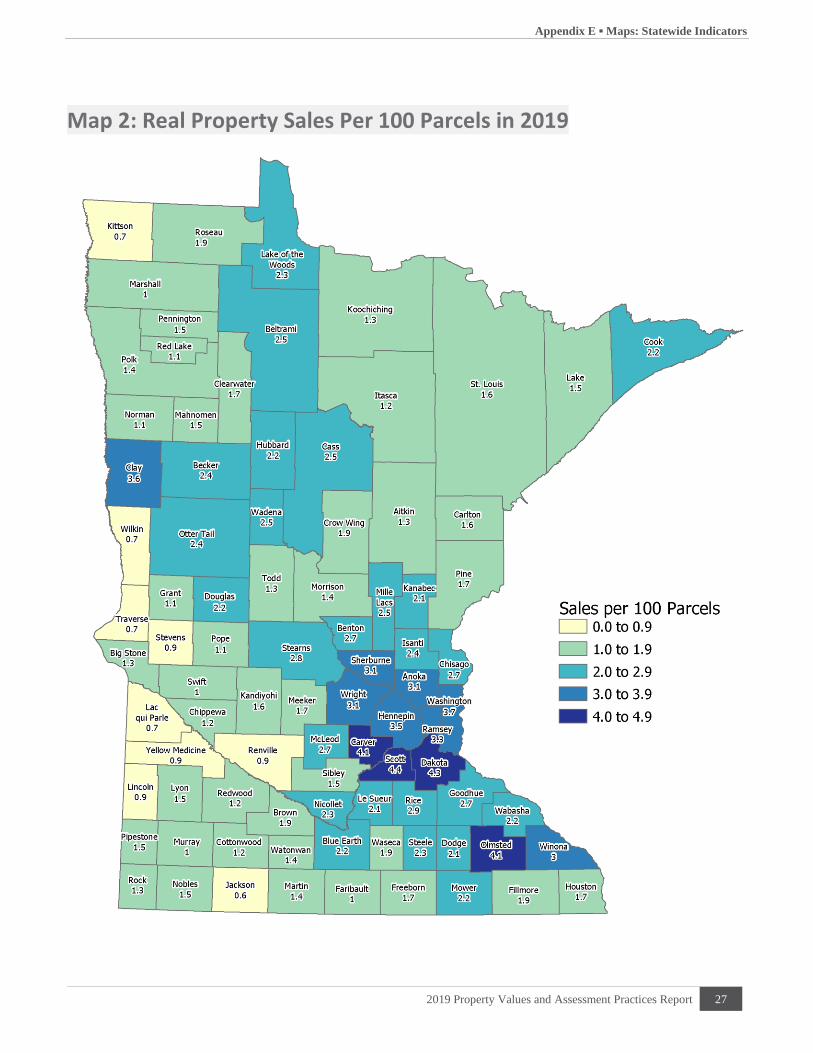
MAP 2 displays the real property sales per 100 parcels for each county for assessment year 2019.
MAP 3 shows taxable tillable Green Acres/Rural Preserve values. Higher taxable values are shown in the
southern portion of the state while lower taxable values are shown in the northeastern part of the state.
MAP 4 shows taxable non-tillable Green Acres/Rural Preserve values. Values to be used for non-tillable
properties enrolled in Green Acres or Rural Preserve do not vary as widely as the values for tillable
properties. The non-tillable values are closer to the tillable values in the northern half of the state.

Appendix E ▪ Maps: Statewide Indicators
26 Minnesota Department of Revenue – Property Tax Division
Map 1: Percent Change in Total Estimated Market Value 2018-2019
Appendix E ▪ Maps: Statewide Indicators
2019 Property Values and Assessment Practices Report 27
Map 2: Real Property Sales Per 100 Parcels in 2019

Appendix E ▪ Maps: Statewide Indicators
28 Minnesota Department of Revenue – Property Tax Division
Map 3: Taxable Tillable Green Acres/Rural Preserve Value (2019 Assessment)

Appendix E ▪ Maps: Statewide Indicators
2019 Property Values and Assessment Practices Report 29
Map 4: Taxable Non-Tillable Green Acres/Rural Preserve Value (2019 Assessment)
Appendix F ▪ Glossary
30 Minnesota Department of Revenue – Property Tax Division
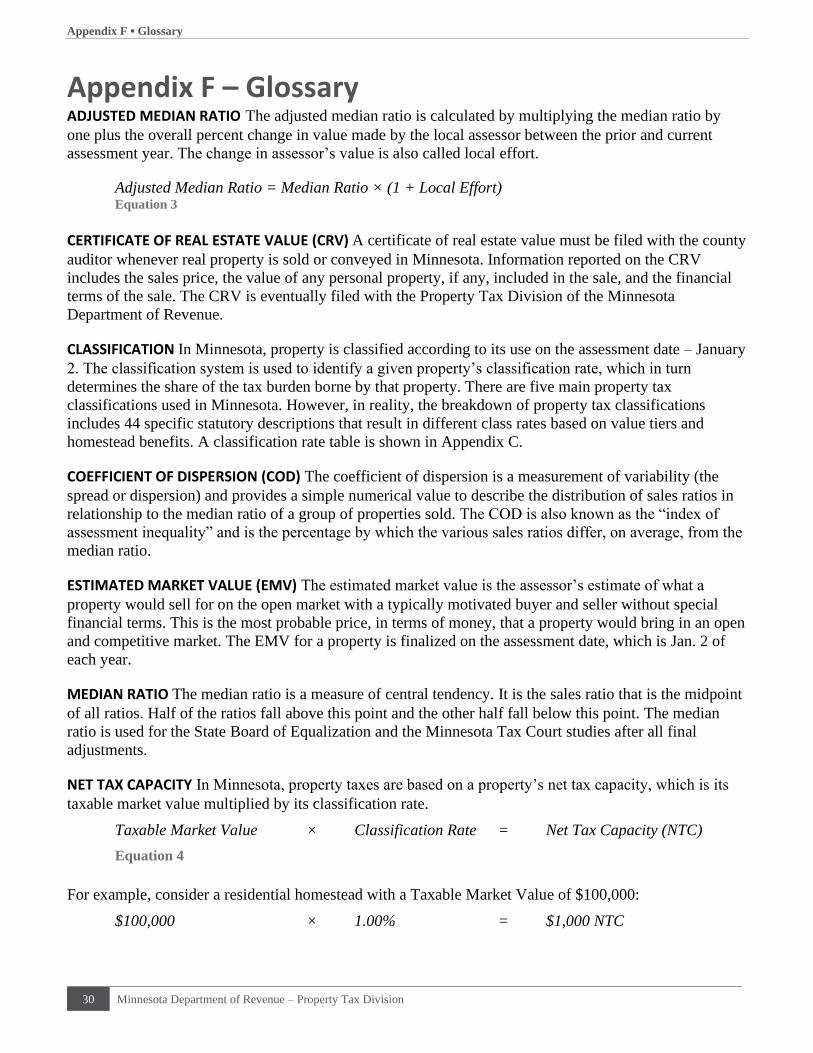
Appendix F – Glossary
ADJUSTED MEDIAN RATIO The adjusted median ratio is calculated by multiplying the median ratio by
one plus the overall percent change in value made by the local assessor between the prior and current
assessment year. The change in assessor’s value is also called local effort.
Adjusted Median Ratio = Median Ratio × (1 + Local Effort) Equation 3
CERTIFICATE OF REAL ESTATE VALUE (CRV) A certificate of real estate value must be filed with the county
auditor whenever real property is sold or conveyed in Minnesota. Information reported on the CRV
includes the sales price, the value of any personal property, if any, included in the sale, and the financial
terms of the sale. The CRV is eventually filed with the Property Tax Division of the Minnesota
Department of Revenue.
CLASSIFICATION In Minnesota, property is classified according to its use on the assessment date – January
2. The classification system is used to identify a given property’s classification rate, which in turn
determines the share of the tax burden borne by that property. There are five main property tax
classifications used in Minnesota. However, in reality, the breakdown of property tax classifications
includes 44 specific statutory descriptions that result in different class rates based on value tiers and
homestead benefits. A classification rate table is shown in Appendix C.
COEFFICIENT OF DISPERSION (COD) The coefficient of dispersion is a measurement of variability (the
spread or dispersion) and provides a simple numerical value to describe the distribution of sales ratios in
relationship to the median ratio of a group of properties sold. The COD is also known as the “index of
assessment inequality” and is the percentage by which the various sales ratios differ, on average, from the
median ratio.
ESTIMATED MARKET VALUE (EMV) The estimated market value is the assessor’s estimate of what a
property would sell for on the open market with a typically motivated buyer and seller without special
financial terms. This is the most probable price, in terms of money, that a property would bring in an open
and competitive market. The EMV for a property is finalized on the assessment date, which is Jan. 2 of
each year.
MEDIAN RATIO The median ratio is a measure of central tendency. It is the sales ratio that is the midpoint
of all ratios. Half of the ratios fall above this point and the other half fall below this point. The median
ratio is used for the State Board of Equalization and the Minnesota Tax Court studies after all final
adjustments.
NET TAX CAPACITY In Minnesota, property taxes are based on a property’s net tax capacity, which is its
taxable market value multiplied by its classification rate.
Taxable Market Value × Classification Rate = Net Tax Capacity (NTC)
Equation 4
For example, consider a residential homestead with a Taxable Market Value of $100,000:
$100,000 × 1.00% = $1,000 NTC
Appendix F ▪ Glossary
2019 Property Values and Assessment Practices Report 31
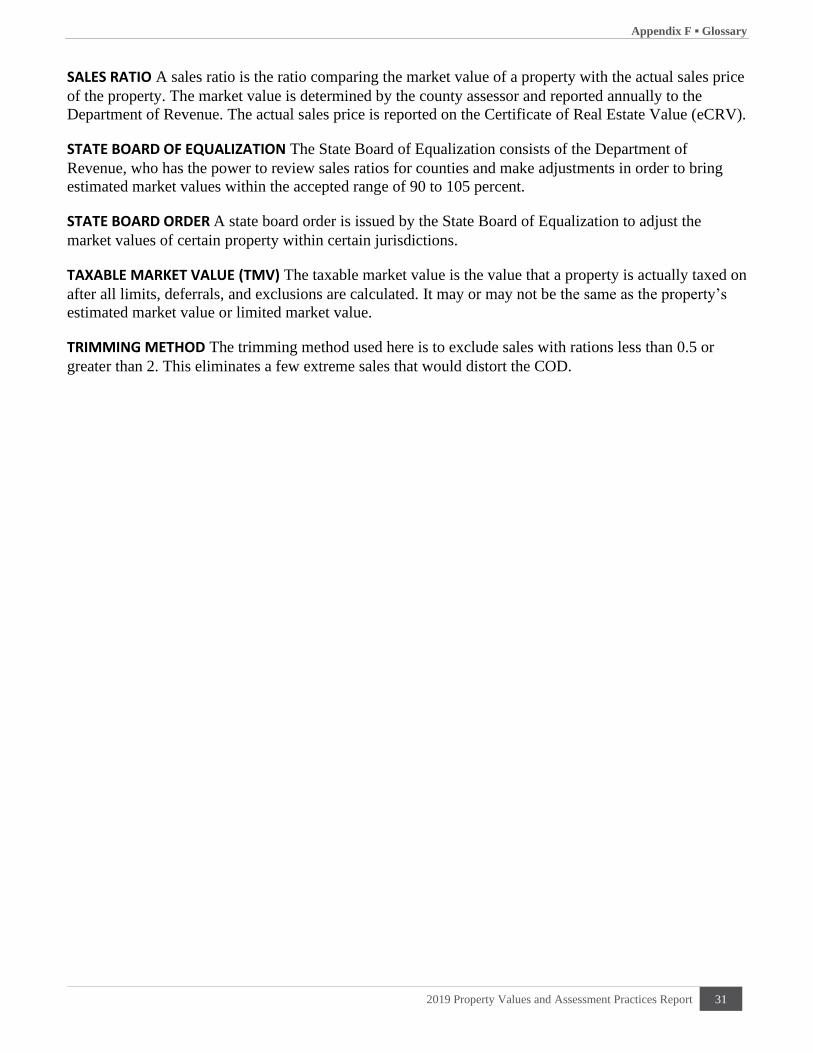
SALES RATIO A sales ratio is the ratio comparing the market value of a property with the actual sales price
of the property. The market value is determined by the county assessor and reported annually to the
Department of Revenue. The actual sales price is reported on the Certificate of Real Estate Value (eCRV).
STATE BOARD OF EQUALIZATION The State Board of Equalization consists of the Department of
Revenue, who has the power to review sales ratios for counties and make adjustments in order to bring
estimated market values within the accepted range of 90 to 105 percent.
STATE BOARD ORDER A state board order is issued by the State Board of Equalization to adjust the
market values of certain property within certain jurisdictions.
TAXABLE MARKET VALUE (TMV) The taxable market value is the value that a property is actually taxed on
after all limits, deferrals, and exclusions are calculated. It may or may not be the same as the property’s
estimated market value or limited market value.
TRIMMING METHOD The trimming method used here is to exclude sales with rations less than 0.5 or
greater than 2. This eliminates a few extreme sales that would distort the COD.