property values
TRANSCRIPT
8/14/2019 Property Values
http://slidepdf.com/reader/full/property-values 1/37
New Mexico
2006 Property Tax Facts
Taxation & Revenue Department
Tax Research Office
P.O. Box 630, Santa Fe, New Mexico 87509-0630
Please report errors and provide suggestions to Al Maury: [email protected], (505) 827-0691
December, 2006

8/14/2019 Property Values
http://slidepdf.com/reader/full/property-values 2/37
Table: Page:
1 New Mexico Property Tax Values and Obligations by County, Tax Year 2006 6
2 New Mexico Property Tax Values and Obligations by County, Tax Year 2005 7
3 Percent Change in Values and Obligations Between Tax Years 2005 and 2006 8
4 Estimated Distribution of New Mexico Property Tax Obligations by County, Tax Year 2006 13
5 Percent Distribution of New Mexico Property Tax Obligations by County, 2006 146 Property Tax Values and Obligations as a Percent of State Total by County, 2006 15
7 Distribution of Tax Base and Obligations Within Counties, Tax Year 2006 16
8 Per Capita Net Taxable Value, Obligations and Income by County, 2006 17
9 Property Tax Rates by Location -- 2006 Property Tax Year 18
10 Weighted Average Property Tax Rates by County, 2006 Tax Year 22
11 Actual, Imposed and Remaining Operating Rates by County 24
12 Actual, Imposed and Remaining Rate Authority by Municipality 25
13 Residential Rate History -- Selected Municipalities 27
14 Veterans and Head of Household Exemptions by County 28
15 Age 65 and Over Low Income Property Tax Rebates by Modified Gross Income 29
16 Number of Returns Claiming Aged 65 and Over Low Income Property Tax Rebates 30
17 Trends in Oil, Natural Gas and Copper Production Values 31
18 Taxes on a Residential Property Assessed at $150,000 by Location-- 2006 Tax Year 33
19 State Assessed Values and Obligations by County -- 2006 Tax Year 35
20 Parcel Counts by County, 2005 Tax Year 36
21 Property Tax Rates Subject to Yield Control Statute (Section 7-37-7.1 NMSA 1978) 37
Figure:
1 Essential Relationships -- Aggregate Taxable Value, Obligations and Similar Figures 3
2 2005 Tax Year Estimated Revenue Distribution 4
2A Property Tax Obligations by Recipient Government, 2005 and 2006 53 Statewide Property Tax Obligations -- 1988 and 2005 Tax Years 9
4 State Debt Service Rates and Obligations -- 1990 through 2005 10
5 Total Net Taxable Value -- 1990 Through 2005 11
6 Trends in Relative Shares of Residential and Nonresidential Net Taxable Value 11
7 Recent Trends in Property Tax Obligations 12
8 Rate Location Map 20
9 Distribution of Property Tax Rates -- 2005 Tax Year 21
10 Means and Medians: Statewide Average Rate Summary 23
11 Recent Residential Rate History -- Selected Municipalities 27
12 New Mexico's Oil, Natural Gas, Carbon Dioxide and Copper Producing Counties 32
2006 New Mexico Property Tax Facts
-2-
8/14/2019 Property Values
http://slidepdf.com/reader/full/property-values 3/37
New Mexico Taxation & Revenue Department2006 Property Tax Facts
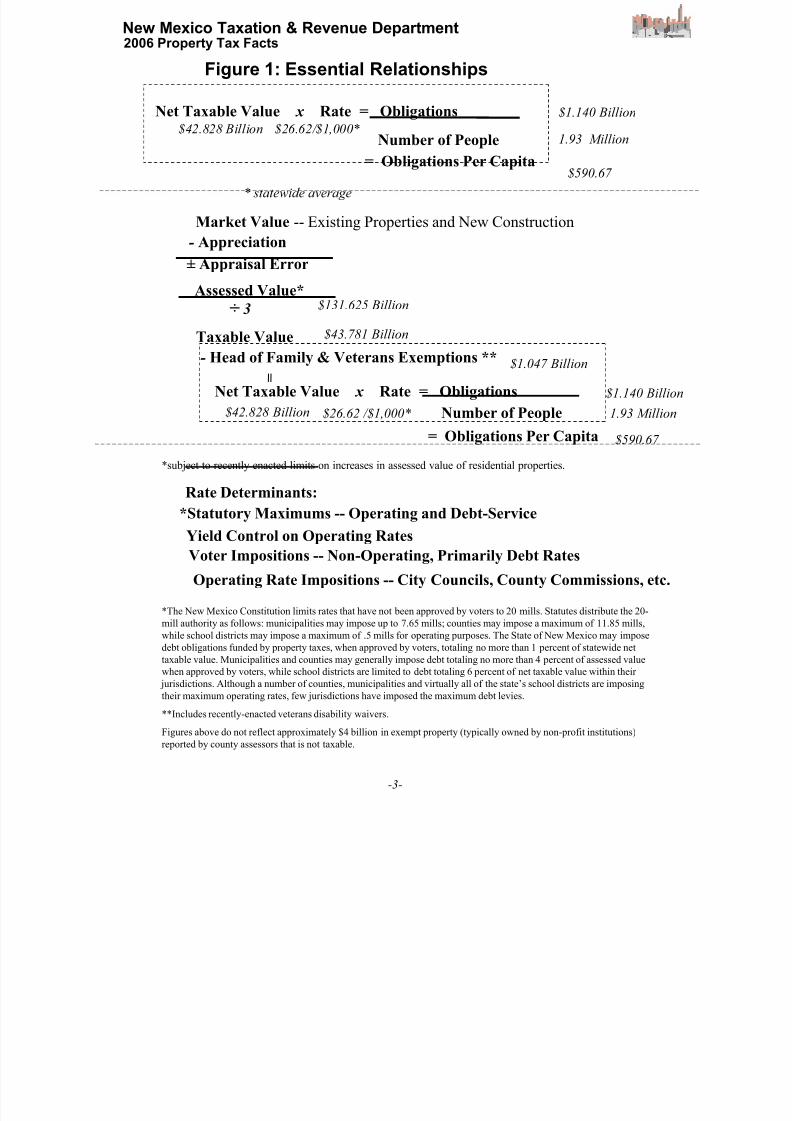
Market Value -- Existing Properties and New Construction
Number of People
= Obligations Per Capita
Net Taxable Value x Rate = Obligations
Number of People
= Obligations Per Capita
=
Net Taxable Value x Rate = Obligations
÷ 3
- Appreciation
± Appraisal Error
Assessed Value*
- Head of Family & Veterans Exemptions **
Taxable Value
Rate Determinants:
Voter Impositions -- Non-Operating, Primarily Debt Rates
*Statutory Maximums -- Operating and Debt-Service
Operating Rate Impositions -- City Councils, County Commissions, et
Yield Control on Operating Rates
Figure 1: Essential Relationships
$42.828 Billion $26.62/$1,000*
$1.140 Billion
1.93 Million
$590.67
$42.828 Billion
$131.625 Billion
* statewide average
*The New Mexico Constitution limits rates that have not been approved by voters to 20 mills. Statutes distribute the 20-
mill authority as follows: municipalities may impose up to 7.65 mills; counties may impose a maximum of 11.85 mills,
while school districts may impose a maximum of .5 mills for operating purposes. The State of New Mexico may impose
debt obligations funded by property taxes, when approved by voters, totaling no more than 1 percent of statewide net
taxable value. Municipalities and counties may generally impose debt totaling no more than 4 percent of assessed value
when approved by voters, while school districts are limited to debt totaling 6 percent of net taxable value within their
jurisdictions. Although a number of counties, municipalities and virtually all of the state’s school districts are imposing
their maximum operating rates, few jurisdictions have imposed the maximum debt levies.
**Includes recently-enacted veterans disability waivers.
Figures above do not reflect approximately $4 billion in exempt property (typically owned by non-profit institutions)
reported by county assessors that is not taxable.
*subject to recently enacted limits on increases in assessed value of residential properties.
-3-
$26.62 /$1,000*
$1.047 Billion
$43.781 Billion
$1.140 Bil
1.93 Milli
$590.67
8/14/2019 Property Values
http://slidepdf.com/reader/full/property-values 4/37
New Mexico Taxation & Revenue Department2006 Property Tax Facts
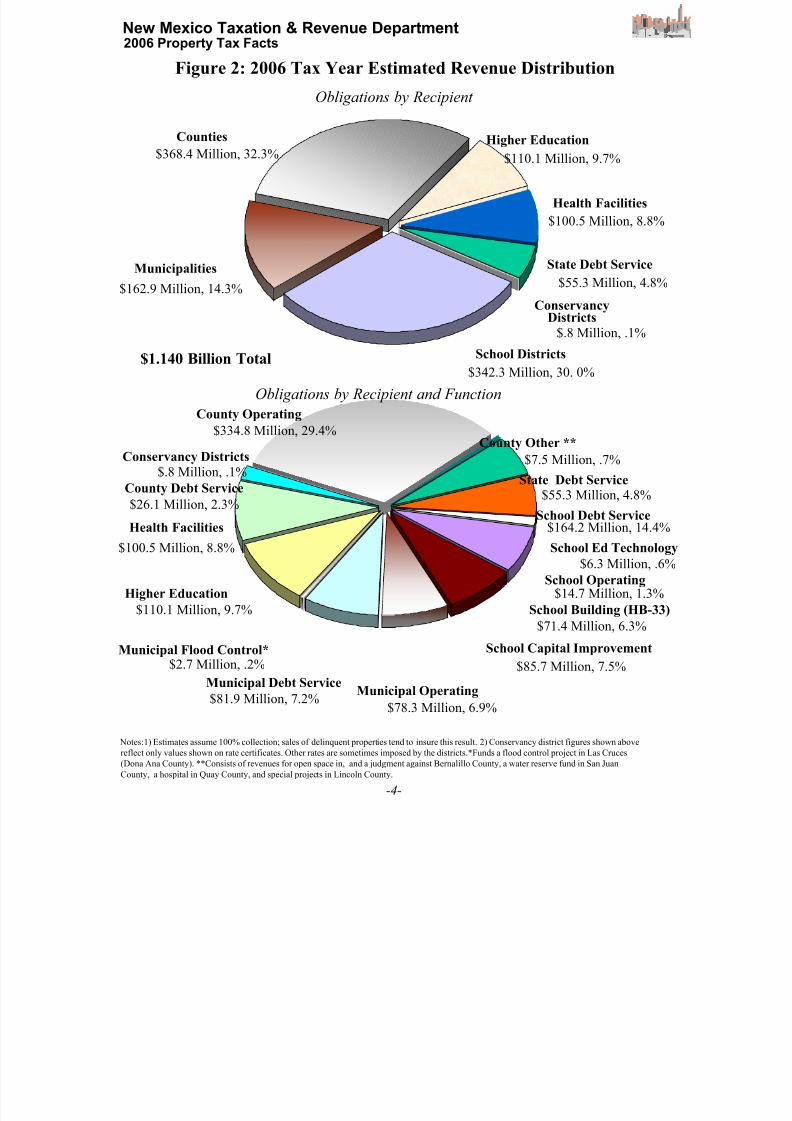
Figure 2: 2006 Tax Year Estimated Revenue Distribution
State Debt Service
School Districts
Counties
Municipalities
$1.140 Billion Total
ConservancyDistricts
$368.4 Million, 32.3%
$162.9 Million, 14.3% $55.3 Million, 4.8%
$.8 Million, .1%
$342.3 Million, 30. 0%
Obligations by Recipient
Obligations by Recipient and Function
State Debt Service
County Operating
$334.8 Million, 29.4%
County Debt Service
$26.1 Million, 2.3%
Municipal Debt ServiceMunicipal Operating
School Operating
School Debt Service
School Building (HB-33
$100.5 Million, 8.8%
$71.4 Million, 6.3%
$14.7 Million, 1.3%
School Capital Improvement
County Other **
School Ed Technolo
$164.2 Million, 14.4%
4
$55.3 Million, 4.8%
Higher Education
Health Facilities
$100.5 Million, 8.8%
$110.1 Million, 9.7%
$85.7 Million, 7.5%
$78.3 Million, 6.9%
$6.3 Million, .6
Higher Education
Health Facilities
$110.1 Million, 9.7%
$81.9 Million, 7.2%
$7.5 Million, .7%Conservancy Districts$.8 Million, .1%
Municipal Flood Control*$2.7 Million, .2%
Notes:1) Estimates assume 100% collection; sales of delinquent properties tend to insure this result. 2) Conservancy district figures shown above
reflect only values shown on rate certificates. Other rates are sometimes imposed by the districts.*Funds a flood control project in Las Cruces
(Dona Ana County). **Consists of revenues for open space in, and a judgment against Bernalillo County, a water reserve fund in San Juan
County, a hospital in Quay County, and special projects in Lincoln County.
8/14/2019 Property Values
http://slidepdf.com/reader/full/property-values 5/37
New Mexico Taxation and Revenue Department -- 2006 Property Tax Facts
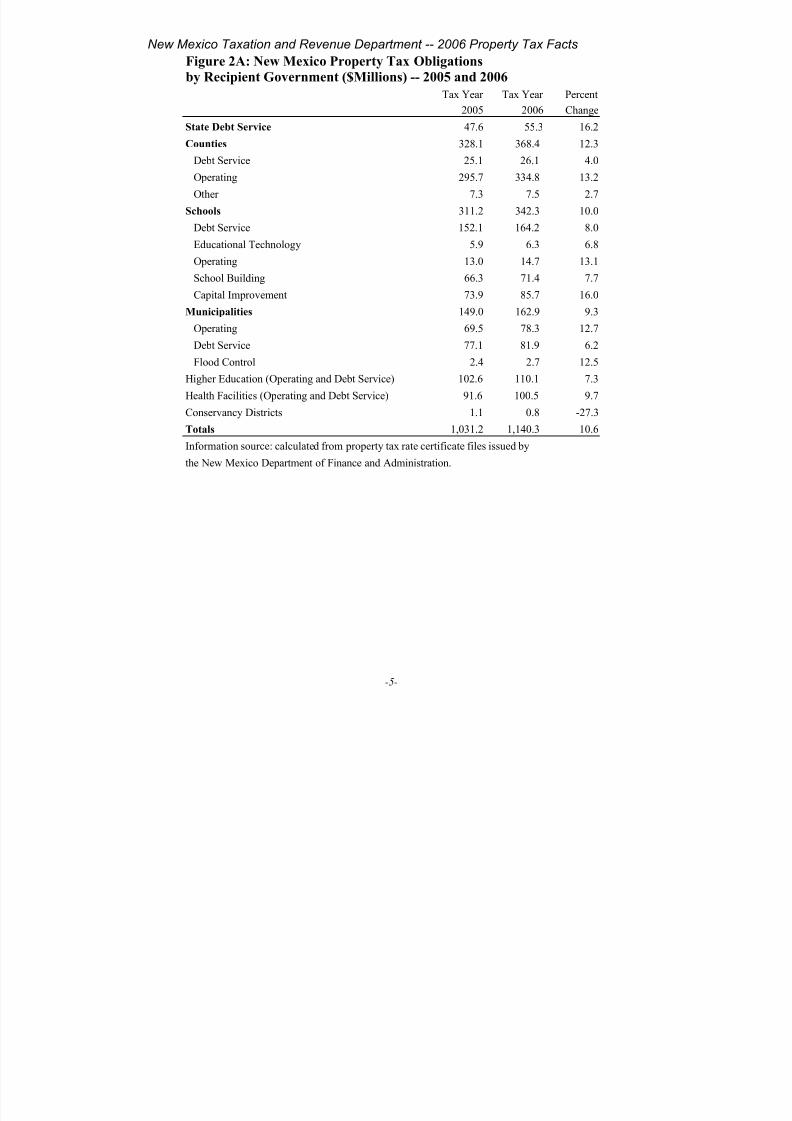
Figure 2A: New Mexico Property Tax Obligations
by Recipient Government ($Millions) -- 2005 and 2006
Tax Year Tax Year Percent
2005 2006 Change
State Debt Service 47.6 55.3 16.2
Counties 328.1 368.4 12.3
Debt Service 25.1 26.1 4.0
Operating 295.7 334.8 13.2
Other 7.3 7.5 2.7
Schools 311.2 342.3 10.0
Debt Service 152.1 164.2 8.0
Educational Technology 5.9 6.3 6.8
Operating 13.0 14.7 13.1
School Building 66.3 71.4 7.7
Capital Improvement 73.9 85.7 16.0
Municipalities 149.0 162.9 9.3
Operating 69.5 78.3 12.7
Debt Service 77.1 81.9 6.2
Flood Control 2.4 2.7 12.5
Higher Education (Operating and Debt Service) 102.6 110.1 7.3
Health Facilities (Operating and Debt Service) 91.6 100.5 9.7
Conservancy Districts 1.1 0.8 -27.3
Totals 1,031.2 1,140.3 10.6
Information source: calculated from property tax rate certificate files issued by
the New Mexico Department of Finance and Administration.
-5-
8/14/2019 Property Values
http://slidepdf.com/reader/full/property-values 6/37
New Mexico Taxation and Revenue Department -- 2006 Property Tax Facts
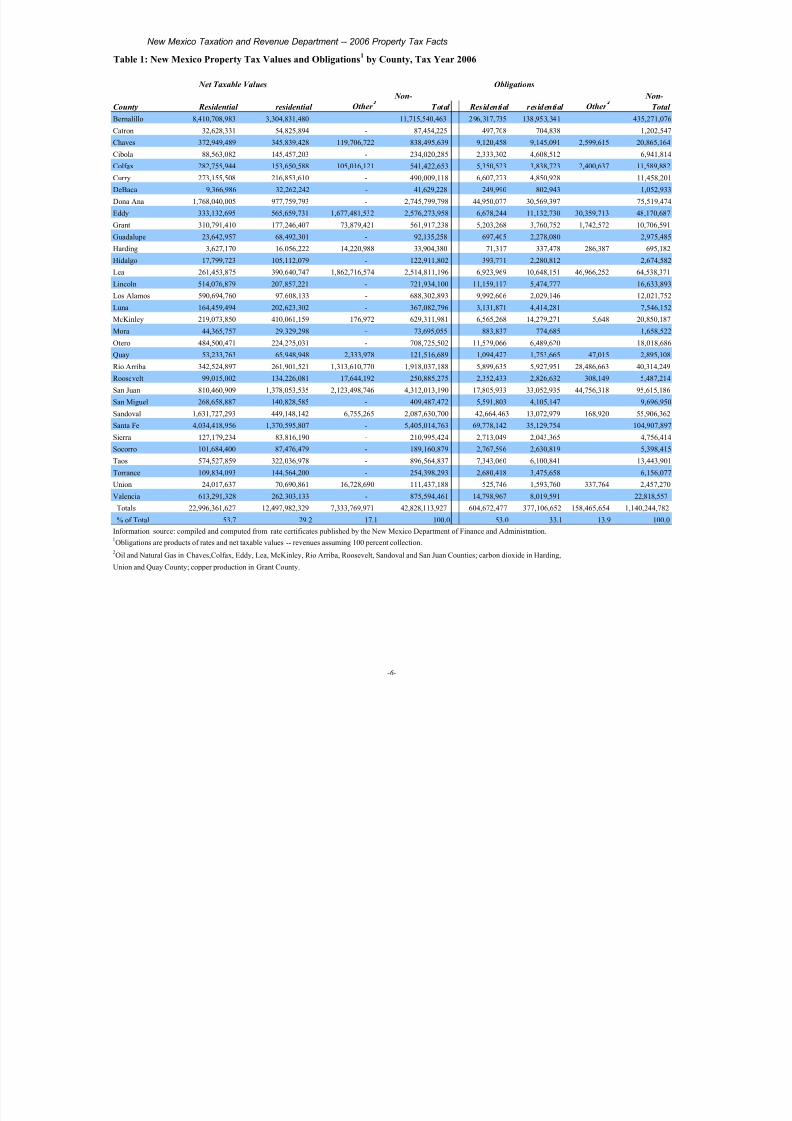
Table 1: New Mexico Property Tax Values and Obligations1
by County, Tax Year 2006
Net Taxable Values Obligations
Non- Non-
County Residential residential Other Total Residential residential Other Tot
Bernalillo 8,410,708,983 3,304,831,480 11,715,540,463 296,317,735 138,953,341 435,271,0
Catron 32,628,331 54,825,894 - 87,454,225 497,708 704,838 1,202,5
Chaves 372,949,489 345,839,428 119,706,722 838,495,639 9,120,458 9,145,091 2,599,615 20,865,1
Cibola 88,563,082 145,457,203 - 234,020,285 2,333,302 4,608,512 6,941,8
Colfax 282,755,944 153,650,588 105,016,121 541,422,653 5,350,523 3,838,723 2,400,637 11,589,8
Curry 273,155,508 216,853,610 - 490,009,118 6,607,273 4,850,928 11,458,2
DeBaca 9,366,986 32,262,242 - 41,629,228 249,990 802,943 1,052,9
Dona Ana 1,768,040,005 977,759,793 - 2,745,799,798 44,950,077 30,569,397 75,519,4
Eddy 333,132,695 565,659,731 1,677,481,532 2,576,273,958 6,678,244 11,132,730 30,359,713 48,170,6
Grant 310,791,410 177,246,407 73,879,421 561,917,238 5,203,268 3,760,752 1,742,572 10,706,5
Guadalupe 23,642,957 68,492,301 - 92,135,258 697,405 2,278,080 2,975,4
Harding 3,627,170 16,056,222 14,220,988 33,904,380 71,317 337,478 286,387 695,1
Hidalgo 17,799,723 105,112,079 - 122,911,802 393,771 2,280,812 2,674,5
Lea 261,453,875 390,640,747 1,862,716,574 2,514,811,196 6,923,969 10,648,151 46,966,252 64,538,3
Lincoln 514,076,879 207,857,221 - 721,934,100 11,159,117 5,474,777 16,633,8
Los Alamos 590,694,760 97,608,133 - 688,302,893 9,992,606 2,029,146 12,021,7
Luna 164,459,494 202,623,302 - 367,082,796 3,131,871 4,414,281 7,546,1
McKinley 219,073,850 410,061,159 176,972 629,311,981 6,565,268 14,279,271 5,648 20,850,1
Mora 44,365,757 29,329,298 - 73,695,055 883,837 774,685 1,658,5
Otero 484,500,471 224,225,031 - 708,725,502 11,529,066 6,489,620 18,018,6
Quay 53,233,763 65,948,948 2,333,978 121,516,689 1,094,427 1,753,665 47,015 2,895,1
Rio Arriba 342,524,897 261,901,521 1,313,610,770 1,918,037,188 5,899,635 5,927,951 28,486,663 40,314,2
Roosevelt 99,015,002 134,226,081 17,644,192 250,885,275 2,352,433 2,826,632 308,149 5,487,2
San Juan 810,460,909 1,378,053,535 2,123,498,746 4,312,013,190 17,805,933 33,052,935 44,756,318 95,615,1
San Miguel 268,658,887 140,828,585 - 409,487,472 5,591,803 4,105,147 9,696,9
Sandoval 1,631,727,293 449,148,142 6,755,265 2,087,630,700 42,664,463 13,072,979 168,920 55,906,3
Santa Fe 4,034,418,956 1,370,595,807 - 5,405,014,763 69,778,142 35,129,754 104,907,8
Sierra 127,179,234 83,816,190 - 210,995,424 2,713,049 2,043,365 4,756,4
Socorro 101,684,400 87,476,479 - 189,160,879 2,767,596 2,630,819 5,398,4
Taos 574,527,859 322,036,978 - 896,564,837 7,343,060 6,100,841 13,443,9
Torrance 109,834,093 144,564,200 - 254,398,293 2,680,418 3,475,658 6,156,0
Union 24,017,637 70,690,861 16,728,690 111,437,188 525,746 1,593,760 337,764 2,457,2
Valencia 613,291,328 262,303,133 - 875,594,461 14,798,967 8,019,591 22,818,55
Totals 22,996,361,627 12,497,982,329 7,333,769,971 42,828,113,927 604,672,477 377,106,652 158,465,654 1,140,244,7
% of Total 53.7 29.2 17.1 100.0 53.0 33.1 13.9 10
nformation source: compiled and computed from rate certificates published by the New Mexico Department of Finance and Administration.
Obligations are products of rates and net taxable values -- revenues assuming 100 percent collection.
-6-
Oil and Natural Gas in Chaves,Colfax, Eddy, Lea, McKinley, Rio Arriba, Roosevelt, Sandoval and San Juan Counties; carbon dioxide in Harding,
Union and Quay County; copper production in Grant County.

8/14/2019 Property Values
http://slidepdf.com/reader/full/property-values 7/37
New Mexico Taxation and Revenue Department -- 2006 Property Tax Facts
Table 2: New Mexico Property Tax Values and Obligations1
by County, Tax Year 2005
Net Taxable Values Obligations
Non- Non-
County Residential residential Other Total Residential residential Other Tot
Bernalillo 7,720,730,828 3,282,014,464 - 11,002,745,292 272,266,829 130,556,744 - 402,823,5
Catron 29,794,947 50,021,507 - 79,816,454 460,173 630,710 - 1,090,8
Chaves 359,024,498 328,538,229 102,171,295 789,734,022 8,911,056 8,927,923 2,246,404 20,085,3
Cibola 85,967,537 140,453,990 - 226,421,527 2,206,233 4,433,897 - 6,640,1
Colfax 270,952,564 154,996,423 58,200,161 484,149,148 4,678,111 3,426,697 1,122,396 9,227,2
Curry 252,897,149 194,729,815 - 447,626,964 6,226,237 4,493,820 - 10,720,0
DeBaca 8,992,625 28,362,076 - 37,354,701 247,339 757,955 - 1,005,2
Dona Ana 1,620,891,170 911,618,732 - 2,532,509,902 40,526,373 28,380,962 - 68,907,3
Eddy 312,357,628 472,926,521 1,357,705,999 2,142,990,148 6,089,897 9,270,964 23,955,020 39,315,8
Grant 273,822,776 154,838,210 78,235,839 506,896,825 4,614,532 3,592,284 1,816,425 10,023,2
Guadalupe 23,908,971 68,411,195 - 92,320,166 643,087 2,182,413 - 2,825,5
Harding 3,537,794 15,374,358 9,512,577 28,424,729 72,542 346,636 210,630 629,8
Hidalgo 16,855,534 100,308,898 - 117,164,432 371,530 2,173,674 - 2,545,2
Lea 250,146,621 370,219,712 1,436,383,844 2,056,750,177 6,549,141 10,036,162 36,171,862 52,757,1
Lincoln 481,697,527 204,522,455 - 686,219,982 9,495,998 5,021,098 - 14,517,0
Los Alamos 558,090,257 92,962,793 - 651,053,050 9,369,275 1,873,210 - 11,242,4
Luna 153,656,484 167,596,882 - 321,253,366 2,797,245 3,645,564 - 6,442,8
McKinley 210,524,700 394,272,627 417,193 605,214,520 6,590,229 14,217,634 13,715 20,821,5
Mora 43,074,290 28,155,448 - 71,229,738 899,435 790,800 - 1,690,2
Otero 463,965,506 214,314,318 - 678,279,824 10,822,116 6,163,493 - 16,985,6
Quay 48,185,990 66,620,705 1,500,848 116,307,543 969,948 1,774,651 31,686 2,776,2
Rio Arriba 333,031,953 246,950,899 968,256,422 1,548,239,274 5,777,162 5,491,431 20,781,539 32,050,1
Roosevelt 95,110,645 120,899,687 12,784,778 228,795,110 2,061,937 2,635,615 241,579 4,939,1
San Juan 746,280,486 1,305,462,872 1,601,383,413 3,653,126,771 16,158,887 31,389,663 33,693,274 81,241,8
San Miguel 259,344,932 135,562,285 - 394,907,217 5,615,618 4,166,010 - 9,781,6
Sandoval 1,373,558,950 413,250,170 4,880,104 1,791,689,224 36,225,248 11,936,298 123,838 48,285,3
Santa Fe 3,637,538,338 1,249,803,142 - 4,887,341,480 68,623,809 31,632,363 - 100,256,1
Sierra 123,839,169 77,432,724 - 201,271,893 2,577,515 1,883,347 - 4,460,8Socorro 98,632,395 79,505,638 - 178,138,033 2,712,294 2,447,575 - 5,159,8
Taos 530,638,015 302,889,517 - 833,527,532 6,784,469 5,656,218 - 12,440,6
Torrance 105,077,369 131,228,862 - 236,306,231 2,595,774 3,132,233 - 5,728,0
Union 23,796,649 66,648,513 10,588,394 101,033,556 499,026 1,462,035 213,188 2,174,2
Valencia 569,885,440 250,373,356 - 820,258,796 13,794,828 7,762,299 - 21,557,12
Totals 21,085,809,737 11,821,267,023 5,642,020,866 38,549,097,626 558,233,892 352,292,378 120,621,556 1,031,147,8
% of Totals 54.7 30.7 14.6 100.0 54.1 34.2 11.7 10
nformation source: compiled and computed from rate certificates published by the New Mexico Department of Finance and Administration.
Obligations are products of rates and net taxable values -- revenues assuming 100 percent collection.
Union and Quay County; copper production in Grant County.
Oil and Natural Gas in Chaves,Colfax, Eddy, Lea, McKinley, Rio Arriba, Roosevelt, Sandoval and San Juan Counties; carbon dioxide in Harding,
-7-

8/14/2019 Property Values
http://slidepdf.com/reader/full/property-values 8/37
New Mexico Taxation and Revenue Department -- 2006 Property Tax Facts
Table 3: Percent Change in Values and Obligations1
Between Tax Years 2005 and 2006
Net Taxable Values Obligations
Non- Non-
County: Residential Residential Other Total Residential Residential Other Total
Bernalillo 8.9 0.7 N/A 6.5 8.8 6.4 N/A 8.1
Catron 9.5 9.6 N/A 9.6 8.2 11.8 N/A 10.2
Chaves 3.9 5.3 17.2 6.2 2.3 2.4 15.7 3.9Cibola 3.0 3.6 N/A 3.4 5.8 3.9 N/A 4.5
Colfax 4.4 -0.9 80.4 11.8 14.4 12.0 113.9 25.6
Curry 8.0 11.4 N/A 9.5 6.1 7.9 N/A 6.9
DeBaca 4.2 13.8 N/A 11.4 1.1 5.9 N/A 4.7
Dona Anna 9.1 7.3 N/A 8.4 10.9 7.7 N/A 9.6
Eddy 6.7 19.6 23.6 20.2 9.7 20.1 26.7 22.5
Grant 13.5 14.5 -5.6 10.9 12.8 4.7 -4.1 6.8
Guadalupe -1.1 0.1 N/A -0.2 8.4 4.4 N/A 5.3
Harding 2.5 4.4 49.5 19.3 -1.7 -2.6 36.0 10.4
Hidalgo 5.6 4.8 N/A 4.9 6.0 4.9 N/A 5.1
Lea 4.5 5.5 29.7 22.3 5.7 6.1 29.8 22.3
Lincoln 6.7 1.6 N/A 5.2 17.5 9.0 N/A 14.6Los Alamos 5.8 5.0 N/A 5.7 6.7 8.3 N/A 6.9
Luna 7.0 20.9 N/A 14.3 12.0 21.1 N/A 17.1
McKinley 4.1 4.0 -57.6 4.0 -0.4 0.4 -58.8 0.1
Mora 3.0 4.2 N/A 3.5 -1.7 -2.0 N/A -1.9
Otero 4.4 4.6 N/A 4.5 6.5 5.3 N/A 6.1
Quay 10.5 -1.0 55.5 4.5 12.8 -1.2 48.4 4.3
Rio Arriba 2.9 6.1 35.7 23.9 2.1 7.9 37.1 25.8
Roosevelt 4.1 11.0 38.0 9.7 14.1 7.2 27.6 11.1
San Juan 8.6 5.6 32.6 18.0 10.2 5.3 32.8 17.7
San Miguel 3.6 3.9 N/A 3.7 -0.4 -1.5 N/A -0.9
Sandoval 18.8 8.7 38.4 16.5 -100.0 9.5 36.4 15.8
Santa Fe 10.9 9.7 N/A 10.6 1.7 11.1 N/A 4.6
Sierra 2.7 8.2 N/A 4.8 5.3 8.5 N/A 6.6
Socorro 3.1 10.0 N/A 6.2 2.0 7.5 N/A 4.6
Taos 8.3 6.3 N/A 7.6 8.2 7.9 N/A 8.1
Torrance 4.5 10.2 N/A 7.7 3.3 11.0 N/A 7.5
Union 0.9 6.1 58.0 10.3 5.4 9.0 58.4 13.0
Valencia 7.6 4.8 N/A 6.7 7.3 3.3 N/A 5.9
Totals 9.1 5.7 30.0 11.1 8.3 7.0 31.4 10.6
Information source: compiled and computed from rate certificates published by the New Mexico Department of Finance and Administration.1Obligations are products of rates and net taxable values -- revenues assuming 100 percent collection.
-8-
2Oil and Natural Gas in Chaves,Colfax, Eddy, Lea, McKinley, Rio Arriba, Roosevelt, Sandoval and San Juan Counties; carbon dioxide in Harding,
Union and Quay County; copper production in Grant County.
8/14/2019 Property Values
http://slidepdf.com/reader/full/property-values 9/37
New Mexico Taxation & Revenue Department2006 Property Tax Facts
149
605
157
377
0
100
200
300
400
500
600
700
$Millions
ResidentialProperties
NonresidentialProperties*
1988 19882006 2006
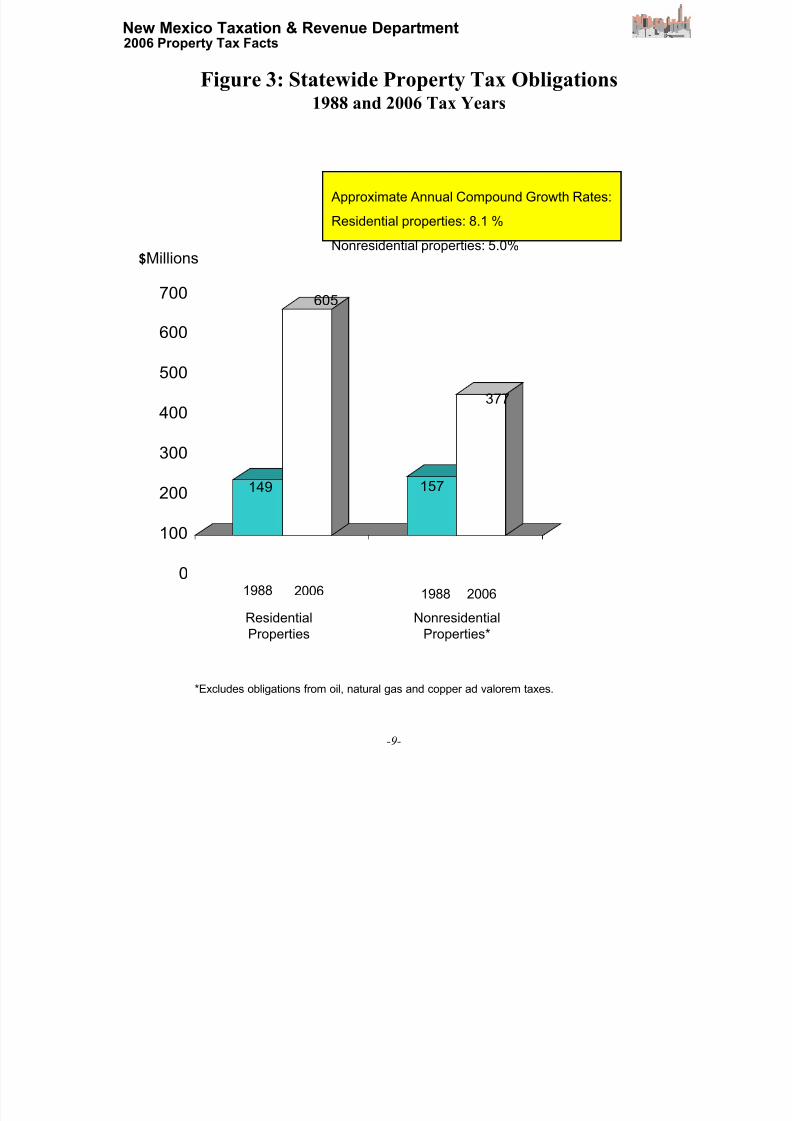
Figure 3: Statewide Property Tax Obligations1988 and 2006 Tax Years
Approximate Annual Compound Growth Rates:
Residential properties: 8.1 %
Nonresidential properties: 5.0%
*Excludes obligations from oil, natural gas and copper ad valorem taxes.
-9-
8/14/2019 Property Values
http://slidepdf.com/reader/full/property-values 10/37
New Mexico Taxation & Revenue Department2006 Property Tax Facts
1.14 0
1.4051.343
1.59 6
1.2 12 1.2 76
1.556
1.3471.438
1.4821.52 9
1.765
1.123
1.52 0
1.028
1.2341.291
0
1
2
19 9 0 199 2 19 94 19 96 199 8 2 00 0 2 0 02 20 0 4 20 0 6
Mills*
17.8
22.7 22.6
28.0
22.0
26.0
35.6
31.4
34.8
38.6 41.9 54.2
35.7
49.0
35.9
4 7.6 55.3
0
10
20
30
40
19 9 0 19 9 2 199 4 19 96 19 98 2 0 00 2 00 2 20 04 2 0 0 6
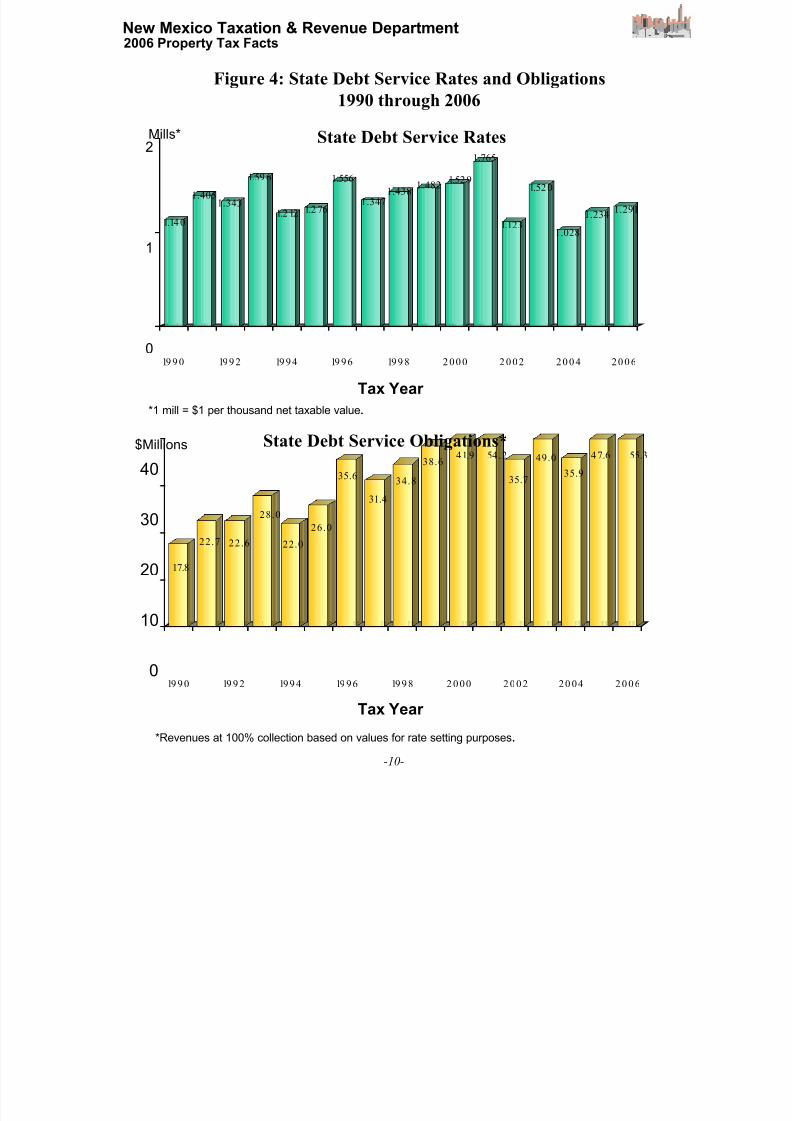
Figure 4: State Debt Service Rates and Obligations
1990 through 2006
State Debt Service Rates
State Debt Service Obligations*$Millions
*1 mill = $1 per thousand net taxable value.
Tax Year
*Revenues at 100% collection based on values for rate setting purposes.
Tax Year
-10-

8/14/2019 Property Values
http://slidepdf.com/reader/full/property-values 11/37
New Mexico Taxation & Revenue Department2006 Property Tax Facts
1 0 . 6
9. 7
1 1 . 1
9. 8
12.2
1 1 . 1
12.7
11.5
1 4 . 5
11.5
15.2
1 2 . 2
16.3
14.4
1 7 . 1
14.6
18.3
13.9
19.4
15.5
21.1
17.5
23.0
19.8
0
5
1 0
1 5
2 0
2 5
1995 1996 1997 1998 1999 2000 2001 2002 2003 2004 2005 2006
Nonr es identia l P r oper t ie s
Res identia l P r oper t ies
49.0
52.153.3 53.1 53.7
57.058.0 58.3 58.5
62.2 62.864.2 64.0 64.7
51.0
47.9 47.4 47.946.7 46.9 46.3
43.0 42.0 41.8 41.539.9 39.8
37.8 37.235.8 36.0
35.3
60.1
52.1 52.651.6
60.3
60.25
48.4
39.75
30
40
50
60
1 9 8 7
1 9 8 8
1 9 8 9
1 9 9 0
1 9 9 1
1 9 9 2
1 9 9 3
1 9 9 4
1 9 9 5
1 9 9 6
1 9 9 7
1 9 9 8
1 9 9 9
2 0 0 0
2 0 0 1
2 0 0 2
2 0 0 3
2 0 0 4
2 0 0 5
2 0 0 6
Figure 5: Total Net Taxable Value -- 1995 Through 2006 Tax Years
Figure 6: Trends in Relative Shares of Residential and Nonresidential
Net Taxable ValuePercent of Total
Net taxable value is generally one-third of assessed value less exemptions. Oil, natural gas and copper production properties are
included in the nonresidential category shown above.
Nonresidential percentages shown above include values of copper ad valorem production properties, but not oil and gas ad valorem properties. Oil and gas
producing values are extremely variable and therefore excluded. Copper producing properties were not, until 1990, production based and are thus not included in
the traditional nonresidential category
Tax
Year
$ Billions
Residential
Nonresidential
-11-
8/14/2019 Property Values
http://slidepdf.com/reader/full/property-values 12/37
New Mexico Taxation & Revenue Department2006 Property Tax Facts
0
200
400
600
800
1000
1200
ResidentialNonresidential*Total
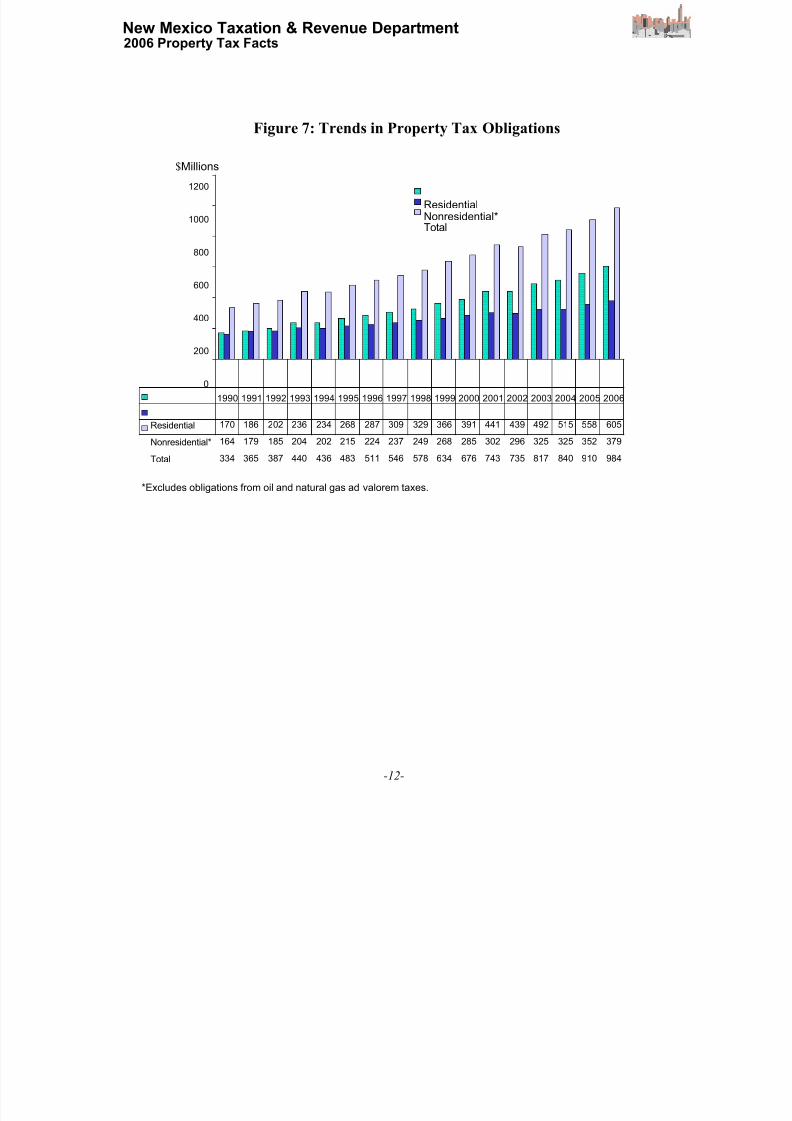
Residential 170 186 202 236 234 268 287 309 329 366 391 441 439 492 515 558 605
Nonresidential* 164 179 185 204 202 215 224 237 249 268 285 302 296 325 325 352 379
Total 334 365 387 440 436 483 511 546 578 634 676 743 735 817 840 910 984
1990 1991 1992 1993 1994 1995 1996 1997 1998 1999 2000 2001 2002 2003 2004 2005 2006
$Millions
*Excludes obligations from oil and natural gas ad valorem taxes.
Figure 7: Trends in Property Tax Obligations
-12-

8/14/2019 Property Values
http://slidepdf.com/reader/full/property-values 13/37
8/14/2019 Property Values
http://slidepdf.com/reader/full/property-values 14/37

8/14/2019 Property Values
http://slidepdf.com/reader/full/property-values 15/37
New Mexico Taxation and Revenue Department -- 2006 Property Tax Facts
Table 6: Property Tax Values and Obligations as a Percent of State Total by County1
Tax Year 2006
Net Taxable Values Obligations
Non- Non-
County Residential residential Other Total Residential residential Other Total
Bernalillo 36.6 26.4 27.4 49.0 36.8 38.2
Catron 0.1 0.4 0.2 0.1 0.2 0.1
Chaves 1.6 2.8 1.6 2.0 1.5 2.4 1.6 1.8
Cibola 0.4 1.2 0.5 0.4 1.2 0.6
Colfax 1.2 1.2 1.4 1.3 0.9 1.0 1.5 1.0
Curry 1.2 1.7 1.1 1.1 1.3 1.0
DeBaca 0.0 0.3 0.1 0.0 0.2 0.1
Dona Ana 7.7 7.8 6.4 7.4 8.1 6.6
Eddy 1.4 4.5 22.9 6.0 1.1 3.0 19.2 4.2
Grant 1.4 1.4 1.0 1.3 0.9 1.0 1.1 0.9
Guadalupe 0.1 0.5 0.2 0.1 0.6 0.3
Harding 0.0 0.1 0.2 0.1 0.0 0.1 0.2 0.1
Hidalgo 0.1 0.8 0.3 0.1 0.6 0.2
Lea 1.1 3.1 25.4 5.9 1.1 2.8 29.6 5.7
Lincoln 2.2 1.7 1.7 1.8 1.5 1.5
Los Alamo 2.6 0.8 1.6 1.7 0.5 1.1
Luna 0.7 1.6 0.9 0.5 1.2 0.7
McKinley 1.0 3.3 0.0 1.5 1.1 3.8 0.0 1.8
Mora 0.2 0.2 0.2 0.1 0.2 0.1
Otero 2.1 1.8 1.7 1.9 1.7 1.6
Quay 0.2 0.5 0.0 0.3 0.2 0.5 0.0 0.3
Rio Arriba 1.5 2.1 17.9 4.5 1.0 1.6 18.0 3.5
Roosevelt 0.4 1.1 0.2 0.6 0.4 0.7 0.2 0.5
San Juan 3.5 11.0 29.0 10.1 2.9 8.8 28.2 8.4
San Migue 1.2 1.1 1.0 0.9 1.1 0.9Sandoval 7.1 3.6 0.1 4.9 7.1 3.5 0.1 4.9
Santa Fe 17.5 11.0 12.6 11.5 9.3 9.2
Sierra 0.6 0.7 0.5 0.4 0.5 0.4
Socorro 0.4 0.7 0.4 0.5 0.7 0.5
Taos 2.5 2.6 2.1 1.2 1.6 1.2
Torrance 0.5 1.2 0.6 0.4 0.9 0.5
Union 0.1 0.6 0.2 0.3 0.1 0.4 0.2 0.2
Valencia 2.7 2.1 2.0 2.4 2.1 2.0
Totals: 100.0 100.0 100.0 100.0 100.0 100.0 100.0 100.01 by class of property, e.g., residential net taxable value in county z as a percent of statewide total residential net taxable value.2Oil, natural gas and copper producing properties.
3Revenues assuming 100 percent collection.
-15-

8/14/2019 Property Values
http://slidepdf.com/reader/full/property-values 16/37
New Mexico Taxation and Revenue Department -- 2006 Property Tax Facts
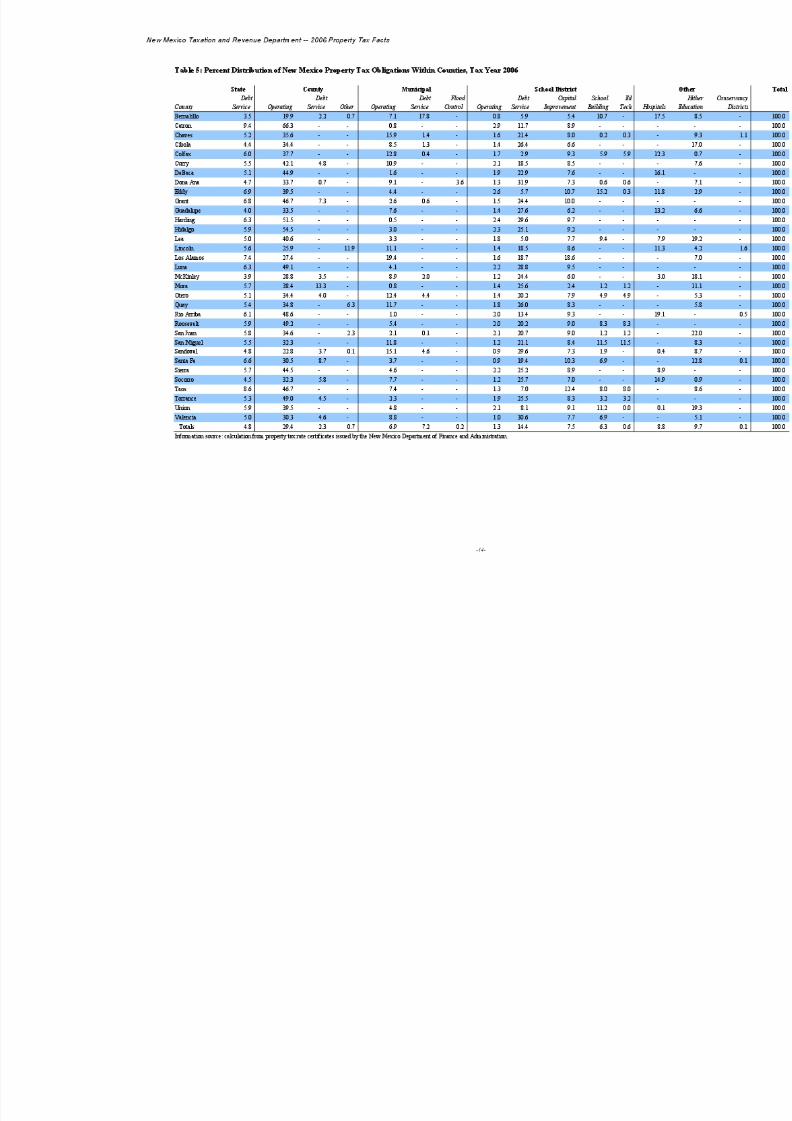
Table 7: Distribution of Tax Base and Obligations Within Counties, 2006 Tax Year
Net Taxable Values -- Percent of County Total Obligations -- Percent of County Total
Non- Non-
County Residential residential Other Total Residential residential Other Total
Bernalillo 71.8 28.2 100.0 68.1 31.9 100.0
Catron 37.3 62.7 100.0 41.4 58.6 100.0
Chaves 44.5 41.2 14.3 100.0 43.7 43.8 12.5 100.0
Cibola 37.8 62.2 100.0 33.6 66.4 100.0
Colfax 52.2 28.4 19.4 100.0 46.2 33.1 20.7 100.0
Curry 55.7 44.3 100.0 57.7 42.3 100.0
De Baca 22.5 77.5 100.0 23.7 76.3 100.0
Dona Ana 64.4 35.6 100.0 59.5 40.5 100.0
Eddy 12.9 22.0 65.1 100.0 13.9 23.1 63.0 100.0
Grant 55.3 31.5 13.1 100.0 48.6 35.1 16.3 100.0
Guadalupe 25.7 74.3 100.0 23.4 76.6 100.0
Harding 10.7 47.4 41.9 100.0 10.3 48.5 41.2 100.0
Hidalgo 14.5 85.5 100.0 14.7 85.3 100.0
Lea 10.4 15.5 74.1 100.0 10.7 16.5 72.8 100.0
Lincoln 71.2 28.8 100.0 67.1 32.9 100.0
Los Alamos 85.8 14.2 100.0 83.1 16.9 100.0
Luna 44.8 55.2 100.0 41.5 58.5 100.0
McKinley 34.8 65.2 0.0 100.0 31.5 68.5 0.0 100.0
Mora 60.2 39.8 100.0 53.3 46.7 100.0
Otero 68.4 31.6 100.0 64.0 36.0 100.0
Quay 43.8 54.3 1.9 100.0 37.8 60.6 1.6 100.0
Rio Arriba 17.9 13.7 68.5 100.0 14.6 14.7 70.7 100.0
Roosevelt 39.5 53.5 7.0 100.0 42.9 51.5 5.6 100.0
San Juan 18.8 32.0 49.2 100.0 18.6 34.6 46.8 100.0
San Miguel 65.6 34.4 100.0 57.7 42.3 100.0Sandoval 78.2 21.5 0.3 100.0 23.4 0.3 23.7
Santa Fe 74.6 25.4 100.0 66.5 33.5 100.0
Sierra 60.3 39.7 100.0 57.0 43.0 100.0
Socorro 53.8 46.2 100.0 51.3 48.7 100.0
Taos 64.1 35.9 100.0 54.6 45.4 100.0
Torrance 43.2 56.8 100.0 43.5 56.5 100.0
Union 21.6 63.4 15.0 100.0 21.4 64.9 13.7 100.0
Valencia 70.0 30.0 100.0 64.9 35.1 100.0
Totals 53.7 29.2 17.1 100.0 53.0 33.1 13.9 100.0
Information source: calculated from NM Department of Finance and Administration, property tax rate certificates.
-16-
8/14/2019 Property Values
http://slidepdf.com/reader/full/property-values 17/37
New Mexico Taxation and Revenue Department -- 2006 Property Tax Facts
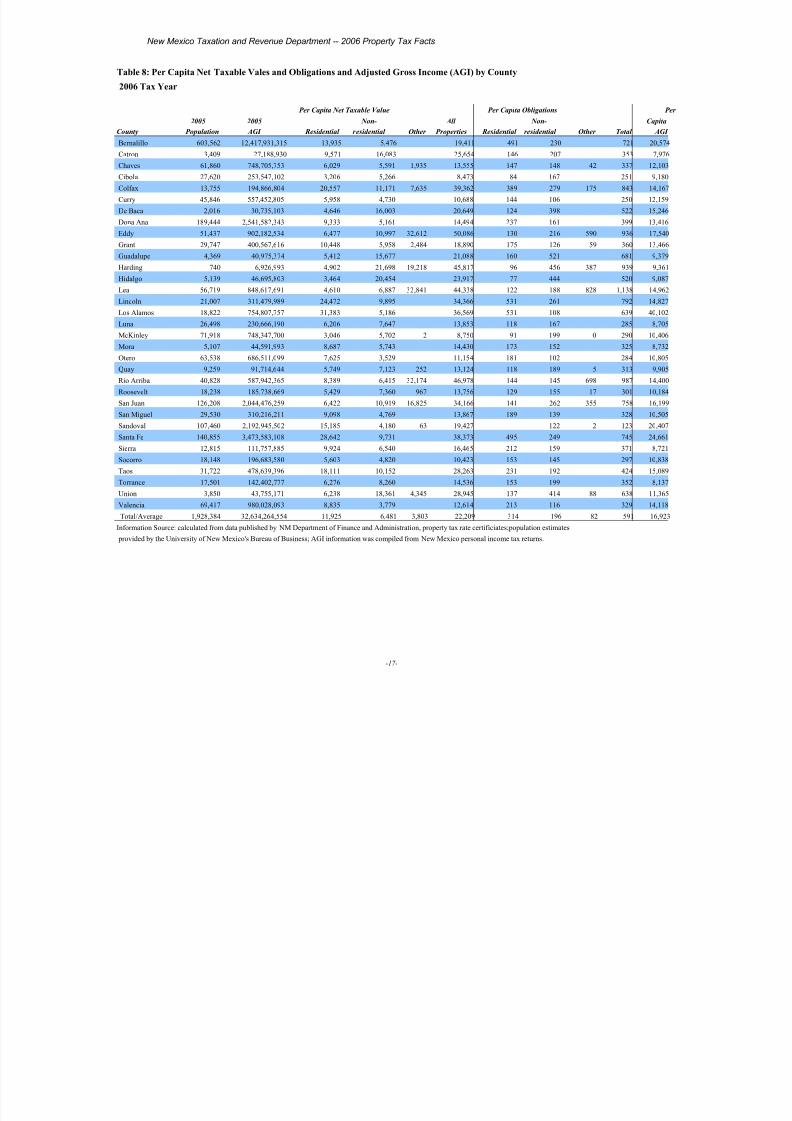
Table 8: Per Capita Net Taxable Vales and Obligations and Adjusted Gross Income (AGI) by County
2006 Tax Year
Per Capita Net Taxable Value Per Capita Obligations
2005 2005 Non- All Non- Capit
County Population AGI Residential residential Other Properties Residential residential Other Total AG
Bernalillo 603,562 12,417,931,315 13,935 5,476 19,411 491 230 721 20,57
Catron 3,409 27,188,930 9,571 16,083 25,654 146 207 353 7,97
Chaves 61,860 748,705,753 6,029 5,591 1,935 13,555 147 148 42 337 12,10
Cibola 27,620 253,547,102 3,206 5,266 8,473 84 167 251 9,18
Colfax 13,755 194,866,804 20,557 11,171 7,635 39,362 389 279 175 843 14,16
Curry 45,846 557,452,805 5,958 4,730 10,688 144 106 250 12,15
De Baca 2,016 30,735,103 4,646 16,003 20,649 124 398 522 15,24
Dona Ana 189,444 2,541,582,343 9,333 5,161 14,494 237 161 399 13,41
Eddy 51,437 902,182,534 6,477 10,997 32,612 50,086 130 216 590 936 17,54
Grant 29,747 400,567,616 10,448 5,958 2,484 18,890 175 126 59 360 13,46
Guadalupe 4,369 40,975,374 5,412 15,677 21,088 160 521 681 9,37
Harding 740 6,926,993 4,902 21,698 19,218 45,817 96 456 387 939 9,36
Hidalgo 5,139 46,695,803 3,464 20,454 23,917 77 444 520 9,08
Lea 56,719 848,617,691 4,610 6,887 32,841 44,338 122 188 828 1,138 14,96
Lincoln 21,007 311,479,989 24,472 9,895 34,366 531 261 792 14,82Los Alamos 18,822 754,807,757 31,383 5,186 36,569 531 108 639 40,10
Luna 26,498 230,666,190 6,206 7,647 13,853 118 167 285 8,70
McKinley 71,918 748,347,700 3,046 5,702 2 8,750 91 199 0 290 10,40
Mora 5,107 44,591,993 8,687 5,743 14,430 173 152 325 8,73
Otero 63,538 686,511,099 7,625 3,529 11,154 181 102 284 10,80
Quay 9,259 91,714,644 5,749 7,123 252 13,124 118 189 5 313 9,90
Rio Arriba 40,828 587,942,365 8,389 6,415 32,174 46,978 144 145 698 987 14,40
Roosevelt 18,238 185,738,669 5,429 7,360 967 13,756 129 155 17 301 10,18
San Juan 126,208 2,044,476,259 6,422 10,919 16,825 34,166 141 262 355 758 16,19
San Miguel 29,530 310,216,211 9,098 4,769 13,867 189 139 328 10,50
Sandoval 107,460 2,192,945,502 15,185 4,180 63 19,427 122 2 123 20,40
Santa Fe 140,855 3,473,583,108 28,642 9,731 38,373 495 249 745 24,66
Sierra 12,815 111,757,885 9,924 6,540 16,465 212 159 371 8,72
Socorro 18,148 196,683,580 5,603 4,820 10,423 153 145 297 10,83
Taos 31,722 478,639,396 18,111 10,152 28,263 231 192 424 15,08
Torrance 17,501 142,402,777 6,276 8,260 14,536 153 199 352 8,13
Union 3,850 43,755,171 6,238 18,361 4,345 28,945 137 414 88 638 11,36
Valencia 69,417 980,028,093 8,835 3,779 12,614 213 116 329 14,11
Total/Average 1,928,384 32,634,264,554 11,925 6,481 3,803 22,209 314 196 82 591 16,92
Information Source: calculated from data published by NM Department of Finance and Administration, property tax rate certificiates;population estimates
provided by the University of New Mexico's Bureau of Business; AGI information was compiled from New Mexico personal income tax returns.
-17-
8/14/2019 Property Values
http://slidepdf.com/reader/full/property-values 18/37
New Mexico Taxation and Revenue Department -- 2006 Property Tax Facts
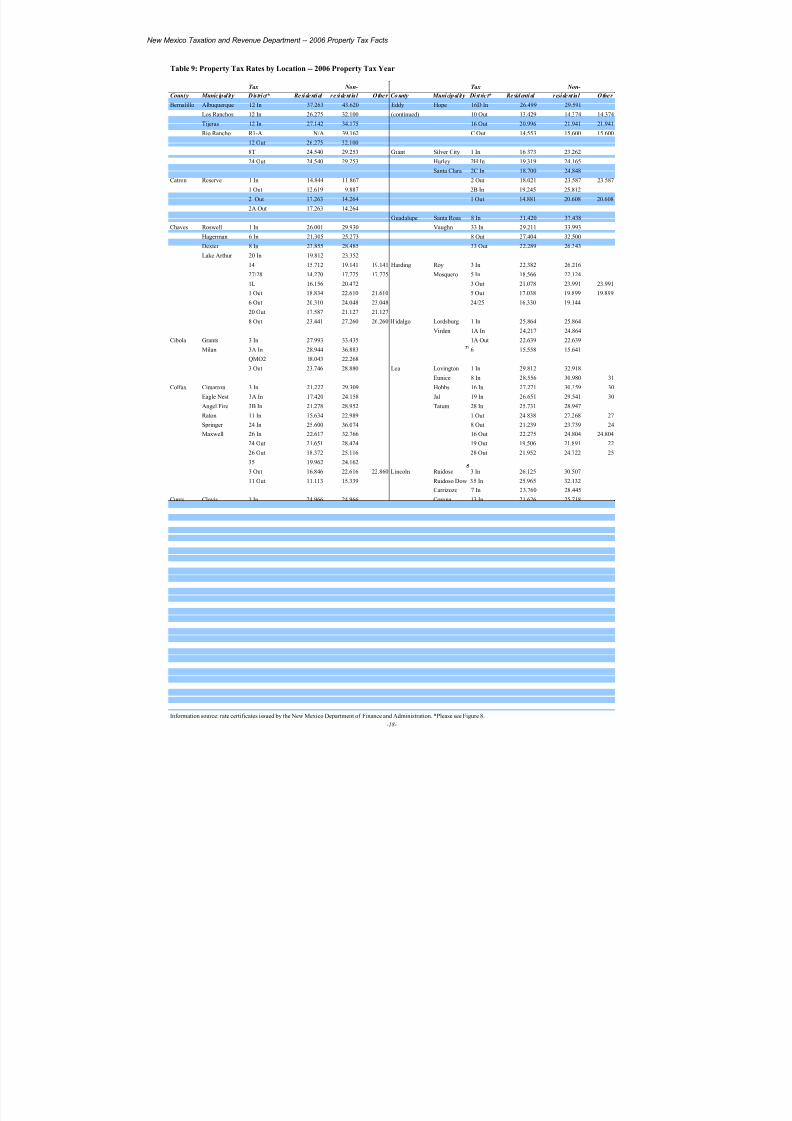
Table 9: Property Tax Rates by Location -- 2006 Property Tax Year
Tax Non- Tax Non-
Count y Munic ip al it y D is tri ct* Re si de nti al r e si de nt ia l O the r Co unty Muni cip al it y Di st ric t* Re sid enti al r esi de nt ia l O the r
Bernalillo Albuquerque 12 In 37.263 43.620 Eddy Hope 16D In 26.499 29.591
Los Ranchos 12 In 26.275 32.100 (continued) 10 Out 13.429 14.374 14.374
Tijeras 12 In 27.142 34.175 16 Out 20.996 21.941 21.941
Rio Rancho R1-A N/A 39.162 C Out 14.553 15.600 15.600
12 Out 26.275 32.100
8T 24.540 29.253 Grant Silver City 1 In 16.373 23.262
24 Out 24.540 29.253 Hurley 2H In 19.319 24.165
Santa Clara 2C In 18.700 24.848
Catron Reserve 1 In 14.844 11.867 2 Out 18.021 23.587 23.587
1 Out 12.619 9.887 2B In 19.245 25.812
2 Out 17.263 14.264 1 Out 14.881 20.608 20.608
2A Out 17.263 14.264
Guadalupe Santa Rosa 8 In 31.420 37.438
Chaves Roswell 1 In 26.001 29.930 Vaughn 33 In 29.211 33.993
Hagerman 6 In 21.305 25.273 8 Out 27.404 32.500
Dexter 8 In 23.855 28.485 33 Out 22.289 26.343
Lake Arthur 20 In 19.812 23.352
14 15.712 19.141 19.141 Harding Roy 3 In 22.382 26.216
27/28 14.270 17.775 17.775 Mosquero 5 In 18.566 22.124
1L 16.156 20.472 3 Out 21.078 23.991 23.991
1 Out 18.834 22.610 21.610 5 Out 17.038 19.899 19.899
6 Out 20.310 24.048 23.048 24/25 16.330 19.14420 Out 17.587 21.127 21.127
8 Out 23.441 27.260 26.260 Hidalgo Lordsburg 1 In 25.864 25.864
Virden 1A In 24.217 24.864
Cibola Grants 3 In 27.993 33.435 1A Out 22.639 22.639
Milan 3A In 28.944 36.883 6 15.558 15.641
QMO2 18.043 22.268
3 Out 23.746 28.880 Lea Lovington 1 In 29.812 32.918
Eunice 8 In 28.556 30.980 31
Colfax Cimarron 3 In 21.222 29.309 Hobbs 16 In 27.271 30.359 30
Eagle Nest 3A In 17.420 24.158 Jal 19 In 26.651 29.541 30
Angel Fire 3B In 21.278 28.952 Tatum 28 In 25.731 28.947
Raton 11 In 15.634 22.989 1 Out 24.838 27.268 27
Springer 24 In 25.600 36.074 8 Out 21.239 23.739 24
Maxwell 26 In 22.617 32.766 16 Out 22.275 24.804 24.804
24 Out 21.651 28.424 19 Out 19.506 21.891 22
26 Out 18.372 25.116 28 Out 21.952 24.722 2535 19.962 24.162
3 Out 16.846 22.616 22.860 Lincoln Ruidoso 3 In 26.125 30.507
11 Out 11.113 15.339 Ruidoso Dow 35 In 25.965 32.132
Carrizozo 7 In 23.760 28.445
Curry Clovis 1 In 24.966 24.966 Corona 13 In 21.626 25.718
Texico 2 In 20.285 20.024 Capitan 28 In 16.033 21.182
Melrose 12 In 16.946 16.987 7 Out 19.898 24.220
Grady 61 In 31.363 31.374 13 Out 18.055 22.293
1 Out 21.241 21.241 20 22.003 26.238
2 Out 18.060 17.799 28 Out 15.599 19.957
12 Out 14.762 14.762 3/35 Out 21.339 25.425
61 Out 23.713 23.724
Los Alamos Los Alamos 1 16.917 20.789
DeBaca Fort Sumner 20 In 27.918 26.877
20 Out 25.693 24.671 Luna Deming 1 In 19.612 23.301
Columbus 1A In 22.340 26.798
Dona Ana Las Cruces 2 In 26.985 32.413 1 Out 18.050 21.078
Mesilla 2D In 21.901 27.348
Hatch 11 In 28.315 32.740 McKinley Gallup 1 In 31.386 40.951
Sunland Park 16 In 30.563 35.372 1 Out 25.064 31.914
11 Out 24.351 28.586 Zuni 20.147 26.738
16 Out 27.858 32.181 Mora Wagon Moun 12 In 24.821 29.928
2 Out 21.051 25.322 1 19.378 25.634
12 Out 20.278 26.613
Eddy Carlsbad C In 20.778 21.825 21.825 12C 24.421 30.853
Loving 10 In 15.271 16.433 1-A 20.278 26.613
Artesia 16 In 22.884 24.166 24.166
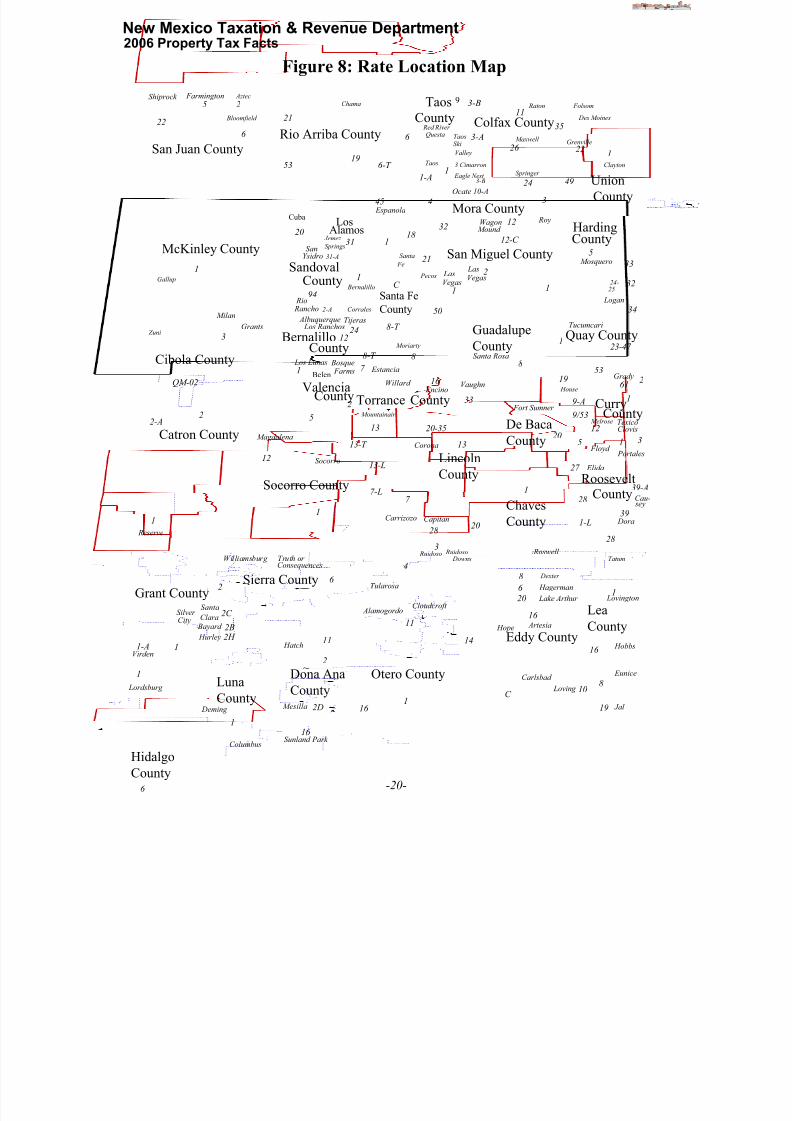
Information source: rate certificates issued by the New Mexico Department of Finance and Administration. *Please see Figure 8.
-18-
8/14/2019 Property Values
http://slidepdf.com/reader/full/property-values 19/37
New Mexico Taxation and Revenue Department -- 2006 Property Tax Facts
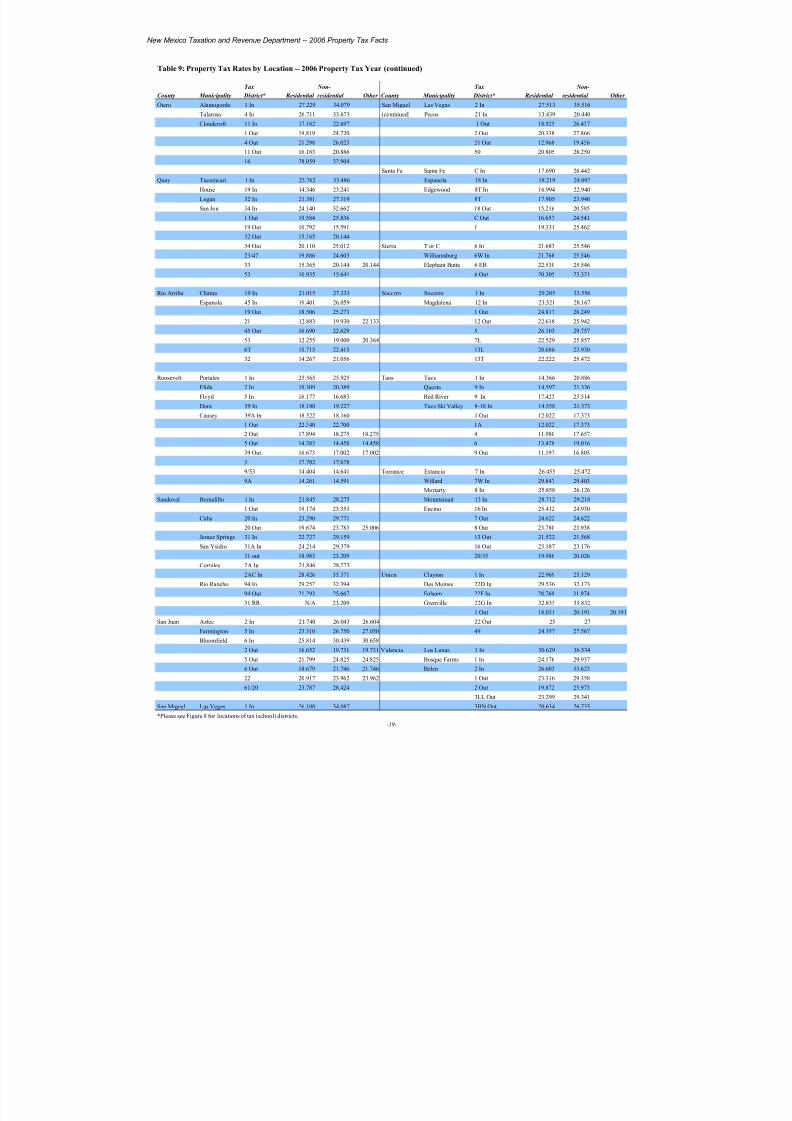
Table 9: Property Tax Rates by Location -- 2006 Property Tax Year (continued)
Tax Non- Tax Non-
County Municipality District* Residential residential Other County Municipality District* Residential residential Other
Otero Alamogordo 1 In 27.229 34.079 San Miguel Las Vegas 2 In 27.513 35.516
Tularosa 4 In 26.711 33.673 (continued) Pecos 21 In 13.439 20.440
Cloudcroft 11 In 17.162 22.697 1 Out 18.925 26.437
1 Out 19.819 24.720 2 Out 20.338 27.866
4 Out 21.298 26.023 21 Out 12.968 19.456
11 Out 16.183 20.886 50 20.805 28.250
16 28.059 32.904
Santa Fe Santa Fe C In 17.690 26.442
Quay Tucumcari 1 In 23.762 33.486 Espanola 18 In 18.219 24.097
House 19 In 14.346 23.241 Edgewood 8T In 16.994 22.940
Logan 32 In 21.381 27.319 8T 17.905 23.940
San Jon 34 In 24.140 32.662 18 Out 15.216 20.585
1 Out 19.584 25.836 C Out 16.657 24.541
19 Out 10.792 15.591 1 19.331 25.462
32 Out 15.365 20.144
34 Out 20.110 25.012 Sierra T or C 6 In 21.683 25.546
23/47 19.886 24.603 Williamsburg 6W In 21.768 25.546
33 15.365 20.144 20.144 Elephant Butte 6 EB 22.530 25.546
53 10.935 15.641 6 Out 20.305 23.321
Rio Arriba Chama 19 In 21.015 27.333 Socorro Socorro 1 In 29.205 33.556
Espanola 45 In 19.401 26.059 Magdalena 12 In 23.321 28.16719 Out 18.506 25.273 1 Out 24.817 28.249
21 12.883 19.930 22.133 12 Out 22.618 25.942
45 Out 16.690 22.629 5 26.103 29.757
53 12.255 19.000 20.364 7L 22.529 25.857
6T 15.715 22.415 13L 20.686 23.930
32 14.267 21.056 13T 22.222 25.472
Roosevelt Portales 1 In 25.565 25.925 Taos Taos 1 In 14.366 20.886
Elida 2 In 19.309 20.389 Questa 9 In 14.597 21.336
Floyd 5 In 16.177 16.683 Red River 9 In 17.423 23.514
Dora 39 In 18.180 19.227 Taos Ski Valley 8-18 In 14.558 21.373
Causey 39A In 18.522 18.160 1 Out 12.022 17.373
1 Out 22.340 22.700 1A 12.022 17.373
2 Out 17.894 18.275 18.275 4 11.980 17.657
5 Out 14.283 14.458 14.458 6 13.428 19.016
39 Out 16.673 17.002 17.002 9 Out 11.197 16.8053 17.702 17.678
9/53 14.404 14.641 Torrance Estancia 7 In 26.455 25.472
9A 14.261 14.591 Willard 7W In 29.847 29.403
Moriarty 8 In 25.858 26.126
Sandoval Bernalillo 1 In 21.845 28.275 Mountainair 13 In 28.712 29.218
1 Out 19.174 23.353 Encino 16 In 25.412 24.930
Cuba 20 In 23.290 29.771 7 Out 24.622 24.622
20 Out 19.674 23.783 25.006 8 Out 23.780 23.938
Jemez Springs 31 In 22.727 29.159 13 Out 21.522 21.568
San Ysidro 31A In 24.214 29.379 16 Out 23.187 23.176
31 out 18.983 23.209 20/35 19.986 20.026
Corrales 2A In 21.846 28.773
2AC In 28.426 35.371 Union Clayton 1 In 22.969 25.129
Rio Rancho 94 In 29.257 32.394 Des Moines 22D In 29.536 32.173
94 Out 21.293 25.667 Folsom 22F In 28.769 31.974
31 RR N/A 23.209 Grenville 22G In 32.833 33.832
1 Out 18.031 20.191 20.191
San Juan Aztec 2 In 21.740 26.043 26.604 22 Out 25 27
Farmington 5 In 23.310 26.750 27.050 49 24.357 27.567
Bloomfield 6 In 25.814 30.439 30.658
2 Out 16.652 19.731 19.731 Valencia Los Lunas 1 In 30.629 36.534
5 Out 21.799 24.825 24.825 Bosque Farms 1 In 24.176 29.937
6 Out 18.679 21.746 21.746 Belen 2 In 26.603 33.623
22 20.917 23.962 23.962 1 Out 23.316 29.358
61/20 23.787 28.424 2 Out 19.872 25.973
3LL Out 23.299 29.341
San Miguel Las Vegas 1 In 26.100 34.087 3BN Out 20.634 26.735
*Please see Figure 8 for locations of tax (school) districts.
-19-
8/14/2019 Property Values
http://slidepdf.com/reader/full/property-values 20/37
New Mexico Taxation & Revenue Department2006 Property Tax Facts
San Juan County
Farmington Aztec
Bloomfield 22
5 2
6 Rio Arriba County
21
5319
6-T
McKinley County
Colfax County
Taos
~
Luna
County
Dona Ana
County
Los
HidalgoCounty
Sandoval
Harding
Santa Fe
County
Bernalillo
Cibola County
Catron County
Union
Mora County
Sierra CountyGrant County
Otero County
Socorro County
San Miguel County
ValenciaTorrance
Guadalupe
County
LincolnCounty
Curry
De Baca
County
Roosevelt
Chaves
County
Eddy County
Shiprock
LeaCounty
Quay County
Chama
6
9
3-A
1-A
4
1
TaosSki
Valley
Questa Red River
3 Cimarron
Eagle Nest 3-B
3-B Raton
Maxwell
Springer
11
26
24
35
Folsom
Des Moines
Grenville
22
49
1Clayton
33
32
34
24-1
2
1
21
1832
12
C
50
88
8-T
2
16
33
20
1953
612
9-A
9/53
12
5
20-35
13
13
1 Gallup
Zuni
Alamos1
3
QM-02
Milan
Grants
2-A2
1
Reserve
Magdalena
Socorro12
5
13-T
1
6
Williamsburg Truth or Consequences
2
1
1
6
1-AVirden
Lordsburg
Silver City
SantaClara
Bayard
Hurley
2C
2B2H
County
Deming
Columbus
1
11
2
2D
16 Sunland Park
Mesilla
Hatch
16
20
Cuba
SanYsidro
Rio Rancho
94
31
31-A
Jemez
Springs
2-A Corrales
1 Bernalillo
MoriartyCounty
AlbuquerqueLos Ranchos
Tijeras
8-T
24
1
11
4
Cloudcroft
Tularosa
Alamogordo
Carrizozo Capitan
Ruidoso Ruidoso
7-L
13-L
Downs
7
28
3
20
Corona
Mountainair
County
Belen1
BosqueFarms
Los LunasEstancia
Willard Encino
Vaughn
Santa Rosa
Dexter
20
Hagerman
Lake Arthur
6
8
28
Tatum
Lovington1
Hobbs
Eunice
Jal
Loving 108
19
16
C
Hope Artesia
Carlsbad
Fort Sumner
Melrose TexicoClovis
County
1
Grady
28
1-L
27
County
39
Cau-
Dora
sey
39-A
1Floyd
3
Portales
23-47
Tucumcari
1
Logan
25
LasVegas
LasVegas
Pecos
12-C
WagonMound
3
Roy
5Mosquero
Ocate 10-A
45 Espanola
14
County
County
County
Roswell
House
Taos
Santa
Fe
7
1
Elida
16
County
Figure 8: Rate Location Map
-20-
12

8/14/2019 Property Values
http://slidepdf.com/reader/full/property-values 21/37
New Mexico Taxation & Revenue Department2006 Property Tax Facts
0
5
10
15
20
25
30
35
40
45
8-10 10-12 12-14 14-16 16-18 18-
20
20 -
22
22-
24
24-
26
26-
28
28-
30
30-
32
32-
34
34-
36
36-
38
38 -
40
40+
Figure 9: Distribution of Property Tax Rates -- 2006 Tax Year
New Mexico properties are subject to one of about 500 rate totals, depending on property type and
location. Highest rates -- over 32 mills -- for residential properties are in Albuquerque (Bernalillo
County and Grenville (Union County). The state’s lowest residential rates, paid by some residents
of Quay County, are under 11 mills. Highest traditional, i.e., non-oil and gas, nonresidential rates
are paid in Albuquerque – 43.620 mills. Lowest rates among traditional nonresidential propertiesare in portions of Catron County – 9.887 mills.
Rates paid by owners of oil, natural gas and copper production properties range from 14.38 mills in
a portion of Eddy County to almost 32 mills in a portion of Lea County. Since 1/3rd of assessed
value is taxed, a mill rate of 33.33 mills represents an effective rate of 1 percent of assessed value.
Statewide weighted average rates, i.e., total obligations/total net taxable value, averaged 26.294
mills among residential properties, 30.173 mills among traditional nonresidential properties,
21.608 mills among oil and gas producing properties, and 26.264 mills among all properties in Tax
Year 2006.
Rate in Mills or $ p$1,000 in Net Taxa
Value
Number of Jurisdictions
ResidentialProperties
NonresidentialProperties
Oil,NaturalGas &Copper ProductionProperties
ResidentialMedian = 21.222
NonresidentialMedian = 25.116
-21-
Oil, NaturalGas andCopper ProductionPropertiesMedian=22.113
8/14/2019 Property Values
http://slidepdf.com/reader/full/property-values 22/37
New Mexico Taxation and Revenue Department -- 2006 Property Tax Facts
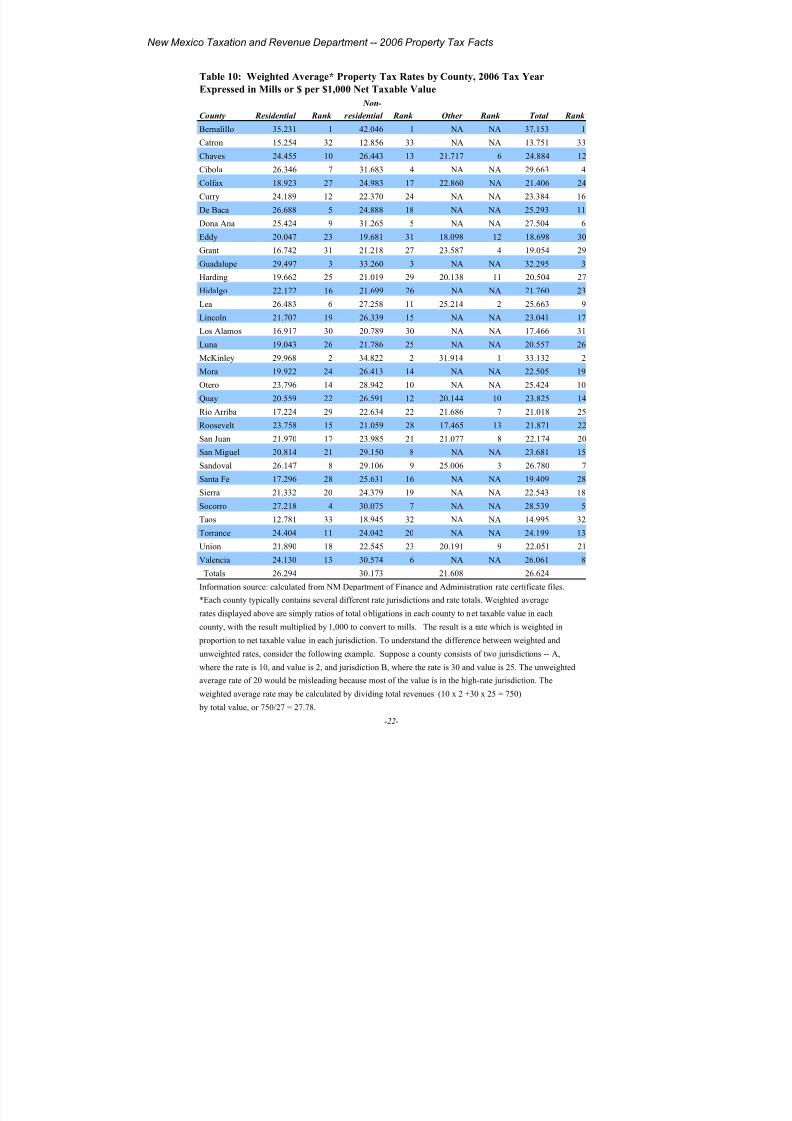
Table 10: Weighted Average* Property Tax Rates by County, 2006 Tax Year
Expressed in Mills or $ per $1,000 Net Taxable Value
Non-
County Residential Rank residential Rank Other Rank Total Rank
Bernalillo 35.231 1 42.046 1 NA NA 37.153 1
Catron 15.254 32 12.856 33 NA NA 13.751 33
Chaves 24.455 10 26.443 13 21.717 6 24.884 12
Cibola 26.346 7 31.683 4 NA NA 29.663 4
Colfax 18.923 27 24.983 17 22.860 NA 21.406 24
Curry 24.189 12 22.370 24 NA NA 23.384 16
De Baca 26.688 5 24.888 18 NA NA 25.293 11
Dona Ana 25.424 9 31.265 5 NA NA 27.504 6
Eddy 20.047 23 19.681 31 18.098 12 18.698 30
Grant 16.742 31 21.218 27 23.587 4 19.054 29
Guadalupe 29.497 3 33.260 3 NA NA 32.295 3
Harding 19.662 25 21.019 29 20.138 11 20.504 27
Hidalgo 22.122 16 21.699 26 NA NA 21.760 23
Lea 26.483 6 27.258 11 25.214 2 25.663 9
Lincoln 21.707 19 26.339 15 NA NA 23.041 17
Los Alamos 16.917 30 20.789 30 NA NA 17.466 31
Luna 19.043 26 21.786 25 NA NA 20.557 26
McKinley 29.968 2 34.822 2 31.914 1 33.132 2
Mora 19.922 24 26.413 14 NA NA 22.505 19
Otero 23.796 14 28.942 10 NA NA 25.424 10
Quay 20.559 22 26.591 12 20.144 10 23.825 14
Rio Arriba 17.224 29 22.634 22 21.686 7 21.018 25
Roosevelt 23.758 15 21.059 28 17.465 13 21.871 22
San Juan 21.970 17 23.985 21 21.077 8 22.174 20
San Miguel 20.814 21 29.150 8 NA NA 23.681 15Sandoval 26.147 8 29.106 9 25.006 3 26.780 7
Santa Fe 17.296 28 25.631 16 NA NA 19.409 28
Sierra 21.332 20 24.379 19 NA NA 22.543 18
Socorro 27.218 4 30.075 7 NA NA 28.539 5
Taos 12.781 33 18.945 32 NA NA 14.995 32
Torrance 24.404 11 24.042 20 NA NA 24.199 13
Union 21.890 18 22.545 23 20.191 9 22.051 21
Valencia 24.130 13 30.574 6 NA NA 26.061 8
Totals 26.294 30.173 21.608 26.624
Information source: calculated from NM Department of Finance and Administration rate certificate files.
*Each county typically contains several different rate jurisdictions and rate totals. Weighted average
rates displayed above are simply ratios of total obligations in each county to net taxable value in each
county, with the result multiplied by 1,000 to convert to mills. The result is a rate which is weighted in
proportion to net taxable value in each jurisdiction. To understand the difference between weighted and
unweighted rates, consider the following example. Suppose a county consists of two jurisdictions -- A,
where the rate is 10, and value is 2, and jurisdiction B, where the rate is 30 and value is 25. The unweighted
average rate of 20 would be misleading because most of the value is in the high-rate jurisdiction. The
weighted average rate may be calculated by dividing total revenues (10 x 2 +30 x 25 = 750)
by total value, or 750/27 = 27.78.
-22-
8/14/2019 Property Values
http://slidepdf.com/reader/full/property-values 23/37
New Mexico Taxation & Revenue Department2006 Property Tax Facts
21.222 21.146
26.294
25.11625.273
30.173
22.133
22.658
21.608
0
5
10
15
20
25
30
35
Mills
Residential Nonresidential Oil, Natural Gas and Copper
Ad Valorem
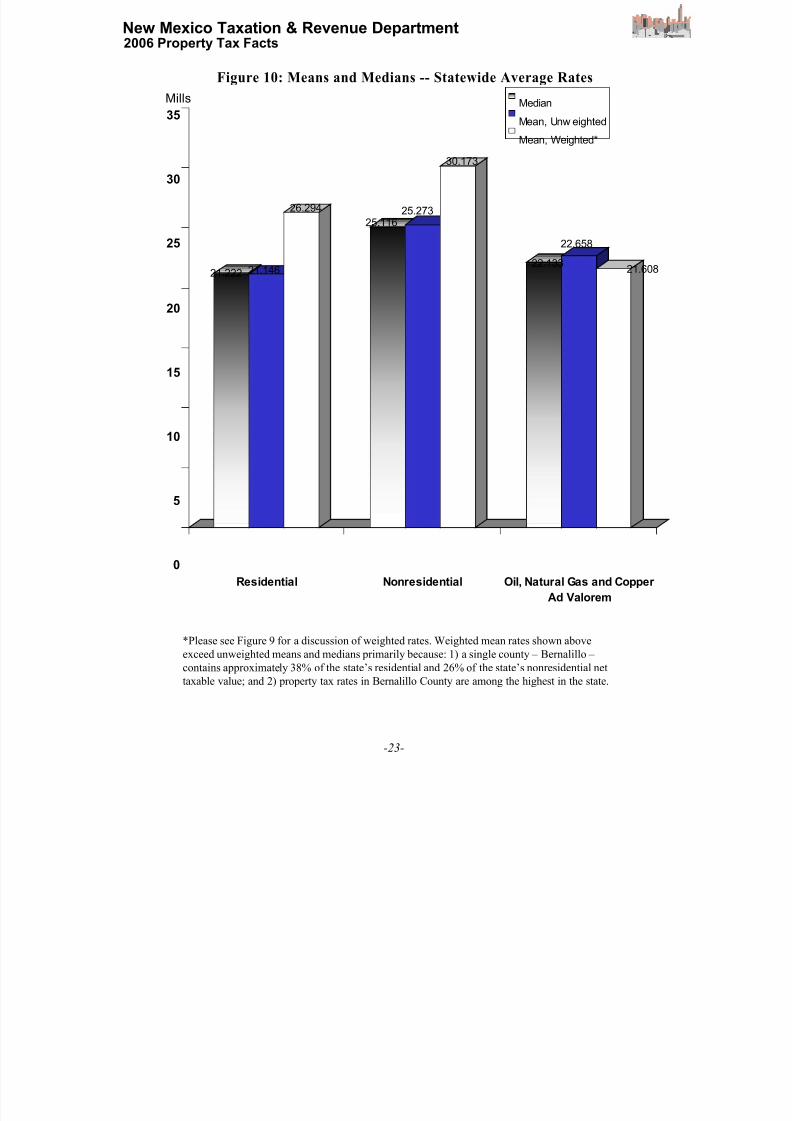
Figure 10: Means and Medians -- Statewide Average Rates
Median
Mean, Unw eighted
Mean, Weighted*
*Please see Figure 9 for a discussion of weighted rates. Weighted mean rates shown above
exceed unweighted means and medians primarily because: 1) a single county – Bernalillo –
contains approximately 38% of the state’s residential and 26% of the state’s nonresidential net
taxable value; and 2) property tax rates in Bernalillo County are among the highest in the state.
-23-

8/14/2019 Property Values
http://slidepdf.com/reader/full/property-values 24/37
New Mexico Taxation and Revenue Department -- 2006 Property Tax Facts
Table 11: Actual, Imposed and Remaining Operating Rates by County
2006 Tax Year
Rate Remaining Potential
County Imposed Authority1
Residential Nonresidential Revenue3
Bernalillo 10.900 0.950 6.363 10.900 11,129,763
Catron 10.850 1.000 10.850 8.096 87,454
Chaves 10.350 1.500 6.989 10.350 1,257,743Cibola 11.850 0.000 7.485 11.850 0
Colfax 10.350 1.500 6.125 10.106 812,134
Curry 9.850 2.000 9.850 9.850 980,018
DeBaca 11.850 0.000 11.850 11.199 0
Dona Ana 11.850 0.000 7.833 11.850 0
Eddy 7.500 4.350 6.623 7.500 11,206,792
Grant 11.850 0.000 6.254 11.833 0
Guadalupe 11.850 0.000 7.785 11.850 0.000
Harding 10.850 1.000 8.109 10.850 33,904
Hidalgo 11.850 0.000 11.850 11.850 0
Lea 10.600 1.250 8.785 10.600 3,143,514
Lincoln 11.600 0.250 7.548 11.600 180,484
Los Alamos 8.850 3.000 4.370 7.261 2,064,909
Luna 11.850 0.000 8.411 11.445 0
McKinley 11.850 0.000 5.259 11.850 0
Mora 11.850 0.000 6.532 11.850 0
Otero 11.850 0.000 7.311 11.850 0
Quay 11.850 0.000 7.144 11.850 0
Rio Arriba 11.850 0.000 4.339 9.647 0
Roosevelt 10.850 1.000 10.613 10.850 250,885
San Juan 8.500 3.350 6.737 8.500 14,445,244
San Miguel 11.850 0.000 5.436 11.850 0
Sandoval 10.350 1.500 5.271 9.127 3,131,446
Santa Fe 11.850 0.000 4.450 10.238 0
Sierra 11.850 0.000 8.834 11.850 0
Socorro 11.850 0.000 7.731 10.935 0
Taos 11.850 0.000 5.042 10.498 0
Torrance 11.850 0.000 11.850 11.850 0
Union 9.150 2.700 7.096 9.150 300,880
Valencia 11.850 0.000 6.199 11.850 0
Total 49,025,172111.85 mill maximum allowed by statute less the imposed rate.
2imposed rate after application of the yield control limitation required by statute.
3remaining rate authority multiplied by total net taxable value.
Actual Operating Rates2
-24-
8/14/2019 Property Values
http://slidepdf.com/reader/full/property-values 25/37
New Mexico Taxation and Revenue Department -- 2006 Property Tax Facts
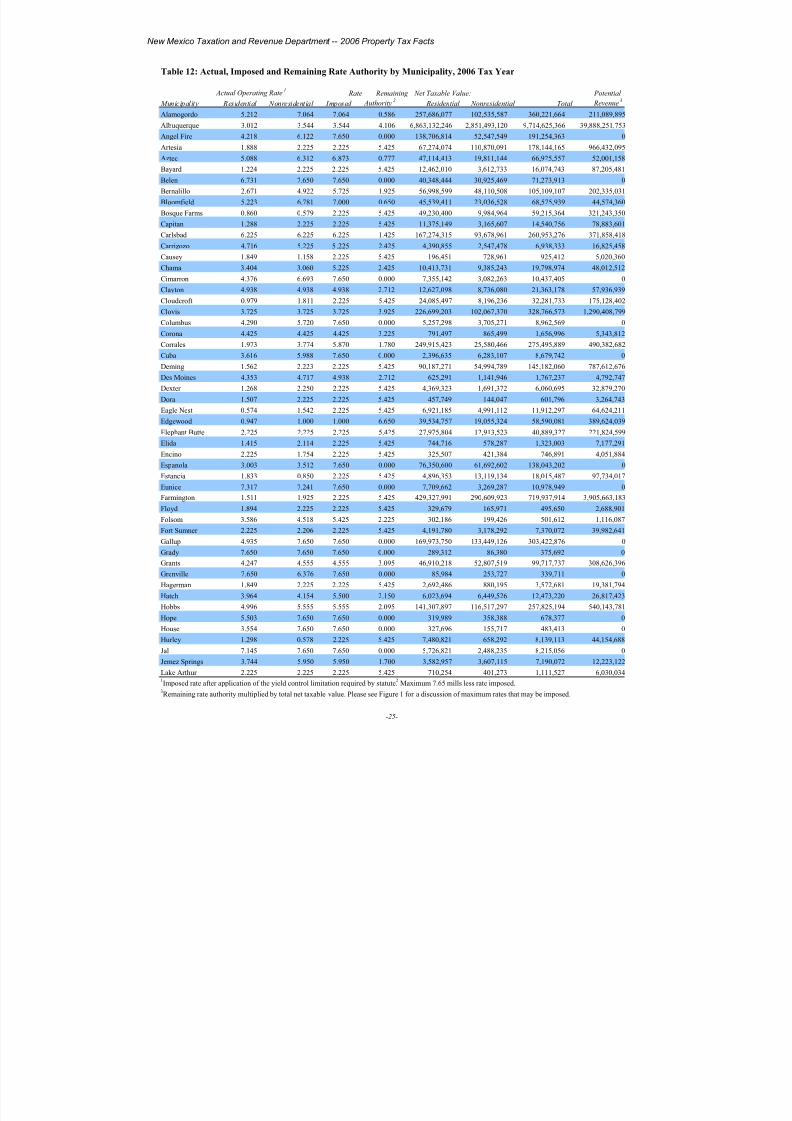
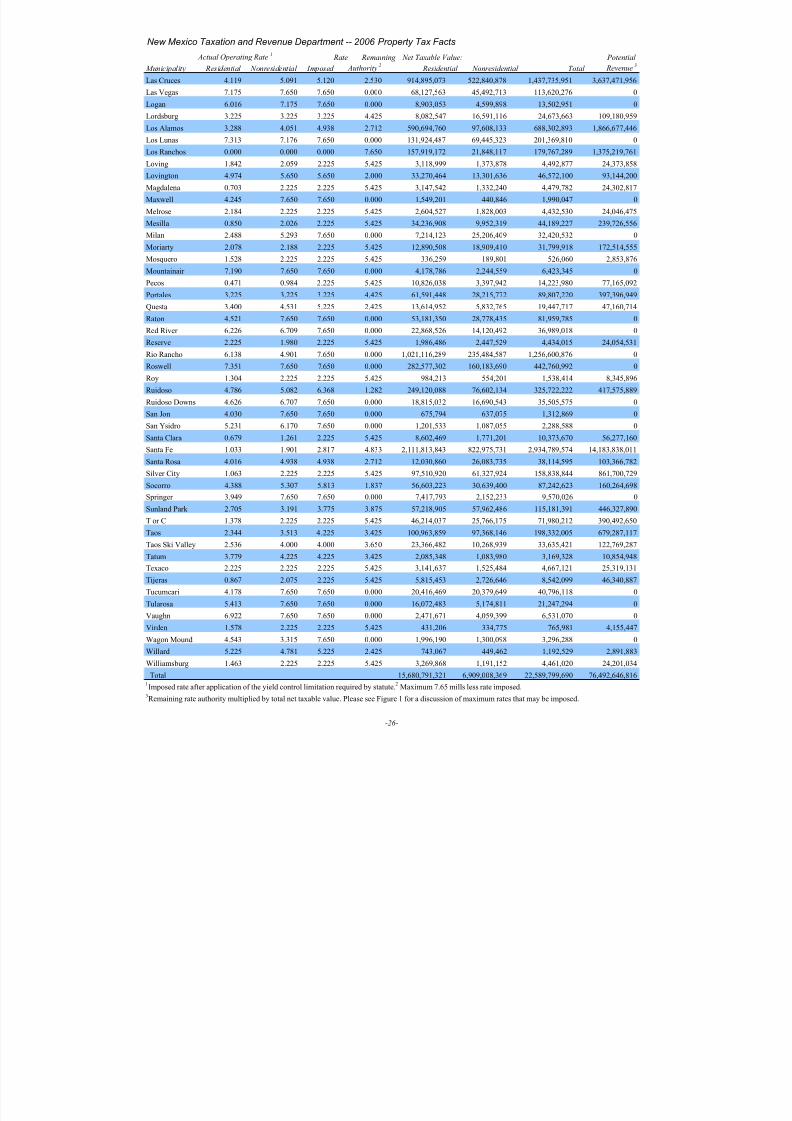
Table 12: Actual, Imposed and Remaining Rate Authority by Municipality, 2006 Tax Year
Actual Operating Rate1
Rate Remaining Net Taxable Value: Potential
Municipality Residential Nonresidential Imposed Authority2
Residential Nonresidential Total Revenue3
Alamogordo 5.212 7.064 7.064 0.586 257,686,077 102,535,587 360,221,664 211,089,895
Albuquerque 3.012 3.544 3.544 4.106 6,863,132,246 2,851,493,120 9,714,625,366 39,888,251,753
Angel Fire 4.218 6.122 7.650 0.000 138,706,814 52,547,549 191,254,363 0
Artesia 1.888 2.225 2.225 5.425 67,274,074 110,870,091 178,144,165 966,432,095
Aztec 5.088 6.312 6.873 0.777 47,114,413 19,811,144 66,925,557 52,001,158
Bayard 1.224 2.225 2.225 5.425 12,462,010 3,612,733 16,074,743 87,205,481
Belen 6.731 7.650 7.650 0.000 40,348,444 30,925,469 71,273,913 0
Bernalillo 2.671 4.922 5.725 1.925 56,998,599 48,110,508 105,109,107 202,335,031
Bloomfield 5.223 6.781 7.000 0.650 45,539,411 23,036,528 68,575,939 44,574,360
Bosque Farms 0.860 0.579 2.225 5.425 49,230,400 9,984,964 59,215,364 321,243,350
Capitan 1.288 2.225 2.225 5.425 11,375,149 3,165,607 14,540,756 78,883,601
Carlsbad 6.225 6.225 6.225 1.425 167,274,315 93,678,961 260,953,276 371,858,418
Carrizozo 4.716 5.225 5.225 2.425 4,390,855 2,547,478 6,938,333 16,825,458
Causey 1.849 1.158 2.225 5.425 196,451 728,961 925,412 5,020,360
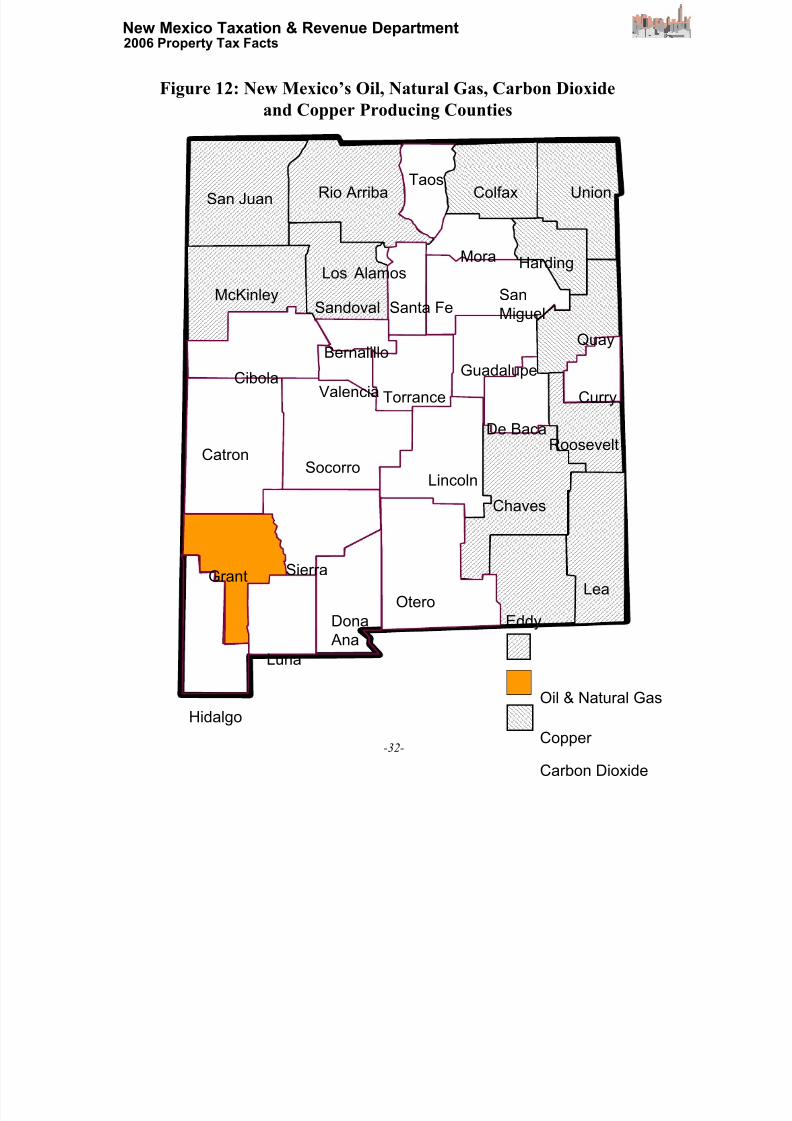
Chama 3.404 3.060 5.225 2.425 10,413,731 9,385,243 19,798,974 48,012,512
Cimarron 4.376 6.693 7.650 0.000 7,355,142 3,082,263 10,437,405 0
Clayton 4.938 4.938 4.938 2.712 12,627,098 8,736,080 21,363,178 57,936,939
Cloudcroft 0.979 1.811 2.225 5.425 24,085,497 8,196,236 32,281,733 175,128,402Clovis 3.725 3.725 3.725 3.925 226,699,203 102,067,370 328,766,573 1,290,408,799
Columbus 4.290 5.720 7.650 0.000 5,257,298 3,705,271 8,962,569 0
Corona 4.425 4.425 4.425 3.225 791,497 865,499 1,656,996 5,343,812
Corrales 1.973 3.774 5.870 1.780 249,915,423 25,580,466 275,495,889 490,382,682
Cuba 3.616 5.988 7.650 0.000 2,396,635 6,283,107 8,679,742 0
Deming 1.562 2.223 2.225 5.425 90,187,271 54,994,789 145,182,060 787,612,676
Des Moines 4.353 4.717 4.938 2.712 625,291 1,141,946 1,767,237 4,792,747
Dexter 1.268 2.250 2.225 5.425 4,369,323 1,691,372 6,060,695 32,879,270
Dora 1.507 2.225 2.225 5.425 457,749 144,047 601,796 3,264,743
Eagle Nest 0.574 1.542 2.225 5.425 6,921,185 4,991,112 11,912,297 64,624,211
Edgewood 0.947 1.000 1.000 6.650 39,534,757 19,055,324 58,590,081 389,624,039
Elephant Butte 2.225 2.225 2.225 5.425 27,975,804 12,913,523 40,889,327 221,824,599
Elida 1.415 2.114 2.225 5.425 744,716 578,287 1,323,003 7,177,291
Encino 2.225 1.754 2.225 5.425 325,507 421,384 746,891 4,051,884Espanola 3.003 3.512 7.650 0.000 76,350,600 61,692,602 138,043,202 0
Estancia 1.833 0.850 2.225 5.425 4,896,353 13,119,134 18,015,487 97,734,017
Eunice 7.317 7.241 7.650 0.000 7,709,662 3,269,287 10,978,949 0
Farmington 1.511 1.925 2.225 5.425 429,327,991 290,609,923 719,937,914 3,905,663,183
Floyd 1.894 2.225 2.225 5.425 329,679 165,971 495,650 2,688,901
Folsom 3.586 4.518 5.425 2.225 302,186 199,426 501,612 1,116,087
Fort Sumner 2.225 2.206 2.225 5.425 4,191,780 3,178,292 7,370,072 39,982,641
Gallup 4.935 7.650 7.650 0.000 169,973,750 133,449,126 303,422,876 0
Grady 7.650 7.650 7.650 0.000 289,312 86,380 375,692 0
Grants 4.247 4.555 4.555 3.095 46,910,218 52,807,519 99,717,737 308,626,396
Grenville 7.650 6.376 7.650 0.000 85,984 253,727 339,711 0
Hagerman 1.849 2.225 2.225 5.425 2,692,486 880,195 3,572,681 19,381,794
Hatch 3.964 4.154 5.500 2.150 6,023,694 6,449,526 12,473,220 26,817,423
Hobbs 4.996 5.555 5.555 2.095 141,307,897 116,517,297 257,825,194 540,143,781
Hope 5.503 7.650 7.650 0.000 319,989 358,388 678,377 0
House 3.554 7.650 7.650 0.000 327,696 155,717 483,413 0
Hurley 1.298 0.578 2.225 5.425 7,480,821 658,292 8,139,113 44,154,688
Jal 7.145 7.650 7.650 0.000 5,726,821 2,488,235 8,215,056 0
Jemez Springs 3.744 5.950 5.950 1.700 3,582,957 3,607,115 7,190,072 12,223,122
Lake Arthur 2.225 2.225 2.225 5.425 710,254 401,273 1,111,527 6,030,0341Imposed rate after application of the yield control limitation required by statute.
2Maximum 7.65 mills less rate imposed.
3Remaining rate authority multiplied by total net taxable value. Please see Figure 1 for a discussion of maximum rates that may be imposed.
-25-
8/14/2019 Property Values
http://slidepdf.com/reader/full/property-values 26/37
New Mexico Taxation and Revenue Department -- 2006 Property Tax Facts
Actual Operating Rate1
Rate Remaining Net Taxable Value: Potential
Municipality Residential Nonresidential Imposed Authority2
Residential Nonresidential Total Revenue3
Las Cruces 4.119 5.091 5.120 2.530 914,895,073 522,840,878 1,437,735,951 3,637,471,956
Las Vegas 7.175 7.650 7.650 0.000 68,127,563 45,492,713 113,620,276 0
Logan 6.016 7.175 7.650 0.000 8,903,053 4,599,898 13,502,951 0
Lordsburg 3.225 3.225 3.225 4.425 8,082,547 16,591,116 24,673,663 109,180,959
Los Alamos 3.288 4.051 4.938 2.712 590,694,760 97,608,133 688,302,893 1,866,677,446
Los Lunas 7.313 7.176 7.650 0.000 131,924,487 69,445,323 201,369,810 0
Los Ranchos 0.000 0.000 0.000 7.650 157,919,172 21,848,117 179,767,289 1,375,219,761
Loving 1.842 2.059 2.225 5.425 3,118,999 1,373,878 4,492,877 24,373,858
Lovington 4.974 5.650 5.650 2.000 33,270,464 13,301,636 46,572,100 93,144,200
Magdalena 0.703 2.225 2.225 5.425 3,147,542 1,332,240 4,479,782 24,302,817
Maxwell 4.245 7.650 7.650 0.000 1,549,201 440,846 1,990,047 0
Melrose 2.184 2.225 2.225 5.425 2,604,527 1,828,003 4,432,530 24,046,475
Mesilla 0.850 2.026 2.225 5.425 34,236,908 9,952,319 44,189,227 239,726,556
Milan 2.488 5.293 7.650 0.000 7,214,123 25,206,409 32,420,532 0
Moriarty 2.078 2.188 2.225 5.425 12,890,508 18,909,410 31,799,918 172,514,555
Mosquero 1.528 2.225 2.225 5.425 336,259 189,801 526,060 2,853,876
Mountainair 7.190 7.650 7.650 0.000 4,178,786 2,244,559 6,423,345 0
Pecos 0.471 0.984 2.225 5.425 10,826,038 3,397,942 14,223,980 77,165,092
Portales 3.225 3.225 3.225 4.425 61,591,448 28,215,772 89,807,220 397,396,949
Questa 3.400 4.531 5.225 2.425 13,614,952 5,832,765 19,447,717 47,160,714
Raton 4.521 7.650 7.650 0.000 53,181,350 28,778,435 81,959,785 0
Red River 6.226 6.709 7.650 0.000 22,868,526 14,120,492 36,989,018 0
Reserve 2.225 1.980 2.225 5.425 1,986,486 2,447,529 4,434,015 24,054,531
Rio Rancho 6.138 4.901 7.650 0.000 1,021,116,289 235,484,587 1,256,600,876 0
Roswell 7.351 7.650 7.650 0.000 282,577,302 160,183,690 442,760,992 0
Roy 1.304 2.225 2.225 5.425 984,213 554,201 1,538,414 8,345,896
Ruidoso 4.786 5.082 6.368 1.282 249,120,088 76,602,134 325,722,222 417,575,889
Ruidoso Downs 4.626 6.707 7.650 0.000 18,815,032 16,690,543 35,505,575 0
San Jon 4.030 7.650 7.650 0.000 675,794 637,075 1,312,869 0
San Ysidro 5.231 6.170 7.650 0.000 1,201,533 1,087,055 2,288,588 0
Santa Clara 0.679 1.261 2.225 5.425 8,602,469 1,771,201 10,373,670 56,277,160
Santa Fe 1.033 1.901 2.817 4.833 2,111,813,843 822,975,731 2,934,789,574 14,183,838,011
Santa Rosa 4.016 4.938 4.938 2.712 12,030,860 26,083,735 38,114,595 103,366,782
Silver City 1.063 2.225 2.225 5.425 97,510,920 61,327,924 158,838,844 861,700,729
Socorro 4.388 5.307 5.813 1.837 56,603,223 30,639,400 87,242,623 160,264,698
Springer 3.949 7.650 7.650 0.000 7,417,793 2,152,233 9,570,026 0
Sunland Park 2.705 3.191 3.775 3.875 57,218,905 57,962,486 115,181,391 446,327,890
T or C 1.378 2.225 2.225 5.425 46,214,037 25,766,175 71,980,212 390,492,650
Taos 2.344 3.513 4.225 3.425 100,963,859 97,368,146 198,332,005 679,287,117
Taos Ski Valley 2.536 4.000 4.000 3.650 23,366,482 10,268,939 33,635,421 122,769,287
Tatum 3.779 4.225 4.225 3.425 2,085,348 1,083,980 3,169,328 10,854,948
Texaco 2.225 2.225 2.225 5.425 3,141,637 1,525,484 4,667,121 25,319,131
Tijeras 0.867 2.075 2.225 5.425 5,815,453 2,726,646 8,542,099 46,340,887
Tucumcari 4.178 7.650 7.650 0.000 20,416,469 20,379,649 40,796,118 0
Tularosa 5.413 7.650 7.650 0.000 16,072,483 5,174,811 21,247,294 0Vaughn 6.922 7.650 7.650 0.000 2,471,671 4,059,399 6,531,070 0
Virden 1.578 2.225 2.225 5.425 431,206 334,775 765,981 4,155,447
Wagon Mound 4.543 3.315 7.650 0.000 1,996,190 1,300,098 3,296,288 0
Willard 5.225 4.781 5.225 2.425 743,067 449,462 1,192,529 2,891,883
Williamsburg 1.463 2.225 2.225 5.425 3,269,868 1,191,152 4,461,020 24,201,034
Total 15,680,791,321 6,909,008,369 22,589,799,690 76,492,646,8161Imposed rate after application of the yield control limitation required by statute.
2Maximum 7.65 mills less rate imposed.
3Remaining rate authority multiplied by total net taxable value. Please see Figure 1 for a discussion of maximum rates that may be imposed.
-26-
8/14/2019 Property Values
http://slidepdf.com/reader/full/property-values 27/37
New Mexico Taxation and Revenue Department -- 2006 Property Tax Facts
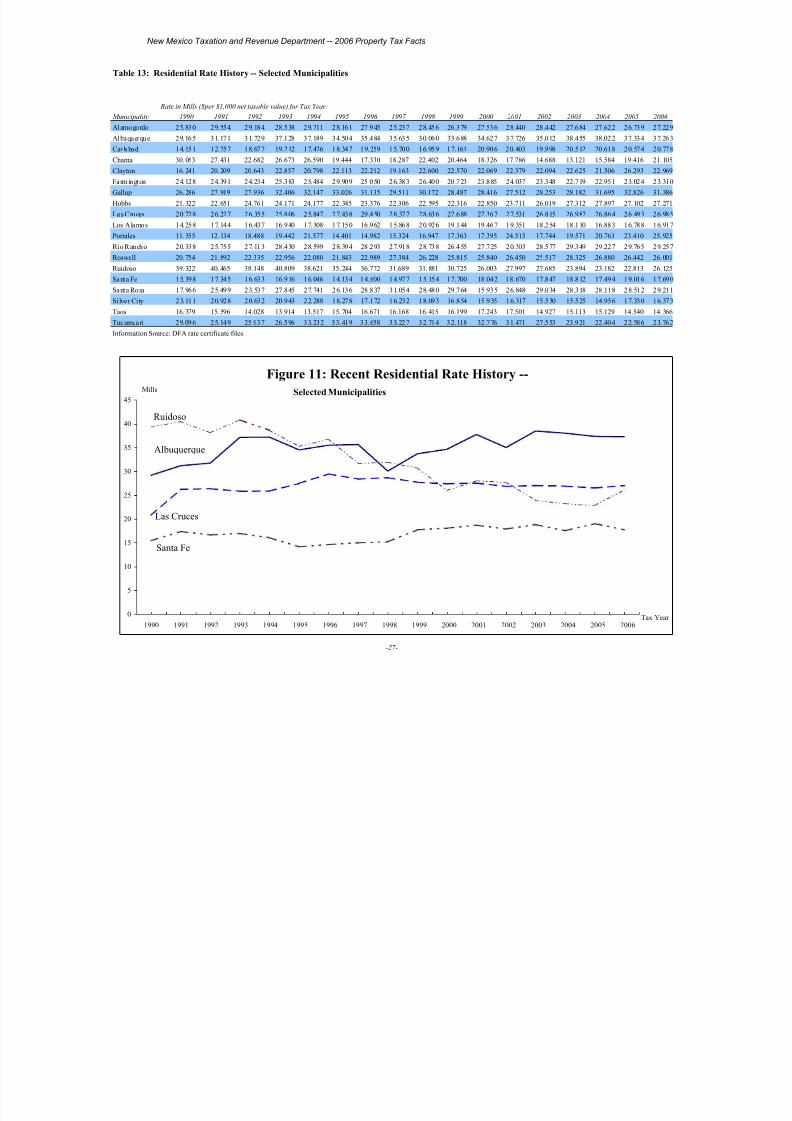
Table 13: Residential Rate History -- Selected Municipalities
Rate in Mills ($per $1,000 net taxable value) for Tax Year:
Municipality 1990 1991 1992 1993 1994 1995 1996 1997 1998 1999 2000 2001 2002 2003 2004 2005 20
Alamogordo 25.830 29.554 29.184 28.538 29.711 28.161 27.945 25.237 28.456 26.379 27.536 28.440 28.442 27.684 27.622 26.739 27.
Albuquerque 29.165 31.171 31.729 37.128 37.189 34.504 35.484 35.635 30.060 33.688 34.627 37.726 35.012 38.455 38.022 37.334 37.
Carlsbad 14.151 12.757 18.677 19.212 17.426 18.347 19.259 15.700 16.959 17.161 20.906 20.403 19.998 20.512 20.618 20.574 20.Chama 30.063 27.431 22.682 26.673 26.590 19.444 17.330 18.287 22.402 20.464 18.326 17.786 14.688 13.121 15.584 19.416 21.
Clayton 16.241 20.209 20.643 22.857 20.798 22.113 22.212 19.163 22.600 22.570 22.069 22.379 22.094 22.625 21.506 26.293 22.
Farmington 24.128 24.391 24.234 25.383 25.484 29.909 25.050 26.383 26.400 20.723 23.885 24.037 23.348 22.719 22.951 23.024 23.
Gallup 26.286 27.919 27.936 32.406 32.147 33.026 31.135 29.511 30.172 28.487 28.416 27.512 28.253 28.182 31.695 32.826 31.
Hobbs 21.322 22.651 24.761 24.171 24.177 22.345 23.376 22.306 22.595 22.316 22.850 23.711 26.019 27.312 27.897 27.102 27.
Las Cruces 20.728 26.227 26.355 25.806 25.847 27.438 29.450 28.377 28.636 27.688 27.367 27.531 26.815 26.987 26.864 26.493 26.
Los Alamos 14.258 17.144 16.437 16.940 17.308 17.150 16.962 15.868 20.926 19.144 19.467 19.351 18.254 18.110 16.883 16.788 16.
Portales 11.355 12.134 18.488 19.442 21.577 14.401 14.982 15.324 16.947 17.363 17.395 24.515 17.744 19.571 20.763 23.410 25.
Rio Rancho 20.338 25.755 27.113 28.430 28.599 28.394 28.293 27.918 28.738 26.455 27.725 20.303 28.577 29.349 29.227 29.765 29.
Roswell 20.754 21.892 22.335 22.956 22.080 21.843 22.989 27.384 26.228 25.815 25.840 26.450 25.517 28.325 26.880 26.442 26.
Ruidoso 39.322 40.465 38.148 40.809 38.621 35.244 36.772 31.689 31.881 30.725 26.003 27.997 27.685 23.894 23.182 22.813 26.
Santa Fe 15.398 17.345 16.633 16.916 16.046 14.134 14.600 14.977 15.154 17.700 18.042 18.670 17.847 18.812 17.494 19.016 17.
Santa Rosa 17.966 25.499 23.537 27.845 27.741 26.136 28.837 31.054 28.480 29.764 15.935 26.848 29.034 28.318 28.118 28.512 29.
Silver City 23.111 20.928 20.632 20.943 22.288 18.278 17.172 16.232 18.093 16.854 15.935 16.317 15.530 15.525 14.956 17.330 16.Taos 16.379 15.596 14.028 13.914 13.517 15.704 16.671 16.168 16.415 16.199 17.243 17.501 14.927 15.113 15.129 14.540 14.
Tucumcari 29.096 25.149 25.937 26.596 33.232 33.419 33.658 33.227 32.714 32.118 32.776 31.471 27.553 23.921 22.404 22.586 23.
nformation Source: DFA rate certificate files.
-27-
Figure 11: Recent Residential Rate History --
0
5
10
15
20
25
30
35
40
45
1990 1991 1992 1993 1994 1995 1996 1997 1998 1999 2000 2001 2002 2003 2004 2005 2006Tax Ye
Mills
Albuquerque
Santa Fe
Ruidoso
Las Cruces
Selected Municipalities
8/14/2019 Property Values
http://slidepdf.com/reader/full/property-values 28/37
New Mexico Taxation and Revenue Department -- 2006 Property Tax Facts
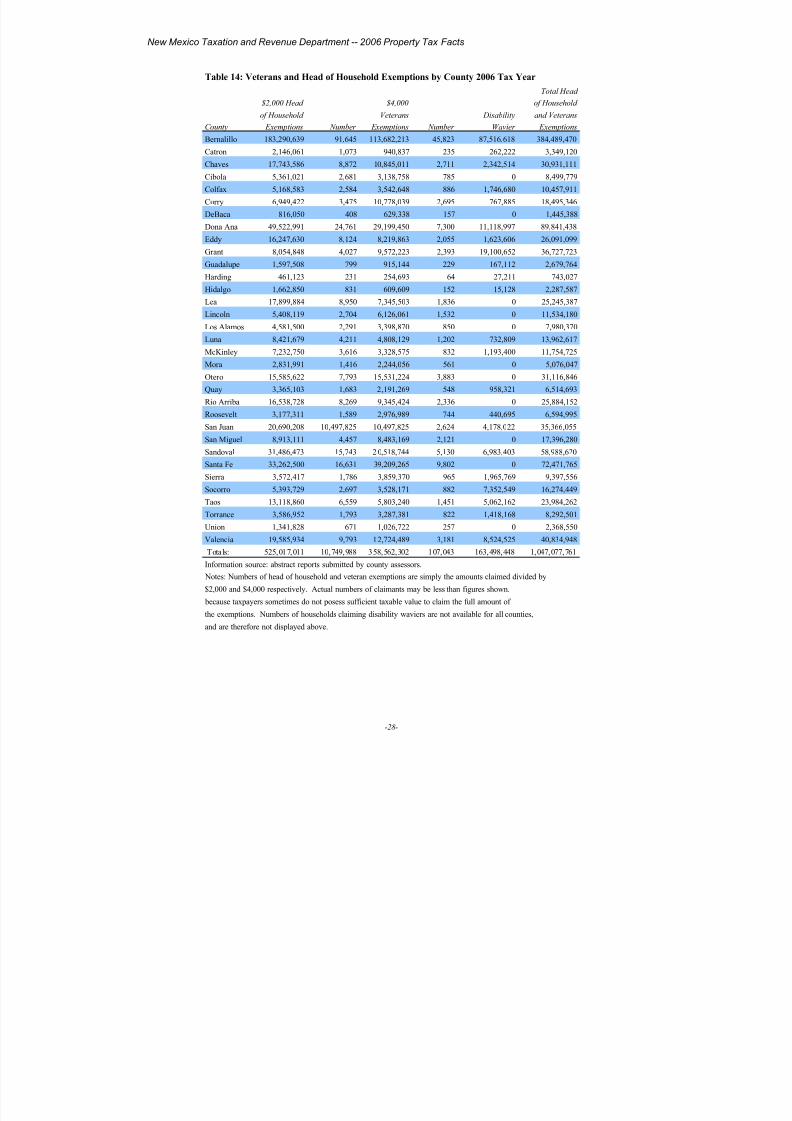
Table 14: Veterans and Head of Household Exemptions by County 2006 Tax Year
Total Head
$2,000 Head $4,000 of Household
of Household Veterans Disability and Veterans
County Exemptions Number Exemptions Number Wavier Exemptions
Bernalillo 183,290,639 91,645 113,682,213 45,823 87,516,618 384,489,470
Catron 2,146,061 1,073 940,837 235 262,222 3,349,120Chaves 17,743,586 8,872 10,845,011 2,711 2,342,514 30,931,111
Cibola 5,361,021 2,681 3,138,758 785 0 8,499,779
Colfax 5,168,583 2,584 3,542,648 886 1,746,680 10,457,911
Curry 6,949,422 3,475 10,778,039 2,695 767,885 18,495,346
DeBaca 816,050 408 629,338 157 0 1,445,388
Dona Ana 49,522,991 24,761 29,199,450 7,300 11,118,997 89,841,438
Eddy 16,247,630 8,124 8,219,863 2,055 1,623,606 26,091,099
Grant 8,054,848 4,027 9,572,223 2,393 19,100,652 36,727,723
Guadalupe 1,597,508 799 915,144 229 167,112 2,679,764
Harding 461,123 231 254,693 64 27,211 743,027
Hidalgo 1,662,850 831 609,609 152 15,128 2,287,587
Lea 17,899,884 8,950 7,345,503 1,836 0 25,245,387Lincoln 5,408,119 2,704 6,126,061 1,532 0 11,534,180
Los Alamos 4,581,500 2,291 3,398,870 850 0 7,980,370
Luna 8,421,679 4,211 4,808,129 1,202 732,809 13,962,617
McKinley 7,232,750 3,616 3,328,575 832 1,193,400 11,754,725
Mora 2,831,991 1,416 2,244,056 561 0 5,076,047
Otero 15,585,622 7,793 15,531,224 3,883 0 31,116,846
Quay 3,365,103 1,683 2,191,269 548 958,321 6,514,693
Rio Arriba 16,538,728 8,269 9,345,424 2,336 0 25,884,152
Roosevelt 3,177,311 1,589 2,976,989 744 440,695 6,594,995
San Juan 20,690,208 10,497,825 10,497,825 2,624 4,178,022 35,366,055
San Miguel 8,913,111 4,457 8,483,169 2,121 0 17,396,280
Sandoval 31,486,473 15,743 2 0,518,744 5,130 6,983,403 58,988,620Santa Fe 33,262,500 16,631 39,209,265 9,802 0 72,471,765
Sierra 3,572,417 1,786 3,859,370 965 1,965,769 9,397,556
Socorro 5,393,729 2,697 3,528,171 882 7,352,549 16,274,449
Taos 13,118,860 6,559 5,803,240 1,451 5,062,162 23,984,262
Torrance 3,586,952 1,793 3,287,381 822 1,418,168 8,292,501
Union 1,341,828 671 1,026,722 257 0 2,368,550
Valencia 19,585,934 9,793 12,724,489 3,181 8,524,525 40,834,948
Totals: 525,017,011 10,749,988 358,562,302 107,043 163,498,448 1,047,077,761
Information source: abstract reports submitted by county assessors.
Notes: Numbers of head of household and veteran exemptions are simply the amounts claimed divided by
$2,000 and $4,000 respectively. Actual numbers of claimants may be less than figures shown.
because taxpayers sometimes do not posess sufficient taxable value to claim the full amount of
the exemptions. Numbers of households claiming disability waviers are not available for all counties,
and are therefore not displayed above.
-28-
8/14/2019 Property Values
http://slidepdf.com/reader/full/property-values 29/37
New Mexico Taxation and Revenue Department -- 2006 Property Tax Facts
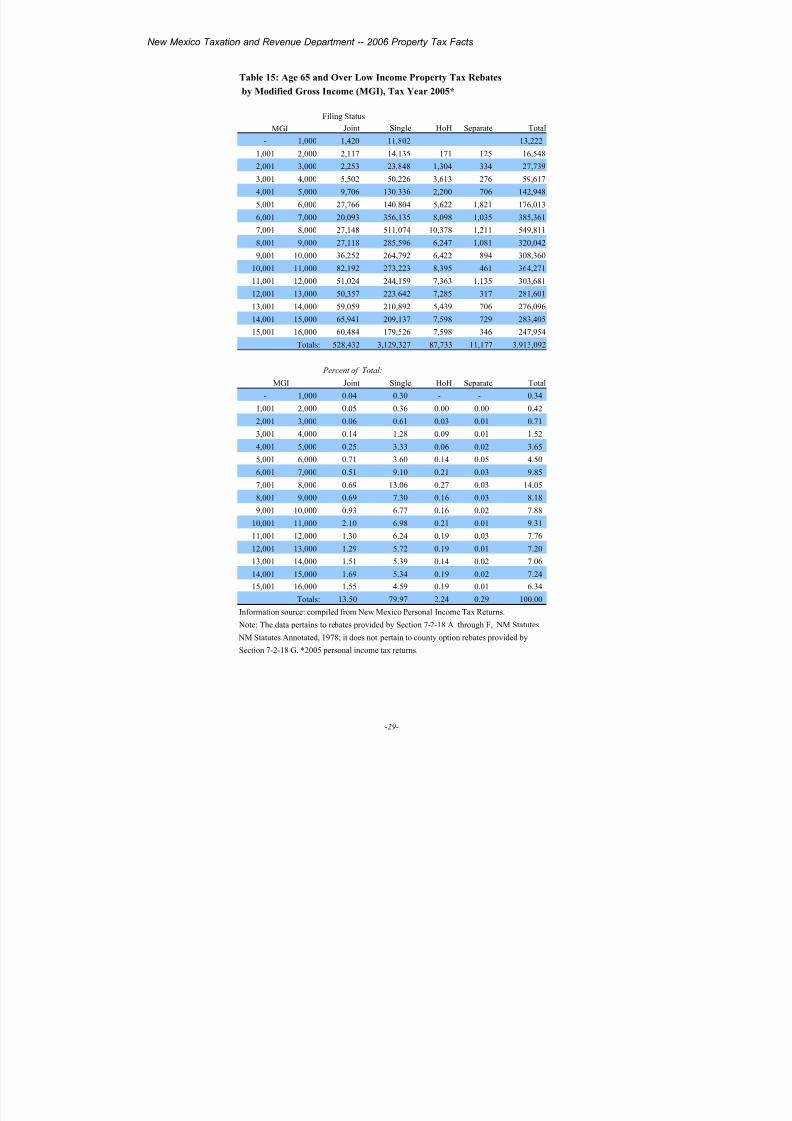
Table 15: Age 65 and Over Low Income Property Tax Rebates
by Modified Gross Income (MGI), Tax Year 2005*
Filing Status
Joint Single HoH Separate Total
- 1,000 1,420 11,802 13,222
1,001 2,000 2,117 14,135 171 125 16,548
2,001 3,000 2,253 23,848 1,304 334 27,739
3,001 4,000 5,502 50,226 3,613 276 59,617
4,001 5,000 9,706 130,336 2,200 706 142,948
5,001 6,000 27,766 140,804 5,622 1,821 176,013
6,001 7,000 20,093 356,135 8,098 1,035 385,361
7,001 8,000 27,148 511,074 10,378 1,211 549,811
8,001 9,000 27,118 285,596 6,247 1,081 320,042
9,001 10,000 36,252 264,792 6,422 894 308,360
10,001 11,000 82,192 273,223 8,395 461 364,271
11,001 12,000 51,024 244,159 7,363 1,135 303,681
12,001 13,000 50,357 223,642 7,285 317 281,601
13,001 14,000 59,059 210,892 5,439 706 276,096
14,001 15,000 65,941 209,137 7,598 729 283,405
15,001 16,000 60,484 179,526 7,598 346 247,954
Totals: 528,432 3,129,327 87,733 11,177 3,913,092
Percent of Total:
MGI Joint Single HoH Separate Total
- 1,000 0.04 0.30 - - 0.34
1,001 2,000 0.05 0.36 0.00 0.00 0.42
2,001 3,000 0.06 0.61 0.03 0.01 0.71
3,001 4,000 0.14 1.28 0.09 0.01 1.52
4,001 5,000 0.25 3.33 0.06 0.02 3.65
5,001 6,000 0.71 3.60 0.14 0.05 4.50
6,001 7,000 0.51 9.10 0.21 0.03 9.85
7,001 8,000 0.69 13.06 0.27 0.03 14.05
8,001 9,000 0.69 7.30 0.16 0.03 8.18
9,001 10,000 0.93 6.77 0.16 0.02 7.88
10,001 11,000 2.10 6.98 0.21 0.01 9.31
11,001 12,000 1.30 6.24 0.19 0.03 7.76
12,001 13,000 1.29 5.72 0.19 0.01 7.20
13,001 14,000 1.51 5.39 0.14 0.02 7.06
14,001 15,000 1.69 5.34 0.19 0.02 7.24
15,001 16,000 1.55 4.59 0.19 0.01 6.34
Totals: 13.50 79.97 2.24 0.29 100.00
Information source: compiled from New Mexico Personal Income Tax Returns.
Note: The data pertains to rebates provided by Section 7-2-18 A through F, NM Statutes
NM Statutes Annotated, 1978; it does not pertain to county option rebates provided by
Section 7-2-18 G. *2005 personal income tax returns.
-29-
MGI

8/14/2019 Property Values
http://slidepdf.com/reader/full/property-values 30/37
New Mexico Taxation and Revenue Department -- 2006 Property Tax Facts
Table 16: Number of Returns Claiming Age 65 & Over Low Income
Property Tax Rebates by MGI, Tax Year 2005*
Filing Status
Joint Single HoH Separate Total
1,000 8 58 66
1,001 2,000 11 85 2 1 99
2,001 3,000 16 156 7 5 184
3,001 4,000 31 305 15 4 355
4,001 5,000 50 744 11 6 811
5,001 6,000 135 769 28 19 951
6,001 7,000 110 2,004 42 14 2,170
7,001 8,000 149 2,909 53 14 3,125
8,001 9,000 156 1,501 31 12 1,700
9,001 10,000 194 1,382 39 9 1,624
10,001 11,000 454 1,470 38 5 1,967
11,001 12,000 270 1,277 36 12 1,595
12,001 13,000 250 1,159 36 4 1,449
13,001 14,000 308 1,092 29 8 1,437
14,001 15,000 339 1,046 36 6 1,427
15,001 16,000 314 913 36 5 1,268
Totals: 2,795 16,870 439 124 20,228
Percent of Total:
Joint Single HOH Separate Total
1,000 0.13 1.53 0.21 0.02 1.88
1,001 2,000 0.15 2.44 0.52 0.03 3.13
2,001 3,000 0.20 3.09 0.87 0.02 4.18
3,001 4,000 0.28 3.41 1.13 0.03 4.85
4,001 5,000 0.38 4.00 1.39 0.03 5.80
5,001 6,000 0.46 4.04 1.49 0.04 6.02
6,001 7,000 0.59 8.66 1.81 0.06 11.12
7,001 8,000 0.66 4.63 1.86 0.04 7.20
8,001 9,000 0.72 4.29 2.08 0.04 7.13
9,001 10,000 0.91 4.16 2.11 0.05 7.23
10,001 11,000 1.08 3.96 2.23 0.05 7.31
11,001 12,000 1.05 3.69 2.35 0.04 7.14
12,001 13,000 1.10 3.46 2.27 0.04 6.88
13,001 14,000 1.12 3.33 2.38 0.04 6.87
14,001 15,000 1.20 3.13 2.28 0.03 6.63
15,001 16,000 1.23 3.08 2.28 0.04 6.64
Totals: 11.25 60.89 27.26 0.60 100.00
Information source: compiled from New Mexico Personal Income Tax Returns.
Note: The data pertains to rebates provided by Section 7-2-18 A through F, NM Statut
NM Statutes Annotated, 1978; it does not pertain to county option rebates provided by
Section 7-2-18 G. *2005 personal income tax returns.
-30-
MGI
MGI
8/14/2019 Property Values
http://slidepdf.com/reader/full/property-values 31/37
New Mexico Taxation and Revenue Department -- 2006 Property Tax Facts
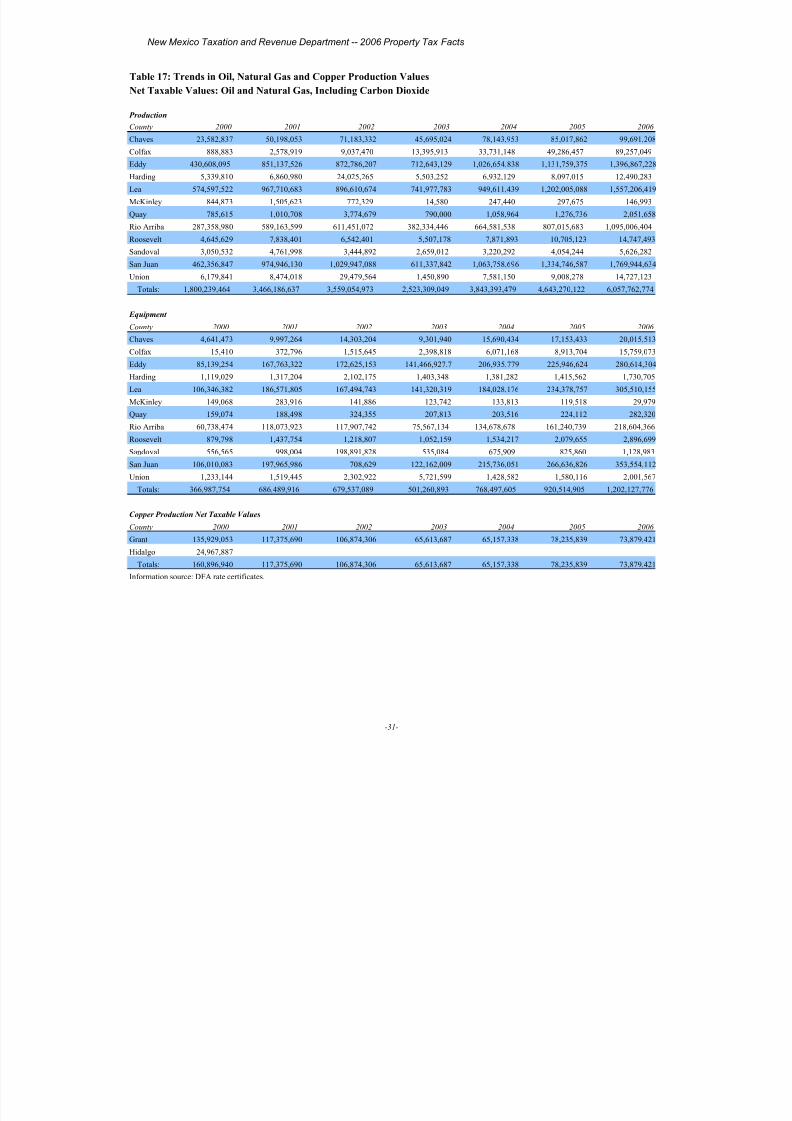
Table 17: Trends in Oil, Natural Gas and Copper Production Values
Net Taxable Values: Oil and Natural Gas, Including Carbon Dioxide
Production
County 2000 2001 2002 2003 2004 2005 2006
Chaves 23,582,837 50,198,053 71,183,332 45,695,024 78,143,953 85,017,862 99,691,208
Colfax 888,883 2,578,919 9,037,470 13,395,913 33,731,148 49,286,457 89,257,049
Eddy 430,608,095 851,137,526 872,786,207 712,643,129 1,026,654,838 1,131,759,375 1,396,867,228
Harding 5,339,810 6,860,980 24,025,265 5,503,252 6,932,129 8,097,015 12,490,283
Lea 574,597,522 967,710,683 896,610,674 741,977,783 949,611,439 1,202,005,088 1,557,206,419
McKinley 844,873 1,505,623 772,329 14,580 247,440 297,675 146,993
Quay 785,615 1,010,708 3,774,679 790,000 1,058,964 1,276,736 2,051,658
Rio Arriba 287,358,980 589,163,599 611,451,072 382,334,446 664,581,538 807,015,683 1,095,006,404
Roosevelt 4,645,629 7,838,401 6,542,401 5,507,178 7,871,893 10,705,123 14,747,493
Sandoval 3,050,532 4,761,998 3,444,892 2,659,012 3,220,292 4,054,244 5,626,282
San Juan 462,356,847 974,946,130 1,029,947,088 611,337,842 1,063,758,696 1,334,746,587 1,769,944,634
Union 6,179,841 8,474,018 29,479,564 1,450,890 7,581,150 9,008,278 14,727,123
Totals: 1,800,239,464 3,466,186,637 3,559,054,973 2,523,309,049 3,843,393,479 4,643,270,122 6,057,762,774
Equipment
County 2000 2001 2002 2003 2004 2005 2006
Chaves 4,641,473 9,997,264 14,303,204 9,301,940 15,690,434 17,153,433 20,015,513
Colfax 15,410 372,796 1,515,645 2,398,818 6,071,168 8,913,704 15,759,073
Eddy 85,139,254 167,763,322 172,625,153 141,466,927.7 206,935,779 225,946,624 280,614,304
Harding 1,119,029 1,317,204 2,102,175 1,403,348 1,381,282 1,415,562 1,730,705
Lea 106,346,382 186,571,805 167,494,743 141,320,319 184,028,176 234,378,757 305,510,155
McKinley 149,068 283,916 141,886 123,742 133,813 119,518 29,979
Quay 159,074 188,498 324,355 207,813 203,516 224,112 282,320
Rio Arriba 60,738,474 118,073,923 117,907,742 75,567,134 134,678,678 161,240,739 218,604,366
Roosevelt 879,798 1,437,754 1,218,807 1,052,159 1,534,217 2,079,655 2,896,699
Sandoval 556,565 998,004 198,891,828 535,084 675,909 825,860 1,128,983San Juan 106,010,083 197,965,986 708,629 122,162,009 215,736,051 266,636,826 353,554,112
Union 1,233,144 1,519,445 2,302,922 5,721,599 1,428,582 1,580,116 2,001,567
Totals: 366,987,754 686,489,916 679,537,089 501,260,893 768,497,605 920,514,905 1,202,127,776
Copper Production Net Taxable Values
County 2000 2001 2002 2003 2004 2005 2006
Grant 135,929,053 117,375,690 106,874,306 65,613,687 65,157,338 78,235,839 73,879,421
Hidalgo 24,967,887
Totals: 160,896,940 117,375,690 106,874,306 65,613,687 65,157,338 78,235,839 73,879,421
Information source: DFA rate certificates.
-31-
8/14/2019 Property Values
http://slidepdf.com/reader/full/property-values 32/37
New Mexico Taxation & Revenue Department2006 Property Tax Facts
San Juan
McKinley Sandoval
Rio Arriba
Eddy
Lea
Chaves
Roosevelt
Union
Harding
Quay
Grant
Hidalgo
Taos
Mora
Colfax
Los
Santa Fe SanMiguel
CibolaTorrance
Catron
Guadalupe
Socorro
Curry
Lincoln
De Baca
OteroDonaAna
Sierra
Luna
Valencia
Bernalillo
Figure 12: New Mexico’s Oil, Natural Gas, Carbon Dioxide
and Copper Producing Counties
Oil & Natural Gas
Carbon Dioxide
Copper
Alamos
-32-
8/14/2019 Property Values
http://slidepdf.com/reader/full/property-values 33/37
New Mexico Taxation and Revenue Department -- 2006 Property Tax Facts
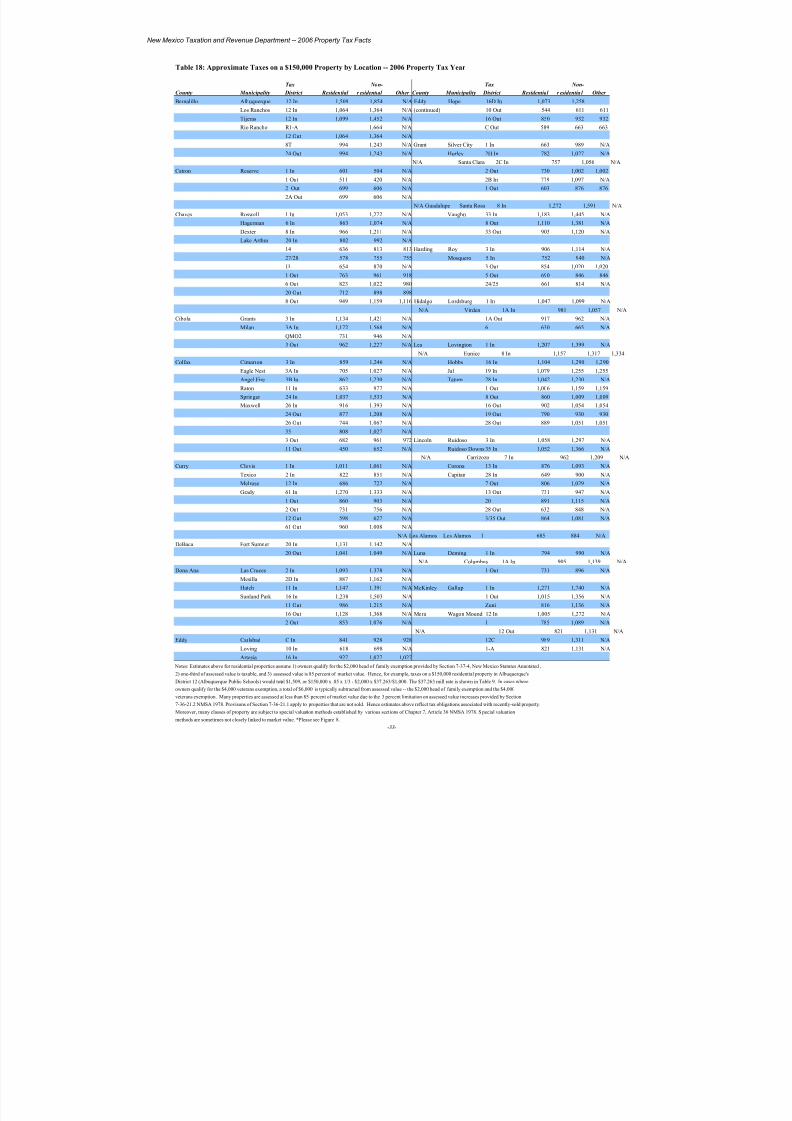
Table 18: Approximate Taxes on a $150,000 Property by Location -- 2006 Property Tax Year
Tax Non- Tax Non-
County Municipality District Residential r esidential Other County Municipality District Residential r esidentia l Other
Bernalillo Albuquerque 12 In 1,509 1,854 N/A Eddy Hope 16D In 1,073 1,258
Los Ranchos 12 In 1,064 1,364 N/A (continued) 10 Out 544 611 611
Tijeras 12 In 1,099 1,452 N/A 16 Out 850 932 932
Rio Rancho R1-A 1,664 N/A C Out 589 663 663
12 Out 1,064 1,364 N/A
8T 994 1,243 N/A Grant Silver City 1 In 663 989 N/A
24 Out 994 1,243 N/A Hurley 2H In 782 1,027 N/A
N/A Santa Clara 2C In 757 1,056 N/A
Catron Reserve 1 In 601 504 N/A 2 Out 730 1,002 1,002
1 Out 511 420 N/A 2B In 779 1,097 N/A
2 Out 699 606 N/A 1 Out 603 876 876
2A Out 699 606 N/A
N/A Guadalupe Santa Rosa 8 In 1,272 1,591 N/A
Chaves Roswell 1 In 1,053 1,272 N/A Vaughn 33 In 1,183 1,445 N/A
Hagerman 6 In 863 1,074 N/A 8 Out 1,110 1,381 N/A
Dexter 8 In 966 1,211 N/A 33 Out 903 1,120 N/A
Lake Arthur 20 In 802 992 N/A
14 636 813 813 Harding Roy 3 In 906 1,114 N/A
27/28 578 755 755 Mosquero 5 In 752 940 N/A
1L 654 870 N/A 3 Out 854 1,020 1,020
1 Out 763 961 918 5 Out 690 846 846
6 Out 823 1,022 980 24/25 661 814 N/A
20 Out 712 898 898
8 Out 949 1,159 1,116 Hidalgo Lordsburg 1 In 1,047 1,099 N/A N/A Virden 1A In 981 1,057 N/A
Cibola Grants 3 In 1,134 1,421 N/A 1A Out 917 962 N/A
Milan 3A In 1,172 1,568 N/A 6 630 665 N/A
QMO2 731 946 N/A
3 Out 962 1,227 N/A Lea Lovington 1 In 1,207 1,399 N/A
N/A Eunice 8 In 1,157 1,317 1,334
Colfax Cimarron 3 In 859 1,246 N/A Hobbs 16 In 1,104 1,290 1,290
Eagle Nest 3A In 705 1,027 N/A Jal 19 In 1,079 1,255 1,255
Angel Fire 3B In 862 1,230 N/A Tatum 28 In 1,042 1,230 N/A
Raton 11 In 633 977 N/A 1 Out 1,006 1,159 1,159
Springer 24 In 1,037 1,533 N/A 8 Out 860 1,009 1,009
Maxwell 26 In 916 1,393 N/A 16 Out 902 1,054 1,054
24 Out 877 1,208 N/A 19 Out 790 930 930
26 Out 744 1,067 N/A 28 Out 889 1,051 1,051
35 808 1,027 N/A
3 Out 682 961 972 Lincoln Ruidoso 3 In 1,058 1,297 N/A
11 Out 450 652 N/A Ruidoso Downs 35 In 1,052 1,366 N/A
N/A Carrizozo 7 In 962 1,209 N/A
Curry Clovis 1 In 1,011 1,061 N/A Corona 13 In 876 1,093 N/A
Texico 2 In 822 851 N/A Capitan 28 In 649 900 N/A
Melrose 12 In 686 722 N/A 7 Out 806 1,029 N/A
Grady 61 In 1,270 1,333 N/A 13 Out 731 947 N/A
1 Out 860 903 N/A 20 891 1,115 N/A
2 Out 731 756 N/A 28 Out 632 848 N/A
12 Out 598 627 N/A 3/35 Out 864 1,081 N/A
61 Out 960 1,008 N/A
N/A Los Alamos Los Alamos 1 685 884 N/A
DeBaca Fort Sumner 20 In 1,131 1,142 N/A
20 Out 1,041 1,049 N/A Luna Deming 1 In 794 990 N/A
N/A Columbus 1A In 905 1,139 N/A
Dona Ana Las Cruces 2 In 1,093 1,378 N/A 1 Out 731 896 N/A
Mesilla 2D In 887 1,162 N/A
Hatch 11 In 1,147 1,391 N/A McKinley Gallup 1 In 1,271 1,740 N/A
Sunland Park 16 In 1,238 1,503 N/A 1 Out 1,015 1,356 N/A
11 Out 986 1,215 N/A Zuni 816 1,136 N/A16 Out 1,128 1,368 N/A Mora Wagon Mound 12 In 1,005 1,272 N/A
2 Out 853 1,076 N/A 1 785 1,089 N/A
N/A 12 Out 821 1,131 N/A
Eddy Carlsbad C In 841 928 928 12C 989 1,311 N/A
Loving 10 In 618 698 N/A 1-A 821 1,131 N/A
Artesia 16 In 927 1,027 1,027
Notes: Estimates above for residential properties assume 1) owners qualify for the $2,000 head of family exemption provided by Section 7-37-4, New Mexico Statutes Annotated ,
2) one-third of assessed value is taxable, and 3) assessed value is 85 percent of market value. Hence, for example, taxes on a $150,000 residential property in Albuquerque's
District 12 (Albuquerque Public Schools) would total $1,509, or $150,000 x .85 x 1/3 - $2,000 x $37.263/$1,000. The $37.263 mill rate is shown in Table 9. In cases where
owners qualify for the $4,000 veterans exemption, a total of $6,000 is typically subtracted from assessed value -- the $2,000 head of family exemption and the $4,000
veterans exemption. Many properties are assessed at less than 85 percent of market value due to the 3 percent limitation on assessed value increases provided by Section
7-36-21.2 NMSA 1978. Provisons of Section 7-36-21.1 apply to properties that are not sold. Hence estimates above reflect tax obligations associated with recently-sold property.
Moreover, many classes of property are subject to special valuation methods established by various sections of Chapter 7, Article 36 NMSA 1978. S pecial valuation
methods are sometimes not closely linked to market value. *Please see Figure 8.
-33-
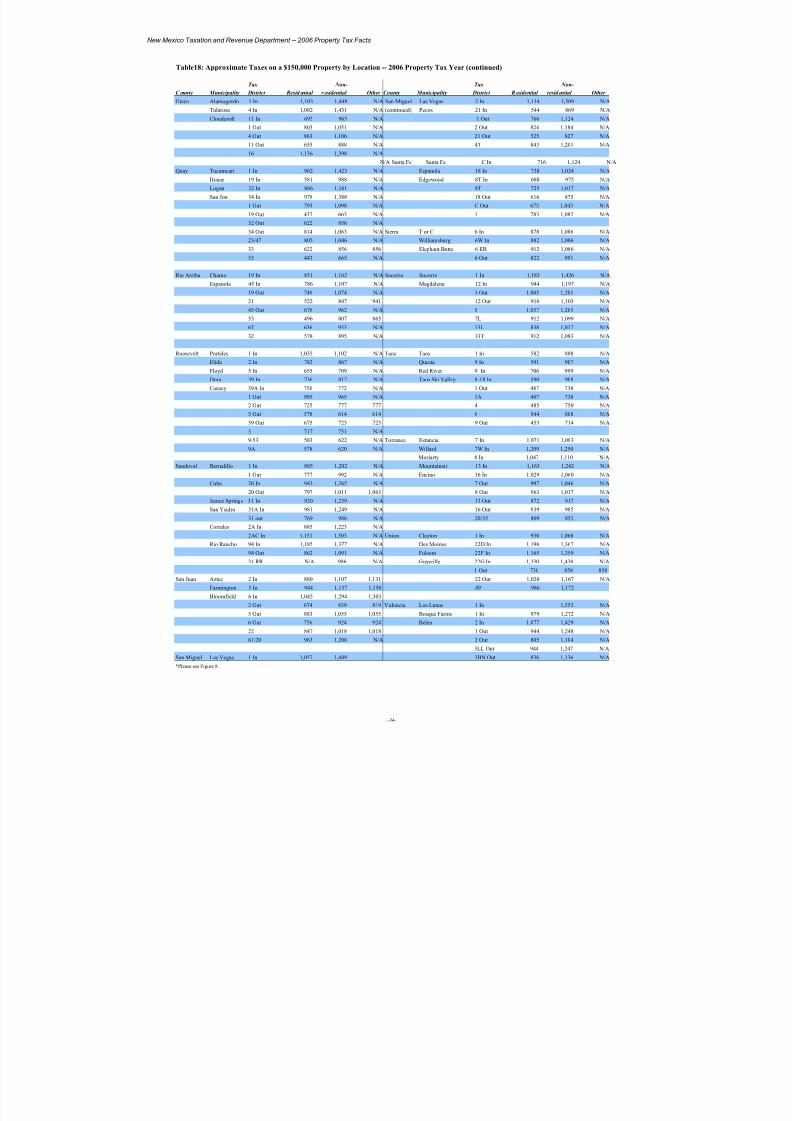
8/14/2019 Property Values
http://slidepdf.com/reader/full/property-values 34/37
New Mexico Taxation and Revenue Department -- 2006 Property Tax Facts
Table18: Approximate Taxes on a $150,000 Property by Location -- 2006 Property Tax Year (continued)
Tax Non- Tax Non-
C ounty Municipality District Resid ential r esidential Other County Municipality District R esidential resid ential Other
Otero Alamogordo 1 In 1,103 1,448 N/A San Miguel Las Vegas 2 In 1,114 1,509 N/A
Tularosa 4 In 1,082 1,431 N/A (continued) Pecos 21 In 544 869 N/A
Cloudcroft 11 In 695 965 N/A 1 Out 766 1,124 N/A
1 Out 803 1,051 N/A 2 Out 824 1,184 N/A
4 Out 863 1,106 N/A 21 Out 525 827 N/A
11 Out 655 888 N/A 43 843 1,201 N/A
16 1,136 1,398 N/A
N/A Santa Fe Santa Fe C In 716 1,124 N/A
Quay Tucumcari 1 In 962 1,423 N/A Espanola 18 In 738 1,024 N/A
House 19 In 581 988 N/A Edgewood 8T In 688 975 N/A
Logan 32 In 866 1,161 N/A 8T 725 1,017 N/A
San Jon 34 In 978 1,388 N/A 18 Out 616 875 N/A
1 Out 793 1,098 N/A C Out 675 1,043 N/A
19 Out 437 663 N/A 1 783 1,082 N/A
32 Out 622 856 N/A
34 Out 814 1,063 N/A Sierra T or C 6 In 878 1,086 N/A
23/47 805 1,046 N/A Williamsburg 6W In 882 1,086 N/A
33 622 856 856 Elephant Butte 6 EB 912 1,086 N/A
53 443 665 N/A 6 Out 822 991 N/A
Rio Arriba Chama 19 In 851 1,162 N/A Socorro Socorro 1 In 1,183 1,426 N/A
Espanola 45 In 786 1,107 N/A Magdalena 12 In 944 1,197 N/A
19 Out 749 1,074 N/A 1 Out 1,005 1,201 N/A
21 522 847 941 12 Out 916 1,103 N/A45 Out 676 962 N/A 5 1,057 1,265 N/A
53 496 807 865 7L 912 1,099 N/A
6T 636 953 N/A 13L 838 1,017 N/A
32 578 895 N/A 13T 912 1,083 N/A
Roosevelt Portales 1 In 1,035 1,102 N/A Taos Taos 1 In 582 888 N/A
Elida 2 In 782 867 N/A Questa 9 In 591 907 N/A
Floyd 5 In 655 709 N/A Red River 9 In 706 999 N/A
Dora 39 In 736 817 N/A Taos Ski Valley 8-18 In 590 908 N/A
Causey 39A In 750 772 N/A 1 Out 487 738 N/A
1 Out 905 965 N/A 1A 487 738 N/A
2 Out 725 777 777 4 485 750 N/A
5 Out 578 614 614 6 544 808 N/A
39 Out 675 723 723 9 Out 453 714 N/A
3 717 751 N/A
9/53 583 622 N/A Torrance Estancia 7 In 1,071 1,083 N/A
9A 578 620 N/A Willard 7W In 1,209 1,250 N/A
Moriarty 8 In 1,047 1,110 N/A
Sandoval Bernalillo 1 In 885 1,202 N/A Mountainair 13 In 1,163 1,242 N/A
1 Out 777 992 N/A Encino 16 In 1,029 1,060 N/A
Cuba 20 In 943 1,265 N/A 7 Out 997 1,046 N/A
20 Out 797 1,011 1,063 8 Out 963 1,017 N/A
Jemez Springs 31 In 920 1,239 N/A 13 Out 872 917 N/A
San Ysidro 31A In 981 1,249 N/A 16 Out 939 985 N/A
31 out 769 986 N/A 20/35 809 851 N/A
Corrales 2A In 885 1,223 N/A
2AC In 1,151 1,503 N/A Union Clayton 1 In 930 1,068 N/A
Rio Rancho 94 In 1,185 1,377 N/A Des Moines 22D In 1,196 1,367 N/A
94 Out 862 1,091 N/A Folsom 22F In 1,165 1,359 N/A
31 RR N/A 986 N/A Grenville 22G In 1,330 1,438 N/A
1 Out 730 858 858
San Juan Aztec 2 In 880 1,107 1,131 22 Out 1,020 1,167 N/A
Farmington 5 In 944 1,137 1,150 49 986 1,172
Bloomfield 6 In 1,045 1,294 1,303
2 Out 674 839 839 Valencia Los Lunas 1 In 1,553 N/A5 Out 883 1,055 1,055 Bosque Farms 1 In 979 1,272 N/A
6 Out 756 924 924 Belen 2 In 1,077 1,429 N/A
22 847 1,018 1,018 1 Out 944 1,248 N/A
61/20 963 1,208 N/A 2 Out 805 1,104 N/A
3LL Out 944 1,247 N/A
San Miguel Las Vegas 1 In 1,057 1,449 3BN Out 836 1,136 N/A
*Please see Figure 8.
-34-

8/14/2019 Property Values
http://slidepdf.com/reader/full/property-values 35/37
New Mexico Taxation and Revenue Department -- 2006 Property Tax Facts
Table 19: State Assessed1
Property Values and Obligations by County,
2006 Tax Year
Obligations
State from State Percent
State Assessed Percent of Percent of Assessed Percent of of County
Net Taxable Value State Total County Value
2
Properties State Total Obligations
3
Bernalillo 446,277,809 12.4 3.8 18,268,761 19.5 4.2
Catron 18,478,146 0.5 21.1 223,819 0.2 18.6
Chaves 105,359,761 2.9 12.6 2,556,476 2.7 12.3
Cibola 42,576,224 1.2 18.2 1,259,927 1.3 18.1
Colfax 29,326,826 0.8 5.4 691,433 0.7 6.0
Curry 61,247,528 1.7 12.5 1,325,330 1.4 11.6
Debaca 21,208,575 0.6 50.9 525,619 0.6 49.9
Dona Ana 176,523,857 4.9 6.4 5,502,989 5.9 7.3
Eddy 373,365,579 10.4 14.5 7,035,549 7.5 14.6
Grant 39,617,018 1.1 7.1 873,840 0.9 8.2
Guadalupe 33,029,210 0.9 35.8 1,024,646 1.1 34.4Harding 4,190,351 0.1 12.4 85,949 0.1 12.4
Hidalgo 73,593,826 2.0 59.9 1,618,393 1.7 60.5
Lea 199,687,008 5.5 7.9 5,125,248 5.5 7.9
Lincoln 52,025,957 1.4 7.2 1,293,814 1.4 7.8
Los Alamos 7,688,420 0.2 1.1 159,832 0.2 1.3
Luna 80,425,358 2.2 21.9 1,713,359 1.8 22.7
Mckinley 235,908,676 6.5 37.5 7,579,810 8.1 36.4
Mora 10,248,002 0.3 13.9 276,213 0.3 16.7
Otero 56,944,470 1.6 8.0 1,532,341 1.6 8.5
Quay 27,879,363 0.8 22.9 700,551 0.7 24.2
Rio Arriba 107,973,887 3.0 5.6 2,246,833 2.4 5.6Roosevelt 42,974,643 1.2 17.1 883,614 0.9 16.1
San Juan 923,126,097 25.6 21.4 21,399,554 22.8 22.4
San Miguel 24,201,067 0.7 5.9 673,353 0.7 6.9
Sandoval 87,446,837 2.4 4.2 2,329,584 2.5 4.2
Santa Fe 90,254,347 2.5 1.7 1,084,696 1.2 1.0
Sierra 21,864,136 0.6 10.4 516,417 0.6 10.9
Socorro 27,774,186 0.8 14.7 763,142 0.8 14.1
Taos 44,488,291 1.2 5.0 807,237 0.9 6.0
Torrance 59,519,948 1.7 23.4 1,404,484 1.5 22.8
Union 25,428,073 0.7 22.8 602,747 0.6 24.5
Valencia 55,597,402 1.5 6.3 1,660,636 1.8 7.3
Totals 3,606,250,878 100.0 8.4 93,746,197 100.0 8.2
Information source: calculated from data provided by the New Mexico Taxation and Revenue
Department's Property Tax Division and DFA property tax rate certificates.1Assessed by the NM
Taxation and Revenue Department's State Assessed Property Bureau.2Percent of total net taxable value
in county.3Percent of total property tax obligations among property owners in county
-35-
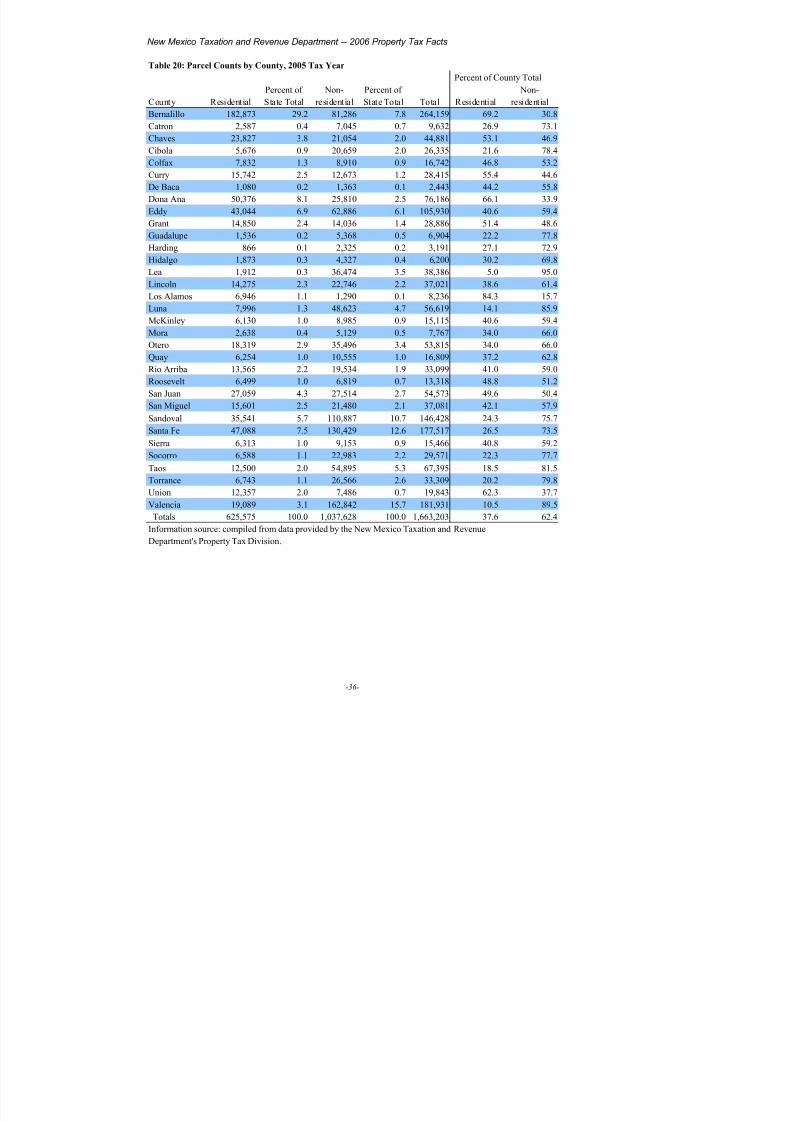
8/14/2019 Property Values
http://slidepdf.com/reader/full/property-values 36/37
New Mexico Taxation and Revenue Department -- 2006 Property Tax Facts
Table 20: Parcel Counts by County, 2005 Tax Year
Percent of County Total
Percent of Non- Percent of Non-
County Residential State Total residential State Total Total Residential residential
Bernalillo 182,873 29.2 81,286 7.8 264,159 69.2 30.8
Catron 2,587 0.4 7,045 0.7 9,632 26.9 73.1
Chaves 23,827 3.8 21,054 2.0 44,881 53.1 46.9
Cibola 5,676 0.9 20,659 2.0 26,335 21.6 78.4Colfax 7,832 1.3 8,910 0.9 16,742 46.8 53.2
Curry 15,742 2.5 12,673 1.2 28,415 55.4 44.6
De Baca 1,080 0.2 1,363 0.1 2,443 44.2 55.8
Dona Ana 50,376 8.1 25,810 2.5 76,186 66.1 33.9
Eddy 43,044 6.9 62,886 6.1 105,930 40.6 59.4
Grant 14,850 2.4 14,036 1.4 28,886 51.4 48.6
Guadalupe 1,536 0.2 5,368 0.5 6,904 22.2 77.8
Harding 866 0.1 2,325 0.2 3,191 27.1 72.9
Hidalgo 1,873 0.3 4,327 0.4 6,200 30.2 69.8
Lea 1,912 0.3 36,474 3.5 38,386 5.0 95.0
Lincoln 14,275 2.3 22,746 2.2 37,021 38.6 61.4
Los Alamos 6,946 1.1 1,290 0.1 8,236 84.3 15.7
Luna 7,996 1.3 48,623 4.7 56,619 14.1 85.9
McKinley 6,130 1.0 8,985 0.9 15,115 40.6 59.4
Mora 2,638 0.4 5,129 0.5 7,767 34.0 66.0
Otero 18,319 2.9 35,496 3.4 53,815 34.0 66.0
Quay 6,254 1.0 10,555 1.0 16,809 37.2 62.8
Rio Arriba 13,565 2.2 19,534 1.9 33,099 41.0 59.0
Roosevelt 6,499 1.0 6,819 0.7 13,318 48.8 51.2
San Juan 27,059 4.3 27,514 2.7 54,573 49.6 50.4
San Miguel 15,601 2.5 21,480 2.1 37,081 42.1 57.9
Sandoval 35,541 5.7 110,887 10.7 146,428 24.3 75.7
Santa Fe 47,088 7.5 130,429 12.6 177,517 26.5 73.5
Sierra 6,313 1.0 9,153 0.9 15,466 40.8 59.2
Socorro 6,588 1.1 22,983 2.2 29,571 22.3 77.7Taos 12,500 2.0 54,895 5.3 67,395 18.5 81.5
Torrance 6,743 1.1 26,566 2.6 33,309 20.2 79.8
Union 12,357 2.0 7,486 0.7 19,843 62.3 37.7
Valencia 19,089 3.1 162,842 15.7 181,931 10.5 89.5
Totals 625,575 100.0 1,037,628 100.0 1,663,203 37.6 62.4
Information source: compiled from data provided by the New Mexico Taxation and Revenue
Department's Property Tax Division.
-36-

8/14/2019 Property Values
http://slidepdf.com/reader/full/property-values 37/37
New Mexico Taxation and Revenue Department -- 2006 Property Tax Facts
Table 21: Property Tax Rates Subject to Yield Control Statute (Section 7-37-7.1 NMSA 1978)
Description Statutory Reference
Municipal Flood Control – 5 mill maximum to construct dikes, dams, etc. Sec 3-41-2
Municipal Parking District – 6 mill maximum Sec 3-51-14
Special Hospital District 4.25 mill maximum Sec 4-48A-16
County Hospitals – operating and maintaining – 6.50 mill maximum –includes UNM Hospital Sec 4-48B-12
County Hospitals – 4.25 to 6.50 mill depending on county class Sec 4-48-15
County Flood Control – 1.5 mill maximum Sec 4-59-2
Community Service District – 10 mill maximum Sec 4-54-4
Small Counties Asistance – 8.85 mill maximum. Sec 4-61-2
Economic Advancement Districts – 2 mill maximum. Sec 6-19-4
Low-Income Property Tax Rebate –County Option –1 mill maximum. Sec 7-2-14.5
County Operating Rates --11.85 mill maximum. Section 7-37-7A.
Municipal Operating Rates --7.65 mill maximum. Section 7-37-7A
School District Operating Rates --.5 mill maximum. Section 7-37-7A
Copper Ad Valorem Tax Sec 7-39-8
College District Operation – 5 mill maximum Sec 21-2a-5
Public School Capital Improvements – 2 mill maximum Sec 22-25-7Public School Buildings – 10 mill maximum Sec 22-26-7
Albuquerque Metropolitan Flood Control -.5 mill maximum Sec 72-16-22
Las Cruces Metro Flood Control -.5 mill maximum Sec 72-17-22
Flood Control Districts -- 2 mill maximum Sec 7-18-20
Southern Sandoval County Flood Control Sec 7-19-22
Artesian Conservancy Districts Sec 73-1-21
Soil and Watershed Conservation Districts Sec 73-20-17
Solid Waste Authority Sec 73-20-46
County Boards of Horticultural Commisioners Sec 76-3-2
Livestock Code Sec 77-2-16
Additional Notes:1) Information displayed above was compiled from House Bill 948, (HB-948) introduced in the 2003 New Mexico legislative
sesion. HB-948 proposed to eliminate the yield control statute, and thus contained all statutory references to it. The legislature did
not approve the proposal.
2) Property tax levies imposed under the Education Technology Equipment Act (6-15A-1 to 6-15A-16 NMSA 1978) are not subject
to the yield control statutes. Under the act, school districts are allowed to create debt without voter permission to enter into lease-
purchase agreements to acquire educational technology equipment. For additional details, please see “How New Mexico Public
Schools are Funded” – New Mexico Public Education Department, School Budget and Finance Analysis Bureau – available on the
Public Education Department website.
-37-
3) The yield control statute was developed to prevent extraordinary tax increases in response to reassessment, and thus encourage
reassessment. The procedure moves rates in the opposite direction of assessed value increases resulting from reassessment, and thus
limits tax increases from reassessment to apprxoximately the rate of inflation.