2016 property values and assessment practices … property values and assessment practices report...
TRANSCRIPT

2016PropertyValuesandAssessmentPracticesReport
AssessmentYear2015
AREPORTSUBMITTEDTOTHEMINNESOTASTATELEGISLATURE
PURSUANTTO
MINNESOTALAWS2001,FIRSTSPECIALSESSION,CHAPTER5,ARTICLE3,SECTION92ANDMINNESOTASTATUTES,SECTION273.1108
PropertyTaxDivision
MinnesotaDepartmentofRevenue
March1,2016


2016 Property Values and Assessment Practices Report i
March 1, 2016
To Members of the Legislature of the State of Minnesota:
I am pleased to present to you this report on property values and assessment practices in the State of Min-nesota. This is the 14th annual version of this report. Since 2012, this report has been combined with the annual report related to agricultural properties and Green Acres, satisfying the requirements of both Min-nesota Laws 2001, First Special Session, chapter 5, article 3, section 92 and Minnesota Statutes, section 273.1108.
This report provides a summary of assessed property values and assessment practices in Minnesota, with an emphasis on market values for 2a agricultural and 2b rural vacant land properties, and Green Acres value methodology and determinations.
Sincerely,
Cynthia Bauerly Commissioner Minnesota Department of Revenue

ii Minnesota Department of Revenue ▪ Property Tax Division
Per Minnesota Statutes, section 3.197, any report to the Legislature must contain, at the beginning of the report, the cost of preparing the report, including any costs incurred by another agency or another level of government.
This report cost $6,900.
2016 Property Values and Assessment Practices Report iii
TableofContentsExecutive Summary ...................................................................................................................... 1
Assessment Practices and Market Values ......................................................................................................... 1
Green Acres and Rural Preserve ........................................................................................................................... 2
Introduction .................................................................................................................................. 3
Overview of the Minnesota Department of Revenue’s Role..................................................................... 3
Property Tax Classifications ........................................................................................................ 4
Property Valuation Basics ........................................................................................................... 5
Sales Ratio Studies and Analyses ............................................................................................... 6
Purpose of Sales Ratio Studies ............................................................................................................................. 6
Sales Ratio Study Process ....................................................................................................................................... 8
Sales Ratio Studies: Measures of Central Tendency and Uniformity ..................................................... 9
2014 Sales Ratio Study for the 2015 State Board of Equalization ........................................................ 10
Estimated Market Value Trends ............................................................................................... 12
Taxable Market Value ................................................................................................................ 13
Tax Distribution .......................................................................................................................... 15
Green Acres ................................................................................................................................. 16
Taxable Green Acres Value ................................................................................................................................... 16
Non-Tillable Lands ................................................................................................................................................... 18
Green Acres Values: 2015 Assessment Year Impact ................................................................................... 19
Rural Preserve ............................................................................................................................. 20
Taxable Rural Preserve Value ............................................................................................................................... 20
Appendix A ▪ Classification Rates (2015 Assessment) ........................................................... 22
Appendix B ▪ Summary of 2015 State Board Orders ............................................................. 23
2015 State Board Orders by County ................................................................................................................. 23
Appendix C ▪ Statewide Values and Assessment Practices Indicators ................................ 27
Map 1: Percent Change in Total Estimated Market Value 2014-2015 ................................................ 28
Map 2: New Construction as a Percent of Total Estimated Market Value (2015 Assessment) . 29
Map 3: Taxable Tillable Green Acres/Rural Preserve Value (2015 Assessment) ............................ 30
iv Minnesota Department of Revenue ▪ Property Tax Division
Map 4: Taxable Non-Tillable Green Acres/Rural Preserve Value (2015 Assessment) ................... 31
Appendix D ▪ Glossary ............................................................................................................... 32
Appendix E ▪ 12-Month Study .................................................................................................. 34
Appendix F ▪ 21-Month Study .................................................................................................. 35
Executive Summary
2016 Property Values and Assessment Practices Report 1
ExecutiveSummaryThis report analyzes the assessment of various types of property including residential, seasonal recrea-tional residential (cabins), apartments, commercial/industrial, agricultural, and rural lands. The report also examines current law and taxable values in relation to the Green Acres and Rural Preserve property tax programs.
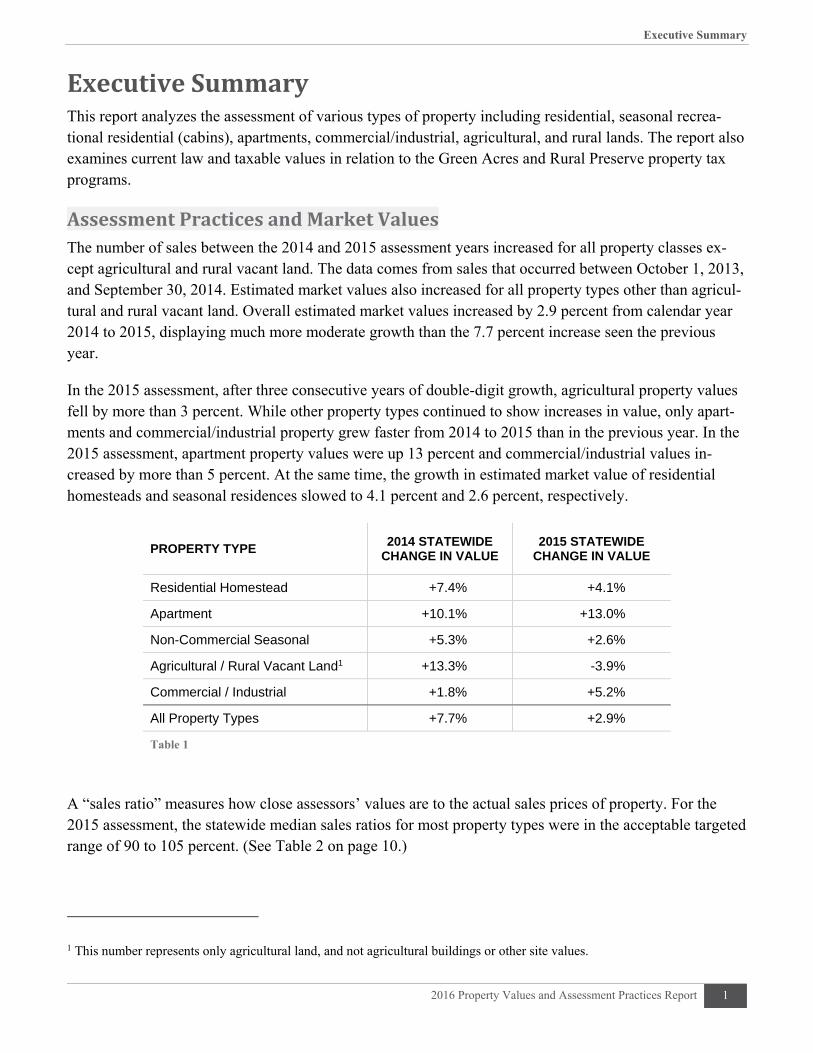
AssessmentPracticesandMarketValuesThe number of sales between the 2014 and 2015 assessment years increased for all property classes ex-cept agricultural and rural vacant land. The data comes from sales that occurred between October 1, 2013, and September 30, 2014. Estimated market values also increased for all property types other than agricul-tural and rural vacant land. Overall estimated market values increased by 2.9 percent from calendar year 2014 to 2015, displaying much more moderate growth than the 7.7 percent increase seen the previous year.
In the 2015 assessment, after three consecutive years of double-digit growth, agricultural property values fell by more than 3 percent. While other property types continued to show increases in value, only apart-ments and commercial/industrial property grew faster from 2014 to 2015 than in the previous year. In the 2015 assessment, apartment property values were up 13 percent and commercial/industrial values in-creased by more than 5 percent. At the same time, the growth in estimated market value of residential homesteads and seasonal residences slowed to 4.1 percent and 2.6 percent, respectively.
PROPERTY TYPE 2014 STATEWIDE
CHANGE IN VALUE 2015 STATEWIDE
CHANGE IN VALUE
Residential Homestead +7.4% +4.1%
Apartment +10.1% +13.0%
Non-Commercial Seasonal +5.3% +2.6%
Agricultural / Rural Vacant Land1 +13.3% -3.9%
Commercial / Industrial +1.8% +5.2%
All Property Types +7.7% +2.9%
Table 1
A “sales ratio” measures how close assessors’ values are to the actual sales prices of property. For the 2015 assessment, the statewide median sales ratios for most property types were in the acceptable targeted range of 90 to 105 percent. (See Table 2 on page 10.)
1 This number represents only agricultural land, and not agricultural buildings or other site values.

Executive Summary
2 Minnesota Department of Revenue ▪ Property Tax Division
Assessment quality remained relatively consistent between the 2014 and 2015 assessments. This is re-flected in both the sales ratio and the “coefficient of dispersion” (COD), the two primary measures of as-sessment quality. As a general rule, sales ratios and coefficients of dispersion are more accurate in classes with more sales activity because a larger sales sample is more likely to reflect the range of values for all properties in the jurisdiction.
The COD measures the uniformity of assessments. For the 2015 assessment, the coefficients generally were within the International Association of Assessing Officers’ (IAAO) acceptable ranges in counties that had an adequate sample of sales. This is an area of concern in places with smaller sales samples. The IAAO ranges are shown on page 11. (See Table 3.)
The State Board of Equalization issues corrective orders when the median sales ratio for a property type is outside the 90 to 105 percent acceptable range. In 2015, 18 counties were issued State Board Orders. This was a slight decrease compared to 2014 when 24 counties were issued State Board Orders.
The Minnesota Department of Revenue’s appraisal staff works with assessors to identify areas of concern for future assessments to help avoid State Board Orders. These issues usually fall into three categories:
1. Low sales ratios in areas with a history of few sales
2. Sales ratios near the 90 to 105 percent range boundaries
3. Areas with uniformity concerns
GreenAcresandRuralPreserveGreen Acres and Rural Preserve are property tax deferral programs that help keep farm property values from increasing due to non-agricultural influences such as development or recreational uses on nearby properties.
The Department of Revenue determines a Green Acres value for class 2a agricultural land for each county to reflect market and agricultural conditions, and counties use the Green Acres value when calculating property taxes. Rural Preserve provides similar benefit for class 2b rural vacant land that is part of a farm.
For the 2015 assessment, the base Green Acres was $9,400 per acre of agricultural land. However, the values used by county assessors ranged from $940 to $10,060 per acre once adjustments were made for local conditions. (See pages 16-19 for more information and examples.)
The overall value deferred under Green Acres and Rural Preserve increased from 2014 to 2015, as the es-timated market value – which reflects non-agricultural influences – increased more than the agricultural value alone.
Introduction
2016 Property Values and Assessment Practices Report 3
IntroductionIn 2001, the Minnesota Legislature mandated an annual report from the Minnesota Department of Reve-nue on property tax values and assessment practices in the state. This year is the 14th annual report on such data and practices to the Legislature. Since 2012, this report has been combined with the annual re-port about agricultural properties and Green Acres, satisfying the requirements of both Minnesota Laws 2001, First Special Session, chapter 5, article 3, section 92, and Minnesota Statutes, section 273.1108.
In accordance with those mandates, this report contains:
Information by major types of property on a statewide basis and at various jurisdictional levels
Recent market value trends, including projections
Trend analysis of excluded market value
Assessment quality indicators, including sales ratios and coefficients of dispersion for counties
Percentage of parcels that change in value each year
A summary of State Board Orders issued in 2015
Green Acres value methodology and determinations
Assessment and classification practices for class 2a agricultural and 2b rural vacant land property
The purpose of this report is to provide an accurate description of the current state of property tax assess-ment and an overview of the department’s responsibility to oversee the state’s property tax assessment process. This report collects property value data for the purpose of monitoring and analyzing underlying value trends and assessment quality indicators. This information and analysis is used to inform govern-ment officials and the public about valuation trends within the property tax system.
OverviewoftheMinnesotaDepartmentofRevenue’sRoleProperty taxes are an important source of revenue for all local units of government in Minnesota, including counties, cities, townships, and school districts. The primary responsibility of the department’s Property Tax Division is to ensure fair and uniform administration of, and compliance with, state property tax laws.
The Property Tax Division measures compliance with property tax laws through:
The State Board of Equalization, which ensures that property taxpayers pay their fair share – no more and no less. The Commissioner of Revenue, acting as the State Board of Equalization, has the authority to increase or decrease assessed market values in order to bring about equalization.
Promotion of uniformity of administration among the counties to ensure that each taxpayer will be treated in the same manner regardless of where the taxpayer lives.
Delivery of accurate and timely aid calculations, certifications, and actual aid payments.
Education and information for county officials, including technical manuals, bulletins, answers to specific questions, and courses taught by division staff. These offerings provide county officials the support and training necessary to administer property tax laws equitably and uniformly.
Property Tax Classifications
4 Minnesota Department of Revenue ▪ Property Tax Division
PropertyTaxClassificationsIn Minnesota, property is classified according to its use on the assessment date – Jan. 2. The classification system is used to identify a given property’s classification rate, which in turn determines the share of the tax burden borne by that property.
There are five main property tax classifications used in Minnesota. However, in reality, the breakdown of property tax classifications includes 34 specific statutory descriptions that result in different class rates based on value tiers and homestead benefits. A classification rate table is shown in Appendix A. The five main property tax classifications in Minnesota are:
Class 1 properties: Mostly residential properties.
Class 2 properties: Mostly rural properties, including agricul-tural and forestland.
Class 3 properties: Commercial and industrial properties.
Class 4 properties: Residential non-homestead properties, sea-sonal/resort properties, and commercial properties.
Class 5 properties: Iron ore and iron-bearing formations and “other” properties not classified elsewhere.
Defining the classification rate of a property is one of the first steps in calculating property taxes. The class rate is then used to determine a property’s net tax capacity:
Taxable Market Value × Classification Rate = Net Tax Capacity (NTC)
Equation 1
For example, consider a residential homestead with a Taxable Market Value of $100,000:
$100,000 × 1.00% = $1,000 NTC
The classification system is also used as part of the Minnesota Department of Revenue’s efforts to meas-ure assessment quality. The sales ratio study and State Board of Equalization use these classifications to study value trends and accuracy of assessors’ valuations. For the purposes of this report, the department has focused on the following major classification types (which do not necessarily follow the classification system’s one through five numbering as shown above).
Residential
Seasonal recreational residential (cabins)
Apartments
Commercial/industrial properties
Agricultural and rural lands
Theauthoritytodefineproper‐tiesbyclassificationisgrantedintheMinnesotaConstitution,ArticleX,whichstates,“Taxesshallbeuniformuponthesameclassofsubjects.”Inotherwords,similarly‐usedpropertiesaregivensimilarclassifications.Classificationratesareapplieduniformlywithinagivenclassifi‐cation,buttheratesmaydifferbetweendifferentclassifications.

Property Valuation Basics
2016 Property Values and Assessment Practices Report 5
PropertyValuationBasicsMinnesota law requires that all property be valued at its market value. For property tax assessment pur-poses, the market value is rounded so that any amount under $100 is rounded up to $100, and any value exceeding $100 is rounded to the nearest $100. Assessors are required to determine the value of the land, the value of the structures and improvements to the land, and the total market value comprised of the land
and structure/improvement value.
The three standard approaches used to determine market value are the cost approach, the income approach, and the sales com-parison approach.
The COST APPROACH estimates the value of the land as if it was vacant, and then adds the depreciated cost of the improvements to arrive at an estimate of value.
The INCOME APPROACH utilizes the income or rent that a property may be expected to produce to determine the value. It is most commonly used for income-producing properties.
Finally, the SALES COMPARISON APPROACH estimates the value of property by looking at the sales prices of comparable properties that have sold in the same market. The sales comparison method is the method most often used for property tax assessment pur-poses.
The “market value” used for property tax purposes is the “open market value,” which is the price a prop-erty would sell for under typical, normal, and competitive conditions. It is also called the estimated mar-ket value (EMV). The most common method of determining the EMV is through the comparable sales approach. The EMV, like the property’s classification, is determined on Jan. 2 of the assessment year.
Appraisal principles and procedures guidelines commonly use the following criteria to determine whether a property meets the definition of an open-market transaction:
1. The buyer and seller are typically motivated;
2. Both parties are well-informed or well-advised, and each party is acting in its own best interest;
3. A reasonable amount of time has been allowed for the property to be exposed to the open market;
4. Payment is made in cash or a cash equivalent;
5. Financing (if any) is on terms generally available to the community and is typically for the prop-erty type in its locale; and
6. The price represents a normal consideration for the property sold, and appears unaffected by spe-cial financing amounts or terms, services, fees, costs, or credits incurred in the transaction.
MinnesotaStatutes,section272.03,subdivision8definesmarketvalueas:
“‘…theusualsellingpriceattheplacewherethepropertytowhichthetermisappliedshallbeatthetimeofassessment;beingthepricewhichcouldbeob‐tainedataprivatesaleoranauctionsale,ifitisdeterminedbytheassessorthatthepricefromtheauctionsalerepresentsanarm's‐lengthtransaction.Thepriceobtainedataforcedsaleshallnotbeconsidered.”
Sales Ratio Studies and Analyses
6 Minnesota Department of Revenue ▪ Property Tax Division
SalesRatioStudiesandAnalysesIn order to evaluate the accuracy and uniformity of assessments within the state (and to ensure compliance with property tax laws), the Minnesota Department of Revenue conducts annual sales ratio studies. These studies measure the relationship between appraised values and the actual sales price. As a mathematical expression, a sales ratio is the assessor’s estimated market value of a property divided by its actual sales price, as seen here:
Sales Ratio=Assessor's Estimated Market Value
Sales Price
Equation 2
For example, assume a home was valued by the assessor at $100,000. The home sold for $105,000. The sales ratio would be calculated as follows:
Sales Ratio=$100,000
$105,000 95%
The sales ratio study provides an indication of the level of assessment (how close appraisals are to market value on an overall basis), as well as the uniformity of assessment (how close individual appraisals are to the median ratio and each other).
PurposeofSalesRatioStudiesSales are the foundation for mass appraisal when using a sales comparison approach. Assessors rely heavily on sales of properties in their jurisdictions when estimating values of all other similar properties in the same area. Assessors are required to use sales information in their assessment work, so the validity of sales information is crucial.
Minnesota requires reporting of sales information. Most sales information is required to be reported on a Certificate of Real Estate Value. Assessors must verify and review sales information before it can be used by the assessor as part of a sales ratio study. Certain sales are automatically removed from consideration, while others require more scrutiny and review by the assessor. When only verified sales remain, the asses-sor is able to analyze and study them to make some generalizations for the market and to make any changes in value to respond to the market.
A formal sales study is also conducted on these sales to verify that the assessors’ actions responded appro-priately to the changes in the market. The Department of Revenue conducts additional studies as a check on the assessors’ performances and to ensure equalization of values. Any of these formal studies involve data analysis, statistical measurement, critical thinking to develop solutions to correct issues, and report-ing of results.
Thesalesratiostudieshavethreebasicpurposes:
1.Toplananupcomingassessment
2.Toevaluateanexistingassessment
3.Toidentifyinequities
Sales Ratio Studies and Analyses
2016 Property Values and Assessment Practices Report 7
The sales ratio study is the culmination of the ongoing process of collecting information about the local real estate market. It provides important information in planning the upcoming assessment, evaluating the existing assessment, and identifying inequities in the assessment. There are other uses, as well. The state conducts several sales ratio studies to assist in assessment review and equalization and to aid the tax court.
Many county and local assessors also perform their own in-house sales ratio analyses. Sales ratio studies are used by assessors in refining their valuation levels, by the tax court in adjudicating assessments, by the State Board of Equalization in determining orders, and by various aid formulas that utilize measures of equalized values. By the time sales ratio studies are completed by the department, there is an expectation that all the underlying sales data has been reviewed and are representative of the market.
The three main sales ratio studies used are:
1. A 12-month study: This study uses sales from Oct. 1 of a given year to Sept. 30 of the following year, and is used to estimate market values for the following assessment. In other words, sales that occurred between Oct. 1, 2013 and Sept. 30, 2014 are used for determining estimated market val-ues for the Jan. 2, 2015 assessment. The 12-month study is discussed in detail in Appendix E.
2. A 9-month study: This study is based on sales occurring between Jan. 1 and Sept. 30 of a given year. (It is the same as the 12-month study, but excludes the sales from October, November, and December.) As described below, this study is used by Minnesota Tax Court.
3. A 21-month study: This study is used for levy and aid purposes. This study uses sales that run from Jan. 1 of a given year to Sept. 30 of the following year and compares the sales to the asses-sor’s market values. The 21-month study is discussed in detail in Appendix F.
The five primary uses of the sales ratio study in Minnesota are:
1. The Minnesota State Board of Equalization uses a 12-month study to judge overall levels of as-sessment. For this study, a median ratio is used. The study looks forward to estimate what the ratio would be if the sales data were applied to the proposed assessor’s values. The ratios are used to equalize values and enhance uniformity across property types and between jurisdictions.
2. The Minnesota Tax Court uses a 12-month study in property valuation cases that look backward to the January assessment date of the current study year. The Tax Court also uses the 9-month (“backward-looking”) study in property valuation cases; it is preferred by the Tax Court if there is are at least six usable sales because all sales in the study occur after the assessment date. This study is used to measure unequal levels of assessment (discrimination) within property types. A median ratio is used to measure assessment equity.
3. The Department of Revenue’s State Assessed Property Unit uses the 12-month study to equalize railroad and utility values. A median ratio is used.
4. The 21-month study is used to produce Adjusted Net Tax Capacities (also called ANTCs) for school and local government aids, as well as a variety of apportionments. A weighted median ratio is used for all aid calculations.
Sales Ratio Studies and Analyses
8 Minnesota Department of Revenue ▪ Property Tax Division
5. The Economic Market Value Study is a sales ratio-adjusted measure of a community’s property wealth, using estimated market values as a starting point. Bonding companies use the adjusted es-timated market value of cities and towns to measure fiscal capacities for bond rating calculations. In previous years, the adjusted-ratio study was based on taxable values and was called the Indi-cated Market Value Study.
In 2011, Minnesota created a new homestead market value exclusion, which excluded a share of homestead property from the net tax capacity calculation, leading to a reduction in taxable market value. As a result, the wealth of a community is better represented by the estimated market value, rather than the taxable market value that has been reduced by the homestead exclusion.
The State Board of Equalization uses sales ratio studies to determine the assessment level for equalization purposes. The study may indicate inequities in the assessment. It may also help to guide assessors by providing information on which to base adjustments to the assessment with respect to neighboring coun-ties. The studies are useful to legislators to develop tax policy or to change tax rates. Property owners may use the studies if they have concerns about unfair or inequitable treatment by assessors.
When the Commissioner of Revenue determines that there has been an unfair or inequitable assessment, the commissioner is authorized to order a reassessment of any taxing district in order to make a correc-tion. The commissioner assists the State Board of Equalization and in that capacity is empowered to re-duce wide disparities in assessment levels between counties and among the classes of real estate within counties.
Sales ratio studies are an excellent tool for the commissioner to measure how closely assessed values are to actual sales prices, and to judge the quality of equalization within classes of properties, and between classes and areas.
SalesRatioStudyProcessSales ratio studies take the following steps to ensure the dependability of the information:
1. Gather basic data on real estate transfers.
2. Screen and edit information to make any necessary adjustments for conditions of sale and exclude all sales that do not represent arm’s-length transactions.
3. Put relevant data into an acceptable format for processing by computer programs.
4. Sort information by categories of real estate within each area.
5. Total the data and compute statistics to describe the information.
One of the main objectives in property tax administration is an equalized assessment. It is important that equalization be attained both among local property owners and between taxing districts because the as-sessment serves as a basis for:
1. Tax levies by overlapping governmental units (i.e. counties, school districts, and special taxing districts).
Sales Ratio Studies and Analyses
2016 Property Values and Assessment Practices Report 9
2. Determination of net bonded indebtedness restricted by statute to a percentage of either the local assessed value or market value.
3. Determination of authorized levies restricted by statutory tax rate limits.
4. Apportionment of state aid to governmental units via the school aid formula and the local govern-ment aid formulae.
An equitable distribution of the tax burden is achieved only if it is built upon a uniform assessment. Non-uniform assessment will result in a shift in the tax burden to other property owners.
SalesRatioStudies:MeasuresofCentralTendencyandUniformityMeasures of central tendency describe the overall level at which properties are appraised. Mean, median, and aggregate (weighted) ratios are used. For each measure, the individual ratio for each sale is used. Af-ter the sales ratio for each sale has been determined, the measurements can be calculated.
The MEAN RATIO (the mathematical average of the sales ratios) is easily affected by extreme sales ratios, and can lead to a significant distortion of the average.
The MEDIAN RATIO is the most widely used measure of central tendency because it is not affected by extreme ratios. Department of Revenue guidelines indicate that the median ratio of a sales ratio study should range from 90 to 105 percent. The median ratio is used to determine the level of assessment for the State Board of Equalization.
Finally, the AGGREGATE RATIO (or weighted mean) is computed by dividing the total assessor’s EMV for all properties sold by the total sales price of those properties. Higher priced properties are given more weight than lower priced properties. The aggregate mean is generally accepted as the most appropriate measure to be used in the equalization of aids.
Measures of uniformity measure the quality and uniformity of the assessment. The measures of uni-formity include the range of ratios, the coefficient of dispersion, and the price-related differential.
The RANGE is the difference between the smallest and largest ratios. A large range typically indicates poor uniformity. The range is highly susceptible to extreme ratios.
The COEFFICIENT OF DISPERSION is an index by which individual ratios vary from the median. A low coefficient of dispersion indicates that appraisals within a class or area are uniform; a high coefficient of dispersion indicates that properties are being appraised at inconsistent percentages of market value. The coefficient of dispersion is calculated by dividing the average absolute deviation (the average difference be-tween each ratio and the median ratio) by the median.
The PRICE-RELATED DIFFERENTIAL measures the relationship between the mean ratio and the aggregate mean ratio. It is calculated by dividing the mean sales ratio by the aggregate mean sales ratio. Appraisal uniformity may be regressive if high-value properties are under-appraised relative to low-value properties, and would be evident

Sales Ratio Studies and Analyses
10 Minnesota Department of Revenue ▪ Property Tax Division
by a price-related differential of greater than one hundred percent. A progressive as-sessment would be indicated by a price-related differential of less than one hundred percent, and indicates that lower priced properties are under-appraised.
2014SalesRatioStudyforthe2015StateBoardofEqualization There were 118,877 Certificates of Real Estate Value (CRVs) received in the 2014 study for the 2015 State Board of Equalization. Of these, 67,031 were considered good, current-year, open-market sales. These sales provided the basis for the sales ratio studies.
Table 2 shows median sales ratios and coefficients of dispersion (CODs) by property type for 2014 and 2015. The lower the COD, the more uniform are the assessments. A high coefficient suggests a lack of equality among individual assessments, with some parcels being assessed at a considerably higher ratio than others. Note that property types with smaller sample sizes tend to have lower sales ratios and higher CODs.
MedianSalesRatiosandCoefficientsofDispersionbyPropertyTypeAssessmentYears2014and2015
PROPERTY TYPE FINAL ADJUSTED
MEDIAN RATIO COEFFICIENT
OF DISPERSION SAMPLE SIZE
State Board Year 2014 2015 2014 2015 2014 2015
Residential/Seasonal 93.4 94.0 10.6 9.9 54,126 67,517
Apartment 96.3 96.4 10.9 14.1 345 556
Commercial/Industrial 96.0 96.2 17.1 17.2 1,201 1,579
Resorts 95.3 100.4 31.0 12.9 19 18
Agricultural 2a / Rural Vacant 2b 94.0 96.9 22.8 21.4 3,801 3,066
Table 2
Sales Ratio Studies and Analyses
2016 Property Values and Assessment Practices Report 11
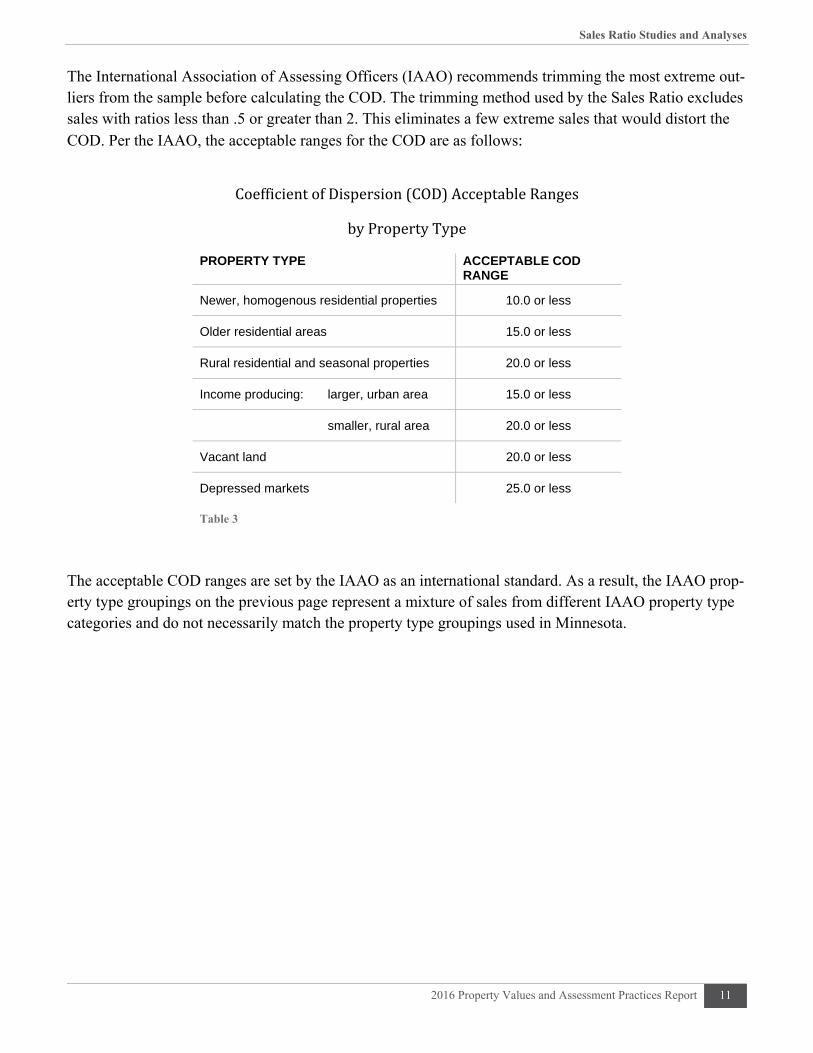
The International Association of Assessing Officers (IAAO) recommends trimming the most extreme out-liers from the sample before calculating the COD. The trimming method used by the Sales Ratio excludes sales with ratios less than .5 or greater than 2. This eliminates a few extreme sales that would distort the COD. Per the IAAO, the acceptable ranges for the COD are as follows:
CoefficientofDispersion(COD)AcceptableRanges
byPropertyType
PROPERTY TYPE ACCEPTABLE COD RANGE
Newer, homogenous residential properties 10.0 or less
Older residential areas 15.0 or less
Rural residential and seasonal properties 20.0 or less
Income producing: larger, urban area 15.0 or less
smaller, rural area 20.0 or less
Vacant land 20.0 or less
Depressed markets 25.0 or less
Table 3
The acceptable COD ranges are set by the IAAO as an international standard. As a result, the IAAO prop-erty type groupings on the previous page represent a mixture of sales from different IAAO property type categories and do not necessarily match the property type groupings used in Minnesota.

Value Trends
12 Minnesota Department of Revenue ▪ Property Tax Division
EstimatedMarketValueTrendsIn 2015 there were over 2,731,000 taxable real property parcels statewide. Overall, assessors’ estimated market value of all property in the state increased 2.84 percent from the 2014 assessment to the 2015 as-sessment. Except for agricultural property, all major property classes gained value from 2014 to 2015.
Major findings:
Agricultural property: The 3.4 percent decrease in value (including building and site values) from 2014-2015 was a turnaround from the 11 percent increase from 2013-2014.
Residential homestead property: The 4 percent increase in value from 2014-2015 was smaller than the 7.4 percent increase in the previous year.
Seasonal recreational residential property: Following the trend in homestead property, the 2.6 percent increase in value from 2014-2015 was half the 5.3 percent increase from 2013-2014.
Commercial/industrial property: In contrast to the other three classes, the 5.2 percent increase from 2014-2015 was larger than the 1.8 percent increase in the previous year.
Chart 1
Prior to 2013, the “agricultural” class as shown here included forest land, which was removed for the 2015 report.
-10%
-5%
0%
5%
10%
15%
20%
25%
2000 2001 2002 2003 2004 2005 2006 2007 2008 2009 2010 2011 2012 2013* 2014* 2015*
EstimatedMarketValuePercentChangebyClass
Agricultural Residential Homestead Seasonal Recreational Residential Commercial/Industrial

Taxable Market Value
2016 Property Values and Assessment Practices Report 13
TaxableMarketValueIn Minnesota, taxes are not directly based on the estimated market value. Minnesota property tax statutes contain a number of exclusions, value deferrals, and exemptions that decrease the amount of the EMV that is subject to taxation. Taxable Market Value (TMV) refers to the amount of value that is actually used in calculating property taxes. This often differs from EMV due to special programs and exclusions. Sam-ple TMV calculations can be found in Section 04.10 of the Auditor/Treasurer Manual, available at www.revenue.state.mn.us.
Taxable market value not only decreases an individual property’s tax burden, it also decreases the tax base for the taxing jurisdiction. The taxable market value is used to determine the tax base for referendum market value, local net tax capacity, and state net tax capacity. For example, a given county’s levy (budget) is spread among all classes of taxable property by determining the cumulative net tax capacity of all the properties. The net tax capacity (taxable market value multiplied by the class rate) of all taxable properties in a jurisdiction is the tax base.
A simple illustration of how property tax rates are determined is shown below:
Step 1: Total proposed budget
All non-property tax revenue (state aids and fees)
= Property tax revenue needed
Step 2: Property tax revenue needed ÷ Total tax capacity of all taxable properties
= Local tax rate
When taxable market values change, the tax burden is redistributed within the jurisdiction. If the levy re-mains constant, property taxes for a single property may still change depending on changes in the classifi-cation rate and/or taxable market value of other properties in the jurisdiction. Some of the more common exclusions and deferrals that remove taxable value from the tax base are shown in Table 4.
As indicated in Table 4 (next page), continued growth in residential homestead values has reduced eligi-bility for the Homestead Market Value Exclusion while increasing development pressure. These changes have resulted in an increase in value deferred under Green Acres. In 2015, the total amount of value de-ferred under Green Acres was 4.6 percent more than it was in the 2014 assessment.
The Homestead Market Value Exclusion reduces the amount of a homestead’s market value that is subject to taxation. On average, the exclusion reduced homestead taxable market value by 9 percent. The exclu-sion reduced taxable market value of all property statewide by 4.5 percent. The statewide total Homestead Market Value Exclusion decreased from 2014-2015 in part due to the increase in residential homestead market values. This is because higher-valued homes are phased out of the exclusion.
Taxable Market Value
14 Minnesota Department of Revenue ▪ Property Tax Division
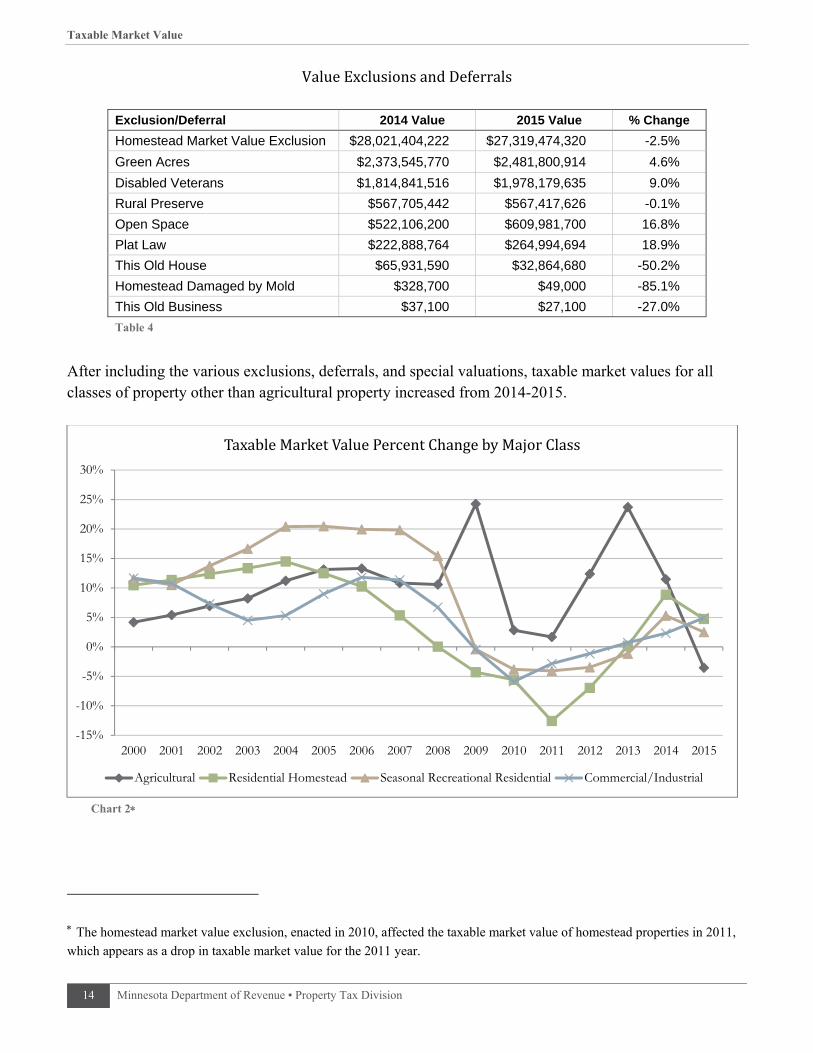
ValueExclusionsandDeferrals
Exclusion/Deferral 2014 Value 2015 Value % Change
Homestead Market Value Exclusion $28,021,404,222 $27,319,474,320 -2.5%
Green Acres $2,373,545,770 $2,481,800,914 4.6%
Disabled Veterans $1,814,841,516 $1,978,179,635 9.0%
Rural Preserve $567,705,442 $567,417,626 -0.1%
Open Space $522,106,200 $609,981,700 16.8%
Plat Law $222,888,764 $264,994,694 18.9%
This Old House $65,931,590 $32,864,680 -50.2%
Homestead Damaged by Mold $328,700 $49,000 -85.1%
This Old Business $37,100 $27,100 -27.0%
Table 4
After including the various exclusions, deferrals, and special valuations, taxable market values for all classes of property other than agricultural property increased from 2014-2015.
Chart 2
The homestead market value exclusion, enacted in 2010, affected the taxable market value of homestead properties in 2011,
which appears as a drop in taxable market value for the 2011 year.
-15%
-10%
-5%
0%
5%
10%
15%
20%
25%
30%
2000 2001 2002 2003 2004 2005 2006 2007 2008 2009 2010 2011 2012 2013 2014 2015
TaxableMarketValuePercentChangebyMajorClass
Agricultural Residential Homestead Seasonal Recreational Residential Commercial/Industrial
Green Acres
2016 Property Values and Assessment Practices Report 15
TaxDistributionMinnesota’s property tax system – with various components including classification, valuation, and spe-cial programs that reduce taxable value – determines which properties will pay a greater or lesser share of taxes.
Agricultural and homesteaded properties, through both classification rates and programs such as Green Acres and the Homestead Market Value Exclusion, have typically received preferential property tax treat-ment. Conversely, commercial properties that have a higher class rate and lesser eligibility for special pro-grams will pay a greater share of taxes than a residential or agricultural property of equal value.
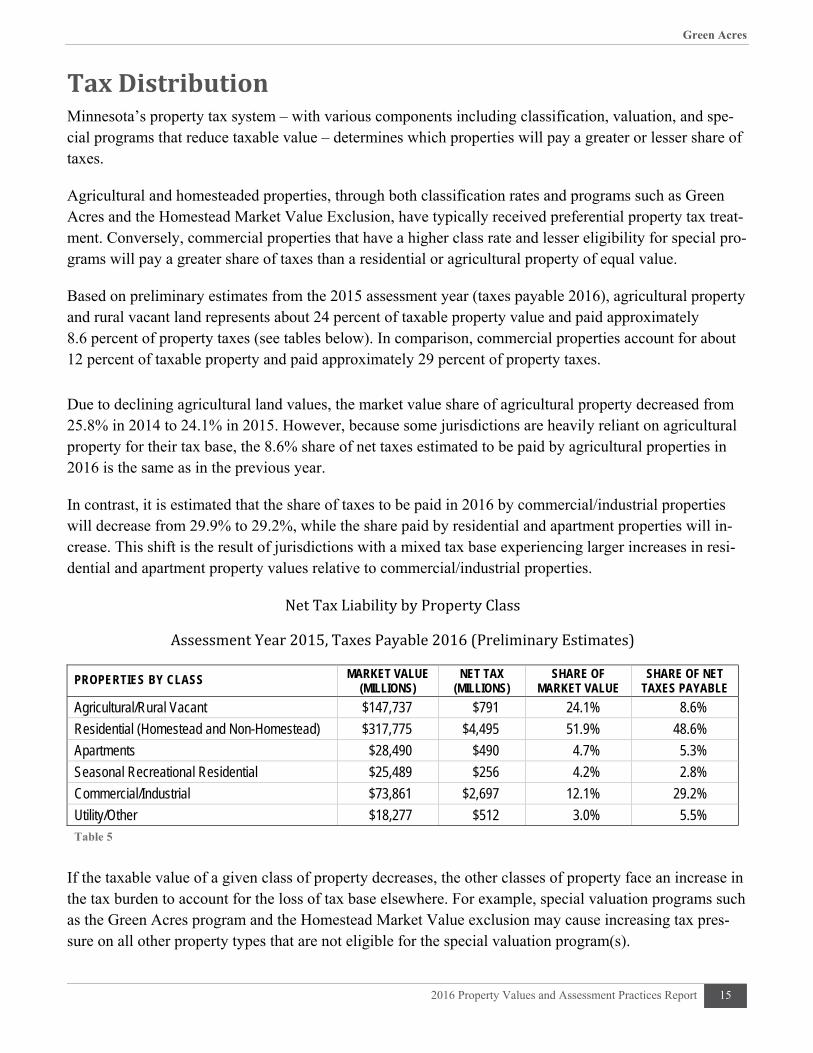
Based on preliminary estimates from the 2015 assessment year (taxes payable 2016), agricultural property and rural vacant land represents about 24 percent of taxable property value and paid approximately 8.6 percent of property taxes (see tables below). In comparison, commercial properties account for about 12 percent of taxable property and paid approximately 29 percent of property taxes.
Due to declining agricultural land values, the market value share of agricultural property decreased from 25.8% in 2014 to 24.1% in 2015. However, because some jurisdictions are heavily reliant on agricultural property for their tax base, the 8.6% share of net taxes estimated to be paid by agricultural properties in 2016 is the same as in the previous year.
In contrast, it is estimated that the share of taxes to be paid in 2016 by commercial/industrial properties will decrease from 29.9% to 29.2%, while the share paid by residential and apartment properties will in-crease. This shift is the result of jurisdictions with a mixed tax base experiencing larger increases in resi-dential and apartment property values relative to commercial/industrial properties.
NetTaxLiabilitybyPropertyClass
AssessmentYear2015,TaxesPayable2016(PreliminaryEstimates)
PROPERTIES BY CLASS MARKET VALUE (MILLIONS)
NET TAX (MILLIONS)
SHARE OF MARKET VALUE
SHARE OF NET TAXES PAYABLE
Agricultural/Rural Vacant $147,737 $791 24.1% 8.6%
Residential (Homestead and Non-Homestead) $317,775 $4,495 51.9% 48.6%
Apartments $28,490 $490 4.7% 5.3%
Seasonal Recreational Residential $25,489 $256 4.2% 2.8%
Commercial/Industrial $73,861 $2,697 12.1% 29.2%
Utility/Other $18,277 $512 3.0% 5.5% Table 5
If the taxable value of a given class of property decreases, the other classes of property face an increase in the tax burden to account for the loss of tax base elsewhere. For example, special valuation programs such as the Green Acres program and the Homestead Market Value exclusion may cause increasing tax pres-sure on all other property types that are not eligible for the special valuation program(s).
Green Acres
16 Minnesota Department of Revenue ▪ Property Tax Division
GreenAcresThe Minnesota Agricultural Property Tax Law (referred to as “Green Acres”) helps insulate farm owners from rising land values due to non-agricultural influences on the land – such as nearby residential and commercial development, or seasonal cabin and resort properties.
Property enrolled in the Green Acres program is valued using sales data for agricultural property outside the 7-county metropolitan area. This provides a lower taxable value for qualifying properties and redis-tributes the tax burden to other properties in the same jurisdiction.
Only class 2a agricultural land can qualify for Green Acres. All of the following requirements must be met for a property to be classified as agricultural land that may qualify for Green Acres. (See Minnesota Statutes, section 273.13, subdivision 23.)
1. At least 10 contiguous acres must be used to produce agricultural products in the preceding year (or be qualifying land enrolled in an eligible conservation program).
2. The agricultural products are defined by statute.
3. The agricultural product must be produced for sale.
Green Acres is a property tax deferral program. When a property is sold, transferred, or no longer quali-fies for the program, the owner has to pay the difference in tax for the last three years of enrollment.
TaxableGreenAcresValueGreen Acres requires assessors to look at qualifying agricultural property in two ways.
First, the assessor must value the property according to its highest and best use (as is done for all properties). This may include non-agricultural value influences.
Then the assessor must determine the agricultural value of the property based on Department of Revenue guidance.
If the agricultural value is below the highest and best use value, the assessor must use the agricul-tural value for tax purposes.
The Minnesota Department of Revenue is charged with establishing agricultural land values throughout the state in consultation with the University of Minnesota. (See Minnesota Statutes, section 273.111, sub-division 4.)
Settinganagriculturalvalue
To establish these agricultural values, the department examines sales of agricultural properties during the previous 12-month review period (October 1-September 30).

Green Acres
2016 Property Values and Assessment Practices Report 17
The department looks at sales in the southwest counties of Lyon, Murray, Nobles, Pipestone, and Rock – referred to as the “base counties” for agricultural values – to establish a base Green Acres value that re-flects the agricultural economy in general. 2
This base value is adjusted for each county to reflect differences in farm economies due to differences in local conditions and markets, such as:
Length of the growing season from southern to northern Minnesota
Differences in soil quality throughout the state
Various commodities that drive agricultural land values 3
To determine a county’s Green Acres value, the base value is multiplied by a preset ratio, or “factor,” that reflects its relationship to the general agricultural economy as indicated by the base counties. See Appen-dix C for a map of Green Acres values by county.
The department first established factors for each county in 2007 for the 2008 assessment, and has recalcu-lated them many times. Each county’s factor was calculated by comparing its median price for farmland sales during the review period to that of the base counties.
County assessors may “feather” the Green Acres values set by the department to account for higher and lower quality land throughout a county. However, the overall county average value must not to go below the department’s guidelines. Assessors may also appeal the county factor set by the department if they do not the factor accurately represents the agricultural market in their county.
This process had proved very effective for valuing tillable lands and provided a fair, uniform, and equal-ized method to value tillable agricultural land enrolled in the Green Acres program throughout the state.
2015Assessment
Analysis of the October 2013-September 2014 sales period showed that the economy for agricultural land was shifting. Market values for agricultural land were generally flat during this period. For this reason, the department left the 2014 base agricultural value unchanged, and it remained at $9,400 per acre for the 2015 assessment. None of the individual county factors were changed either.
2 These counties were chosen in 2007 by a Green Acres Committee that included the Department of Revenue and members of the assessment community. Based on available data, the committee located the most recent period (1990-1996) when the non-agricultural influences on farmland sales were minimal or nonexistent in Minnesota, with the exception of the 7-county metro-politan area. During this period, Lyon, Murray, Nobles, Pipestone, and Rock counties were the most indicative of true agricul-tural sales.
3 For example, soil quality is typically better in the southern portion of the state, while lesser-quality land is more prevalent in the northeastern portion of the state. Counties with greater need for pastureland due to dairy farming practices typically have a smaller market for tillable agricultural land.
Green Acres
18 Minnesota Department of Revenue ▪ Property Tax Division
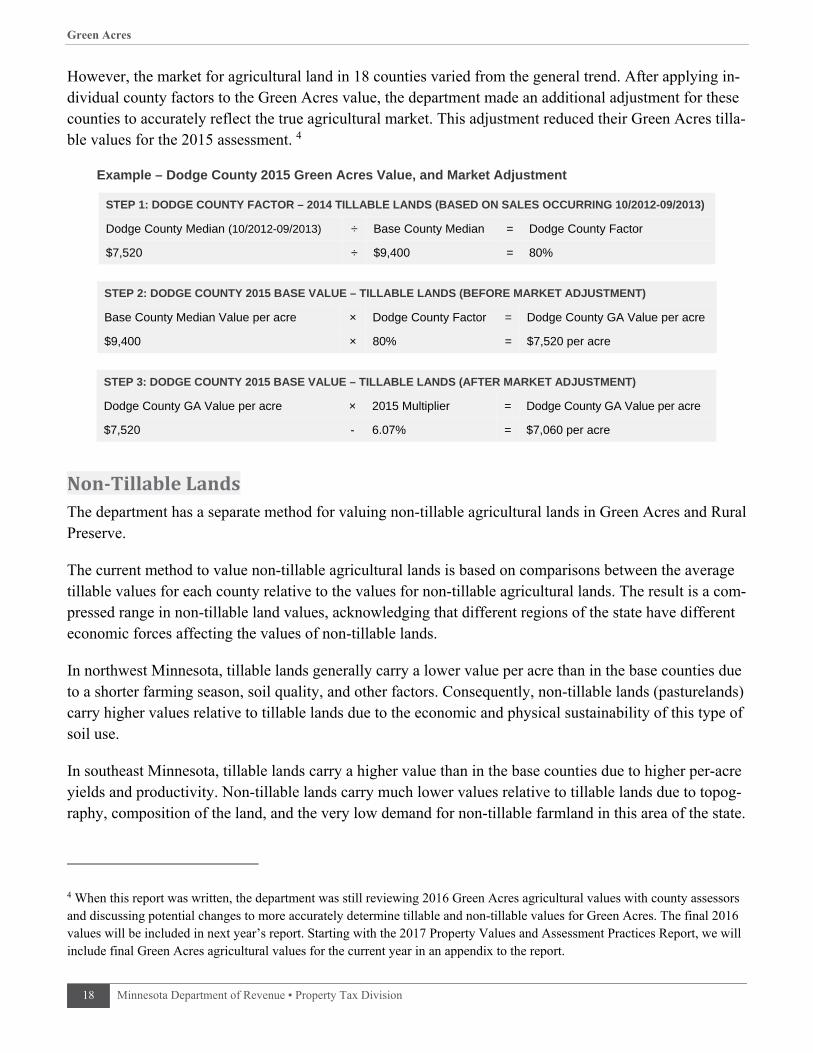
However, the market for agricultural land in 18 counties varied from the general trend. After applying in-dividual county factors to the Green Acres value, the department made an additional adjustment for these counties to accurately reflect the true agricultural market. This adjustment reduced their Green Acres tilla-ble values for the 2015 assessment. 4
Example – Dodge County 2015 Green Acres Value, and Market Adjustment
STEP 1: DODGE COUNTY FACTOR – 2014 TILLABLE LANDS (BASED ON SALES OCCURRING 10/2012-09/2013)
Dodge County Median (10/2012-09/2013) ÷ Base County Median = Dodge County Factor
$7,520 ÷ $9,400 = 80%
STEP 2: DODGE COUNTY 2015 BASE VALUE – TILLABLE LANDS (BEFORE MARKET ADJUSTMENT)
Base County Median Value per acre × Dodge County Factor = Dodge County GA Value per acre
$9,400 × 80% = $7,520 per acre
Non‐TillableLandsThe department has a separate method for valuing non-tillable agricultural lands in Green Acres and Rural Preserve.
The current method to value non-tillable agricultural lands is based on comparisons between the average tillable values for each county relative to the values for non-tillable agricultural lands. The result is a com-pressed range in non-tillable land values, acknowledging that different regions of the state have different economic forces affecting the values of non-tillable lands.
In northwest Minnesota, tillable lands generally carry a lower value per acre than in the base counties due to a shorter farming season, soil quality, and other factors. Consequently, non-tillable lands (pasturelands) carry higher values relative to tillable lands due to the economic and physical sustainability of this type of soil use.
In southeast Minnesota, tillable lands carry a higher value than in the base counties due to higher per-acre yields and productivity. Non-tillable lands carry much lower values relative to tillable lands due to topog-raphy, composition of the land, and the very low demand for non-tillable farmland in this area of the state.
4 When this report was written, the department was still reviewing 2016 Green Acres agricultural values with county assessors and discussing potential changes to more accurately determine tillable and non-tillable values for Green Acres. The final 2016 values will be included in next year’s report. Starting with the 2017 Property Values and Assessment Practices Report, we will include final Green Acres agricultural values for the current year in an appendix to the report.
STEP 3: DODGE COUNTY 2015 BASE VALUE – TILLABLE LANDS (AFTER MARKET ADJUSTMENT)
Dodge County GA Value per acre × 2015 Multiplier = Dodge County GA Value per acre
$7,520 - 6.07% = $7,060 per acre

Green Acres
2016 Property Values and Assessment Practices Report 19
There are different values for tillable and non-tillable lands because of diverse non-agricultural influences in different areas of the state. It is possible that a county may only have non-tillable lands receiving Green Acres deferral if the average 2a tillable value does not exceed the 100 percent Green Acres value but the county’s non-tillable value exceeds the Green Acres non-tillable value. Conversely, it is possible to have only tillable lands receiving deferral but not the non-tillable lands.
GreenAcresValues:2015AssessmentYearImpactStatewide taxable values of 2a land increased only slightly (0.3%), but the amount of value deferred under Green Acres was up 4.6 percent. The chart below illustrates changes through the 2015 assessment year.
Chart 3
-
2,000
4,000
6,000
8,000
10,000
12,000
14,000
16,000
2010 2011 2012 2013 2014 2015
Mill
ions
2aGreenAcresValues,2010‐2015(totalvalueinmillions)
Deferred Value
Taxable Value

Rural Preserve
20 Minnesota Department of Revenue ▪ Property Tax Division
RuralPreserveThe Rural Preserve Property Tax Program complements Green Acres and provides similar property tax benefits for class 2b rural vacant land that is part of a contiguous farm enrolled in Green Acres. Rural Pre-serve was enacted in 2009 for the 2011 assessment (taxes payable in 2012) under Minnesota Statutes, sec-tion 273.114.
As with Green Acres, a portion of taxable value is deferred for qualifying land while it is enrolled in the program. The assessor determines two values for the land: a “highest and best use value” based on market conditions, and a value that is uninfluenced by non-agricultural factors such as residential or commercial development. The assessor must use whichever value is lower for property tax purposes.
This provides a lower taxable value for qualifying properties and redistributes the tax burden to other properties in the same jurisdiction. When a property is sold, transferred, or no longer qualifies for the pro-gram, the owner has to pay the difference in tax for the last three years of enrollment.
TaxableRuralPreserveValueClass 2b rural vacant land property is not always unusable wasteland. Sometimes, class 2b land may be tillable or usable as pastureland, but is not used for agricultural purposes. The classification system acknowledges the different land uses; however for valuation purposes, similar lands should be similarly assessed.
Rural Preserve values are calculated differently than under Green Acres. Each year, the department issues a memo to notify counties of their Green Acres values for tillable and non-tillable agricultural lands. The department urges counties to use the following guidelines to calculate Rural Preserve values:
For otherwise tillable lands, use the Green Acres tillable land value.
For non-tillable lands that are otherwise pastureable, use their non-tillable Green Acres value.
For unusable waste, wild land, swamp land, etc., use 50% of the non-tillable Green Acres value.
Examples
1. If the county has estimated the value of woods at $2500 per acre because of recreational or other non-agricultural value influences, and the value for Rural Preserve is $2200, the deferral is based on the $300 per acre difference.
2. If a county has estimated the value of a swamp at $1800 per acre because of recreational or other non-agricultural market value influences, and the value for Rural Preserve is $2200, then the rec-ommended Rural Preserve value for the unusable swamp land is $1100 per acre (50% of $2200), and the deferral is based on the $700 difference in value.
3. If a county has valued a swamp at $900 per acre due to lack of non-agricultural market influences, and the recommended value for Rural Preserve is $2200 and 50 percent of that value is $1100, there is no deferral. (The property may still be enrolled in the program, but the tax deferral only applies if the EMV set by the county exceeds the Rural Preserve value.)
Rural Preserve
2016 Property Values and Assessment Practices Report 21
Unusable wasteland often carries a very low estimated market value, which may not be high enough to receive a tax deferral under Rural Preserve (as shown in Example 3 above). However, there may be some areas of the state where recreational uses are affecting the market value of these unusable wastelands that are part of a farm.
Statewide,$567,417,626ofestimatedmarketvaluewasdeferredundertheRuralPreserveprogramyearforthe2015assessment.
Appendix A ▪ Classification Rates
22 Minnesota Department of Revenue ▪ Property Tax Division
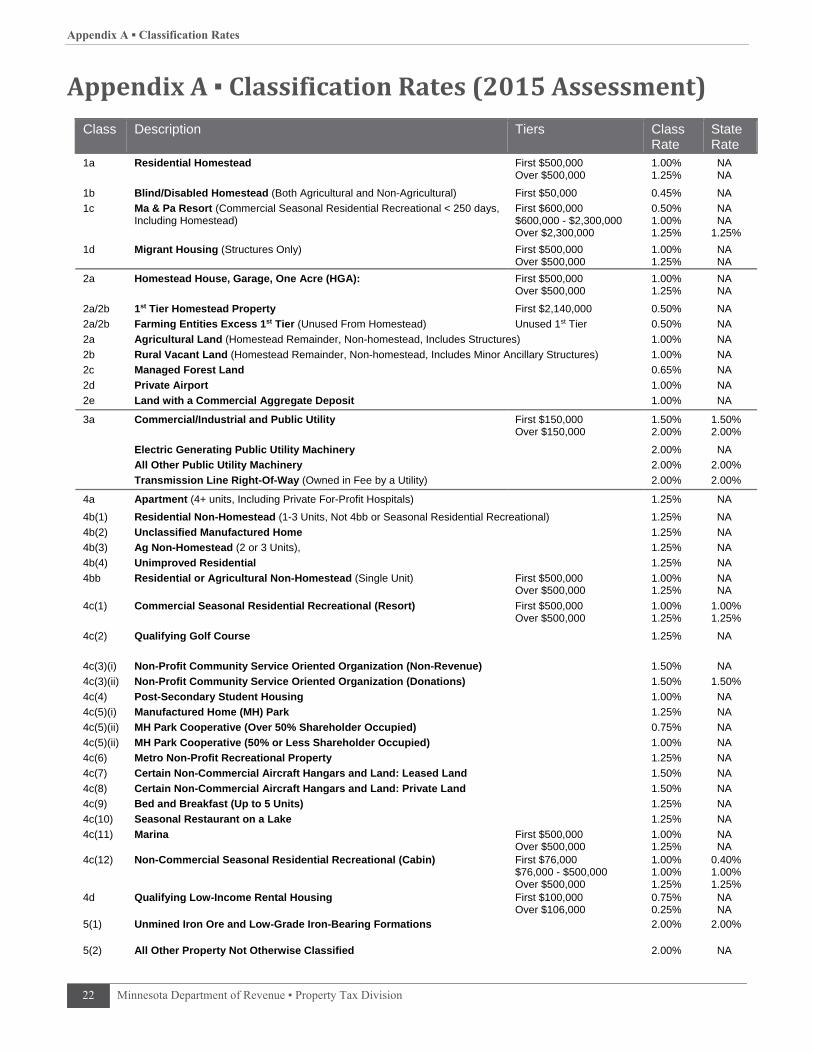
AppendixA▪ClassificationRates(2015Assessment)Class Description Tiers Class
Rate State Rate
1a Residential Homestead First $500,000 Over $500,000
1.00% 1.25%
NA NA
1b Blind/Disabled Homestead (Both Agricultural and Non-Agricultural) First $50,000 0.45% NA
1c Ma & Pa Resort (Commercial Seasonal Residential Recreational < 250 days, Including Homestead)
First $600,000 $600,000 - $2,300,000 Over $2,300,000
0.50% 1.00% 1.25%
NA NA 1.25%
1d Migrant Housing (Structures Only) First $500,000 Over $500,000
1.00% 1.25%
NA NA
2a Homestead House, Garage, One Acre (HGA): First $500,000 Over $500,000
1.00% 1.25%
NA NA
2a/2b 1st Tier Homestead Property First $2,140,000 0.50% NA
2a/2b Farming Entities Excess 1st Tier (Unused From Homestead) Unused 1st Tier 0.50% NA
2a Agricultural Land (Homestead Remainder, Non-homestead, Includes Structures) 1.00% NA
2b Rural Vacant Land (Homestead Remainder, Non-homestead, Includes Minor Ancillary Structures) 1.00% NA
2c Managed Forest Land 0.65% NA
2d Private Airport 1.00% NA
2e Land with a Commercial Aggregate Deposit 1.00% NA
3a Commercial/Industrial and Public Utility First $150,000 Over $150,000
1.50% 2.00%
1.50% 2.00%
Electric Generating Public Utility Machinery 2.00% NA
All Other Public Utility Machinery 2.00% 2.00%
Transmission Line Right-Of-Way (Owned in Fee by a Utility) 2.00% 2.00%
4a Apartment (4+ units, Including Private For-Profit Hospitals) 1.25% NA
4b(1) Residential Non-Homestead (1-3 Units, Not 4bb or Seasonal Residential Recreational) 1.25% NA
4b(2) Unclassified Manufactured Home 1.25% NA
4b(3) Ag Non-Homestead (2 or 3 Units), 1.25% NA
4b(4) Unimproved Residential 1.25% NA
4bb Residential or Agricultural Non-Homestead (Single Unit) First $500,000 Over $500,000
1.00% 1.25%
NA NA
4c(1) Commercial Seasonal Residential Recreational (Resort) First $500,000 Over $500,000
1.00% 1.25%
1.00% 1.25%
4c(2) Qualifying Golf Course 1.25% NA
4c(3)(i) Non-Profit Community Service Oriented Organization (Non-Revenue) 1.50% NA
4c(3)(ii) Non-Profit Community Service Oriented Organization (Donations) 1.50% 1.50%
4c(4) Post-Secondary Student Housing 1.00% NA
4c(5)(i) Manufactured Home (MH) Park 1.25% NA
4c(5)(ii) MH Park Cooperative (Over 50% Shareholder Occupied) 0.75% NA
4c(5)(ii) MH Park Cooperative (50% or Less Shareholder Occupied) 1.00% NA
4c(6) Metro Non-Profit Recreational Property 1.25% NA
4c(7) Certain Non-Commercial Aircraft Hangars and Land: Leased Land 1.50% NA
4c(8) Certain Non-Commercial Aircraft Hangars and Land: Private Land 1.50% NA
4c(9) Bed and Breakfast (Up to 5 Units) 1.25% NA
4c(10) Seasonal Restaurant on a Lake 1.25% NA
4c(11) Marina First $500,000 Over $500,000
1.00% 1.25%
NA NA
4c(12) Non-Commercial Seasonal Residential Recreational (Cabin) First $76,000 $76,000 - $500,000 Over $500,000
1.00% 1.00% 1.25%
0.40% 1.00% 1.25%
4d Qualifying Low-Income Rental Housing First $100,000 Over $106,000
0.75% 0.25%
NA NA
5(1) Unmined Iron Ore and Low-Grade Iron-Bearing Formations 2.00% 2.00%
5(2) All Other Property Not Otherwise Classified 2.00% NA

Appendix B ▪ Summary of 2015 State Board Orders
2016 Property Values and Assessment Practices Report 23
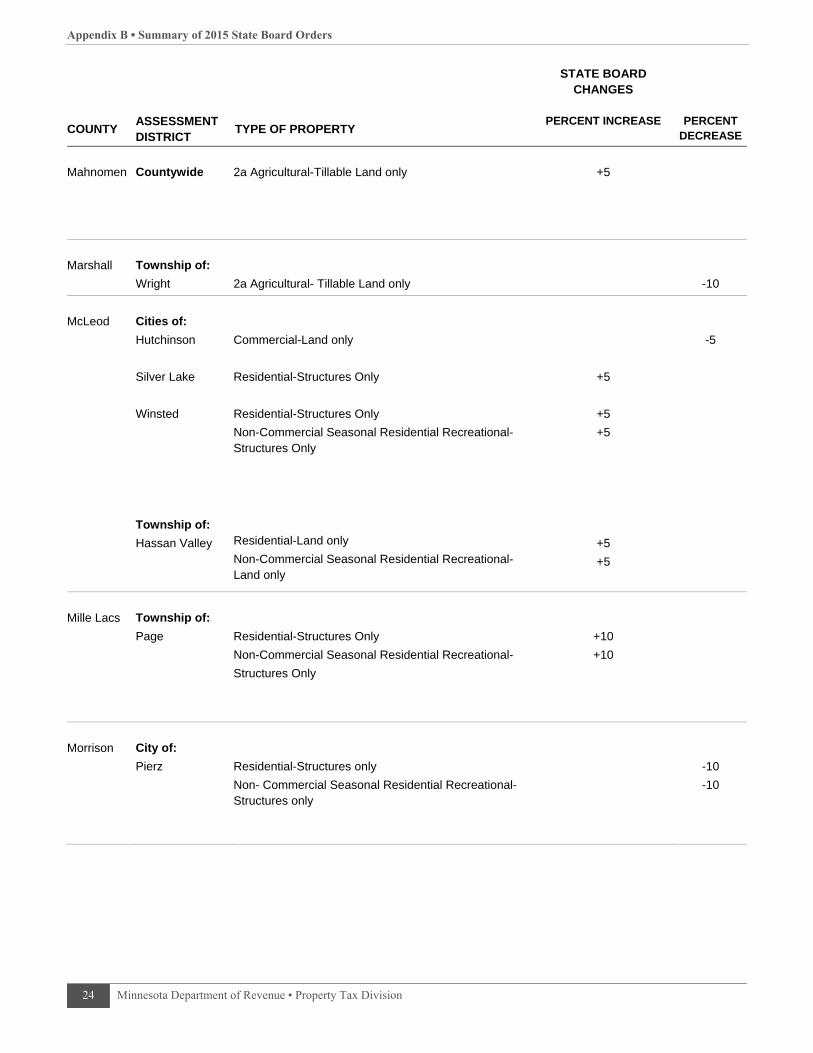
AppendixB▪Summaryof2015StateBoardOrders
2015StateBoardOrdersbyCounty STATE BOARD
CHANGES
COUNTY ASSESSMENT DISTRICT
TYPE OF PROPERTY PERCENT INCREASE PERCENT
DECREASE
Benton
Township of:
Langola
Residential Structures- Off Water
Non-Commercial Seasonal Residential Recreational-
Structures only-Off Water
+10
+10
Carlton
Cities of:
Carlton
Residential-Land and Structures
Only to the portion of the City that was annexed
From the city of Thompson
Non-commercial Seasonal Residential Recreational-
Land and Structures
Only the portion of the city of Carlton that was annexed
From the city of Thompson
+5
+5
Chippewa
Township of:
Sparta
Residential-Land Only-Excluding “Site Value” Non-Commercial Seasonal Residential Recreational – Land Only-Excluding “Site Value”
+5
+5
Clearwater
Township of:
Copley
Residential-Land Only
+5
Cook
Township of:
Unorganized 2W
Residential-Structures only
Non-Commercial Seasonal Residential Recreational-Structures only
+10
+10
Freeborn
City of:
Geneva
Residential-Structures only
+5
Koochiching
Countywide:
Township of:
Unorganized #98
2a Agricultural-Land Only
2b Rural Vacant Land-Land Only
2c Managed Forest-Land only
Residential Structures Only
Non-Commercial Seasonal Residential-Structures only
+5
+5
-5
-5
-5
Appendix B ▪ Summary of 2015 State Board Orders
24 Minnesota Department of Revenue ▪ Property Tax Division
STATE BOARD CHANGES
COUNTY ASSESSMENT DISTRICT
TYPE OF PROPERTY PERCENT INCREASE PERCENT
DECREASE
Mahnomen
Countywide
2a Agricultural-Tillable Land only
+5
Marshall
Township of:
Wright
2a Agricultural- Tillable Land only
-10
McLeod
Cities of:
Hutchinson
Silver Lake
Winsted
Township of:
Hassan Valley
Commercial-Land only
Residential-Structures Only
Residential-Structures Only
Non-Commercial Seasonal Residential Recreational-Structures Only
Residential-Land only
Non-Commercial Seasonal Residential Recreational-Land only
+5
+5
+5
+5
+5
-5
Mille Lacs
Township of:
Page
Residential-Structures Only
Non-Commercial Seasonal Residential Recreational-
Structures Only
+10
+10
Morrison
City of:
Pierz
Residential-Structures only
Non- Commercial Seasonal Residential Recreational-Structures only
-10
-10
Appendix B ▪ Summary of 2015 State Board Orders
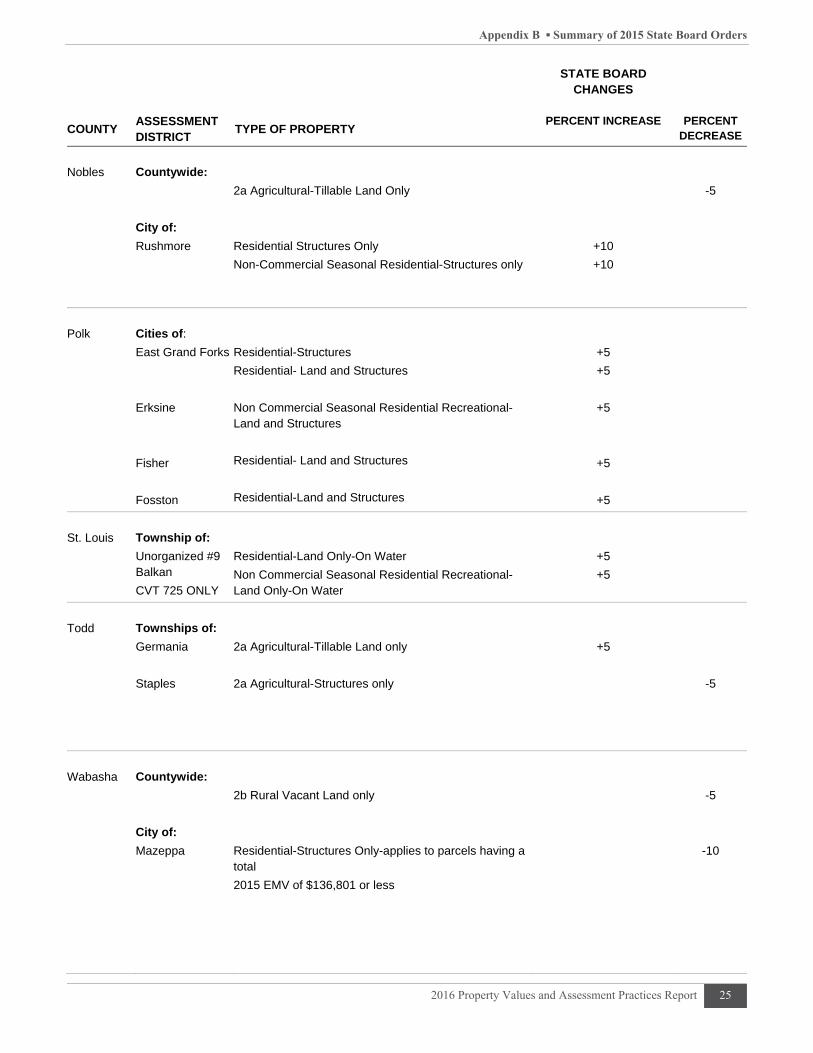
2016 Property Values and Assessment Practices Report 25
STATE BOARD CHANGES
COUNTY ASSESSMENT DISTRICT
TYPE OF PROPERTY PERCENT INCREASE PERCENT
DECREASE
Nobles
Countywide:
City of:
Rushmore
2a Agricultural-Tillable Land Only
Residential Structures Only
Non-Commercial Seasonal Residential-Structures only
+10
+10
-5
Polk
Cities of:
East Grand Forks
Erksine
Fisher
Fosston
Residential-Structures
Residential- Land and Structures
Non Commercial Seasonal Residential Recreational-Land and Structures
Residential- Land and Structures
Residential-Land and Structures
+5
+5
+5
+5
+5
St. Louis
Township of:
Unorganized #9 Balkan
CVT 725 ONLY
Residential-Land Only-On Water
Non Commercial Seasonal Residential Recreational-Land Only-On Water
+5
+5
Todd
Townships of:
Germania
Staples
2a Agricultural-Tillable Land only
2a Agricultural-Structures only
+5
-5
Wabasha
Countywide:
City of:
Mazeppa
2b Rural Vacant Land only
Residential-Structures Only-applies to parcels having a total
2015 EMV of $136,801 or less
-5
-10

Appendix B ▪ Summary of 2015 State Board Orders
26 Minnesota Department of Revenue ▪ Property Tax Division
STATE BOARD CHANGES
COUNTY ASSESSMENT DISTRICT
TYPE OF PROPERTY PERCENT INCREASE PERCENT
DECREASE
Wadena
Countywide:
Residential – Land only On-Water Lakeshore
Off Water only
Non-Commercial Seasonal Residential Recreational – Land Only On- Water only
-15
-15
Appendix C ▪ Statewide Values and Assessment Practices Indicators
2016 Property Values and Assessment Practices Report 27
AppendixC▪StatewideValuesandAssessmentPracticesIndicatorsThe following pages contain statewide charts and maps with information about Minnesota property val-ues, sales ratio measures, and the Green Acres and Rural Preserve programs.
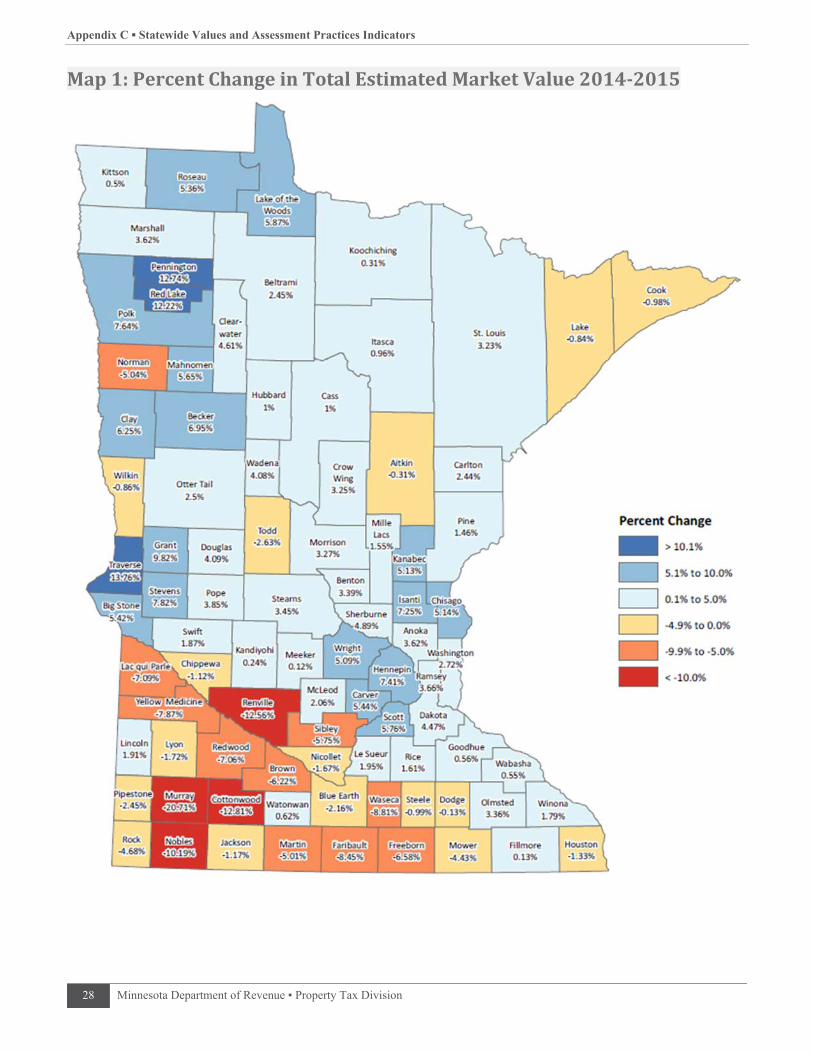
MAP 1 displays the percent change in estimated market value for each county from assessment years 2014 to 2015.
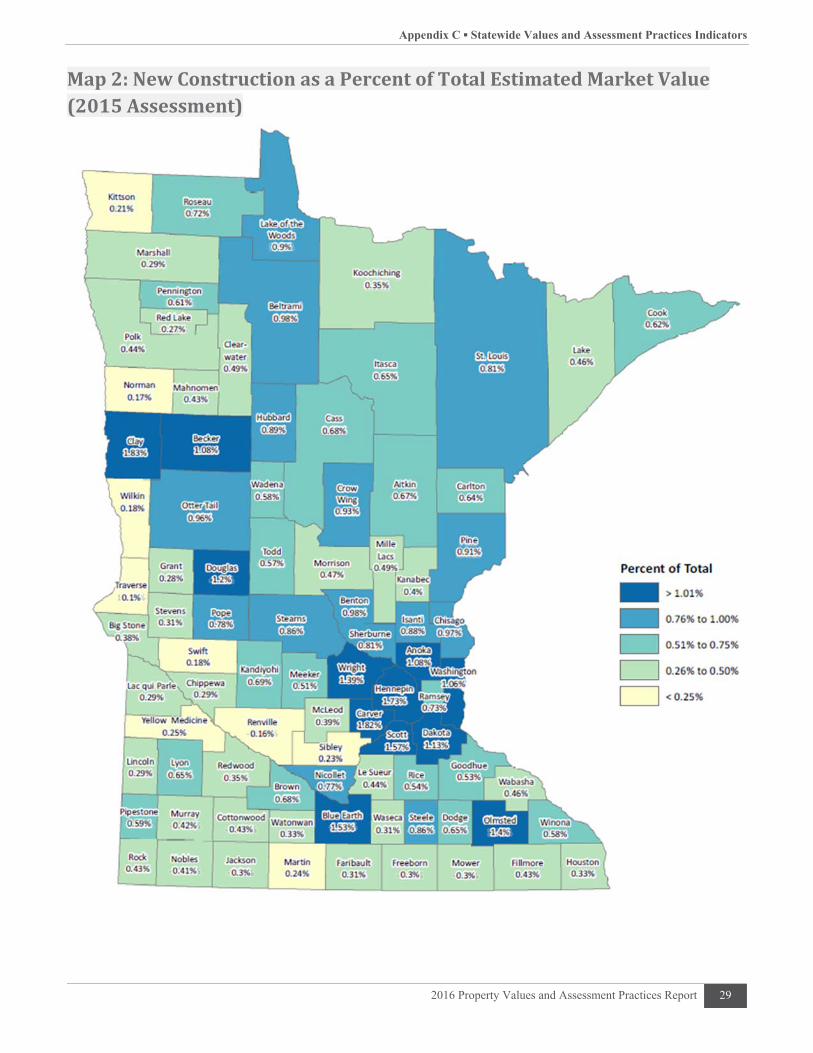
MAP 2 displays the average percentage that new construction composes of estimated market value for each county from assessment years 2014 to 2015.
MAP 3 shows taxable tillable Green Acres/Rural Preserve values. Values to be used for tillable properties enrolled in Green Acres or Rural Preserve for a given county are the product of the county’s factor and the base county tillable value, which is $9,400 for the 2015 assessment for taxes payable in 2016. Higher taxable values are shown in the southern portion of the state while lower taxable values are shown in the northeastern part of the state.
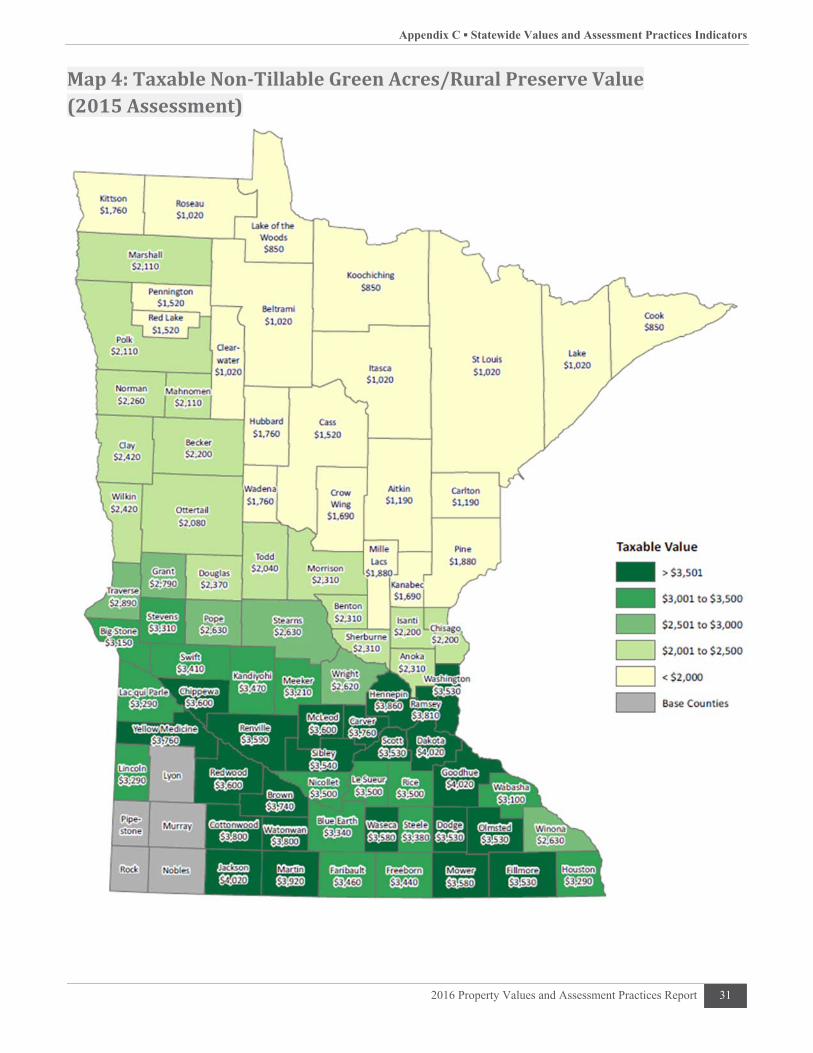
MAP 4 shows taxable non-tillable Green Acres/Rural Preserve values. Values to be used for non-tillable properties enrolled in Green Acres or Rural Preserve do not vary as widely as the values for tillable prop-erties. The non-tillable values are closer to the tillable values in the northern half of the state.
Appendix C ▪ Statewide Values and Assessment Practices Indicators
28 Minnesota Department of Revenue ▪ Property Tax Division
Map1:PercentChangeinTotalEstimatedMarketValue2014‐2015
Appendix C ▪ Statewide Values and Assessment Practices Indicators
2016 Property Values and Assessment Practices Report 29
Map2:NewConstructionasaPercentofTotalEstimatedMarketValue(2015Assessment)

Appendix C ▪ Statewide Values and Assessment Practices Indicators
30 Minnesota Department of Revenue ▪ Property Tax Division
Map3:TaxableTillableGreenAcres/RuralPreserveValue(2015Assessment)
Appendix C ▪ Statewide Values and Assessment Practices Indicators
2016 Property Values and Assessment Practices Report 31
Map4:TaxableNon‐TillableGreenAcres/RuralPreserveValue(2015Assessment)
Appendix D ▪ Glossary
32 Minnesota Department of Revenue ▪ Property Tax Division
AppendixD▪Glossary
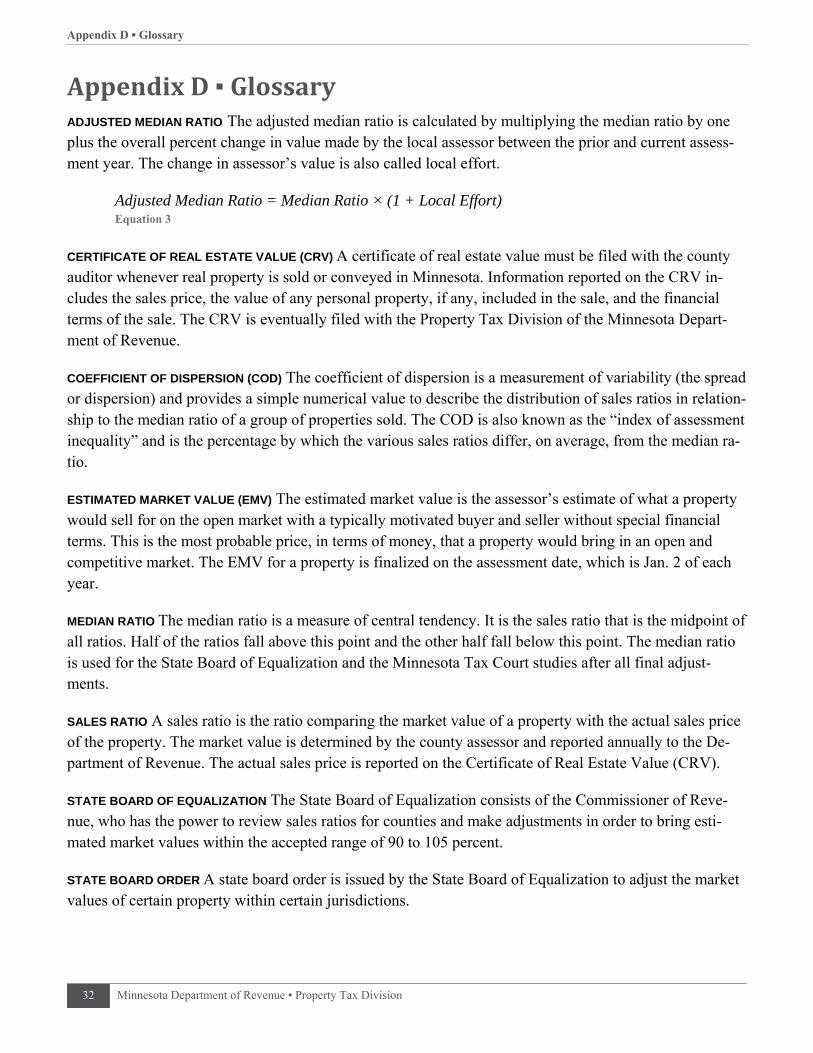
ADJUSTED MEDIAN RATIO The adjusted median ratio is calculated by multiplying the median ratio by one plus the overall percent change in value made by the local assessor between the prior and current assess-ment year. The change in assessor’s value is also called local effort.
Adjusted Median Ratio = Median Ratio × (1 + Local Effort) Equation 3
CERTIFICATE OF REAL ESTATE VALUE (CRV) A certificate of real estate value must be filed with the county auditor whenever real property is sold or conveyed in Minnesota. Information reported on the CRV in-cludes the sales price, the value of any personal property, if any, included in the sale, and the financial terms of the sale. The CRV is eventually filed with the Property Tax Division of the Minnesota Depart-ment of Revenue.
COEFFICIENT OF DISPERSION (COD) The coefficient of dispersion is a measurement of variability (the spread or dispersion) and provides a simple numerical value to describe the distribution of sales ratios in relation-ship to the median ratio of a group of properties sold. The COD is also known as the “index of assessment inequality” and is the percentage by which the various sales ratios differ, on average, from the median ra-tio.
ESTIMATED MARKET VALUE (EMV) The estimated market value is the assessor’s estimate of what a property would sell for on the open market with a typically motivated buyer and seller without special financial terms. This is the most probable price, in terms of money, that a property would bring in an open and competitive market. The EMV for a property is finalized on the assessment date, which is Jan. 2 of each year.
MEDIAN RATIO The median ratio is a measure of central tendency. It is the sales ratio that is the midpoint of all ratios. Half of the ratios fall above this point and the other half fall below this point. The median ratio is used for the State Board of Equalization and the Minnesota Tax Court studies after all final adjust-ments.
SALES RATIO A sales ratio is the ratio comparing the market value of a property with the actual sales price of the property. The market value is determined by the county assessor and reported annually to the De-partment of Revenue. The actual sales price is reported on the Certificate of Real Estate Value (CRV).
STATE BOARD OF EQUALIZATION The State Board of Equalization consists of the Commissioner of Reve-nue, who has the power to review sales ratios for counties and make adjustments in order to bring esti-mated market values within the accepted range of 90 to 105 percent.
STATE BOARD ORDER A state board order is issued by the State Board of Equalization to adjust the market values of certain property within certain jurisdictions.

Appendix D ▪ Glossary
2016 Property Values and Assessment Practices Report 33
TAXABLE MARKET VALUE (TMV) The taxable market value is the value that a property is actually taxed on after all limits, deferrals, and exclusions are calculated. It may or may not be the same as the property’s estimated market value or limited market value.
TRIMMING METHOD The trimming method used here is to exclude sales with rations less than 0.5 or greater than 2. This eliminates a few extreme sales that would distort the COD.
Appendix E ▪ 12-Month Study
34 Minnesota Department of Revenue ▪ Property Tax Division
AppendixE▪12‐MonthStudyThe 12-month study is mainly used to determine State Board of Equalization Orders. The 12 months en-compass the period from Oct. 1 of one year through Sept. 30 of the following year. The dates are based on the dates of sale as indicated on the Certificate of Real Estate Value (CRV). These certificates are filled out by the buyer or seller whenever property is sold or conveyed and filed with the county. The certifi-cates include the sales price of the property, disclosure of any special financial terms associated with the sale, and whether the sale included personal property. The actual sales price from the CRV is then com-pared to what the county has reported as the market value.
The data contained in the report is based upon the 12-month study using sales from Oct. 1, 2013 through Sept. 30, 2014. These sales are compared with preliminary values for assessment year 2015, taxes payable 2016. The sale prices are adjusted for time and financial terms to the date of the assessment, which is Jan. 2 of each year. For this study, the sales are adjusted to Jan. 2, 2015. In areas with few sales, it is very dif-ficult to adjust for inflation or deflation because the sales samples are used to develop time trends. For ex-ample, based on an annual inflation rate of 3 percent (.25 percent monthly), if a house were purchased in August 2013 for $200,000, it would be adjusted to a January 2015 value of $202,500, or the sales price would be adjusted upward by 1.25 percent for the 5-month timeframe to January.
The State Board of Equalization orders assessment changes when the level of assessment (as measured by the median sales ratio) is below 90 percent, or above 105 percent. The orders are usually on a county-, city-, or township-wide basis for a particular classification of property. All State Board Orders must be implemented by the county. The changes will be made to the current assessment under consideration, for taxes payable the following year.
The equalization process (including issuing State Board Orders) is designed not only to equalize values on a county-, town-, or city-wide basis, but also to equalize values across county lines to ensure a fair valua-tion process across taxing districts, county lines, and property types. State Board Orders are implemented only after a review of values and sales ratios and discussions with the county assessors in the county af-fected by the State Board Orders, county assessors in adjacent counties, and the commissioner.
Appendix F ▪ 21-Month Study
2016 Property Values and Assessment Practices Report 35
AppendixF▪21‐MonthStudyThe 21-month study is different from the 9-month and 12-month studies. Its purpose is to adjust values used for state aid calculations so that all jurisdictions across the state are equalized. In order to build sta-bility into the system, a longer term of 21 months is used, which allows for a greater number of sales. While the 9- and 12-month studies compare the actual sales to the assessor’s estimated market value, the 21-month study compares actual sales to the assessor’s taxable market value. As with the 9- and 12-month studies, the sale prices are adjusted for time and terms of financing.
The 21-month study is used to calculate adjusted net tax capacities that are used in the foundation aid for-mula for school funding. It is also used to calculate tax capacities for Local Government Aid (LGA) and various smaller aids such as library aid. This study is also utilized by bonding companies to rate the fiscal capacity of different governmental jurisdictions.
The adjusted net tax capacity is used to eliminate differences in levels of assessment between taxing juris-dictions for state aid distributions. All property is meant to be valued at its selling price in an open market, but many factors make that goal hard to achieve. The sales ratio study can be used to eliminate differences caused by local markets or assessment practices.
The adjusted net tax capacity is calculated by dividing the net tax capacity of a class of property by the sales ratio for the class. For example, the net tax capacity for residential properties is divided by the resi-dential sales ratio to produce the residential adjusted net tax capacity. The process would be repeated for all of the property types. The total adjusted net tax capacity would be used in state aid calculations.