2013 property values and assessment practices … property values and assessment practices report i...
TRANSCRIPT

2013 Property Values and
Assessment Practices Report Assessment Year 2012
A REPORT SUBMITTED TO THE MINNESOTA STATE LEGISLATURE
PURSUANT TO
LAWS 2001, FIRST SPECIAL SESSION, CHAPTER 5, ARTICLE 3, SECTION 92 AND
MINNESOTA STATUTES, SECTION 273.1108
Property Tax Division
Minnesota Department of Revenue
March 1, 2013


2013 Property Values and Assessment Practices Report i
March 1, 2013
To Members of the Legislature of the State of Minnesota:
I am pleased to present to you this report on property values and assessment practices in the State of Minne-
sota. This is the 11th annual version of this report. Beginning last year, this report has been combined with
the annual report related to agricultural properties and Green Acres, satisfying the requirements of both Min-
nesota Laws 2001, First Special Session, chapter 5, article 3, section 92 and Minnesota Statutes, section
273.1108.
This report provides a summary of assessed property values and assessment practices within the state of Min-
nesota, with an emphasis on market values for 2a agricultural and 2b rural vacant land properties, and Green
Acres value methodology and determinations.
Sincerely,
Myron Frans Commissioner Minnesota Department of Revenue

ii Minnesota Department of Revenue ▪ Property Tax Division
Per Minnesota Statutes, section 3.197, any report to the Legislature must contain, at the beginning of the report, the cost of preparing the report, including any costs incurred by another agency or another level of government. This report cost $5,800.

2013 Property Values and Assessment Practices Report iii
Table of Contents
Executive Summary 1
Introduction 3
Overview of the Minnesota Department of Revenue’s Role 3
Property Tax Classifications 4
Property Valuation Basics 5
A note on foreclosures 6
Sales Ratio Studies and Analyses 7
Purpose of Sales Ratio Studies 7
Sales Ratio Study Process 8
Sales Ratio Studies: Measures of Central Tendency and Uniformity 9
2011 Sales Ratio Study for the 2012 State Board of Equalization 10
Median Sales Ratios and Coefficients of Dispersion by Property Type 10
Coefficient of Dispersion (COD) Acceptable Ranges by Property Type 11
Value Trends 12
Taxable Market Value 13
Green Acres 15
Taxable Green Acres Value 15
Non-tillable lands 18
Green Acres Values: 2012 and 2013 Assessment Years 20
Agricultural Land Sales Trends 2006-2012 (Assessment Years 2008-2013) 20
Rural Preserve 21
Taxable Rural Preserve Value 21
Tax Distribution 23
Tax Liability Share by Classes of Property 23
APPENDIX A ▪ Classification Rate Table 24
APPENDIX B ▪ Summary of 2012 State Board Orders 25
2012 State Board Orders by County 25
2012 State Board Orders by Property Classification and Jurisdictions 25
Summary of 2012 Non-Orders 26
Non-Orders by County/City 27

iv Minnesota Department of Revenue ▪ Property Tax Division
APPENDIX C ▪ Statewide Values and Assessment Practices Indicators 28
Figure 1: Growth in Total EMV, TMV and Excluded Value, 2005-2012 29
Figure 2: Statewide Total Estimated Market Value by Property Type (in billions of $) 30
Map 1: Percent Change in Total Estimated Market Value 2011-2012 31
Map 2: New Construction as a Percent of Total Estimated Market Value 2012 32
Map 3: Taxable Tillable Green Acres/Rural Preserve Value 33
Map 4: Taxable Non-Tillable Green Acres/Rural Preserve Value 34
APPENDIX D ▪ Glossary 35
APPENDIX E ▪ 12-Month Study 37
APPENDIX F ▪ 21-Month Study 38

Executive Summary
2013 Property Values and Assessment Practices Report 1
Executive Summary
This report analyzes the assessment of various types of property including residential, seasonal recreational
residential (cabins), apartments, commercial/industrial, agricultural, and rural lands.
The real estate market throughout Minnesota showed some improvement over 2011 with the number of sales
increasing for all property classes except residential and seasonal through the fall of 2012. Estimated market
values increased for both apartments and agricultural properties, as well. Residential, seasonal, and commer-
cial properties, however, continued to decline in value. While overall estimated market values decreased by 0.3
percent from 2011 to 2012, this is an improvement over the 1.9 percent decrease seen the previous year. The
counties with estimated market value increases were in the southwest and northwest regions of the state.
In the period from 2000 through 2006, all values increased by at least 10 percent annually, but the statewide
values for residential, seasonal, and commercial/industrial properties have been declining since 2007. Between
2011 and 2012, only the estimated market values for the agricultural and rural classes and the apartment class
experienced positive growth in aggregate statewide. In addition, agricultural values have risen at the same time
that the value of other development has declined, and these changes have resulted in a decrease in value de-
ferred under Green Acres. In 2012, the total amount of value deferred under Green Acres was 25 percent less
than in 2011. Agricultural and rural vacant estimated market values declined in 26 counties between 2011 and
2012, while Green Acres taxable values declined in 8 counties.
PROPERTY TYPE STATEWIDE
CHANGE IN VALUE
Residential Homestead -5.6%
Apartment +3.0%
Seasonal -6.9%
Agricultural / Rural Vacant / Forest lands +10.7%
Commercial/Industrial -1.4%
Table 1
A sales ratio measures how close assessors’ values are to the ultimate sales price of property. For the 2012
assessment, the statewide median sales ratios for the most property types were in the targeted 90 to 105 per-
cent range (see Table 2 on page 10).
Assessment quality remained relatively consistent between the 2011 and 2012 assessments. This is reflected
in both of the sales ratio and the coefficient of dispersion (COD), the two primary measures of assessment
quality. As a general rule, both sales ratios and coefficients of dispersion are more accurate in classes with
more sales activity because a larger sales sample is more likely to reflect the range of values for all properties
in the jurisdiction.

Executive Summary
2 Minnesota Department of Revenue ▪ Property Tax Division
The COD measures the uniformity of assessments. For the 2012 assessment, the coefficients generally were
within the International Association of Assessing Officers’ (IAAO) acceptable ranges in counties that had an
adequate sample of sales. This is an area of concern in places with smaller sales samples. The IAAO ranges
are shown on page 11. The State Board of Equalization issues corrective orders when the median sales ratio
for a property type is outside the 90 to 105 percent acceptable range. In 2012, State Board Orders were issued
in two counties. In 2011, State Board orders were issued in nine counties. The Minnesota Department of
Revenue’s appraisal staff works with assessors to identify areas of concern for future assessments to help
avoid State Board orders. The issues to watch usually fall into three watch indicator categories:
1. Low ratios in areas with a history of few sales;
2. Sales ratios near the 90 to 105 range boundaries; and,
3. Areas with uniformity concerns

Introduction
2013 Property Values and Assessment Practices Report 3
Introduction
During the 2001 special legislative session, the Minnesota legislature mandated an annual report from the De-
partment of Revenue on property tax values and assessment practices within the state. This year is the 11th
annual report on such data and practices to the legislature. This report has also been combined with the an-
nual report related to agricultural properties and Green Acres, satisfying the requirements of both Minnesota
Laws 2001, First Special Session, chapter 5, article 3, section 92 and Minnesota Statutes, section 273.1108.
In accordance with those mandates, this report contains:
information by major types of property on a statewide basis and at various jurisdictional levels;
recent market value trends, including projections;
trend analysis of excluded market value;
assessment quality indicators, including sales ratios and coefficients of dispersion for counties;
percentage of parcels that change in value each year;
a summary of State Board Orders;
Green Acres value methodology and determinations; and,
assessment and classification practices pertaining to 2a agricultural and 2b rural vacant land property.
The purpose of this report is to provide the legislature with an accurate snapshot of the current state of prop-
erty tax assessment, as well as an overview of the Minnesota Department of Revenue’s responsibility to over-
see the state’s property tax assessment process. This report provides a vehicle for an ongoing, systematic col-
lection of property value data for the purpose of monitoring and analyzing underlying value trends and as-
sessment quality indicators. This information and analysis is used to satisfy the Department’s responsibility to
inform government officials and the public about valuation trends within the property tax system.
Overview of the Minnesota Department of Revenue’s Role
Property taxes are an important source of revenue for all local units of government in the Minnesota, including
counties, cities, townships, and school districts. The primary responsibility of the department’s Property Tax
Division is to ensure fair and uniform administration of, and compliance with, Minnesota’s property tax laws.
The Property Tax Division measures compliance with property tax laws through:
The State Board of Equalization, which ensures that property taxpayers pay their fair share – no more
and no less. The commissioner of revenue, acting as the State Board of Equalization, has the authority
to issue orders increasing or decreasing assessed market values in order to bring about equalization;
Promotion of uniformity of administration among the counties to ensure that each taxpayer will be
treated in the same manner regardless of where the taxpayer lives;
Delivery of accurate and timely aid calculations, certifications, and actual aid payments;
Education and information for county officials, including technical manuals, bulletins, answers to spe-
cific questions, and courses taught by Division staff. These offerings provide county officials the sup-
port and training necessary to administer property tax laws equitably and uniformly.

Property Tax Classifications
4 Minnesota Department of Revenue ▪ Property Tax Division
The authority to define properties by
classification is granted in the Minneso-
ta Constitution, Article X, which states,
“Taxes shall be uniform upon the same
class of subjects.” In other words, simi-
larly-used properties are given similar
classifications. Classification rates are
applied uniformly within a given classi-
fication, but the rates may differ be-
tween different classifications.
Property Tax Classifications
In Minnesota, property is classified according to its use on the assessment date – Jan. 2. The classification sys-
tem is used to identify a given property’s classification rate, which in turn determines the share of the tax bur-
den borne by that property. There are five main property tax classifications used. In reality, the breakdown of
property tax classifications includes 35 specific statutory descriptions that result in over 55 different class rates
based on value tiers and homestead benefits. A classification rate
table is shown in Appendix A. The five main property tax classifica-
tions in Minnesota are:
Class 1 properties: Mostly residential properties.
Class 2 properties: Mostly rural properties, including agri-
cultural and forestland.
Class 3 properties: Commercial and industrial properties.
Class 4 properties: Residential non-homestead properties,
seasonal/resort properties, and commercial properties.
Class 5 properties: Iron ore and iron-bearing formations
and “other” properties not classified elsewhere.
Defining the classification rate of a property is one of the first steps in calculating property taxes. The class
rate is then used to determine a property’s net tax capacity:
Taxable Market Value × Classification Rate = Net Tax Capacity
Equation 1
The classification system is also used as part of the Department of Revenue’s efforts to measure assessment
quality. The sales ratio study and State Board of Equalization use these classifications to study value trends
and accuracy of assessors’ valuations. For the purposes of this report, the department has focused on the fol-
lowing major classification types (which do not necessarily follow the classification system’s one through five
numbering as shown above).
Residential
Seasonal recreational residential (cabins)
Apartments
Commercial/industrial properties
Agricultural and rural lands

Property Valuation Basics
2013 Property Values and Assessment Practices Report 5
Minnesota Statutes, section 272.03,
subdivision 8 defines market value as:
“‘…the usual selling price at the place
where the property to which the term is
applied shall be at the time of assess-
ment; being the price which could be
obtained at a private sale or an auction
sale, if it is determined by the assessor
that the price from the auction sale rep-
resents an arm's-length transaction. The
price obtained at a forced sale shall not
be considered.”
Property Valuation Basics
Minnesota Law requires that all property be valued at its market value. For property tax assessment purposes,
the market value is rounded so that any amount under $100 is rounded up to $100, and any value exceeding
$100 is rounded to the nearest $100. Assessors are prohibited from adopting a lower or different standard of
value, as the value is used for the basis of taxation. Assessors are also required to determine the value of the
land only, the value of the structures and improvements to the land separately, and the total market value
comprised of the land and structure/improvement value.
The three standard approaches used to determine market value are
the cost approach, the income approach, and the sales comparison
approach. The cost approach estimates the value of the land as if
it was vacant, and then adds the depreciated cost of the improve-
ments to arrive at an estimate of value. The income approach uti-
lizes the income or rent that a property may be expected to produce
to determine the value. It is most commonly used for income-
producing properties. Finally, the sales comparison approach
estimates the value of property by looking at the sales prices of
comparable properties that have sold in the same market. The sales
comparison method is the method most often used for property tax
assessment purposes.
The “market value” used for property tax purposes is the “open
market value,” which is the price a property would sell for under typical, normal, and competitive conditions.
It is also called the estimated market value (EMV). The most common method of determining the EMV is
through the comparable sales approach. The EMV, like the property’s classification, is determined on Jan. 2
of the assessment year.
Appraisal principles and procedures guidelines commonly use the following criteria to determine whether a
property meets the definition of an open-market transaction:
1. The buyer and seller are typically motivated;
2. Both parties are well-informed or well-advised, and each party is acting in its own best interest;
3. A reasonable amount of time has been allowed for the property to be exposed to the open market;
4. Payment is made in cash or a cash equivalent;
5. Financing (if any) is on terms generally available to the community and is typically for the property
type in its locale; and
6. The price represents a normal consideration for the property sold, and appears unaffected by special
financing amounts or terms, services, fees, costs, or credits incurred in the transaction.

Property Valuation Basics
6 Minnesota Department of Revenue ▪ Property Tax Division
A note on foreclosures
The statutory definitions of market value, as well as the standards used in assessment practices, preclude as-
sessors from considering foreclosures as part of open-market transactions in the sales approach of valuing
property. As such, foreclosure sales are not included in the sales ratio study conducted by the Department of
Revenue.
For assessors, the International Association of Assessing Officers standard on sales ratio studies provides that
“the physical characteristics of the property on the date of the assessment must be the same as those on the
date of the sale.”1 For most open-market transactions, this is the case. However, for many foreclosure sales,
determining the characteristics and state of the property on the date of the sale is very difficult.
In some limited markets, foreclosure-type sales are so prevalent as to be driving the sales prices of non-
foreclosure home sales. In these markets, foreclosure sales that otherwise meet the definition of “open mar-
ket” may be used to help value other properties, but they usually are not used in a sales study unless the asses-
sor has made an inspection reasonably close to the time of the sale. Even if not directly used, it can also be
argued that the existence of foreclosed properties and buyers’ ability to buy these properties, by their exist-
ence and availability, has a dampening effect on the value of all other properties that are offered for sale. Con-
sequently, their existence would already be reflected in the real estate market.
Regardless, it is important to note that assessors value similar properties in a similar manner. The sales price
of any given home (whether open-market or not) will not be the sole determinant in that property’s EMV as
determined by the assessor for property tax purposes.
The EMV is not necessarily the value on which the property is taxed. The legislature has provided various
programs which may reduce the market value for certain types of property for purposes of taxation. These
reductions are made by deferment, limitation or exclusion, such as Green Acres or Disabled Veterans Home-
stead Valuation Exclusion programs. The market value after these reductions are applied is referred to as the
taxable market value (TMV). TMV is explained later in this report.
1 International Association of Assessing Officers, Standard on Ratio Studies (Kansas City, MO: International Association of Assessing Officers, 2010), 9.

Sales Ratio Studies and Analyses
2013 Property Values and Assessment Practices Report 7
The sales ratio studies have three
basic purposes:
1. To plan an upcoming assessment
2. To evaluate an existing assessment
3. To identify inequities
Sales Ratio Studies and Analyses
In order to evaluate the accuracy and uniformity of assessments within the state (and thus to ensure compli-
ance with property tax laws), the Minnesota Department of Revenue conducts annual sales ratio studies.
These studies measure the relationship between appraised values and market values or the actual sales price.
As a mathematical expression, a sales ratio is the assessor’s estimated market value of a property divided by its
actual sales price, as seen here:
Equation 2
The sales ratio study provides an indication of the level of assessment (how close appraisals are to market val-
ue on an overall basis), as well as the uniformity of assessment (how close individual appraisals are to the me-
dian ratio and each other).
Purpose of Sales Ratio Studies
Sales are the foundation for mass appraisal when utilizing a sales comparison approach. Assessors rely heavily
on sales of properties in their jurisdictions when estimating values of all other similar properties in the same
area. Assessors are required to use sales information in their assessment work. The validity of sales infor-
mation is crucial. The sales analysis and study conducted by the assessor is only as good as the information
provided to and the work completed by the assessor.
Sales information, the majority of which is required to be reported on
a Certificate of Real Estate Value, go through a verification and review
process before being utilized by the assessor as part of a sales ratio
study to estimate future values. Minnesota is fortunate to be a state
that requires reporting of sales information. Certain sales are automat-
ically removed from consideration, while others require more scrutiny
and review by the assessor. When only verified sales remain, the asses-
sor is able to analyze and study them to make some generalizations for the market and to make any changes in
value to respond to the market.
A formal sales study is also conducted on these sales to verify the assessors’ actions responded appropriately
to the changes in the market. The Department of Revenue conducts additional studies as a check on the as-
sessors’ performances and to ensure equalization of values. Any of these formal studies involve data analysis,
statistical measurement, critical thinking to develop solutions to correct issues, and reporting of results.
The sales ratio study is the culmination of the ongoing process of collecting information about the local real
estate market. It provides important information in planning the upcoming assessment, evaluating the existing
assessment, and identifying inequities in the assessment. There are other uses, as well. The state conducts sev-

Sales Ratio Studies and Analyses
8 Minnesota Department of Revenue ▪ Property Tax Division
eral sales ratio studies to assist in assessment review and equalization and to aid the tax court. Many county
and local assessors also perform their own in-house sales ratio analyses. Sales ratio studies are used by asses-
sors in refining their valuation levels, by the tax court in adjudicating assessments, by the State Board of
Equalization in determining orders, and by various aid formulas that utilize measures of equalized values. By
the time sales ratio studies are completed by the department, there is an expectation that all the underlying
sales data has been reviewed and are representative of the market.
The three main sales ratio studies used are:
1. A 12-month study: This study uses sales from Oct. 1 of a given year to Sept. 30 of the following
year, and is used to estimate market values for the following assessment. In other words, sales that
occurred between Oct. 1, 2011 and Sept. 30, 2012 are used for determining estimated market values
for the Jan. 2, 2013 assessment. The 12-month study is discussed in greater detail in Appendix E.
2. A nine-month study: This study is used by the Tax Court and is based on sales occurring between
Jan. 1 and Sept. 30 of a given year. (It is the same as the 12-month study, but excludes the sales from
October, November, and December.)
3. A 21-month study: This study is used for levy and aid purposes. This study uses sales that run from
Jan. 1 of a given year to Sept. 30 of the following year and compares the sales to the assessor’s market
values. The 21-month study is discussed in greater detail in Appendix F.
The State Board of Equalization uses sales ratio studies to determine the assessment level for equalization
purposes. The study may indicate inequities in the assessment. It may also help to guide assessors by provid-
ing information on which to base adjustments to the assessment with respect to neighboring counties. The
studies are useful to legislators to develop tax policy or to change tax rates. Property owners may use the stud-
ies if they have concerns about unfair or inequitable treatment by assessors.
When the commissioner of revenue determines that there has been an unfair or inequitable assessment, the
commissioner is authorized to order a reassessment of any taxing district in order to make a correction. The
commissioner assists the State Board of Equalization and in that capacity is empowered to reduce wide dis-
parities in assessment levels between counties and among the classes of real estate within counties.
Sales ratio studies are an excellent tool for the commissioner of revenue to measure how closely assessed val-
ues are to actual sales prices, and to judge the quality of equalization within classes of properties, and between
classes and areas.
Sales Ratio Study Process
As previously stated, sales ratio studies are only as reliable as the information they are based on. Therefore, it
is necessary to take action to ensure the dependability of the information used in the ratio studies. The five
steps necessary are as follows:
1. Gather basic data on real estate transfers.

Sales Ratio Studies and Analyses
2013 Property Values and Assessment Practices Report 9
2. Screen and edit information to make any necessary adjustments for conditions of sale and exclude all
sales that do not represent arm’s-length transactions.
3. Put relevant data into an acceptable format for processing on computer.
4. Sort information by listed categories of real estate within each area.
5. Total the data and compute statistics to describe the information.
One of the main objectives in property tax administration is an equalized assessment. It is important that
maximum equalization be attained both among local property owners and between taxing districts because
the assessment serves as a basis for:
1. Tax levies by overlapping governmental units (i.e. counties, school districts, and special taxing dis-
tricts).
2. Determination of net bonded indebtedness restricted by statute to a percentage of either the local as-
sessed value or market value.
3. Determination of authorized levies restricted by statutory tax rate limits.
4. Apportionment of state aid to governmental units via the school aid formula and the local govern-
ment aid formula.
An equitable distribution of the tax burden is achieved only if it is built upon a uniform assessment. The re-
sult of a non-uniform assessment is a shift in the tax burden to other property owners.
Sales Ratio Studies: Measures of Central Tendency and Uniformity
Measures of central tendency describe the overall level at which properties are appraised. Mean, median, and
aggregate (weighted) ratios are used. For each measure, the individual ratio for each sale is used. After the
sales ratio for each sale has been determined, the measurements can be calculated.
The MEAN RATIO (the mathematical average of the sales ratios) is easily affected by ex-
treme sales ratios, and can lead to a significant distortion of the average.
The MEDIAN RATIO is the most widely used measure of central tendency because it is
not affected by extreme ratios. Department of Revenue guidelines indicate that the me-
dian ratio of a sales ratio study should range from 90 to 105 percent. The median ratio is
used to determine the level of assessment for the State Board of Equalization.
Finally, the AGGREGATE RATIO (or weighted mean) is computed by dividing the total as-
sessor’s EMV for all properties sold by the total sales price of those properties. Higher
priced properties are given more weight than lower priced properties. The aggregate
mean is generally accepted as the most appropriate measure to be used in the equaliza-
tion of aids.
Measures of uniformity measure the quality and uniformity of the assessment. The measures of uniformity
include the range of ratios, the coefficient of dispersion, and the price-related differential.

Sales Ratio Studies and Analyses
10 Minnesota Department of Revenue ▪ Property Tax Division
The RANGE is the difference between the smallest and largest ratios. A large range typi-
cally indicates poor uniformity. The range is highly susceptible to extreme ratios.
The COEFFICIENT OF DISPERSION is an index by which individual ratios vary from the
median. A low coefficient of dispersion indicates that appraisals within a class or area
are uniform; a high coefficient of dispersion indicates that properties are being ap-
praised at inconsistent percentages of market value. The coefficient of dispersion is cal-
culated by dividing the average absolute deviation (the average difference between each
ratio and the median ratio) by the median.
The PRICE-RELATED DIFFERENTIAL measures the relationship between the mean ratio
and the aggregate mean ratio. It is calculated by dividing the mean sales ratio by the ag-
gregate mean sales ratio. Appraisal uniformity may be regressive if high-value properties
are under-appraised relative to low-value properties, and would be evident by a price-
related differential of greater than one hundred percent. A progressive assessment
would be indicated by a price-related differential of less than one hundred percent, and
indicates that lower priced properties are under-appraised.
2011 Sales Ratio Study for the 2012 State Board of Equalization
There were 103,145 Certificates of Real Estate Value (CRV) received in the 2011 study for the 2012 State
Board of Equalization. Of these, 42,298 were considered good, current-year, open-market sales. These sales
provide the basis for the sales ratio studies.
Table 2 shows median sales ratios and coefficients of dispersion (COD) by property type for 2011 and 2012.
The lower the COD, the more uniform are the assessments. A high coefficient suggests a lack of equality
among individual assessments, with some parcels being assessed at a considerably higher ratio than others.
Note that property types with smaller sample sizes tend to have lower sales ratios and higher CODs.
Median Sales Ratios and Coefficients of Dispersion by Property Type Assessment Years 2011 and 2012
PROPERTY TYPE FINAL ADJUSTED
MEDIAN RATIO
COEFFICIENT
OF DISPERSION SAMPLE SIZE
State Board Year 2011 2012 2011 2012 2011 2012
Residential/Seasonal 97.8 99.0 11.3 10.9 35,588 29,740
Apartment 98.8 101.4 14.1 12.0 189 205
Commercial/Industrial 96.5 96.7 20.5 21.0 753 939
Resorts 90.9 88.2 16.8 23.5 10 14
Agricultural 2a / Rural Vacant 2b 95.2 94.0 18.7 18.8 2,061 2,492
Table 2
Sales Ratio Studies and Analyses
2013 Property Values and Assessment Practices Report 11
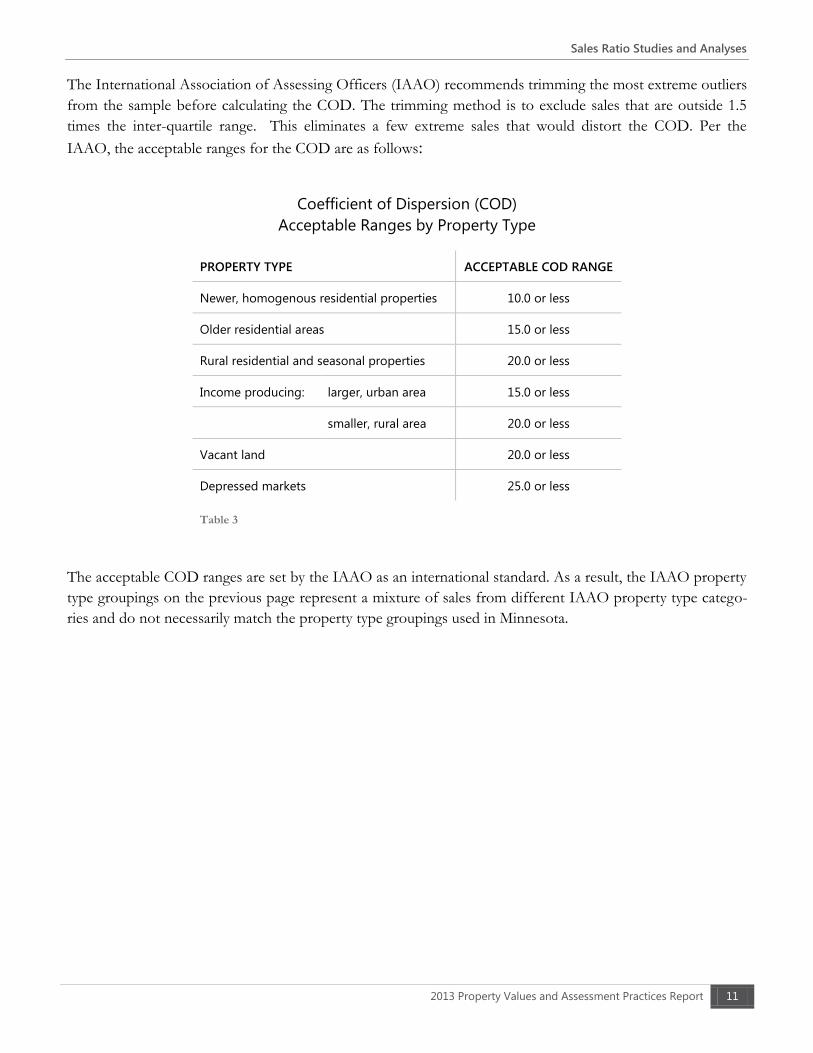
The International Association of Assessing Officers (IAAO) recommends trimming the most extreme outliers
from the sample before calculating the COD. The trimming method is to exclude sales that are outside 1.5
times the inter-quartile range. This eliminates a few extreme sales that would distort the COD. Per the
IAAO, the acceptable ranges for the COD are as follows:
Coefficient of Dispersion (COD)
Acceptable Ranges by Property Type
PROPERTY TYPE ACCEPTABLE COD RANGE
Newer, homogenous residential properties 10.0 or less
Older residential areas 15.0 or less
Rural residential and seasonal properties 20.0 or less
Income producing: larger, urban area 15.0 or less
smaller, rural area 20.0 or less
Vacant land 20.0 or less
Depressed markets 25.0 or less
Table 3
The acceptable COD ranges are set by the IAAO as an international standard. As a result, the IAAO property
type groupings on the previous page represent a mixture of sales from different IAAO property type catego-
ries and do not necessarily match the property type groupings used in Minnesota.

Value Trends
12 Minnesota Department of Revenue ▪ Property Tax Division
Value Trends
There are 2,720,257 taxable real property parcels statewide. Overall, assessors’ estimated market value of all
property in the state decreased 0.32 percent from the 2011 assessment to the 2012 assessment. Decreases
were deepest among residential homestead and seasonal recreational residential property, while agricultural
property was the only major class that increased in value statewide. Commercial/Industrial property contin-
ued to decline in market value, but the declines were smaller than those from 2009-2010 and 2010-2011.
Chart 1
-10%
-5%
0%
5%
10%
15%
20%
25%
2000 2001 2002 2003 2004 2005 2006 2007 2008 2009 2010 2011 2012
Estimated Market Value Percent Change by Major Class
Agricultural Residential Homestead Seasonal Recreational Residential Commercial/Industrial

Taxable Market Value
2013 Property Values and Assessment Practices Report 13
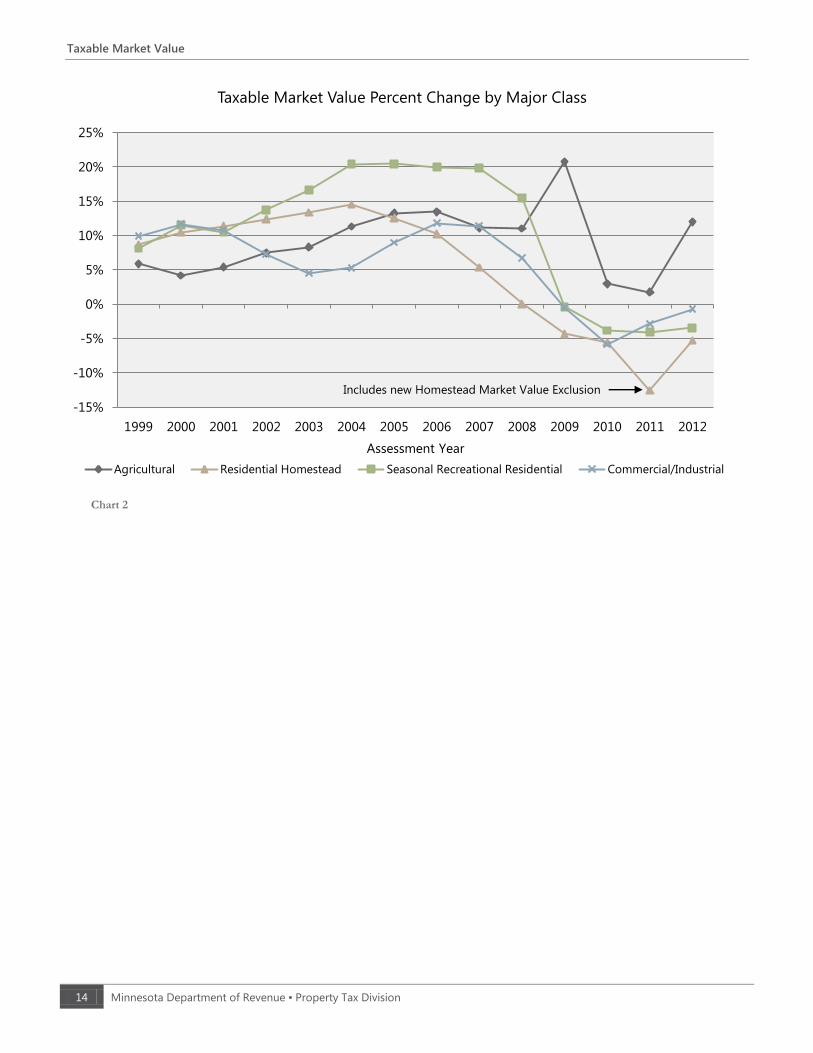
Taxable Market Value
In Minnesota, taxes are not directly based on the estimated market value. Minnesota property tax statutes
contain a number of exclusions, value deferrals, and exemptions that decrease the amount of the EMV that is
subject to taxation. Taxable Market Value (TMV) refers to the amount of value that is actually used in calcu-
lating property taxes. This often differs from EMV due to special programs and exclusions. Sample TMV
calculations can be found in Section 04.10 of the Auditor/Treasurer Manual, available at
www.revenue.state.mn.us.
Taxable market value not only decreases an individual property’s tax burden, it also decreases the tax base for
the taxing jurisdiction. The taxable market value is used to determine the tax base for referendum market val-
ue, local net tax capacity, and state net tax capacity. For example, a given county’s levy (budget) is spread
among all classes of taxable property by determining the cumulative net tax capacity of all the properties. The
net tax capacity (taxable market value multiplied by the class rate) of all taxable properties in a jurisdiction is
the tax base.
A simple illustration of how property tax rates are determined is shown below:
Step 1: Total proposed budget All non-property tax revenue (state aids and fees) = Property tax revenue needed
Step 2: Property tax revenue needed ÷ Total tax capacity of all taxable properties = Local tax rate
When taxable market values change, the tax bur-
den is redistributed within the jurisdiction. If the
levy remains constant, property taxes for a single
property may still change depending on changes in
the classification rate and/or taxable market value
of other properties in the jurisdiction. Some of the
more common exclusion and deferrals that re-
move taxable value from the tax base are shown in
Table 4.
The Green Acres and Rural Preserve programs
will be discussed more thoroughly in the following
sections.
The Homestead Market Value Exclusion replaced the former Homestead Market Value Credit starting with
property assessed in 2011 for taxes payable in 2012. The exclusion reduces the amount of a homestead’s
property that is subject to taxation. On average, the exclusion reduces homestead taxable market value by ten
percent. The exclusion reduced taxable market value of all property statewide by five percent.
EXCLUSION / DEFERRAL 2012 VALUE
Green Acres $3,370,834,244
Rural Preserve $191,866,237
Open Space $550,076,000
Homestead Market Value Exclusion $30,127,290,570
This Old House $177,635,476
Disabled Veterans $1,573,325,857
Plat Law $132,932,898
This Old Business $87,800
Homestead Property Damaged by Mold $1,234,900
Table 4
Taxable Market Value
14 Minnesota Department of Revenue ▪ Property Tax Division
Chart 2
-15%
-10%
-5%
0%
5%
10%
15%
20%
25%
1999 2000 2001 2002 2003 2004 2005 2006 2007 2008 2009 2010 2011 2012
Assessment Year
Taxable Market Value Percent Change by Major Class
Agricultural Residential Homestead Seasonal Recreational Residential Commercial/Industrial
Includes new Homestead Market Value Exclusion

Green Acres
2013 Property Values and Assessment Practices Report 15
Green Acres
In 1967, the Minnesota Legislature created a property tax program named the Minnesota Agricultural Proper-
ty Tax Law, which is referred to as “Green Acres”. Legislators were attempting to find a method for valuing
agricultural property based on its agricultural use only while protecting its value from other non-agricultural
influences. At the time, development appeared to be swallowing up agricultural property in the seven-county
metropolitan area, driving up the market values used to calculate property taxes. Under this law, qualifying
agricultural property enrolled in the Green Acres program is valued using sales data for agricultural property
outside the metropolitan area to eliminate the non-agricultural development influences.
Since 1967, the provisions of Green Acres have changed multiple times. Under current law, only class 2a ag-
ricultural land qualifies for the deferral provided by Green Acres. Minnesota Statutes, section 273.13, subdi-
vision 23 lists the requirements that must be met for a property to be classified as class 2a agricultural land
that would qualify for Green Acres deferral:
1. At least 10 contiguous acres must be used to produce agricultural products in the preceding year (or
be qualifying land enrolled in an eligible conservation program);
2. The agricultural products are defined by statute; and
3. The agricultural product must be produced for sale.
The benefit of the program is a reduced value for farm properties that are facing increasing value pressures
due to non-agricultural value influences such as residential and commercial development, or seasonal recrea-
tional land uses. By providing a lower taxable valuation, the deferral program redistributes the tax burden to
non-qualifying properties within the same taxing jurisdictions.
Taxable Green Acres Value
For assessors, the most significant barrier to implementing Green Acres prior to law changes made since 2008
was determining the “actual” agricultural value of farmland in their counties. By law, assessors must deter-
mine the “highest and best use” of property and then estimate the market value based on that determination.
If the highest and best use of agricultural property is for residential, lakeshore, commercial development, or
for recreational purposes, the assessor must value the property as if it were to be converted to the highest and
best use and disregard its value as property used agriculturally. Thus, in cases where the highest and best use
of the property is for something other than agriculture, the assessor places a value on that property that ex-
ceeds its agricultural value, likely resulting in higher property taxes.
Green Acres, however, requires assessors to look at qualifying agricultural property in two ways. First, the
assessor must value the property according to its highest and best use (as is done for all properties). Then the
assessor must determine the agricultural value of the property based on Department of Revenue guidance. If
this agricultural value is below the highest and best use value, the assessor must use the agricultural value for

Green Acres
16 Minnesota Department of Revenue ▪ Property Tax Division
tax purposes. The Department of Revenue is charged with establishing agricultural land values throughout
the state.
In 2007, a Green Acres Committee made up of members of the assessment community and the Department
of Revenue was formed partly for the purpose of determining Green Acres agricultural values. Based upon
available data, the committee located the most recent period in time (1990-1996) when the non-agricultural
influences on farmland sales were either minimal or non-existent throughout the state, with the exception of
the seven-county metropolitan area. The committee found that the southwest counties of Lyon, Murray, No-
bles, Pipestone, and Rock were the most indicative of true agricultural sales and these now form what are re-
ferred to as the “base counties” for agricultural values.
A common misconception is that the base counties determine the agricultural values used throughout the
state. The base counties are used to help define the current agricultural economy in general, but each county’s
individual agricultural economy is treated differently depending upon how it differs from the norm. In order
to determine a county’s relationship to the general agricultural economy, each county’s median price for farm-
land sales during the established period was compared to that of the base counties to establish a ratio, or fac-
tor. This factor is then applied to the current median sales price per acre in the base counties to establish a
current indicator of agricultural value for each county. Median values are used to focus on more typical be-
haviors and cull out the behavior at the extremes. A map of Green Acres values by county is included in Ap-
pendix C of this report.
The factor was created to reflect the differences in farm economies based on the varying lengths of the grow-
ing season from southern to northern Minnesota, the differences in soil quality throughout the state, and the
different commodities that drive agricultural land values. For example, soil quality is typically better in the
southern portion of the state, while lesser-quality land is more prevalent in the northeastern portion of the
state. Counties with greater need for pastureland due to dairy farming practices typically had a smaller market
for tillable agricultural land. This factor serves to reflect the relationship between a county’s individual agricul-
tural economy and the agricultural economy as indicated by the base counties.
From 2010 to 2012, the Department of Revenue noticed changes in the agricultural market indicating that the
influences of development and recreational uses on agricultural land sales had subsided, yielding a market of
agricultural land driven by agricultural influences. This gave the department an opportunity to see how the
factors developed from the 1990-1996 sales compared to factors developed using current (October 2011 -
September 2012) sales of agricultural land. The department also applied time trends to the sales used to calcu-
late the new factors and base values. This means that the sales prices were adjusted forward to Jan. 1, 2013, in
accordance with recent changes in the department’s sales ratio calculations. As a result of the analysis, the fac-
tors were recalculated for all counties in the state. For the 2013 assessment, the base value increased to $8,400
(up from $5,200 in 2012) while most county factors decreased.
For example, from October 2011 through September 2012, the Green Acres base counties had 101 sales of
agricultural land. Those sales yielded a median sales price of $8,400 per acre. During that same timeframe,
Dodge County had 12 sales of agricultural land with a median sales price of $6,700 per acre. The Green Acres
“factor” for Dodge County was determined by dividing the median sales price per acre for Dodge County
($6,700) by the median sales price per acre for the base counties ($8,400).

Green Acres
2013 Property Values and Assessment Practices Report 17
For the 2013 assessment, the Dodge County factor (80 percent) is applied to the 2013 base median to deter-
mine a 2013 tillable agricultural value for Dodge County of $6,720. If the average tillable value based on local
markets for Dodge County exceeds $6,720 per acre, then the Green Acres (GA) value is applied to the tillable
lands.
EXAMPLE 1
STEP 1: DODGE COUNTY FACTOR – TILLABLE LANDS (BASED ON SALES OCCURRING 10/2011-09/2012)
Dodge County Median (10/2011-09/2012 ÷ Base County Median = Dodge County Factor
$6,720 ÷ $8,400 = 79.8% (rounded to 80%)
STEP 2: DODGE COUNTY 2013 BASE VALUE – TILLABLE LANDS
Base County Median Value per acre × Dodge County Factor = Dodge County GA Value per acre
$8,400 × 80% = $6,720 per acre
During that same time frame (October 2011-September 2012), Benton County had 9 sales of agricultural land
with a median sales price of $3,400 per acre. The Green Acres factor for Benton County was determined by
dividing the median sales price per acre for Benton County ($3,400) by the median sales price per acre for the
base counties ($8,400).
For the 2013 assessment, the Benton County factor of 41 percent is applied to the 2013 base median to de-
termine a 2013 tillable agricultural value for Benton County of $3,440 per acre. If the average tillable value
based on local sales for Benton County exceeds $3,440 per acre, then the Green Acres value is applied to till-
able lands enrolled in the Green Acres program.
EXAMPLE 2
STEP 1: BENTON COUNTY FACTOR – TILLABLE LANDS (BASED ON SALES OCCURRING 10/2011-09/2012)
Benton County Median (10/2011-09/2012) ÷ Base County Median = Benton County Factor
$3,440 ÷ $8,400 = 40.5% (rounded to 41%)
STEP 2: BENTON COUNTY 2013 BASE VALUE – TILLABLE LANDS
Base County Median Value per acre × Benton County Factor = Benton County GA Value per acre
$8,400 × 41% = $3,440 per acre
This process has proved very effective for valuing tillable lands and - with these updates to the factors and
values – should continue to provide a fair, uniform, and equalized method to value tillable agricultural land
enrolled in the Green Acres program throughout the state. Based on the best data available to the Depart-
ment of Revenue and to Minnesota assessors, the method for establishing agricultural values for tillable agri-
cultural properties in Minnesota that was developed by the Green Acres Committee and updated and imple-
mented by the department produces values for agricultural land that reflect true agricultural values in the

Green Acres
18 Minnesota Department of Revenue ▪ Property Tax Division
state. Assessors must use the values as the basis for setting agricultural values for qualifying Green Acres
properties in their counties.
While not perfect, this method of establishing agricultural values has also provided a uniform basis for valua-
tion while still deriving agricultural values from the market. The result is a projection of what the current agri-
cultural value of land would be in the absence of non-agricultural market influences. Also, while the Green
Acres value for a county is determined by Department of Revenue, the values resulting from the factor may
be “feathered” by the assessor to account for different land types throughout a county. While adjustments
can be made for higher and lower quality lands, the overall county average value must not to go below the
department’s guidelines. Additionally, the factors are appealable by the assessor if the assessor believes them
to not represent the agricultural market in the county.
Minnesota Statutes, section 273.111, subdivision 4 reads:
“( ) Th v f ny [q fy ng f G n ]… h … b n y w h f n
pp p g f n n v …. F h , h h n n ny d-
ed values resulting from nonagricultural factors. In order to account for the presence of nonagricultural influences
that may affect the value of agricultural land, the commissioner of revenue shall, in consultation with the De-
partment of Applied Economics at the University of Minnesota, develop a fair and uniform method of deter-
mining the average value of agricultural land for each county in the state consistent with this subdivision. The
values must be determined using appropriate sales data. When appropriate, the commissioner may make rea-
sonable adjustments to the values based on the most recent available county or regional data for agricultural
production, commodity prices, production expenses, rent, and investment return. The commissioner shall annu-
ally assign the resulting countywide average value to each county, and these values shall be used as the basis for
determining the agricultural value for all properties in the county qualifying for tax deferment under this section.
The county assessor, in consultation with the Department of Revenue, shall determine the relative value of agri-
cultural land for each assessment district in comparison to the countywide average value, considering and giving
recognition to appropriate agricultural market and soil data available.
(b) In the case of property qualify ng f x f n n y…, h h n n h p n f
commercial, industrial, residential, or seasonal recreational land use influences in determining the value for ad
valorem tax purposes provided that in no case shall the value exceed the value prescribed by the commissioner of
revenue for class 2a til b p p y n h n y.”
Non-tillable lands
The Department of Revenue began discussing agricultural values with the Department of Applied Economics
at the end of 2010 (prior to the 2011 assessment). The department also verified and reviewed the valuation
process with members of the assessment community from different areas of the state. As part of the analysis
and review of Green Acres values by the department and counties, it became apparent that the relationships
between tillable and non-tillable (e.g., pastureland) agricultural properties was not as clearly indicated by the
factor process. The methodology described on p.16-17 was developed initially to review and determine tillable
agricultural values. For valuing non-tillable lands in previous years, the department recommended using a
value of 50 percent of the tillable value. Since that time, it has been determined that a statewide factor of 50

Green Acres
2013 Property Values and Assessment Practices Report 19
percent of the tillable value per county is not appropriate in all cases. The department further analyzed these
values with representatives of the assessment community from different areas of the state.
In northwest Minnesota, tillable lands generally carry a lower value per acre than in the base counties due to
the decreased length of the tillable farming season, the quality of the soil, and other factors. Conversely, non-
tillable agricultural lands (pasturelands) carry higher values relative to the tillable lands due to the economic
and physical sustainability of this type of soil use. For some counties in this region of the state, the 50 per-
cent value was too low to reflect the actual agricultural values of non-tillable lands.
In southeast Minnesota, tillable lands carry a higher value than in the base counties due to higher per-acre
yields and productivity. Non-tillable lands carry much lower values relative to the tillable values due to topog-
raphy, composition of the land, and the very low demand for non-tillable farmland in this area of the state.
Consequently, a 50 percent value for non-tillable lands is too high to reflect the actual agricultural value of
non-tilled lands.
The department, along with assessors from different areas of the state including northwest, southeast, and
central Minnesota, reviewed and analyzed the data available. After discussions for the 2011 assessment, the
department developed a new method for valuing non-tillable agricultural lands. This method is based on
comparisons between the average tillable values for each county relative to the values for non-tillable agricul-
tural lands. The result is a compressed range in values when compared to the previous 50 percent method.
This compression acknowledges that different regions of the state have different economic forces affecting
the values of non-tillable lands.
In an ongoing effort to address the varying agricultural economies throughout the state, the department con-
tinues to analyze these trends with representatives of the assessment community. Because of the different
values for tillable and non-tillable lands, and because of diverse non-agricultural influences in different areas
of the state, it is possible that a county may only have non-tillable lands receiving Green Acres deferral if the
average 2a tillable value does not exceed the 100 percent Green Acres value but the county’s non-tillable val-
ue exceeds the Green Acres non-tillable value. Conversely, it is possible to have only tillable lands receiving
deferral but not the non-tillable lands.
Green Acres
20 Minnesota Department of Revenue ▪ Property Tax Division
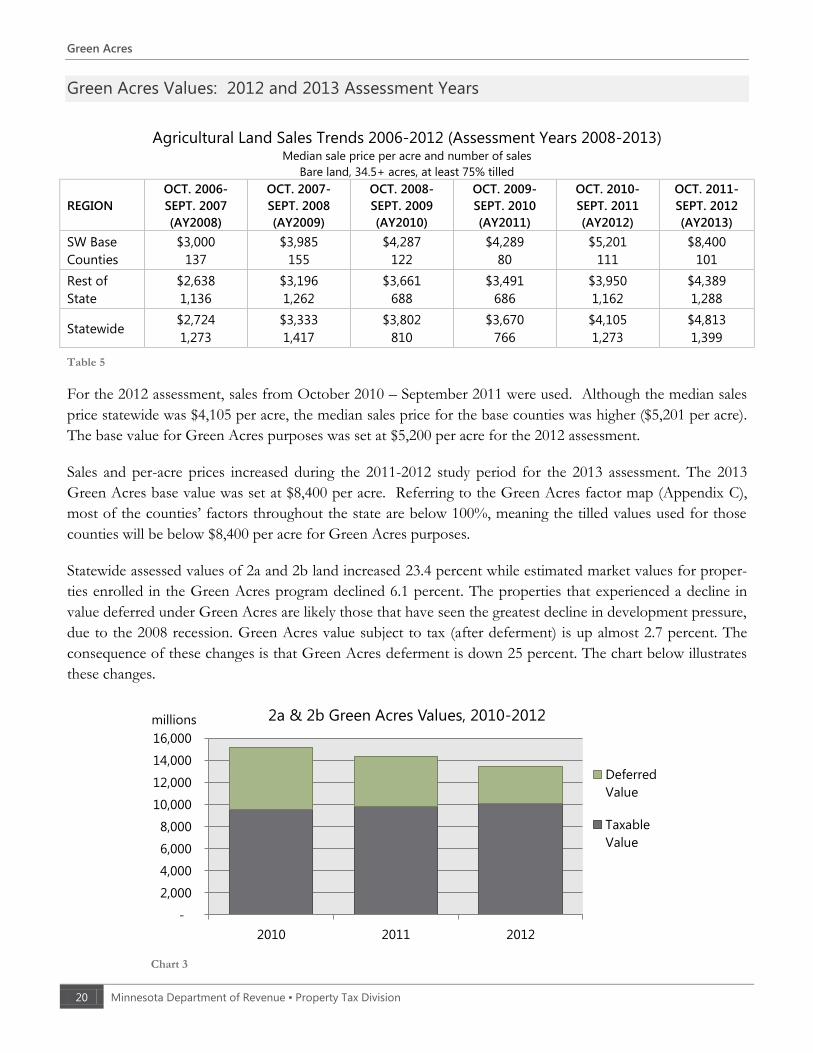
Green Acres Values: 2012 and 2013 Assessment Years
Agricultural Land Sales Trends 2006-2012 (Assessment Years 2008-2013) Median sale price per acre and number of sales
Bare land, 34.5+ acres, at least 75% tilled
REGION
OCT. 2006-
SEPT. 2007
(AY2008)
OCT. 2007-
SEPT. 2008
(AY2009)
OCT. 2008-
SEPT. 2009
(AY2010)
OCT. 2009-
SEPT. 2010
(AY2011)
OCT. 2010-
SEPT. 2011
(AY2012)
OCT. 2011-
SEPT. 2012
(AY2013)
SW Base
Counties
$3,000
137
$3,985
155
$4,287
122
$4,289
80
$5,201
111
$8,400
101
Rest of
State
$2,638
1,136
$3,196
1,262
$3,661
688
$3,491
686
$3,950
1,162
$4,389
1,288
Statewide $2,724
1,273
$3,333
1,417
$3,802
810
$3,670
766
$4,105
1,273
$4,813
1,399
Table 5
For the 2012 assessment, sales from October 2010 – September 2011 were used. Although the median sales
price statewide was $4,105 per acre, the median sales price for the base counties was higher ($5,201 per acre).
The base value for Green Acres purposes was set at $5,200 per acre for the 2012 assessment.
Sales and per-acre prices increased during the 2011-2012 study period for the 2013 assessment. The 2013
Green Acres base value was set at $8,400 per acre. Referring to the Green Acres factor map (Appendix C),
most of the counties’ factors throughout the state are below 100%, meaning the tilled values used for those
counties will be below $8,400 per acre for Green Acres purposes.
Statewide assessed values of 2a and 2b land increased 23.4 percent while estimated market values for proper-
ties enrolled in the Green Acres program declined 6.1 percent. The properties that experienced a decline in
value deferred under Green Acres are likely those that have seen the greatest decline in development pressure,
due to the 2008 recession. Green Acres value subject to tax (after deferment) is up almost 2.7 percent. The
consequence of these changes is that Green Acres deferment is down 25 percent. The chart below illustrates
these changes.
Chart 3
-
2,000
4,000
6,000
8,000
10,000
12,000
14,000
16,000
2010 2011 2012
2a & 2b Green Acres Values, 2010-2012
Deferred
Value
Taxable
Value
millions

Rural Preserve
2013 Property Values and Assessment Practices Report 21
Rural Preserve
The Rural Preserve Property Tax Program under Minnesota Statutes, section 273.114, was enacted in 2009
and first available for the 2011 assessment year (taxes payable in 2012). The program coincides with Green
Acres and applies to class 2b rural vacant land property that is part of a contiguous farm that is concurrently
enrolled in Green Acres. The Rural Preserve program was enacted to provide similar tax benefits as the
Green Acres program to property owners who own qualifying class 2b rural vacant land
As with Green Acres, a portion of taxable value is deferred for the duration of enrollment in the program.
The assessor determines two values for the land: a “highest and best use value” based on market conditions,
and a value that is uninfluenced by non-agricultural (e.g. residential or commercial development) factors. The
difference between the highest and best use value and the Rural Preserves value is a reduction in the taxable
market value that redistributes the tax burden to other properties in the taxing jurisdiction. The actual taxes
are based on the Rural Preserve value and the difference between the taxes based on the Rural Preserve value
and the taxes based on a highest and best use value are deferred for the duration of the program.
Taxable Rural Preserve Value
Minnesota Statutes, section 273.114, subdivision 3 provides:
“N w h n ng n 272.03, b v n 8, and 273.11 [both sections refer to market value], the value
of any real estate that qualifies under subdivision 2 must, upon timely application by the owner in the manner
provided in subdivision 5, not exceed the value prescribed by the commissioner of revenue for class 2a tillable
property in that county. The house and garage, if any, and the immediately surrounding one acre of land and a
minor, ancillary nonresidential structure, if any, shall be valued according to their appropriate value. In deter-
mining the value for ad valorem tax purposes, the assessor shall not consider the presence of commercial, indus-
trial, residential, or seasonal recreational land use influences that may affect the value of real estate subject to
h n.”
Class 2b rural vacant land property is not always unusable wasteland. Sometimes, class 2b land may be oth-
erwise tillable or usable as pastureland, but is not used for agricultural purposes. The classification system
acknowledges the different land uses; however for valuation purposes, similar lands should be similarly as-
sessed. For purposes of valuation for the Rural Preserve program, the Department of Revenue has recom-
mends using the following:
For otherwise tillable class 2b lands, counties are urged to use the Green Acres tillable land value.
For non-tillable lands that are otherwise usable as pasture, counties are urged to use their non-tillable
Green Acres value.
For unusable waste, wild land, swamp land, etc. enrolled in Rural Preserve, assessors use 50% of the
non-tillable class 2a land value.

Rural Preserve
22 Minnesota Department of Revenue ▪ Property Tax Division
Statewide, $191,866,237 of
estimated market value was
deferred under the Rural
Preserve program year for
the 2012 assessment.
For example, if the county has estimated the value of woods at $2500 per acre because of recreational or oth-
er non-agricultural value influences, and the value for Rural Preserve (based on the Green Acres valuation
memo) is $2200, the deferral is based on the $300 per acre difference.
If a county has estimated the value of a swamp at $1800 per acre because of recreational or other non-
agricultural market value influences, and the value for Rural Preserve is $2200 (based on the Green Acres val-
uation memo), then the recommended Rural Preserve value for the unusable swamp land is $1100 per acre
(50 percent of $2200), and the deferral is based on the $700 difference in value.
If the estimated market value (EMV) of the land the property owner wishes to
enroll in Rural Preserve is less than the recommended value for the Rural Pre-
serve Program, the property may still be enrolled, but there are no deferred tax-
es. The Rural Preserve deferral is only applicable in cases where the EMV ex-
ceeds the indicated Rural Preserve value for any given property. For example,
if a county has valued a swamp at $900 per acre due to lack of non-agricultural
market influences, and the recommended value for Rural Preserve is $2200 (based on the Green Acres valua-
tion memo) and 50 percent of that value is $1100, there is no deferral because the swamp EMV is lower than
the Rural Preserve value.
Unusable wasteland often carries a very low estimated market value, and does not always carry a value high
enough that Green Acres or Rural Preserve values would be implemented. However, there may be some are-
as of the state where recreational uses are affecting the market value of these unusable wastelands that are
part of a farm.

Tax Distribution
2013 Property Values and Assessment Practices Report 23
Tax Distribution
Minnesota’s property tax system - with various components including classification, valuation, and special
programs that reduce taxable value - determines which properties will pay a greater or lesser share of taxes.
Agricultural and homesteaded properties, through both classification rates and programs such as Green Acres
and the new homestead market value exclusion, have typically received preferential property tax treatment.
Conversely, commercial properties that have a higher class rate and lesser eligibility for special programs will
pay a greater share of taxes than a residential or agricultural property of equal value.
Based on preliminary estimates from the 2012 assessment year (taxes payable 2013), agricultural, rural vacant,
and forest land represented about 22 percent of taxable property value and paid about 8 percent of property
taxes (see table below). In comparison, commercial properties accounted for 13 percent of taxable property
and paid approximately 31 percent of property taxes:
Tax Liability Share by Classes of Property Assessment Year 2012, Taxes Payable 2013 (Preliminary Estimates)
PROPERTIES BY CLASS MARKET VALUE
(MILLIONS)
NET TAX
(MILLIONS)
MARKET
VALUE SHARE
SHARE OF NET
TAXES PAYABLE
Agricultural/Rural Vacant/Forest Land $111,480 $683 21.6% 8.0%
Residential (Homestead and Non-homestead) $276,228 $4,126 53.5% 48.2%
Apartments $21,845 $402 4.2% 4.7%
Seasonal Recreational Residential $23,888 $235 4.6% 2.7%
Commercial/Industrial $68,309 $2,657 13.2% 31.1%
Utility/Other $14,555 $450 2.8% 5.3%
Table 6
If the taxable value of a given class of property decreases, the other classes of property face an increase in the
tax burden to account for the loss of tax base elsewhere. This explains why the Green Acres program causes
increasing tax pressure on residential, seasonal, and commercial properties. It also explains why the home-
stead market value exclusion increases tax pressure on commercial, seasonal, and agricultural properties. If
commercial properties’ taxable value was reduced or excluded, the tax pressure would shift to residential, sea-
sonal, and agricultural properties.

APPENDIX A ▪ Classification Rate Table
24 Minnesota Department of Revenue ▪ Property Tax Division
APPENDIX A ▪ Classification Rate Table
CLASS DESCRIPTION TIERS CLASS RATE STATE RATE
1a Residential Homestead First $500,000 1.00% NA
Over $500,000 1.25% NA
1b Blind/Disabled Homestead (Both Ag and Non-Ag) First $50,000 0.45% NA
1c Ma & Pa Resort (Comm. SRR < 250 days, incl. homestead) First $600,000 0.50% NA
$600,000 - $2,300,000 1.00% NA
Over $2,300,000 1.25% 1.25%
1d Migrant Housing (Structures Only) First $500,000 1.00% NA
Over $500,000 1.25% NA
2a Homestead House, Garage, One Acre (HGA): First $500,000 1.00% NA
Over $500,000 1.25% NA
2a/2b 1st Tier Homestead Property First $1,210,000 0.50% NA
2a/2b Farming Entities Excess 1st Tier (Unused from homestead) Unused 1
st $1,210,000 0.50% NA
2a Agricultural Land (Hmstd Remainder and Non-Hmstd; Includes Structures) 1.00% NA
2b Rural Vacant Land (Hmstd Remainder and Non-Hmstd; Incl.Minor Ancil. Structures) 1.00% NA
2c Managed Forest Land 0.65% NA
2d Private Airport 1.00% NA
2e Land with a Commercial Aggregate Deposit 1.00% NA
3a Commercial/Industrial and Public Utility First $150,000 1.50% 1.50%
Over $150,000 2.00% 2.00%
Electric Generating Public Utility Machinery 2.00% NA
All Other Public Utility Machinery 2.00% 2.00%
Transmission Line Right-Of-Way (Owned in fee by a utility) 2.00% 2.00%
3b Employment Property (Border City Zones) First $150,000 1.50% 1.50%
Over $150,000 2.00% 2.00%
4a Apartment (4+ units, including private for-profit hospitals) 1.25% NA
4b(1) Residential Non-Homestead (1-3 Units Not 4bb or SRR) 1.25% NA
4b(2) Unclassified Manufactured Home 1.25% NA
4b(3) Ag Non-Homestead (2 or 3 Units, Garage, One Acre) 1.25% NA
4b(4) Unimproved Residential 1.25% NA
4bb(1) Residential Non-Homestead (Single Unit) First $500,000 1.00% NA
Over $500,000 1.25% NA
4bb(2) Ag Non-Homestead (Single Unit, Garage, One Acre) First $500,000 1.00% NA
Over $500,000 1.25% NA
4c(1) Commercial Seasonal Residential Recreational (Resort) First $500,000 1.00% 1.00%
Over $500,000 1.25% 1.25%
4c(2) Qualifying Golf Course 1.25% NA
4c(3)(i) Non-Profit Community Service Oriented Organization (Non-Revenue) 1.50% NA
4c(3)(ii) Non-Profit Community Service Oriented Organization (Donations) 1.50% 1.50%
4c(4) Post-Secondary Student Housing 1.00% NA
4c(5)(i) Manufactured Home Park 1.25% NA
4c(5)(ii) MH Park Cooperative (Over 50% Shareholder Occupied) 0.75% NA
4c(5)(ii) MH Park Cooperative (50% or Less Shareholder Occupied) 1.00% NA
4c(6) Metro Non-Profit Recreational Property 1.25% NA
4c(7) Certain Non-Comm Aircraft Hangars and Land: Leased Land 1.50% NA
4c(8) Certain Non-Comm Aircraft Hangars and Land: Private Land 1.50% NA
4c(9) Bed and Breakfast (up to 5 units) 1.25% NA
4c(10) Seasonal Restaurant on a Lake 1.25% NA
4c(11) Marina First $500,000 1.00% 1.00%
Over $500,000 1.25% 1.25%
4c(12) Non-Commercial Seasonal Residential Recreational (Cabin) First $76,000 1.00% 0.40%
$76,000 - $500,000 1.00% 1.00%
Over $500,000 1.25% 1.25%
4d Qualifying Low-Income Rental Housing 0.75% NA
5(1) Unmined Iron Ore and Low-Grade Iron-Bearing Formations 2.00% 2.00%
5(2) All Other Property Not Otherwise Classified 2.00% NA
APPENDIX B ▪ Summary of State Board Orders
2013 Property Values and Assessment Practices Report 25
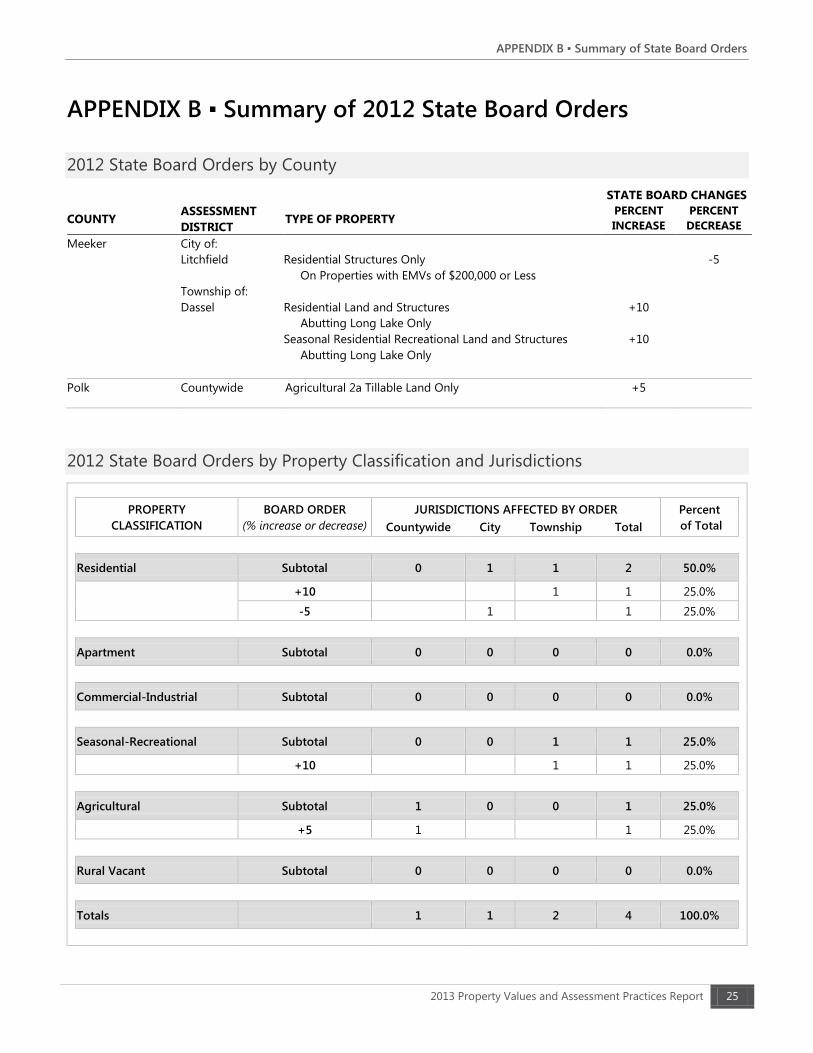
APPENDIX B ▪ Summary of 2012 State Board Orders
2012 State Board Orders by County
STATE BOARD CHANGES
COUNTY ASSESSMENT
DISTRICT TYPE OF PROPERTY
PERCENT
INCREASE
PERCENT
DECREASE
Meeker City of:
Litchfield
Township of:
Dassel
Residential Structures Only
On Properties with EMVs of $200,000 or Less
Residential Land and Structures
Abutting Long Lake Only
Seasonal Residential Recreational Land and Structures
Abutting Long Lake Only
+10
+10
-5
Polk Countywide Agricultural 2a Tillable Land Only +5
2012 State Board Orders by Property Classification and Jurisdictions
PROPERTY BOARD ORDER JURISDICTIONS AFFECTED BY ORDER Percent
CLASSIFICATION (% increase or decrease) Countywide City Township Total of Total
Residential Subtotal 0 1 1 2 50.0%
+10 1 1 25.0%
-5 1 1 25.0%
Apartment Subtotal 0 0 0 0 0.0%
Commercial-Industrial Subtotal 0 0 0 0 0.0%
Seasonal-Recreational Subtotal 0 0 1 1 25.0%
+10 1 1 25.0%
Agricultural Subtotal 1 0 0 1 25.0%
+5 1 1 25.0%
Rural Vacant Subtotal 0 0 0 0 0.0%
Totals 1 1 2 4 100.0%

APPENDIX B ▪ Summary of State Board Orders
26 Minnesota Department of Revenue ▪ Property Tax Division
Summary of 2012 Non-Orders
State Board Orders are not issued every time a sales ratio is outside the acceptable range (90-105 percent). In
2012, 147 of these non-compliant ratios were not given orders. A summary of those instances and reasons for
not issuing board orders are provided below.
ATTENTION TO MARKET: Assessor addressed issue
with an assessment change and/or some local effort.
CIA ANALYSIS: The county has analyzed non-sales market
evidence that supports a change has occurred in the mar-
ket; this opinion supports no action.
CURRENT COMPLIANCE: Sales in new ratio study period
are significant and indicate acceptable levels of assess-
ment.
CURRENT SALES INDICATE DIFFERENT MARKET:
There is a change/shift in the market where an order
would not improve the assessment.
EQUALIZATION CONCERNS: An order would harm bor-
der value equalization or uniformity of valuation across
jurisdictions/counties.
EVIDENCE NOT STRONG/DISPERSED SALES: Limited
recent sales; sales over a wide, dispersed, or dissimilar
area; or recent sales contradict the average ratio, (includ-
ing six or more sales over a large geographic area, count-
ywide, or unorganized district).
FLUCTUATING RATIOS: Ratios over history are not con-
sistently high or low.
MONITORING OR COUNTY REVIEW: The county has
agreed to monitor and review properties and/or sales in-
formation in lieu of an order.
NEW STUDY PERIOD RATIOS COMPLIANT: Ratios
show compliance with the forward methodology.
REASSESSMENT: A reassessment has recently been
completed or has been agreed to in lieu of an order.
SALE EXCLUDED: The sales sample was changed, either
data corrected, or a sale added or deleted.
STRATIFICATION OF SALES: Sales analysis indicates the
problem may be limited to certain property types, geo-
graphic locations, or value strata.
TIME ADJUSTMENT CONCERNS: Analysis indicates
concern with the applied time adjustment and how that
affected the ratios and study.
Residential/
Seasonal
Commercial/
Industrial Apartment
Agricultural/
Rural Vacant
Totals by
reason
SMALL SAMPLE*
Current Compliance 2 1 3
Evidence Not Strong / Dispersed Sales 8 1 9
Fluctuating Ratios 12 1 13
Monitoring or County Review 8 8
REGULAR SAMPLE
Attention to Market 11 11
CIA Analysis 1 1
Current Compliance 9 1 3 13
Evidence Not Strong / Dispersed Sales 4 1 1 6 12
Fluctuating Ratios 1 1 2 4
Monitoring or County Review 27 10 2 10 49
New Study Period Ratios Compliant 4 2 1 7
Reassessment 3 2 5
Stratification of Sales 1 1 2
Time Adjustment Concerns 6 4 10
Total 84 21 4 38 147
*Small sample = less than six sales of a certain property type

APPENDIX B ▪ Summary of State Board Orders
2013 Property Values and Assessment Practices Report 27
Non-Orders by County/City
County/City Small
Sample
Regular
Sample All
Aitkin 0 4 4
Anoka 0 0 0
Becker 0 0 0
Beltrami 2 1 3
Benton 0 0 0
Big Stone 0 0 0
Blue Earth 0 0 0
Brown 0 0 0
Carlton 5 1 6
Carver 0 0 0
Cass 0 1 1
Chippewa 0 0 0
Chisago 0 3 3
Clay 0 1 1
Clearwater 0 1 1
Cook 0 1 1
Cottonwood 0 1 1
Crow Wing 0 1 1
Dakota 0 5 5
Dodge 0 2 2
Douglas 0 0 0
Faribault 0 0 0
Fillmore 0 1 1
Freeborn 0 3 3
Goodhue 0 5 5
Grant 1 2 3
Hennepin 0 3 3
Houston 0 1 1
Hubbard 0 0 0
Isanti 0 1 1
Itasca 1 0 1
Jackson 0 2 2
Kanabec 0 0 0
Kandiyohi 0 0 0
Kittson 0 3 3
Koochiching 1 1 2
La qui Parle 0 0 0
Lake 1 1 2
Lake of the Woods 0 0 0
Le Sueur 0 1 1
Lincoln 0 0 0
Lyon 0 1 1
McLeod 0 0 0
Mahnomen 0 1 1
Marshall 0 1 1
Martin 0 1 1
Meeker 0 2 2
County/City Small
Sample
Regular
Sample All
Mille Lacs 0 3 3
Morrison 0 5 5
Mower 0 1 1
Murray 0 0 0
Nicollet 0 3 3
Nobles 0 2 2
Norman 0 1 1
Olmsted 2 1 3
Otter Tail 0 6 6
Pennington 0 2 2
Pine 0 0 0
Pipestone 0 1 1
Polk 0 1 1
Pope 2 1 3
Ramsey 0 5 5
Red Lake 0 2 2
Redwood 0 1 1
Renville 0 0 0
Rice 0 1 1
Rock 0 3 3
Roseau 0 1 1
St Louis 11 4 15
Scott 0 1 1
Sherburne 0 2 2
Sibley 0 0 0
Stearns 0 0 0
Steele 1 2 3
Stevens 0 1 1
Swift 1 0 1
Todd 0 2 2
Traverse 2 0 2
Wabasha 1 0 1
Wadena 0 2 2
Waseca 1 1 2
Washington 1 0 1
Watonwan 0 1 1
Wilkin 0 2 2
Winona 0 1 1
Wright 0 3 3
Yellow Medicine 0 0 0
Duluth 0 0 0
St. Cloud 0 0 0
Minneapolis 0 0 0
Totals by reason 33 114 147

APPENDIX C ▪ Statewide Values and Assessment Practices Indicators
28 Minnesota Department of Revenue ▪ Property Tax Division
APPENDIX C ▪ Statewide Values and Assessment Practices
Indicators
The following pages contain statewide charts and maps with information about Minnesota property values,
sales ratio measures, and the Green Acres and Rural Preserve programs.
FIGURE 1 shows the statewide growth in estimated market value, taxable market value, and property value ex-
clusions from 2005 through 2012.
FIGURE 2 shows the statewide growth in estimated market value by major property types from 2005 through
2012.
MAP 1 displays the percent change in estimated market value for each county from assessment years 2011 to
2012.
MAP 2 displays the average percentage that new construction composes of estimated market value for each
county from assessment years 2011 to 2012.
MAP 3 shows taxable tillable Green Acres/Rural Preserve values. Values to be used for tillable properties en-
rolled in Green Acres or Rural Preserve for a given county are the product of the county’s factor and the base
county tillable value, which is $8,400 for the 2013 assessment for taxes payable in 2014. Higher taxable values
are shown in the southern portion of the state while lower taxable values are shown in the northeastern part
of the state.
MAP 4 shows taxable non-tillable Green Acres/Rural Preserve values. Values to be used for non-tillable
properties enrolled in Green Acres or Rural Preserve do not vary as widely as the values for tillable properties.
The range in taxable values for non-tillable agricultural properties enrolled in Green Acres or Rural Preserve
is from $760 per acre to $3,860 per acre (compared to the range for tillable properties, which is $840 per acre
to $9,660 per acre). The non-tillable values are closer to the tillable values in the north half of the state. .

APPENDIX C ▪ Statewide Values and Assessment Practices Indicators
2013 Property Values and Assessment Practices Report 29
Figure 1:
Growth in Total Estimated Market Value (EMV), Taxable Market Value (TMV) and
Excluded Value, 2005-2012
-
100
200
300
400
500
600
700
2005 2006 2007 2008 2009 2010 2011 2012
Billio
ns
EMV
TMV

APPENDIX C ▪ Statewide Values and Assessment Practices Indicators
30 Minnesota Department of Revenue ▪ Property Tax Division
Figure 2:
Statewide Total Estimated Market Value by Property Type (in billions of $)
-
100
200
300
400
500
600
700
2005 2006 2007 2008 2009 2010 2011 2012
-
10
20
30
40
50
60
70
80
90
2005 2006 2007 2008 2009 2010 2011 2012
-
20
40
60
80
100
120
140
2005 2006 2007 2008 2009 2010 2011 2012
-
10
20
30
40
50
60
70
2005 2006 2007 2008 2009 2010 2011 2012
-
50
100
150
200
250
300
350
2005 2006 2007 2008 2009 2010 2011 2012
-
5
10
15
20
25
30
35
2005 2006 2007 2008 2009 2010 2011 2012
ALL Commercial/Industrial
Agricultural/Rural Vacant/Forest Land Apartment / Residential Non-homestead
Residential Homestead Seasonal Recreational Residential

APPENDIX C ▪ Statewide Values and Assessment Practices Indicators
2013 Property Values and Assessment Practices Report 31
Map 1:
Percent Change in Total Estimated Market Value 2011-2012
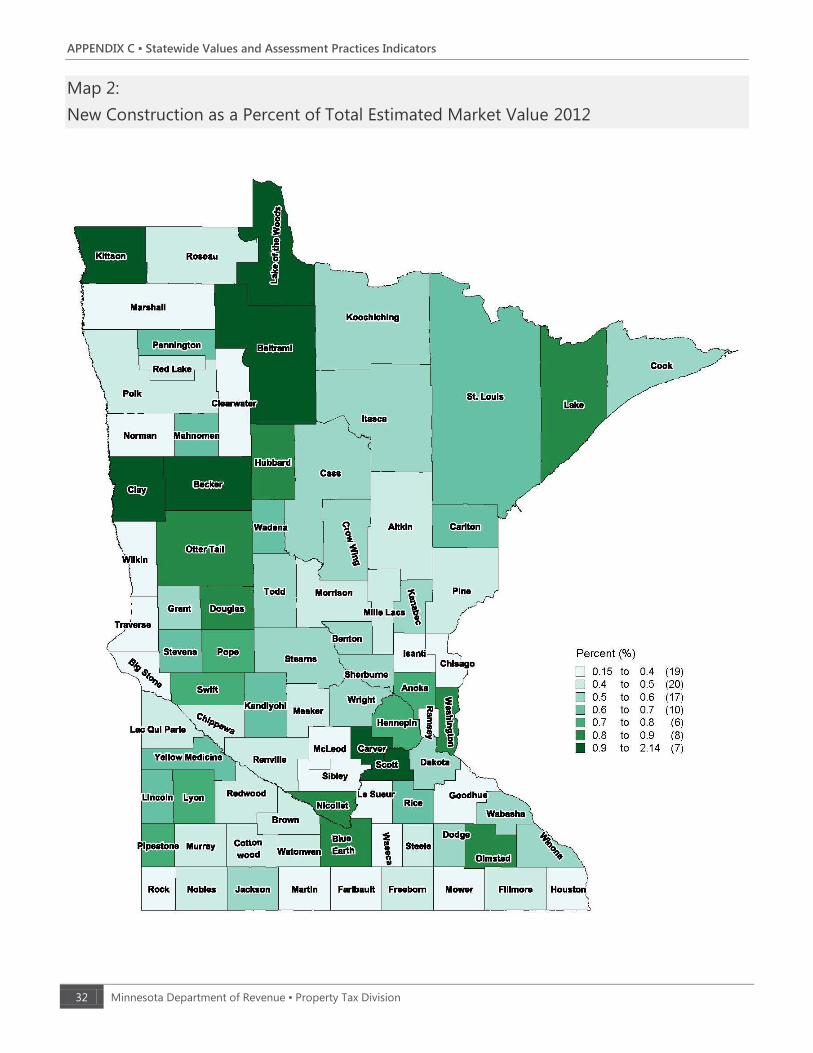
APPENDIX C ▪ Statewide Values and Assessment Practices Indicators
32 Minnesota Department of Revenue ▪ Property Tax Division
Map 2:
New Construction as a Percent of Total Estimated Market Value 2012

APPENDIX C ▪ Statewide Values and Assessment Practices Indicators
2013 Property Values and Assessment Practices Report 33
Map 3:
Taxable Tillable Green Acres/Rural Preserve Value

APPENDIX C ▪ Statewide Values and Assessment Practices Indicators
34 Minnesota Department of Revenue ▪ Property Tax Division
Map 4:
Taxable Non-Tillable Green Acres/Rural Preserve Value

APPENDIX D ▪ Glossary
2013 Property Values and Assessment Practices Report 35
APPENDIX D ▪ Glossary
ADJUSTED MEDIAN RATIO The adjusted median ratio is calculated by multiplying the median ratio by one
plus the overall percent change in value made by the local assessor between the prior and current assessment
year. The change in assessor’s value is also called local effort.
Adjusted Median Ratio = Median Ratio × (1 + Local Effort)
Equation 3
CERTIFICATE OF REAL ESTATE VALUE (CRV) A certificate of real estate value must be filed with the county
auditor whenever real property is sold or conveyed in Minnesota. Information reported on the CRV includes
the sales price, the value of any personal property, if any, included in the sale, and the financial terms of the
sale. The CRV is eventually filed with the Property Tax Division of the Minnesota Department of Revenue.
COEFFICIENT OF DISPERSION (COD) The coefficient of dispersion is a measurement of variability (the spread
or dispersion) and provides a simple numerical value to describe the distribution of sales ratios in relationship
to the median ratio of a group of properties sold. The COD is also known as the “index of assessment ine-
quality” and is the percentage by which the various sales ratios differ, on average, from the median ratio.
ESTIMATED MARKET VALUE (EMV) The estimated market value is the assessor’s estimate of what a property
would sell for on the open market with a typically motivated buyer and seller without special financial terms.
This is the most probable price, in terms of money, that a property would bring in an open and competitive
market. The EMV for a property is finalized on the assessment date, which is Jan. 2 of each year.
MEDIAN RATIO The median ratio is a measure of central tendency. It is the sales ratio that is the midpoint of
all ratios. Half of the ratios fall above this point and the other half fall below this point. The median ratio is
used for the State Board of Equalization and the Minnesota Tax Court studies after all final adjustments.
SALES RATIO A sales ratio is the ratio comparing the market value of a property with the actual sales price of
the property. The market value is determined by the county assessor and reported annually to the Depart-
ment of Revenue. The actual sales price is reported on the Certificate of Real Estate Value (CRV).
STATE BOARD OF EQUALIZATION The State Board of Equalization consists of the commissioner of revenue,
who has the power to review sales ratios for counties and make adjustments in order to bring estimated mar-
ket values within the accepted range of 90 to 105 percent.
STATE BOARD ORDER A state board order is issued by the State Board of Equalization to adjust the market
values of certain property within certain jurisdictions.

APPENDIX D ▪ Glossary
36 Minnesota Department of Revenue ▪ Property Tax Division
TAXABLE MARKET VALUE (TMV) The taxable market value is the value that a property is actually taxed on
after all limits, deferrals, and exclusions are calculated. It may or may not be the same as the property’s esti-
mated market value or limited market value.
TRIMMING METHOD The trimming method used here is to exclude sales that are outside 1.5 times the inter-
quartile range. This method starts by sorting the sample by ascending ratio then dividing the sample into
quarters (quartiles). The first quarter is at the 25 percent point of sample. The second quartile is the 50 per-
cent or median point. The third quartile is at the 75 percent point. The fourth quartile includes the highest
ratios. The inter quartile range is the difference between the values at the first and third quartiles. This num-
ber is multiplied by 1.5 to calculate the trimming point for the upper and lower bounds when calculating the
COD.

Appendix E ▪ 12-Month Study
2013 Property Values and Assessment Practices Report 37
APPENDIX E ▪ 12-Month Study
The 12-month study is mainly used to determine State Board of Equalization Orders. The 12 months en-
compass the period from Oct. 1 of one year through Sept. 30 of the following year. The dates are based on
the dates of sale as indicated on the Certificate of Real Estate Value (CRV). These certificates are filled out by
the buyer or seller whenever property is sold or conveyed and filed with the county. The certificates include
the sales price of the property, disclosure of any special financial terms associated with the sale, and whether
the sale included personal property. The actual sales price from the CRV is then compared to what the coun-
ty has reported as the market value.
The data contained in the report is based upon the 12-month study using sales from Oct. 1, 2010 through
Sept. 30, 2011. These sales are compared with preliminary values for assessment year 2012, taxes payable
2013. The sale prices are adjusted for time and financial terms to the date of the assessment, which is Jan. 2
of each year. For this study, the sales are adjusted to Jan. 2, 2012. In areas with few sales, it is very difficult to
adjust for inflation or deflation because the sales samples are used to develop time trends. For example, based
on an annual inflation rate of 3 percent (.25 percent monthly), if a house were purchased in August 2011 for
$200,000, it would be adjusted to a January 2012 value of $202,500, or the sales price would be adjusted up-
ward by 1.25 percent for the five-month timeframe to January.
The State Board of Equalization orders assessment changes when the level of assessment (as measured by the
median sales ratio) is below 90 percent, or above 105 percent. The orders are usually on a county-, city-, or
township-wide basis for a particular classification of property. All State Board Orders must be implemented
by the county. The changes will be made to the current assessment under consideration, for taxes payable the
following year.
The equalization process (including issuing State Board Orders) is designed not only to equalize values on a
county-, town-, or city-wide basis, but also to equalize values across county lines to ensure a fair valuation
process across taxing districts, county lines, and property types. State Board Orders are implemented only
after a review of values and sales ratios and discussions with the county assessors in the county affected by
the State Board Orders, county assessors in adjacent counties, and the commissioner.

Appendix F ▪ 21-Month Study
38 Minnesota Department of Revenue ▪ Property Tax Division
APPENDIX F ▪ 21-Month Study
The 21-month study is different from the nine-month and 12-month studies. Its purpose is to adjust values
used for state aid calculations so that all jurisdictions across the state are equalized. In order to build stability
into the system, a longer term of 21 months is used, which allows for a greater number of sales. While the
nine- and 12-month studies compare the actual sales to the assessor’s estimated market value, the 21-month
study compares actual sales to the assessor’s taxable market value. As with the nine- and 12-month studies, the
sale prices are adjusted for time and terms of financing.
The 21-month study is used to calculate adjusted net tax capacities that are used in the foundation aid formula
for school funding. It is also used to calculate tax capacities for Local Government Aid (LGA) and various
smaller aids such as library aid. This study is also utilized by bonding companies to rate the fiscal capacity of
different governmental jurisdictions.
The adjusted net tax capacity is used to eliminate differences in levels of assessment between taxing jurisdic-
tions for state aid distributions. All property is meant to be valued at its selling price in an open market, but
many factors make that goal hard to achieve. The sales ratio study can be used to eliminate differences caused
by local markets or assessment practices.
The adjusted net tax capacity is calculated by dividing the net tax capacity of a class of property by the sales
ratio for the class. For example, the net tax capacity for residential properties is divided by the residential sales
ratio to produce the residential adjusted net tax capacity. The process would be repeated for all of the proper-
ty types. The total adjusted net tax capacity would be used in state aid calculations.