2015 keynote address
TRANSCRIPT

Implementation of Large-Scale Technology-Enhanced EFL Programs at the
National Level: 11 Key Factors for Success
Dr. Danny GlickDirector of Pedagogy & Implementation at Edusoft,
a subsidiary of ETS
International DR-TESOL Conference Keynote Address
July 31, 2015

Objectives
In this presentation we will explore:
• 11 key factors for effective implementation of large-scale technology-enhanced EFL courses
• The benefits of these key factors for decision makers, teachers and students
• Case studies and success stories from across the globe as examples illustrating how large-scale blended courses can be effectively implemented

Success Stories
Colombia1.5 million students
Mexico50, 000 students
Peru1,000 schools
Mexico3,000 teachers
Chile12,000 students
Panama200,000 students
Kazakhstan800 teachers
Guatemala2,500 students
Honduras750,000 students

Categories Key Factors Fall Into
Positive Learning
Outcomes
SolidImplementation
21st -CenturyPedagogies
Flexible Delivery Options
Assessment and Evaluation

Key Factor #1: Carefully-Planned Rollout

Carefully-Planned Rollout: Benefits
Decision Makers:
• Ensures cost-effectiveness and budget control
• Addresses possible challenges before they even arise
Teachers:
• Has everything up and running before the project gets underway
• Makes sure the program is aligned with the intended learning outcomes
Students:
• Ensures students receive classroom materials and platform access on time

Case Study # 1: University of Chihuahua, Chihuahua, Mexico
50,000 Students

Case Study #1: University of Chihuahua, Chihuahua, Mexico
11700
12990
15400
10000
12000
14000
16000
18000
2013 2014 2015
Logins
Logins
Proper Planning =
Logins increased 32%over 2 years.

Key Factor #2: Symbiotic Relationship Between Technology and Pedagogy

Symbiotic Relationship Between Technology and Pedagogy: Benefits
Decision Makers:
• Maximizes program outcomes
• Accommodates the needs of students from different socio-economic backgrounds
Teachers:
• Fosters a more meaningful learning environment
• Reduces teacher workload
• Frees teachers to spend more 1-on-1 time with struggling learners
Students:
• Provides students with an opportunity to practice the objectives of the previous f2f lesson while preparing for the upcoming lesson

Case Study #2: INACAP, Chile12,000 Students

Case Study #2: INACAP, Chile

Key Factor #3: Key Information Flows Across All Channels

Cascade Model of Implementation
Solution Provider
10 Senior Master Trainers
100 Senior EFL Teachers
1,000 Classroom Teachers
200,000 Students

Key Information Flows Across All Channels: Benefits
Decision Makers:
• Reduces pedagogical, administrative, operational, and technical challenges which may arise
Teachers:
• Eliminates teachers’ sense of isolation often associated with large-scale projects
• Provides timely feedback and support to teachers
Students:
• Provides timely answers even to project-related questions that the teacher may otherwise not be able to answer
Case Study #3: SENA, Colombia1.5 Million Students

Key Factor #4: Flexible Delivery Options

Flexible Delivery Options: Benefits
Decision Makers:
• Allows decision makers to offer a technology-enhanced solutions even in areas with low level of technological readiness
Teachers:
• Enables teachers to close the gap between digital natives and digital immigrants
• Enhances computer literacy
Students:
• Bridges technological, educational, and economic gaps
• Boosts motivation

Case Study #4: MINEDU, Peru1,000 Schools
Key Factor #5: Teacher Training

Teacher Training: Benefits
Decision Makers:
• Enhances teacher commitment
• Maximizes learning outcomes
• Improves the standing of the institution
Teachers:
• Familiarizes teachers with new technologies
• Increases professional confidence
• Increases motivation

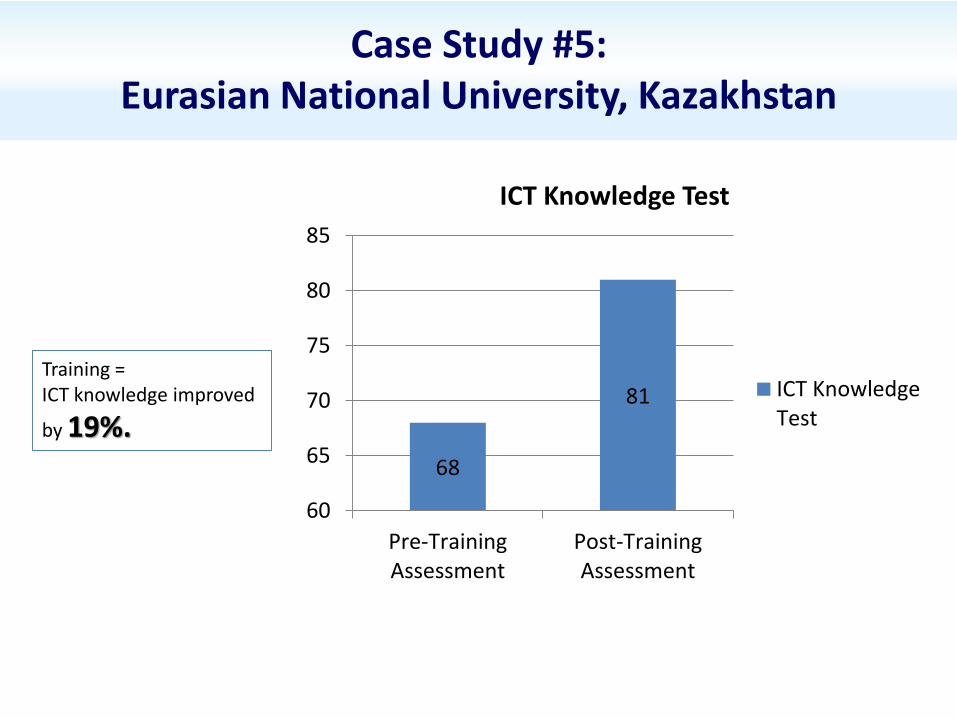
Case Study #5: Eurasian National University, Kazakhstan
Case Study #5: Eurasian National University, Kazakhstan
68
81
60
65
70
75
80
85
Pre-TrainingAssessment
Post-TrainingAssessment
ICT Knowledge Test
ICT KnowledgeTest
Training = ICT knowledge improved
by 19%.

Key Factor #6: Implementation Follow-up
Planning
Follow-up
Plan of Action
Resource Allocation

Implementation Follow-up: Benefits
Decision Makers:
• Maximizes program outcomes by identifying and addressing areas of weakness at the early stages
• Enables implementation/technological/HR adjustments when necessary
• Ensures that follow-up is geared to identifying schools which may require a higher level of support
Teachers:
• Improves teaching practices
• Provides constructive feedback together with a detailed plan of action
Students:
• Ensures all students have equal opportunities

Case Study #6: MINEDU, Peru1,000 Schools

Key Factor #7: Professional Development

Helping Teachers Get Tools for Improvement They Want and Deserve
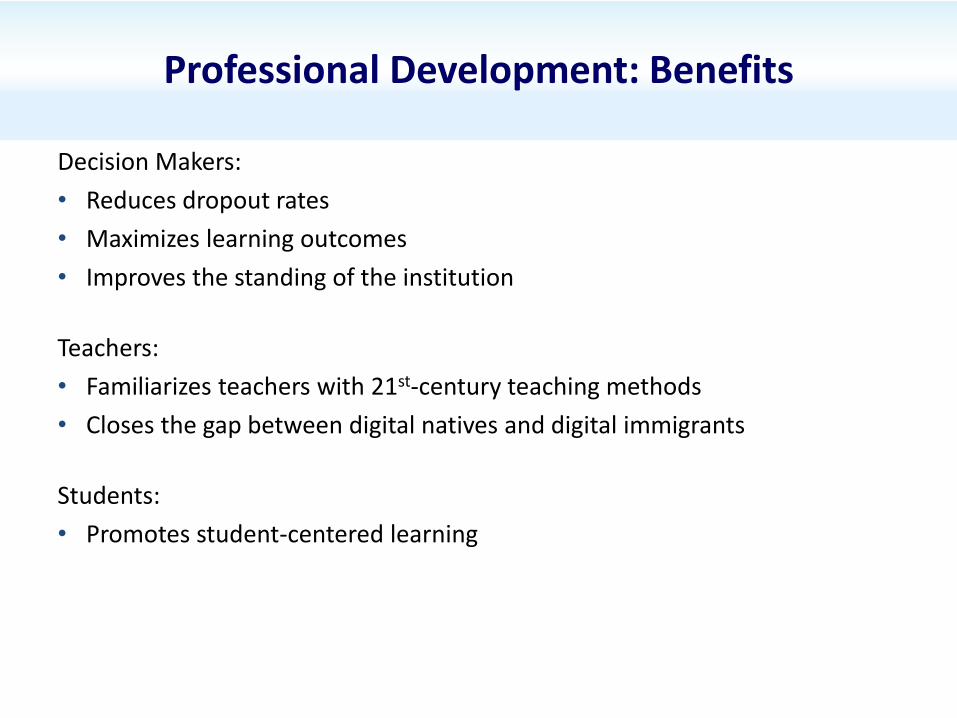
Professional Development: Benefits
Decision Makers:
• Reduces dropout rates
• Maximizes learning outcomes
• Improves the standing of the institution
Teachers:
• Familiarizes teachers with 21st-century teaching methods
• Closes the gap between digital natives and digital immigrants
Students:
• Promotes student-centered learning

Case Study #7: Javier College CALL Methodologies Course
Panama, 8,000 Students

Case Study #7: Javier College CALL Methodologies Course

Key Factor #8: Assessment and Evaluation

Assessment and Evaluation: Benefits
Decision Makers:
• Enables implementation/technological/HR adjustments when necessary throughout the course
Teachers:
• Enables teachers to verify that the course objectives are being met
• Enables teachers to identify struggling students and get them back on track
• Enables teachers to make sure that their teaching methods lead to effective learning outcomes and make adjustments when necessary
Students:
• Enables students to strengthen areas of weakness
• Enables students to reflect on the learning process

Case Study #8: MOE, Tamaulipas, Mexico3,000 Teachers

Key Factor #9: Macro-level Analysis of Data

Macro-level Analysis of Data: Benefits
Decision Makers:
• Provides bird’s-eye view of project status
• Identifies struggling regions, schools, faculties, and individual teachers
Teachers:
• Provides teachers with support and solutions to arising issues at the early stages
Students:
• Identifies and provides solutions to at-risk students early on

Case Study #9: MINEDU, Peru1,000 Schools

Key Factor #10: Reduced Dropout Rates

Reduced Dropout Rates: Benefits
Decision Makers:
• Maximizes the outcomes of publically-funded projects (ROI)
• Ensures that no child is left behind
• Closes economic gaps
Teachers:
• Maximizes learning outcomes
• Closes educational gaps
Students:
• Closes educational gaps
• Opens doors to a better future

Case Study #10: SENA, Colombia1.5 Million Students

Key Factor #11: Long-term Teacher Retention
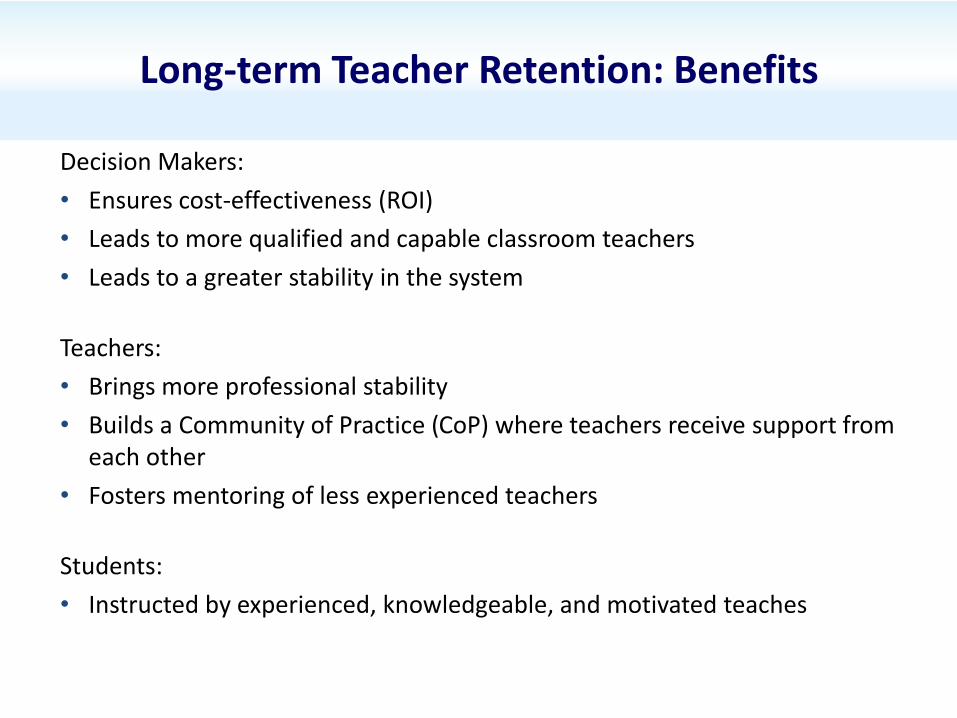
Long-term Teacher Retention: Benefits
Decision Makers:
• Ensures cost-effectiveness (ROI)
• Leads to more qualified and capable classroom teachers
• Leads to a greater stability in the system
Teachers:
• Brings more professional stability
• Builds a Community of Practice (CoP) where teachers receive support from each other
• Fosters mentoring of less experienced teachers
Students:
• Instructed by experienced, knowledgeable, and motivated teaches

Case Study #11: NIS (Nazarbayev Intellectual Schools), Kazakhstan
800 Teachers

Categories Key Factors Fall Into
Positive Learning
Outcomes
SolidImplementation
21st -CenturyPedagogies
Flexible Delivery Options
Assessment and Evaluation

Case Study
• INACAP is Chile’s largest institution of higher education
• 27 campuses
• 115,000 students
• 100 technical and professional degree programs

Impact on Learning: The Case Study of INACAP
18
25
37
5459
0
10
20
30
40
50
60
70
March April May June July
Logins
Progress
Key Factors = Logins and Progress
increased 41% over 4
months.
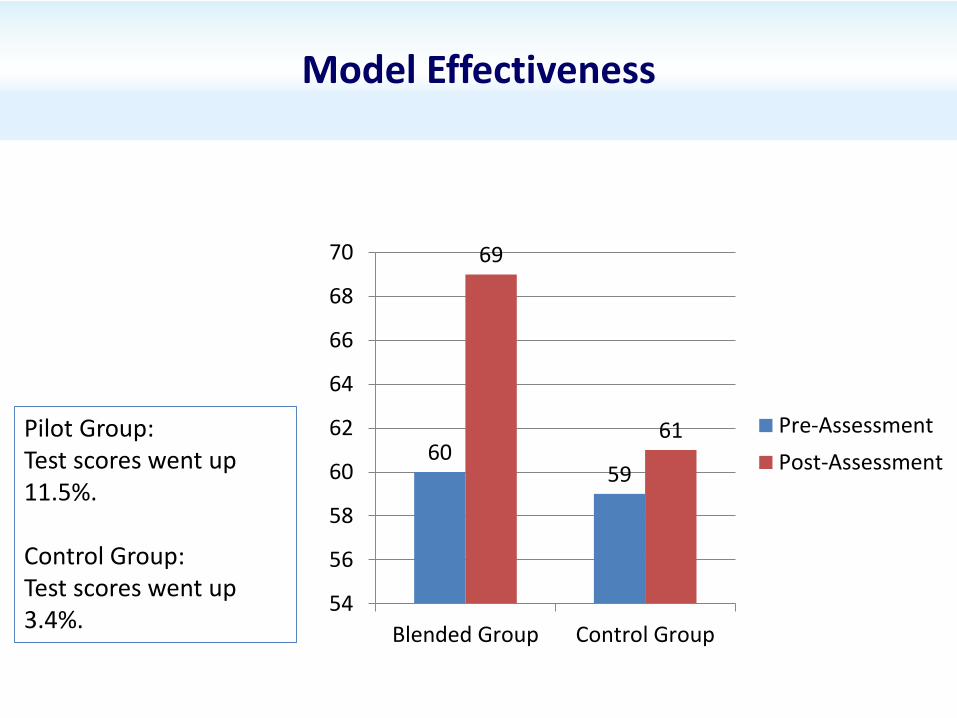
Model Effectiveness
6059
69
61
54
56
58
60
62
64
66
68
70
Blended Group Control Group
Pre-Assessment
Post-Assessment
Pilot Group: Test scores went up 11.5%.
Control Group: Test scores went up 3.4%.

Success Indicators
From
• 96 Active Classes
• 1,669 Students in 2009
• A Single Program (General English)
To
• 285 Active Classes
• 3,351 Students in 2015
• A Dual Program (General English and ESP)