2014 partners wealth group audit survey 2
DESCRIPTION
ÂTRANSCRIPT
The aim of this report is to provide a source of data to
assist SMSF trustees and their advisors in their decision
making.

SURVEY FINDINGS
Almost half of the funds in the survey were either paying a pension to a retired member or a Transition to Retirement Income Stream to a member who had attained preservation age.
Reportable contraventions continued to fall although this year, however we saw an increase in the number of breaches arising from SMSFs borrowing.
Partners Superannuation Services (PSS) is part of the Partners Wealth Group (PWG). PWG is a national organisation that provides financial and legal services to accountants and their clients.
The annual survey conducted is based on a random selection of 600 funds drawn from the pool of funds audited by PSS in the preceding year. Some of the funds may have been included in a prior year's sample group.
PSS has two ASIC registered auditors, Martin Murden and Tiffany Yang.
The aim of the survey is to provide a source of data to assist SMSF trustees and their advisors in their decision
making. A table showing comparisons of the survey for the seven years to 2014 is included in the appendices.
For more information about Martin and Tiffany, and the services Partners Wealth Group provides, visit
www.partnerswealthgroup.com.au

SURVEY FINDINGS
The total number of funds requiring a contravention report to be lodged with the ATO fell slightly from 5.3% to 5% of the survey group. The longer term average is 6.3%. Whilst the continued decline is evidence trustees are trying to comply with the requirements of SIS, it is noticeable the ATO's figures show only approximately 2.2% of all funds had a contravention report to be lodged in the 2013/14 year.
The two most common contraventions for each year the survey has been in operation have been in house assets and loans to members. This year has seen some change. These two breaches have fallen to 20% and 23.3% respectively. The averages since the survey commenced have been 36% and 32%.
This year has seen a significant increase in breaches arising from borrowings by SMSFs, an increase from 12.5% to 23.3% of the total funds which have been issued with contravention reports. Only one of the breaches in this category related to a fund acquiring property via a LRBA.
There were only two other breaches that occurred more than once. Both occurred twice. They were failure to provide the auditor with the information requested within the prescribed timeframe and failing to comply with the member trustee rules.
*Other breaches included
Failure to comply with pension payment requirements
Giving a charge over fund assets for personal borrowings
Disqualified person acting as trustee
Failure to comply with the rules concerning artwork and collectibles
2014 Audit Breaches

SURVEY FINDINGS
The average fund size in this year's sample group was $1.022m, a sizeable increase on the previous group which was $823K. The average fund size for the seven years of the survey was $784K.
A noticeable change with this year's group of funds was in numbers at the extremes. 191 funds or almost 32% had assets in excess of $1m including 13 with assets greater than $5m. The largest fund just topped the $10m figure. Over the survey period funds with $1m or more in assets have averaged 24%
At the other end of scale, 29 funds or 5% had assets of less than $100k and a further 46 funds (8% had assets in the $100-200K range. The averages over the last 7 years have been 11% and 13% respectively. Whilst some of the smaller of these were first year funds with rollovers to come from other funds, it was evident that others had been in operation for some years and they were only slowly increasing in size.
Over the course of the last 7 years, the number of funds with 2 members has stayed within a narrow band of 68-72% with the average being 70%. This year's survey came in with 70% of funds having 2 members. Sole member funds made up 24% of the survey group. The longer term average is 22% and this year was at the upper end of the 18-24% range of the last 7 years.
Three and four member funds were at their lowest for the survey period with 6%. The average has been 8% and the highest 10% in {year}
Whilst the most common fund size remains at two, being typically a husband and wife or a couple in a de facto relationship, the one member funds are of interest. Whilst some of these have been started as a single member fund, others have become so due to either the death of a member or divorce.
Three and four member funds usually comprise parents and one or more of their children.

SURVEY FINDINGS
39.6% of investments were in listed shares and trusts which was consistent with the seven year average of 39%. The percentage held stayed within a narrow band over the course of the survey with a constantly changing pool of funds.
Direct property investment was 22% of total investments. This has fluctuated over the seven years from 13.4% in 2008 to a high of 22.1%. The average has been 19%. What is interesting to note is that of the 165 funds in the survey group that directly held property, the average fund value was $1.689m and that almost 48% of this was invested in direct property.
Cash and fixed interest investments were 13.6% and 14.8% respectively. Both have an average of 14% over the seven years the survey has been conducted. Last year's survey group recorded 19.6% in fixed interest investments. With subdued interest rates, a lower allocation could be expected as trustees look elsewhere for higher returns. One reason for a consistently high allocation to cash is the percentages are calculated at the end of the financial year and SMSFs can be expected to have received additional contributions in the month of June which are yet to be invested by the end of the month.
This year's survey group recorded the lowest allocation (4.4%) to managed funds for the seven year period. The lowest previously recorded was 5.3% and the average over the period of the survey has been 6%.
Other investments at 5.6% were also below the longer term average of 7%. Other investments include artwork & collectibles, in house assets, unlisted investments and associated unit trusts.
ASSET DIVERSIFICATION OVER 7 YEAR PERIOD
SURVEY FINDINGS
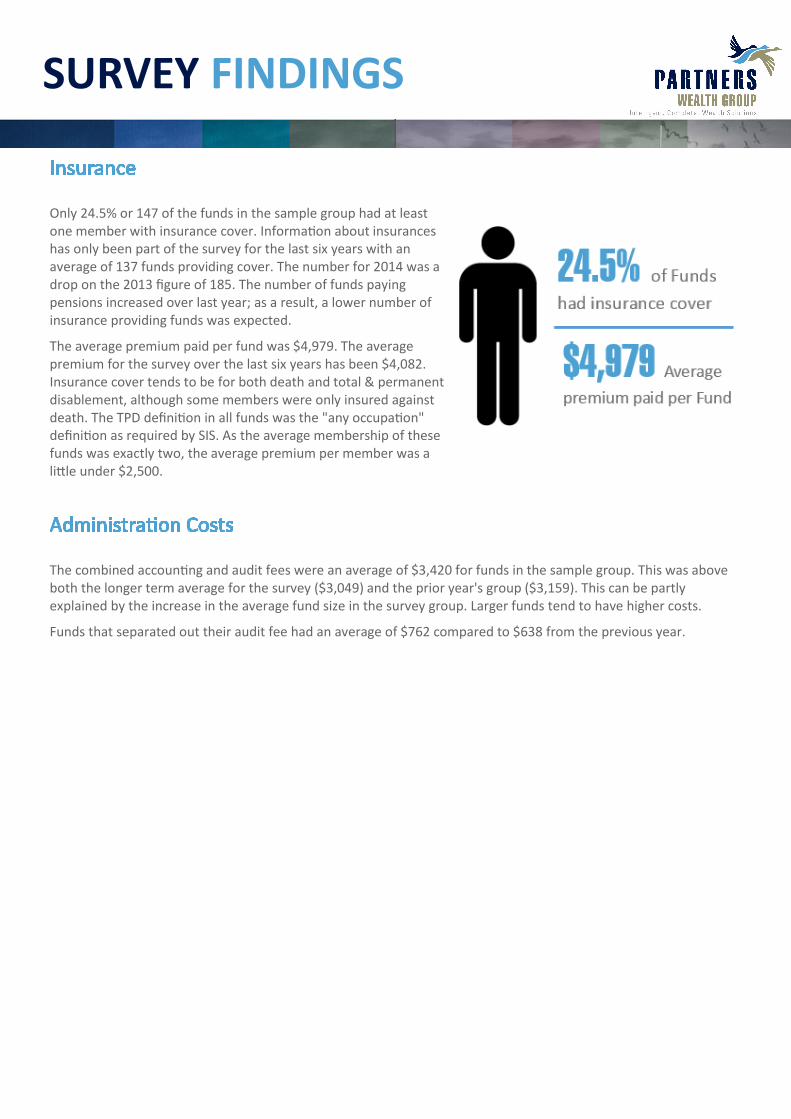
Only 24.5% or 147 of the funds in the sample group had at least one member with insurance cover. Information about insurances has only been part of the survey for the last six years with an average of 137 funds providing cover. The number for 2014 was a drop on the 2013 figure of 185. The number of funds paying pensions increased over last year; as a result, a lower number of insurance providing funds was expected.
The average premium paid per fund was $4,979. The average premium for the survey over the last six years has been $4,082. Insurance cover tends to be for both death and total & permanent disablement, although some members were only insured against death. The TPD definition in all funds was the "any occupation" definition as required by SIS. As the average membership of these funds was exactly two, the average premium per member was a little under $2,500.
The combined accounting and audit fees were an average of $3,420 for funds in the sample group. This was above both the longer term average for the survey ($3,049) and the prior year's group ($3,159). This can be partly explained by the increase in the average fund size in the survey group. Larger funds tend to have higher costs.
Funds that separated out their audit fee had an average of $762 compared to $638 from the previous year.

SURVEY APPENDIX
2014 Audit Survey Statistics
ATO Contravention Reports 2014 2013 2012 2011 2010 2009 2008
Funds 5 5.3 5.3 5.5 3.4 7.2 11.3
Breaches
In House Assets 20 31 31 36 47 22 50
Loans to members 23 38 31 33 18 44 25
Other 57 31 38 31 35 34 25
Membership 2014 2013 2012 2011 2010 2009 2008
2 member fund 70 70 72 70 68 72 68
1 member fund 24 23 21 22 22 18 22
3 or 4 member fund 6 7 7 8 10 10 10
Fund Size 2014 2013 2012 2011 2010 2009 2008
> $1m 32 23 29 24 25 17 15
< $100,000 5 7 9 8 12 15 24
$100,000 - $200,000 8 12 10 12 13 20 17
Average $1,022,105 $823,467 $923,652 $796,641 $729,061 $684,062 $511,806
Asset Diversification 2014 2013 2012 2011 2010 2009 2008
Shares/Listed Trusts 39.6 27.2 37.5 41.9 37.7 42.2 44.3
Property 22 21.2 22.1 18.1 20.3 19.3 13.4
Cash 13.6 16.6 10.7 10.6 14.3 15.5 15.0
Fixed Interest 14.8 19.6 13.6 15.4 13.4 11.0 12.7
Managed Funds 4.4 8.0 6.3 5.3 7.4 6.3 7.7
Other 5.6 7.4 9.8 5.7 6.9 5.7 6.9
Funds Paying Pensions 2014 2013 2012 2011 2010 2009 2008
46.5 37.7 40.7 37.7 30.0 23.8 14.8
Accounting & Audit Fees 2014 2013 2012 2011 2010 2009
$3,420 $3,159 $3,243 $3,065 $2,922 $2,483
Insurance Premiums 2014 2013 2012 2011 2010 2009
Number of Funds 147 185 142 126 115 108
Average Premium $4,979 $4,427 $4,862 $3,817 $2,956 $3,449
Comments about the figures in the table
Figures are percentages unless otherwise indicated.
"Other" for asset diversification includes artwork & collectibles, associated unit trusts and in house assets.
Questions about accounting & audit fees and insurance premiums were not asked in the 2008 survey.
TABLE 1. Summary of data

CONTACT US
For further information about the PSS Audit Survey, contact Partners Superannuation Services
Partners Wealth Group Partners Retirement Planning & Investment Advisors Partners Aged Care Advice Partners Property Partners Superannuation Tax Services Partners Superannuation Services Partners Wealth Protection Partners Mortgage & Lending Guild Financial Planning Partners 360 Partners Legal Head Office: Level 13, 636 St Kilda Road, Melbourne VIC 3004 T 03 8508 7800 NSW Office: Level 4, 8 Spring Street, Sydney NSW 2000 T 02 8017 7200 QLD Office: Level 3, 164 Grey Street, South Brisbane, QLD 4101 T 07 3230 8560 WA Office: Level 1, 9 Bowman Street, South Perth, WA 6151 T 08 9368 8650
☎ 1800 333 143 www.partnerswealthgroup.com.au
Disclaimer: This publication has been prepared to provide you with general information only. It is not intended to
take the place of professional advice and you should not take action on specific issues in reliance on this information. In
preparing this information, we did not take into account the investment objectives, financial situation or particular needs of
any particular person. Before making an investment decision, you need to consider (with or without the assistance of an
adviser) whether this information is appropriate to your needs, objectives and circumstances. Partners Wealth Group does
not give any warranty as to the accuracy, reliability or completeness of information. We do not accept any liability for any
error or omission in this presentation or for any resulting loss or damage. Past performance is not indicative of future
performance. This information is provided for persons in Australia only and is not provided for the use of any person who is in
any other country. The Advisors of Partners Retirement Planning & Investment Advisors are Authorised Representatives of
Charter Financial Planning Limited Australian Financial Services Licensee Licence No 2324665.
Tiffany Yang Senior Auditor, Partners Superannuation Services
E [email protected] T 1800 333 143
Martin Murden Director Audit & Consulting, PSS
E [email protected] T 1800 333 143