2013 annual venture capital rundown - pitchbook
TRANSCRIPT

Better Data. Better Decisions.
RundownVenture Capital2013 Annual
90VC funds closed on $20.2 billion
in 2012
Capital exited hits a new high of
$47.3 billion in 2012
Page 14Page 3 Page 13
VC firms invest
$27.8Bacross
3,417 dealsin 2012
PitchBook®

Bet ter Data. Bet ter Decisions.PitchBook
2013 Annual Venture Capital Rundown
Table of ContentsIntroduction
2012 VC Snapshot2012 VC OverviewAngel/Seed Rounds
Early Stage Venture RoundsLate Stage Venture Rounds
2012 First FinancingsRegional Rundown
The ‘Series A Crunch’ Industry Focus
VC ExitsVC Fundraising
Deals in Trending SectorsMost Active Investors
Methodology
12345678910-121314151617
COPYRIGHT © 2013 by PitchBook Data, Inc. All rights reserved. No part of this publication may be reproduced in any form or by any means – graphic,
electronic, or mechanical, including photocopying, recording, taping, and information storage and retrieval systems – without the express written permission
of PitchBook Data, Inc. Contents are based on information from sources believed to be reliable, but accuracy and completeness cannot be guaranteed. Nothing
herein should be construed as any past, current or future recommendation to buy or sell any security or an offer to sell, or a solicitation of an offer to buy any
security. This material does not purport to contain all of the information that a prospective investor may wish to consider and is not to be relied upon as such or
used in substitution for the exercise of independent judgment.

2013 Annual Venture Capital Rundown
Bet ter Data. Bet ter [email protected]
www.pitchbook.com
Introduction
1
A tale of two halvesAttempting to draw conclusions about VC investing in the U.S. proved more difficult than usual in 2012. Excuse the cliché, but it truly was a tale of two halves. 2012 started on a high note, as the first half of the year was the best ever in terms of VC financings, with 1,992 investments. Unfortunately, deal-making in the second half of the year was as sluggish as the first half was blistering, with the number of VC rounds declining 25% in 3Q and 17% in 4Q, which was the slowest quarter since 3Q 2009. The amount of capital invested also dwindled throughout the year and fell 19% from 2011 to 2012. Despite the slowdown at the end of the year, the number of VC financings only declined 3% from 2011 to 2012, and many VCs are expressing optimism about prospects in 2013 and beyond.
Much of the confidence stems from the continuing development of disruptive technologies, such as mobile, cloud computing, and big data, that have the capability of changing how both consumers and businesses utilize and interact with technology. Many investors also see promising opportunities in the Healthcare space, particularly in technology systems that can improve efficiency and reduce costs.
The outlook for exits also looks promising in 2013. While exit volume has declined for the past two years, capital exited has climbed each year since 2008. Public equity markets have become a more viable exit option in recent years, as the 45 VC-backed IPOs in 2012 were the most since 2007. Additionally, corporations continue to hold large stores of cash on their balance sheets, and U.S.-based private equity funds have more than $400 billion of dry powder to put to work.
Fundraising has been one of the most discussed topics in VC circles in recent years, as capital invested has outstripped capital raised every year since 2009. With fewer dollars flowing into the asset class, the capital that has been raised recently was concentrated among a few top performing funds. That began to change in 2012, as the average fund size dropped 37% from 2011. Furthermore, there were more funds of $50 million or less raised in 2012 than any year since 2008.
The rest of this report will delve deeper into all of the trends mentioned above and provide a forward-looking analysis of VC investment in the year ahead. We hope this report, which has been compiled using data collected on a deal by deal, company by company, and fund by fund basis, provides you with valuable information and insights.

2
Venture CapitalSnapshot 2012 Better Data. Better Decisions.
Early Stage
Later Stage
Angel & Seed
1,529
1,074
814
1,609
1,255
671
$8,950
$18,059
$793
$11,360
$22,447
$640.6
$3.5
$10.6
$0.85
$3.8
$10.0
$0.75
Deal Count Total $ Invested ($M) Median Deal Size ($M) Industry % Change
Totals 3,4173,535
$27,807$34,444
$3.1$4.0
877-267-5593 [email protected]
Industry % Change Legend
Graphs represent deal count changes by industry from 2011 to 2012.
B2B B2C
Energy Healthcare
Information Technology
2% 14%
-5%-13%-20%
-10% -14% -12%-15%-29%
4% 15%
-9%-13%-12%
18% 36% 16%
$$
PitchBook is the leading research firm for Private Equity and Venture Capital. For more information visit www.pitchbook.com
2012 Stat2011 Statdirectional
trend
PitchBook®
17%-4%

2013 Annual Venture Capital Rundown
Bet ter Data. Bet ter [email protected]
www.pitchbook.com
2012 VC Overview
$8.0 $8.0 $7.3 $6.1 $4.8 $5.4 $5.5 $4.7 $6.4 $6.7 $5.4 $5.5 $9.0 $8.8 $9.0 $7.7 $7.1 $8.6 $6.5 $5.6
811699 693
589 620 596 631 651696
766718
737872
925 915 823950
1,042
779
646
0
200
400
600
800
1,000
1,200
$0
$1
$2
$3
$4
$5
$6
$7
$8
$9
$10
1Q 2Q 3Q 4Q 1Q 2Q 3Q 4Q 1Q 2Q 3Q 4Q 1Q 2Q 3Q 4Q 1Q 2Q 3Q 4Q
2008 2009 2010 2011 2012
Capital Invested ($B) # of Deals Closed
A year of highs and lows for venture funding
Source: PitchBook
It is hard to imagine a better start to the year for VC investing than we saw in 2012. Deal-making increased 15% in 1Q and 10% in 2Q, which was the most active quarter for VC investing on record. At the halfway point in 2012, the VC industry appeared to be primed for a record-breaking year as it continued its steady growth from the depths of 2009. However, the story changed drastically in 3Q as VC investors completed just 779 investments—the lowest quarterly total since 4Q 2010. Deal flow continued to decelerate through the end of the year, with just 646 financings completed in 4Q 2012—the lowest quarterly total since 3Q 2009.
Despite the disappointing finish to 2012, the number of VC rounds declined just 3% from 2011 to 2012. The downturn was more significant when looking at capital invested, however, which sank 19% from $34.4 billion in 2011 to $27.8 billion in 2012. One of the most significant reasons for the stark drop in capital invested was a considerable slowdown in VC rounds of $100 million or more. The number of $100 million financings fell 50% from 2011 to 2012 as the total amount of capital invested in these deals dropped from $8.1 billion to $3.2 billion.
Another important factor in the drop-off in capital invested is the increasing proportion of angel/seed rounds, which expanded from 19% of VC deals in 2011 to 24% in 2012. As we will discuss later, the proportion of angel/seed financings has steadily been increasing as a proportion of VC activity in recent years while early stage rounds have been declining, creating what some people have dubbed the “Series A Crunch.”
VC Deal Count Breakdown by Stage
2011
Angel/Seed Early Stage Late Stage
0 500 1000 1500 2000 2500 3000 3500 4000
2012
2010
2009 2,498
2,917
3,535
3,417
VC Deal Flow
3
Source: PitchBook

Bet ter Data. Bet ter Decisions.PitchBook
2013 Annual Venture Capital Rundown
Angel/Seed Rounds
$103 $29 $63 $43 $57 $35 $41 $61 $71 $67 $77 $89 $171 $163 $132 $175 $165 $209 $221 $198
8545 54
41
8055 61 69
10985
117 101
175 164 158174
225247
184
158
0
50
100
150
200
250
300
$0
$50
$100
$150
$200
$250
1Q 2Q 3Q 4Q 1Q 2Q 3Q 4Q 1Q 2Q 3Q 4Q 1Q 2Q 3Q 4Q 1Q 2Q 3Q 4Q
2008 2009 2010 2011 2012
Capital Invested ($M) # of Deals Closed
While the number of angel/seed rounds waned through the second half of 2012, the capital invested in these deals remained relatively strong throughout the year. Despite the slowdown in 3Q and 4Q, there was a 21% increase in the number of angel/seed rounds and a 24% uptick in capital invested from 2011 to 2012.
As the chart above shows, the amount of angel/seed capital flowing into companies has increased significantly in the last two years. Investors doled out $303.4 million in angel/seed rounds in 2010. That total more than doubled to $640.6 million in 2011 and expanded to $793.4 million in 2012.
It should come as no surprise that Software was the predominate sector for angel/seed investing once again in 2012. However, over the last two years, the Software industry has seen its share of angel/seed rounds decline as investors have gravitated to opportunities in the Consumer
Angel/seed investing hits new high in 2012Angel/Seed Deal Flow
Products & Services (B2C) industry, where angel/seed financings climbed an exponential 199% from 2010 to 2012. But while Software shrank from 53% of angel/seed rounds in 2010 to 46% in 2012, the number of financings increased 73% and capital invested spiked 162% over the same period.
Most of the expansion in the
B2C space has been fueled by strong increases in both B2C Media and Retail financings. Since 2009, the number of angel/seed rounds in the B2C Media sector has nearly tripled from 55 to 145 in 2012, while the number of angel/seed rounds in the Retail sector has more than doubled from 18 to 38 during the same period.
Top Sectors in Angel/Seed Round Deal Counts
Source: PitchBook
Source: PitchBook
0 200 400 600 800
Software Commercial Services
B2C Media
Healthcare Devicesand Supplies
Other
2012
2011
2010
Retail
4
2013 Annual Venture Capital Rundown
Bet ter Data. Bet ter [email protected]
www.pitchbook.com
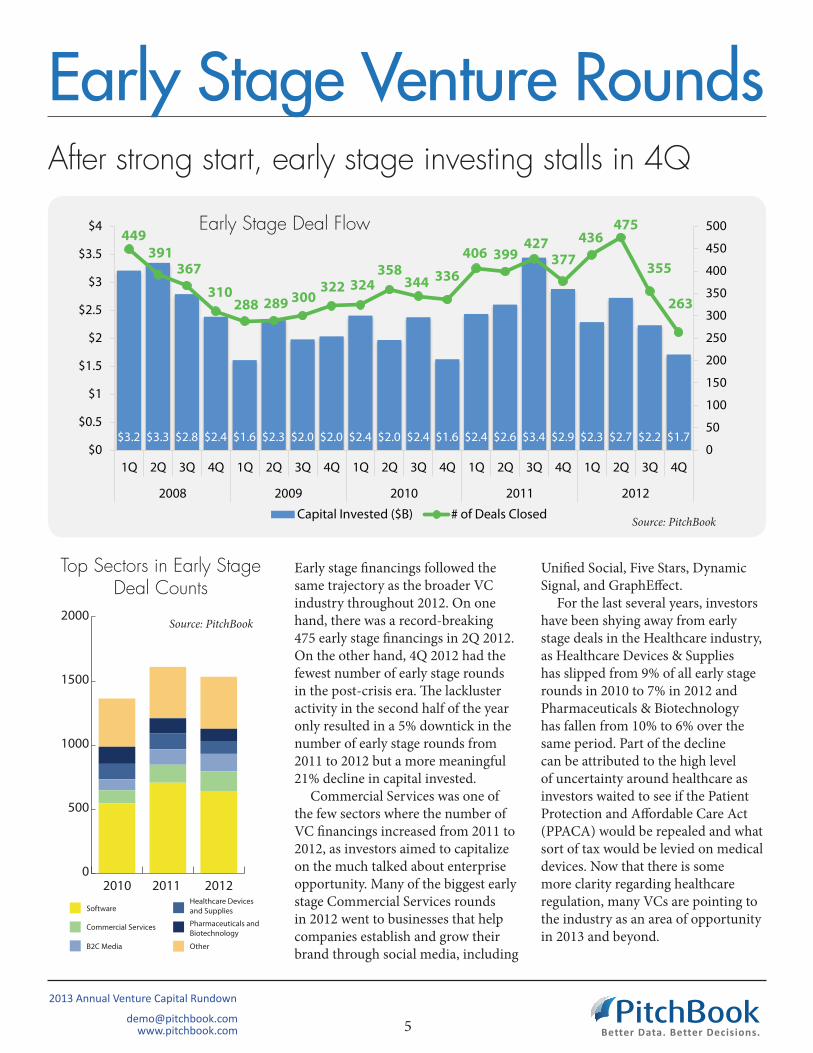
Early Stage Venture RoundsAfter strong start, early stage investing stalls in 4Q
Source: PitchBook
Early Stage Deal Flow
$3.2 $3.3 $2.8 $2.4 $1.6 $2.3 $2.0 $2.0 $2.4 $2.0 $2.4 $1.6 $2.4 $2.6 $3.4 $2.9 $2.3 $2.7 $2.2 $1.7
449391
367
310288 289 300
322 324358
344 336
406 399427
377436
475
355
263
0
50
100
150
200
250
300
350
400
450
500
$0
$0.5
$1
$1.5
$2
$2.5
$3
$3.5
$4
1Q 2Q 3Q 4Q 1Q 2Q 3Q 4Q 1Q 2Q 3Q 4Q 1Q 2Q 3Q 4Q 1Q 2Q 3Q 4Q
2008 2009 2010 2011 2012
Capital Invested ($B) # of Deals Closed
Early stage financings followed the same trajectory as the broader VC industry throughout 2012. On one hand, there was a record-breaking 475 early stage financings in 2Q 2012. On the other hand, 4Q 2012 had the fewest number of early stage rounds in the post-crisis era. The lackluster activity in the second half of the year only resulted in a 5% downtick in the number of early stage rounds from 2011 to 2012 but a more meaningful 21% decline in capital invested.
Commercial Services was one of the few sectors where the number of VC financings increased from 2011 to 2012, as investors aimed to capitalize on the much talked about enterprise opportunity. Many of the biggest early stage Commercial Services rounds in 2012 went to businesses that help companies establish and grow their brand through social media, including
Software
Commercial Services
B2C Media
Healthcare Devicesand Supplies
Pharmaceuticals andBiotechnology
Other
2012201120100
500
1000
1500
2000
Top Sectors in Early Stage Deal Counts
Unified Social, Five Stars, Dynamic Signal, and GraphEffect.
For the last several years, investors have been shying away from early stage deals in the Healthcare industry, as Healthcare Devices & Supplies has slipped from 9% of all early stage rounds in 2010 to 7% in 2012 and Pharmaceuticals & Biotechnology has fallen from 10% to 6% over the same period. Part of the decline can be attributed to the high level of uncertainty around healthcare as investors waited to see if the Patient Protection and Affordable Care Act (PPACA) would be repealed and what sort of tax would be levied on medical devices. Now that there is some more clarity regarding healthcare regulation, many VCs are pointing to the industry as an area of opportunity in 2013 and beyond.
Source: PitchBook
5

Bet ter Data. Bet ter Decisions.PitchBook
2013 Annual Venture Capital Rundown
Late Stage Venture Rounds
$4.7 $4.6 $4.4 $3.7 $3.1 $3.0 $3.5 $2.6 $3.9 $4.7 $2.9 $3.8 $6.4 $6.0 $5.4 $4.6 $4.6 $5.7 $4.0 $3.7
277 263 272238 252 252
270 260 263
323
257300 291
362330
272289
320
240225
0
50
100
150
200
250
300
350
400
$0
$1
$2
$3
$4
$5
$6
$7
1Q 2Q 3Q 4Q 1Q 2Q 3Q 4Q 1Q 2Q 3Q 4Q 1Q 2Q 3Q 4Q 1Q 2Q 3Q 4Q
2008 2009 2010 2011 2012
Capital Invested ($B) # of Deals Closed
$100 million late-stage rounds fall nearly 50% in 2012Late Stage Deal Flow
Both the number of late stage rounds and the amount of capital invested through those deals fell for the first time in three years in 2012. Most of the downturn in 2012 can be attributed to the sluggish deal-making in the second half of the year, with 4Q being the slowest quarter for late stage financings since 4Q 2007. There was a noticeable dearth of late stage rounds of $100 million or more throughout the year; investors completed just 17 such financings in 2012—a 48% decrease from 2011.
The Software sector once again dominated and even grew its share of late stage financings from 32% in 2011 to 34% in 2012. Within the Software industry, there was a significant 80% increase in financings for Social/Platform Software from 2011 to 2012 as investors continue to capitalize on the proliferation of mobile devices and online networks. Many enterprise-focused Software sectors, such as
0 300 600 900 1200 1500
Software
Commercial Services
B2C Media
Healthcare Devicesand Supplies
Pharmaceuticals andBiotechnology
Other
2012
2011
2010
Top Sectors in Late Stage Deals
Business/Productivity, Database, and Network Management, also saw more late stage financings in 2012.
With the capital intensive nature of many Healthcare-related businesses, Healthcare Devices & Supplies and Pharmaceuticals & Biotechnology were the second and third most invested in sectors, respectively, in 2012. However,
Healthcare Devices & Supplies saw a 28% decline in late stage financings from 2011 to 2012, which could be a function of the medical device tax that was put into effect on January 1, 2013. Pharmaceuticals & Biotechnology, on the other hand, was one of the few sectors to enjoy an uptick in late stage financings from 2011 to 2012.
Source: PitchBook
Source: PitchBook
6
2013 Annual Venture Capital Rundown
Bet ter Data. Bet ter [email protected]
www.pitchbook.com
Source: PitchBook
2012 First Financings
0
50
100
150
200
250
300
350
400
450
1Q 2Q 3Q 4Q 1Q 2Q 3Q 4Q 1Q 2Q 3Q 4Q
2010 2011 2012
Software
B2C Media
Commercial Services
Pharmaceuticals andBiotechnologyHealthcare Devices andSuppliesOther
Total
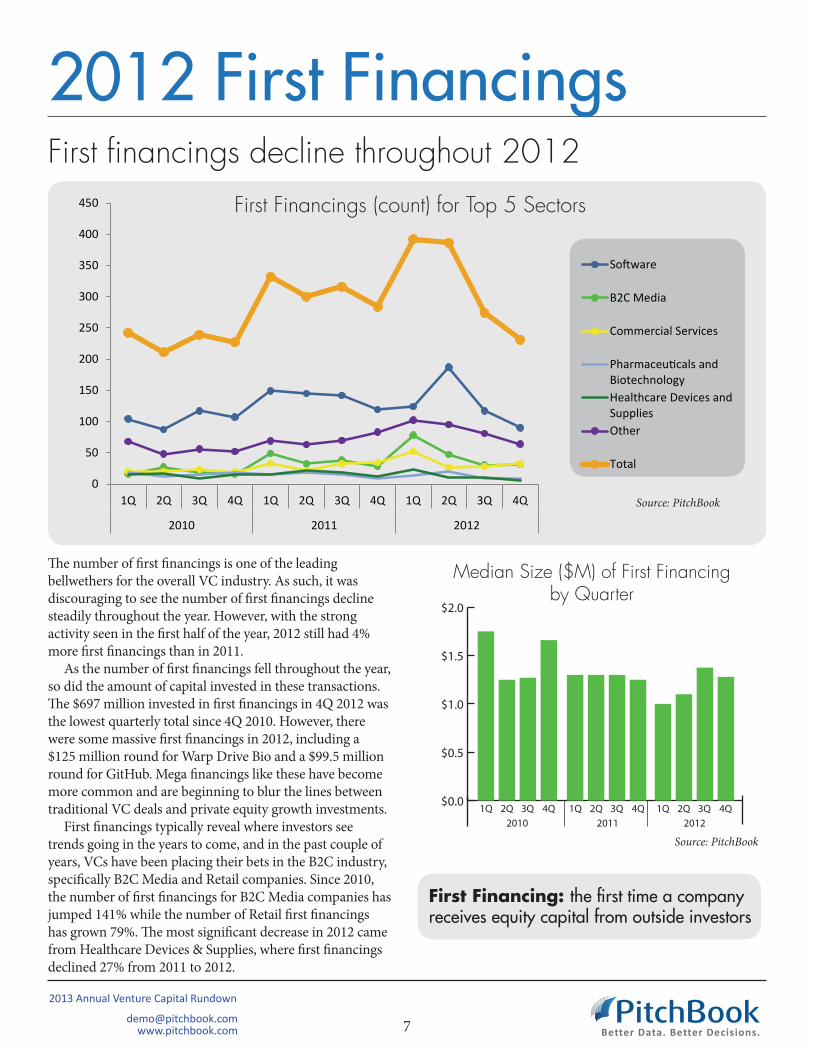
First financings decline throughout 2012First Financings (count) for Top 5 Sectors
First Financing: the first time a company receives equity capital from outside investors
Median Size ($M) of First Financing by Quarter
Source: PitchBook
$0.0
$0.5
$1.0
$1.5
$2.0
2010 2011 20121Q 2Q 3Q 4Q 1Q 2Q 3Q 4Q 1Q 2Q 3Q 4Q
The number of first financings is one of the leading bellwethers for the overall VC industry. As such, it was discouraging to see the number of first financings decline steadily throughout the year. However, with the strong activity seen in the first half of the year, 2012 still had 4% more first financings than in 2011.
As the number of first financings fell throughout the year, so did the amount of capital invested in these transactions. The $697 million invested in first financings in 4Q 2012 was the lowest quarterly total since 4Q 2010. However, there were some massive first financings in 2012, including a $125 million round for Warp Drive Bio and a $99.5 million round for GitHub. Mega financings like these have become more common and are beginning to blur the lines between traditional VC deals and private equity growth investments.
First financings typically reveal where investors see trends going in the years to come, and in the past couple of years, VCs have been placing their bets in the B2C industry, specifically B2C Media and Retail companies. Since 2010, the number of first financings for B2C Media companies has jumped 141% while the number of Retail first financings has grown 79%. The most significant decrease in 2012 came from Healthcare Devices & Supplies, where first financings declined 27% from 2011 to 2012.
7

0 500 1,000 1,500
2011
2012
VC Deal Count
Capital Invested ($B)
Washington
Oregon
California
0 $5 $10 $15 $20
2011
2012
Regional Rundown
Not all Pacific blues for western VC deal-making
New England The number of New England-based VC rounds fell by 5% in 2012; however, New England was the only region to attract more VC capital in 2012 than 2011. Much of the uptick in capital invested came from the Energy industry, including a $420 million Series D round for GreatPoint Energy. Healthcare continued to lead New England in capital invested as it has every year since 2005. However, the IT industry has been gaining ground in recent years and now represents 33% of capital invested.
West Coast
Great LakesWhile the number of VC investments in the Great Lakes region only fell 6% from 2011 to 2012, the amount of capital invested plummeted a precipitous 62% over the same
period with declines of more than $100 million in five of the seven industries. As the chart accompanying
chart shows, 2011 was somewhat of an anomalous year with a $950 million Series D round for Groupon in 2011, but that is not the whole story. There was just one VC investment of more than $50 million in the Great Lakes region in 2012 compared to nine in 2011, including four of more than $100 million.
0%
10%
20%
30%
40%
50%
60%
70%
80%
90%
100%
2010 2011 2012
Materials &Resources
InformationTechnology
Healthcare
Financial Services
Energy
B2C
B2B
Capital Invested by Industry
Far and away the most active region of VC investment on a year-to-year basis, the West Coast saw 3% fewer deals in 2012 than 2011 but held steady at 45% of all VC financings. Interestingly, while there was a 13% contraction
in capital invested, the West Coast grew its proportion of total VC capital invested from 51% to 55%. Several sectors saw more VC investments in 2012, including Communications & Networking, B2C
Media, Retail, and Commercial Services. The hardest hit industry was once
again Healthcare, which saw a considerable 25% drop-off in
VC rounds from 2011 to 2012. Despite a negligible decline
in deals from 2011 to 2012, the Software
sector expectedly led the way with 693 financings. 0
2
4
6
8
10
$1,000
$1,500
$2,000
$2,500
$3,000
$3,500
2008 2009 2010 2011 2012
Capital Invested ($M)# of $50M+ Rounds
Capital Invested
8
Mid-Atlantic Midwest South Southeast Mountain2011
2012
Source: PitchBook
Source: PitchBook
Source: PitchBook
Deal Counts by Region
164
144
181
161
176
187
187
193
504
494
*The West Coast also includes Alaska
and Hawaii. Alaska had zero VC deals in 2012, while Hawaii had
three. Consequently, they were omitted from the
graphs above.

2013 Annual Venture Capital Rundown
Bet ter Data. Bet ter [email protected]
www.pitchbook.com
The ‘Series A Crunch’Angel/seed-backed companies start to feel the crunch
One of the hottest VC topics of 2012 was the “Series A Crunch,” which describes a growing number of angel/seed rounds and a declining number of follow-on financings. The chart above shows the number of angel/seed rounds charted against the number of early stage rounds for companies that had previously raised angel/seed funding. In 2008, the number of angel/seed rounds outstripped the number of early stage follow-on financings by just 1.9-to-1.
As is evident, that ratio has expanded considerably ever since and now sits at 3.3-to-1. Much of the phenomenon can be attributed to the fact that angel/seed rounds have ballooned from 8% of all VC financings in 2008 to 24% in 2012. Over that same period, early stage rounds have contracted from 54% of the total to 45%.
There have been conflicting views about the impact of the Series A Crunch, including whether or not it even exists. Some people fear that the growing size of VC funds and late stage financings could create a scarcity of capital for companies in early stage rounds. This fear is compounded by the fact that VC capital invested has outpaced fundraising for four consecutive years now. Others say that this is just a natural VC cycle, and we will see follow-on early stage rounds pickup now thanks to the increasing number of companies receiving angel/seed funding.
It is important to note that not raising an early stage
financing round may not necessarily be a sign of weakness. For example, our data show that several companies return to their angel/seed investors for multiple rounds of financing. Other companies simply do not have the need or desire to raise additional outside capital. Another possibility is that the company is acquired before having the opportunity to raise a follow-on financing.
0
200
400
600
800
225265
412
671
814
118 125176
255 244
2008 2009 2010 2011 2012
# of Early Stage Rounds for Co’s w/ Angel/Seed Funding
# of Angel/Seed Rounds
9
Large Angel/Seed Rounds withoutEarly Stage Financing
Company Last Financing Total Raised
BitDefender 2007 $7M
SilverbackEnterprise Group
2011 $11.5M
The Daily Caller
2009 $3M
DermTech 2007 $10M
Darkstrand 2008 $12M
Source: PitchBook
Source: PitchBook
Bet ter Data. Bet ter Decisions.PitchBook
2013 Annual Venture Capital Rundown
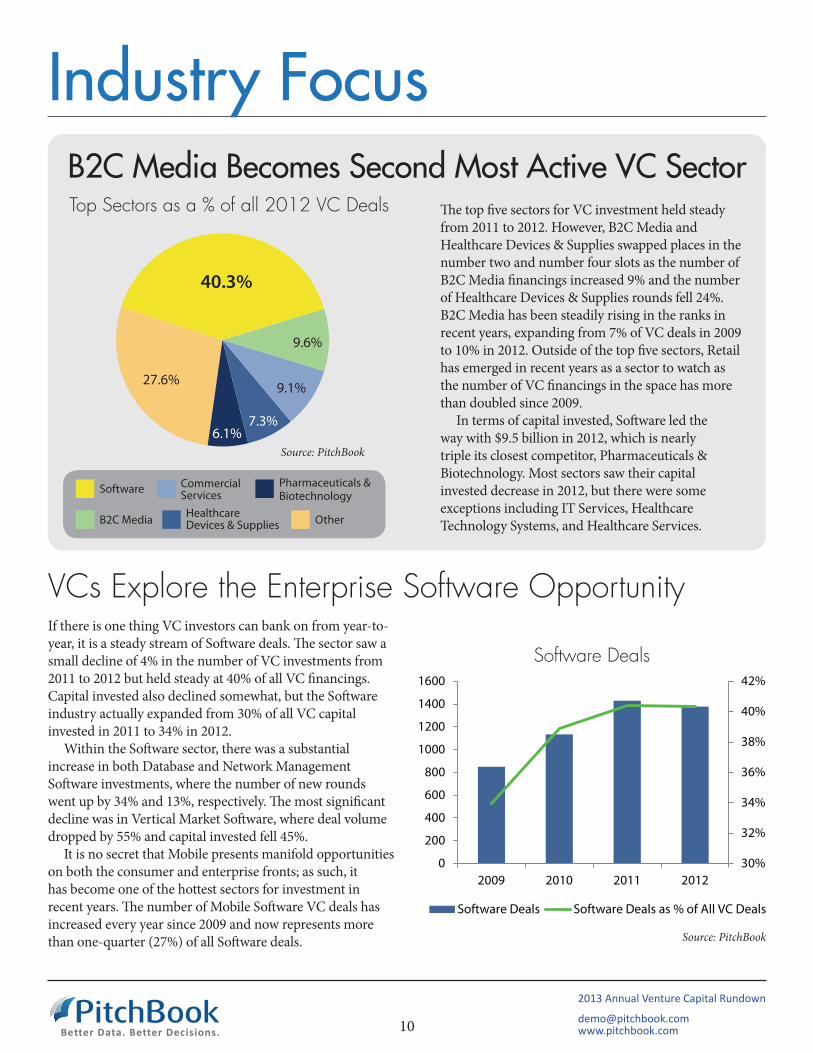
Industry FocusB2C Media Becomes Second Most Active VC SectorTop Sectors as a % of all 2012 VC Deals The top five sectors for VC investment held steady
from 2011 to 2012. However, B2C Media and Healthcare Devices & Supplies swapped places in the number two and number four slots as the number of B2C Media financings increased 9% and the number of Healthcare Devices & Supplies rounds fell 24%. B2C Media has been steadily rising in the ranks in recent years, expanding from 7% of VC deals in 2009 to 10% in 2012. Outside of the top five sectors, Retail has emerged in recent years as a sector to watch as the number of VC financings in the space has more than doubled since 2009.
In terms of capital invested, Software led the way with $9.5 billion in 2012, which is nearly triple its closest competitor, Pharmaceuticals & Biotechnology. Most sectors saw their capital invested decrease in 2012, but there were some exceptions including IT Services, Healthcare Technology Systems, and Healthcare Services.
VCs Explore the Enterprise Software OpportunityIf there is one thing VC investors can bank on from year-to-year, it is a steady stream of Software deals. The sector saw a small decline of 4% in the number of VC investments from 2011 to 2012 but held steady at 40% of all VC financings. Capital invested also declined somewhat, but the Software industry actually expanded from 30% of all VC capital invested in 2011 to 34% in 2012.
Within the Software sector, there was a substantial increase in both Database and Network Management Software investments, where the number of new rounds went up by 34% and 13%, respectively. The most significant decline was in Vertical Market Software, where deal volume dropped by 55% and capital invested fell 45%.
It is no secret that Mobile presents manifold opportunities on both the consumer and enterprise fronts; as such, it has become one of the hottest sectors for investment in recent years. The number of Mobile Software VC deals has increased every year since 2009 and now represents more than one-quarter (27%) of all Software deals.
Healthcare Devices and SuppliesPharmaceuticals and Biotechnology
40.3%
9.6%
9.1%
7.3%6.1%
27.6%
Software
B2C Media
CommercialServices
Healthcare Devices & Supplies
Pharmaceuticals & Biotechnology
Other
Source: PitchBook
10
Software Deals
30%
32%
34%
36%
38%
40%
42%
0
200
400
600
800
1000
1200
1400
1600
2009 2010 2011 2012
Software Deals Software Deals as % of All VC Deals
Source: PitchBook

2013 Annual Venture Capital Rundown
Bet ter Data. Bet ter [email protected]
www.pitchbook.com
Industry FocusClean Tech Falls Out of Favor in 2012
11
Both the number of VC financings and the amount of capital invested in Clean Tech companies fell for the first time in three years in 2012 as rock-bottom natural gas prices, high competition, and a rash of recent failures, including Miasole and Solyndra, have soured VC investors on the Clean Tech space. Not to mention the fact that there have only been 53 liquidity events for VC-backed Clean Tech companies since 2009, contrasted with 708 new financings. However, there is some reason for optimism as there were 21 exits from Clean Tech companies in 2012, including the successful IPO of SolarCity and a $100 million acquisition of SmartSynch.
Several prominent Clean Tech investors, including Vinod Khosla, have come out publicly to defend the space as an investment strategy. Veterans in the Clean Tech space argue that it is inherently different than Software and many of the other traditional VC sectors; Clean Tech takes more money and patience in order for companies to reach maturity. With that in mind, many Clean Tech-focused VCs appear to be retrenching for further investment.
Clean Tech Deal Flow
$1
0
50
100
150
200
250
$0
$1
$2
$3
$4
$5
2009 2010 2011 2012
Capital Invested ($B) # of Deals Closed
Source: PitchBook
Social Content Propels VC Investment in B2C MediaB2C Media has been one of the fastest growing sectors for VC investment, with the number of VC financings nearly doubling from 2009 to 2012. The Social Content subsector has been one of the main drivers of this growth, accounting for 42% of B2C Media VC rounds in 2012, compared to just 24% in 2009. Another area of strength has been Information Services, where the number of VC rounds hit an all-time high in 2012. With the shift to social, online content, more traditional subsectors of the B2C Media industry, such as Broadcasting, Radio, & Television and Publishing, have seen VC activity fall off considerably in recent years.
Despite the strong deal flow in the Social Content and Information Services subsectors, capital invested in these areas fell by well more than 50% from 2011 to 2012 as there simply was not the same appetite for massive financing rounds. To that end, the two aforementioned subsectors saw eight deals of more than $50 million totaling $1.2 billion in 2011, including a $490 million round for Zynga and a $200 million round for TrueCar. In 2012, however, there were just two deals of more than $50 million that brought in a combined $150 million.
Social Content as % of B2C Media Deals
0%10%20%30%40%50%60%70%80%90%
100%
2009 2010 2011 2012
Social Content Deals Other Media Deals
Source: PitchBook

Bet ter Data. Bet ter Decisions.PitchBook
2013 Annual Venture Capital Rundown
Industry FocusVCs Explore New Opportunities in Healthcare
12
VCs See Promise in B2B Media & Information ServicesCommercial Services accounted for 9% of all VC financings in 2012, but the investments were highly concentrated in the Media & Information Services subsector. PitchBook has 14 different subsectors under the Commercial Services umbrella, but Media & Information Services represented a whopping two-thirds (67%) of the sector’s VC rounds in 2012. While Commercial Services may not seem like a space primed for VC investment, the proliferation of social content and online media has created a need for services catered to enterprise clients.
Some of the largest deals in Commercial Media & Information Services in 2012 were for companies that allow
For more than a decade, the Devices & Supplies and Pharmaceuticals & Biotechnology sectors have dominated VC investment in the Healthcare space, regularly accounting for more than 80% of new financings. However, with the number of Devices & Supplies rounds down 24% in 2012 and investment in Pharmaceuticals & Biotechnology declining for three consecutive years, the two industries represented less than 80% of Healthcare deals for the first time ever.
Several factors have combined to stifle investment in these sectors, including a new medical device tax and continued uncertainty about how the Patient Protection and Affordable Care Act (PPACA) will look when fully implemented. Another reason why the two aforementioned sectors have seen their share of Healthcare financings shrink is the heightened focus from VCs on Technology Systems, where investment has increased for three consecutive years. As healthcare providers across the country update antiquated medical record systems and back office technologies, many view Technology Systems as one of the most promising areas for VC investment moving forward, which is reflected in the high number of angel/seed deals in the sector.
Still, Devices & Supplies and Pharmaceuticals & Biotechnology will continue to play a crucial role
Healthcare Capital Invested by Stage
0%10%20%30%40%50%60%70%80%90%
100%
Angel/Seed Early Stage Late Stage
OtherPharmaceuticals & Biotechnology
Technology SystemsServicesDevices & Supplies
Source: PitchBook
businesses to utilize social advertising and provide secure social networks for employees (LifeStreet, YuMe, eMarketer, Unified Social, AdRoll, etc.).
050
100150200250
2007 2008 2009 2010 2011 2012Media & Information Services Deals All Other Commercial Services Deals
116
207
100 103
Source: PitchBook
Commercial Services Deal Flow
in overall VC investment. The sectors are particularly important in late stage financings due to the extensive amount of capital required for research, development, and product approval.

2013 Annual Venture Capital Rundown
Bet ter Data. Bet ter [email protected]
www.pitchbook.com
VC Exits
Capital exited hits new high in ’12 despite declining volume
Healthcare Devices and SuppliesPharmaceuticals and Biotechnology $2.4 $5.7 $1.8 $2.9 $0.7 $3.3 $4.1 $8.4 $6.6 $3.6 $7.5 $10.5 $6.0 $7.2 $15.7 $7.5 $8.2 $22.7 $8.9 $7.5
7661 72 65 64
74 7085
104 106
130142
132
104
132
100115 120 120
95
0
20
40
60
80
100
120
140
160
$0
$5
$10
$15
$20
$25
1Q 2Q 3Q 4Q 1Q 2Q 3Q 4Q 1Q 2Q 3Q 4Q 1Q 2Q 3Q 4Q 1Q 2Q 3Q 4Q
2008 2009 2010 2011 2012Capital Exited ($B) # of Exits
VC Exits by Quarter
As counterintuitive as it may seem, the number of VC exits has decreased two consecutive years while the amount of capital exited has been accelerating over the same period. In fact, since hitting a nadir of $12.8 billion in 2008, the amount of capital exited has more than tripled to $47.3 billion in 2012. Everyone is well aware of the $16.4 billion Facebook IPO, but there were six additional liquidity events of $1 billion or more that helped push the total higher in 2012. Larger exits have steadily been increasing as a proportion of total VC exits in recent years. Since 2008, exits of more than $100 million have grown from 35% of all exits to 41% in 2012.
One of the most significant developments of the year was the increasing number of IPOs; the 45 offerings were the most since 2007 and five times more than just three years ago in 2009. Since 2008, IPOs
have expanded from 2% of VC exits to 10% in 2012.
With corporations sitting on huge stockpiles of capital, it would seem like now would be an ideal time to execute acquisitions. However, corporate acquisitions of VC-backed companies
have declined for two straight years, and the amount of capital exited via the strategy declined 16% from 2011 to 2012. Private equity firms are also flush with cash and nearly doubled their investment in VC-backed companies from 2011 to 2012.
Source: PitchBook
13
VC Exits by Type
0%
20%
40%
60%
80%
100%
2007 2008 2009 2010 2011 2012
Corporate Acquisition IPO PE BuyoutSource: PitchBook

Bet ter Data. Bet ter Decisions.PitchBook
2013 Annual Venture Capital Rundown
VC Fundraising
Average fund size drops 37% in 2012
Healthcare Devices and SuppliesPharmaceuticals and Biotechnology
$17.6 $30.3 $31.3 $40.7 $30.7 $12.9 $17.2 $19.6 $20.2
153
181158 157 147
77 85
55
90
020406080100120140160180200
$0$5
$10$15
$20$25$30$35
$40$45
2004 2005 2006 2007 2008 2009 2010 2011 2012
Capital Raised ($B) # of Funds Closed
VC Fundraising by Year
Source: PitchBook
VC investors closed 90 funds totaling $20.2 billion in 2012, both of which are increases from 2011. Despite the uptick in fundraising, the amount of capital invested by VC firms exceeded the amount of capital raised for the fourth consecutive year, which is beginning to raise concerns among some industry professionals.
When looking at the year-over-year numbers, it is important to note that while the number of funds jumped 64% from 2011 to 2012, the amount of capital raised only increased a modest 3%. To that end, the average fund size dropped a substantial 37% from 2011 to 2012.
The drop in average fund size is a particularly significant development considering that the average VC fund size more than doubled from $170 million to $360 million from 2009 to 2011. The phenomenon has led to much discussion amongst VC professionals and media outlets about the impact that increasing fund sizes is having on
the industry as a whole, including the ‘Series A Crunch’ and larger rounds that are beginning to blur the lines between traditional VC investment and private equity growth deals.
It is important to note that while the average fund size dropped, new capital continues to be concentrated with a handful of the top firms. To that
end, the 10 largest funds raised in 2012 accounted for 47% of the total capital raised and the top 5 funds represented a substantial 33%. Still, VC firms closed 35 funds of $50 million or less in 2012, nearly triple the 2011 total. Furthermore, funds of less than $100 million increased from 30% of funds raised in 2011 to 49% in 2012.
14
VC Fundraising (count) by Fund Size
0%
20%
40%
60%
80%
100%
2007 2008 2009 2010 2011 2012
$1B+
$500M-$1B
$250M-$500M
$100M-$250M
$50M-$100M
Under $50M
Source: PitchBook

2013 Annual Venture Capital Rundown
Bet ter Data. Bet ter [email protected]
www.pitchbook.com
Stage Company 2012 RoundDescription Trending
Sector
Deals in Trending Sectors
Seed&
Angel
EarlyStage
LateStage
Cloud/Video/Enterprise
Sharing Services
Healthcare Tech
Cloud/Security
Social/Mobile Games
Medical Robotics
Mobile/EnterpriseSoftware
Personalized Services
Mobile Video
Cloud/Enterprise Software
Big Data
VideoAdvertising
3D Printing
$9M
$2.5M
$51.5M
$25M
$40M
$6.2M
$60M
$30M
$33.6M
$1M
$6.1M
$10M
$15M
$3M
15
Provider of 3D printing services and a community marketplace for 3D printed products.
Developer of tools that allow users to conduct self-driven big data explorations.
Provider of a cloud information protection platform, which includes encryption and tokenization gateways.
Developer of air energy storage systems that store energy from wind farms and make it available on demand.
Renewable Energy
Provider of cloud-based payroll services.
Provider of video advertising campaigns, including marketing and production resources.
Provider of a healthcare communications platform that connects nurses, healthcare providers, and agencies.
Developer of medical robotics utilized in minimally invasive surgical procedures.
Provider of a free mobile video calling service compatible with iPhone and Android devices.
Provider of cloud-based video conferencing services.
Developer of a mobile merchant commerce platform that features complete integration with mobile, online, and POS.
Developer of personalized search services that incorporate data from Facebook, Foursquare, and other social networks.
Provider of a social network for mobile gaming.
Provider of an online platform for sharing and viewing live video of public places.
Provider of both public and private cloud computing solutions.
CloudComputing $85M

Bet ter Data. Bet ter Decisions.PitchBook
2013 Annual Venture Capital Rundown
Most Active Investors 2012
Investor# of Deals
Seed/Angel Early Stage Late Stage
Investor# of Deals Investor
# of Deals
16
500 StartupsSV AngelTechStarsY CombinatorGoogle VenturesLerer VenturesAndreessen HorowitzFirst Round CapitalStart FundStart EngineNew Enterprise AssociatesCrunchFundGeneral Catalyst PartnersFounders FundGreylock PartnersCharles River VenturesFounder CollectiveGreat Oaks Venture CapitalMucker CapitalCincyTech VenturesCrosslink CapitalDreamIt VenturesQuotidian VenturesTrue VenturesAtlas VentureBetaworksKapor CapitalSiemer VenturesCapital InnovatorsFreestyle CapitalKleiner Perkins Caufield & ByersOhio Innovation FundBaseline VenturesBattery VenturesBoomStartupCrosscut VenturesFelicis VenturesIgnition PartnersMenlo VenturesMorado Venture PartnersNew World VenturesPortland Seed FundSoftbank CapitalSoftTech VC
503632272423212016151312121111101010109999988887777666666666666
500 StartupsSV AngelAndreessen HorowitzGoogle VenturesFirst Round CapitalGreylock PartnersNew Enterprise AssociatesKleiner Perkins Caufield & ByersLerer VenturesBen Franklin Technology PartnersKhosla VenturesY CombinatorAccel PartnersGeneral Catalyst PartnersBattery VenturesFounders FundCrunchFundFoundry GroupTrue VenturesConnecticut InnovationsGreycroft PartnersLightspeed Venture PartnersMatrix PartnersNew World VenturesAtlas VentureCharles River VenturesHighland Capital PartnersAustin VenturesFounder CollectiveSequoia CapitalShasta VenturesNorth Bridge Venture PartnersFelicis VenturesFloodgate FundGolden SeedsIntel CapitalPolaris Venture PartnersRRE VenturesBenchmark CapitalBessemer Venture PartnersCanaan PartnersCIT GAP FundsLightbankRedpoint Ventures
4544383330282824242323232222211918171716161616161515151414141413121212121212111111111111
New Enterprise AssociatesKleiner Perkins Caufield & ByersIntel CapitalSequoia CapitalNorwest Venture PartnersDraper Fisher JurvetsonAccel PartnersDuff Ackerman & GoodrichKhosla VenturesBenchmark CapitalMenlo VenturesBessemer Venture PartnersBattery VenturesLightspeed Venture PartnersGeneral Catalyst PartnersMatrix PartnersUS Venture PartnersGreylock PartnersIndex VenturesMohr Davidow VenturesSigma PartnersVenrockAndreessen HorowitzCrosslink CapitalDomain AssociatesGoogle VenturesOrbiMed AdvisorsRedpoint VenturesEPIC VenturesIgnition PartnersIn-Q-TelCanaan PartnersFirst Round CapitalFlybridge Capital PartnersInsight Venture PartnersInterWest PartnersQualcomm VenturesShasta VenturesTrident Capital
393623232220191919181817161614141413131313131212121212121111111010101010101010
Source: PitchBook Source: PitchBook
Source: PitchBook

2013 Annual Venture Capital Rundown
Bet ter Data. Bet ter [email protected]
www.pitchbook.com
Methodology
17
Venture Capital
Venture Capital Deals
Fundraising
Exits
Venture capital, for the purposes of this report, is defined as institutional investors that have raised a fund structured as a limited partnership from a group of accredited investors with the purpose of making seed, angel, or venture capital investments. Corporate entities making venture capital investments are also included.
All venture capital financings to U.S.-based companies are included in this report. The deals are broken into stages accordingly:
• Angel: Investments by individuals into private companies.
• Seed: Investments that are explicitly referred to as “seed” deals or financings by the company or investors, or first financings of less than $500,000.
• Early: Investments in nascent companies with high growth rates. Early stage rounds include Series A and B, as well as some Series C financings.
• Late: Investments in more established companies that typically have proven products and revenue streams. Late stage rounds include all financings Series D or later, as well as some Series C rounds.
This report includes all U.S.-based venture capital funds that have held a final close. Fund of funds and secondary funds are not included.
This report includes both full and partial exits via mergers and acquisitions, private equity buyouts, and IPOs.
RegionsWest Coast: Alaska, California, Hawaii, Oregon, WashingtonMountain: Arizona, Colorado, Idaho, Montana, Nevada, New Mexico, Utah, WyomingMidwest: Iowa, Kansas, Missouri, Nebraska, North Dakota, South DakotaGreat Lakes: Illinois, Indiana, Michigan, Minnesota, Ohio, WisconsinNew England: Connecticut, Maine, Massachusetts, New Hampshire, Rhode Island, VermontMid-Atlantic: Delaware, D.C., Maryland, New Jersey, New York, Pennsylvania, Virginia, West VirginiaSouth: Arkansas, Kentucky, Louisiana, Oklahoma, Tennessee, TexasSoutheast: Alabama, Florida, Georgia, Mississippi, North Carolina, Puerto Rico, South Carolina

PitchBook tracks more Private Equity and Venture Capital data than anyone.
* All
Pitc
hBoo
k da
ta s
ourc
ed fr
om th
e Pi
tchB
ook
Plat
form
as
of 1
/22/
2012
Want the whole pie?
Bet ter Data. Bet ter Decisions.PitchBook Private Deal Comps
Targeted Business Development
Sourcing New Deals
Targeted Buyers Lists
Benchmarking Funds & IRR
Public Company Fundamentals
94,173 24,826
17,285
58,500
6,641 8,781
Limited Partners
Investors
Funds
Companies
Deals
Service Providers
PitchBook Corporate Headquarters1201 Alaskan Way, Pier 56 - Suite 200Seattle, WA 98101
1-877-636-3496
www.pitchbook.com