1q 2018 - svb.com€¦ · executive summary 3 1q 2018 pitchbook-nvca venture monitor after an...
TRANSCRIPT

1Q 2018
An enormous $28.2B invested in 1Q, besting the previous decade high by more than $4B Page 4
The definitive review of the US venture capital ecosystem covering 1Q and beyond
Though 1Q exits were slow, the pace is expected to increase as IPOs heat up and corporations use tax breaks for acquisitionsPage 26
SoftBank’s Vision Fund has made a splash. Now VCs are gearing up for a battle with mega funds of their own Page 29
In partnership with
Credits & ContactPitchBook Data, Inc. JOHN GABBERT Founder, CEO ADLEY BOWDEN Vice President, Research & Analysis
Content NIZAR TARHUNI Associate Director, Research & Analysis KYLE STANFORD Analyst CAMERON STANFILL Analyst JOELLE SOSTEIM Analyst MASAUN NELSON Data Analyst JENNIFER SAM Senior Graphic Designer
RESEARCH [email protected]
National Venture Capital Association (NVCA)BOBBY FRANKLIN President & CEOMARYAM HAQUE Senior Vice President of Industry AdvancementBEN VEGHTE Vice President of Communications & Marketing
Contact [email protected]
Silicon Valley Bank GREG BECKER Chief Executive Officer MICHAEL DESCHENEAUX President TRACY ISACKE Head of Corporate Relationship Management BOB BLEE Head of Corporate Finance MATT TROTTER Managing Director of Hardware and Frontier Tech Contact Silicon Valley Bank svb.com [email protected]
Perkins Coie BUDDY ARNHEIM Partner, Emerging Companies & Venture Capital FIONA BROPHY Partner, Emerging Companies & Venture CapitalCHARLES E. TORRES Partner, Emerging Companies & Venture Capital Contact Perkins Coie perkinscoie.com startuppercolator.com
Solium KEVIN SWAN VP Corporate Development JEREMY WRIGHT Head of Private Markets STEVE LIU Head of Solium Analytics JERON PAUL CEO, Capshare Contact Solium solium.com
Executive summary 3Overview 4Angel/seed 7First financings 8Solium: Cap table analytics can provide transparency to an opaque industry
9
Early-stage VC 10Late-stage VC 11Perkins Coie: Key points for client capital needs and liquidity in today’s venture landscape
12
Activity by region 14Activity by sector 16SVB: Advanced manufacturing: Can a cobot help you with that?
17
Life sciences 18Corporate VC 19Q&A: As tech disrupts traditional industries, corporations boost startup investment
21
Growth equity 23SVB: What public market fluctuations signal for venture dealmaking
25
Exits 26Fundraising 291Q league tables 32Methodology 35
Contents
2 1Q 2018 PITCHBOOK-NVCA VENTURE MONITOR

Executive Summary
3 1Q 2018 PITCHBOOK-NVCA VENTURE MONITOR
After an active 2017 for investment in US venture-backed companies, momentum in capital deployed continued in the first quarter of 2018 while the pace of companies receiving capital continued to decelerate. A total of 1,683 venture-backed companies raised $28.2 billion in funding during 1Q 2018, marking the fourth consecutive quarter of more than $20 billion deployed to venture-backed companies and the highest amount of capital deployed in a single quarter since at least 2006.
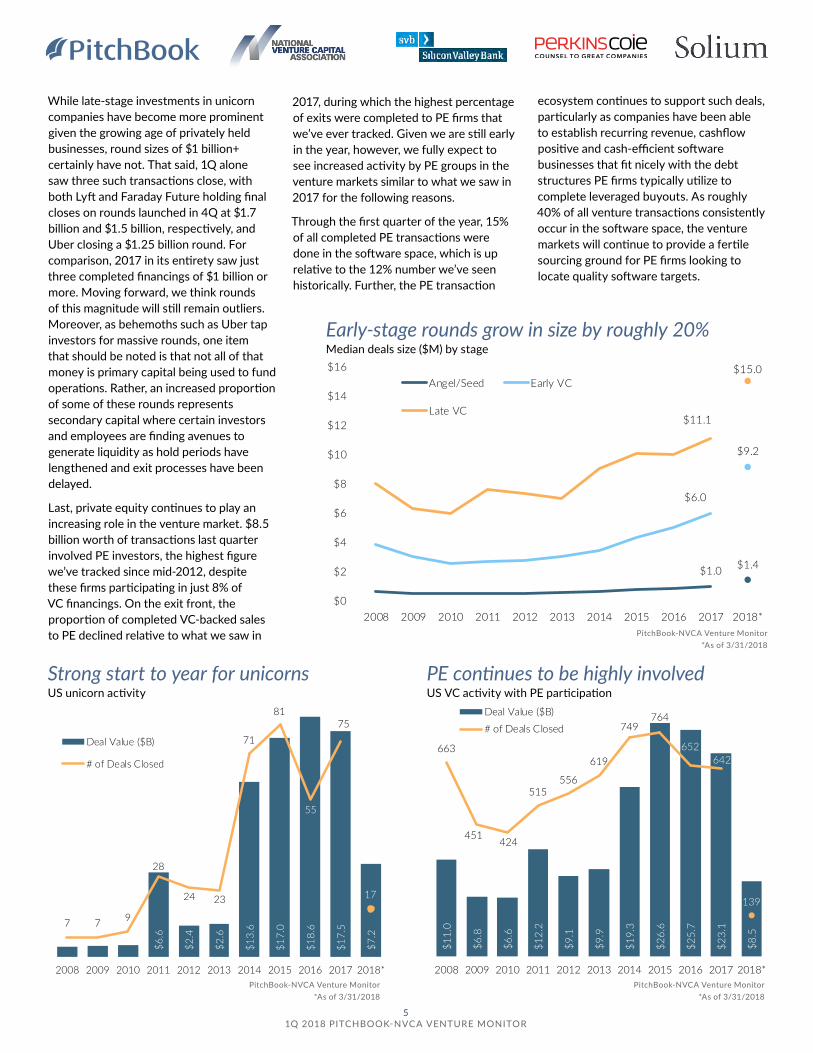
In 1Q, 17 unicorns (i.e., companies valued at $1 billion+) attracted a combined $7.2 billion, over one-quarter of total capital deployed to venture-backed companies, the second-highest quarterly deal value share we have tracked. This new normal of sustained rise in capital deployment and fewer completed deals is a continued trend from 2017. Fewer companies receiving funding and at higher valuations has in turn corresponded with increased median deal sizes across all stages. In 1Q, the median early-stage deal reached $9.2 million and median late-stage deal reached $15 million, increases of 3.1x and 2.1x, respectively, compared to just five years ago.
Increasing deal sizes across all stages of the company growth cycle can be partly attributed to the sustained momentum in venture capital fundraising over the last several years, which has resulted in a combined $160 billion raised since 2014, including $7.9 billion raised in 1Q 2018. Norwest Venture Partners’ $1.5 billion fund XIV and General Catalyst’s $1.375 billion fund IX were the largest of the 54 venture funds holding a final close.
While the total amount of capital raised and number of funds closing in the first quarter—for both new and established firms—was light compared to recent quarters, several prominent venture firms are currently in the market raising funds with multibillion-dollar targets, suggesting a pickup in pace as 2018 unfolds. When factoring in these efforts to raise larger venture capital funds, as well as the ever-increasing role of the $100 billion SoftBank Vision Fund, some investors expect overall investment into venture-backed companies to reach—and perhaps even surpass—the post-dot-com record from 2017.
In addition to rising expectations for another year of historical investment activity, optimism is also high for a strengthening exit environment that will bring long-awaited liquidity to venture investors and LPs alike. In the first quarter, there were 144 disclosed venture-backed M&A transactions, led by Amazon’s $1.2 billion acquisition of smart security device company Ring. While venture-backed M&A activity was flat compared to the end of 2017, many investors expect the repatriation provision and the lower corporate rate included in the recently passed tax reform package to provide corporations with additional capital to make strategic acquisitions of venture-backed companies, which may boost M&A activity in the months ahead.
A strong 4Q 2017 for venture-backed IPOs signaled continued optimism for 2018, which for the most part played out in the first quarter. In 1Q 2018, there were 15 venture-backed IPOs, led by storage platform Dropbox’s NASDAQ listing on March 23, which raised $756 million at an $8.2 billion valuation. With a recent string of successful enterprise tech IPOs like Dropbox in 2018 and Okta, MongoDB and Mulesoft in 2017, and a healthy pipeline of venture-backed companies readying for IPOs, some investors believe that 2018 will likely be the strongest year for IPO activity in recent memory.
Beyond the exit environment, two other areas the industry will continue to closely monitor in 2018 are: 1) the SEC crackdown on initial coin offerings (ICOs), which surfaced in 2017 as a potential disruptor of the venture investment model; and 2) proposed legislation that would affect foreign investment into venture funds and startups, which could result in a costly and opaque process and a burden on the ecosystem.
4 1Q 2018 PITCHBOOK-NVCA VENTURE MONITOR
$37.
0
$27.
0
$31.
2
$44.
6
$41.
6
$47.
0
$71.
4
$81.
8
$75.
3
$82.
9
$28.
2
4,707 4,4655,378
6,7347,865
9,22610,467 10,558
8,824
8,652
1,693
2008 2009 2010 2011 2012 2013 2014 2015 2016 2017 2018*
Deal Value ($B)# of Deals Closed
0
500
1,000
1,500
2,000
2,500
3,000
$0
$5
$10
$15
$20
$25
$30
1Q 3Q 1Q 3Q 1Q 3Q 1Q 3Q 1Q 3Q 1Q 3Q 1Q 3Q 1Q 3Q 1Q 3Q 1Q 3Q 1Q
2008 2009 2010 2011 2012 2013 2014 2015 2016 2017 2018
Deal Value ($B) # of Deals ClosedAngel/Seed Early VCLater VC
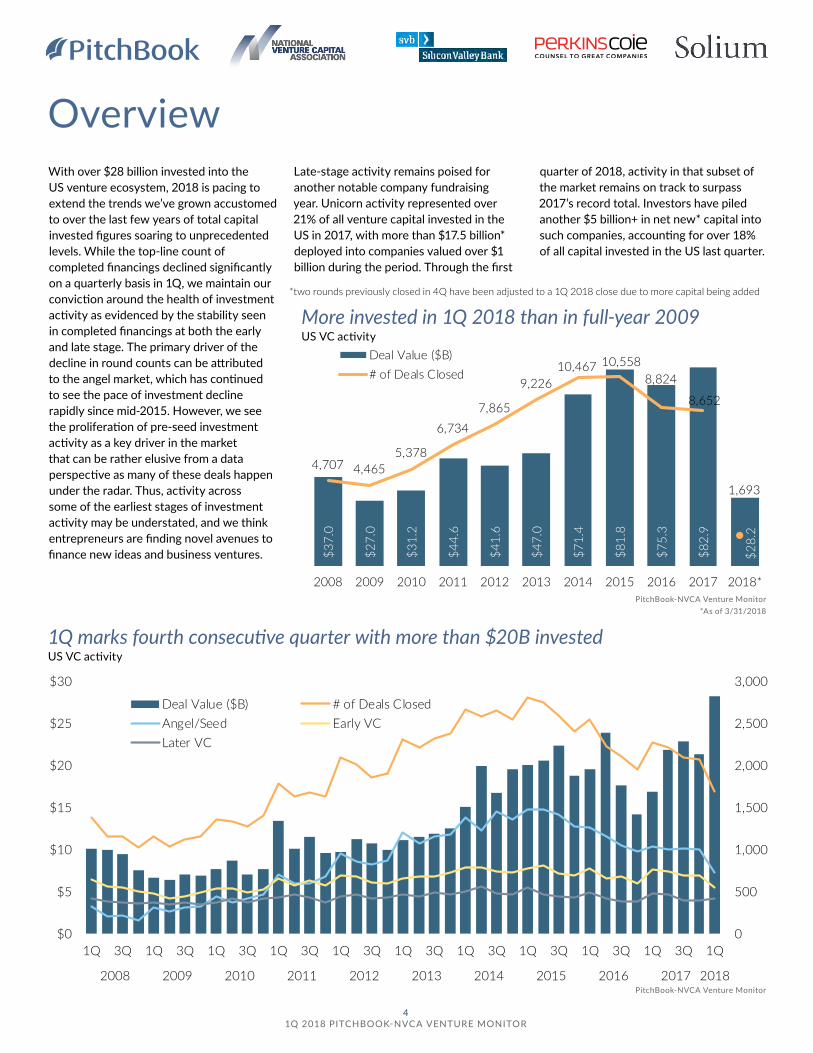
OverviewWith over $28 billion invested into the US venture ecosystem, 2018 is pacing to extend the trends we’ve grown accustomed to over the last few years of total capital invested figures soaring to unprecedented levels. While the top-line count of completed financings declined significantly on a quarterly basis in 1Q, we maintain our conviction around the health of investment activity as evidenced by the stability seen in completed financings at both the early and late stage. The primary driver of the decline in round counts can be attributed to the angel market, which has continued to see the pace of investment decline rapidly since mid-2015. However, we see the proliferation of pre-seed investment activity as a key driver in the market that can be rather elusive from a data perspective as many of these deals happen under the radar. Thus, activity across some of the earliest stages of investment activity may be understated, and we think entrepreneurs are finding novel avenues to finance new ideas and business ventures.
Late-stage activity remains poised for another notable company fundraising year. Unicorn activity represented over 21% of all venture capital invested in the US in 2017, with more than $17.5 billion* deployed into companies valued over $1 billion during the period. Through the first
quarter of 2018, activity in that subset of the market remains on track to surpass 2017’s record total. Investors have piled another $5 billion+ in net new* capital into such companies, accounting for over 18% of all capital invested in the US last quarter.
More invested in 1Q 2018 than in full-year 2009 US VC activity
1Q marks fourth consecutive quarter with more than $20B invested US VC activity
PitchBook-NVCA Venture Monitor *As of 3/31/2018
PitchBook-NVCA Venture Monitor
*two rounds previously closed in 4Q have been adjusted to a 1Q 2018 close due to more capital being added
5 1Q 2018 PITCHBOOK-NVCA VENTURE MONITOR
PE continues to be highly involved US VC activity with PE participation
Strong start to year for unicorns US unicorn activity
PitchBook-NVCA Venture Monitor *As of 3/31/2018
PitchBook-NVCA Venture Monitor *As of 3/31/2018
While late-stage investments in unicorn companies have become more prominent given the growing age of privately held businesses, round sizes of $1 billion+ certainly have not. That said, 1Q alone saw three such transactions close, with both Lyft and Faraday Future holding final closes on rounds launched in 4Q at $1.7 billion and $1.5 billion, respectively, and Uber closing a $1.25 billion round. For comparison, 2017 in its entirety saw just three completed financings of $1 billion or more. Moving forward, we think rounds of this magnitude will still remain outliers. Moreover, as behemoths such as Uber tap investors for massive rounds, one item that should be noted is that not all of that money is primary capital being used to fund operations. Rather, an increased proportion of some of these rounds represents secondary capital where certain investors and employees are finding avenues to generate liquidity as hold periods have lengthened and exit processes have been delayed.
Last, private equity continues to play an increasing role in the venture market. $8.5 billion worth of transactions last quarter involved PE investors, the highest figure we’ve tracked since mid-2012, despite these firms participating in just 8% of VC financings. On the exit front, the proportion of completed VC-backed sales to PE declined relative to what we saw in
2017, during which the highest percentage of exits were completed to PE firms that we’ve ever tracked. Given we are still early in the year, however, we fully expect to see increased activity by PE groups in the venture markets similar to what we saw in 2017 for the following reasons.
Through the first quarter of the year, 15% of all completed PE transactions were done in the software space, which is up relative to the 12% number we’ve seen historically. Further, the PE transaction
ecosystem continues to support such deals, particularly as companies have been able to establish recurring revenue, cashflow positive and cash-efficient software businesses that fit nicely with the debt structures PE firms typically utilize to complete leveraged buyouts. As roughly 40% of all venture transactions consistently occur in the software space, the venture markets will continue to provide a fertile sourcing ground for PE firms looking to locate quality software targets.
Early-stage rounds grow in size by roughly 20% Median deals size ($M) by stage
PitchBook-NVCA Venture Monitor *As of 3/31/2018
$11.
0
$6.8
$6.6
$12.
2
$9.1
$9.9
$19.
3
$26.
6
$25.
7
$23.
1
$8.5
663
451 424
515556
619
749764
652642
139
2008 2009 2010 2011 2012 2013 2014 2015 2016 2017 2018*
Deal Value ($B)# of Deals Closed
$6.6
$2.4
$2.6
$13.
6
$17.
0
$18.
6
$17.
5
$7.2
7 7 9
28
24 23
71
81
55
75
17
2008 2009 2010 2011 2012 2013 2014 2015 2016 2017 2018*
Deal Value ($B)
# of Deals Closed
$1.0 $1.4
$6.0
$9.2
$11.1
$15.0
$0
$2
$4
$6
$8
$10
$12
$14
$16
2008 2009 2010 2011 2012 2013 2014 2015 2016 2017 2018*
Angel/Seed Early VC
Late VC

©2018 SVB Financial Group. All rights reserved. Silicon Valley Bank is a member of the FDIC and the Federal Reserve System. SVB, SVB FINANCIAL GROUP, SILICON VALLEY BANK, MAKE NEXT HAPPEN NOW and the chevron device are trademarks of SVB Financial Group, used under license.
For 35 years, Silicon Valley Bank has been at the intersection of innovation and capital. We provide unique access to insights and strategies for companies of all sizes, in innovation centers around the world. All designed to help you find what’s next.
svb.com
The insights you need to discover what’s next.
7 1Q 2018 PITCHBOOK-NVCA VENTURE MONITOR
$449
$407
$394
$669
$675
$629
$541
$750
$849
$1,1
15$1
,253
$871
$1,4
62$1
,086
$1,3
44$1
,555
$1,2
89$1
,416
$2,0
45$1
,846
$2,0
61$2
,146
$2,1
09$1
,936
$1,6
71$1
,714
$1,7
19$1
,548
$1,5
87$1
,690
$1,8
95$1
,808
$1,6
24
0
200
400
600
800
1,000
1,200
1,400
1,600
$0
$500
$1,000
$1,500
$2,000
$2,500
1Q 2Q 3Q 4Q 1Q 2Q 3Q 4Q 1Q 2Q 3Q 4Q 1Q 2Q 3Q 4Q 1Q 2Q 3Q 4Q 1Q 2Q 3Q 4Q 1Q 2Q 3Q 4Q 1Q 2Q 3Q 4Q 1Q
2010 2011 2012 2013 2014 2015 2016 2017 2018
Deal Value ($B) # of Deals Closed
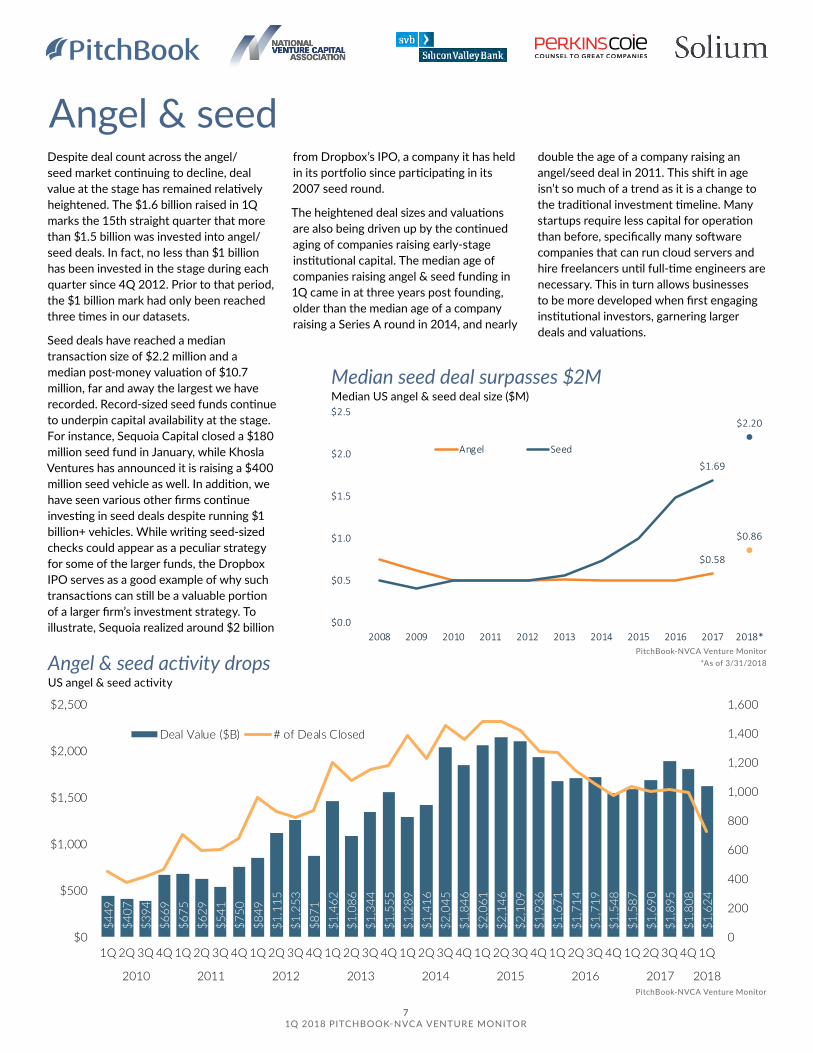
Angel & seed activity drops US angel & seed activity
Angel & seed
PitchBook-NVCA Venture Monitor *As of 3/31/2018
PitchBook-NVCA Venture Monitor
$0.58
$0.86
$1.69
$2.20
$0.0
$0.5
$1.0
$1.5
$2.0
$2.5
2008 2009 2010 2011 2012 2013 2014 2015 2016 2017 2018*
Angel Seed
Median seed deal surpasses $2M Median US angel & seed deal size ($M)
Despite deal count across the angel/seed market continuing to decline, deal value at the stage has remained relatively heightened. The $1.6 billion raised in 1Q marks the 15th straight quarter that more than $1.5 billion was invested into angel/seed deals. In fact, no less than $1 billion has been invested in the stage during each quarter since 4Q 2012. Prior to that period, the $1 billion mark had only been reached three times in our datasets.
Seed deals have reached a median transaction size of $2.2 million and a median post-money valuation of $10.7 million, far and away the largest we have recorded. Record-sized seed funds continue to underpin capital availability at the stage. For instance, Sequoia Capital closed a $180 million seed fund in January, while Khosla Ventures has announced it is raising a $400 million seed vehicle as well. In addition, we have seen various other firms continue investing in seed deals despite running $1 billion+ vehicles. While writing seed-sized checks could appear as a peculiar strategy for some of the larger funds, the Dropbox IPO serves as a good example of why such transactions can still be a valuable portion of a larger firm’s investment strategy. To illustrate, Sequoia realized around $2 billion
from Dropbox’s IPO, a company it has held in its portfolio since participating in its 2007 seed round.
The heightened deal sizes and valuations are also being driven up by the continued aging of companies raising early-stage institutional capital. The median age of companies raising angel & seed funding in 1Q came in at three years post founding, older than the median age of a company raising a Series A round in 2014, and nearly
double the age of a company raising an angel/seed deal in 2011. This shift in age isn’t so much of a trend as it is a change to the traditional investment timeline. Many startups require less capital for operation than before, specifically many software companies that can run cloud servers and hire freelancers until full-time engineers are necessary. This in turn allows businesses to be more developed when first engaging institutional investors, garnering larger deals and valuations.
8 1Q 2018 PITCHBOOK-NVCA VENTURE MONITOR
$1.4
$1.0
$1.0
$1.2
$1.9
$1.3
$1.5
$1.5
$1.6
$2.1
$1.9
$1.5
$2.1
$1.6
$1.5
$2.0
$1.8
$1.7
$2.2
$2.0
$2.0
$2.4
$2.1
$2.3
$1.8
$1.7
$2.0
$1.6
$1.8
$2.1
$1.6
$2.0
$2.4
0
200
400
600
800
1,000
1,200
$0
$0.5
$1.0
$1.5
$2.0
$2.5
$3.0
1Q 2Q 3Q 4Q 1Q 2Q 3Q 4Q 1Q 2Q 3Q 4Q 1Q 2Q 3Q 4Q 1Q 2Q 3Q 4Q 1Q 2Q 3Q 4Q 1Q 2Q 3Q 4Q 1Q 2Q 3Q 4Q 1Q
2010 2011 2012 2013 2014 2015 2016 2017 2018
Deal Value ($B)
# of Deals Closed
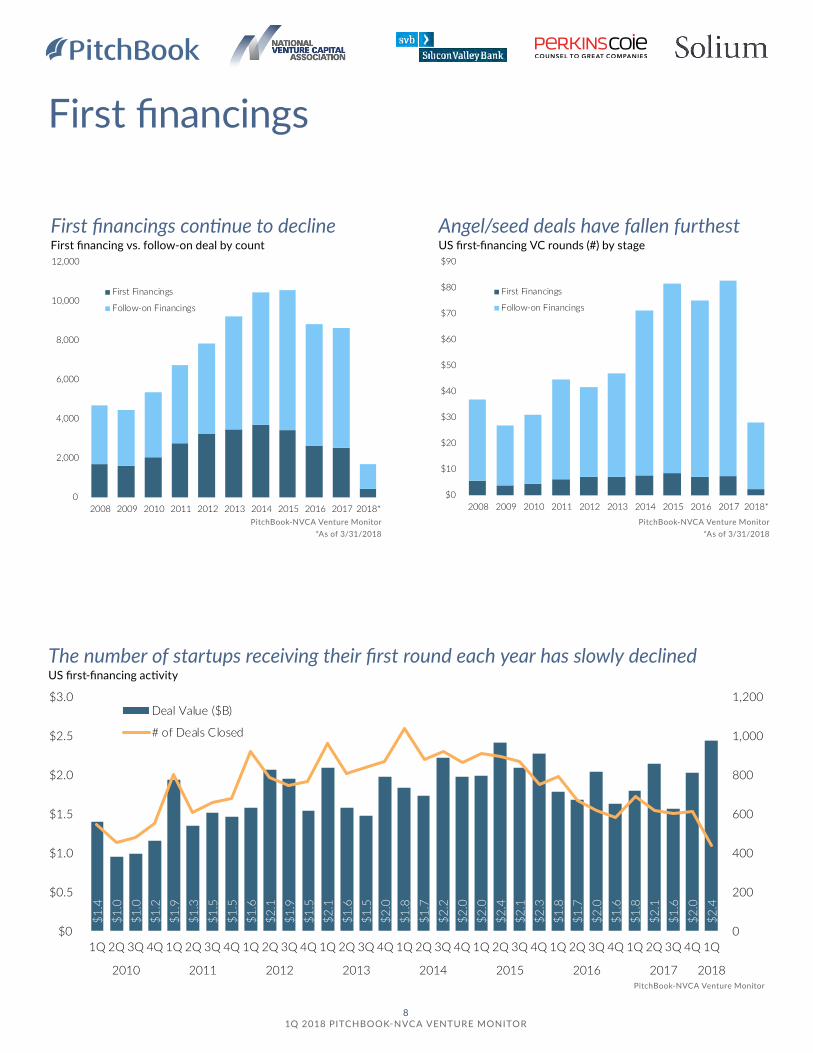
First financings
0
2,000
4,000
6,000
8,000
10,000
12,000
2008 2009 2010 2011 2012 2013 2014 2015 2016 2017 2018*
First Financings
Follow-on Financings
First financings continue to decline First financing vs. follow-on deal by count
The number of startups receiving their first round each year has slowly declined US first-financing activity
$0
$10
$20
$30
$40
$50
$60
$70
$80
$90
2008 2009 2010 2011 2012 2013 2014 2015 2016 2017 2018*
First Financings
Follow-on Financings
Angel/seed deals have fallen furthest US first-financing VC rounds (#) by stage
PitchBook-NVCA Venture Monitor *As of 3/31/2018
PitchBook-NVCA Venture Monitor *As of 3/31/2018
PitchBook-NVCA Venture Monitor
9 1Q 2018 PITCHBOOK-NVCA VENTURE MONITOR
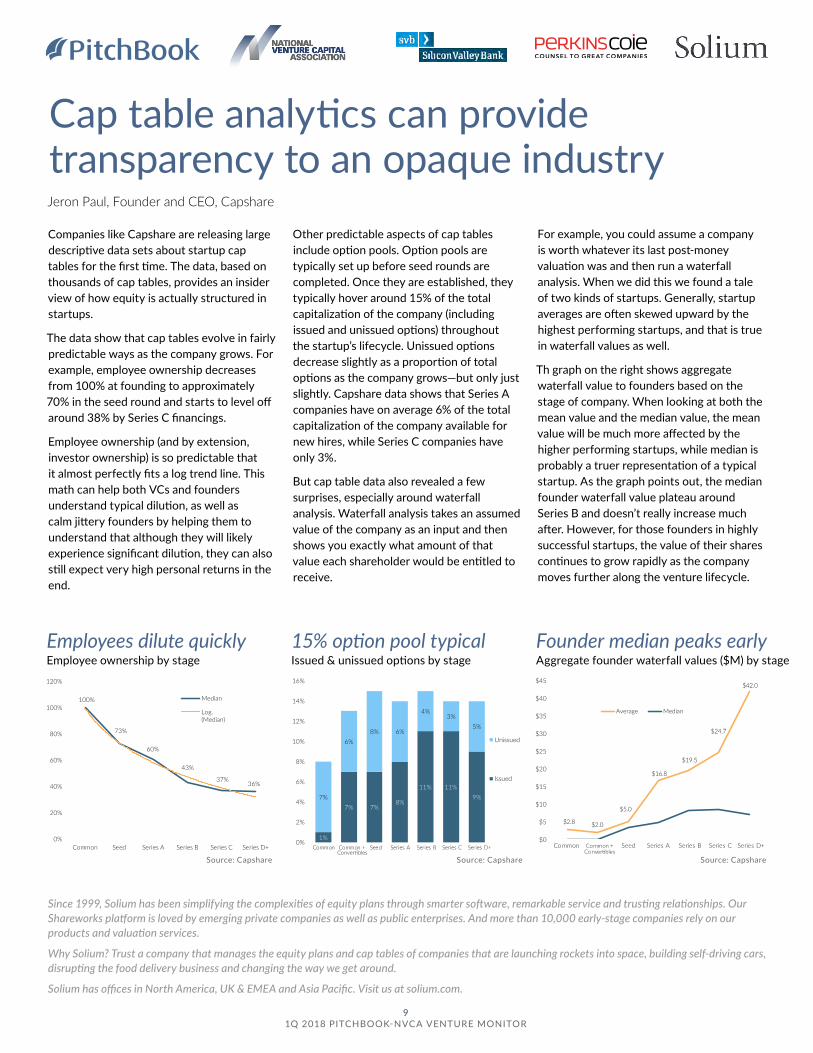
Cap table analytics can provide transparency to an opaque industry Companies like Capshare are releasing large descriptive data sets about startup cap tables for the first time. The data, based on thousands of cap tables, provides an insider view of how equity is actually structured in startups.
The data show that cap tables evolve in fairly predictable ways as the company grows. For example, employee ownership decreases from 100% at founding to approximately 70% in the seed round and starts to level off around 38% by Series C financings.
Employee ownership (and by extension, investor ownership) is so predictable that it almost perfectly fits a log trend line. This math can help both VCs and founders understand typical dilution, as well as calm jittery founders by helping them to understand that although they will likely experience significant dilution, they can also still expect very high personal returns in the end.
Other predictable aspects of cap tables include option pools. Option pools are typically set up before seed rounds are completed. Once they are established, they typically hover around 15% of the total capitalization of the company (including issued and unissued options) throughout the startup’s lifecycle. Unissued options decrease slightly as a proportion of total options as the company grows—but only just slightly. Capshare data shows that Series A companies have on average 6% of the total capitalization of the company available for new hires, while Series C companies have only 3%.
But cap table data also revealed a few surprises, especially around waterfall analysis. Waterfall analysis takes an assumed value of the company as an input and then shows you exactly what amount of that value each shareholder would be entitled to receive.
For example, you could assume a company is worth whatever its last post-money valuation was and then run a waterfall analysis. When we did this we found a tale of two kinds of startups. Generally, startup averages are often skewed upward by the highest performing startups, and that is true in waterfall values as well.
Th graph on the right shows aggregate waterfall value to founders based on the stage of company. When looking at both the mean value and the median value, the mean value will be much more affected by the higher performing startups, while median is probably a truer representation of a typical startup. As the graph points out, the median founder waterfall value plateau around Series B and doesn’t really increase much after. However, for those founders in highly successful startups, the value of their shares continues to grow rapidly as the company moves further along the venture lifecycle.
Since 1999, Solium has been simplifying the complexities of equity plans through smarter software, remarkable service and trusting relationships. Our Shareworks platform is loved by emerging private companies as well as public enterprises. And more than 10,000 early-stage companies rely on our products and valuation services.
Why Solium? Trust a company that manages the equity plans and cap tables of companies that are launching rockets into space, building self-driving cars, disrupting the food delivery business and changing the way we get around.
Solium has offices in North America, UK & EMEA and Asia Pacific. Visit us at solium.com.
100%
73%
60%
43%
37%36%
0%
20%
40%
60%
80%
100%
120%
Common Seed Series A Series B Series C Series D+
Median
Log.(Median)
Employees dilute quickly Employee ownership by stage
1%
7% 7%8%
11% 11%9%7%
6%8% 6%
4%3%
5%
0%
2%
4%
6%
8%
10%
12%
14%
16%
Common Common +Convertibles
Seed Series A Series B Series C Series D+
Unissued
Issued
15% option pool typical Issued & unissued options by stage
Founder median peaks early Aggregate founder waterfall values ($M) by stage
$2.8 $2.0
$5.0
$16.8
$19.5
$24.7
$42.0
$0
$5
$10
$15
$20
$25
$30
$35
$40
$45
Common Common +Convertibles
Seed Series A Series B Series C Series D+
Average Median
Jeron Paul, Founder and CEO, Capshare
Source: Capshare Source: Capshare Source: Capshare

10 1Q 2018 PITCHBOOK-NVCA VENTURE MONITOR
Early-stage VC$2
.9$2
.5$2
.6$2
.5$3
.3$2
.9$3
.5$3
.8$3
.0$3
.6$3
.1$3
.1$3
.5$3
.7$3
.4$4
.4$4
.6$5
.1$5
.0$5
.5$4
.9$7
.3$6
.3$6
.2$6
.2$6
.5$6
.1$5
.0$5
.7$6
.7$7
.8$9
.5$9
.9
0
100
200
300
400
500
600
700
800
900
$0
$2
$4
$6
$8
$10
$12
1Q 2Q 3Q 4Q 1Q 2Q 3Q 4Q 1Q 2Q 3Q 4Q 1Q 2Q 3Q 4Q 1Q 2Q 3Q 4Q 1Q 2Q 3Q 4Q 1Q 2Q 3Q 4Q 1Q 2Q 3Q 4Q 1Q
2010 2011 2012 2013 2014 2015 2016 2017 2018
Deal Value ($B) # of Deals Closed
0%
10%
20%
30%
40%
50%
60%
70%
80%
90%
100%
2008
2009
2010
2011
2012
2013
2014
2015
2016
2017
2018
*
$25M+
$10M-$25M
$5M-$10M
$1M-$5M
$500K-$1M
Under$500K
0%
10%
20%
30%
40%
50%
60%
70%
80%
90%
100%
2008
2009
2010
2011
2012
2013
2014
2015
2016
2017
2018
*
$25M+
$10M-$25M
$5M-$10M
$1M-$5M
$500K-$1M
Under$500K
81 deals of at least $25M in 1Q US early-stage activity (#) by size
Deals <$10M account for 11% of value US early-stage activity ($) by size
Over $9B was invested at the early stage during each of past two quarters US early-stage VC activity
PitchBook-NVCA Venture Monitor *As of 3/31/2018
PitchBook-NVCA Venture Monitor *As of 3/31/2018
PitchBook-NVCA Venture Monitor
For two consecutive quarters now, the early stage has received more than $9 billion in investment, far and away the highest totals we have seen. For comparison, 2010 saw a total of $10.5 billion invested throughout the entire year, and prior to 4Q 2017 there had never been a quarter with more than $8 billion invested. Some of this enormous growth
is due to just a few deals over the past few quarters, but taking out the largest deals won’t change the trend. Early-stage deals are simply getting larger. The median age of companies that raised a Series A or Series B round in 1Q reached 3.3 and 5.1 years, respectively. Both are more than a year older than companies raising at the same stage a decade ago. “Seed is the new Series A” was a common thought a few years ago,
and that seems more and more plausible as time goes. Capital availability has filtered down to the earliest stages of VC, and the ripple effect has manifested in growing deal sizes as venture investment shifts further into the business lifecycle. We believe that this trend will persist as businesses come to the early stage better capitalized with strong plans for growth.
$4.4
$5.9
$4.0
$4.5
$9.4
$6.6
$7.4
$5.0
$5.9
$6.6
$6.3
$6.0
$6.2
$6.7
$7.1
$6.6
$9.1
$13.
4$9
.8$1
2.2
$13.
0$1
1.2
$14.
0$1
0.6
$11.
7$1
5.7
$9.8
$7.7
$9.6
$13.
4$1
3.2
$10.
0$1
6.7
0
100
200
300
400
500
600
$0
$2
$4
$6
$8
$10
$12
$14
$16
$18
1Q 2Q 3Q 4Q 1Q 2Q 3Q 4Q 1Q 2Q 3Q 4Q 1Q 2Q 3Q 4Q 1Q 2Q 3Q 4Q 1Q 2Q 3Q 4Q 1Q 2Q 3Q 4Q 1Q 2Q 3Q 4Q 1Q
2010 2011 2012 2013 2014 2015 2016 2017 2018
Deal Value ($B) # of Deals Closed
0%
10%
20%
30%
40%
50%
60%
70%
80%
90%
100%
2008
2009
2010
2011
2012
2013
2014
2015
2016
2017
2018
*
$50M+
$25M-$50M
$10M-$25M
$5M-$10M
$1M-$5M
Under$1M
11 1Q 2018 PITCHBOOK-NVCA VENTURE MONITOR
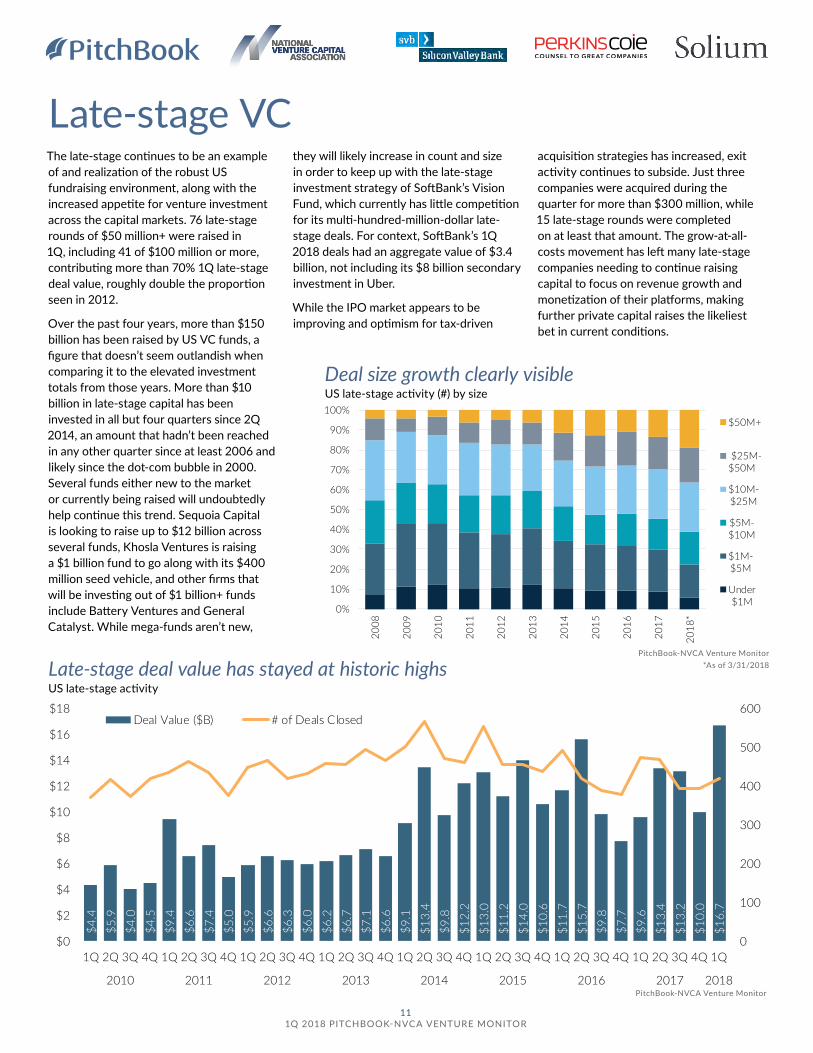
Late-stage VC
Deal size growth clearly visible US late-stage activity (#) by size
Late-stage deal value has stayed at historic highs US late-stage activity
PitchBook-NVCA Venture Monitor
PitchBook-NVCA Venture Monitor *As of 3/31/2018
The late-stage continues to be an example of and realization of the robust US fundraising environment, along with the increased appetite for venture investment across the capital markets. 76 late-stage rounds of $50 million+ were raised in 1Q, including 41 of $100 million or more, contributing more than 70% 1Q late-stage deal value, roughly double the proportion seen in 2012.
Over the past four years, more than $150 billion has been raised by US VC funds, a figure that doesn’t seem outlandish when comparing it to the elevated investment totals from those years. More than $10 billion in late-stage capital has been invested in all but four quarters since 2Q 2014, an amount that hadn’t been reached in any other quarter since at least 2006 and likely since the dot-com bubble in 2000. Several funds either new to the market or currently being raised will undoubtedly help continue this trend. Sequoia Capital is looking to raise up to $12 billion across several funds, Khosla Ventures is raising a $1 billion fund to go along with its $400 million seed vehicle, and other firms that will be investing out of $1 billion+ funds include Battery Ventures and General Catalyst. While mega-funds aren’t new,
they will likely increase in count and size in order to keep up with the late-stage investment strategy of SoftBank’s Vision Fund, which currently has little competition for its multi-hundred-million-dollar late-stage deals. For context, SoftBank’s 1Q 2018 deals had an aggregate value of $3.4 billion, not including its $8 billion secondary investment in Uber.
While the IPO market appears to be improving and optimism for tax-driven
acquisition strategies has increased, exit activity continues to subside. Just three companies were acquired during the quarter for more than $300 million, while 15 late-stage rounds were completed on at least that amount. The grow-at-all-costs movement has left many late-stage companies needing to continue raising capital to focus on revenue growth and monetization of their platforms, making further private capital raises the likeliest bet in current conditions.
12 1Q 2018 PITCHBOOK-NVCA VENTURE MONITOR
Key points for client capital needs and liquidity in today’s venture landscape
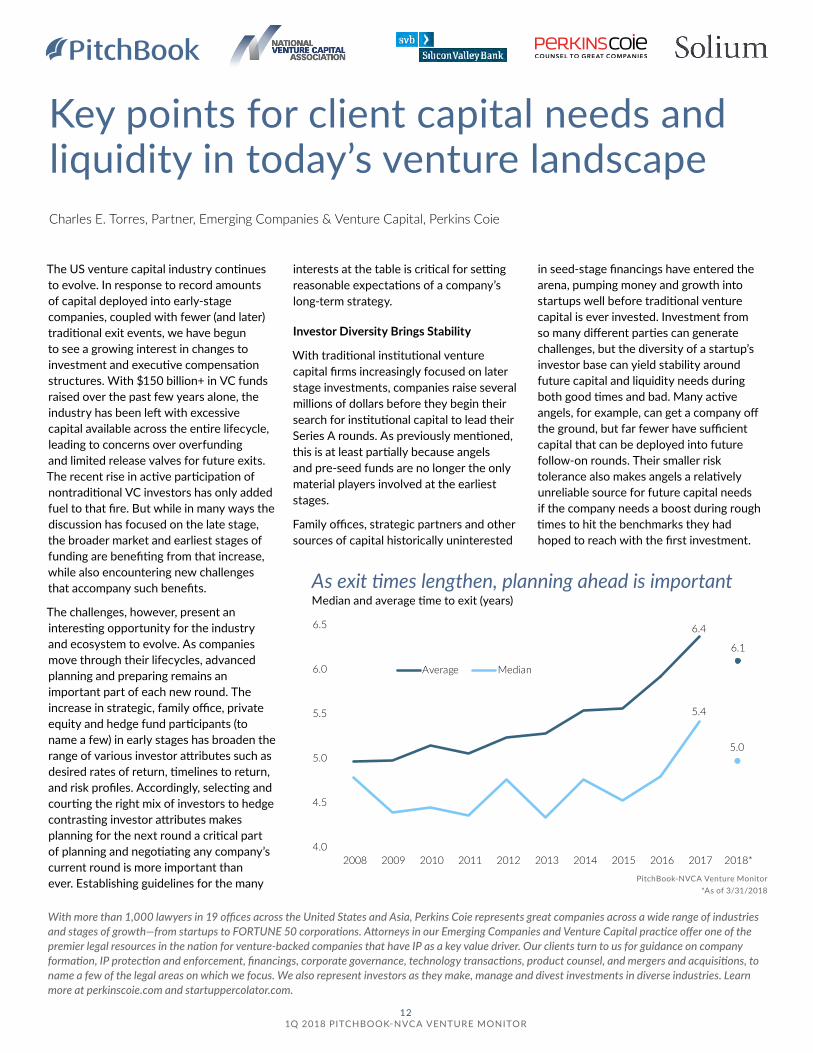
The US venture capital industry continues to evolve. In response to record amounts of capital deployed into early-stage companies, coupled with fewer (and later) traditional exit events, we have begun to see a growing interest in changes to investment and executive compensation structures. With $150 billion+ in VC funds raised over the past few years alone, the industry has been left with excessive capital available across the entire lifecycle, leading to concerns over overfunding and limited release valves for future exits. The recent rise in active participation of nontraditional VC investors has only added fuel to that fire. But while in many ways the discussion has focused on the late stage, the broader market and earliest stages of funding are benefiting from that increase, while also encountering new challenges that accompany such benefits.
The challenges, however, present an interesting opportunity for the industry and ecosystem to evolve. As companies move through their lifecycles, advanced planning and preparing remains an important part of each new round. The increase in strategic, family office, private equity and hedge fund participants (to name a few) in early stages has broaden the range of various investor attributes such as desired rates of return, timelines to return, and risk profiles. Accordingly, selecting and courting the right mix of investors to hedge contrasting investor attributes makes planning for the next round a critical part of planning and negotiating any company’s current round is more important than ever. Establishing guidelines for the many
With more than 1,000 lawyers in 19 offices across the United States and Asia, Perkins Coie represents great companies across a wide range of industries and stages of growth—from startups to FORTUNE 50 corporations. Attorneys in our Emerging Companies and Venture Capital practice offer one of the premier legal resources in the nation for venture-backed companies that have IP as a key value driver. Our clients turn to us for guidance on company formation, IP protection and enforcement, financings, corporate governance, technology transactions, product counsel, and mergers and acquisitions, to name a few of the legal areas on which we focus. We also represent investors as they make, manage and divest investments in diverse industries. Learn more at perkinscoie.com and startuppercolator.com.
interests at the table is critical for setting reasonable expectations of a company’s long-term strategy.
Investor Diversity Brings Stability
With traditional institutional venture capital firms increasingly focused on later stage investments, companies raise several millions of dollars before they begin their search for institutional capital to lead their Series A rounds. As previously mentioned, this is at least partially because angels and pre-seed funds are no longer the only material players involved at the earliest stages.
Family offices, strategic partners and other sources of capital historically uninterested
in seed-stage financings have entered the arena, pumping money and growth into startups well before traditional venture capital is ever invested. Investment from so many different parties can generate challenges, but the diversity of a startup’s investor base can yield stability around future capital and liquidity needs during both good times and bad. Many active angels, for example, can get a company off the ground, but far fewer have sufficient capital that can be deployed into future follow-on rounds. Their smaller risk tolerance also makes angels a relatively unreliable source for future capital needs if the company needs a boost during rough times to hit the benchmarks they had hoped to reach with the first investment.
Charles E. Torres, Partner, Emerging Companies & Venture Capital, Perkins Coie
6.4
6.1
5.4
5.0
4.0
4.5
5.0
5.5
6.0
6.5
2008 2009 2010 2011 2012 2013 2014 2015 2016 2017 2018*
Average Median
PitchBook-NVCA Venture Monitor *As of 3/31/2018
As exit times lengthen, planning ahead is important Median and average time to exit (years)
13 1Q 2018 PITCHBOOK-NVCA VENTURE MONITOR
Perkins Coie LLP Attorney Advertising
ARTIFICIAL INTELLIGENCE, MACHINE
LEARNING AND ROBOTICS
Let’s chat about AI.
OUR EMERGING COMPANIES & VENTURE CAPITAL TEAM
includes technology lawyers
who advise startups on the
development and integration of
products and services that merge
digital presence, physical hardware
and human-inspired intelligence.
We also represent investors as
they make, manage and divest
investments in this space.
To learn more, visit
PerkinsCoie.com/AI
Conversely, the new class of early-stage participants tend to have different, or even opposite, appetites, expectations and tolerances.
Accordingly, a diversified group of investors allows a company to consider a variety of investment timelines and blend expectations by having those with deeper pockets “decrease” the expected liquidity timelines of less patient investors. Strategic partners and family offices generally invest with more patient capital and can complement an investor group due to their lesser need for a quick return. Differing return timelines provide the opportunity for startups to build the company through slower, more sustainable means to continue raising private capital without investors clamoring for an exit. As the venture timeline lengthens, a pure exit is not always just over the horizon or even part of the plan. In this case, the stability of long-term capital can help continue to support the founder’s vision.
Planning Future Raises is Crucial
Planning ahead is less obvious than one might think. During an era of high valuations and deal sizes, the direction of the company can be lost to clouded vision and oversized checks. But taking the time to plan out two capital raises down the line can keep the business on the correct forward path, which is instrumental in aligning the interests of all parties. Of course, planning for how to get the company through the next round of investment will make business operations run smoother and keep a process in place for how to best handle adversity, but modeling out the next two rounds will also make teams think through strategies and align capital expectations for both investors and founders on how much capital will be best for the company to take on, as prospective valuations, new capital and dilution will weigh heavily on a company’s growth or exit strategy.
Successfully aligning everyone’s interests and expectations is one pillar of a successful planning process. As time goes on, management can become disincentivised. Along the same vein, the
amount of capital being introduced into the industry can be potentially damaging to the investor-founder relationship, should one side view capital usage to be skewed in favor of the founders over the investors (or a particular class of investors).
Seek to Implement and Encourage Liquidity and Incentive Strategies
Enhancing upside through option and other management incentive pools, including refreshing such pools as needed, can keep management engaged for the long term. Simultaneously providing liquidity to founders with secondary repurchases and sales can also reduce unhelpful stressors and resolve tensions. Conversely, I’ve started exploring the novel idea of secondary offering participation rights, which provide less patient investors with greater certainty that they can participate in any secondary offering, because that helps them in a similar and reciprocal manner. The transparent discussion and provision of these pre-exit liquidity rights increases the chance that founders and investors will find some early liquidity, pare down their crowded capitalization tables (which are increasingly filled with equity issued pursuant to convertible securities) and bring in fresh, long-term investors, all at the same time.
As companies move along the venture lifecycle, exits at some point move to the forefront of discussion and business positioning. The high volume of capital availability has created a backlog of companies in the market that will likely move toward exit in the near term. While the IPO market looks to be rebounding at the moment after two less-than-stellar years, and recently passed tax legislation has also left corporations with extra cash to spend on acquisitions, such a decision should be approached with caution. The public markets have proven tumultuous, and running a public company (or part of a public company, if acquired by one) is not a job fit for (or desired by) everyone. When it comes time to begin the process of talking about a future exit, the investors and the management team need to understand where the other stands on the issues of both the timing and type of an exit.
14 1Q 2018 PITCHBOOK-NVCA VENTURE MONITOR
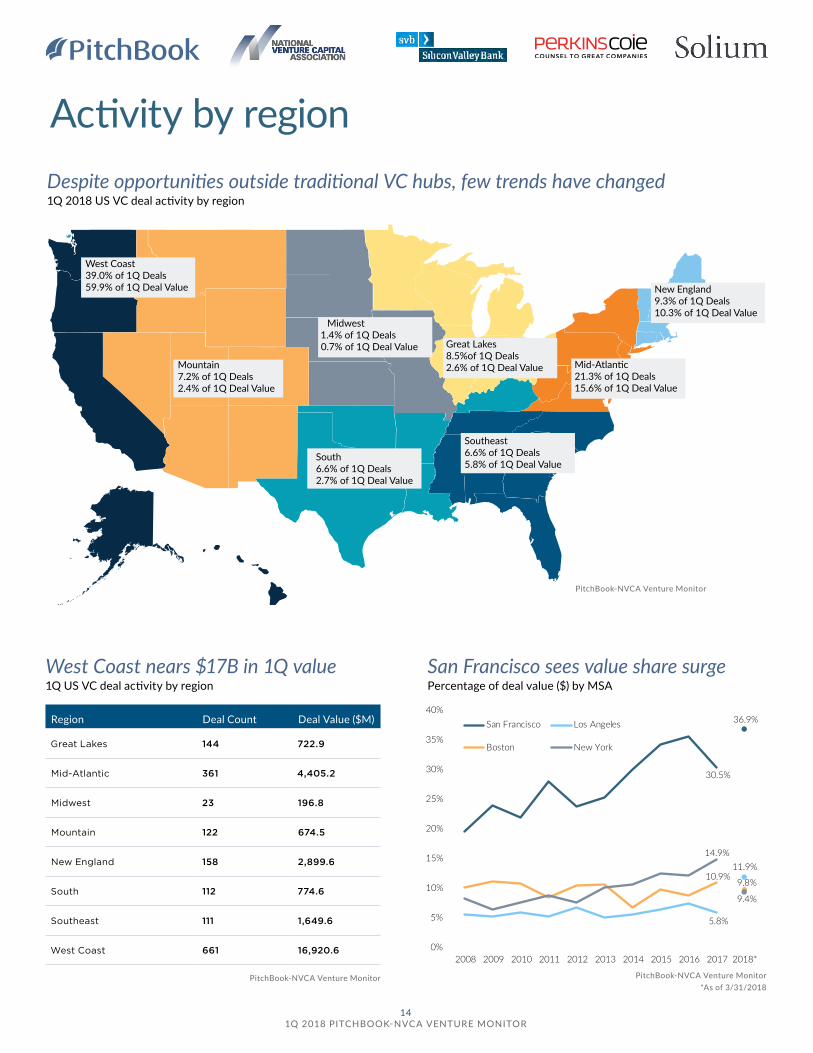
West Coast nears $17B in 1Q value 1Q US VC deal activity by region
Despite opportunities outside traditional VC hubs, few trends have changed 1Q 2018 US VC deal activity by region
Activity by region
PitchBook-NVCA Venture Monitor
San Francisco sees value share surge Percentage of deal value ($) by MSA
PitchBook-NVCA Venture Monitor PitchBook-NVCA Venture Monitor *As of 3/31/2018
West Coast39.0% of 1Q Deals59.9% of 1Q Deal Value
Mountain7.2% of 1Q Deals2.4% of 1Q Deal Value
Midwest1.4% of 1Q Deals0.7% of 1Q Deal Value Great Lakes
8.5%of 1Q Deals2.6% of 1Q Deal Value Mid-Atlantic
21.3% of 1Q Deals15.6% of 1Q Deal Value
New England9.3% of 1Q Deals10.3% of 1Q Deal Value
Southeast6.6% of 1Q Deals5.8% of 1Q Deal Value
South6.6% of 1Q Deals2.7% of 1Q Deal Value
30.5%
36.9%
5.8%
11.9%10.9%
9.8%
14.9%
9.4%
0%
5%
10%
15%
20%
25%
30%
35%
40%
2008 2009 2010 2011 2012 2013 2014 2015 2016 2017 2018*
San Francisco Los Angeles
Boston New York
Region Deal Count Deal Value ($M)
Great Lakes 144 722.9
Mid-Atlantic 361 4,405.2
Midwest 23 196.8
Mountain 122 674.5
New England 158 2,899.6
South 112 774.6
Southeast 111 1,649.6
West Coast 661 16,920.6
Shape the future ofthe venture industrywith NVCAADVOCACY COMMUNITY & EDUCATION RESEARCH
JOIN US!
Please contact NVCA with your membership queries
[email protected] 202.864.5918
16 1Q 2018 PITCHBOOK-NVCA VENTURE MONITOR
Activity by sector
0
2,000
4,000
6,000
8,000
10,000
12,000
2008
2009
2010
2011
2012
2013
2014
2015
2016
2017
2018
*CommercialServicesConsumer Goods& RecreationEnergy
HC Devices &SuppliesHC Services &SystemsIT Hardware
Media
Other
Pharma &BiotechSoftware
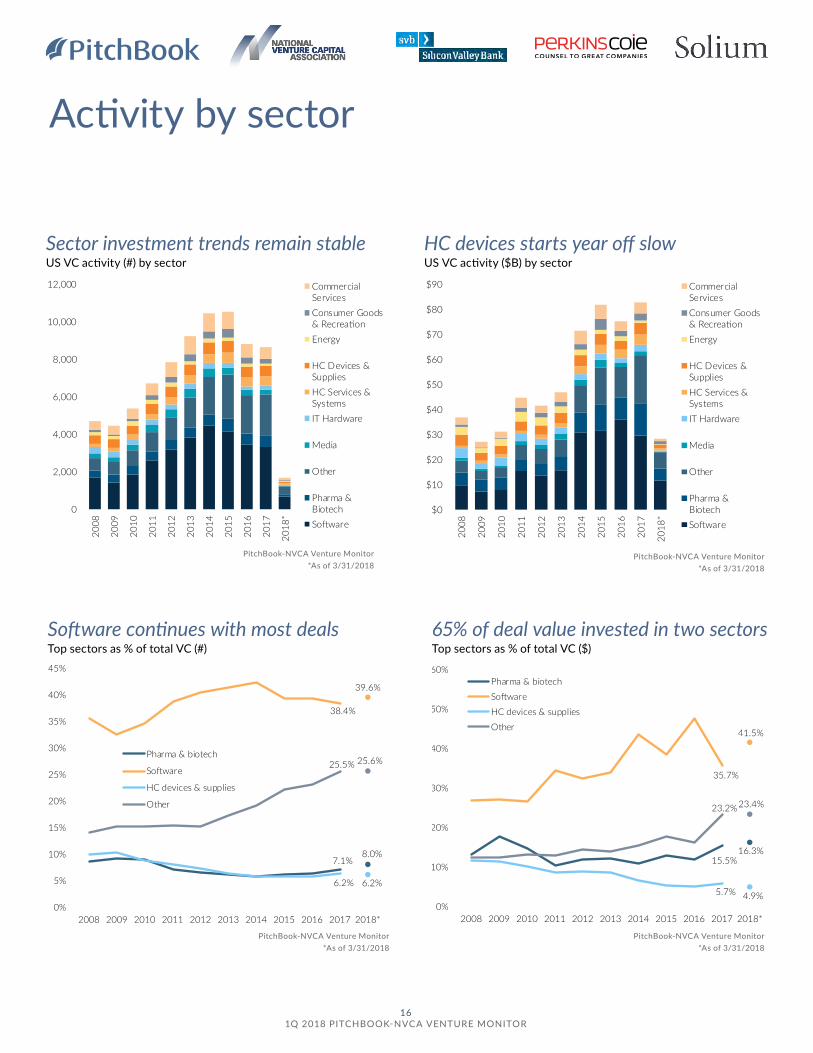
Sector investment trends remain stable US VC activity (#) by sector
$0
$10
$20
$30
$40
$50
$60
$70
$80
$90
2008
2009
2010
2011
2012
2013
2014
2015
2016
2017
2018
*
CommercialServicesConsumer Goods& RecreationEnergy
HC Devices &SuppliesHC Services &SystemsIT Hardware
Media
Other
Pharma &BiotechSoftware
HC devices starts year off slow US VC activity ($B) by sector
7.1%8.0%
38.4%
39.6%
6.2% 6.2%
25.5% 25.6%
0%
5%
10%
15%
20%
25%
30%
35%
40%
45%
2008 2009 2010 2011 2012 2013 2014 2015 2016 2017 2018*
Pharma & biotech
Software
HC devices & supplies
Other
Software continues with most deals Top sectors as % of total VC (#)
15.5%16.3%
35.7%
41.5%
5.7% 4.9%
23.2%23.4%
0%
10%
20%
30%
40%
50%
60%
2008 2009 2010 2011 2012 2013 2014 2015 2016 2017 2018*
Pharma & biotech
Software
HC devices & supplies
Other
65% of deal value invested in two sectors Top sectors as % of total VC ($)
PitchBook-NVCA Venture Monitor *As of 3/31/2018
PitchBook-NVCA Venture Monitor *As of 3/31/2018
PitchBook-NVCA Venture Monitor *As of 3/31/2018
PitchBook-NVCA Venture Monitor *As of 3/31/2018
17 1Q 2018 PITCHBOOK-NVCA VENTURE MONITOR
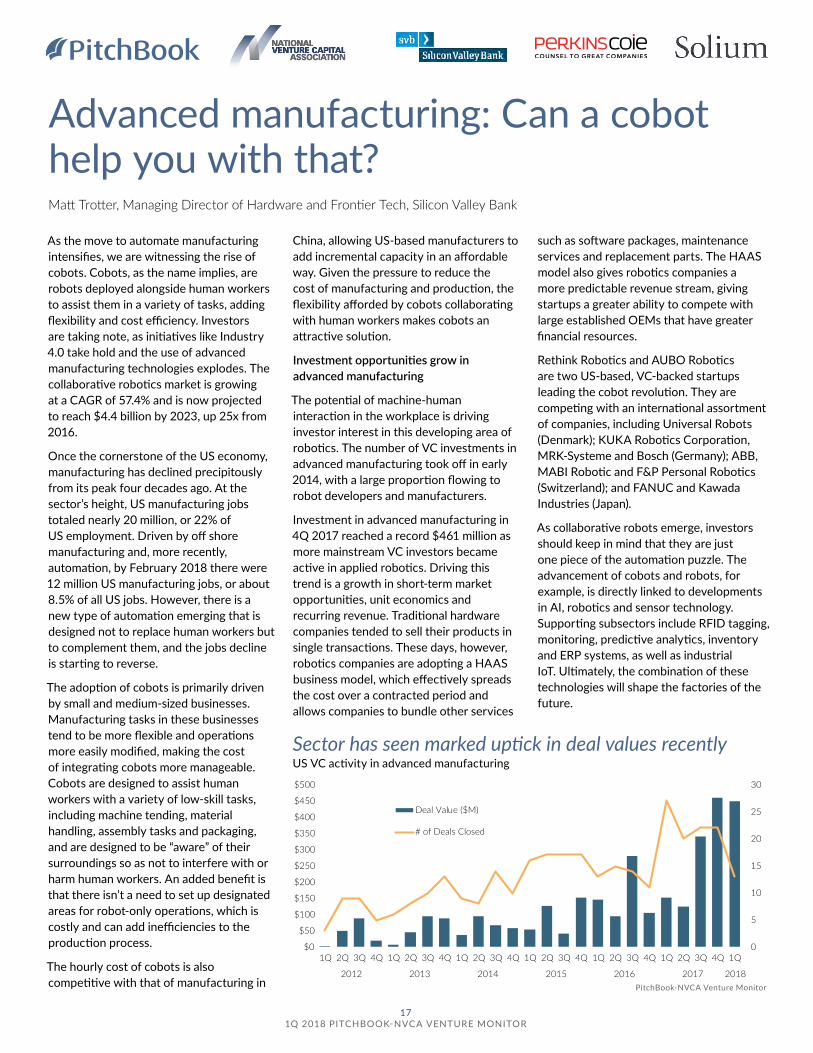
As the move to automate manufacturing intensifies, we are witnessing the rise of cobots. Cobots, as the name implies, are robots deployed alongside human workers to assist them in a variety of tasks, adding flexibility and cost efficiency. Investors are taking note, as initiatives like Industry 4.0 take hold and the use of advanced manufacturing technologies explodes. The collaborative robotics market is growing at a CAGR of 57.4% and is now projected to reach $4.4 billion by 2023, up 25x from 2016.
Once the cornerstone of the US economy, manufacturing has declined precipitously from its peak four decades ago. At the sector’s height, US manufacturing jobs totaled nearly 20 million, or 22% of US employment. Driven by off shore manufacturing and, more recently, automation, by February 2018 there were 12 million US manufacturing jobs, or about 8.5% of all US jobs. However, there is a new type of automation emerging that is designed not to replace human workers but to complement them, and the jobs decline is starting to reverse.
The adoption of cobots is primarily driven by small and medium-sized businesses. Manufacturing tasks in these businesses tend to be more flexible and operations more easily modified, making the cost of integrating cobots more manageable. Cobots are designed to assist human workers with a variety of low-skill tasks, including machine tending, material handling, assembly tasks and packaging, and are designed to be “aware” of their surroundings so as not to interfere with or harm human workers. An added benefit is that there isn’t a need to set up designated areas for robot-only operations, which is costly and can add inefficiencies to the production process.
The hourly cost of cobots is also competitive with that of manufacturing in
China, allowing US-based manufacturers to add incremental capacity in an affordable way. Given the pressure to reduce the cost of manufacturing and production, the flexibility afforded by cobots collaborating with human workers makes cobots an attractive solution.
Investment opportunities grow in advanced manufacturing
The potential of machine-human interaction in the workplace is driving investor interest in this developing area of robotics. The number of VC investments in advanced manufacturing took off in early 2014, with a large proportion flowing to robot developers and manufacturers.
Investment in advanced manufacturing in 4Q 2017 reached a record $461 million as more mainstream VC investors became active in applied robotics. Driving this trend is a growth in short-term market opportunities, unit economics and recurring revenue. Traditional hardware companies tended to sell their products in single transactions. These days, however, robotics companies are adopting a HAAS business model, which effectively spreads the cost over a contracted period and allows companies to bundle other services
such as software packages, maintenance services and replacement parts. The HAAS model also gives robotics companies a more predictable revenue stream, giving startups a greater ability to compete with large established OEMs that have greater financial resources.
Rethink Robotics and AUBO Robotics are two US-based, VC-backed startups leading the cobot revolution. They are competing with an international assortment of companies, including Universal Robots (Denmark); KUKA Robotics Corporation, MRK-Systeme and Bosch (Germany); ABB, MABI Robotic and F&P Personal Robotics (Switzerland); and FANUC and Kawada Industries (Japan).
As collaborative robots emerge, investors should keep in mind that they are just one piece of the automation puzzle. The advancement of cobots and robots, for example, is directly linked to developments in AI, robotics and sensor technology. Supporting subsectors include RFID tagging, monitoring, predictive analytics, inventory and ERP systems, as well as industrial IoT. Ultimately, the combination of these technologies will shape the factories of the future.
Advanced manufacturing: Can a cobot help you with that?
0
5
10
15
20
25
30
$0
$50
$100
$150
$200
$250
$300
$350
$400
$450
$500
1Q 2Q 3Q 4Q 1Q 2Q 3Q 4Q 1Q 2Q 3Q 4Q 1Q 2Q 3Q 4Q 1Q 2Q 3Q 4Q 1Q 2Q 3Q 4Q 1Q
2012 2013 2014 2015 2016 2017 2018
Deal Value ($M)
# of Deals Closed
Sector has seen marked uptick in deal values recently US VC activity in advanced manufacturing
PitchBook-NVCA Venture Monitor
Matt Trotter, Managing Director of Hardware and Frontier Tech, Silicon Valley Bank

18 1Q 2018 PITCHBOOK-NVCA VENTURE MONITOR
Life sciences$9
.2
$7.9
$7.7
$8.6
$8.7
$9.7
$12.
4
$14.
9
$12.
6
$17.
6
$6.0
870 869952
1,0181,086
1,1481,221
1,258
1,0941,155
241
2008 2009 2010 2011 2012 2013 2014 2015 2016 2017 2018*
Deal Value ($B)
# of Deals Closed
LS investment reaching new heights US VC activity in life sciences
0
200
400
600
800
1,000
1,200
1,400
2008 2009 2010 2011 2012 2013 2014 2015 2016 2017 2018*
Pharma & Biotech
HC Devices & Supplies
Investment split between sectors US VC activity in life sciences (#) by sector
13.3%
14.2%
0%
5%
10%
15%
20%
25%
2008 2009 2010 2011 2012 2013 2014 2015 2016 2017 2018*
As other sectors fall, LS increases share US VC activity in life sciences as percent of total VC
0%
10%
20%
30%
40%
50%
60%
70%
80%
90%
100%
2008
2009
2010
2011
2012
2013
2014
2015
2016
2017
2018
*$50M+
$25-$50M
$10M-$25M
$5M-$10M
$1M-$5M
Under$1M
LS deals increasing along trends US VC activity in life sciences (#) by size
PitchBook-NVCA Venture Monitor *As of 3/31/2018
PitchBook-NVCA Venture Monitor *As of 3/31/2018
PitchBook-NVCA Venture Monitor *As of 3/31/2018
PitchBook-NVCA Venture Monitor *As of 3/31/2018
Policy changing CVC in life sciences
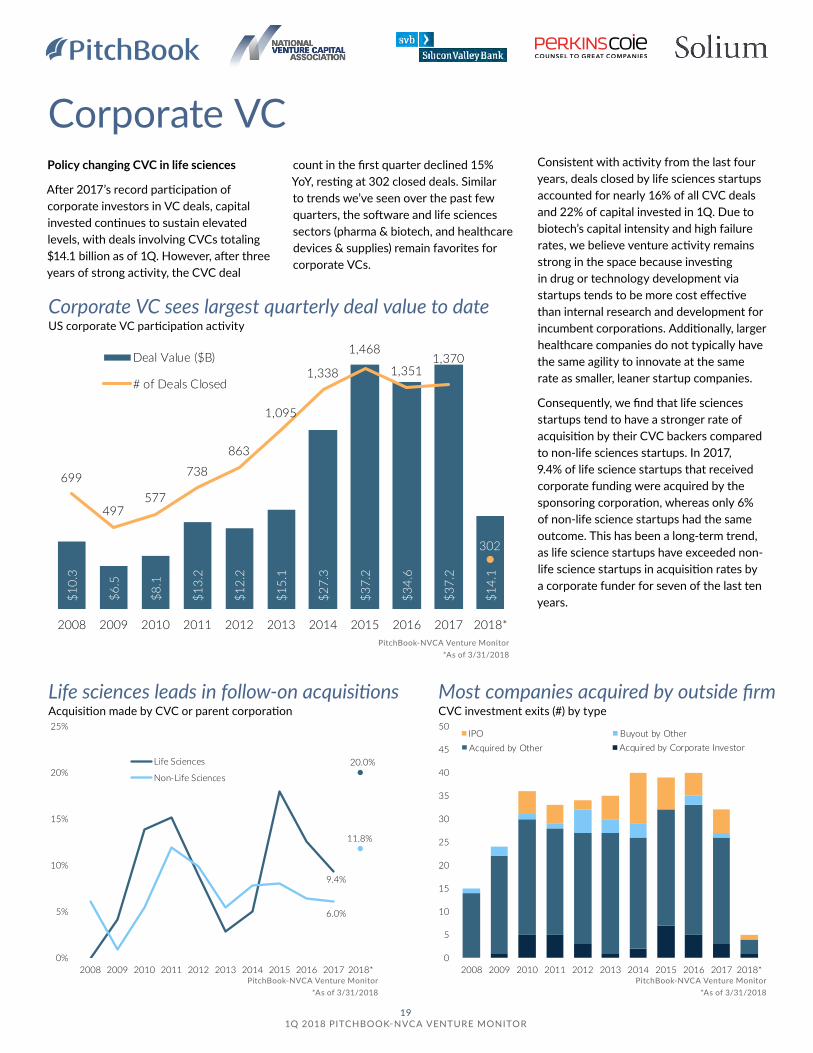
After 2017’s record participation of corporate investors in VC deals, capital invested continues to sustain elevated levels, with deals involving CVCs totaling $14.1 billion as of 1Q. However, after three years of strong activity, the CVC deal
count in the first quarter declined 15% YoY, resting at 302 closed deals. Similar to trends we’ve seen over the past few quarters, the software and life sciences sectors (pharma & biotech, and healthcare devices & supplies) remain favorites for corporate VCs.
Consistent with activity from the last four years, deals closed by life sciences startups accounted for nearly 16% of all CVC deals and 22% of capital invested in 1Q. Due to biotech’s capital intensity and high failure rates, we believe venture activity remains strong in the space because investing in drug or technology development via startups tends to be more cost effective than internal research and development for incumbent corporations. Additionally, larger healthcare companies do not typically have the same agility to innovate at the same rate as smaller, leaner startup companies.
Consequently, we find that life sciences startups tend to have a stronger rate of acquisition by their CVC backers compared to non-life sciences startups. In 2017, 9.4% of life science startups that received corporate funding were acquired by the sponsoring corporation, whereas only 6% of non-life science startups had the same outcome. This has been a long-term trend, as life science startups have exceeded non-life science startups in acquisition rates by a corporate funder for seven of the last ten years.
19 1Q 2018 PITCHBOOK-NVCA VENTURE MONITOR
Corporate VC
PitchBook-NVCA Venture Monitor *As of 3/31/2018
Corporate VC sees largest quarterly deal value to date US corporate VC participation activity
PitchBook-NVCA Venture Monitor *As of 3/31/2018
$10.
3
$6.5
$8.1
$13.
2
$12.
2
$15.
1
$27.
3
$37.
2
$34.
6
$37.
2
$14.
1699
497577
738
863
1,095
1,338
1,468
1,3511,370
302
2008 2009 2010 2011 2012 2013 2014 2015 2016 2017 2018*
Deal Value ($B)
# of Deals Closed
9.4%
20.0%
6.0%
11.8%
0%
5%
10%
15%
20%
25%
2008 2009 2010 2011 2012 2013 2014 2015 2016 2017 2018*
Life Sciences
Non-Life Sciences
Life sciences leads in follow-on acquisitions Acquisition made by CVC or parent corporation
0
5
10
15
20
25
30
35
40
45
50
2008 2009 2010 2011 2012 2013 2014 2015 2016 2017 2018*
IPO Buyout by OtherAcquired by Other Acquired by Corporate Investor
PitchBook-NVCA Venture Monitor *As of 3/31/2018
Most companies acquired by outside firm CVC investment exits (#) by type

Changes in the regulatory environment driven by new leadership in the FDA have the potential to change life sciences investment by CVCs or parent companies. Under its new leadership, the FDA has prioritized faster and more efficient drug
approval processes. Given that one of the greatest costs of drug creation is clearing regulatory approval, these developments can reduce R&D costs to both startups and large incumbents. On one hand, this could encourage continued investment by
CVCs, as startups will theoretically be able to stretch funding dollars further and reach milestones faster. However, a faster and less expensive route to drug approval could also incentivize incumbents to focus on internal development instead.
20 1Q 2018 PITCHBOOK-NVCA VENTURE MONITOR
0%
10%
20%
30%
40%
50%
60%
70%
80%
90%
100%
2008
2009
2010
2011
2012
2013
2014
2015
2016
2017
2018
*
$50M+
$25M-$50M
$10M-$25M
$5M-$10M
$1M-$5M
Under$1M
Many CVC deals occur at late stage US corporate VC activity (#) by size
0%
10%
20%
30%
40%
50%
60%
70%
80%
90%
100%
2008
2009
2010
2011
2012
2013
2014
2015
2016
2017
2018
*
$50M+
$25M-$50M
$10M-$25M
$5M-$10M
$1M-$5M
Under$1M
Unicorn deals account for high % of CVC US corporate VC activity ($) by size
PitchBook-NVCA Venture Monitor *As of 3/31/2018
PitchBook-NVCA Venture Monitor *As of 3/31/2018
PitchBook-NVCA Venture Monitor
0
50
100
150
200
250
300
350
400
450
$0
$2
$4
$6
$8
$10
$12
$14
$16
1Q 2Q 3Q 4Q 1Q 2Q 3Q 4Q 1Q 2Q 3Q 4Q 1Q 2Q 3Q 4Q 1Q 2Q 3Q 4Q 1Q 2Q 3Q 4Q 1Q 2Q 3Q 4Q 1Q 2Q 3Q 4Q 1Q
2010 2011 2012 2013 2014 2015 2016 2017 2018
Deal Value ($B) # of Deals ClosedAngel/Seed Early VCLate VC
Similar to overall VC, CVC deal count has slid while value has risen US corporate VC participation activity
21 1Q 2018 PITCHBOOK-NVCA VENTURE MONITOR
As tech disrupts traditional industries, corporations boost startup investment Q&A with Tracy Isacke, Head of Corporate Relationship Management, Silicon Valley Bank
Why is corporate venture valuable for promoting innovation?
The speed of innovation and disruption is accelerating. Large corporates and their industries are being challenged by incredibly nimble startups that often look to pick off pieces around the edges of a business before coming to dominate an entire industry. To compete, some corporations have created in-house
“startups,” but many larger corporations now recognize that internal innovation alone is not enough. They view promising startups as potential partners in their bid to push the innovation envelope and, in turn, are creating corporate venture capital arms.
A decade ago, it was very hard and expensive for startups to scale and compete with large multinational organizations. Since then, the barriers to entry and growth have fundamentally changed, as mobile and cloud technologies and the drop in computing costs are all creating incredible opportunities to scale businesses at a faster pace and at a fraction of the cost. The ability to scale also has accelerated with the ease of access to capital. Now, as many startups are scaling more efficiently, corporates have realized it’s in their strategic interests to foster value creation through partnerships, investments and acquisitions.
The takeaway is that new market and innovation models are keeping even the most established companies on their toes. This is very good news for entrepreneurs and the VC funding landscape overall: Venture dollars, corporate expertise, and access to customers and distribution channels are flowing to almost every industry and fueling innovation.
your KPIs strategic, financial or a blend of both? Often, it’s most sensible to pursue a smart balance. The term “strategic” is often mistranslated as a lack of concern for financial success when, in fact, it should signal a strong alignment with business initiatives, including profitability.
Beyond succinctly defining your goals, clarity about your approach is also paramount. It’s important to understand what areas you care to invest in, articulate the decision-making process and communicate how you plan to differentiate yourself as a source of value-added capital to the startups. Finally, it’s very important not to treat corporate venture investment as a P&L within the core business. Traditional VC investors take a long-term view of gaining returns from their portfolio investments, and corporate investors should adopt the same level of patience.
At a time of increasing disruption, corporations must innovate to survive, and many are doing so by partnering with top startup entrepreneurs and founders. In this edition, we ask Tracy Isacke, Head of Corporate Relationship Management at Silicon Valley Bank, about the hottest trends and upcoming opportunities for corporate venture capital in the global innovation ecosystem.
In your experience, what strategies enable CVC arms to be successful?
CVC success requires a strong commitment from executives at the top of the organization. Trying to set up a CVC arm with half measures—minimal funding, slow decision-making, lack of C-suite champions—is typically a recipe for failure. A key question to resolve at the start: Are
...barriers to entry and growth have fundamentally changed, as mobile and cloud technologies and the drop in computing costs are all creating incredible opportunities to scale businesses at a faster pace and at a fraction of the cost.
It’s important to understand what areas you care to invest in, articulate the decision-making process and communicate how you plan to differentiate yourself...
For more than 30 years, Silicon Valley Bank (SVB) has helped innovative companies and their investors move bold ideas forward, fast. SVB provides targeted financial services and expertise through its offices in innovation centers around the world. With commercial, international and private banking services, SVB helps address the unique needs of innovators. Learn more at svb.com.
©2018 SVB Financial Group. All rights reserved. SVB, SVB FINANCIAL GROUP, SILICON VALLEY BANK, MAKE NEXT HAPPEN NOW and the chevron device are trademarks of SVB Financial Group, used under license. Silicon Valley Bank is a member of the FDIC and the Federal Reserve System. Silicon Valley Bank is the California bank subsidiary of SVB Financial Group (Nasdaq: SIVB).
22 1Q 2018 PITCHBOOK-NVCA VENTURE MONITOR
Many corporations have essentially joined the ranks of VC investors, adding investment teams and dedicated funds, but sometimes their goals veer from those of traditional VCs. Strategies and return profiles may differ. Is CVC growth ultimately good for the VC industry as a whole, and what effects have you seen?
It depends. When corporates get it right, and they understand the value they can bring to a startup partner or an entire industry, then I think they truly have the ability to change the trajectory of a company or a market for the better. Having a partner—for example, a corporate investor who works in a larger organization, has critical subject matter expertise and can ask second- and third-order questions—can be significant when setting up a startup for long-term success. Having a partner who truly understands your business can lead to great working dynamics and help build a strong board. That said, if corporates fail to set or articulate their expectations or execute on their promises, founders and traditional VC investors are frustrated.
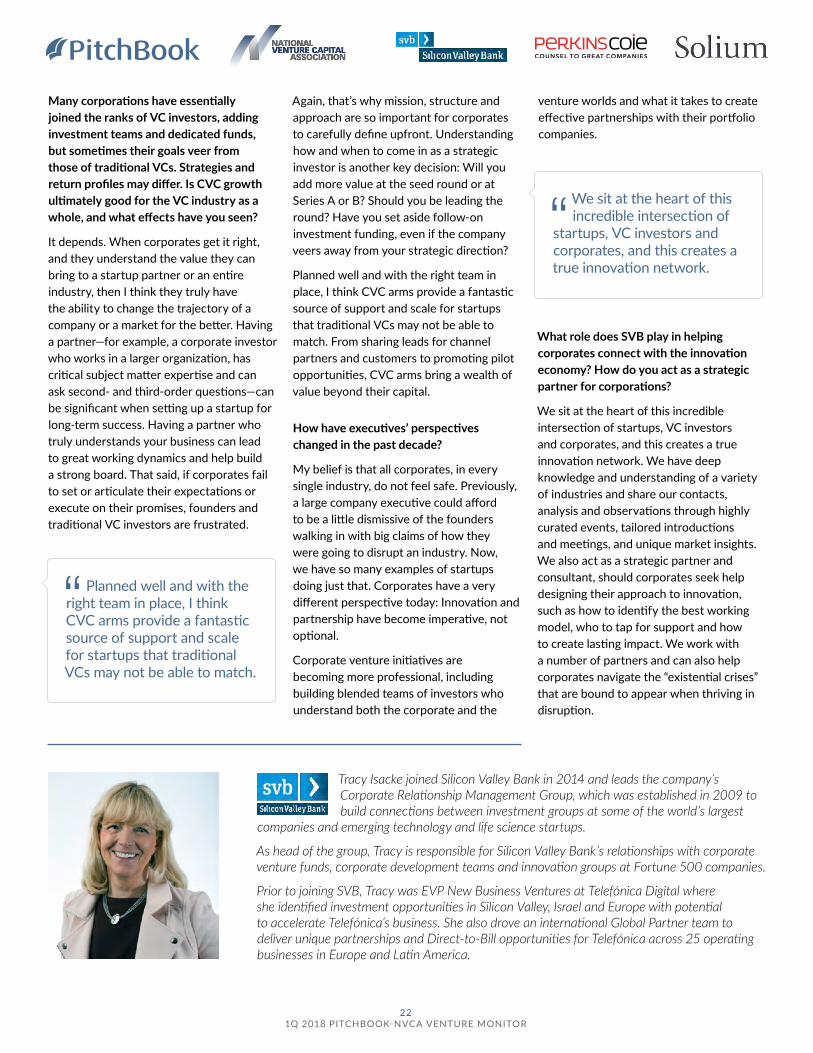
Tracy Isacke joined Silicon Valley Bank in 2014 and leads the company’s Corporate Relationship Management Group, which was established in 2009 to build connections between investment groups at some of the world’s largest
companies and emerging technology and life science startups.
As head of the group, Tracy is responsible for Silicon Valley Bank’s relationships with corporate venture funds, corporate development teams and innovation groups at Fortune 500 companies.
Prior to joining SVB, Tracy was EVP New Business Ventures at Telefónica Digital where she identified investment opportunities in Silicon Valley, Israel and Europe with potential to accelerate Telefónica’s business. She also drove an international Global Partner team to deliver unique partnerships and Direct-to-Bill opportunities for Telefónica across 25 operating businesses in Europe and Latin America.
Again, that’s why mission, structure and approach are so important for corporates to carefully define upfront. Understanding how and when to come in as a strategic investor is another key decision: Will you add more value at the seed round or at Series A or B? Should you be leading the round? Have you set aside follow-on investment funding, even if the company veers away from your strategic direction?
Planned well and with the right team in place, I think CVC arms provide a fantastic source of support and scale for startups that traditional VCs may not be able to match. From sharing leads for channel partners and customers to promoting pilot opportunities, CVC arms bring a wealth of value beyond their capital.
How have executives’ perspectives changed in the past decade?
My belief is that all corporates, in every single industry, do not feel safe. Previously, a large company executive could afford to be a little dismissive of the founders walking in with big claims of how they were going to disrupt an industry. Now, we have so many examples of startups doing just that. Corporates have a very different perspective today: Innovation and partnership have become imperative, not optional.
Corporate venture initiatives are becoming more professional, including building blended teams of investors who understand both the corporate and the
What role does SVB play in helping corporates connect with the innovation economy? How do you act as a strategic partner for corporations?
We sit at the heart of this incredible intersection of startups, VC investors and corporates, and this creates a true innovation network. We have deep knowledge and understanding of a variety of industries and share our contacts, analysis and observations through highly curated events, tailored introductions and meetings, and unique market insights. We also act as a strategic partner and consultant, should corporates seek help designing their approach to innovation, such as how to identify the best working model, who to tap for support and how to create lasting impact. We work with a number of partners and can also help corporates navigate the “existential crises” that are bound to appear when thriving in disruption.
Planned well and with the right team in place, I think CVC arms provide a fantastic source of support and scale for startups that traditional VCs may not be able to match.
We sit at the heart of this incredible intersection of
startups, VC investors and corporates, and this creates a true innovation network.
venture worlds and what it takes to create effective partnerships with their portfolio companies.
23 1Q 2018 PITCHBOOK-NVCA VENTURE MONITOR
Growth equity$3
.9
$9.3
$3.8
$2.7
$9.5
$5.6
$5.7
$6.3
$3.9
$6.6
$9.2
$5.9
$7.2
$6.9
$5.6
$6.0
$9.1
$12.
9
$14.
0
$10.
1
$11.
8
$12.
4
$13.
8
$10.
3
$12.
0
$15.
8
$6.6
$9.6
$8.7
$15.
6
$12.
0
$9.4
$14.
6
0
50
100
150
200
250
300
$0
$2
$4
$6
$8
$10
$12
$14
$16
$18
1Q 2Q 3Q 4Q 1Q 2Q 3Q 4Q 1Q 2Q 3Q 4Q 1Q 2Q 3Q 4Q 1Q 2Q 3Q 4Q 1Q 2Q 3Q 4Q 1Q 2Q 3Q 4Q 1Q 2Q 3Q 4Q 1Q
2010 2011 2012 2013 2014 2015 2016 2017 2018
Deal Value ($B)
# of Deals Closed
GE on pace for fifth straight year of $40B in value US growth equity activity
Deal volume picking back up US growth equity activity
PitchBook-NVCA Venture Monitor *As of 3/31/2018
PitchBook-NVCA Venture Monitor
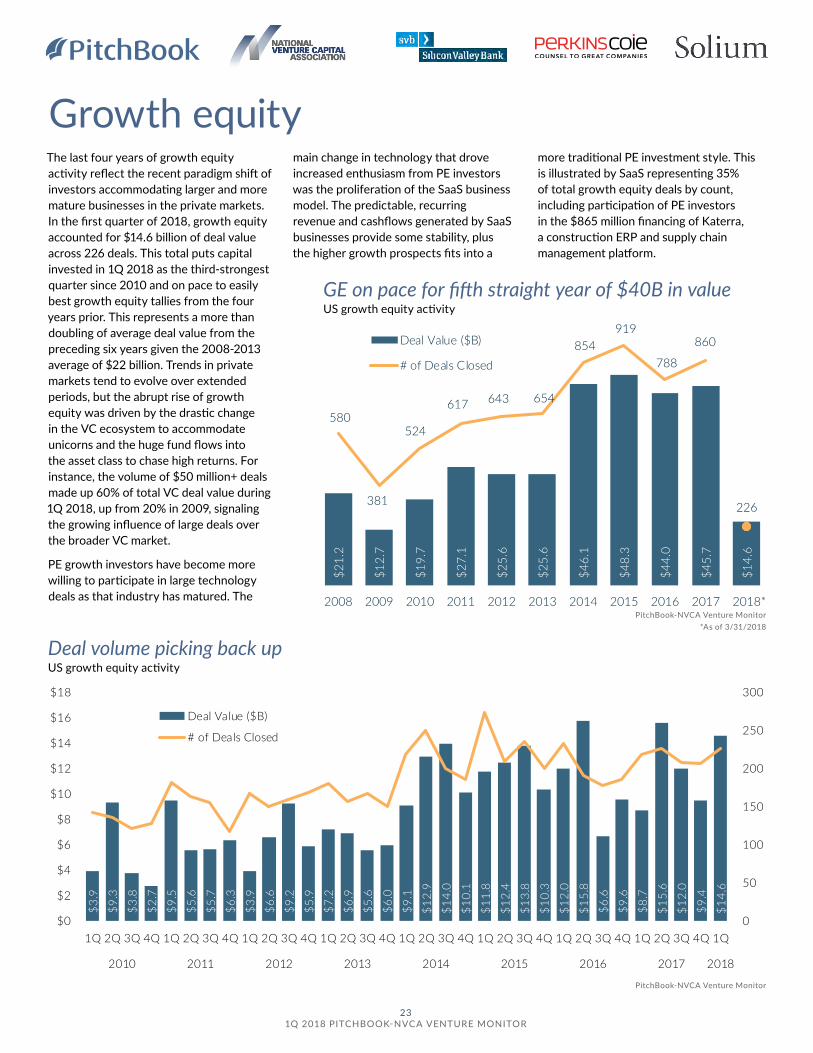
The last four years of growth equity activity reflect the recent paradigm shift of investors accommodating larger and more mature businesses in the private markets. In the first quarter of 2018, growth equity accounted for $14.6 billion of deal value across 226 deals. This total puts capital invested in 1Q 2018 as the third-strongest quarter since 2010 and on pace to easily best growth equity tallies from the four years prior. This represents a more than doubling of average deal value from the preceding six years given the 2008-2013 average of $22 billion. Trends in private markets tend to evolve over extended periods, but the abrupt rise of growth equity was driven by the drastic change in the VC ecosystem to accommodate unicorns and the huge fund flows into the asset class to chase high returns. For instance, the volume of $50 million+ deals made up 60% of total VC deal value during 1Q 2018, up from 20% in 2009, signaling the growing influence of large deals over the broader VC market.
PE growth investors have become more willing to participate in large technology deals as that industry has matured. The
main change in technology that drove increased enthusiasm from PE investors was the proliferation of the SaaS business model. The predictable, recurring revenue and cashflows generated by SaaS businesses provide some stability, plus the higher growth prospects fits into a
more traditional PE investment style. This is illustrated by SaaS representing 35% of total growth equity deals by count, including participation of PE investors in the $865 million financing of Katerra, a construction ERP and supply chain management platform.
$21.
2
$12.
7
$19.
7
$27.
1
$25.
6
$25.
6
$46.
1
$48.
3
$44.
0
$45.
7
$14.
6
580
381
524
617 643 654
854 919
788
860
226
2008 2009 2010 2011 2012 2013 2014 2015 2016 2017 2018*
Deal Value ($B)
# of Deals Closed
24 1Q 2018 PITCHBOOK-NVCA VENTURE MONITOR
0%
10%
20%
30%
40%
50%
60%
70%
80%
90%
100%
2008
2009
2010
2011
2012
2013
2014
2015
2016
2017
2018
*
$200M+
$100M-$200M
$75M-$100M
$50M-$75M
$30M-$50M
$15M-$30M
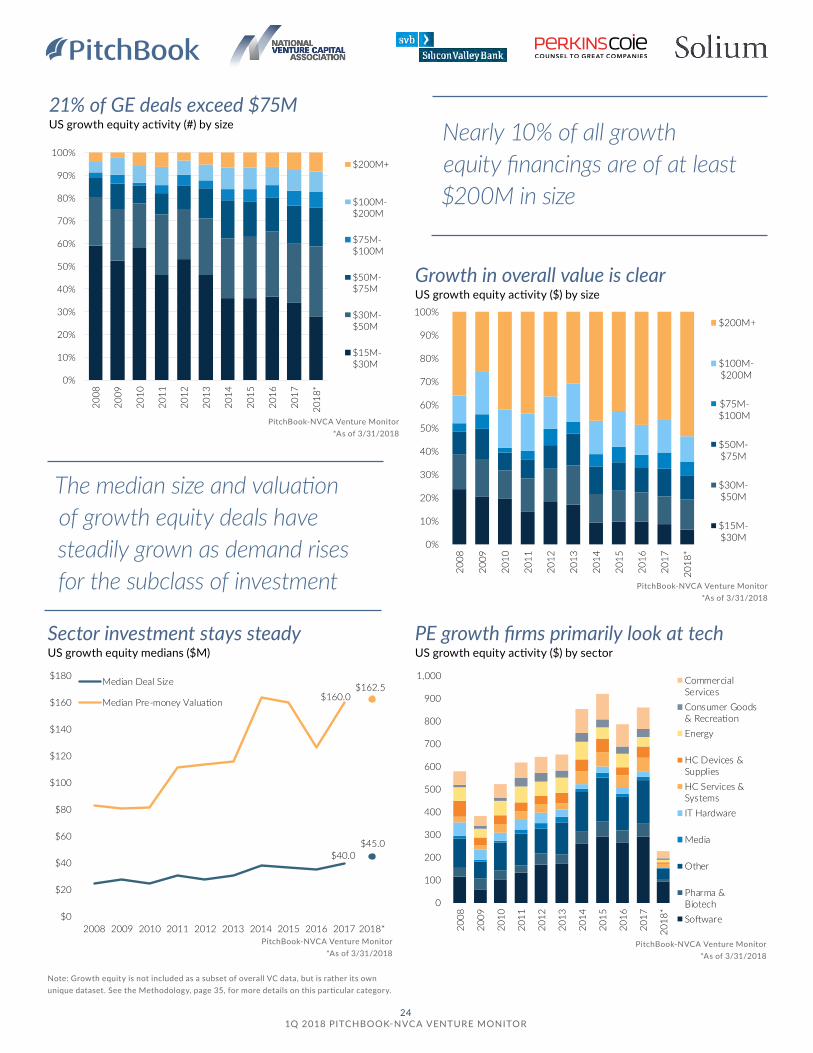
21% of GE deals exceed $75M US growth equity activity (#) by size
Growth in overall value is clear US growth equity activity ($) by size
Sector investment stays steady US growth equity medians ($M)
PE growth firms primarily look at tech US growth equity activity ($) by sector
Nearly 10% of all growth equity financings are of at least $200M in size
The median size and valuation of growth equity deals have steadily grown as demand rises for the subclass of investment
PitchBook-NVCA Venture Monitor *As of 3/31/2018
PitchBook-NVCA Venture Monitor *As of 3/31/2018
PitchBook-NVCA Venture Monitor *As of 3/31/2018
PitchBook-NVCA Venture Monitor *As of 3/31/2018
Note: Growth equity is not included as a subset of overall VC data, but is rather its own unique dataset. See the Methodology, page 35, for more details on this particular category.
0%
10%
20%
30%
40%
50%
60%
70%
80%
90%
100%
2008
2009
2010
2011
2012
2013
2014
2015
2016
2017
2018
*
$200M+
$100M-$200M
$75M-$100M
$50M-$75M
$30M-$50M
$15M-$30M
$40.0$45.0
$160.0$162.5
$0
$20
$40
$60
$80
$100
$120
$140
$160
$180
2008 2009 2010 2011 2012 2013 2014 2015 2016 2017 2018*
Median Deal Size
Median Pre-money Valuation
0
100
200
300
400
500
600
700
800
900
1,000
2008
2009
2010
2011
2012
2013
2014
2015
2016
2017
2018
*
CommercialServicesConsumer Goods& RecreationEnergy
HC Devices &SuppliesHC Services &SystemsIT Hardware
Media
Other
Pharma &BiotechSoftware
25 1Q 2018 PITCHBOOK-NVCA VENTURE MONITOR
What public market fluctuations signal for venture dealmaking
As we know all too well, tech company IPOs tend to slow during periods of turbulence in the public markets. Naturally, few want to test their growth story amid public scrutiny when larger unpredictable market forces are in play. But what about the impact of public market turbulence on private venture investments to scaled tech companies?
At SVB, by analyzing both public and proprietary data, we see correlations around how topsy-turvy public markets affect venture deal making. More on that in a minute, but first a little scene-setting.
At the start of 2018, the current bull market that started in March 2009 seemed determined to celebrate its ninth birthday on a heady upswing: The S&P 500 index closed up nearly 6 percent in January 2018, marking one of the best new-year debuts in nearly two decades. But February arrived with a sobering downturn: In the first three trading days, the S&P 500 gave up all of its January gains and headed into correction territory, bottoming out after a 10 percent decline from its January high. Importantly, during this period of decline, the long-dormant CBOE Volatility Index (the “VIX”), which measures expectations of stock market fluctuations, closed above 30 for the first time since August 2015 and recorded the biggest single-day jump since the index was created in 1990.
At the time of this writing, with the exception of a few bumps caused by trade war or interest rate fears, the markets seem to have recovered from that rocky early February of 2018. The IPO window appears to be opening again, with the strong post-IPO gains of Zscaler and Dropbox, and several more VC-backed tech companies on deck to go public. Still, the volatility index remains above the benign sub-15 level it held through 2017, which
could signal rocky times ahead. What might this public market experience mean for private late-stage VC investing?
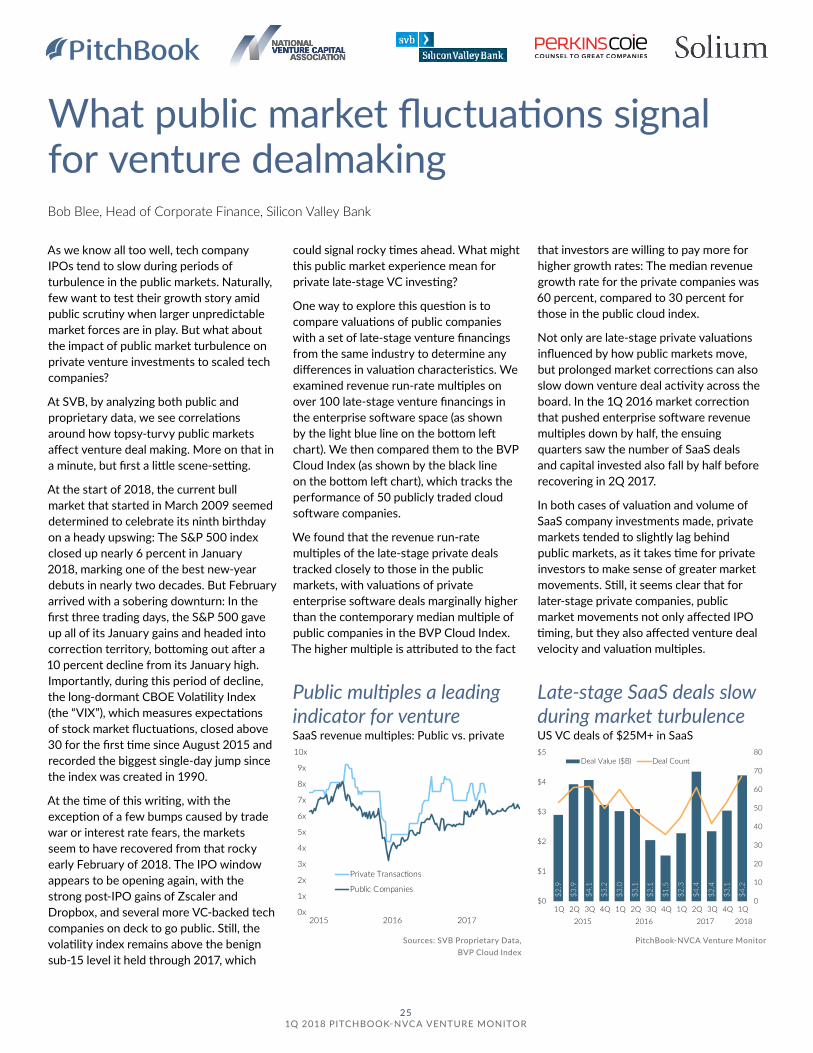
One way to explore this question is to compare valuations of public companies with a set of late-stage venture financings from the same industry to determine any differences in valuation characteristics. We examined revenue run-rate multiples on over 100 late-stage venture financings in the enterprise software space (as shown by the light blue line on the bottom left chart). We then compared them to the BVP Cloud Index (as shown by the black line on the bottom left chart), which tracks the performance of 50 publicly traded cloud software companies.
We found that the revenue run-rate multiples of the late-stage private deals tracked closely to those in the public markets, with valuations of private enterprise software deals marginally higher than the contemporary median multiple of public companies in the BVP Cloud Index. The higher multiple is attributed to the fact
that investors are willing to pay more for higher growth rates: The median revenue growth rate for the private companies was 60 percent, compared to 30 percent for those in the public cloud index.
Not only are late-stage private valuations influenced by how public markets move, but prolonged market corrections can also slow down venture deal activity across the board. In the 1Q 2016 market correction that pushed enterprise software revenue multiples down by half, the ensuing quarters saw the number of SaaS deals and capital invested also fall by half before recovering in 2Q 2017.
In both cases of valuation and volume of SaaS company investments made, private markets tended to slightly lag behind public markets, as it takes time for private investors to make sense of greater market movements. Still, it seems clear that for later-stage private companies, public market movements not only affected IPO timing, but they also affected venture deal velocity and valuation multiples.
Bob Blee, Head of Corporate Finance, Silicon Valley Bank
0x
1x
2x
3x
4x
5x
6x
7x
8x
9x
10x
2015 2016 2017
Private Transactions
Public Companies
Public multiples a leading indicator for venture SaaS revenue multiples: Public vs. private
Late-stage SaaS deals slow during market turbulence US VC deals of $25M+ in SaaS
$2.9
$3.9
$4.1
$3.2
$3.0
$3.1
$2.1
$1.5
$2.3
$4.4
$2.4
$3.1
$4.2
0
10
20
30
40
50
60
70
80
$0
$1
$2
$3
$4
$5
1Q 2Q 3Q 4Q 1Q 2Q 3Q 4Q 1Q 2Q 3Q 4Q 1Q2015 2016 2017 2018
Deal Value ($B) Deal Count
PitchBook-NVCA Venture Monitor Sources: SVB Proprietary Data, BVP Cloud Index
26 1Q 2018 PITCHBOOK-NVCA VENTURE MONITOR
Exits$9
.1
$4.8
$7.9
$9.9
$8.8
$9.2
$7.8
$8.6
$6.8
$26.
3
$11.
9
$10.
5
$3.9
$8.9
$11.
4
$13.
1
$14.
0
$11.
6
$18.
2
$36.
8
$8.7
$10.
5
$14.
5
$15.
3
$11.
1
$16.
7
$15.
9
$9.3
$17.
2
$13.
0
$14.
3
$12.
6
$8.1
0
50
100
150
200
250
300
$0
$5
$10
$15
$20
$25
$30
$35
$40
1Q 2Q 3Q 4Q 1Q 2Q 3Q 4Q 1Q 2Q 3Q 4Q 1Q 2Q 3Q 4Q 1Q 2Q 3Q 4Q 1Q 2Q 3Q 4Q 1Q 2Q 3Q 4Q 1Q 2Q 3Q 4Q 1Q
2010 2011 2012 2013 2014 2015 2016 2017 2018
Exit Value ($B)# of Exits Closed
$16.
3
$16.
4
$31.
7
$34.
4
$55.
5
$37.
3
$80.
5
$49.
0
$53.
0
$57.
1
$8.1
483 482
698738
867 889
1,0671,004
873835
188
2008 2009 2010 2011 2012 2013 2014 2015 2016 2017 2018*
Exit Value ($B)
# of Exits Closed
Exits continue to slide, leaving industry in crunch US VC-backed exit activity
Exits slide during three of past four quarters US VC-backed exit activity
PitchBook-NVCA Venture Monitor *As of 3/31/2018
PitchBook-NVCA Venture Monitor
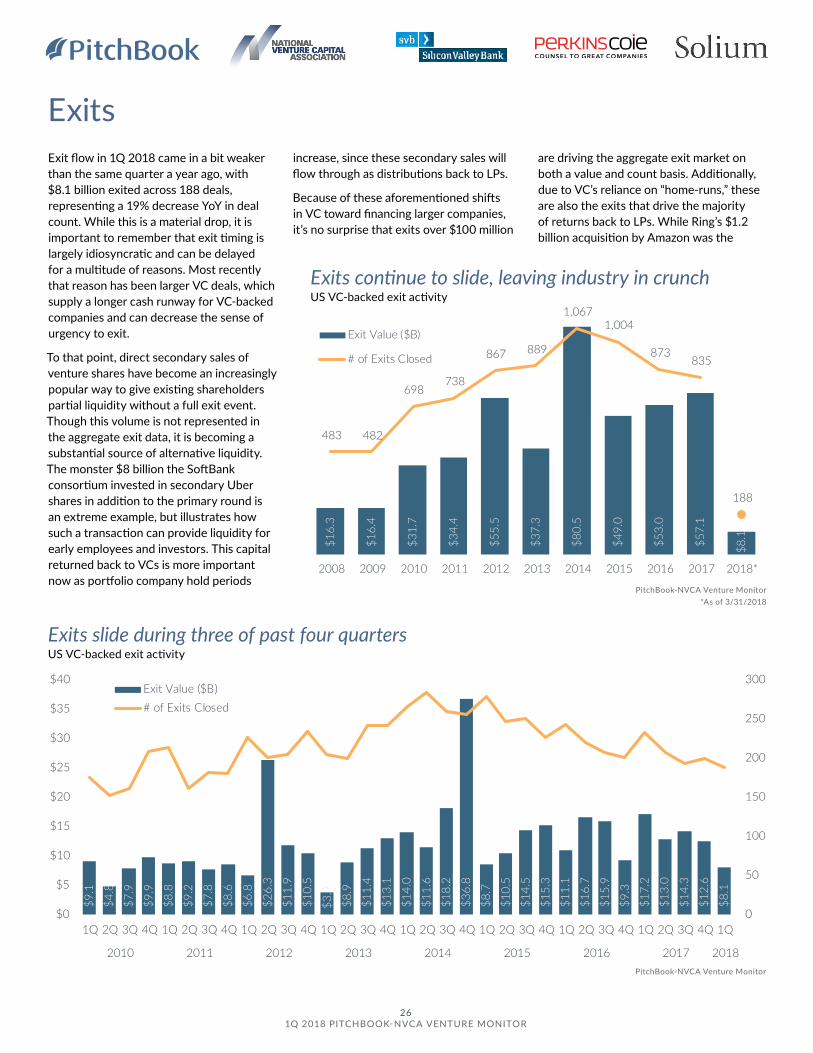
Exit flow in 1Q 2018 came in a bit weaker than the same quarter a year ago, with $8.1 billion exited across 188 deals, representing a 19% decrease YoY in deal count. While this is a material drop, it is important to remember that exit timing is largely idiosyncratic and can be delayed for a multitude of reasons. Most recently that reason has been larger VC deals, which supply a longer cash runway for VC-backed companies and can decrease the sense of urgency to exit.
To that point, direct secondary sales of venture shares have become an increasingly popular way to give existing shareholders partial liquidity without a full exit event. Though this volume is not represented in the aggregate exit data, it is becoming a substantial source of alternative liquidity. The monster $8 billion the SoftBank consortium invested in secondary Uber shares in addition to the primary round is an extreme example, but illustrates how such a transaction can provide liquidity for early employees and investors. This capital returned back to VCs is more important now as portfolio company hold periods
increase, since these secondary sales will flow through as distributions back to LPs.
Because of these aforementioned shifts in VC toward financing larger companies, it’s no surprise that exits over $100 million
are driving the aggregate exit market on both a value and count basis. Additionally, due to VC’s reliance on “home-runs,” these are also the exits that drive the majority of returns back to LPs. While Ring’s $1.2 billion acquisition by Amazon was the
28 1Q 2018 PITCHBOOK-NVCA VENTURE MONITOR
9.7x9.3x
7.7x
9.1x 9.1x
10.4x 9.8x 10.5x 10.1x 10.4x
9.0x
8,652
1,693835
188 0
2,000
4,000
6,000
8,000
10,000
12,000
0x
2x
4x
6x
8x
10x
12x
2008 2009 2010 2011 2012 2013 2014 2015 2016 2017 2018*
Investments/Exits # of Investments # of Exits
$94.0
$70.0
$78.8
$110.0
$0
$20
$40
$60
$80
$100
$120
2008 2009 2010 2011 2012 2013 2014 2015 2016 2017 2018*
Acquisition/Buyout IPO
0%
10%
20%
30%
40%
50%
60%
70%
80%
90%
100%
2008
2009
2010
2011
2012
2013
2014
2015
2016
2017
2018
*$500M+
$100M-$500M
$50M-$100M
$25M-$50M
Under$25M
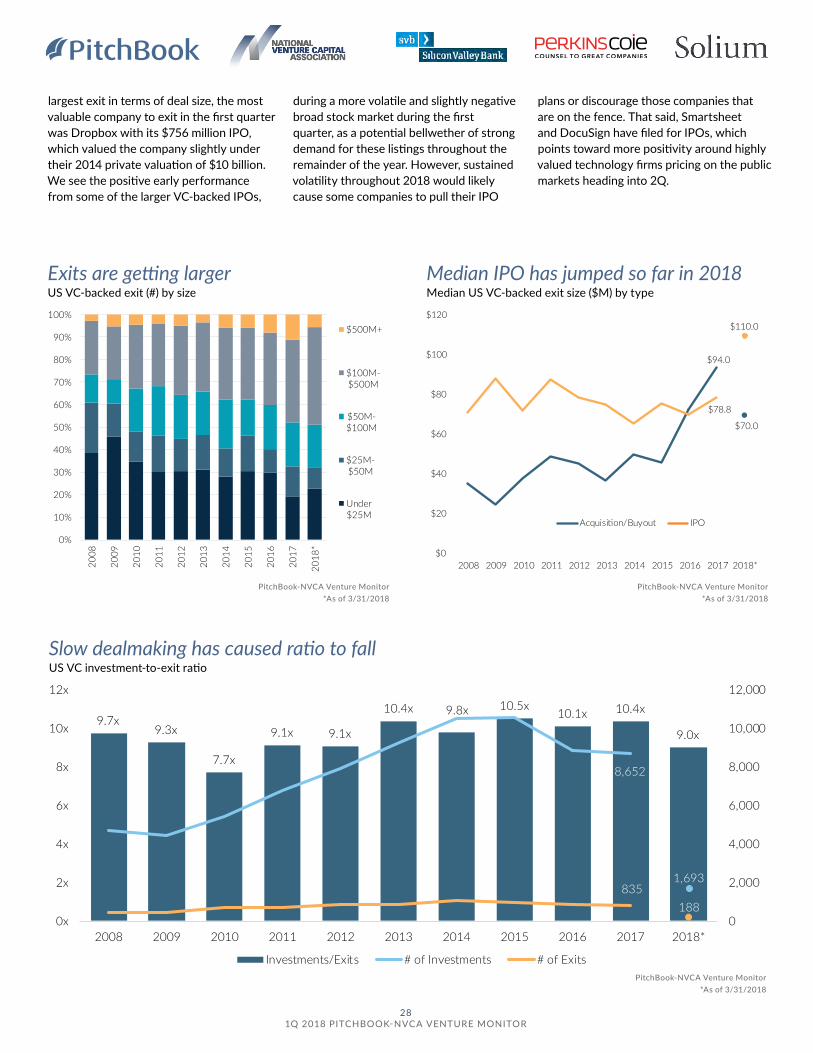
Exits are getting larger US VC-backed exit (#) by size
Median IPO has jumped so far in 2018 Median US VC-backed exit size ($M) by type
Slow dealmaking has caused ratio to fall US VC investment-to-exit ratio
PitchBook-NVCA Venture Monitor *As of 3/31/2018
PitchBook-NVCA Venture Monitor *As of 3/31/2018
PitchBook-NVCA Venture Monitor *As of 3/31/2018
largest exit in terms of deal size, the most valuable company to exit in the first quarter was Dropbox with its $756 million IPO, which valued the company slightly under their 2014 private valuation of $10 billion. We see the positive early performance from some of the larger VC-backed IPOs,
during a more volatile and slightly negative broad stock market during the first quarter, as a potential bellwether of strong demand for these listings throughout the remainder of the year. However, sustained volatility throughout 2018 would likely cause some companies to pull their IPO
plans or discourage those companies that are on the fence. That said, Smartsheet and DocuSign have filed for IPOs, which points toward more positivity around highly valued technology firms pricing on the public markets heading into 2Q.

29 1Q 2018 PITCHBOOK-NVCA VENTURE MONITOR
Fundraising
$31.
7
$12.
2
$20.
0
$25.
9
$24.
1
$21.
3
$36.
2
$36.
1
$40.
9
$33.
3
$7.9
192
123
161 156
203224
295 283300
235
54
2008 2009 2010 2011 2012 2013 2014 2015 2016 2017 2018*
Capital Raised ($B)
# of Funds Closed
Fundraising likely to pick up after slow quarter US VC fundraising activity
PitchBook-NVCA Venture Monitor *As of 3/31/2018
PitchBook-NVCA Venture Monitor *As of 3/31/2018
Billion-dollar funds loom, but small funds stick around
So far in 2018, VC funds have closed on roughly $8 billion in commitments across 54 vehicles, putting both capital raised and fund count on pace to dip slightly from 2017. A strong showing from micro funds (vehicles smaller than $50 million) has pulled down he median fund size, though we expect a surge of larger funds to close later in the year to provide a boost to fund sizes and total capital raised. With two billion-dollar funds closed already and up to four more in the pipeline, 2018 could still surpass last year in terms of total capital raised.
In the first quarter of 2018, micro funds made up 50% of fund count for the first time since 2015. Driven by seed and early-stage vehicles with niche strategies or regional focuses, the representation of smaller funds speaks to continued development of innovative strategies and
$3.1
$1.1
$1.0
$1.9
$1.6
$1.5
$2.0
$2.1
$2.4
$3.5
$0.8
31
25
36
21
28
23
44
3027
37
11
2008 2009 2010 2011 2012 2013 2014 2015 2016 2017 2018*
Capital Raised ($B)
# of Funds Closed
PitchBook-NVCA Venture Monitor *As of 3/31/2018
First-time funds continue to be strong US first-time fundraising activity
$1.2
$0.8
$1.1
$1.2
$1.6
$1.8
$1.9
$1.6
$1.7
$1.8
$0.5
68
54
73 74
112 118
152 149 138
104
27
2008 2009 2010 2011 2012 2013 2014 2015 2016 2017 2018*
Capital Raised ($B)# Funds Closed
50% of closed funds in 1Q under $50M US micro fund activity

30 1Q 2018 PITCHBOOK-NVCA VENTURE MONITOR
0%
10%
20%
30%
40%
50%
60%
70%
80%
90%
100%
2006
2007
2008
2009
2010
2011
2012
2013
2014
2015
2016
2017
2018
*
$1B+
$500M-$1B
$250M-$500M
$100M-$250M
$50M-$100M
Under$50M
PitchBook-NVCA Venture Monitor *As of 3/31/2018
PitchBook-NVCA Venture Monitor *As of 3/31/2018
emerging venture ecosystems. True Wealth Ventures Fund I, for instance, focuses exclusively on female founders, while Illinois Ventures’ Emerging Technologies Fund III seeks to capitalize research spin-outs from the University of Illinois. First-time funds have also made a strong showing with 11 vehicles closed in 1Q 2018, putting this year on track to each 2014’s decade high number of funds closed.
Though capital raised is tracking lower so far, the outsized effects of mega-funds (vehicles $500 million or greater) will likely lift capital raised in the remainder of 2018, as four vehicles including Lightspeed Venture Partners and Social Capital have all announced intentions to raise funds of $1 billion or more in the near future. The impact from mega-funds is clear, as these funds made up 47% of all capital raised by venture funds in 2018, despite only representing 5% of all closed vehicles. While three funds of over $1 billion were closed in all of 2017, three strategies have already closed in the beginning of 2018—Norwest Venture Partners’ $1.5 billion and General Catalyst Partners’ $1.37 billion fund, as well as $1.25 billion raised across two complementary vehicles from Battery Ventures.
VCs have taken to raising larger funds to garner the capital necessary to maintain a competitive stance against deep-pocketed investors, such as SoftBank, as deal sizes and valuations continue to rise. But strong fundraising is only possible if there is sufficient LP demand, and many institutional investors have been looking to allocate more to private market strategies—including VC—while trying to consolidate their allocation to fewer managers, resulting in larger but fewer fund commitments. While these mega-funds may offer GPs competitive advantages, they also bring into question whether their managers can deliver venture-like returns, as GPs run the risks of overpaying in outsized rounds and overcapitalizing startups.
$53.0$45.0
$146.6 $148.6
$0
$40
$80
$120
$160
$200
2008 2009 2010 2011 2012 2013 2014 2015 2016 2017 2018*
Median
Average
Median fund size declines Median & average US VC fund size ($M)
Several large funds planned for rest of year US VC fundraising activity (#) by size

See how the PitchBook Platform can
help VCs invest smarter.
We do pre-money valuations,cap tables,series terms,custom search,growth metrics.
You invest in the next big thing.
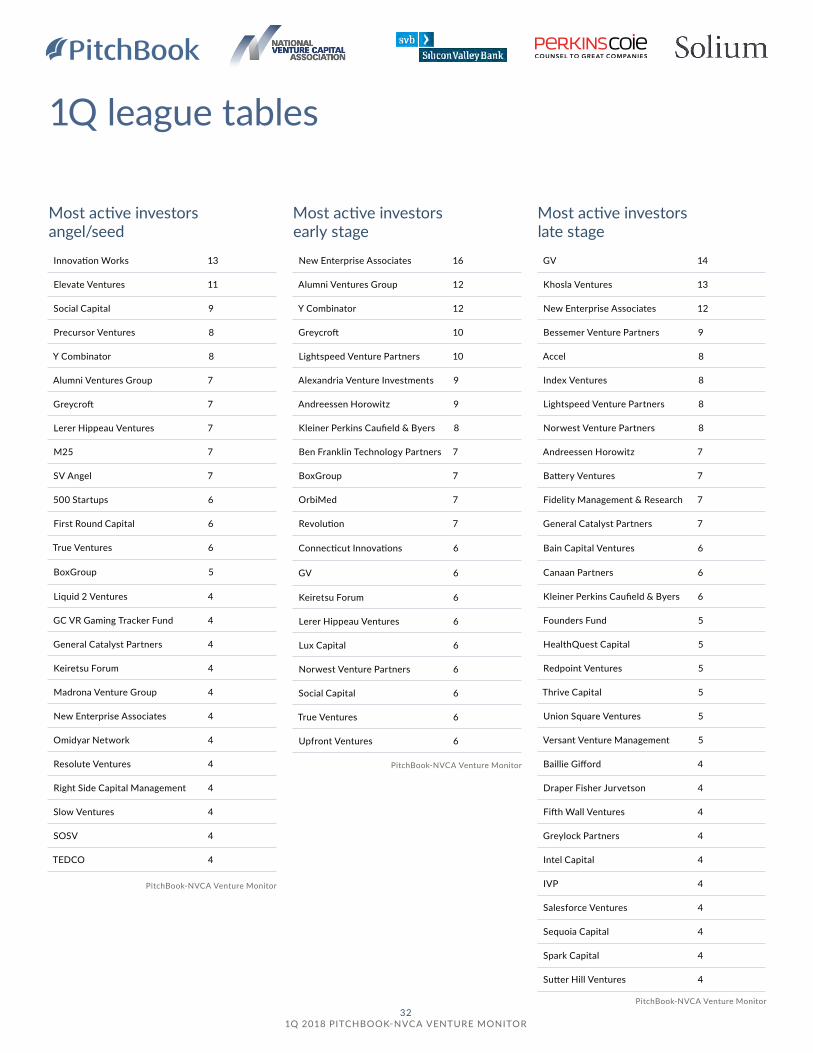
32 1Q 2018 PITCHBOOK-NVCA VENTURE MONITOR
1Q league tables
Innovation Works 13
Elevate Ventures 11
Social Capital 9
Precursor Ventures 8
Y Combinator 8
Alumni Ventures Group 7
Greycroft 7
Lerer Hippeau Ventures 7
M25 7
SV Angel 7
500 Startups 6
First Round Capital 6
True Ventures 6
BoxGroup 5
Liquid 2 Ventures 4
GC VR Gaming Tracker Fund 4
General Catalyst Partners 4
Keiretsu Forum 4
Madrona Venture Group 4
New Enterprise Associates 4
Omidyar Network 4
Resolute Ventures 4
Right Side Capital Management 4
Slow Ventures 4
SOSV 4
TEDCO 4
Most active investors angel/seed
Most active investors early stage
Most active investors late stage
New Enterprise Associates 16
Alumni Ventures Group 12
Y Combinator 12
Greycroft 10
Lightspeed Venture Partners 10
Alexandria Venture Investments 9
Andreessen Horowitz 9
Kleiner Perkins Caufield & Byers 8
Ben Franklin Technology Partners 7
BoxGroup 7
OrbiMed 7
Revolution 7
Connecticut Innovations 6
GV 6
Keiretsu Forum 6
Lerer Hippeau Ventures 6
Lux Capital 6
Norwest Venture Partners 6
Social Capital 6
True Ventures 6
Upfront Ventures 6
PitchBook-NVCA Venture Monitor
PitchBook-NVCA Venture Monitor
GV 14
Khosla Ventures 13
New Enterprise Associates 12
Bessemer Venture Partners 9
Accel 8
Index Ventures 8
Lightspeed Venture Partners 8
Norwest Venture Partners 8
Andreessen Horowitz 7
Battery Ventures 7
Fidelity Management & Research 7
General Catalyst Partners 7
Bain Capital Ventures 6
Canaan Partners 6
Kleiner Perkins Caufield & Byers 6
Founders Fund 5
HealthQuest Capital 5
Redpoint Ventures 5
Thrive Capital 5
Union Square Ventures 5
Versant Venture Management 5
Baillie Gifford 4
Draper Fisher Jurvetson 4
Fifth Wall Ventures 4
Greylock Partners 4
Intel Capital 4
IVP 4
Salesforce Ventures 4
Sequoia Capital 4
Spark Capital 4
Sutter Hill Ventures 4
PitchBook-NVCA Venture Monitor
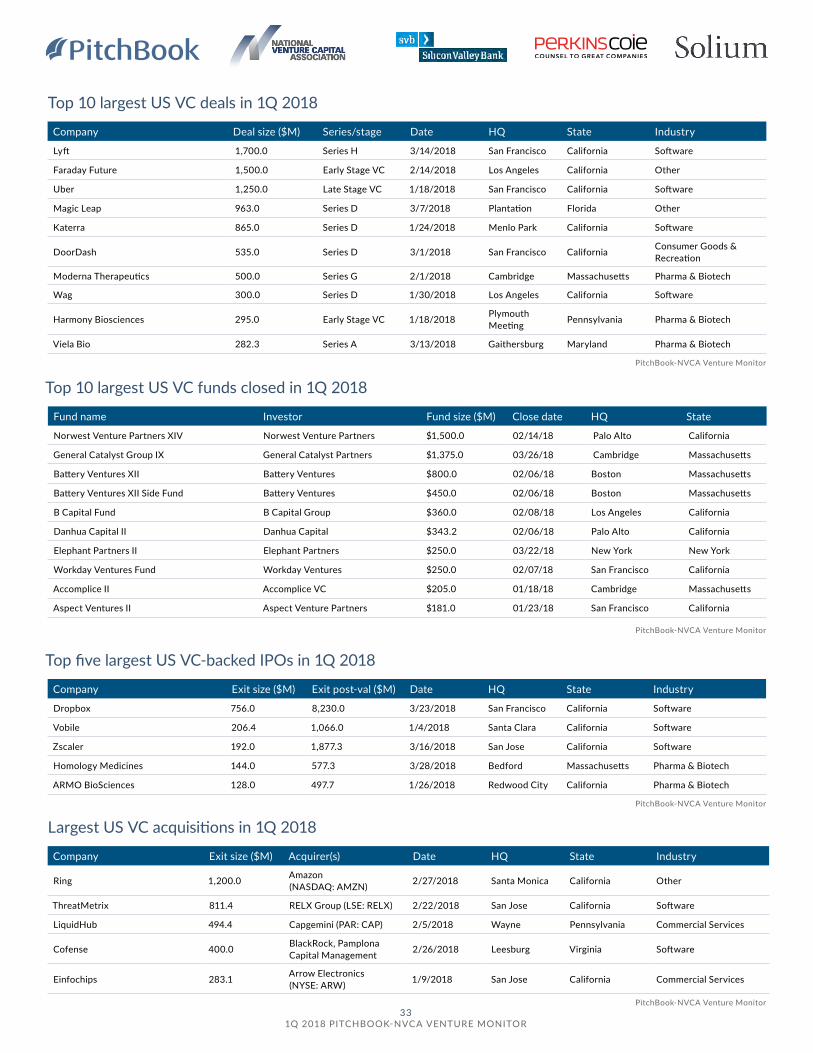
33 1Q 2018 PITCHBOOK-NVCA VENTURE MONITOR
Company Deal size ($M) Series/stage Date HQ State Industry
Lyft 1,700.0 Series H 3/14/2018 San Francisco California Software
Faraday Future 1,500.0 Early Stage VC 2/14/2018 Los Angeles California Other
Uber 1,250.0 Late Stage VC 1/18/2018 San Francisco California Software
Magic Leap 963.0 Series D 3/7/2018 Plantation Florida Other
Katerra 865.0 Series D 1/24/2018 Menlo Park California Software
DoorDash 535.0 Series D 3/1/2018 San Francisco California Consumer Goods & Recreation
Moderna Therapeutics 500.0 Series G 2/1/2018 Cambridge Massachusetts Pharma & Biotech
Wag 300.0 Series D 1/30/2018 Los Angeles California Software
Harmony Biosciences 295.0 Early Stage VC 1/18/2018 Plymouth Meeting Pennsylvania Pharma & Biotech
Viela Bio 282.3 Series A 3/13/2018 Gaithersburg Maryland Pharma & Biotech
Top 10 largest US VC deals in 1Q 2018
Top 10 largest US VC funds closed in 1Q 2018
Top five largest US VC-backed IPOs in 1Q 2018
Largest US VC acquisitions in 1Q 2018
Fund name Investor Fund size ($M) Close date HQ State
Norwest Venture Partners XIV Norwest Venture Partners $1,500.0 02/14/18 Palo Alto California
General Catalyst Group IX General Catalyst Partners $1,375.0 03/26/18 Cambridge Massachusetts
Battery Ventures XII Battery Ventures $800.0 02/06/18 Boston Massachusetts
Battery Ventures XII Side Fund Battery Ventures $450.0 02/06/18 Boston Massachusetts
B Capital Fund B Capital Group $360.0 02/08/18 Los Angeles California
Danhua Capital II Danhua Capital $343.2 02/06/18 Palo Alto California
Elephant Partners II Elephant Partners $250.0 03/22/18 New York New York
Workday Ventures Fund Workday Ventures $250.0 02/07/18 San Francisco California
Accomplice II Accomplice VC $205.0 01/18/18 Cambridge Massachusetts
Aspect Ventures II Aspect Venture Partners $181.0 01/23/18 San Francisco California
Company Exit size ($M) Exit post-val ($M) Date HQ State Industry
Dropbox 756.0 8,230.0 3/23/2018 San Francisco California Software
Vobile 206.4 1,066.0 1/4/2018 Santa Clara California Software
Zscaler 192.0 1,877.3 3/16/2018 San Jose California Software
Homology Medicines 144.0 577.3 3/28/2018 Bedford Massachusetts Pharma & Biotech
ARMO BioSciences 128.0 497.7 1/26/2018 Redwood City California Pharma & Biotech
Company Exit size ($M) Acquirer(s) Date HQ State Industry
Ring 1,200.0 Amazon (NASDAQ: AMZN) 2/27/2018 Santa Monica California Other
ThreatMetrix 811.4 RELX Group (LSE: RELX) 2/22/2018 San Jose California Software
LiquidHub 494.4 Capgemini (PAR: CAP) 2/5/2018 Wayne Pennsylvania Commercial Services
Cofense 400.0 BlackRock, Pamplona Capital Management 2/26/2018 Leesburg Virginia Software
Einfochips 283.1 Arrow Electronics (NYSE: ARW) 1/9/2018 San Jose California Commercial Services
PitchBook-NVCA Venture Monitor
PitchBook-NVCA Venture Monitor
PitchBook-NVCA Venture Monitor
PitchBook-NVCA Venture Monitor
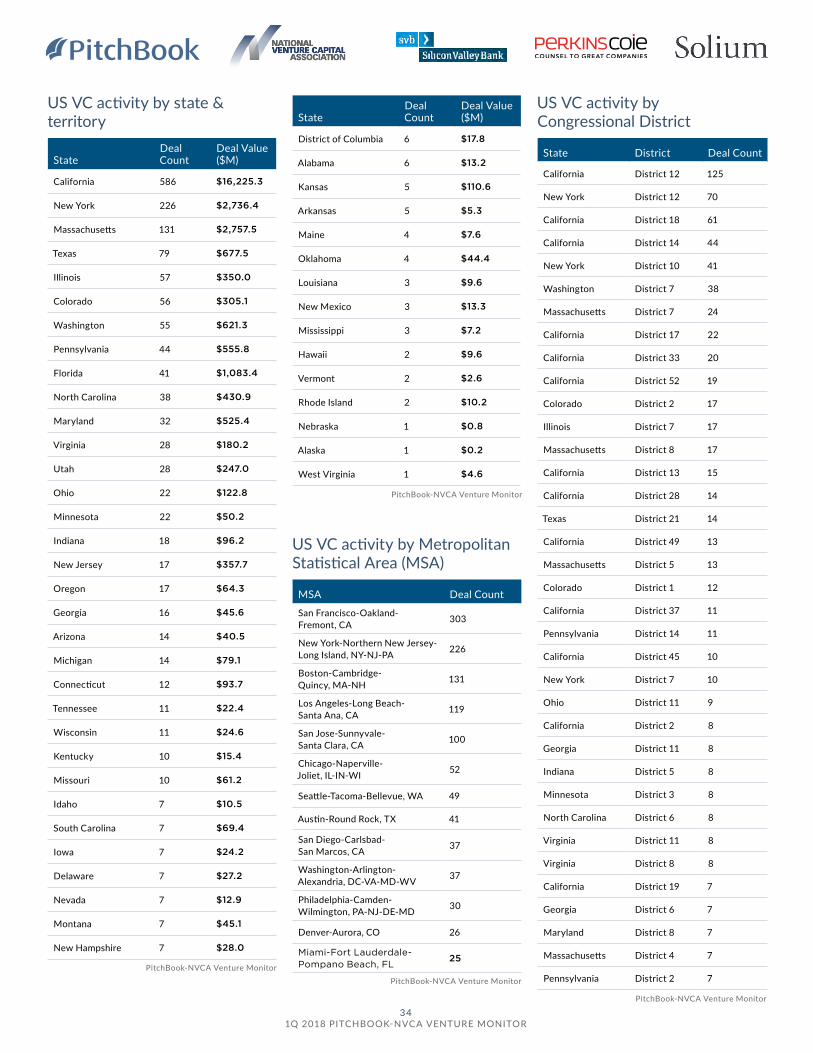
34 1Q 2018 PITCHBOOK-NVCA VENTURE MONITOR
US VC activity by state & territory
US VC activity by Metropolitan Statistical Area (MSA)
State District Deal Count
California District 12 125
New York District 12 70
California District 18 61
California District 14 44
New York District 10 41
Washington District 7 38
Massachusetts District 7 24
California District 17 22
California District 33 20
California District 52 19
Colorado District 2 17
Illinois District 7 17
Massachusetts District 8 17
California District 13 15
California District 28 14
Texas District 21 14
California District 49 13
Massachusetts District 5 13
Colorado District 1 12
California District 37 11
Pennsylvania District 14 11
California District 45 10
New York District 7 10
Ohio District 11 9
California District 2 8
Georgia District 11 8
Indiana District 5 8
Minnesota District 3 8
North Carolina District 6 8
Virginia District 11 8
Virginia District 8 8
California District 19 7
Georgia District 6 7
Maryland District 8 7
Massachusetts District 4 7
Pennsylvania District 2 7
US VC activity by Congressional District
StateDeal Count
Deal Value ($M)
California 586 $16,225.3
New York 226 $2,736.4
Massachusetts 131 $2,757.5
Texas 79 $677.5
Illinois 57 $350.0
Colorado 56 $305.1
Washington 55 $621.3
Pennsylvania 44 $555.8
Florida 41 $1,083.4
North Carolina 38 $430.9
Maryland 32 $525.4
Virginia 28 $180.2
Utah 28 $247.0
Ohio 22 $122.8
Minnesota 22 $50.2
Indiana 18 $96.2
New Jersey 17 $357.7
Oregon 17 $64.3
Georgia 16 $45.6
Arizona 14 $40.5
Michigan 14 $79.1
Connecticut 12 $93.7
Tennessee 11 $22.4
Wisconsin 11 $24.6
Kentucky 10 $15.4
Missouri 10 $61.2
Idaho 7 $10.5
South Carolina 7 $69.4
Iowa 7 $24.2
Delaware 7 $27.2
Nevada 7 $12.9
Montana 7 $45.1
New Hampshire 7 $28.0
MSA Deal Count
San Francisco-Oakland- Fremont, CA 303
New York-Northern New Jersey-Long Island, NY-NJ-PA 226
Boston-Cambridge- Quincy, MA-NH 131
Los Angeles-Long Beach- Santa Ana, CA 119
San Jose-Sunnyvale- Santa Clara, CA 100
Chicago-Naperville- Joliet, IL-IN-WI 52
Seattle-Tacoma-Bellevue, WA 49
Austin-Round Rock, TX 41
San Diego-Carlsbad- San Marcos, CA 37
Washington-Arlington-Alexandria, DC-VA-MD-WV 37
Philadelphia-Camden-Wilmington, PA-NJ-DE-MD 30
Denver-Aurora, CO 26
Miami-Fort Lauderdale-Pompano Beach, FL
25
StateDeal Count
Deal Value ($M)
District of Columbia 6 $17.8
Alabama 6 $13.2
Kansas 5 $110.6
Arkansas 5 $5.3
Maine 4 $7.6
Oklahoma 4 $44.4
Louisiana 3 $9.6
New Mexico 3 $13.3
Mississippi 3 $7.2
Hawaii 2 $9.6
Vermont 2 $2.6
Rhode Island 2 $10.2
Nebraska 1 $0.8
Alaska 1 $0.2
West Virginia 1 $4.6
PitchBook-NVCA Venture Monitor PitchBook-NVCA Venture Monitor
PitchBook-NVCA Venture Monitor
PitchBook-NVCA Venture Monitor
MethodologyFundraising We define VC funds as pools of capital raised for the purpose of investing in the equity of startup companies. In addition to funds raised by traditional VC firms, PitchBook also includes funds raised by any institution with the primary intent stated above. Funds identifying as growth-stage vehicles are classified as PE funds and are not included in this report. A fund’s location is determined by the country in which the fund is domiciled; if that information is not explicitly known, the HQ country of the fund’s general partner is used. Only funds based in the United States that have held their final close are included in the fundraising numbers. The entirety of a fund’s committed capital is attributed to the year of the final close of the fund. Interim close amounts are not recorded in the year of the interim close.
Deals We include equity investments into startup companies from an outside source. Investment does not necessarily have to be taken from an institutional investor. This can include investment from individual angel investors, angel groups, seed funds, VC firms, corporate venture firms, and corporate investors. Investments received as part of an accelerator program are not included, however, if the accelerator continues to invest in follow-on rounds, those further financings are included. All financings are of companies headquartered in the US. Angel & seed: We define financings as angel rounds if there are no PE or VC firms involved in the company to date and we cannot determine if any PE or VC firms are participating. In addition, if there is a press release that states the round is an angel round, it is classified as such. Finally, if a news story or press release only mentions individuals making investments in a financing, it is also classified as angel. As for seed, when the investors and/or press release state that a round is a seed financing, or it is for less than $500,000 and is the first round as reported by a government filing, it is classified as such. If angels are the only investors, then a round is only marked as seed if it is explicitly stated. Early-stage: Rounds are generally classified as Series A or B (which we typically aggregate together as early stage) either by the series of stock issued in the financing or, if that information is unavailable, by a series of factors including: the age of the company, prior financing history, company status, participating investors, and more. Late-stage: Rounds are generally classified as Series C or D or later (which we typically aggregate together as late stage) either by the series of stock issued in the financing or, if that information is unavailable, by a series of factors including: the age of the company, prior financing history, company status, participating investors, and more. Growth equity: Rounds must include at least one investor tagged as growth/expansion, while deal size must either be $15 million or more (although rounds of undisclosed size that meet all other criteria are included). In addition, the deal must be classified as growth/expansion or later-stage VC in the PitchBook Platform. If the financing is tagged as late-stage VC it is included regardless of industry. Also, if a company is tagged with any PitchBook vertical, excepting manufacturing and infrastructure, it is kept. Otherwise, the following industries are excluded from growth equity financing calculations: buildings and property, thrifts and mortgage finance, real estate investment trusts, and oil & gas equipment, utilities, exploration, production and refining. Lastly, the company in question must not have had an M&A event, buyout, or IPO completed prior to the round in question. Corporate VC: Financings classified as corporate VC include rounds that saw both firms investing via established CVC arms or corporations making equity investments off balance sheets or whatever other non-CVC method actually employed. Rounds in VC-backed companies previously tagged as just corporate investments have been added into the dataset. Capital efficiency score: Our capital efficiency score was calculated using companies that had completed an exit (IPO, M&A or PE Buyout) since 2006. The aggregate value of those exits, defined as the pre-money valuation of the exit, was then divided by the aggregate amount of VC that was invested into those companies during their time under VC backing to give a Multiple On Invested Capital (MOIC). After the average time to exit was calculated for each pool of companies, it was used to divide the MOIC figure and give us a capital efficiency score.
Exits We include the first majority liquidity event for holders of equity securities of venture-backed companies. This includes events where there is a public market for the shares (IPO) or the acquisition of majority of the equity by another entity (corporate or financial acquisition). This does not include secondary sales, further sales after the initial liquidity event, or bankruptcies. M&A value is based on reported or disclosed figures, with no estimation used to assess the value of transactions for which the actual deal size is unknown.
COPYRIGHT © 2018 by PitchBook Data, Inc. All rights reserved. No part of this publication may be reproduced in any form or by any means—graphic, electronic, or mechanical, including photocopying, recording, taping, and information storage and retrieval systems—without the express written permission of PitchBook Data, Inc. Contents are based on information from sources believed to be reliable, but accuracy and completeness cannot be guaranteed. Nothing herein should be construed as any past, current or future recommendation to buy or sell any security or an offer to sell, or a solicitation of an offer to buy any security. This material does not purport to contain all of the information that a prospective investor may wish to consider and is not to be relied upon as such or used in substitution for the exercise of independent judgment.
35 1Q 2018 PITCHBOOK-NVCA VENTURE MONITOR
Why we teamed up Meet the PitchBook-NVCA Venture Monitor
NVCA is recognized as the go-to organization for
venture capital advocacy, and the statistics we
release are the industry standard. PitchBook is
the leading data software provider for venture
capital professionals, serving more than 1,800
clients across the private market. Our partnership
with PitchBook empowers us to unlock more
insights on the venture ecosystem and better
advocate for an ever-evolving industry.
A brand-new, quarterly report that
details venture capital activity
and delivers insights to inform your
investment strategy. PitchBook’s
data will also bolster our
year-in-review publication.
The PitchBook Platform
Help us help you
More data. Less dough.
T H E P E R K S O F P A R T N E R S H I P
As an NVCA member, your free access to the
PitchBook Platform includes five advanced
searches and five profile views per month.
We will email quarterly surveys to each
member firm, which will give you the
opportunity to report your activity to
PitchBook. The data you provide will
not only power PitchBook-NVCA reports,
but also ensure your firm is represented
accurately in the PitchBook Platform. If
you’d like to send your quarterly activity
report directly to PitchBook, email
Our members get 10% off a new subscription
to the PitchBook Platform (up to a
$10,000 value) or one free, additional seat.
If your firm was a PitchBook client prior
to September 14, 2016, you’re eligible for
one of these discounts the next time you
renew your contract.
The 411 on the PitchBook and National Venture Capital Association (NVCA) partnership
Fundraise faster with targeted searches for
limited partners who will likely be interested
in your fund.
Conduct better due diligence by diving deep
into a company’s round-by-round financing
history, executive team and market traction.
Price deals with confidence using pre- and
post-money valuations, public and private
comps, cap tables and series terms.
Find promising investors quickly by zeroing
in on other firms or strategic acquirers
whose investment preferences match your
portfolio company.
PitchBook Data, Inc. | 206.623.1986 | pitchbook.com/nvca National Venture Capital Association | 202.864.5920 | nvca.org
Ready to get started with the PitchBook Platform? Go to pitchbook.com/nvca