1/71 statistics inferences about population variances
Post on 19-Dec-2015
225 views
TRANSCRIPT
1/71
Statistics
Inferences About Population Variances
Contents Inference about a Population Variance Inferences about the Variances of Two
Populations

STATISTICS in PRACTICE
The U.S. General Accounting
Office (GAO) evaluators studied
a Department of Interior program
established to help clean up the
nation’s rivers and lakes. The audits reviewed sample data on the
oxygen content, the pH level, and the amount of suspended solids in the effluent.
STATISTICS in PRACTICE
The hypothesis test was conducted about the variance in pH level for the population of effluent. The population variance in pH level expected at a properly functioning plant.
In this chapter you will learn how to conduct statistical inferences about the variances of one and two populations.
Inferences About a Population Variance
Chi-Square Distribution(2) Interval Estimation of 2
Hypothesis Testing
Chi-Square Distribution
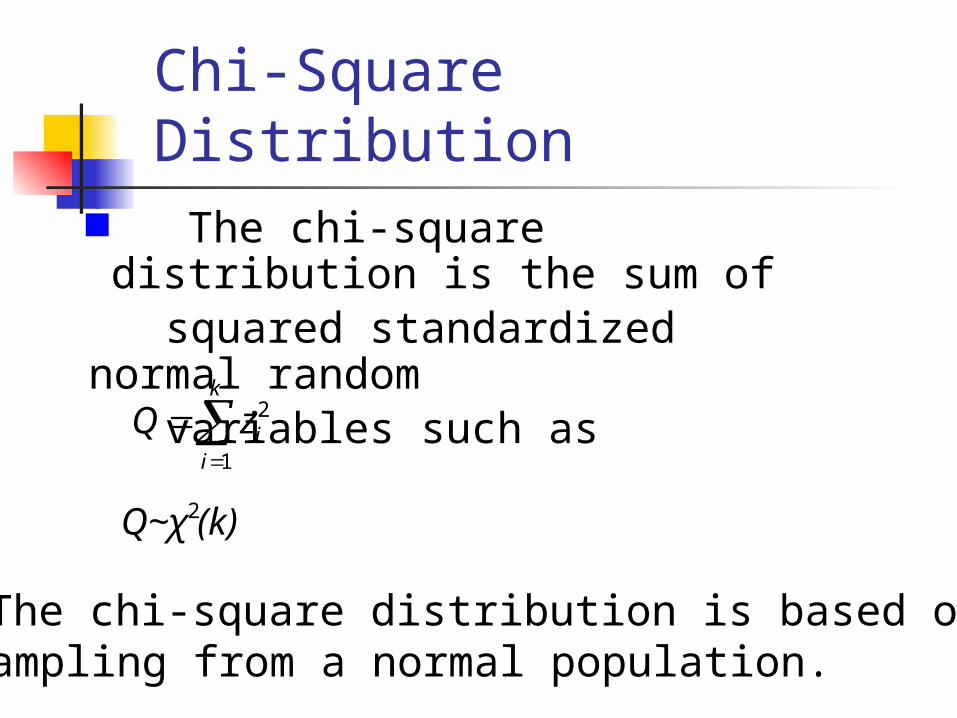
The chi-square distribution is based on sampling from a normal population.
The chi-square distribution is the sum of squared standardized normal random variables such as
k
iizQ
1
2
(k)Q~χ 2
Chi-Square Distribution
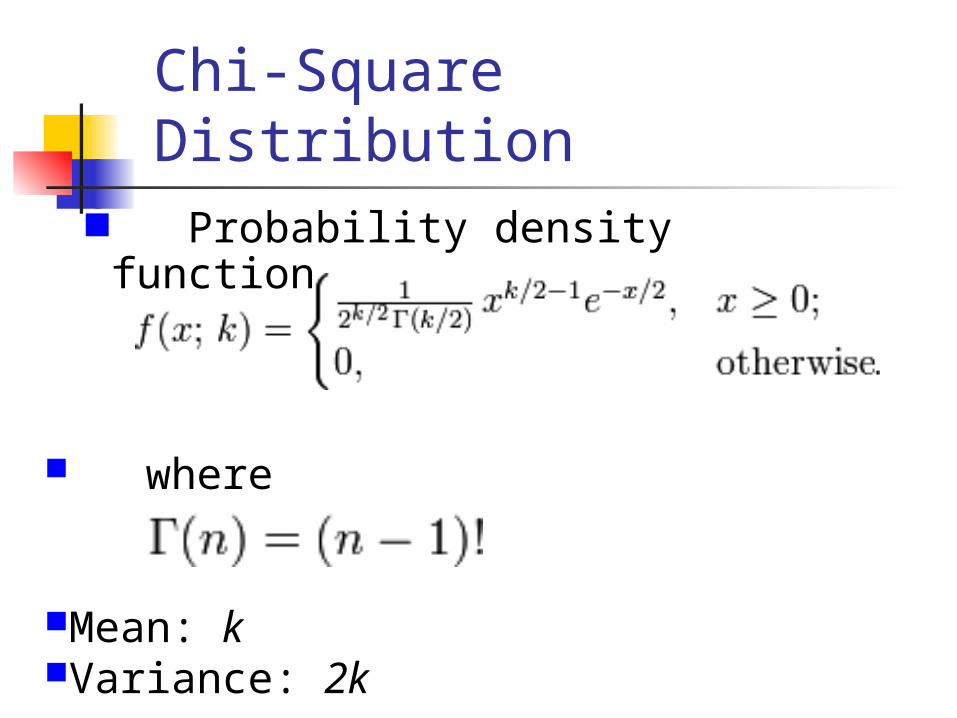
where
Mean: kVariance: 2k
Probability density function
Chi-Square Distribution
We can use the chi-square distribution to develop interval estimates and conduct hypothesis tests about a population variance.
The sampling distribution of (n - 1)s2/ 2 has a chi-square distribution whenever a simplerandom sample of size n is selected from a normal population.
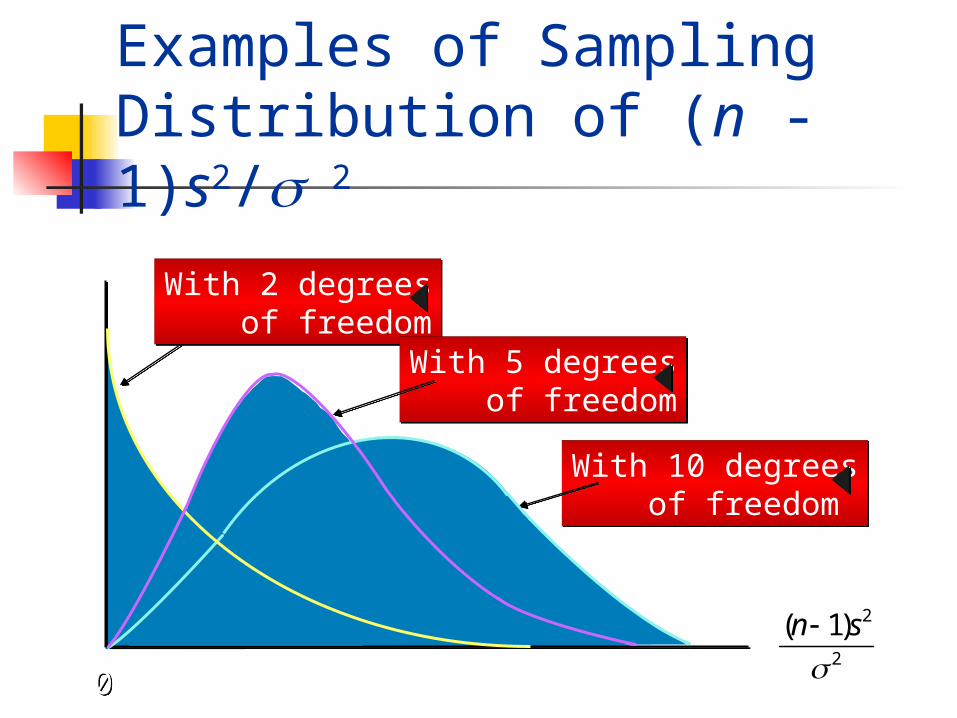
Examples of Sampling Distribution of (n - 1)s2/ 2
00
With 2 degrees of freedomWith 2 degrees of freedom
2
2
( 1)n s
With 5 degrees of freedomWith 5 degrees of freedom
With 10 degrees of freedomWith 10 degrees of freedom
2 2 2.975 .025
Chi-Square Distribution
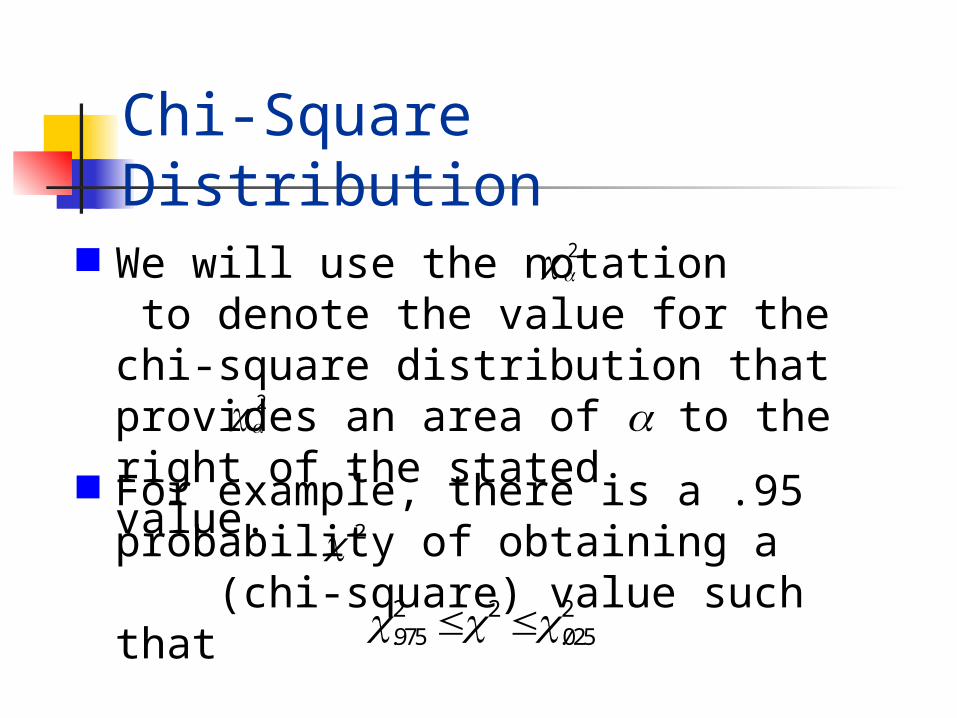
For example, there is a .95 probability of obtaining a (chi-square) value such that2
We will use the notation to denote the value for the chi-square distribution that provides an area of a to the right of the stated value.
2
2

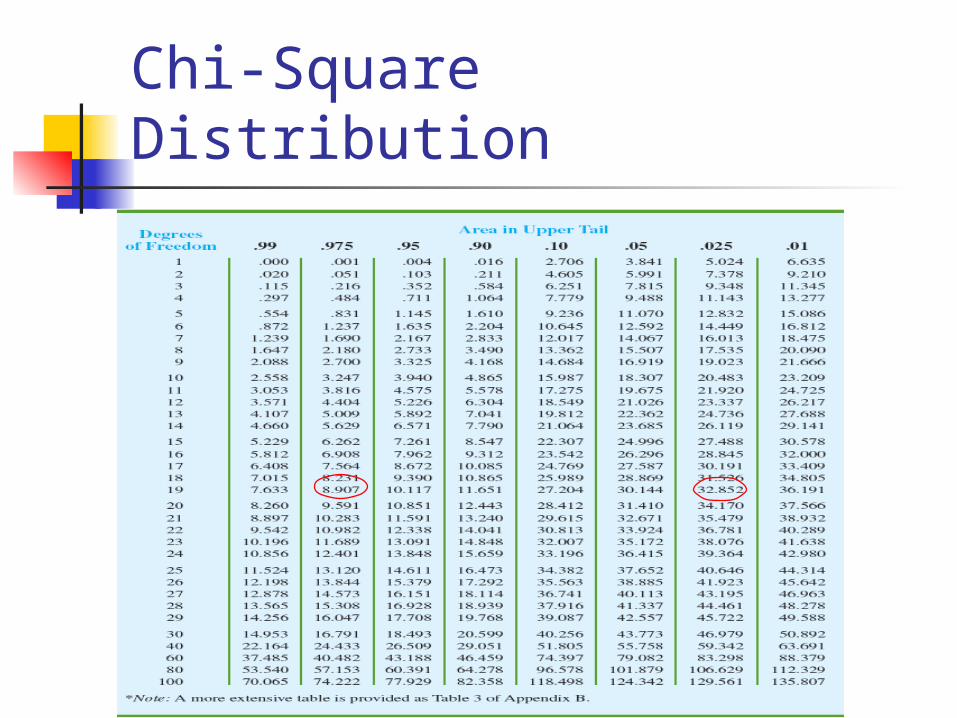
Chi-Square Distribution A Chi-Square Distribution with 19 Degrees
of Freedom
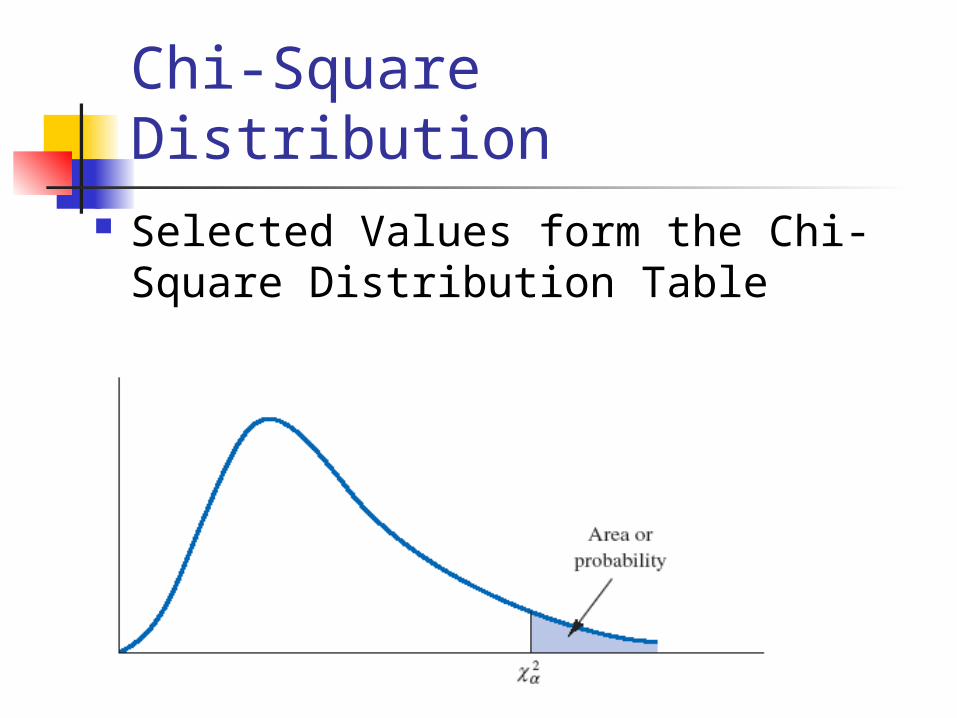
Chi-Square Distribution Selected Values form the Chi-Square
Distribution Table
Chi-Square Distribution
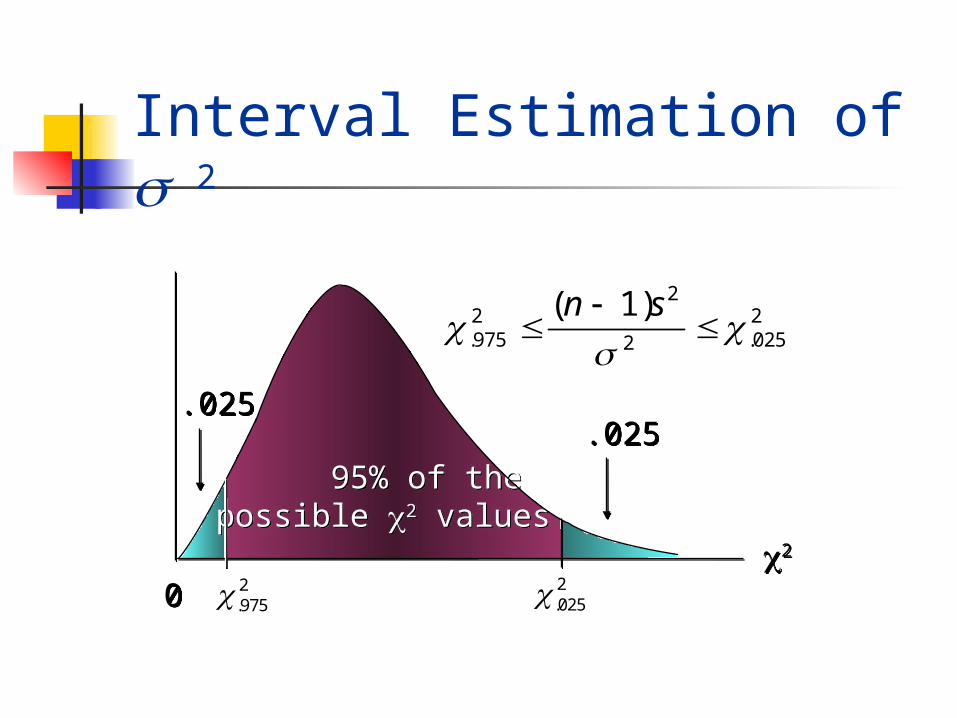
95% of thepossible 2 values 95% of thepossible 2 values
22
00
.025.025
2.025
.025.025
2.975
Interval Estimation of 2
22 2.975 .0252
( 1)n s

Interval Estimation of 2
22 2(1 / 2) / 22
( 1)n s
Substituting (n – 1)s2/ s 2 for the c2 we get
Performing algebraic manipulation we get
2)2/1(
22
22/
2 )1()1(
snsn
There is a (1 – a) probability of obtaining a c2 value such that
22/
22)2/1(
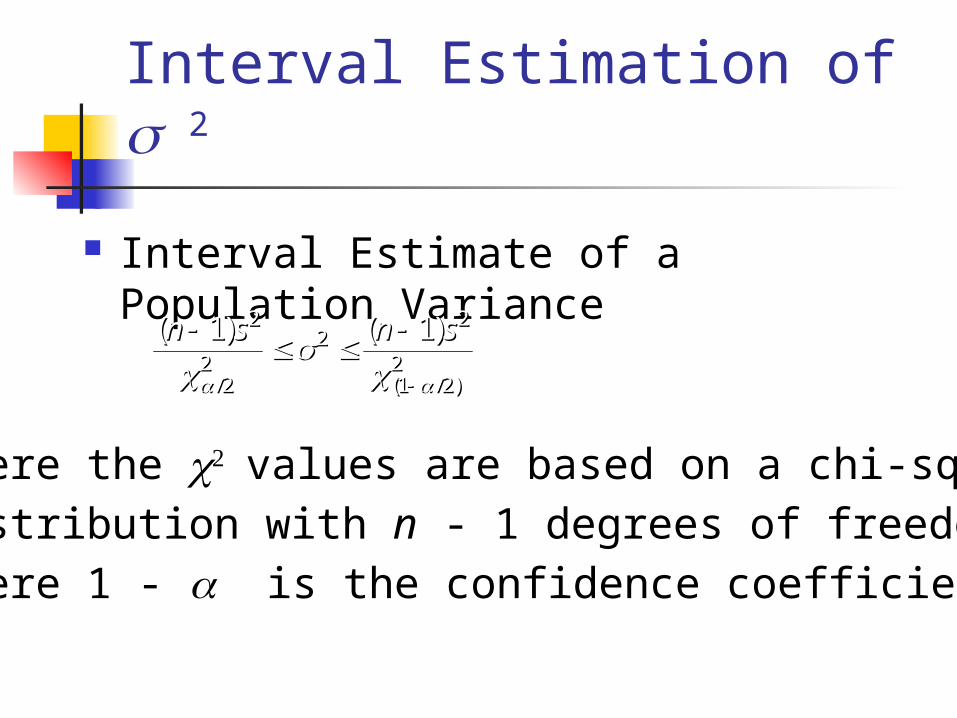
Interval Estimate of a Population Variance
Interval Estimation of 2
( ) ( )
/ ( / )
n s n s
1 12
22
22
1 22
( ) ( )
/ ( / )
n s n s
1 12
22
22
1 22
where the values are based on a chi-square
distribution with n - 1 degrees of freedom and
where 1 - is the confidence coefficient.
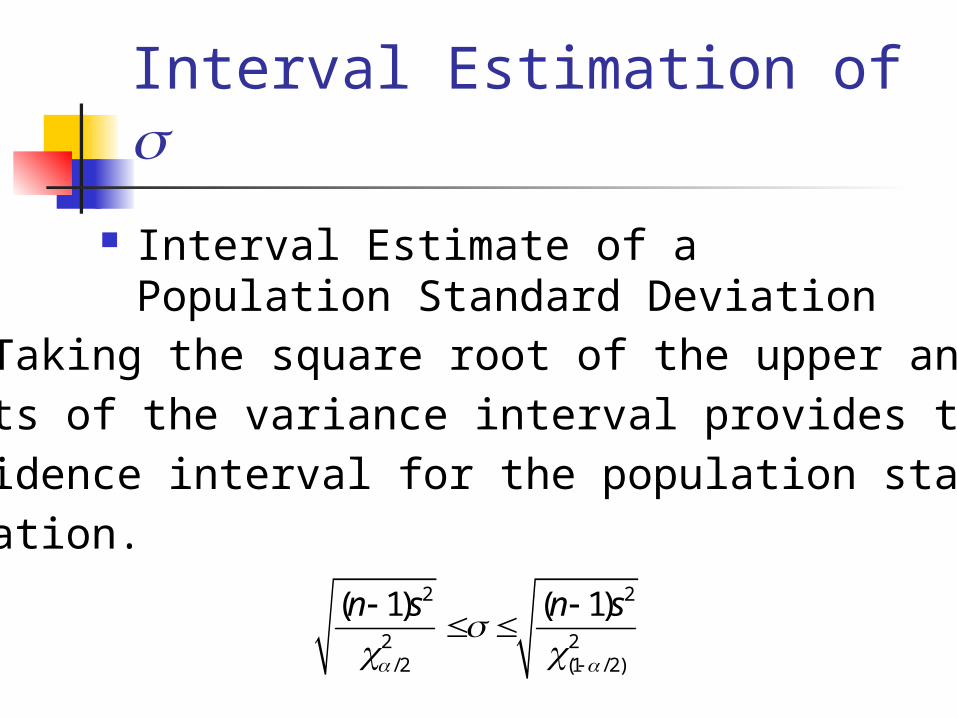
Interval Estimation of Interval Estimate of a Population Standard
Deviation Taking the square root of the upper and lower
limits of the variance interval provides the
confidence interval for the population standard
deviation.2 2
2 2/ 2 (1 / 2)
( 1) ( 1)n s n s

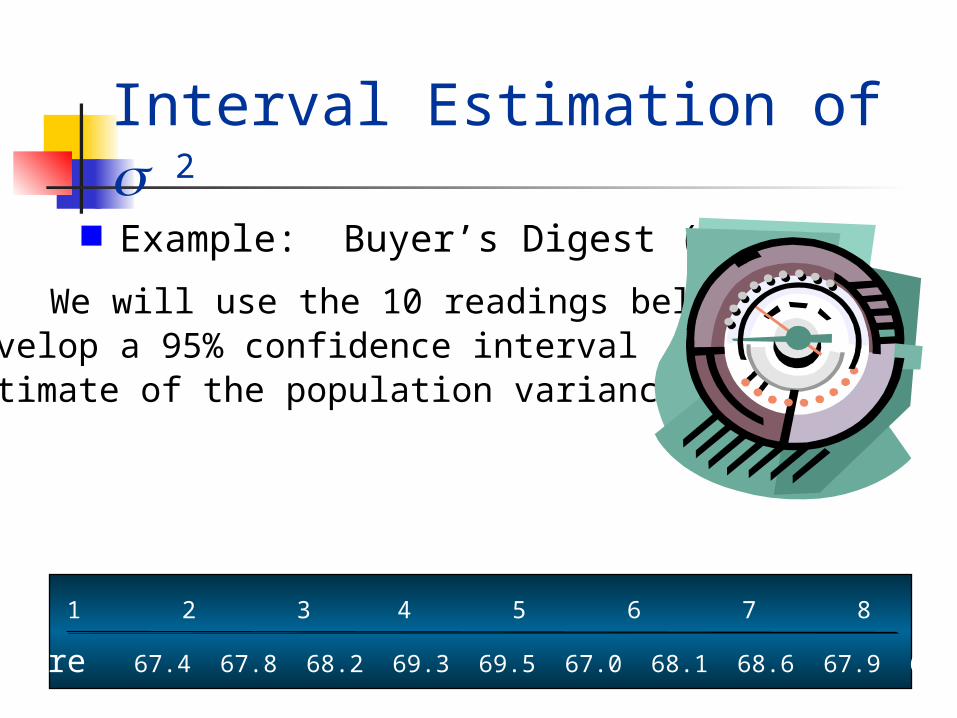
Buyer’s Digest rates thermostats manufactured
for home temperature control. In a recent test, 10
thermostats manufactured by The rmoRite were
selected and placed in a test room that
was maintained at a temperature of 68oF.
The temperature readings of the ten thermostats
are shown on the next slide.
Interval Estimation of 2
Example: Buyer’s Digest (A)
Interval Estimation of 2
We will use the 10 readings below todevelop a 95% confidence intervalestimate of the population variance.
Example: Buyer’s Digest (A)
Temperature 67.4 67.8 68.2 69.3 69.5 67.0 68.1 68.6 67.9 67.2
Thermostat 1 2 3 4 5 6 7 8 9 10

Degrees
of Freedom .99 .975 .95 .90 .10 .05 .025 .01
5 0.554 0.831 1.145 1.610 9.236 11.070 12.832 15.0866 0.872 1.237 1.635 2.204 10.645 12.592 14.449 16.8127 1.239 1.690 2.167 2.833 12.017 14.067 16.013 18.4758 1.647 2.180 2.733 3.490 13.362 15.507 17.535 20.0909 2.088 2.700 3.325 4.168 14.684 16.919 19.023 21.666
10 2.558 3.247 3.940 4.865 15.987 18.307 20.483 23.209
Area in Upper Tail
Selected Values from the Chi-Square Distribution Table
Our value Our value
2.975
For n - 1 = 10 - 1 = 9 d.f. and a = .05
Interval Estimation of 2
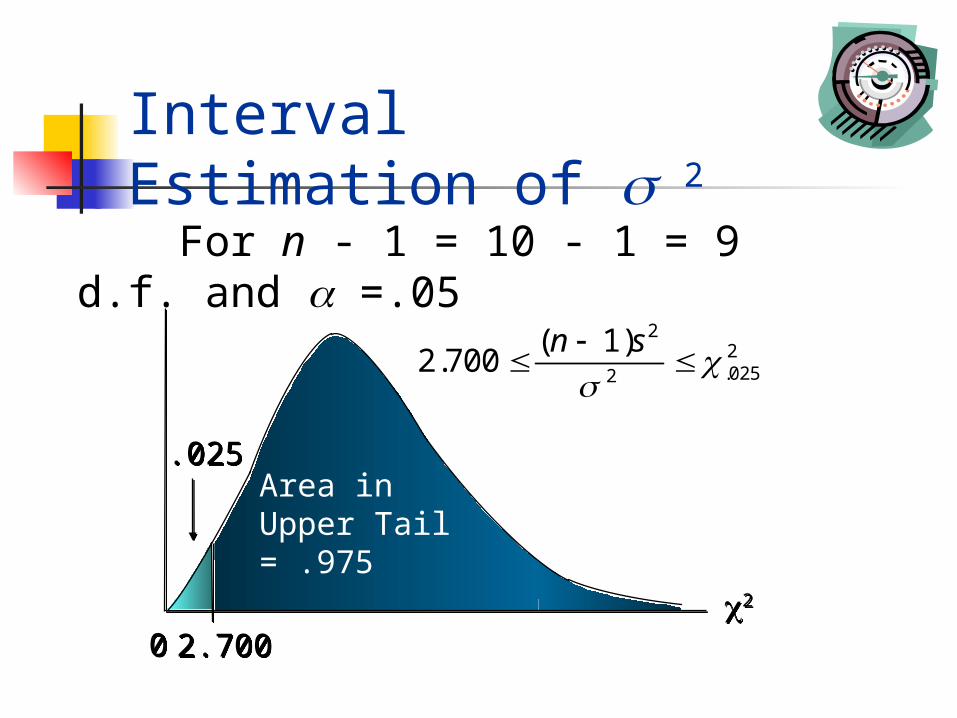
22
00
.025.025
2
2.0252
( 1)2.700
n s
Area inUpper Tail= .975
2.7002.700
For n - 1 = 10 - 1 = 9 d.f. and a =.05
Interval Estimation of 2

Degrees
of Freedom .99 .975 .95 .90 .10 .05 .025 .01
5 0.554 0.831 1.145 1.610 9.236 11.070 12.832 15.0866 0.872 1.237 1.635 2.204 10.645 12.592 14.449 16.8127 1.239 1.690 2.167 2.833 12.017 14.067 16.013 18.4758 1.647 2.180 2.733 3.490 13.362 15.507 17.535 20.0909 2.088 2.700 3.325 4.168 14.684 16.919 19.023 21.666
10 2.558 3.247 3.940 4.865 15.987 18.307 20.483 23.209
Area in Upper Tail
Selected Values from the Chi-Square Distribution Table
For n - 1 = 10 - 1 = 9 d.f. and a = .05
Our value Our value
2.025
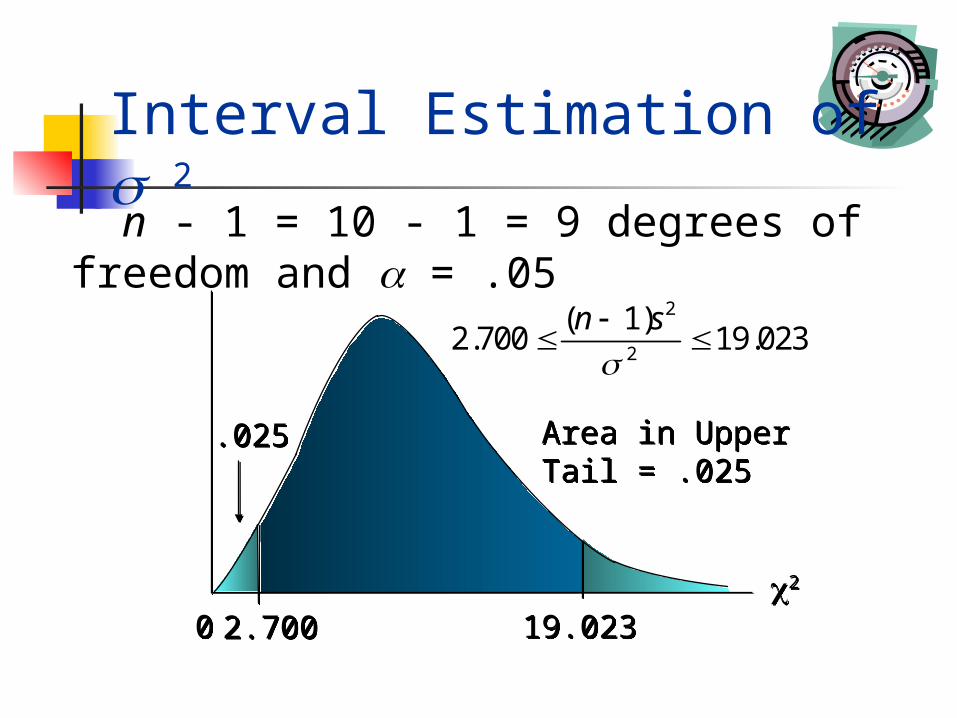
Interval Estimation of 2
22
00
.025.025
2.7002.700
n - 1 = 10 - 1 = 9 degrees of freedom and a = .05
2
2
( 1)2.700 19.023
n s
19.02319.023
Area in UpperTail = .025Area in UpperTail = .025
Interval Estimation of 2
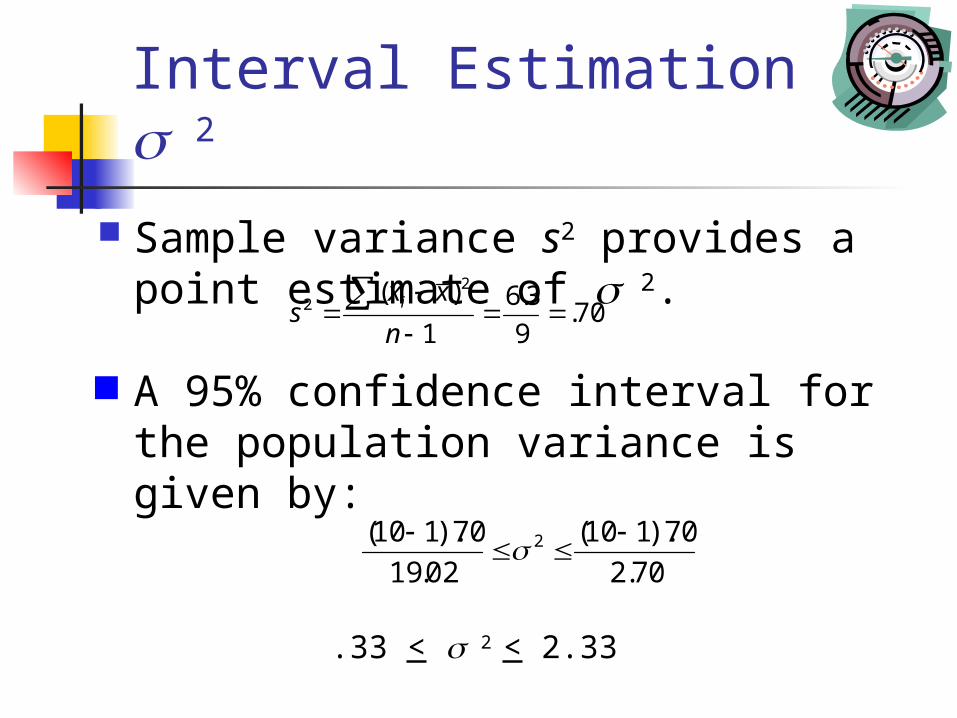
Sample variance s2 provides a point estimate of 2.
Interval Estimation of 2
.33 < 2 < 2.33
70.9
3.6
1
)( 22
n
xxs i
A 95% confidence interval for the population variance is given by:
70.2
70).110(
02.19
70).110( 2
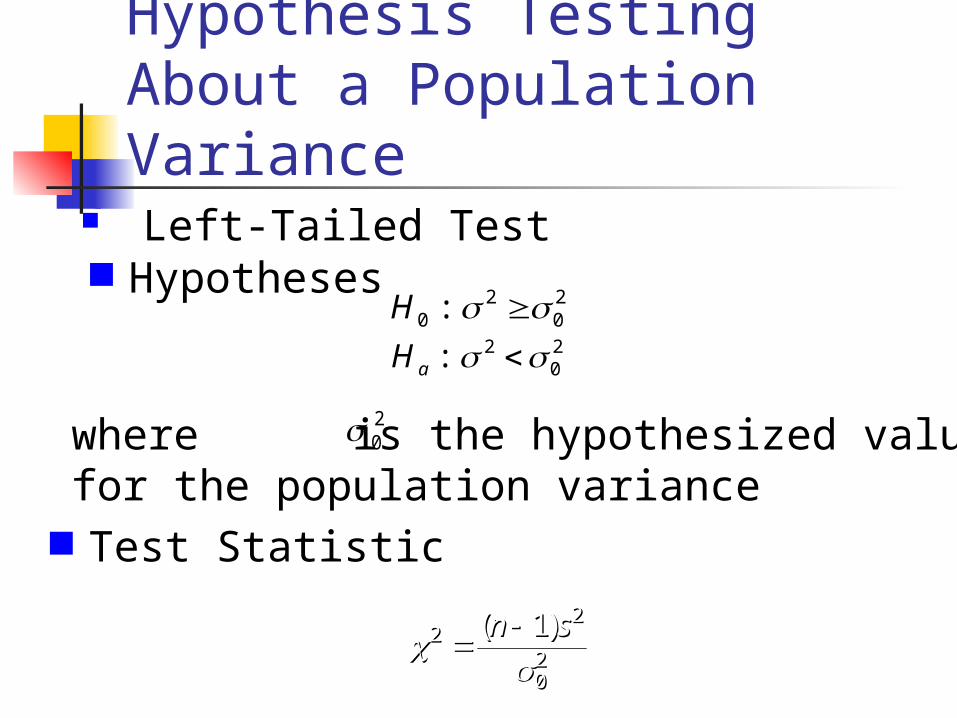
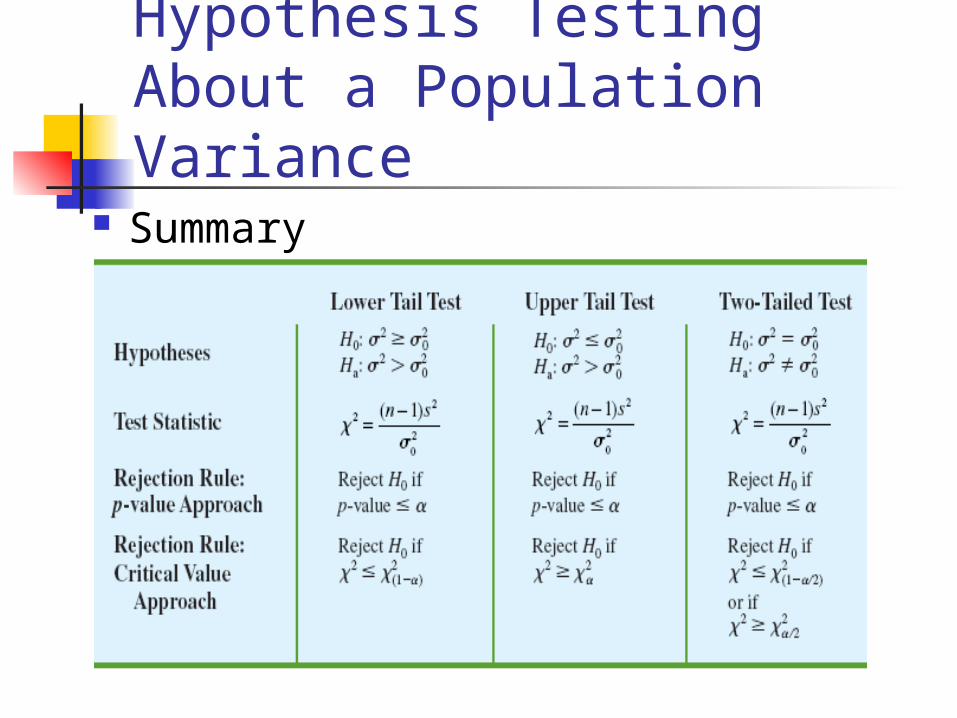
Left-Tailed Test
Hypothesis TestingAbout a Population Variance
22
02
1 ( )n s
22
02
1 ( )n s
Test Statistic
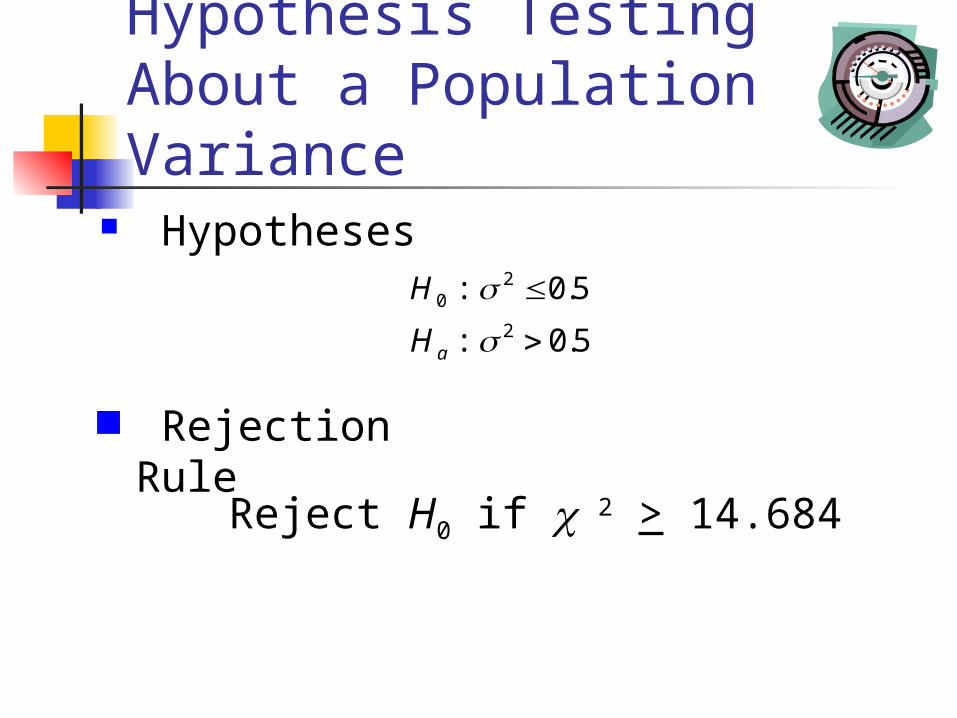
Hypotheses 2 20 0: H
2 20: aH
where is the hypothesized valuefor the population variance
20
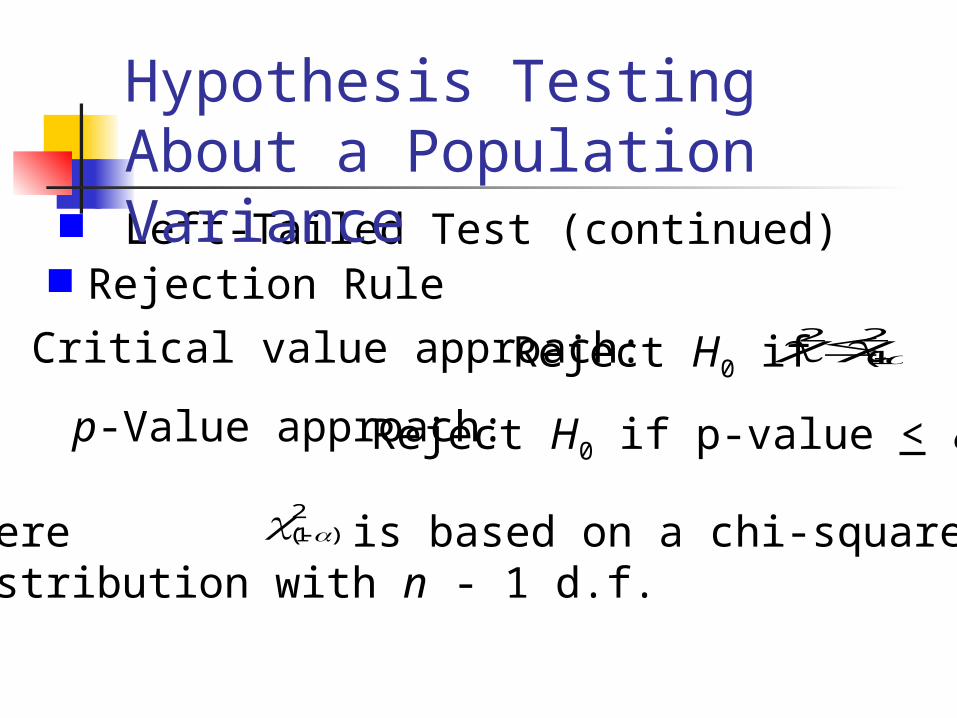
where is based on a chi-squaredistribution with n - 1 d.f.
2)1(
Left-Tailed Test (continued)
Reject H0 if p-value < ap-Value approach:
Critical value approach:
Rejection Rule
Reject H0 if2 2
(1 )
Hypothesis TestingAbout a Population Variance

Right-Tailed Test
H02
02: H0
202:
Ha : 202Ha : 202
22
02
1 ( )n s
22
02
1 ( )n s
Test Statistic
Hypotheses
where is the hypothesized valuefor the population variance
20
Hypothesis TestingAbout a Population Variance
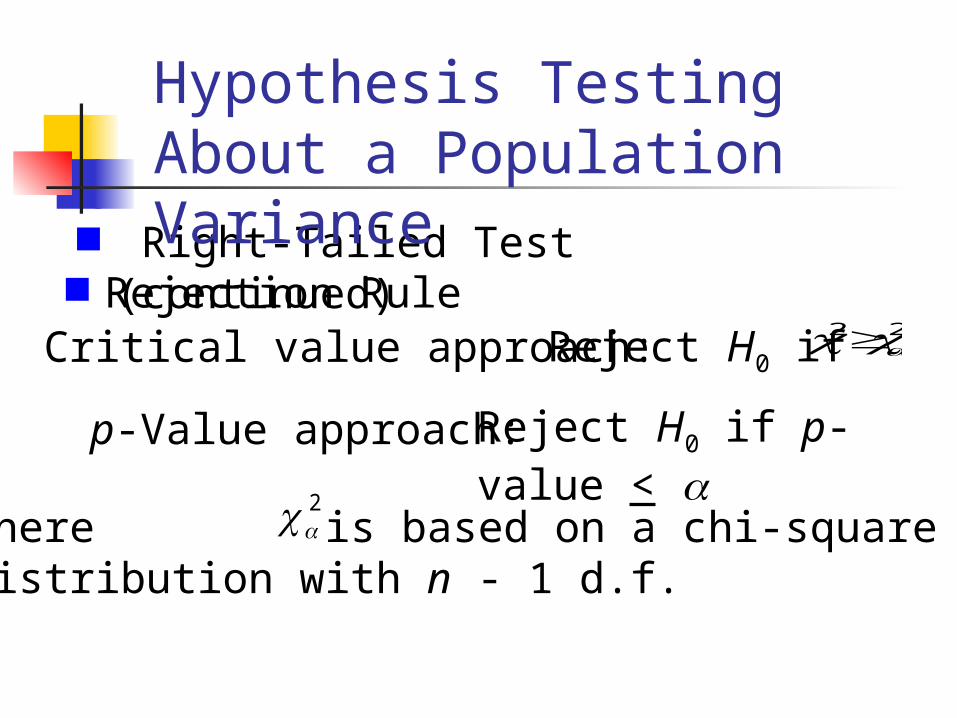
Reject H0 if2 2
Right-Tailed Test (continued)
Reject H0 if p-value < ap-Value approach:
Critical value approach:
Rejection Rule
where is based on a chi-squaredistribution with n - 1 d.f.
2
Hypothesis TestingAbout a Population Variance
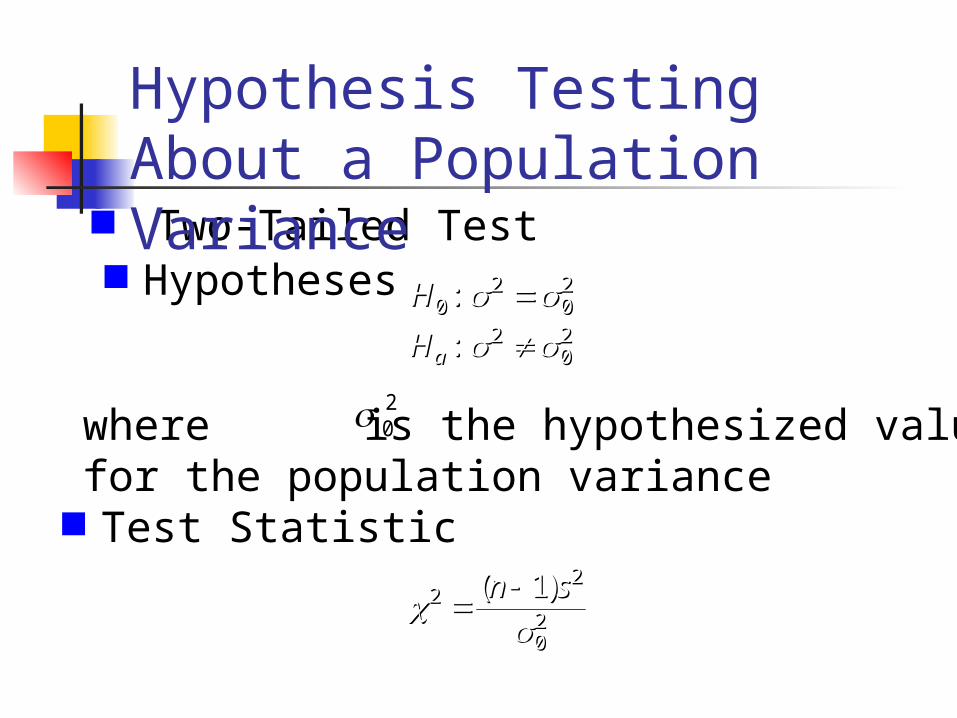
Two-Tailed Test
22
02
1 ( )n s
22
02
1 ( )n s
Test Statistic
Hypotheses
Ha : 202Ha : 202
H02
02: H0
202:
where is the hypothesized valuefor the population variance
20
Hypothesis TestingAbout a Population Variance
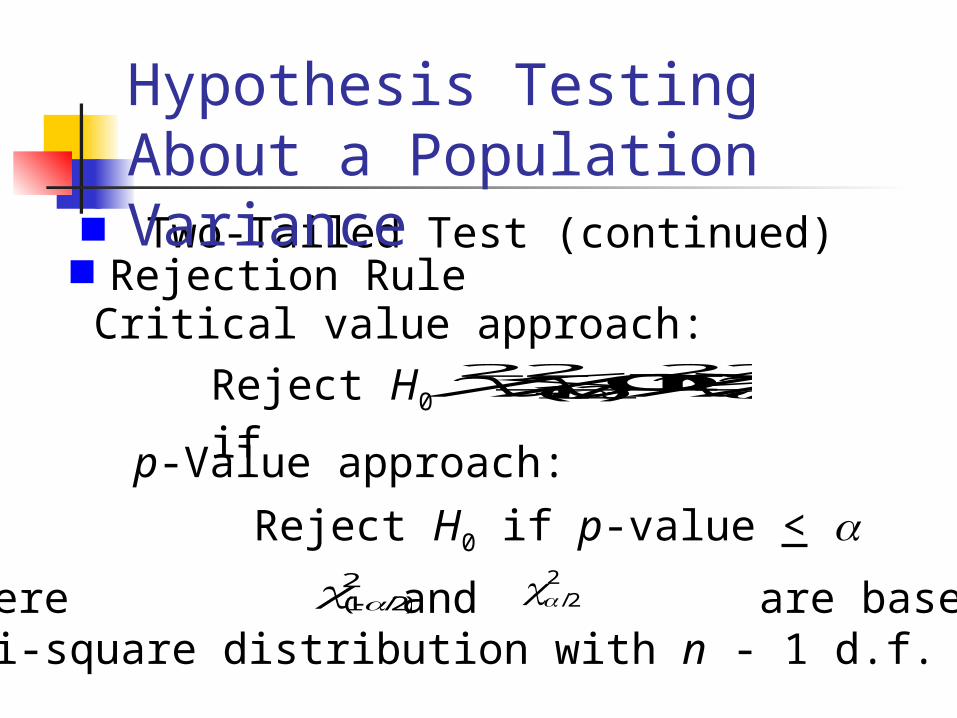
Two-Tailed Test (continued)
Reject H0 if p-value < ap-Value approach:
Critical value approach: Rejection Rule
Reject H0 if2 2 2 2
(1 / 2) / 2 or
where and are based on achi-square distribution with n - 1 d.f.
2)2/1(
22/
Hypothesis TestingAbout a Population Variance
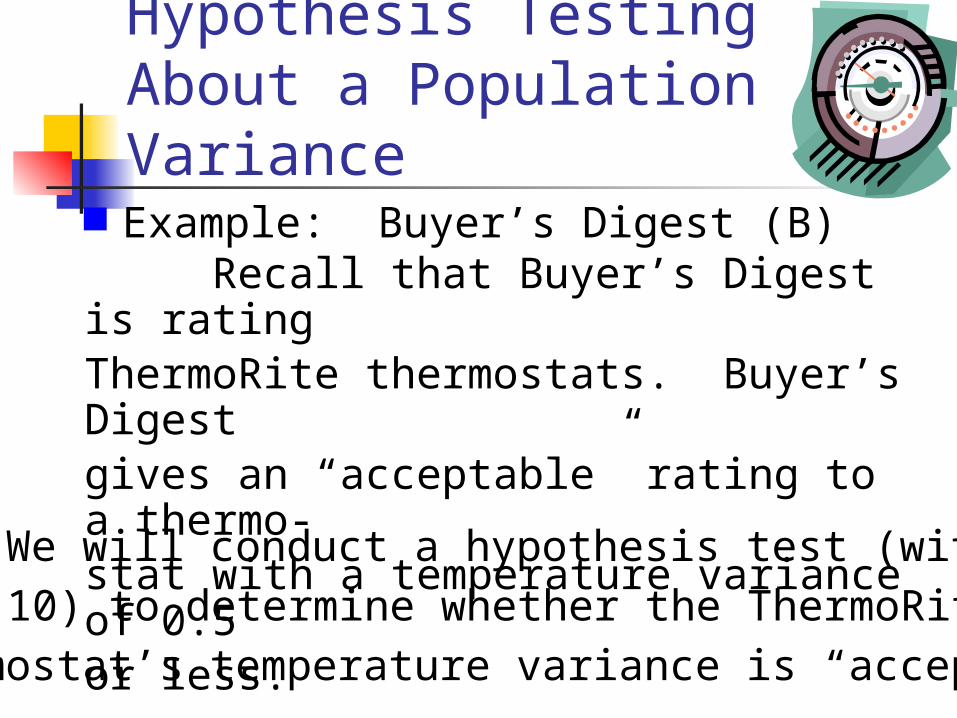
Recall that Buyer’s Digest is ratingThermoRite thermostats. Buyer’s Digestgives an “acceptable” rating to a thermo-stat with a temperature variance of 0.5or less.
Example: Buyer’s Digest (B)
We will conduct a hypothesis test (with
a = .10) to determine whether the ThermoRite
thermostat’s temperature variance is “acceptable”.
Hypothesis TestingAbout a Population Variance

Using the 10 readings, we will
conduct a hypothesis test (with a = .10)
to determine whether the ThermoRite
thermostat’s temperature variance is
“acceptable”.
Example: Buyer’s Digest (B)
Temperature 67.4 67.8 68.2 69.3 69.5 67.0 68.1 68.6 67.9 67.2
Thermostat 1 2 3 4 5 6 7 8 9 10
Hypothesis TestingAbout a Population Variance
Hypotheses2
0 : 0.5H 2: 0.5aH
Reject H0 if c 2 > 14.684
Rejection Rule
Hypothesis TestingAbout a Population Variance
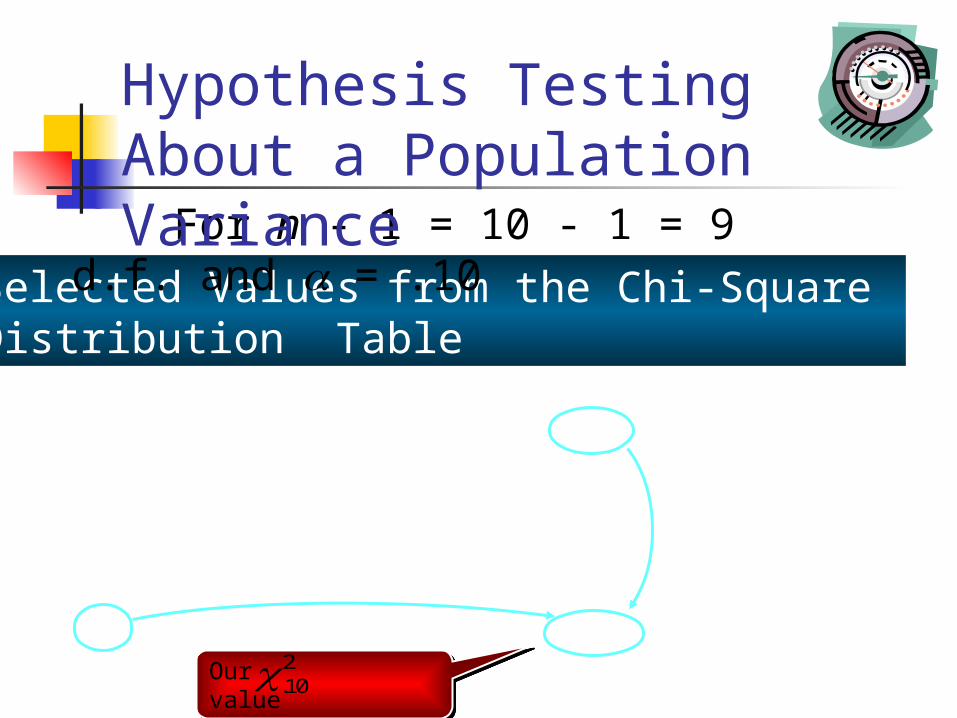
Degrees
of Freedom .99 .975 .95 .90 .10 .05 .025 .01
5 0.554 0.831 1.145 1.610 9.236 11.070 12.832 15.0866 0.872 1.237 1.635 2.204 10.645 12.592 14.449 16.8127 1.239 1.690 2.167 2.833 12.017 14.067 16.013 18.4758 1.647 2.180 2.733 3.490 13.362 15.507 17.535 20.0909 2.088 2.700 3.325 4.168 14.684 16.919 19.023 21.666
10 2.558 3.247 3.940 4.865 15.987 18.307 20.483 23.209
Area in Upper Tail
Selected Values from the Chi-Square Distribution Table
For n - 1 = 10 - 1 = 9 d.f. and a = .10
Our value Our value 2.10
Hypothesis TestingAbout a Population Variance
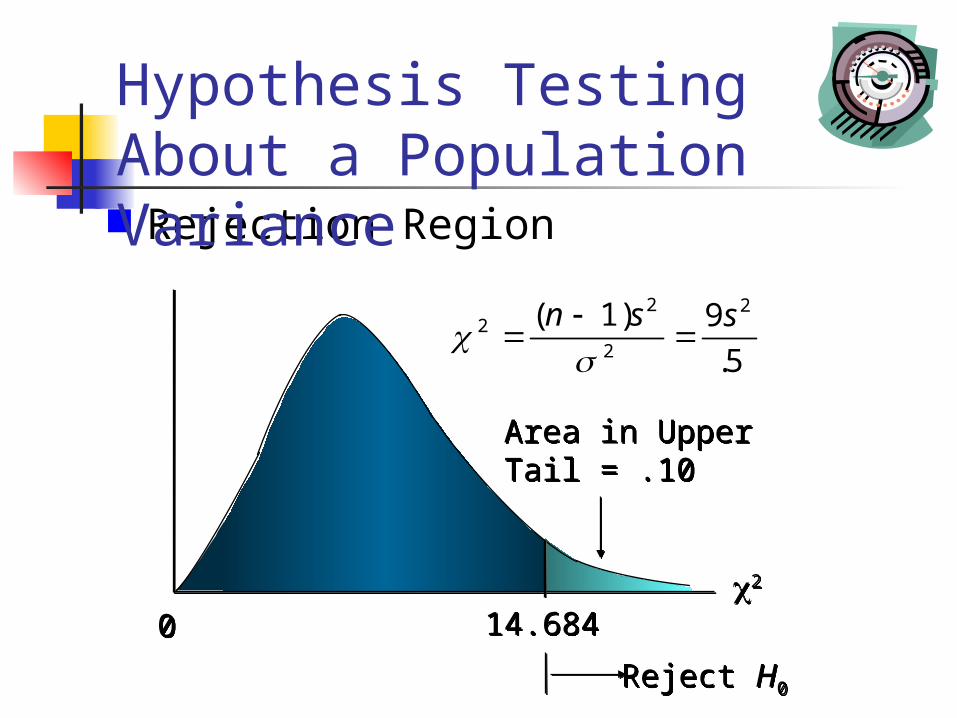
22
00 14.68414.684
Area in UpperTail = .10Area in UpperTail = .10
Rejection Region
2 22
2
( 1) 9.5
n s s
Reject H0Reject H0
Hypothesis TestingAbout a Population Variance
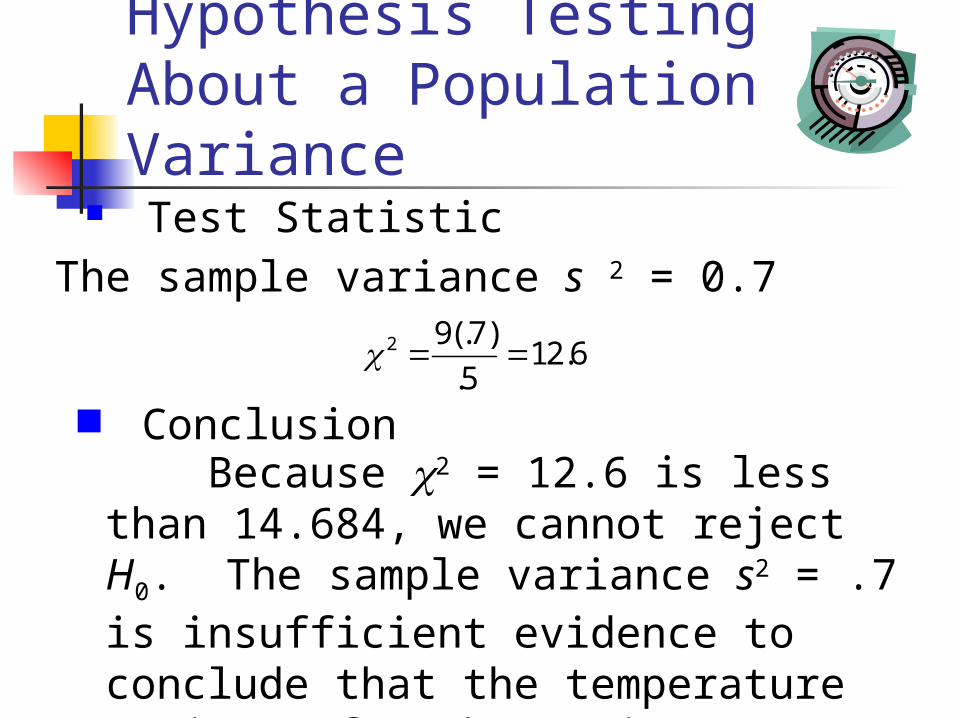
Test Statistic
2 9(.7)12.6
.5
Because c2 = 12.6 is less than 14.684, we cannot reject H0. The sample variance s2 = .7 is insufficient evidence to conclude that the temperature variance for ThermoRite thermostats is unacceptable.
Conclusion
The sample variance s 2 = 0.7
Hypothesis TestingAbout a Population Variance

• The rejection region for the ThermoRite thermostat example is in the upper tail; thus, the appropriate p-value is less than .90 (c 2 = 4.168) and greater than .10 (c 2 = 14.684).
Using Excel to Conduct a Hypothesis Testabout a Population Variance
Using the p-Value
• The sample variance of s 2 = .7 is insufficient evidence to conclude that the temperature variance is unacceptable (>.5).
• Because the p –value > a = .10, we cannot reject the null hypothesis.
Hypothesis TestingAbout a Population Variance
Summary
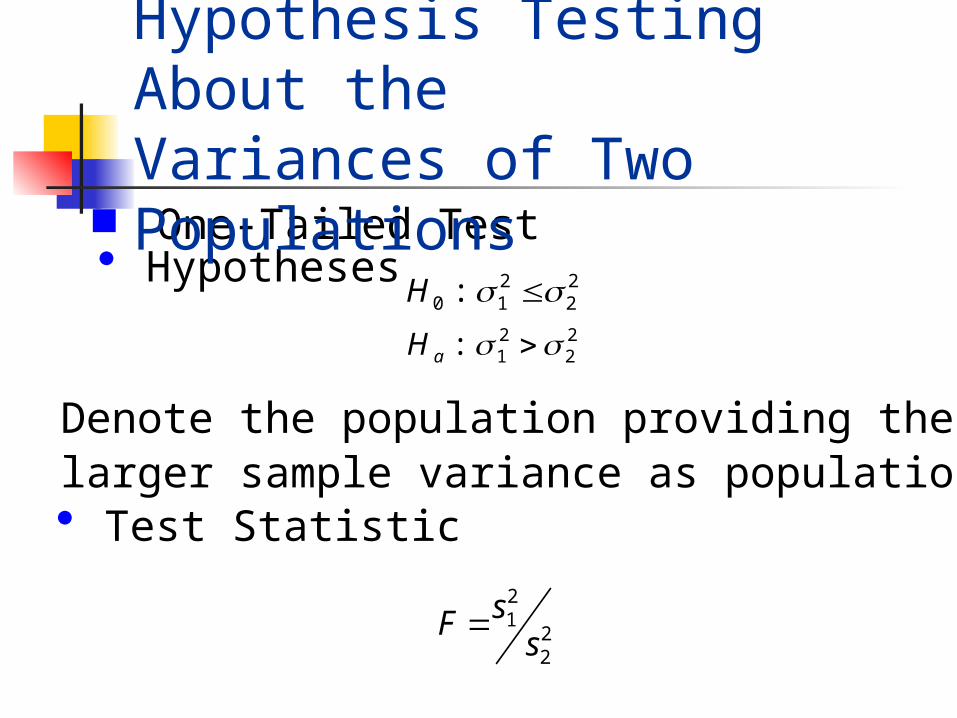
One-Tailed Test
• Test Statistic
• Hypotheses
Hypothesis Testing About theVariances of Two Populations
Denote the population providing thelarger sample variance as population 1.
2 20 1 2: H
2 21 2: aH
21
22
sFs
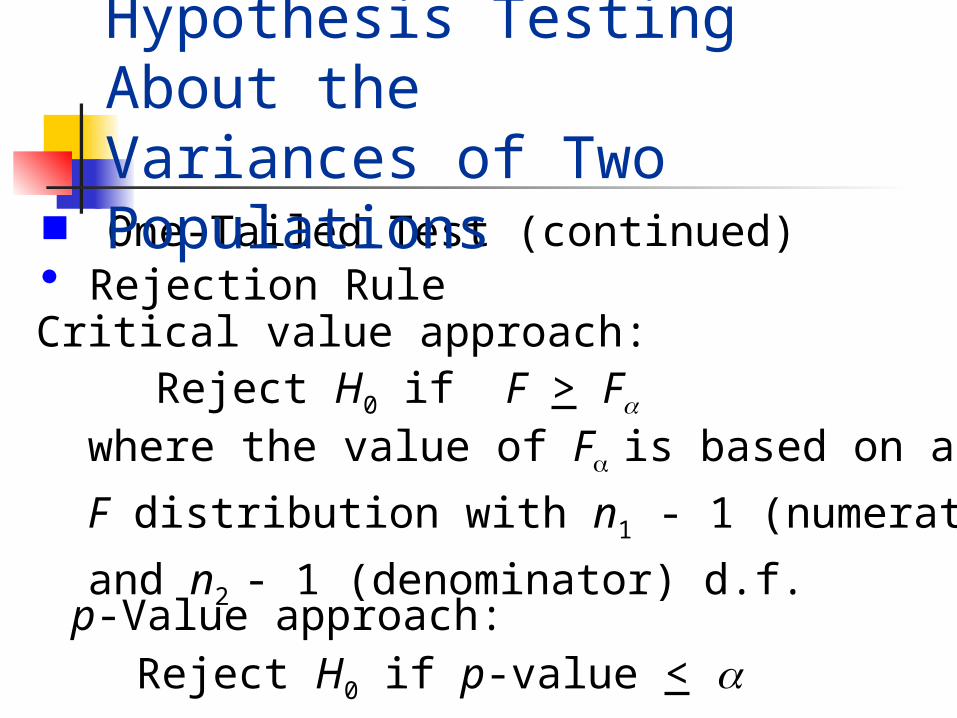
Reject H0 if F > F
One-Tailed Test (continued)
Reject H0 if p-value < a
where the value of F is based on an
F distribution with n1 - 1 (numerator)
and n2 - 1 (denominator) d.f.p-Value approach:
Critical value approach:• Rejection Rule
Hypothesis Testing About theVariances of Two Populations
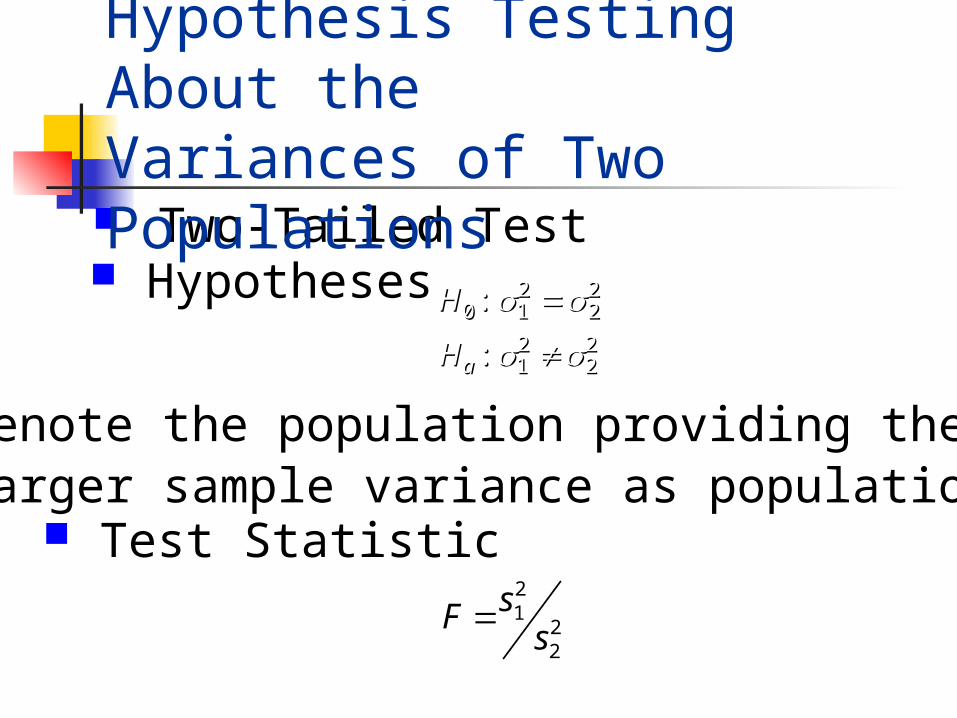
Two-Tailed Test
Test Statistic
Hypotheses H0 12
22: H0 1
222:
Ha : 12
22Ha : 1
222
Denote the population providing thelarger sample variance as population 1.
21
22
sFs
Hypothesis Testing About theVariances of Two Populations
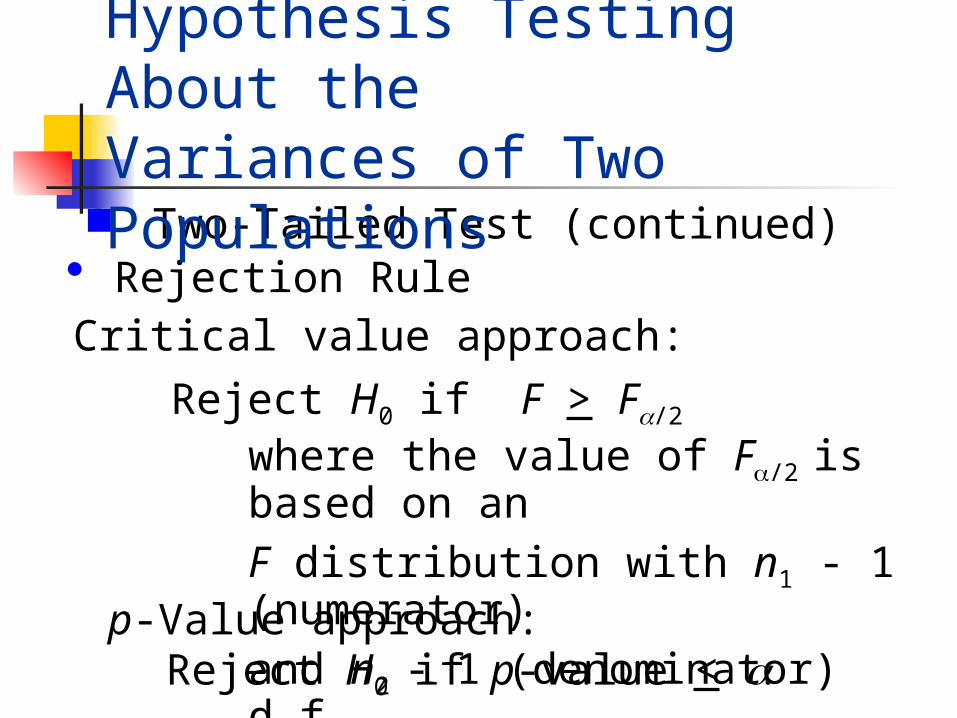
Two-Tailed Test (continued)
Reject H0 if p-value < ap-Value approach:
Critical value approach:
• Rejection Rule
Reject H0 if F > F/2
where the value of F/2 is based on an
F distribution with n1 - 1 (numerator)
and n2 - 1 (denominator) d.f.
Hypothesis Testing About theVariances of Two Populations

F Distribution

F Distribution
Probability density function
where
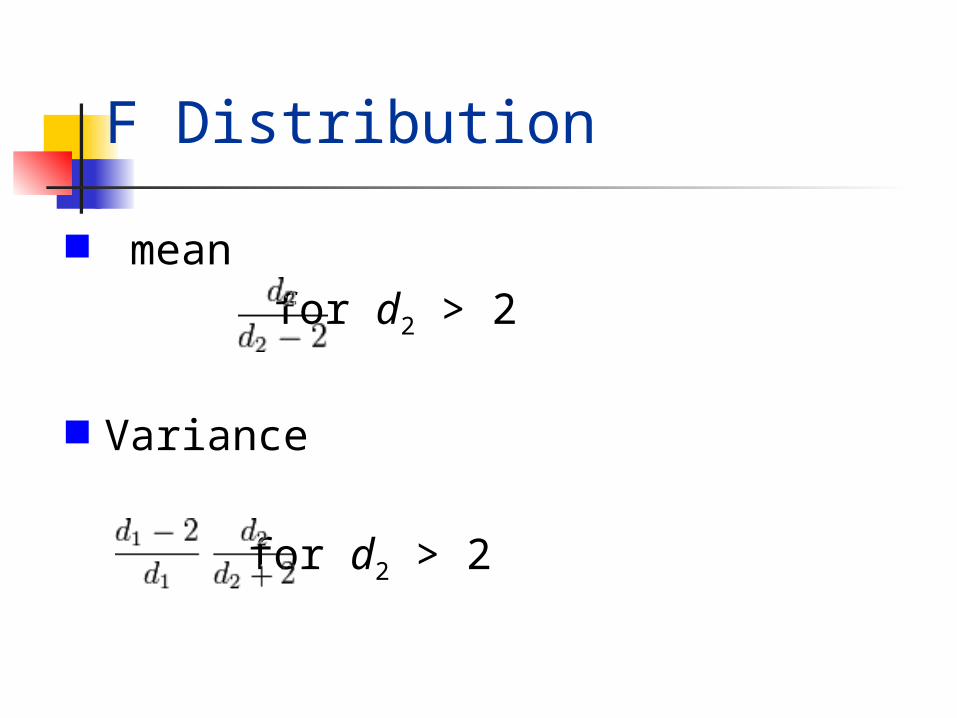
F Distribution
mean for d2 > 2
Variance
for d2 > 2
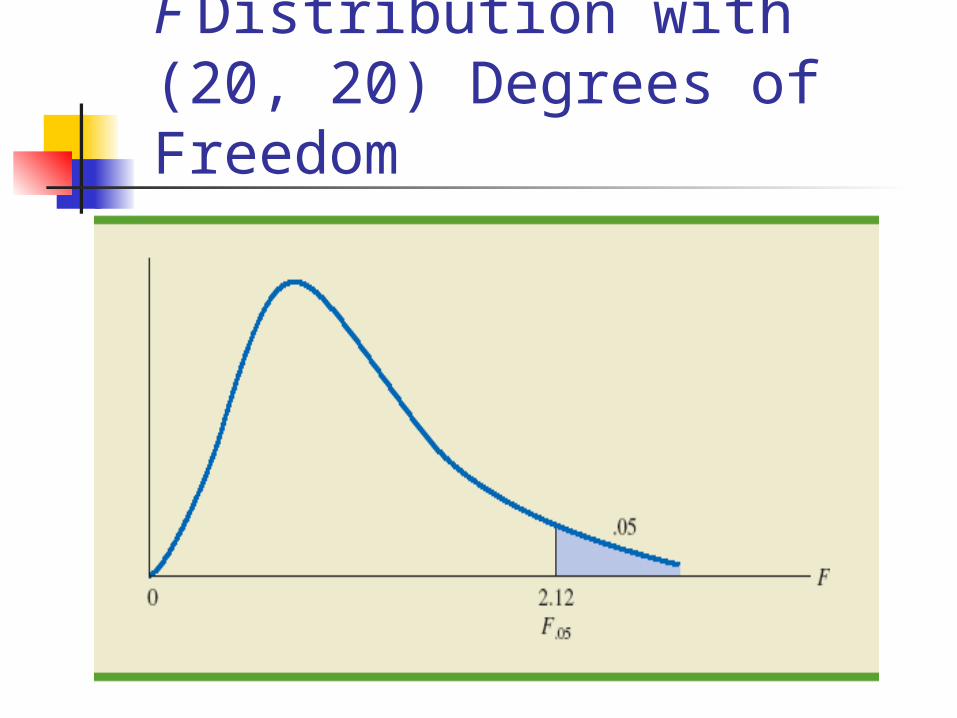
F Distribution with (20, 20) Degrees of Freedom
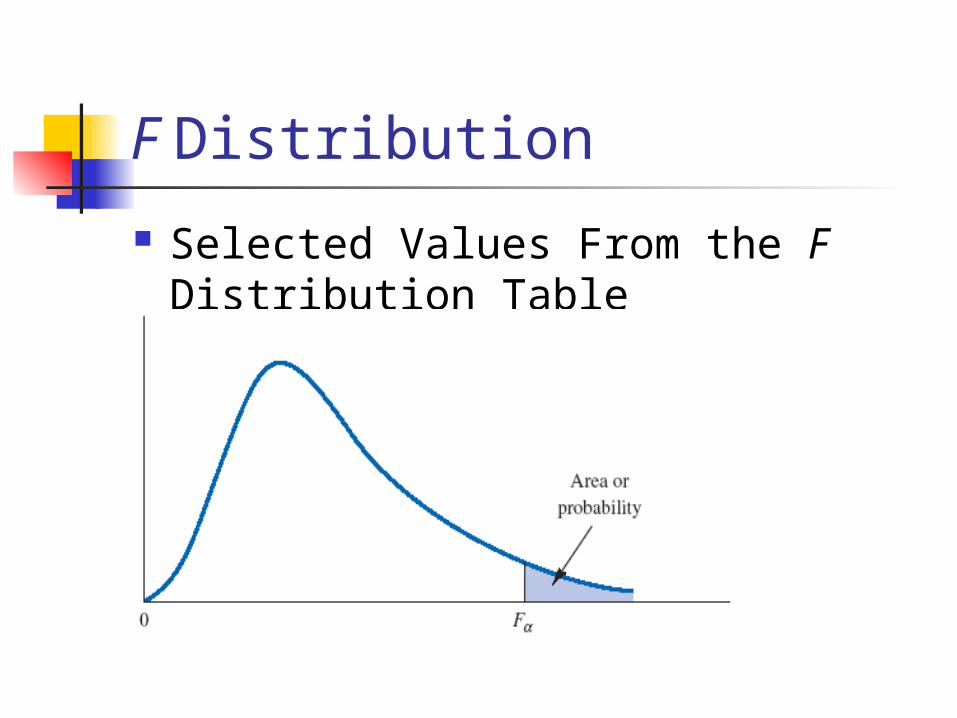
F Distribution
Selected Values From the F Distribution Table
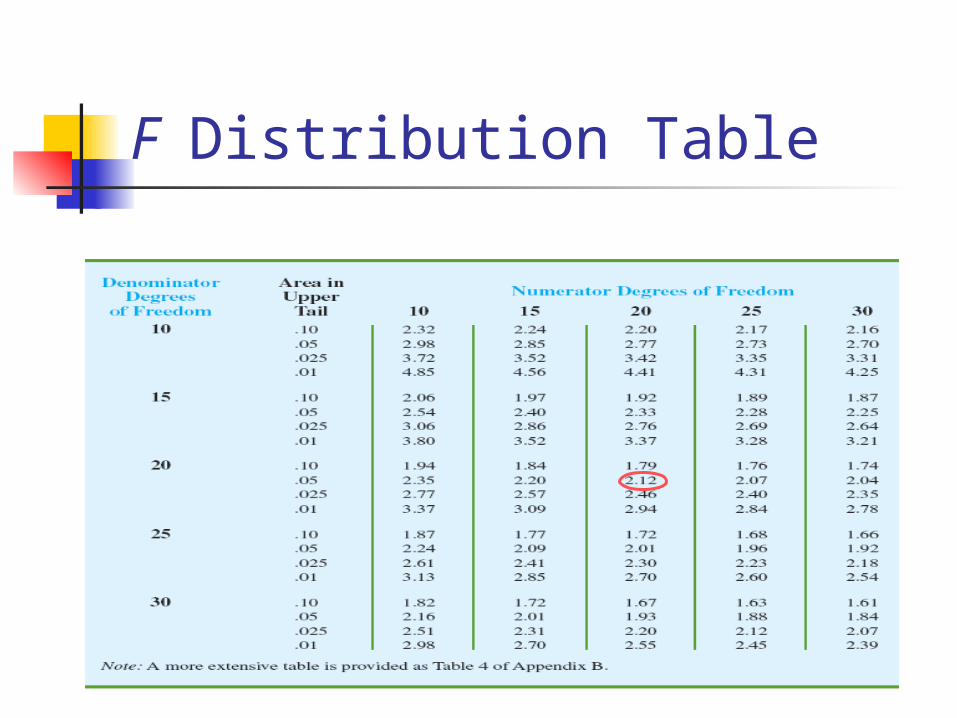
F Distribution Table

Buyer’s Digest has conducted the
same test, as was described earlier, on
another 10 thermostats, this time
manufactured by TempKing. The
temperature readings of the ten
thermostats are listed on the next slide.
Example: Buyer’s Digest (C)
Hypothesis Testing About theVariances of Two Populations
Example: Buyer’s Digest (C)
We will conduct a hypothesis test with = .10 to see if the variances are equal for ThermoRite’s thermostats and TempKing’s thermostats.
Hypothesis Testing About theVariances of Two Populations
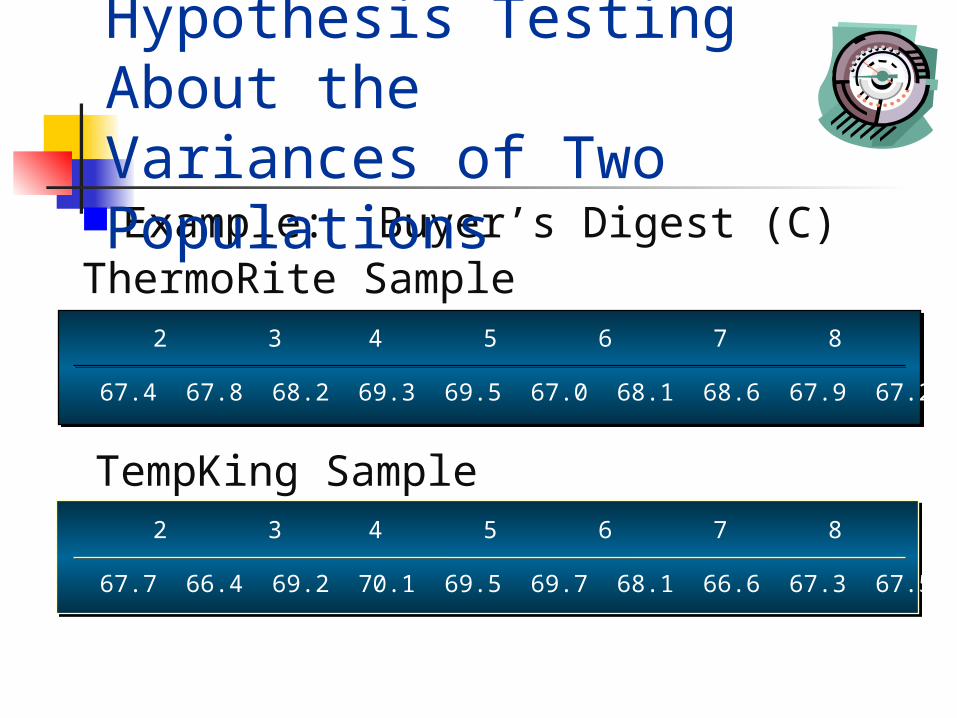
Example: Buyer’s Digest (C)ThermoRite Sample
TempKing Sample
Temperature 67.4 67.8 68.2 69.3 69.5 67.0 68.1 68.6 67.9 67.2
Thermostat 1 2 3 4 5 6 7 8 9 10
Temperature 67.7 66.4 69.2 70.1 69.5 69.7 68.1 66.6 67.3 67.5
Thermostat 1 2 3 4 5 6 7 8 9 10
Hypothesis Testing About theVariances of Two Populations
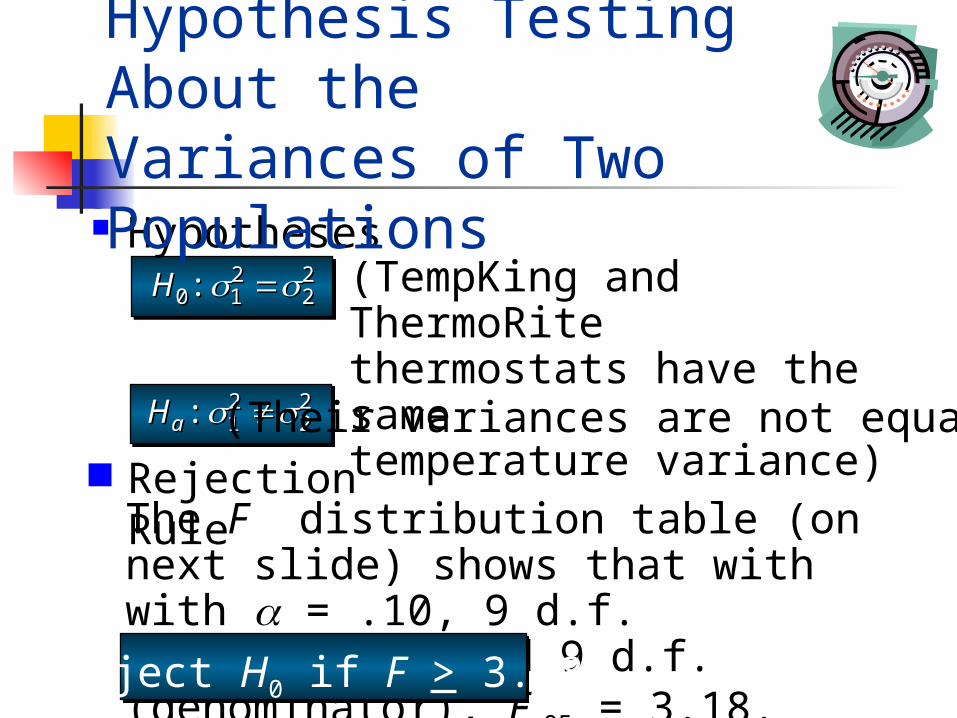
The F distribution table (on next slide) shows that with with = .10, 9 d.f. (numerator), and 9 d.f. (denominator), F.05 = 3.18.
HypothesesH0 1
222: H0 1
222:
Ha : 12
22Ha : 1
222
Reject H0 if F > 3.18
(Their variances are not equal)
(TempKing and ThermoRite thermostats have the same temperature variance)
Rejection Rule
Hypothesis Testing About theVariances of Two Populations
Denominator Area in
Degrees Upper
of Freedom Tail 7 8 9 10 158 .10 2.62 2.59 2.56 2.54 2.46
.05 3.50 3.44 3.39 3.35 3.22.025 4.53 4.43 4.36 4.30 4.10.01 6.18 6.03 5.91 5.81 5.52
9 .10 2.51 2.47 2.44 2.42 2.34.05 3.29 3.23 3.18 3.14 3.01
.025 4.20 4.10 4.03 3.96 3.77.01 5.61 5.47 5.35 5.26 4.96
Numerator Degrees of Freedom
Selected Values from the F Distribution Table
Hypothesis Testing About theVariances of Two Populations

Test StatisticTempKing’s sample variance is 1.768
ThermoRite’s sample variance is .700
= 1.768/.700 = 2.5322
21
s
sF
Hypothesis Testing About theVariances of Two Populations
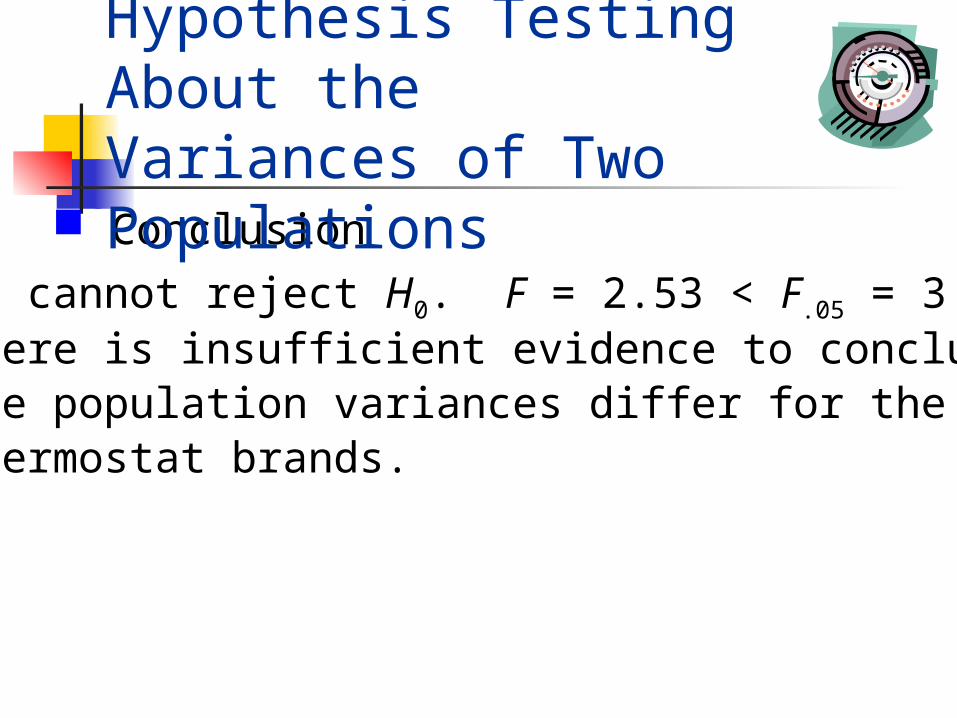
We cannot reject H0. F = 2.53 < F.05 = 3.18.There is insufficient evidence to conclude thatthe population variances differ for the twothermostat brands.
Conclusion
Hypothesis Testing About theVariances of Two Populations
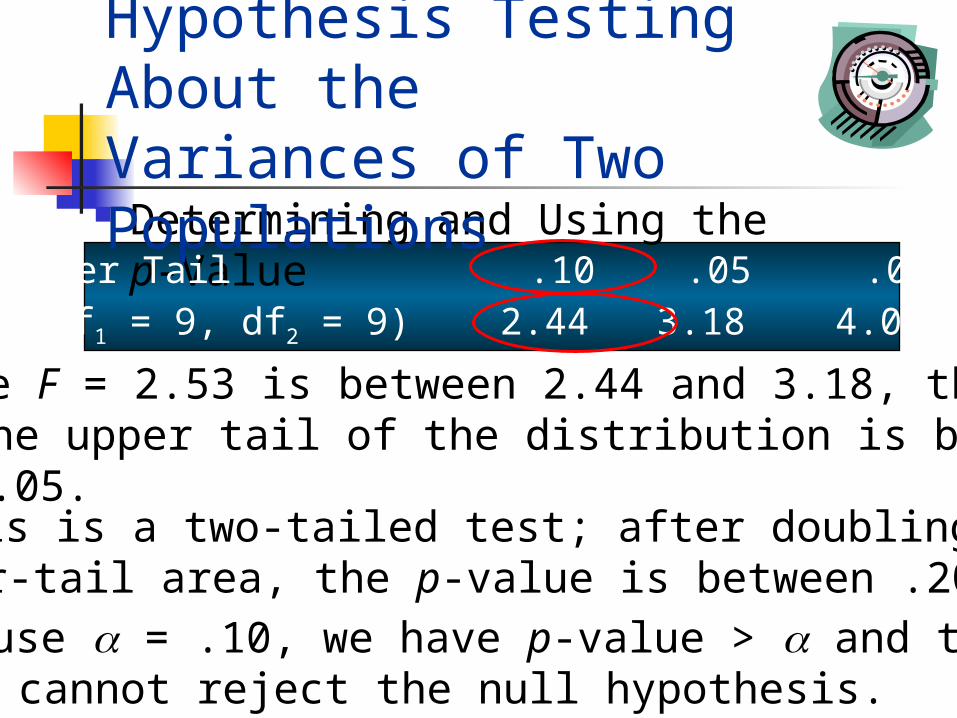
Determining and Using the p-Value
• Because a = .10, we have p-value > a and therefore we cannot reject the null hypothesis.
• But this is a two-tailed test; after doubling the upper-tail area, the p-value is between .20 and .10.
• Because F = 2.53 is between 2.44 and 3.18, the area in the upper tail of the distribution is between .10 and .05.
Area in Upper Tail .10 .05 .025 .01F Value (df1 = 9, df2 = 9) 2.44 3.18 4.03 5.35
Hypothesis Testing About theVariances of Two Populations
Hypothesis Testing About theVariances of Two Populations
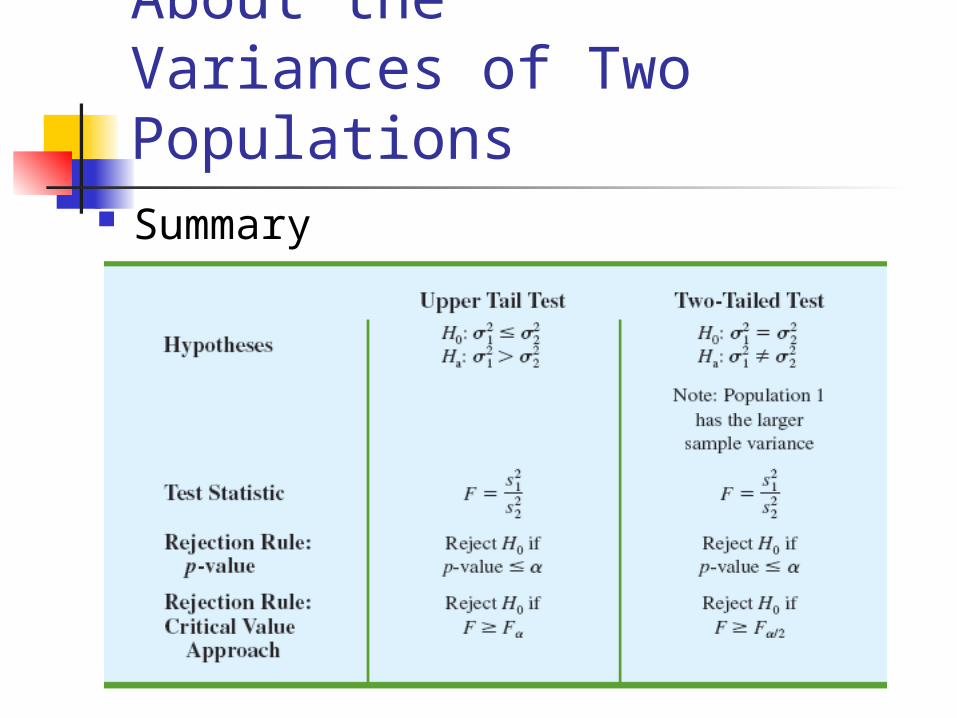
Summary