1 1 slide © 2008 thomson south-western. all rights reserved chapter 11 inferences about population...
TRANSCRIPT

1 1 Slide
Slide
© 2008 Thomson South-Western. All Rights Reserved© 2008 Thomson South-Western. All Rights Reserved
Chapter 11Chapter 11 Inferences About Population Variances Inferences About Population Variances
Inference about a Population VarianceInference about a Population Variance Inferences about Two Population VariancesInferences about Two Population Variances
2 2 Slide
Slide
© 2008 Thomson South-Western. All Rights Reserved© 2008 Thomson South-Western. All Rights Reserved
Inferences About a Population VarianceInferences About a Population Variance
Chi-Square DistributionChi-Square Distribution Interval EstimationInterval Estimation Hypothesis TestingHypothesis Testing

3 3 Slide
Slide
© 2008 Thomson South-Western. All Rights Reserved© 2008 Thomson South-Western. All Rights Reserved
Chi-Square DistributionChi-Square Distribution
We can use the chi-square distribution to developWe can use the chi-square distribution to develop interval estimates and conduct hypothesis testsinterval estimates and conduct hypothesis tests about a population variance.about a population variance.
The sampling distribution of (The sampling distribution of (nn - 1) - 1)ss22//22 has a has a chi-chi- square distribution whenever a simple random square distribution whenever a simple random samplesample of size of size nn is selected from a normal population. is selected from a normal population.
The chi-square distribution is based on samplingThe chi-square distribution is based on sampling from a normal population.from a normal population.
The The chi-square distributionchi-square distribution is the sum of is the sum of squaredsquared standardized normal random variables standardized normal random variables such assuch as
((zz11))22+(+(zz22))22+(+(zz33))22 and so on. and so on.

4 4 Slide
Slide
© 2008 Thomson South-Western. All Rights Reserved© 2008 Thomson South-Western. All Rights Reserved
Examples of Sampling Distribution of (Examples of Sampling Distribution of (nn - - 1)1)ss22//22
00
With 2 degreesWith 2 degrees of freedomof freedomWith 2 degreesWith 2 degrees of freedomof freedom
2
2
( 1)n s
With 5 degreesWith 5 degrees of freedomof freedomWith 5 degreesWith 5 degrees of freedomof freedom
With 10 degreesWith 10 degrees of freedomof freedomWith 10 degreesWith 10 degrees of freedomof freedom

5 5 Slide
Slide
© 2008 Thomson South-Western. All Rights Reserved© 2008 Thomson South-Western. All Rights Reserved
2 2 2.975 .025 2 2 2.975 .025
Chi-Square DistributionChi-Square Distribution
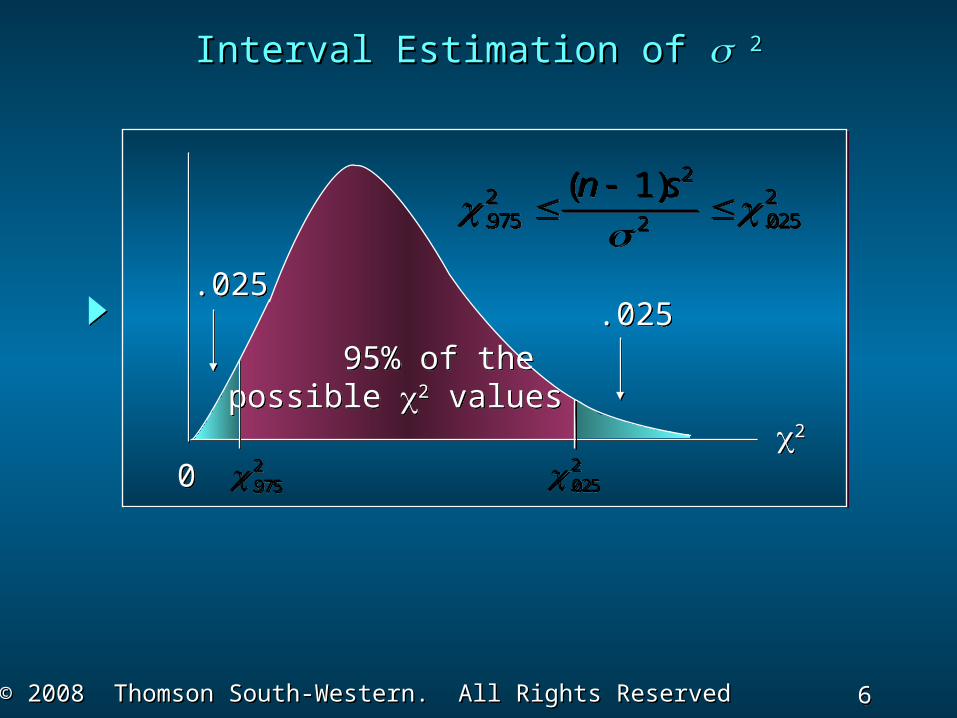
For example, there is a .95 probability of For example, there is a .95 probability of obtaining a obtaining a 22 (chi-square) value such that (chi-square) value such that
We will use the notation to denote the We will use the notation to denote the value for the chi-square distribution that value for the chi-square distribution that provides an area of provides an area of to the right of the stated to the right of the stated value. value.
2 2
2 2
6 6 Slide
Slide
© 2008 Thomson South-Western. All Rights Reserved© 2008 Thomson South-Western. All Rights Reserved
95% of thepossible 2 values 95% of thepossible 2 values
22
00
.025.025
2.025 2.025
.025.025
2.975 2.975
Interval Estimation of Interval Estimation of 22
22 2.975 .0252
( 1)n s
2
2 2.975 .0252
( 1)n s

7 7 Slide
Slide
© 2008 Thomson South-Western. All Rights Reserved© 2008 Thomson South-Western. All Rights Reserved
Interval Estimation of Interval Estimation of 22
( ) ( )
/ ( / )
n s n s
1 12
22
22
1 22
( ) ( )
/ ( / )
n s n s
1 12
22
22
1 22
2 2 2(1 / 2) / 2 2 2 2(1 / 2) / 2
22 2(1 / 2) / 22
( 1)n s
2
2 2(1 / 2) / 22
( 1)n s
Substituting (Substituting (nn – 1) – 1)ss22//22 for the for the 22 we get we get
Performing algebraic manipulation we getPerforming algebraic manipulation we get
There is a (1 – There is a (1 – ) probability of obtaining a ) probability of obtaining a 22 valuevalue
such thatsuch that

8 8 Slide
Slide
© 2008 Thomson South-Western. All Rights Reserved© 2008 Thomson South-Western. All Rights Reserved
Interval Estimate of a Population VarianceInterval Estimate of a Population Variance
Interval Estimation of Interval Estimation of 22
( ) ( )
/ ( / )
n s n s
1 12
22
22
1 22
( ) ( )
/ ( / )
n s n s
1 12
22
22
1 22
where the where the values are based on a chi-squarevalues are based on a chi-square
distribution with distribution with nn - 1 degrees of freedom and - 1 degrees of freedom and
where 1 - where 1 - is the confidence coefficient. is the confidence coefficient.
9 9 Slide
Slide
© 2008 Thomson South-Western. All Rights Reserved© 2008 Thomson South-Western. All Rights Reserved
Interval Estimation of Interval Estimation of
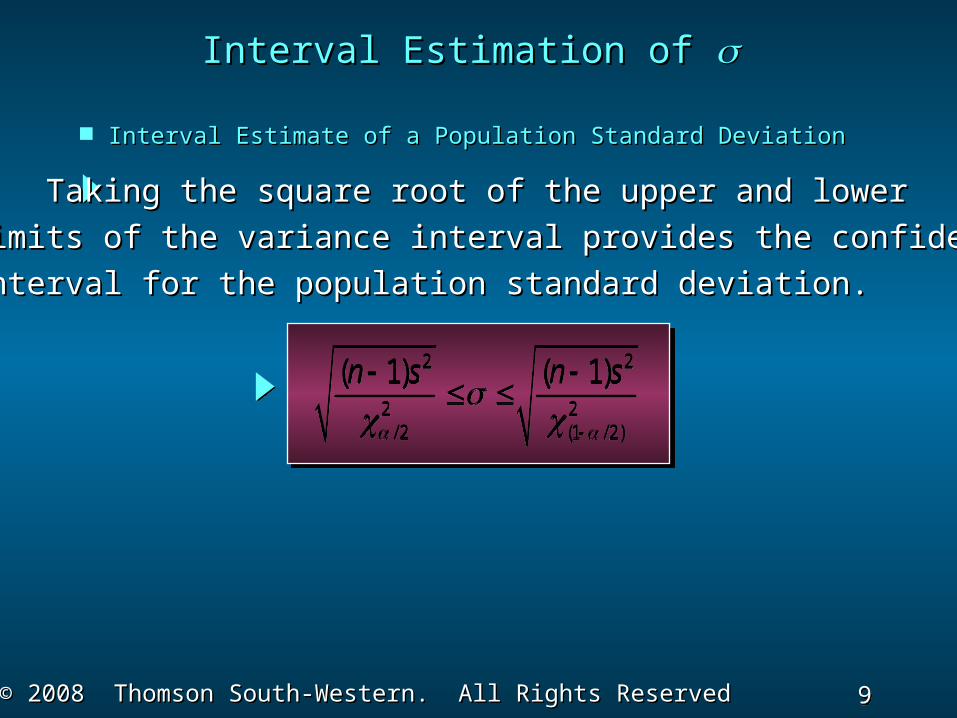
Interval Estimate of a Population Standard DeviationInterval Estimate of a Population Standard Deviation
Taking the square root of the upper and lowerTaking the square root of the upper and lower
limits of the variance interval provides the confidencelimits of the variance interval provides the confidence
interval for the population standard deviation.interval for the population standard deviation.
2 2
2 2/ 2 (1 / 2)
( 1) ( 1)n s n s
2 2
2 2/ 2 (1 / 2)
( 1) ( 1)n s n s

10 10 Slide
Slide
© 2008 Thomson South-Western. All Rights Reserved© 2008 Thomson South-Western. All Rights Reserved
Left-Tailed TestLeft-Tailed Test
Hypothesis TestingHypothesis TestingAbout a Population VarianceAbout a Population Variance
22
02
1 ( )n s
22
02
1 ( )n s
where is the hypothesized valuewhere is the hypothesized valuefor the population variancefor the population variance
20 20
•Test StatisticTest Statistic
•HypothesesHypotheses2 2
0 0: H 2 20 0: H
2 20: aH 2 20: aH
11 11 Slide
Slide
© 2008 Thomson South-Western. All Rights Reserved© 2008 Thomson South-Western. All Rights Reserved
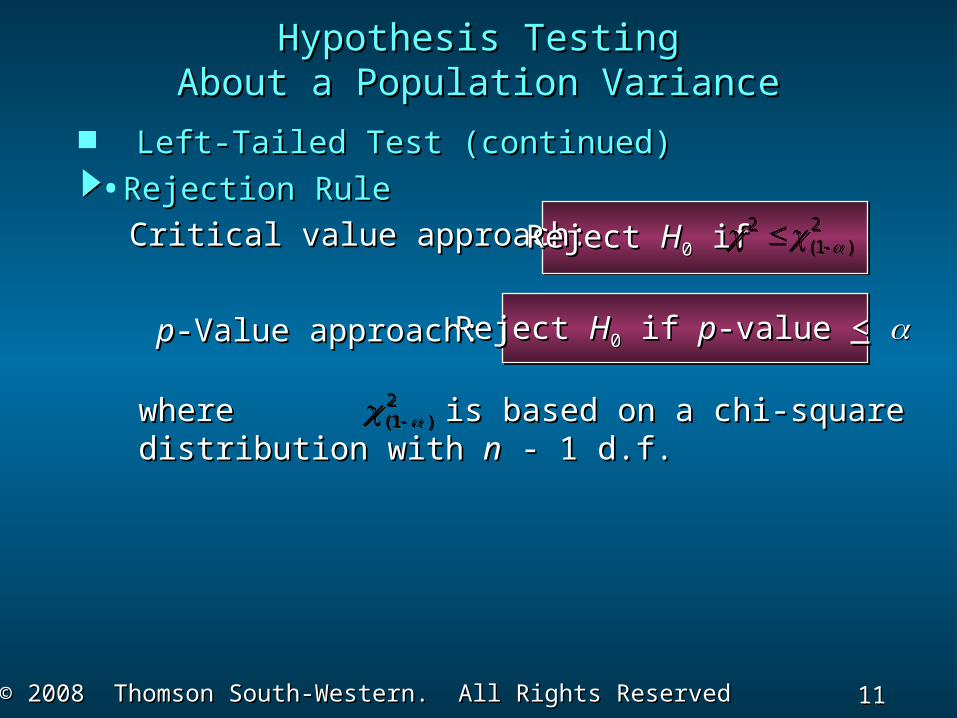
Left-Tailed Test (continued)Left-Tailed Test (continued)
Hypothesis TestingHypothesis TestingAbout a Population VarianceAbout a Population Variance
Reject Reject HH00 if if pp-value -value << pp-Value approach:-Value approach:
Critical value approach:Critical value approach:•Rejection RuleRejection Rule
Reject Reject HH00 if if 2 2(1 ) 2 2(1 )
where is based on a chi-squarewhere is based on a chi-squaredistribution with distribution with nn - 1 d.f. - 1 d.f.
2(1 ) 2(1 )

12 12 Slide
Slide
© 2008 Thomson South-Western. All Rights Reserved© 2008 Thomson South-Western. All Rights Reserved
Right-Tailed TestRight-Tailed Test
Hypothesis TestingHypothesis TestingAbout a Population VarianceAbout a Population Variance
H02
02: H0
202:
Ha : 202Ha : 202
22
02
1 ( )n s
22
02
1 ( )n s
where is the hypothesized valuewhere is the hypothesized valuefor the population variancefor the population variance
20 20
•Test StatisticTest Statistic
•HypothesesHypotheses

13 13 Slide
Slide
© 2008 Thomson South-Western. All Rights Reserved© 2008 Thomson South-Western. All Rights Reserved
Right-Tailed Test (continued)Right-Tailed Test (continued)
Hypothesis TestingHypothesis TestingAbout a Population VarianceAbout a Population Variance
Reject Reject HH00 if if 2 2 2 2
Reject Reject HH00 if if pp-value -value <<
22where is based on a chi-squarewhere is based on a chi-square
distribution with distribution with nn - 1 d.f. - 1 d.f.
pp-Value approach:-Value approach:
Critical value approach:Critical value approach:•Rejection RuleRejection Rule

14 14 Slide
Slide
© 2008 Thomson South-Western. All Rights Reserved© 2008 Thomson South-Western. All Rights Reserved
Two-Tailed TestTwo-Tailed Test
Hypothesis TestingHypothesis TestingAbout a Population VarianceAbout a Population Variance
22
02
1 ( )n s
22
02
1 ( )n s
where is the hypothesized valuewhere is the hypothesized valuefor the population variancefor the population variance
20 20
•Test StatisticTest Statistic
•HypothesesHypotheses
Ha : 202Ha : 202
H02
02: H0
202:

15 15 Slide
Slide
© 2008 Thomson South-Western. All Rights Reserved© 2008 Thomson South-Western. All Rights Reserved
Two-Tailed Test (continued)Two-Tailed Test (continued)
Hypothesis TestingHypothesis TestingAbout a Population VarianceAbout a Population Variance
Reject Reject HH00 if if pp-value -value <<
pp-Value approach:-Value approach:
Critical value approach:Critical value approach:•Rejection RuleRejection Rule
2 2 2 2(1 / 2) / 2 or 2 2 2 2(1 / 2) / 2 or Reject Reject HH00 if if
where are based on awhere are based on achi-square distribution with chi-square distribution with nn - 1 d.f. - 1 d.f.
2 2(1 / 2) / 2 and 2 2(1 / 2) / 2 and
16 16 Slide
Slide
© 2008 Thomson South-Western. All Rights Reserved© 2008 Thomson South-Western. All Rights Reserved
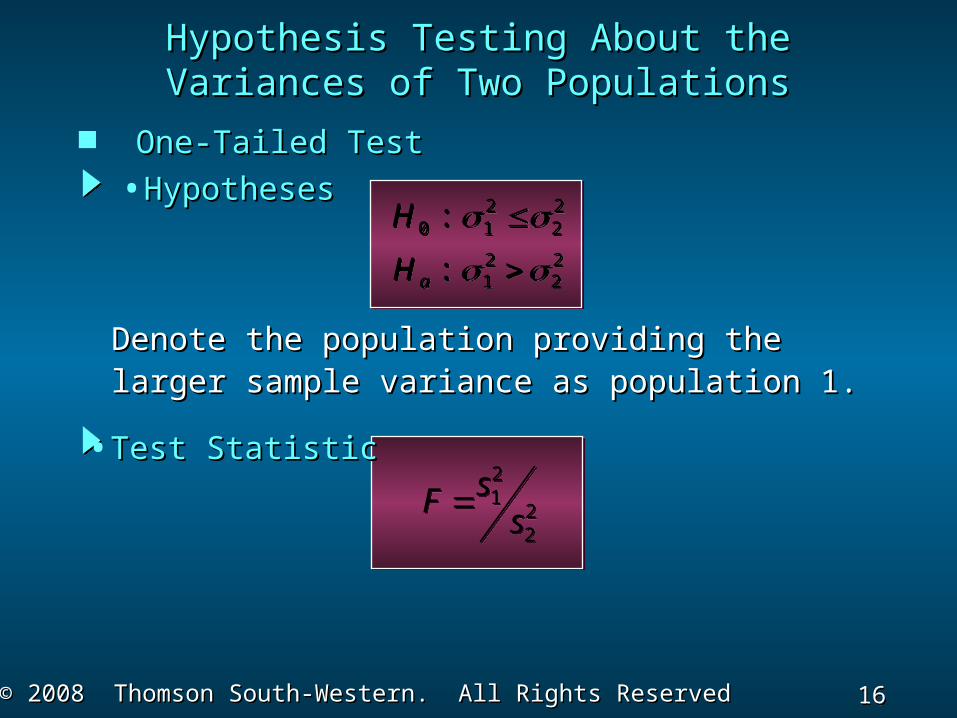
One-Tailed TestOne-Tailed Test
•Test StatisticTest Statistic
•HypothesesHypotheses
Hypothesis Testing About theHypothesis Testing About theVariances of Two PopulationsVariances of Two Populations
Denote the population providing theDenote the population providing thelarger sample variance as population 1.larger sample variance as population 1.
2 20 1 2: H 2 20 1 2: H
2 21 2: aH 2 21 2: aH
21
22
sFs
21
22
sFs
17 17 Slide
Slide
© 2008 Thomson South-Western. All Rights Reserved© 2008 Thomson South-Western. All Rights Reserved
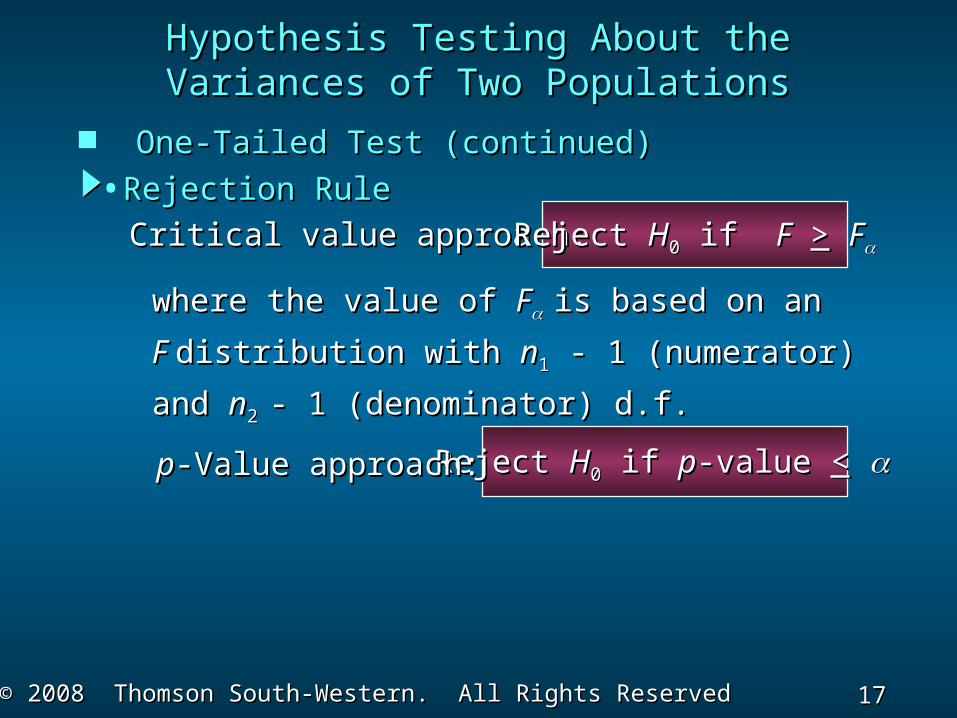
One-Tailed Test (continued)One-Tailed Test (continued)
Reject Reject HH00 if if pp-value -value <<
where the value of where the value of FF is based on anis based on an
F F distribution with distribution with nn11 - 1 (numerator) - 1 (numerator)
and and nn2 2 - 1 (denominator) d.f.- 1 (denominator) d.f.
pp-Value approach:-Value approach:
Critical value approach:Critical value approach:•Rejection RuleRejection Rule
Hypothesis Testing About theHypothesis Testing About theVariances of Two PopulationsVariances of Two Populations
Reject Reject HH00 if if FF >> FF

18 18 Slide
Slide
© 2008 Thomson South-Western. All Rights Reserved© 2008 Thomson South-Western. All Rights Reserved
Two-Tailed TestTwo-Tailed Test
•Test StatisticTest Statistic
•HypothesesHypotheses
Hypothesis Testing About theHypothesis Testing About theVariances of Two PopulationsVariances of Two Populations
H0 12
22: H0 1
222:
Ha : 12
22Ha : 1
222
Denote the population providing theDenote the population providing thelarger sample variance as population 1.larger sample variance as population 1.
21
22
sFs
21
22
sFs

19 19 Slide
Slide
© 2008 Thomson South-Western. All Rights Reserved© 2008 Thomson South-Western. All Rights Reserved
Two-Tailed Test (continued)Two-Tailed Test (continued)
Reject Reject HH00 if if pp-value -value << pp-Value approach:-Value approach:
Critical value approach:Critical value approach:•Rejection RuleRejection Rule
Hypothesis Testing About theHypothesis Testing About theVariances of Two PopulationsVariances of Two Populations
Reject Reject HH00 if if FF >> FF/2/2
where the value of where the value of FF/2 /2 is based on anis based on an
F F distribution with distribution with nn11 - 1 (numerator) - 1 (numerator)
and and nn2 2 - 1 (denominator) d.f.- 1 (denominator) d.f.