138
DESCRIPTION
138TRANSCRIPT

7/17/2019 138
http://slidepdf.com/reader/full/138563db91c550346aa9a9a1e96 1/6
URBAN MORPHOLOGY ANALYSIS BY HIGH AND VERY HIGH SPATIAL
RESOLUTION REMOTE SENSING
A. Puissanta, W. Zhanga, G. Skupinskia
a
Laboratoire Image, Ville, Environnement, CNRS ERL 7230, Université de Strasbourg, 3 rue de l’Argonne, F- 67083Strasbourg, France
anne.puissant[at]live-cnrs.unistra.fr
zhangweifrance[a]hotmail.com
grezgorz.skupinski[a]live-cnrs.unistra.fr
KEY WORDS: urban morphology, high and very high spatial resolution, ruled-based classification, ancillary data
ABSTRACT:Improving our knowledge on the urban patterns and their dynamics at multiple spatial scales (from the Morphological Urban Area -
MUA, the urban fabric to the urban materials) is a real challenge for research, but also a necessity to manage the territory. Satellite
imagery with high and very high spatial resolutions is a real opportunity and is a very relevant data source in this domain. Since
recent years, the object-oriented classification approach is largely developed and applied for urban interest. In this context, this paperproposes a general workflow to mapping urban patterns at different scales. High spatial resolution imagery is firstly used to extract
impervious surface based on supervised object-oriented classifier and to delineate the morphological urban area at the scale of
1:25,000. Based on this first mapping, a second workflow is proposed to introduce ancillary data (communication network) to
produce a mapping of urban fabrics by using both a bottom and a top-down approach. In the bottom-up approach, urban blocks and
materials are also classified by object-oriented processing. In the top-down approach, the previous results are used to produce a
mapping of urban fabrics at 1:10,000. These classifications are based on membership function classifier which is dependant of the
users’s expert knowledge that can define rules and constraints in the membership function to control the classification procedure.
Results produced at different scales (MUA, to the urban fabric and urban materials) on the urban area of Strasbourg (East of France)
achieve high overall accuracy and show the possibility to apply the workflow to other cities with similar morphology and
characteristic typical of our western cities.
1. INTRODUCTION
Improving our knowledge on the urban patterns and their
dynamics at multiple spatial scales (from the urban block to the
morphological urban zone) is a real challenge for research, but
also a necessity to design master plans, to monitor consumption
of agricultural fields, woodland and natural lands, to plan
infrastructure development (drinking water, sewage, roads,
etc.), to locate slum development in rapid expanding cities, to
manage risk and security, to handle environment protection, to
assess urban services (waste, health, post, transportation, etc.).
Satellite imagery with different spatial resolutions is a real
opportunity and is a very relevant data source in this domain.
Since recent years, the object-oriented classification approach is
largely developed and applied for urban interest (Burnett andBlaschke, 2003; Jacquemin et al., 2007; Hanson et Wolff.,
2010). Since several decades, a wide range of techniques has
been applied on high spatial remote sensing images to
delineated Morphological Urban Area (MUA) at scales ranging
from 1/50 000 to 1/25 000 (Weber, 2001, Tatem, et al, 2004).
At a finer scale (from at scales ranging from 1/10 000 to 1/25
000), urban geographers and planners are subdividing the city
in morphological homogeneous neighbourhoods, sometimes
named Homogeneous Urban Patch (HUP) to characterise,
manage and plan the city. These HUP were defined by Herold et
al. (2003) as (a) a morphogenetic regions, homogeneous in
texture and visibly different from their neighbouring HUP, (b)
composed of several landcover classes, but only one single
landuse classes, (c) where possible their boundaries followsroads or others natural or artificial features, (d) of a relatively
large size. These HUP called here urban fabrics group several
similar urban blocks.
In this context, the first objective of this paper is to improve the
mapping of the MUA by using object-oriented classification on
high spatial resolution image (Spot 10m) compared to classical
per-pixel supervised classification. The second objective is to
propose a bottom-up methodology combining supervised and
ruled-based classification methods to classify urban fabrics from
very high spatial resolution imagery (Quickbird, 2.4m) by using
ancillary data allowing to delineate urban blocks. The
experiments have been performed on the urban area of
Strasbourg for the calibration of feature selection and
classification. The proposed workflow has been also applied on
a subset of the Toulouse urban area to validate the approach
allowing to produce a multiscale mapping of urban forms.
The first section presents the study site and data. The second
section of this paper details the workflow. Section 3 presents
results obtained on the Strasbourg area completed with results
on Toulouse area. Validation and discussion of the results are
expressed in section 5, before conclusions and perspectives in
section 6.
2.
STUDY SITES AND DATA
The urban area of Strasbourg and Toulouse (more than 400 000
inhabitants) are located respectively on the East of France, in
the floodplain of Rhine river (Figure 1a) and on the South-Westof France in the floodplain of the Garonne river (Figure 1b).
These both cities present several typical morphological urban
Proceedings of the 4th GEOBIA, May 7-9, 2012 - Rio de Janeiro - Brazil. p.524
524
7/17/2019 138
http://slidepdf.com/reader/full/138563db91c550346aa9a9a1e96 2/6
characteristics representative of some western urban areas: a
concentric dense city centre inherited from the Middle Ages
with surroundings organised in some rings characterized by
typical urban fabrics (Table 1). They are also submitted to a
gradual urbanisation process since the last century with an
urban sprawl achieving the third ring.
Figure 1. Study sites (a) Strasbourg and (b) Toulouse (©CNES)
1. Dense urban fabric (city center)
2. Urban fabric with individual houses
3. Urban fabric with housing blocks
4. Mixed urban fabricUrban fabric composed of individual housed
and housing blocks
5. Mixed urban area Area composed of housing classes (class 1, 2, 3)
and specialised areas (class 6)
6. Specialised or specific areas
Surfaces dedicated to specialised activities:e.g commercial and industrial activities, etc.
7. Green surfacesUrban park, sport fields, etc
8. Communication ways
9. Hydrographic network and water surfaces
Table 1. List of relevant urban fabrics for mapping urban area
at 1:10,000
The Strasbourg and Toulouse datasets are composed of two
multispectral images with different spatial resolutions (2.4 m
and 10 m) acquired respectively by the QuickBird satellite
(c)DigitalGlobe) and the SPOT-5 (c)CNES (Table 1). The
SPOT-5 image (figure 1a,b) have four spectral bands (green,red, near-infrared, middle infrared). The QuickBird
multispectral image (figure 1c,d) is available in four spectral
bands (blue, green, red, and near-infrared). All the data are
geometrically corrected in the same cartographic projection
(RGF93).
3.
METHODOLOGY
The proposed methodology is organized in four steps (Figure
2). The first step concerns the MUA extraction based on HRS
imagery. The modified watershed segmentation implemented in
the ENVI EX 4.8 was adapted to extract impervious surfaces
(housing, communication ways, commercial or industrialisedzones) on the SPOT5 image (10m). Features characterizing
spectral, spatial and textural information have been calculated.
This segmentation is following by a supervised classification
where two algorithms (implemented in ENVI EX) are
compared: the Nearest Neighbourhood (NN) and the Support
Vector Machine (SVM). These classification results are also
compared to a per-pixel supervised classification (maximum
likelihood algorithm).
The MUA is then delimited (on the most relevant result in termsof global accuracy assessment) by using a classical threshold of
distance (200m defined by the European level) between urban
patches. For the third following steps based on VHRS imagery,
the multi-resolution image segmentation (MRIS, Baatz and
Schäpe, 2000) and the classification algorithm implemented in
eCognition®8.64 was adopted (NN algorithm).
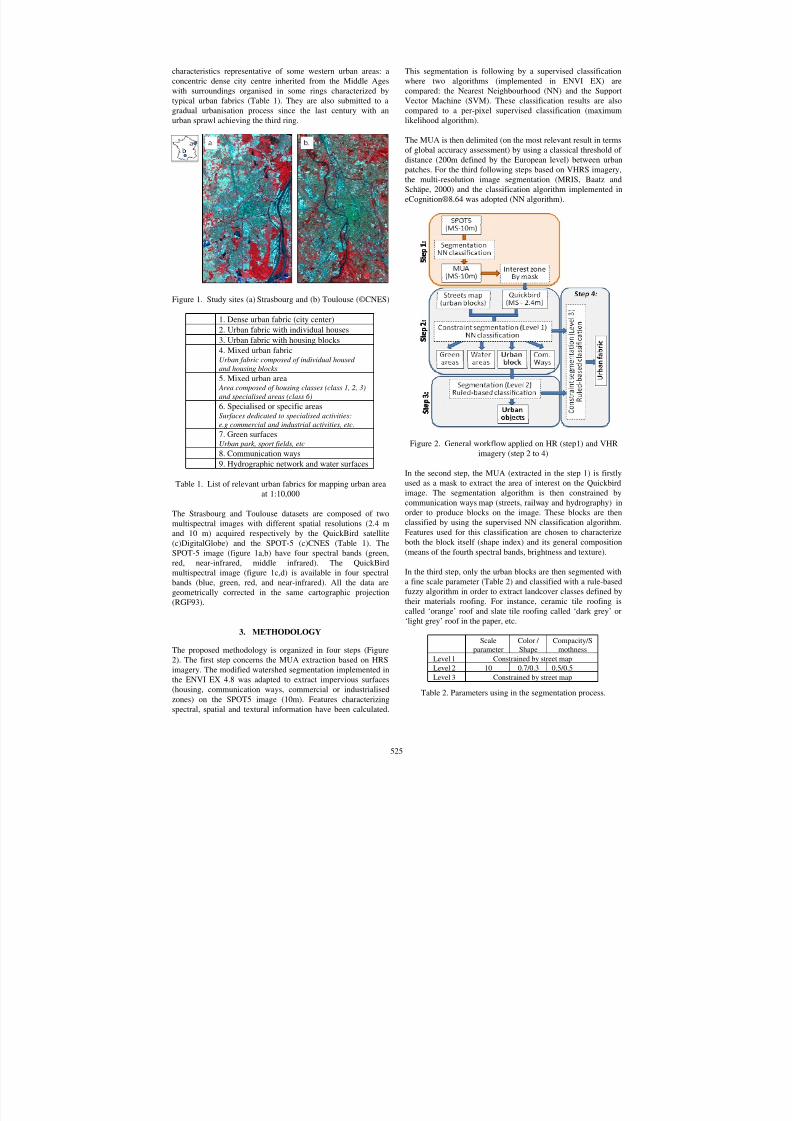
Figure 2. General workflow applied on HR (step1) and VHR
imagery (step 2 to 4)
In the second step, the MUA (extracted in the step 1) is firstly
used as a mask to extract the area of interest on the Quickbird
image. The segmentation algorithm is then constrained by
communication ways map (streets, railway and hydrography) in
order to produce blocks on the image. These blocks are then
classified by using the supervised NN classification algorithm.
Features used for this classification are chosen to characterize
both the block itself (shape index) and its general composition
(means of the fourth spectral bands, brightness and texture).
In the third step, only the urban blocks are then segmented with
a fine scale parameter (Table 2) and classified with a rule-based
fuzzy algorithm in order to extract landcover classes defined by
their materials roofing. For instance, ceramic tile roofing is
called ‘orange’ roof and slate tile roofing called ‘dark grey’ or
‘light grey’ roof in the paper, etc.
Scale
parameter
Color /
Shape
Compacity/S
mothness
Level 1 Constrained by street map
Level 2 10 0.7/0.3 0.5/0.5
Level 3 Constrained by street map
Table 2. Parameters using in the segmentation process.
525

7/17/2019 138
http://slidepdf.com/reader/full/138563db91c550346aa9a9a1e96 3/6
For this classification level (level 2), the hierarchy of landcover
classes/urban materials is created by using a ‘deduction’
approach (Figure 3). Some previous tests have shown that the
order of the object extraction and the rules application are
controlling classification results (Puissant et al, 2006). Urban
materials which are considered as 'easy' to extract in term of
number of features (minimal) are on the top of the hierarchy.
For example, vegetation is the first class that can be easilyextracted by using spectral index as MSAVI which is
considered in the literature as more relevant in urban context
(REF). In summarize, features rules are chosen in order to
follow the principle of visual interpretation (color, shape,
texture, vegetation index) and their number is then most
restricted as possible to allow the reproducibility of the method.
The proposed landcover class hierarchy is then presented in
Figure 3. Features thresholds are chosen by empirical tests and
visual interpretation for each class.
Figure 3. Workflow for the classification at the level 2
(landcover or materials classes).
At the fourth level, the urban blocks (built at the second step by
the constraint segmentation) are classified into landuse classes
characterising the urban morphology in six classes of urban
fabrics (Table 1). The classification is based on the sub-level 2
by using rules of composition. The arrangement of landcover
classes observed by an expert is confirmed by a statistical
analysis of some urban blocks (based on the ground survey
knowledge of the expert). This analysis allows highlightingsome rules of spatial arrangement of landcover classes to
describe an urban fabric. For example, Figure 4 shows that in
our western cities, an individual urban fabric is characterized by
an important proportion of vegetation with a high percentage of
'orange' roofing, however in an urban fabric with urban blocks
(high building for housing) the proportion of dark and light grey
roofing is higher than the orange roofing with the same
proportion of vegetation. For this experience, all thresholds of
landcover classes at level 2 are defined by integrating this
knowledge.
Figure 4. Composition of urban fabric classes (described in
Table 1) based on landcover classes of the sub-level 2
An accuracy assessment of each classification is operated at
each level and is based on confusion matrix associated
indicators: overall accuracy, user’s and producer’s accuracy and
Kappa coefficient. Field survey mapping or visual interpretation
of aerial photographs was performed to obtain data for
validation of the classifications.
4. RESULTS AND VALIDATION
All the steps of the workflow have been performed on the urban
area of Strasbourg for the calibration of feature selection and
classification process (sections 4.1, 4.2, 4.3). Except for the step1, some experiments have also been applied on a subset of the
Toulouse urban area to validate the approach allowing to
produce a multiscale mapping of urban forms (from objects to
urban fabrics).
4.1 Classification of the MUA (step 1)
For the segmentation step at 10m, we found out that a scale
parameter of 25 (with a merge parameter of 90) was the optimal
scale to extract impervious surfaces. To classify image objects
using NN or SVM classifier, a feature space and training
samples have to be defined. After testing many different band
combinations, composite bands, textural and spatial parameters,
the following features were used in the expert system rule toextract urban patches: mean bands 1,2,3, band ratio, brightness,
526

7/17/2019 138
http://slidepdf.com/reader/full/138563db91c550346aa9a9a1e96 4/6
entropy, length and area. The training samples were chosen to
be statically relevant by using more than 30 samples for each
class (110 in total). These both results have also been compared
to a per pixel classification where all classes of impervious
surface have been summarized.
Table 3 shows producer’s accuracy, user’s accuracy, overall
accuracy and the kappa index generated for the third classifiers.As expected, the SVM classifier produces the highest accuracy
(93,35%). The improvement can be noted specially for the
user’s accuracy related to impervious surfaces. This
demonstrates that the SVM classifier can reduce some
confusions between impervious and other classes over the two
others algorithms.
Maxlike NN SVM
%prod %user %prod %user %prod %user
Impervious surf. 89.62 58.32 66.24 67.25 84.49 86.45
Other 80.11 99.48 94.89 94.34 98.23 94.34
Overall acc. (%) 83.25 91.14 93.35
Kappa index 0.66 0.78 0.83
Table 3. Accuracy assessment on the classification results of
urban patches.
From the classification result the MUA is produced by some
spatial analysis described in section 3 (Figure 5a). This MUA is
then selected to be used as a mask to the Quickbird image with
a fine spatial resolution (2.4m) for the next step.
4.2 Classification of urban blocks (level 1) and urban
materials (level 2)
The masked image is used as an input for the segmentation step.
The classification is performed on segmented blocks
corresponding to the minimal system built from the
communication ways. Training samples are chosen to apply theNN classifier and the classification result (level 1) is expressed
in four thematic classes of blocks: (1 ) green spaces
(agricultural lands, urban park, sport fields, etc), (2 )
communication ways related to surfaces, (3 ) water surfaces
(river and lake) and (4 ) urban blocks related to housing or
commercial activities. Classification results of these blocks
(Figure 5b) obtained an overall accuracy assessment of 86%
with a kappa index of 0,87. Some confusions related to urban
blocks have been manually corrected in order to use this result
to classify the sub-level 2. Some blocks have not been classified
because they do not cover the Quickbird image.
The classification of urban materials is defined in 11 classes
where accuracy assesment is presented in Table 4.
%Prod Acc. %User Acc.
Grassland 100.00 88.24
Tree 69.23 69.23
Mixed vegetation 89.75 86.23
Shadow of tree 89.69 79.58
Shadow of building 86.67 79.10
White roof 100.00 86.67
Blue roof 75.54 100.00
Road 60.50 68.12
Orange roof 97.80 98.89
Light grey 63.41 55.32
Dark Grey 68.63 94.6
Overall accuracy (%) 78.88
Kappa Index 0.75
Table 4. Accuracy assessment of classification at level 2.
Producer’s and user’s accuracy are generally highest on urban
materials on the top of the hierarchy which is presented in
ascending order of difficulty (described in Figure 3). As
expected, the main confusions appear between objects with
similar materials such as roads and light or dark grey roof.
Classification result is presented on a subset of the urban area of
Strasbourg (Figure 5c).
4.3 Classification of urban fabrics (level 3)
For the level 3, the accuracy assessment is 76,6% with a kappa
index of 0,70. Three urban fabrics seems particularly well
identified (dense, individual and specialised urban fabrics). The
producer’s and user’s accuracies of 100% for the dense urban
fabric can be explained due to the low representatively of this
thematic class in periurban area. Indeed in your experiment we
have chosen to exclude the city centre because some clouds and
shadows appear on the Quickbird image. Accuracies are low for
complex urban fabric such as mixed urban fabric and area.
Their composition is not clearly different as shown at Figure 3.
However, classification results (Figure 5d) are very encouragingresults allowing to help end-users to produce automatically
interest maps of the territory at the scale of urban fabrics.
%Prod Acc. %User Acc.
1. Dense Urban Fabric (UF) 100.00 100.00
2. UF with individual houses 100.00 76.92
3. UF with housing blocks 81.82 83.56
4. Mixed urban fabric (housing) 57.14 66.67
5. Mixed urban area (activities) 33.34 54.21
6. specialised areas 100.00 86.67
Overall accuracy (%) 76.60
Kappa Index 0.70
Table 5. Accuracy assessment of classification at level 3.
4.4 Validation of the workflow on Toulouse area
Only a subset of Toulouse area localised in the first ring of
urbanisation has been used to validate the workflow allowing to
map blocks (level 1), objects (level 2) and urban fabrics (level
3) as vector datatbase on communication ways is easily
available. Segmentation parameters have been identified as
relevant for their application to this second city and hvae been
applied without changes. In the features space chosen for the
classifcation step, only the thresholds of parameters have to be
adapted for a better adequation with the spectral and spatial
variability of the local context of Toulouse. The overall
accuracy assessment at the different steps (Table 6) shows the
same confusions or omissions errors and shows thereproductibility of the proposed workflow with the unique
condition to have date on communication ways.
Level 1 Level 2 Level 3
Overall acc. (%) 83.25 91.14 93.35
Kappa index 0.66 0.78 0.83
Table 3. Accuracy assessment for each level of classification on
Toulouse area.
527

7/17/2019 138
http://slidepdf.com/reader/full/138563db91c550346aa9a9a1e96 5/6
Figure 5. Results on Strasbourg area: (a) Morphological Urban Agglomeration (MUA), (b) classification of urban blocks, (c) classification of land
urban fabrics.
528

7/17/2019 138
http://slidepdf.com/reader/full/138563db91c550346aa9a9a1e96 6/6
5. CONCLUSION AND PERSPECTIVES
The proposed methodology in this research based on HRS and
VHRS imagery allows producing some information related to
MUA and urban fabrics. For this level of analysis, no database
exists and it is important to help end-users to produceautomatically with a generic methodology these information’s.
In order to do that, the proposed methods using existing data on
street map showed good results on Strasbourg. To highlight the
reproducibility of the method, combining all the workflow but
also the features sets, the both workflow have been tested on the
Toulouse urban area. Results are shown also their soundness
proving that it is possible to apply this methodology to an other
site of interest (with the same morphological development).
Some researchers have been enables in two domains: for the
segmentation methods and parameters and for the features
selection and thresholding. In order to choose the optimal
resolution(s) and segmentation parameters, the spatial
heterogeneity could be measured using average local variancefunction (Woodcock and Stralher, 1987, Nijland et al, 2009,
Tran et al.,2011) on a set of images with different resolutions
(from VHRS to HRS). The spatial analysis of the composition
of each urban fabric could do also of an more precise statistical
analysis by calculate these information on a great number of
urban fabric. However, the same type of approach could also be
applied to cities characterized by other morphology
development by adapting features selection and composition.
References
Baatz, M., Schäpe, A., 2000, “Multiresolution segmentation: an
optimization approach for high quality multi-scale
image segmentation”,http://www.ecognition.cc/download/baatz_schaepe.pdf.
Burnett, C. and Blasche, T. (2003): A multi-scale segmentation
/ object relationship modelling methodology for
landscape analysis. In: Ecological Modelling 168(3),
233-249.Van der Sande et al., 2003;
Hanson E., Wolff E., 2010. "Change detection for update of
topographic databases through multi-level region-based
classification of VHR optical and SAR data", The
International Archives of the Photogrammetry, Remote
Sensing and Spatial Information Sciences, Vol.
XXXVIII-4/C7, Ghent: 2010.
Herold, M., Gardner, M. & Roberts, D. A. (2003). Spectral
Resolution Requirements for Mapping Urban Areas,
IEEE Transactions on Geoscience and Remote Sensing,
41, 9, pp. 1907-1919.
Jacquin, A., Misakova, L., Gay, M., 2007, “A hybrid object-
based classification approach for mapping urban sprawl
in periurban environment”, ScienceDirect, Landscape
and Urban Planning 84, 152–165.
Nijland W., E.A. Addink, S.M. De Jong, F.D. Van der Meer,
2009. , Optimizing spatial image support for
quantitative mapping of natural vegetation, Remote
Sensing of Environment 113, 771–780
Puissant A. Sheeren D., Weber C., Wemmert C., Gancarski P.,
2006, Amélioration des connaissances sur
l’environnement urbain: intérêt de l’intégration de
règles dans les procédures de classiifcation, Colloque
interactions Nature-Sociétés – Analyse et modèles,
UMR LETG6554, La baule, Mai 2006, 8 p.
Tran T.D.B., Puissant A., Badariotti D., Weber C., 2011,
Optimizing Spatial Resolution of Imagery for Urban
Form Detection—The Cases of France and Vietnam, Remote Sens. 2011, 3(10), 2128-2147.
Weber C., Hirsch J., 2001, « Processus de croissance et limites
urbaines », Cybergeo : European Journal of Geography,
Sciences humaines, document 158,
http://www.cybergeo.eu/index716.html.
Woodcock C. E., Alan H. Strahler, 1987. The factor of scale in
remote sensing, Remote Sensing of Environment,
Volume 21, Issue 3, April 1987, Pages 311-332
Acknowledgements
This research is funded and takes part of the ORFEO
Accompaniment Program (CNES) which has the objectives to
prepare, accompany and promote the use and the exploitation of
the images derived from the next Pléiades systems.
529