sir20185169.pdf - flood-inundation maps for lake champlain
TRANSCRIPT
U.S. Department of the InteriorU.S. Geological Survey
Scientific Investigations Report 2018–5169
Prepared in cooperation with the International Joint Commission
Flood-Inundation Maps for Lake Champlain in Vermont and New York

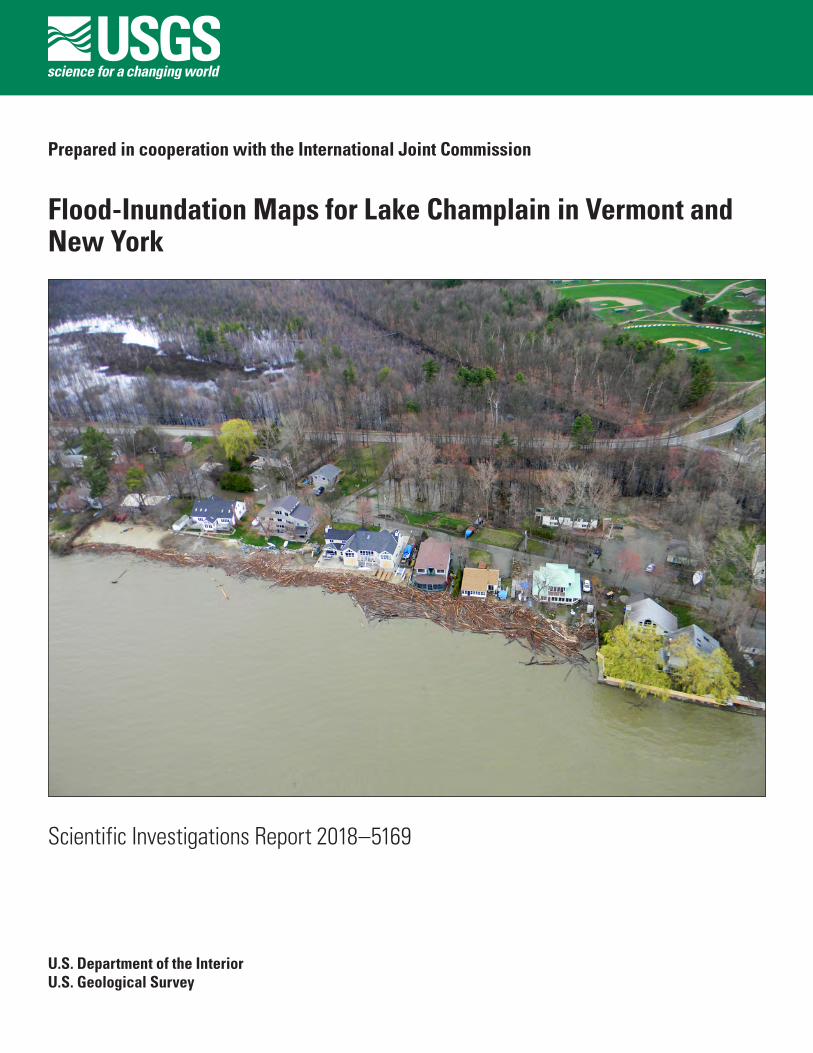
Cover. Photograph showing Lake Champlain shoreline, Colchester, Vermont, April 29, 2011. Photograph taken by Bill Howland, Lake Champlain Basin Program.
Flood-Inundation Maps for Lake Champlain in Vermont and New York
By Robert H. Flynn and Laura Hayes
Prepared in cooperation with the International Joint Commission
Scientific Investigations Report 2018–5169
U.S. Department of the InteriorU.S. Geological Survey
U.S. Department of the InteriorDAVID BERNHARDT, Acting Secretary
U.S. Geological SurveyJames F. Reilly II, Director
U.S. Geological Survey, Reston, Virginia: 2019
For more information on the USGS—the Federal source for science about the Earth, its natural and living resources, natural hazards, and the environment—visit https://www.usgs.gov or call 1–888–ASK–USGS.
For an overview of USGS information products, including maps, imagery, and publications, visit https://store.usgs.gov.
Any use of trade, firm, or product names is for descriptive purposes only and does not imply endorsement by the U.S. Government.
Although this information product, for the most part, is in the public domain, it also may contain copyrighted materials as noted in the text. Permission to reproduce copyrighted items must be secured from the copyright owner.
Suggested citation:Flynn, R.H., and Hayes, L., 2019, Flood-inundation maps for Lake Champlain in Vermont and New York: U.S. Geological Survey Scientific Investigations Report 2018–5169, 14 p., https://doi.org/10.3133/sir20185169. [Supersedes USGS Scien-tific Investigations Report 2016–5060.]
ISSN 2328-0328 (online)
iii
Acknowledgments
The authors wish to thank the International Joint Commission for funding this study and the Vermont Agency of Transportation and New York Department of Environmental Conservation for funding the operation and maintenance of some of the gages used for this study. Thanks are given to the National Weather Service for their forecasted Lake Champlain stages at USGS Lake Gage 04295000 at Rouses Point, New York.
iv
ContentsAcknowledgments ........................................................................................................................................iiiAbstract ...........................................................................................................................................................1Introduction.....................................................................................................................................................2
Purpose and Scope ..............................................................................................................................2Study Area Description and Physical Setting ..................................................................................5Previous Flood Inundation Mapping Studies ...................................................................................6
Creation of Flood-Inundation-Map Series .................................................................................................6Computation of Water-Surface Flood-Inundation Extents .............................................................7
Hydrologic Data............................................................................................................................7Topographic Data .........................................................................................................................7Development of Water-Surface Flood Extents........................................................................8
Development of Flood-Inundation Maps and Grids ........................................................................8Flood-Inundation Map Delivery .................................................................................................8Disclaimer for Flood-Inundation Maps ....................................................................................8Uncertainties and Limitations Regarding Use of Flood-Inundation Maps .......................10
Estimating Potential Losses Due to Flooding ..........................................................................................10Summary........................................................................................................................................................10References Cited..........................................................................................................................................11
Figures
1. Map showing Lake Champlain Basin and U.S. Geological Survey lake gages ..................32. Flood-inundation map for Lake Champlain in New York and Vermont, corresponding
to a stage of 106.0 feet at the U.S. Geological Survey lake elevation gage at RichelieuRiver at Rouses Point, N.Y., and inset map showing 11 flood-inundation stages at St.Albans Bay, Vermont ....................................................................................................................9
Tables
1. Information for U.S. Geological Survey lake gages, Lake Champlain, Vermontand New York ................................................................................................................................4
2. Federal Emergency Management Agency flood insurance studies for townsabutting Lake Champlain in Vermont and New York ...............................................................4
v
Conversion Factors U.S. customary units to International System of Units
Multiply By To obtain
Length
inch (in.) 2.54 centimeter (cm)inch (in.) 25.4 millimeter (mm)foot (ft) 0.3048 meter (m)mile (mi) 1.609 kilometer (km)
Area
square mile (mi2) 2.590 square kilometer (km2)
Flow rate
cubic foot per second (ft3/s) 0.02832 cubic meter per second (m3/s)inch per year (in/yr) 25.4 millimeter per year (mm/yr)
DatumVertical coordinate information is referenced to (1) stage, the height above an arbitrary datum established at a lake gage, or (2) elevation, the height above the National Geodetic Vertical Datum of 1929 (NGVD 29) and (or) North American Vertical Datum of 1988 (NAVD 88).
Horizontal coordinate information is referenced to the North American Datum of 1983 (NAD 83).
Temperature in degrees Fahrenheit (°F) may be converted to degrees Celsius (°C) as °C = (°F – 32) / 1.8.

Flood-Inundation Maps for Lake Champlain in Vermont and New York
By Robert H. Flynn and Laura Hayes
AbstractIn 2016, digital flood-inundation maps along the shore-
line of Lake Champlain in Addison, Chittenden, Franklin, and Grand Isle Counties in Vermont and northern Clinton County in New York were created by the U.S. Geological Survey (USGS) in cooperation with the International Joint Commis-sion (IJC). This report discusses the creation of updated static digital flood-inundation mapping, in 2018, to include the entire shoreline of Lake Champlain in the United States. The flood-inundation maps, which can be accessed through the USGS Flood Inundation Mapping Science website at http://water.usgs.gov/osw/flood_inundation/, depict estimates of the areal extent of flooding corresponding to selected water-surface elevations (stages) at the USGS lake gages on Lake Champlain.
As a result of the record setting floods of May 2011 in Lake Champlain and the Richelieu River, the U.S. and Canadian governments requested that the IJC issue a reference for a study to identify how flood forecasting, preparedness, and mitigation could be improved in the Lake Champlain–Richelieu River Basin. The IJC submitted the Lake Champlain–Richelieu River Plan of Study to the govern-ments of Canada and the United States in 2013. The flood-inundation maps in this study are one aspect of the task work outlined in the IJC 2013 Plan of Study.
Wind and seiche effects (standing oscillating wave with a long wavelength) that can influence flooding along the Lake Champlain shoreline were not represented. The flood-inundation maps reflect 11 stages for Lake Champlain that are static for the entire area of the lake. Near-real-time stages at the USGS gages on Lake Champlain may be obtained from the USGS National Water Information System website at http://waterdata.usgs.gov/ (https://doi.org/10.5066/F7P55KJN) or from the National Weather Service Advanced Hydrologic Prediction Service at http://water.weather.gov/ahps/.
Updated static flood-inundation boundary extents were created for Lake Champlain in Franklin, Chittenden, Addison, Rutland, and Grand Isle Counties in Vermont and Clinton, Essex, and Washington Counties in New York by using
recently acquired (2009, 2012, 2014, and 2015) light detection and ranging (lidar) data. The corresponding flood-inundation maps may be referenced to any of the four active USGS lake gages on Lake Champlain. Of these four active lake gages, USGS lake gage 04295000, Richelieu River (Lake Champlain) at Rouses Point, N.Y.; USGS lake gage 04294500, Lake Champlain at Burlington, Vt.; USGS lake gage 04279085 Lake Champlain north of Whitehall, N.Y.; and USGS lake gage 04294413, Lake Champlain at Port Henry, N.Y., only the Richelieu River (Lake Champlain) at Rouses Point, N.Y., gage also serves as a National Weather Service prediction location. Lake Champlain static flood-inundation map boundary extents corresponding to the May 2011 peak flood stage (103.20 feet [ft], National Geodetic Vertical Datum of 1929 [NGVD 29], as recorded at the USGS Rouses Point lake gage, were com-pared to the flood-inundation area extents determined from satellite imagery for the May 2011 flood (which incorporated documented high-water marks from the flood of May 2011) and were found to be in good agreement. The May 2011 flood is the highest recorded lake water level (stage) at the Rouses Point, N.Y., and Burlington, Vt., lake gages. Flood stages greater than 101.5 ft (NGVD 29) exceed the “major flood stage” as defined by the National Weather Service for USGS lake gage 04295000.
Updated digital elevation models (DEMs) were created from the recent lidar data for Lake Champlain in Vermont and New York. These DEMs were used in determining the flood-inundation boundary and associated depth grids for 11 flood stages at 0.5-ft or 1-ft intervals from 100.0 to 106.0 ft (NGVD 29) as referenced to the USGS lake gages. In addition, the May 2011 flood-inundation area for elevation 103.20 ft (NGVD 29) (102.77 ft, North American Vertical Datum of 1988) was determined from these updated DEMs.
The availability of these maps, along with online infor-mation regarding current stages at the USGS lake gages and forecasted high-flow stages from the National Weather Service at USGS lake gage 04295000, Richelieu River (Lake Champlain) at Rouses Point, N.Y., will provide emergency management personnel and residents with information that is critical for flood response activities such as evacuations and road closures, as well as for post-flood recovery efforts.
2 Flood-Inundation Maps for Lake Champlain in Vermont and New York
IntroductionDuring the spring and summer of 2011, historic flood-
ing was recorded (Kiah and others, 2013) in Lake Champlain (fig. 1) as a result of heavy spring rainfall on a warm, satu-rated, late spring snowpack across the Androscoggin, Con-necticut, and St. Lawrence River Basins (which includes the Lake Champlain and Richelieu River Basins) in northern New Hampshire and Vermont. As a result of melting snow and rainfall, historically high flood levels were observed in Lake Champlain beginning in late April and extending through May 2011. Damage caused by shoreline erosion and variable lake levels during this period of high water was exacerbated by wind-driven waves associated with local fetch and lake-wide seiche effects (standing oscillating wave with a long wave-length) (Bjerklie and others, 2014). Seiche effects have been previously reported on the lake (Shanley and Denner, 1999) and are created by wind and atmospheric pressure changes.
The flood of May 2011 resulted in a period of record maximum stage (lake level) as recorded at all of the lake gages in Lake Champlain. The maximum recorded stage at U.S. Geological Survey (USGS) lake gage 04295000, Richelieu River (Lake Champlain) at Rouses Point, N.Y. (hereinafter referred to as the Rouses Point, N.Y., gage; USGS, 2018a), was 103.20 ft (National Geodetic Vertical Datum of 1929 [NGVD 29]) on May 6, 2011, and the maximum recorded stage at USGS lake gage 04294500, Lake Champlain at Burl-ington, Vt. (hereinafter referred to as the Burlington, Vt., gage; USGS, 2018b), was 103.27 ft (NGVD 29) on May 6, 2011 (table 1). The maximum recorded stage at the USGS lake gage 04279085, Lake Champlain north of Whitehall, N.Y. (herein-after referred to as the Whitehall, N.Y., gage; USGS, 2018c), was 103.57 ft (NGVD 29) on May 9, 2011. This lake eleva-tion, in the southern part of the lake, was affected by seiche (USGS, 2018c). Before the flooding of May 2011, the highest stage recorded at the Rouses Point, N.Y., gage was 102.1 ft (NGVD 29) on May 4, 1869 (USGS, 2018a), and the high-est stage recorded at the Burlington, Vt., gage was 101.86 ft (NGVD 29) on April 27, 1993 (USGS, 2018b).
Lake water-surface elevations recorded at the Rouses Point, N.Y., and Burlington, Vt., gages are generally in close agreement as both gages are located in the northern part of the lake. Although the net difference in lake levels at the Burlington and Rouses Point sites averages near zero, internal seiches in the lake have been found to cause differences in the lake levels by as much as 0.3 ft (0.1 meter [m]) (Shan-ley and Denner, 1999). On August 28, 2011, during tropical storm Irene, lake levels varied by as much as 4 ft, with a lake elevation of 98.5 ft (NGVD 29) at the Whitehall, N.Y., gage at the southern end of the lake and a lake elevation of 94.5 ft (NGVD 29) at the Rouses Point gage at the northern end of the lake (Lumia and others, 2014).
Prior to this study, emergency responders in the New York and Vermont communities bordering Lake Champlain relied on several information sources to make decisions on alerting the public and mitigating flood damages. One source
is the Federal Emergency Management Agency (FEMA) flood insurance studies (FIS) for the communities surrounding Lake Champlain. These communities are in Franklin, Chittenden, Addison, Rutland, and Grand Isle Counties in Vermont and Clinton, Essex, and Washington Counties in New York (table 2). Not all communities adjacent to Lake Champlain participate in the FIS program.
Data from the USGS lake gages (table 1) are a second source of information. Current and historical water levels, including annual peak stages, are available for five USGS lake gages (USGS, 2018a, b, c, d, e).
A third source of flood-related information is the National Weather Service (NWS) Advanced Hydrologic Prediction Ser-vice (AHPS), which displays the USGS stage and forecasted stage data for the Rouses Point, N.Y., gage (USGS, 2018a) and for the Burlington, Vt., gage (USGS, 2018b).
One way to address the informational gaps in flood extent is to produce a series of flood-inundation maps that are refer-enced to the stages recorded at the USGS lake gage. By refer-ring to the appropriate map, emergency responders can discern the severity of flooding (areal extent), identify roads that are or will soon be flooded, and make plans for notification or evacu-ation of residents in harm’s way. In addition, the capability to visualize the potential extent of flooding has been shown to motivate residents to take precautions and heed warnings that they previously might have disregarded. In 2014–15, the USGS, in cooperation with the International Joint Commission (IJC), conducted a project to produce a series of static flood-inundation maps for the perimeter of Lake Champlain where light detection and ranging (lidar) data were available. During 2018, updated static flood-inundation boundary extents were created for Lake Champlain in Franklin, Chittenden, Addison, Rutland, and Grand Isle Counties in Vermont and Clinton, Essex, and Washington Counties in New York. These updated maps include creation of static flood-inundation boundaries on the New York side of Lake Champlain (south of the northern part of Clinton County) along with the creation of depth grids for all of Lake Champlain. The previous report (Flynn and Hayes, 2016) did not include this information. In addition, recently acquired, higher resolution lidar data were used for the creation of the flood-inundation boundaries and depth grids for Rutland, Grand Isle, and Chittenden Counties in Vermont as well as for northern Clinton County in New York. The Lake Champlain static flood-inundation maps are intended to aid residents in assessing the extent of flooding based on the stage as shown on the USGS gage websites and stage predictions by the NWS for the Rouses Point, N.Y., gage.
Purpose and Scope
This report describes the development of a series of 11 estimated flood-inundation maps for the entire shoreline of Lake Champlain in Franklin, Chittenden, Addison, Rutland, and Grand Isle Counties in Vermont and Clinton, Essex, and Washington Counties in New York and identifies where these maps and ancillary data (for example, geographic information
Introduction 3
Bo
uque
t River
St. L
aw
rence River
Rich
elieu
Riv
er
MissisquoiBay
MalletsBay
InlandSea
Main Lake
Sout
h La
ke
Lamoille R iver
Winooski River
Otter Creek
0 10 20 MILES
0 10 20 KILOMETERS
EXPLANATION
#
Lake Champlain Basin
U.S. Geological Surveylake gage and identifier
Terrain
73°74°
45°
44°
LakeChamplain
Lake
Geo
rge
Base from U.S. National Park Service, Natural Earth physical map, 500-meter resolution, http://services.arcgisonline.com/ArcGIS/rest/services, 2015Albers Conic projection, North American Datum of 1983 (NAD 83)
Lake
Mem
phre
mago
g
Missisquoi R ive
r
Poultne y River
L
aC
hute
Sara
nac
Riv er
N. Branch Saranac R.
Ausable River
West B
ranch Ausab le R.
Eas
t Bra
nch
Ausa
ble R
.
GreenMountains
Adirondack Mountains
Taconic Mountains
CLINTON COUNTY
GRANDISLE
COUNTY
CHITTENDEN COUNTY
FRANKLIN COUNTY
LAMOILLECOUNTY
ADDISONCOUNTY
RUTLANDCOUNTYWASHINGTON
COUNTY
WARRENCOUNTY
ESSEX COUNTY
WINDSORCOUNTY
ORANGECOUNTY
WASHINGTONCOUNTY
ORLEANSCOUNTY
BENNINGTON
COUNTY
FRANKLIN COUNTY
CANADA
UNITED STATES
VER
MO
NT
NEW
HA
MPS
HIR
E
ONTARIO QUEBEC
HAMILTONCOUNTY
NE
W Y
OR
KV
ER
MO
NT
!(
!(
!(!(
!(
!(
Montpelier
Rutland
Burlington
South Burlington
Colchester
Plattsburgh
Rouses Point
Grand Isle
Port Henry
GlensFalls
Lebanon
Whitehall
Essex Charlotte
Saint-Jean-sur-Richelieu
Chambly
Fryer Island
#
#
#
#
#
04295000
04294620
04294500
04294413
04279085
04279085
Figure 1.
Herbaceous
Forest
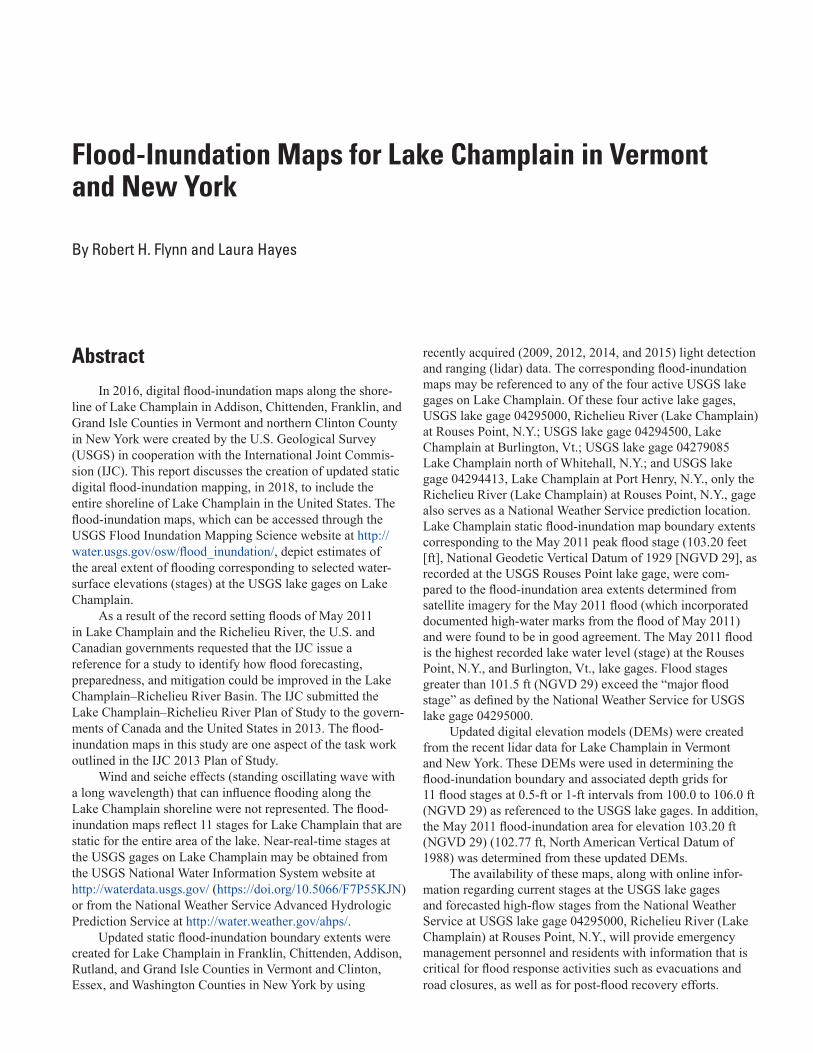
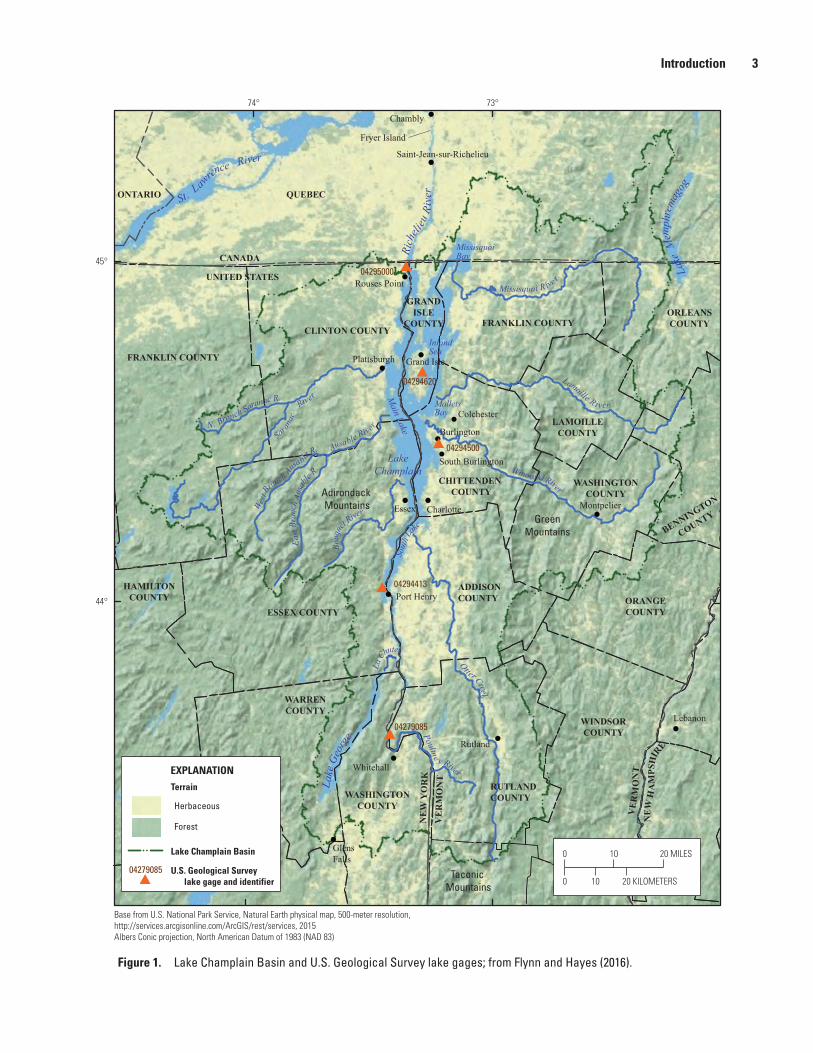
Figure 1. Lake Champlain Basin and U.S. Geological Survey lake gages; from Flynn and Hayes (2016).
4 Flood-Inundation Maps for Lake Champlain in Vermont and New York
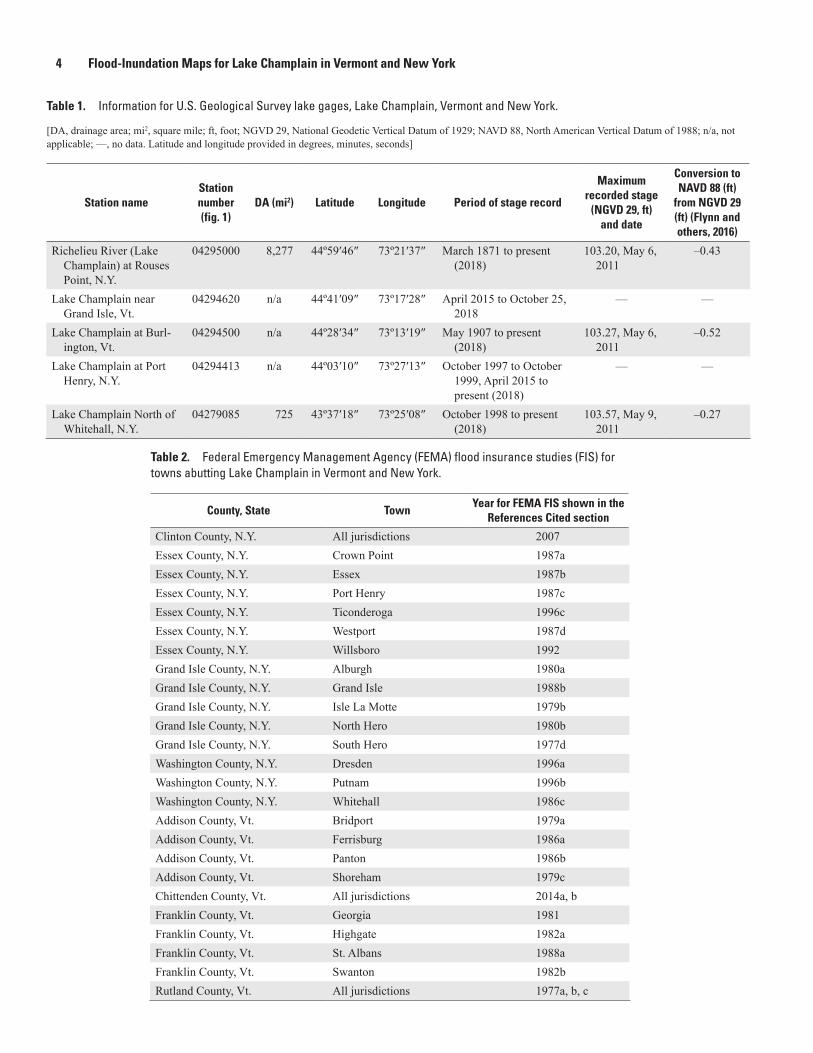
Table 2. Federal Emergency Management Agency (FEMA) flood insurance studies (FIS) for towns abutting Lake Champlain in Vermont and New York.
County, State TownYear for FEMA FIS shown in the
References Cited section
Clinton County, N.Y. All jurisdictions 2007Essex County, N.Y. Crown Point 1987aEssex County, N.Y. Essex 1987bEssex County, N.Y. Port Henry 1987cEssex County, N.Y. Ticonderoga 1996cEssex County, N.Y. Westport 1987dEssex County, N.Y. Willsboro 1992Grand Isle County, N.Y. Alburgh 1980aGrand Isle County, N.Y. Grand Isle 1988bGrand Isle County, N.Y. Isle La Motte 1979bGrand Isle County, N.Y. North Hero 1980bGrand Isle County, N.Y. South Hero 1977dWashington County, N.Y. Dresden 1996aWashington County, N.Y. Putnam 1996bWashington County, N.Y. Whitehall 1986cAddison County, Vt. Bridport 1979aAddison County, Vt. Ferrisburg 1986aAddison County, Vt. Panton 1986bAddison County, Vt. Shoreham 1979cChittenden County, Vt. All jurisdictions 2014a, bFranklin County, Vt. Georgia 1981Franklin County, Vt. Highgate 1982aFranklin County, Vt. St. Albans 1988aFranklin County, Vt. Swanton 1982bRutland County, Vt. All jurisdictions 1977a, b, c
Table 1. Information for U.S. Geological Survey lake gages, Lake Champlain, Vermont and New York.
[DA, drainage area; mi2, square mile; ft, foot; NGVD 29, National Geodetic Vertical Datum of 1929; NAVD 88, North American Vertical Datum of 1988; n/a, not applicable; —, no data. Latitude and longitude provided in degrees, minutes, seconds]
Station nameStation number (fig. 1)
DA (mi2) Latitude Longitude Period of stage record
Maximum recorded stage
(NGVD 29, ft) and date
Conversion to NAVD 88 (ft)
from NGVD 29 (ft) (Flynn and others, 2016)
Richelieu River (Lake Champlain) at Rouses Point, N.Y.
04295000 8,277 44º59′46″ 73º21′37″ March 1871 to present (2018)
103.20, May 6, 2011
–0.43
Lake Champlain near Grand Isle, Vt.
04294620 n/a 44º41′09″ 73º17′28″ April 2015 to October 25, 2018
— —
Lake Champlain at Burl-ington, Vt.
04294500 n/a 44º28′34″ 73º13′19″ May 1907 to present (2018)
103.27, May 6, 2011
–0.52
Lake Champlain at Port Henry, N.Y.
04294413 n/a 44º03′10″ 73º27′13″ October 1997 to October 1999, April 2015 to present (2018)
— —
Lake Champlain North of Whitehall, N.Y.
04279085 725 43º37′18″ 73º25′08″ October 1998 to present (2018)
103.57, May 9, 2011
–0.27
Introduction 5
system [GIS] flood lines, polygons, and depth grids) can be accessed online. This report supersedes a previously published flood-inundation report and maps for portions of the Lake Champlain area (Flynn and Hayes, 2016) and includes areas of the lake previously not mapped for flood inundation.
The Lake Champlain flood-inundation maps cover a straight-line lake distance of approximately 120 miles (mi) in length on the eastern side of the Lake from Rutland County in Vermont north to the United States/Canadian border and approximately 120 mi in length on the western side of the Lake from Washington County north to the United States/Canadian border (fig. 1). The maps were produced for flood levels which can be referenced to the stage recorded at any of the five lake gages on Lake Champlain (table 1). These flood-inundation maps for Lake Champlain are static and, therefore, do not factor in wind and seiche.
The flood-inundation maps cover a range in stage from 100 ft to 106 ft, referenced to the lake gage datum of NGVD 29. The 99.9-foot (ft; NGVD 29) stage is defined by theNWS as the “action stage” or that stage which, when reached,requires the NWS or a partner to take some type of mitiga-tion action in preparation for possible substantial hydrologicactivity (NWS, 2018a, b). The 100.0-ft (NGVD 29) stageis defined by the NWS as the minor “flood stage” (NWS,2018a). The 103.20-ft, 103.27-ft, and 103.57-ft (NGVD 29)stages are the highest recorded water levels at the lake gagesat Rouses Point, N.Y.; Burlington, Vt.; and Whitehall, N.Y.,respectively. These stages exceed the “major flood stage” of101.5 ft (NGVD 29) as defined by the NWS for the Burling-ton, Vt., and Rouses Point, N.Y., gages. Major flood stage isnot defined by the NWS for the Whitehall, N.Y., gage but, atthe USGS Port Henry gage, approximately 40 mi north of theUSGS Whitehall gage, it is defined at 103.0 ft (NGVD 29).
Study Area Description and Physical Setting
Lake Champlain (fig. 1) is located in a broad valley between the Adirondack Mountains of New York to the west, the Green Mountains of Vermont to the east, and the Taconic Mountains to the south (not shown in fig. 1). During the last glacial period, retreating glaciers left a large body of freshwa-ter that covered the present day Great Lakes, Lake Champlain, and much of the St. Lawrence River Valley (Lake Champlain Research Consortium, 2004). The Lake Champlain Basin area comprises 8,234 square miles (mi2) and has 587 mi of shore-line (Lake Champlain Basin Program, 2013) in New York, Vermont, and Quebec, Canada. The surface area of the lake, at a mean elevation of 95.5 ft (NGVD 29), occupies 435 mi2 (Lake Champlain Basin Program, 2015), or approximately 5.3 percent of the basin, excluding islands. The southern end (or South Lake, fig. 1) is a narrow river-like region, whereas in the central region (or Main Lake, fig. 1), the lake is wide with some small islands. In the northern region, the lake is widest with several large islands. The drainage basin area for Lake
Champlain is 56 percent in Vermont, 37 percent in New York, and 7 percent in the Province of Quebec, Canada.
Lake Champlain is the largest freshwater lake in the United States outside of the five Great Lakes (Stickney and others, 2001). Water transiting through Lake Champlain flows north from Whitehall, N.Y., to the United States/Canadian border at the inlet to the Richelieu River. The Richelieu River extends north from Rouses Point, N.Y., downstream to Sorel, Quebec, Canada (not shown in fig. 1), where the Richelieu River flows into the St. Lawrence River and ultimately flows into the Atlantic Ocean from the Gulf of St. Lawrence. Lake Champlain extends from Whitehall, N.Y., in the south to the Richelieu River in Quebec, Canada (Lake Champlain Basin Program, 2015).
Lake Champlain is in the physiographic province of the Champlain Lowlands (not shown in fig. 1). The lake is divided into five distinct areas (Lake Champlain Basin Program, 2015): the South Lake, the Main Lake (or Broad Lake), Malletts Bay, the Inland Sea (or Northeast Arm), and Missisquoi Bay (fig. 1). Water retention time is approximately 3 years in the Main Lake and less than 2 months in the South Lake (Lake Champlain Basin Program, 2015). With a popu-lation of 42,239, Burlington, Vt., is the largest city on the lake (in 2017, U.S. Census Bureau, 2018a). The second and third most populated cities are Plattsburgh, N.Y., and South Burlington, Vt., with populations of 19,696 (in 2017, U.S. Census Bureau, 2018b) and 19,141 (in 2017, U.S. Census Bureau, 2018c), respectively.
The population distribution in the drainage basin consists of 68 percent in Vermont, 27 percent in New York, and 5 per-cent in Quebec (Lake Champlain Basin Program, 2015). Mean precipitation over the Lake Champlain Basin varies between 30 and 50 inches per year depending on the watershed location within the basin (Howland and others, 2006). The mean air temperature within the basin is 45 degrees Fahrenheit (Shanley and Denner, 1999).
Lake Champlain was formed approximately 11,000 years ago as the last glacial period ended and left behind a large body of freshwater that covered the present-day Great Lakes (not shown), Lake Champlain, and much of the St. Lawrence River valley (Lake Champlain Research Consortium, 2004). The lake is 12 mi at its widest point with an average depth of 64 ft, although the deepest point is between Charlotte, Vt., and Essex, N.Y., with a depth of 400 ft (Lake Champlain Land Trust, 2015). Average annual water level is 95.5 ft (NGVD 29) with a typical annual variation between high and lowaverage water levels of approximately 6 ft and a maximumrange of 9.4 ft since the 1870s when daily records began (LakeChamplain Basin Program, 2015). After floods in the 1930s, adam was built in 1939 at Fryer Island to regulate the RichelieuRiver flow (Riboust and Brissette, 2015). However, leveesaround the dam and dredging of the shoals at Saint-Jean-sur-Richelieu were never completed (IJC, 2013). The damwas never put into service, and the Richelieu River remainsunregulated (Riboust and Brissette, 2015).
6 Flood-Inundation Maps for Lake Champlain in Vermont and New York
In the spring, snowmelt and the inflows to Lake Cham-plain typically become greater than the outflow into the Riche-lieu River in Quebec, Canada (Shanley and Denner, 1999), and as a result, lake levels rise during the spring. In Vermont, the largest rivers that flow into Lake Champlain include the Missisquoi, Lamoille, Poultney, and Winooski Rivers and Otter Creek, and in New York, they include the Ausable, La Chute (outflow of Lake George), Saranac, and Bouquet Rivers. Tributaries to Lake Champlain are primarily high-gradient streams that peak within 24 hours in response to precipita-tion or snowmelt (Bjerklie and others, 2014). The dominant hydrologic event during the year is snowmelt in spring, when typically nearly one-half of the annual streamflow occurs in a 6- to 8-week period (Shanley and Denner, 1999). The response of the Lake Champlain outflow to inflow is not instantaneous, and the lake plays an important role in regulating flow to the Richelieu River. Because of the storage capacity of the lake, the lake level peak lags the peak inflow by several days. The Richelieu River and Lake Champlain Basins are dominated by strong spring flooding but have more moderate flows through-out the rest of the year. Richelieu River discharge is effectively controlled by the water level in Lake Champlain with approxi-mately 95 percent of the Richelieu River’s outlet flow into the St. Lawrence River originating in Lake Champlain (Riboust and Brissette, 2015).
At the Rouses Point, N.Y., gage, major flood stage, as designated by the NWS (2018a), is 101.5 ft (NGVD 29), moderate flood stage is 101.0 ft (NGVD 29), and minor flood stage is 100.0 ft (NGVD 29). As a result of the rainfall and runoff events of April and May 2011, Lake Champlain was above flood stage for 67 consecutive days, reaching its peak stage of 103.2 ft on May 6, 2011. Lake Champlain was above the NWS-designated major flood stage for the entire month of May 2011 (Bjerklie and others, 2014). High winds resulted in wave heights in excess of 3 ft (Lake Champlain Basin Pro-gram, 2013) on Lake Champlain, and these waves exacerbated shoreline erosion and damage. During and following the May 2011 flooding, Vermont declared a state of emergency, and a Presidential disaster declaration (declaration number 1995-DR: http://www.fema.gov/pdf/news/pda/1995.pdf) was made on June 15, 2011.
At the Rouses Point, N.Y., gage, the maximum flood elevation of 103.20 ft (NGVD 29) was observed on May 6, 2011. This maximum lake level is 1.10 ft above the previ-ous record of 102.10 ft (NGVD 29), set on May 4, 1869, and 7.70 ft above its mean level of 95.5 ft. A record flood eleva-tion of 103.27 ft (NGVD 29) was reached at the Burlington, Vt., gage on May 6, 2011. This lake level is 1.41 ft above the previous record of 101.86 ft (NGVD 29), set on April 27, 1993, and 7.77 ft above its mean level of 95.5 ft. The mini-mum observed elevation for the lake was 92.61 ft, which was recorded on December 4, 1908, at the Burlington, Vt., gage. The highest lake elevation for Lake Champlain occurred at the Whitehall, N.Y., gage, with a peak flood elevation of 103.57 ft (NGVD 29) on May 9, 2011 (USGS, 2018a). This lake eleva-tion at the Whitehall, N.Y., gage was affected by seiche.
While the flood of May 2011 resulted in a period of record maximum stage as recorded at all of the lake gages in Lake Champlain, flooding is a recurring issue for the Riche-lieu River and Lake Champlain. For the 2011 flood, May and June monthly precipitation occurred at record levels, and this was coupled with an above-average snowpack, resulting in lake levels that took more than 2 months to fall below the flood level (Lake Champlain Basin Program, 2015) and causing approximately 3,000 homes to be flooded (Riboust and Brissette, 2015) in the Lake Champlain and Richelieu River Basins. In Vermont, 419 homes were damaged and 24 destroyed (Medalie and Olson, 2013), and in New York, hundreds of homes and several businesses were damaged (Lumia and others, 2014). The Canadian government esti-mated the Canadian cost of the 2011 flood to be 70 million U.S. dollars, and the estimated cost of flood damage in New York and Vermont was approximately 20 million U.S. dollars (IJC, 2013).
Previous Flood Inundation Mapping Studies
This report supersedes and details an update to the Lake Champlain static flood-inundation report and mapping (Flynn and Hayes, 2016) and includes areas of the lake previously not mapped for flood inundation. Because lidar data were not available for several counties along the Lake Champlain shoreline, the previous study report and mapping included only four counties in Vermont (Franklin, Chittenden, Addison, and Grand Isle) and one county in New York (Clinton).
Creation of Flood-Inundation-Map Series
Flood-inundation maps were created during this study for five counties in Vermont (Franklin, Chittenden, Addison, Rutland, and Grand Isle) and three counties in New York (Clinton, Essex, and Washington) that have shoreline on Lake Champlain.
The USGS has standardized the procedures for creating flood-inundation maps for flood-prone communities (USGS, 2018f) so that the process followed and products produced are similar among study areas. Tasks specific to development of the flood-inundation maps for Lake Champlain included the following: (1) collection of lidar topographic data, (2) compar-ison of 2011 Lake Champlain flood extent with a study using satellite imagery (Bjerklie and others, 2014) and from high-water mark data (Medalie and Olson, 2013), (3) determination of flood extent inundation maps for 11 static lake stages for Lake Champlain based on digital elevation models (DEMs) created from lidar within a GIS, (4) preparation of the maps, as shapefile lines, polygons, and depth grids that depict
Creation of Flood-Inundation-Map Series 7
the areal extent of flood inundation and provide the depth of floodwaters for display on a USGS flood-inundation mapping application (USGS, 2018f) and the IJC website (IJC, 2015), and (5) installation of a lake gage (04294620) at Grand Isle, Vt. (discontinued October 25, 2018), and re-establishment of a lake gage (04294413) at Port Henry, N.Y., to have a network of five lake gages on Lake Champlain to aid users of the inun-dation maps in determining the variability of water-surface elevations for estimating lake levels for specified locations around Lake Champlain (table 1).
Computation of Water-Surface Flood-Inundation Extents
The study area flood-inundation maps focus on the shore-line areas of Lake Champlain in Vermont and New York. The static water-surface extents of the 11 flood-inundation maps in this study were determined for Lake Champlain from DEMs created from lidar data acquired between 2009 and 2015 for Rutland, Addison, Chittenden, Franklin, and Grand Isle Counties in Vermont and for Washington, Essex, and Clinton Counties in New York.
Hydrologic Data
The study area includes five Lake Champlain lake gages (table 1). Three of the lake gages were in operation before this study, one gage (Lake Champlain near Grand Isle, Vt.) was established and then discontinued in October 2018, and one gage (Lake Champlain at Port Henry, N.Y.) was re-activated for an IJC study of the Lake Champlain–Richelieu River Basin of which creation of these FIMs are a component of that study. Because the 11 study area flood-inundation maps are static maps, they can be referenced to any of the USGS lake gages on Lake Champlain. The flood elevation of 103.20 ft (NGVD 29) is, however, referenced to the Rouses Point, N.Y., gage because that is the flood elevation of record at that gage (table 1). In addition, the Rouses Point, N.Y., gage is a predic-tion site for the NWS (NWS, 2018a), and users can reference the USGS and NWS information along with the appropriate flood-inundation contour, to determine the extent of predicted flooding for the Lake Champlain location of interest.
The Rouses Point, N.Y., gage (04295000) has been in operation since March 1871 and was a non-recording gage until 1939. Stage is measured every 15 minutes, transmitted hourly by a satellite radio in the lake gage, and made available online through the USGS National Water Information System (USGS, 2018a). Stage data from this lake gage are refer-enced to NGVD 29 but can be converted to water-surface elevations referenced to the North American Vertical Datum of 1988 (NAVD 88) by subtracting 0.43 ft from the NGVD 29 elevation. The conversion value of 0.43 ft was determined
from a Global Navigation Satellite System survey (Flynn and others, 2016).
Locations for the USGS lake gages for Lake Champlain are shown in figure 1. The lake gages are all referenced to NGVD 29 (ft) with the exception of the Lake Champlain near Grand Isle lake gage, which is referenced to NAVD 88 (ft). To convert Grand Isle lake gage elevations to NGVD 29 (ft), add 0.45 ft to given NAVD 88 (ft) stage values.
In addition to water levels from the Rouses Point, N.Y., gage, historical water levels are available from October 1998 at the Lake Champlain North of Whitehall, N.Y., gage and from May 1907 at the Lake Champlain at Burlington, Vt., gage. The lake gage at Port Henry, N.Y., (hereinafter referred to as the Port Henry, N.Y., gage; USGS, 2018d) was re-activated on April 10, 2015, and has historical water level data from October 16, 1997, to September 20, 1999; the lake gage at Grand Isle, Vt., (04294620; hereinafter referred to as the Grand Isle, Vt., gage; USGS, 2018e) is a new gage that was activated on March 31, 2015, and was discontinued on October 25, 2018.
Topographic DataAll topographic data in this study are referenced verti-
cally to NAVD 88 and horizontally to the North American Datum of 1983. The 11 static flood-inundation maps are referenced to NGVD 29 with a datum conversion value of 0.43 applied (to create contours in NAVD 88) as determined at the Rouses Point, N.Y., gage. The vertical datum adjustment between NAVD 88 and NGVD 29 varies across the study area. Because the conversion value of 0.43 ft as determined at the Rouses Point gage was used to convert between NAVD 88 and NGVD 29, the converted NAVD 88 values for the southern area of the lake have up to a 0.16-ft error. The lidar data for Vermont were collected during 2009, 2012, 2014, and 2015 by Photo Science, Inc., and by Quantum Spatial, both of Lexing-ton, Kentucky. Postprocessing of these data was completed in 2009 for Franklin County, in 2013 for Addison County, in 2015 for Chittenden County, and in 2016 for Grand Isle and Rutland Counties. The lidar data for New York were collected during 2014 and 2015 by Quantum Spatial for Clinton and Essex Counties and by Atlantic of Huntsville, Alabama, con-tracted by Axis Geospatial of Easton, Maryland, for Washing-ton County. Postprocessing of the lidar data for New York was completed in 2015.
The lidar data have vertical root mean square errors (RMSEz) ranging from 1.9 to 3.2 inches (4.9 to 8.2 centimeters [cm]), which compute to 3.8 to 6.4 inches (9.6 to 16.1 cm) vertical accuracy (Accuracyz = RMSEz * 1.96), and DEM hori-zontal resolutions ranging from 2.30 to 5.25 ft (0.7 to 1.6 m) (Photo Science, Inc., 2009, 2013, 2015, 2016; Axis Geospatial, 2015; Quantum Spatial, 2015). The lidar data specifications support production of 1-ft contours (Dewberry, 2012).
8 Flood-Inundation Maps for Lake Champlain in Vermont and New York
Development of Water-Surface Flood Extents
The DEMs created from the lidar were used to generate water-surface flood-inundation maps for a total of 11 stages. Ten were at 0.5- or 1.0-ft intervals between 100 and 106 ft as follows: 100, 101, 101.5, 102, 102.5, 103, 103.5, 104, 105, and 106 as referenced to NGVD 29 of the Rouses Point, N.Y., gage. An additional stage of 103.2 ft was also generated to show the flood-inundation area during the May 2011 flood. The stages of 100 to 106 ft, NGVD 29, at lake gage 04295000 correspond to elevations of 99.57 to 105.57 ft, NAVD 88, respectively (fig. 2).
Development of Flood-Inundation Maps and Grids
A hydraulic model was not developed for the Lake Champlain inundation mapping effort. Instead, the 11 static and discrete inundation flood data and maps were created for Lake Champlain to represent a range of hydraulic scenarios from the minimum designated flood stage of 100.0 ft NGVD 29 (NWS, 2018a, b) at the Burlington, Vt., and Rouses Point, N.Y., lake gages to greater than the peak of record high-water flood stage observed in May 2011. The flood of May 2011, as recorded at the Rouses Point, N.Y., gage, was estimated to have an annual exceedance probability less than or equal to 0.2 percent (Olson and Bent, 2013; equal to or greater than the 500-year recurrence interval). The inundation maps represent 11 stages as referenced to the Rouses Point, N.Y., gage. Because this lake gage is also an AHPS site for the NWS (2018a), the user can obtain applicable information on fore-casted peak stages. The 11 stages (NGVD 29) are 100, 101, 101.5, 102, 102.5, 103, 103.2 (May 2011 flood), 103.5, 104, 105, and 106.
The inundation map for the flood of May 2011 (103.20 ft, NGVD 29, which is 102.77, NAVD 88) was referenced to the stage at the Rouses Point, N.Y., gage and compared to a flood map created from satellite imagery (Bjerklie and others, 2014) which had been calibrated to high-water marks (Medalie and Olson, 2013). The map layers from the two studies were overlaid and found to generally match, but a detailed compari-son could not be accurately made or easily quantified because of the differences in methods and data resolutions. Bjerklie and others (2014) took wind and wave effects into account, whereas the current (2018) study did not. Also, the satellite imagery used in the 2014 report had resolutions of 30, 120, or 250 m (about 98, 394, and 820 ft), whereas the lidar-created DEM data used in this 2018 report had resolutions of 0.7, 1.0, or 1.6 m (about 2.3, 3.3, and 5.3 ft).
After creation of the flood-inundation maps show-ing flood surface elevation and flood extents, the data were combined with a detailed ground-surface elevation model (lidar-based DEM) within ArcGIS (Esri, 2018). This pro-cess resulted in the creation of a raster grid with 2-m × 2-m
(about 6.5-ft × 6.5-ft) cells showing where flooding will occur for each of the 11 flood scenarios as well as an estimate of how deep the flooding is for individual grid cells in the flood-inundation area. The depth grids do not cover the lake area, but are limited to the inundated land areas. The Esri grid for-mats were converted to tagged image format (TIF) files, which range from about 167 to 235 megabytes (MB) each.
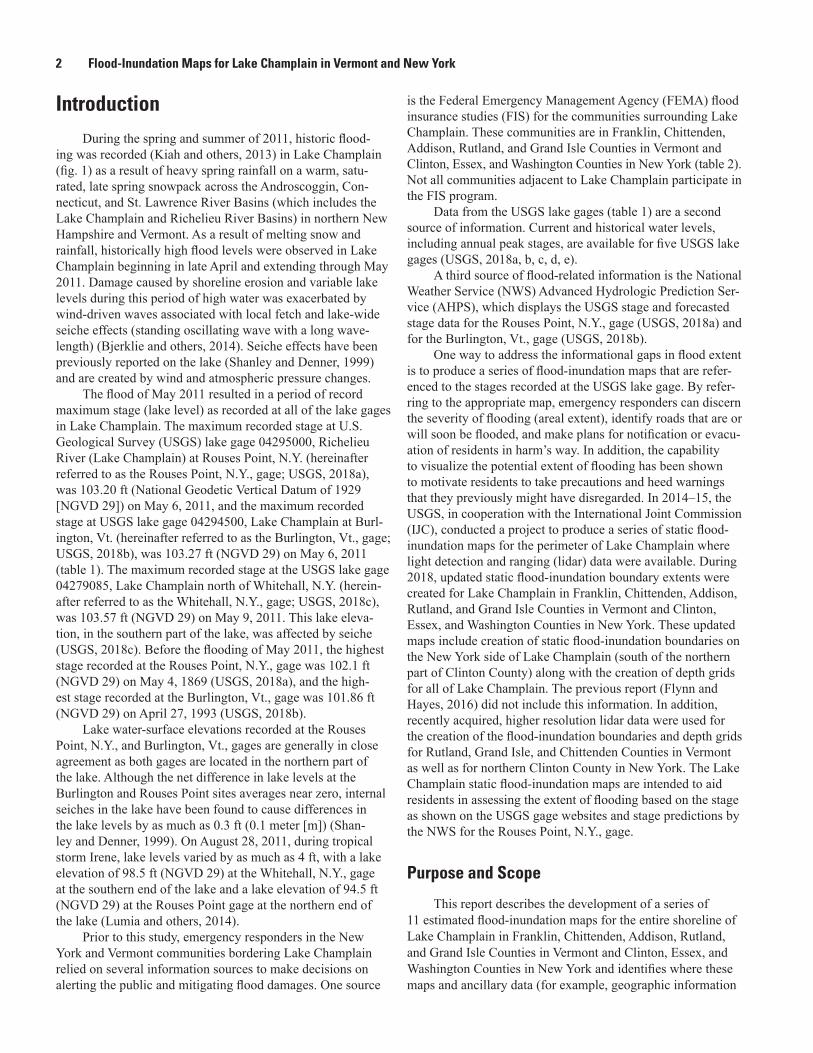
Flood-inundation maps were created for Lake Champlain and can be referenced to any of the four active USGS lake gages on Lake Champlain. Flood-inundation data layers were created within a GIS for the 11 water-surface elevations by using the DEM data created from lidar data. Estimated flood-inundation boundaries for each simulated profile were devel-oped with the ArcMap application of ArcGIS (Esri, 2018). The flood map corresponding to the highest water-surface eleva-tion mapped, a stage of 106.0 ft (NGVD 29 [105.57 ft, NAVD 88], is presented in figure 2 along with an inset showing the 11 flood-inundation extents at St. Albans Bay.
Flood-Inundation Map Delivery
The current study documentation and shapefiles of the flood-inundation boundaries are available online at https://doi.org/10.3133/sir20185169. Also, a USGS Flood Inundation Mapping Science website (USGS, 2018f) has been established to make USGS flood-inundation study information available to the public. The USGS website links to a mapping application that presents map libraries and provides detailed information on flood extents for modeled sites. The mapping application enables the production of customized flood-inundation maps from the map series for Lake Champlain. A link on the USGS website connects to the USGS National Water Information System (USGS, 2018a), which presents the current stage at the Rouses Point, N.Y., gage for which the inundation maps are referenced. A second link connects to the NWS AHPS website (NWS, 2015a) so that the user can obtain applicable informa-tion on forecasted peak stage. The estimated flood-inundation maps are displayed in sufficient detail so that preparations for flooding and decisions for emergency response can be per-formed efficiently. All GIS files presented on the USGS Flood Inundation Mapping Science website and metadata associated with each of the files are available as a USGS data release (Hayes and Flynn, 2019).
Disclaimer for Flood-Inundation Maps
The flood-inundation maps should not be used for navigation, regulatory, permitting, or other legal purposes. The USGS provides these maps “as-is” for a quick reference, emergency planning tool but assumes no legal liability or responsibility resulting from the use of this information. In addition, as these flood-inundation maps are static, they do not account for the effects of wind and seiche on lake levels.

Creation of Flood-Inundation-Map Series 9
Figure 2.
!
72°30'73°30' 73°
45°
44°30'
44°
43°30'
!
!
!
!
0 250 500 FEET
0 50 100 METERS
EXPLANATION
99.57100.57101.07101.57102.07102.57
102.77103.07103.57104.57105.57
Contour lines (elevations in feet relative to North American Vertical Datum of 1988)
St. Albans Bay
NEW YORK VERMONT
QUEBEC CANADAUNITED STATES
04294413
04294500
04294620
04295000
Burlington
Plattsburgh
Port Henry
LakeChamplain
Rutland04279085
Whitehall
Middlebury
0 5 10 MILES
0 5 10 KILOMETERS
U.S. Geological Surveylake gage and identifier
04279085
Base from U.S. National Park Service, Natural Earth physical map, 500-meter resolution, http://services.arcgisonline.com/ArcGIS/rest/services, 2015Albers Conic projection, North American Datum of 1983 (NAD 83)
Herbaceous
Forest
Terrain
Figure 2. Flood-inundation map for Lake Champlain in New York and Vermont, corresponding to a stage of 106.0 feet (National Geodetic Vertical Datum of 1929) (105.57 ft, North American Vertical Datum of 1988) at the U.S. Geological Survey lake elevation gage at Richelieu River (Lake Champlain) at Rouses Point, N.Y. (station number 04295000), and inset map showing 11 flood-inundation stages at St. Albans Bay, Vermont.
10 Flood-Inundation Maps for Lake Champlain in Vermont and New York
Uncertainties and Limitations Regarding Use of Flood-Inundation Maps
Although the flood-inundation maps represent the bound-aries of inundated areas with a distinct line, some uncertainty is associated with these maps. Because the flood-inundation maps are static maps, each for a given flood event, the lake stage and associated flood boundary extent at one USGS lake gage may not correspond to the lake stage and associated flood boundary extent at another USGS lake gage. In addi-tion, a flood stage predicted by the NWS at the Rouses Point, N.Y., gage (04295000) may not be the same as a flood stage at another location on the lake. Unique meteorological factors (timing and distribution of precipitation), wind, and seiche may cause actual water-surface elevations in Lake Champlain to vary from the assumed static flood elevations depicted, which may lead to deviations from the inundation boundaries shown. Additional areas may be flooded due to unanticipated conditions such as backwater from localized debris or ice jams.
Lake Champlain static flood-inundation map boundary extents corresponding to the May 2011 flood (103.2 ft, NGVD 29) were evaluated by comparing these boundary extents to the stage at the Rouses Point, N.Y., gage and flood-inundation area extents determined from satellite imagery for the May 2011 flood (which incorporated documented high-water marks from the flood of May 2011) (Bjerklie and others, 2014) and were found to be in rough agreement. In addition, although the flood-inundation boundary extents are shown in tributar-ies near the confluence to the lake, hydraulic analyses of the tributaries were not done as part of this study, and, as such, these boundary extents do not reflect the stream water surface, only the lake water surface.
The vertical accuracy of the lidar data available for the Lake Champlain region ranges from 0.32 to 0.53 ft (9.9 to 16.1 cm, respectively). A 95-percent confidence level accu-racy means that 95 percent of the positions in the dataset will have an error, with respect to true ground position, that is equal to or smaller than the reported accuracy value (FEMA, 2010). FEMA’s guidelines state that lidar data with a vertical accuracy of 18 cm (0.59 ft) or better (< 18 cm) support 1-foot contour intervals. The 1-foot contour intervals therefore are supported by these data’s vertical accuracy; however, the 0.5-ft interval contours presented may not meet FEMA’s recommen-dations (for 0.5-ft interval) and thus should be considered an approximation (FEMA, 2010, 2016).
If this series of flood-inundation maps will be used in conjunction with NWS river forecasts, the user should be aware of additional uncertainties in the maps that may be inherent or factored into NWS forecast procedures. The static flood-inundation maps for Lake Champlain do not factor in wind and seiche and were produced for flood levels referenced to the stage recorded or forecasted at the Rouses Point, N.Y., gage (04295000). The NWS uses forecast models to estimate the quantity and timing of water flowing through
selected stream and lake locations in the United States. These forecast models (1) estimate the amount of runoff generated by precipitation and snowmelt, (2) simulate the movement of floodwater as it proceeds downstream, and (3) predict the flow and stage (and water-surface elevation) for a water body at a given location (AHPS forecast point) throughout the forecast period (every 6 hours and 3 to 5 days out in many locations). These forecasts have their own uncertainties that must be con-sidered with the uncertainties associated with the maps. For more information on AHPS forecasts, please see http://water.weather.gov/ahps/pcpn_and_river_forecasting.pdf.
Estimating Potential Losses Due to Flooding
The flood-inundation maps provide general information relative to the depth and areal extent of flooding. These data can aid in assessing populations and infrastructure at risk and estimating potential losses from disasters such as floods and hurricanes. Government planners, GIS specialists, and emergency managers can use these flood-inundation maps to estimate losses from floods and to assess the most beneficial mitigation approaches to minimize these losses.
SummaryIn 2016, digital flood-inundation maps along the shore-
line of Lake Champlain in Addison, Chittenden, Franklin, and Grand Isle Counties in Vermont and northern Clinton County in New York were created by the U.S. Geological Survey (USGS) in cooperation with the International Joint Commis-sion (IJC). In 2018, updated static digital flood-inundation maps were created to include the entire shoreline of Lake Champlain in the United States due to the availability of new light detection and ranging (lidar) data for the entire lake shoreline. These flood-inundation maps for Lake Champlain include the lake border counties of Franklin, Chittenden, Addi-son, Rutland, and Grand Isle in Vermont and Clinton, Essex, and Washington in New York. The maps were developed by using lidar data collected in 2009, 2012, 2014, and 2015. The lidar data were used to determine static water-surface eleva-tions and to delineate estimated flood-inundation extents as shapefile polygons and depth grids for each profile and can be referenced to any of the four active lake gages on Lake Cham-plain. Water-surface profiles were generated for 11 stages at 0.5- or 1.0-foot (ft) intervals between 100 and 106 ft as follows: 100, 101, 101.5, 102, 102.5, 103, 103.2, 103.5, 104, 105, and 106 as referenced to the National Geodetic Vertical Datum of 1929 (NGVD 29) at five USGS lake gages. The additional stage of 103.2 ft was generated to show the peak flood-inundation area as recorded during the May 2011 flood at the USGS lake gage 04295000 (Rouses Point, N.Y.). With
References Cited 11
the exception of the USGS Lake Champlain near Grand Isle, Vt., lake gage which was referenced to the North American Vertical Datum of 1988 (NAVD 88), the USGS lake gages on Lake Champlain are referenced to NGVD 29; therefore, the datum of NGVD 29 was also used for the inundation maps. Conversion to NAVD 88 at the reference lake gage (USGS gage 04295000, Richelieu River [Lake Champlain]) requires subtraction of 0.43 ft from the NGVD 29 referenced elevations.
The maximum recorded stage at USGS lake gage 04295000, Richelieu River (Lake Champlain) at Rouses Point, N.Y., was 103.20 ft (NGVD 29) on May 6, 2011, and the maximum recorded stage at USGS lake gage 04294500, Lake Champlain at Burlington, Vt., was 103.27 ft (NGVD 29) on May 6, 2011. The Richelieu River (Lake Champlain) at Rouses Point, N.Y., lake gage is also a National Weather Service forecast location. The water-surface flood elevation extents were created within a geographic information system to delineate the estimated flood-inundation areas as shapefile polygons and lines. The flood maps are available through a mapping application that can be accessed on the USGS Flood Inundation Mapping Science website at http://water.usgs.gov/osw/flood_inundation/.
These flood-inundation maps are nonregulatory but, in conjunction with the real-time stage data from the USGS lake gage, Richelieu River (Lake Champlain) at Rouses Point, N.Y. (station number 04295000), and forecasted flood stage data from the National Weather Service Advanced Hydrologic Prediction Service, will help to guide the public in taking indi-vidual safety precautions and will provide emergency manage-ment personnel with a tool to efficiently manage emergency flood operations and post-flood recovery efforts.
References Cited
Axis Geospatial, 2015, Easton, Md., contracted Atlantic to obtain lidar data for Washington and Essex Counties, N.Y.
Bjerklie, D.M., Trombley, T.J., and Olson, S.A., 2014, Assess-ment of the spatial extent and height of flooding in Lake Champlain during May 2011, using satellite remote sens-ing and ground-based information: U.S. Geological Survey Scientific Investigations Report 2014–5163, 18 p., accessed July 26, 2017, at https://doi.org/10.3133/sir20145163.
Dewberry, 2012, National Enhanced Elevation Assessment: Fairfax, Va., 84 p., accessed June 28, 2018, at http://www.dewberry.com/docs/default-source/documents/neea_final-report_revised-3-29-12.pdf?sfvrsn=0.
Esri, 2018, ArcGIS, Version 10.4.1, accessed May 5, 2018, at http://www.esri.com/software/arcgis/.
Federal Emergency Management Agency [FEMA], 1977a, Flood insurance study, Rutland County: Washington, D.C., accessed September 28, 2017, at https://map1.msc.fema.gov/data/50/S/PDF/50021CV001A.pdf?LOC=ed3edd3ae798119609262fd91ec2d217.
Federal Emergency Management Agency [FEMA], 1977b, Flood insurance study, Rutland County: Washington, D.C., accessed September 28, 2017, at https://map1.msc.fema.gov/data/50/S/PDF/50021CV002A.pdf?LOC=9fea04eda0309c84012c55e46091bd2b.
Federal Emergency Management Agency [FEMA], 1977c, Flood insurance study, Rutland County: Washington, D.C., accessed September 28, 2017, at https://map1.msc.fema.gov/data/50/S/PDF/50021CV003A.pdf?LOC=46948fff64cce2d2750c218448ffe728.
Federal Emergency Management Agency [FEMA], 1977d, Flood insurance study, South Hero, Grand Isle County: Washington, D.C., accessed September 28, 2017, at https://map1.msc.fema.gov/data/50/S/PDF/500226V000.pdf?LOC=f6e5d216afe61dcfd35e46b5fa695afc.
Federal Emergency Management Agency [FEMA], 1979a, Flood insurance study, Bridport, VT, Addison County: Washington, D.C., accessed September 28, 2017, at https://map1.msc.fema.gov/data/50/S/PDF/500164V000.pdf?LOC=914b8502b5913fe5e34c2545723bdfa6.
Federal Emergency Management Agency [FEMA], 1979b, Flood insurance study, Isle La Motte, Grand Isle County: Washington, D.C., accessed September 28, 2017, at https://map1.msc.fema.gov/data/50/S/PDF/500224V000.pdf?LOC=ede1daa76491e7425eb3a2784aafa9fe.
Federal Emergency Management Agency [FEMA], 1979c, Flood insurance study, Shoreham, VT, Addison County: Washington, D.C., accessed September 28, 2017, at https://map1.msc.fema.gov/data/50/S/PDF/500171V000.pdf?LOC=18176237efeaee93f654f5039c04aff6.
Federal Emergency Management Agency [FEMA], 1980a, Flood insurance study, Alburgh, Grand Isle County: Wash-ington, D.C., accessed September 28, 2017, at https://map1.msc.fema.gov/data/50/S/PDF/500221V000.pdf?LOC=d19c04a66bac95cadf61d2cc1fa4676a.
Federal Emergency Management Agency [FEMA], 1980b, Flood insurance study, North Hero, Grand Isle County: Washington, D.C., accessed September 28, 2017, at https://map1.msc.fema.gov/data/50/S/PDF/500225V000.pdf?LOC=2372f1ebf27c5e8979d1d8bdb91c3f52.
12 Flood-Inundation Maps for Lake Champlain in Vermont and New York
Federal Emergency Management Agency [FEMA], 1981, Flood insurance study, Georgia, Franklin County: Washing-ton, D.C., accessed September 28, 2017, at https://map1.msc.fema.gov/data/50/S/PDF/500217V000.pdf?LOC=8b0625ef03d6d5c1faf3c731003c4217.
Federal Emergency Management Agency [FEMA], 1982a, Flood insurance study, Highgate, Franklin County: Wash-ington, D.C., accessed September 28, 2017, at https://map1.msc.fema.gov/data/50/S/PDF/500055V000.pdf?LOC=2594f5adefafdee06f8cbe3220a401e5.
Federal Emergency Management Agency [FEMA], 1982b, Flood insurance study, Swanton, Franklin County: Wash-ington, D.C., accessed September 28, 2017, at https://map1.msc.fema.gov/data/50/S/PDF/500220V000.pdf?LOC=afce8ae8b62b5f4610509dbf5f40120b.
Federal Emergency Management Agency [FEMA], 1986a, Flood insurance study, Ferrisburg, VT, Addison County: Washington, D.C., accessed September 28, 2017, at https://map1.msc.fema.gov/data/50/S/PDF/500002V000.pdf?LOC=578d6c91ea5decae48314c53c2a625cf.
Federal Emergency Management Agency [FEMA], 1986b, Flood insurance study, Panton, VT, Addison County: Wash-ington, D.C., accessed September 28, 2017, at https://map1.msc.fema.gov/data/50/S/PDF/500169V000.pdf?LOC=4b4058a92f7376d6d718979351511a9c.
Federal Emergency Management Agency [FEMA], 1986c, Flood insurance study, Whitehall, Washington County: Washington, D.C., accessed September 28, 2017, at https://map1.msc.fema.gov/data/36/S/PDF/361239V000.pdf?LOC=8c9c39e871baae4d611bc7075dd78b96.
Federal Emergency Management Agency [FEMA], 1987a, Flood insurance study, Crown Point, Essex County: Wash-ington, D.C., accessed September 28, 2017, at https://map1.msc.fema.gov/data/36/S/PDF/361148V000.pdf?LOC=99496adbcb33aa67dca4866487795efb.
Federal Emergency Management Agency [FEMA], 1987b, Flood insurance study, Essex, Essex County: Washington, D.C., accessed September 28, 2017, at https://map1.msc.fema.gov/data/36/S/PDF/361149V000.pdf?LOC=ee747f44cd73342a1880f8fdc855ef05.
Federal Emergency Management Agency [FEMA], 1987c, Flood insurance study, Port Henry, Essex County: Wash-ington, D.C., accessed September 28, 2017, at https://map1.msc.fema.gov/data/36/S/PDF/361493V000.pdf?LOC=61619dec9856456911e330a6c5d1c9ee.
Federal Emergency Management Agency [FEMA], 1987d, Flood insurance study, Westport, Essex County: Washing-ton, D.C., accessed September 28, 2017, at https://map1.msc.fema.gov/data/36/S/PDF/361160V000.pdf?LOC=20e97de71cc86b0e80601d93bb9e9a29.
Federal Emergency Management Agency [FEMA], 1988a, Flood insurance study, St. Albans, Franklin County: Wash-ington, D.C., accessed September 28, 2017, at https://map1.msc.fema.gov/data/50/S/PDF/500219V000.pdf?LOC=9eefbdded2ae7357bfe90672637d0571.
Federal Emergency Management Agency [FEMA], 1988b, Flood insurance study, Grand Isle, Grand Isle County: Washington, D.C., accessed September 28, 2017, at https://map1.msc.fema.gov/data/50/S/PDF/500223V000.pdf?LOC=e8f102de8743b65287ba61a1846c90e2.
Federal Emergency Management Agency [FEMA], 1992, Flood insurance study, Willsboro, Essex County: Washing-ton, D.C., accessed September 28, 2017, at https://map1.msc.fema.gov/data/36/S/PDF/360267V000.pdf?LOC=c1b341277a2f2a4429ffce1ee3062274.
Federal Emergency Management Agency [FEMA], 1996a, Flood insurance study, Dresden, Washington County: Wash-ington, D.C., accessed September 28, 2017, at https://map1.msc.fema.gov/data/36/S/PDF/361410V000.pdf?LOC=7bae559a955653e1f1cdfa7527271851.
Federal Emergency Management Agency [FEMA], 1996b, Flood insurance study, Putnam, Washington County: Wash-ington, D.C., accessed September 28, 2017, at https://map1.msc.fema.gov/data/36/S/PDF/361236V000.pdf?LOC=39f6869fddae92fc1189c2db5dc1ece6.
Federal Emergency Management Agency [FEMA], 1996c, Flood insurance study, Ticonderoga, Essex County: Wash-ington, D.C., accessed September 28, 2017, at https://map1.msc.fema.gov/data/36/S/PDF/361159V000.pdf?LOC=a90faa5f9ee494528a0ba4bf68096d16.
Federal Emergency Management Agency [FEMA], 2007, Flood insurance study, Clinton County, New York (All Jurisdictions): Washington, D.C., accessed June 28, 2018, at https://map1.msc.fema.gov/data/36/S/PDF/36019CV000A.pdf?LOC=925348f4573a3a6f8989e43ace0812db.
Federal Emergency Management Agency [FEMA], 2010, Procedure Memorandum No. 61—Standards for lidar and other high quality digital topography, accessed June 28, 2018, at https://www.fema.gov/media-library-data/1388780431699-c5e577ea3d1da-878b40e20b776804736/Procedure+Memorandum+61-Standards+for+Lidar+and+Other+High+Quality+Digital+Topography+(Sept+2010).pdf.
Federal Emergency Management Agency [FEMA], 2014a, Flood insurance study, Chittenden County: Washington, D.C., accessed September 28, 2017, at https://map1.msc.fema.gov/data/50/S/PDF/50007CV001B.pdf?LOC=fbeb264e84cf86c4736bcb230846762b.
References Cited 13
Federal Emergency Management Agency [FEMA], 2014b, Flood insurance study, Chittenden County: Washington, D.C., accessed September 28, 2017, at https://map1.msc.fema.gov/data/50/S/PDF/50007CV002B.pdf?LOC=613b3a8e22d4bf34fe78dfb06d8cbeb2.
Federal Emergency Management Agency [FEMA], 2016, Guidance for flood risk analysis and mapping—Eleva-tion guidance, accessed June 28, 2018, at https://www.fema.gov/media-library-data/1469794589266-f404b39e-73fa7a1c5ffe4447636634d4/Elevation_Guidance_May_2016.pdf.
Flynn, R.H., and Hayes, Laura, 2016, Flood-inundation maps for Lake Champlain in Vermont and in northern Clinton County, New York: U.S. Geological Survey Scientific Investigations Report 2016–5060, 11 p., accessed August 2, 2018, at https://doi.org/10.3133/sir20165060.
Flynn, R.H., Rydlund, P.H., Jr., and Martin, D.J., 2016, Network global navigation satellite system surveys to harmonize American and Canadian datums for the Lake Champlain Basin: U.S. Geological Survey Scientific Investigations Report 2016–5009, 17 p., accessed August 2, 2018, at https://doi.org/10.3133/sir20165009.
Hayes, Laura, and Flynn, R.H., 2019, Flood-inundation shapefiles and grids for Lake Champlain in Vermont and New York: U.S. Geological Survey data release, https://doi.org/10.5066/P9ZBDF6S.
Howland, W.G., Gruessner, B., Lescaze, M., and Stickney, M., 2006, Lake Champlain—Experience and lessons learned brief: Grand Isle, Vermont, p. 93–114, accessed June 28, 2018, at http://iwlearn.net/iw-projects/1665/experience-notes-and-lessons-learned/lakechamplain_2005.pdf/view.
International Joint Commission [IJC], 2013, Plan of study for the identification of measures to mitigate flooding and the impacts of flooding of Lake Champlain and Richelieu River: International Lake Champlain and Richelieu River Plan of Study Group, 128 p.
International Joint Commission [IJC], 2015, IJC Lake Cham-plain and Richelieu River Flood Inundation: International Joint Commission, accessed August 28, 2015, at http://www.ijc.org/en_/.
Kiah, R.G., Jarvis, J.D., Hegemann, R.F., Hilgendorf, G.S., and Ward, S.L., 2013, Hydrologic conditions in New Hampshire and Vermont, water year 2011: U.S. Geological Survey Open-File Report 2013–1135, 36 p., accessed Sep-tember 22, 2017, at http://pubs.usgs.gov/of/2013/1135/.
Lake Champlain Basin Program, 2013, Flood resilience in the Lake Champlain Basin and Upper Richelieu River, April 11: Lake Champlain Basin Program report, 93 p.
Lake Champlain Basin Program, 2015, Lake and basin facts, accessed June 28, 2018, at http://www.lcbp.org/about-the-basin/facts/.
Lake Champlain Land Trust, 2015, Lake Champlain facts, accessed June 28, 2018, at http://www.lclt.org/about-lake-champlain/lake-champlain-facts/.
Lake Champlain Research Consortium, 2004, About Lake Champlain, accessed June 28, 2018, at http://academics.smcvt.edu/lcrc/aboutlake.html.
Lumia, Richard, Firda, G.D., and Smith, T.L., 2014, Floods of 2011 in New York: U.S. Geological Survey Scientific Inves-tigations Report 2014–5058, 236 p., accessed September 22, 2017, at http://dx.doi.org/10.3133/sir20145058.
Medalie, Laura, and Olson, S.A., 2013, High-water marks from flooding in Lake Champlain from April through June 2011 and tropical storm Irene in August 2011 in Vermont: U.S. Geological Survey Data Series 763, 11 p., accessed September 22, 2017, at http://pubs.usgs.gov/ds/763/.
National Weather Service [NWS], 2018a, Advanced Hydrologic Prediction Service, Richelieu River (Lake Champlain) at Rouses Point, N.Y., accessed June 28, 2018, at http://water.weather.gov/ahps2/hydrograph.php?wfo=btv&gage=roun6.
National Weather Service [NWS], 2018b, Advanced Hydro-logic Prediction Service, Lake Champlain at Burlington, Vt., accessed June 28, 2018, at http://water.weather.gov/ahps2/hydrograph.php?wfo=btv&gage=burv1.
Olson, S.A., and Bent, G.C., 2013, Annual exceedance prob-abilities of the peak discharges of 2011 at streamgages in Vermont and selected streamgages in New Hampshire, western Massachusetts, and northeastern New York: U.S. Geological Survey Scientific Investigations Report 2013–5187, 17 p., accessed June 28, 2018, at https://doi.org/10.3133/sir20135187.
Photo Science, Inc., 2009, Lidar data for Franklin County, Vt.: Lexington, Ky., Photo Science, Inc.
Photo Science, Inc., 2013, Lidar data for Addison County, Vt.: Lexington, Ky., Photo Science, Inc.
Photo Science, Inc., 2015, Lidar data for Chittenden County, Vt.: Lexington, Ky., Photo Science, Inc.
Photo Science, Inc., 2016, Lidar data for Grand Isle and Rut-land Counties, Vt.: Lexington, Ky., Photo Science, Inc.
Quantum Spatial, 2015, Lexington, Ky., lidar data for Clinton and Essex Counties, N.Y.
14 Flood-Inundation Maps for Lake Champlain in Vermont and New York
Riboust, Philippe, and Brissette, François, 2015, Climate change impacts and uncertainties on spring flooding of Lake Champlain and the Richelieu River: Journal of the Ameri-can Water Resources Association, v. 53, no. 3, p. 776–793, accessed September 22, 2017, at http://dx.doi.org/10.1111/jawr.12271.
Shanley, J.B., and Denner, J.C., 1999, The hydrology of the Lake Champlain Basin—Lake Champlain in Transition—From research toward restoration: Washington, D.C., AGU, p. 41–66.
Stickney, M., Hickey, C., and Hoerr, R., 2001, Lake Cham-plain Basin Program—Working together today for tomor-row—Lakes and Reservoirs: Research and Management, v. 6, p. 217–223.
U.S. Census Bureau, 2018a, State and County Quickfacts—Population, 2017 Estimate for Burlington city, Vermont, accessed September 28, 2018, at https://www.census.gov/quickfacts/fact/table/burlingtoncityvermont/PST045217.
U.S. Census Bureau, 2018b, State and County Quickfacts—Population, 2017 Estimate for Plattsburgh city, New York, accessed September 28, 2018, at https://www.census.gov/quickfacts/fact/table/plattsburghcitynewyork/PST045217.
U.S. Census Bureau, 2018c, State and County Quickfacts—Population, 2017 Estimate for South Burlington city, Vermont, accessed September 28, 2018, at https://www.census.gov/quickfacts/fact/table/southburlingtoncityvermont.
U.S. Geological Survey [USGS], 2018a, USGS 04295000, Richelieu River (Lake Champlain) at Rouses Point N.Y.: U.S. Geological Survey, accessed May 5, 2018, at https://waterdata.usgs.gov/ny/nwis/uv?site_no=04295000.
U.S. Geological Survey [USGS], 2018b, USGS 04294500, Lake Champlain at Burlington, Vt.: U.S. Geological Survey, accessed May 5, 2018, at https://waterdata.usgs.gov/nwis/uv?site_no=04294500.
U.S. Geological Survey [USGS], 2018c, USGS 04279085, Lake Champlain North of Whitehall, N.Y.: U.S. Geological Survey, accessed May 5, 2018, at https://waterdata.usgs.gov/nwis/uv?site_no=04279085.
U.S. Geological Survey [USGS], 2018d, USGS 04294413, Lake Champlain at Port Henry, N.Y.: U.S. Geological Sur-vey, accessed May 5, 2018, at https://waterdata.usgs.gov/ny/nwis/uv?site_no=04294413.
U.S. Geological Survey [USGS], 2018e, USGS 04294620, Lake Champlain near Grand Isle, Vt.: U.S. Geologi-cal Survey, accessed May 5, 2018, at http://waterdata.usgs.gov/nh/nwis/uv/?site_no=04294620&PARAmeter_cd=62615,72020.
U.S. Geological Survey [USGS], 2018f, USGS Flood Inundation Mapping Program: U.S. Geological Survey, accessed May 5, 2018, at http://water.usgs.gov/osw/flood_inundation/.

For more information about this report, contact:Director, New England Water Science Center U.S. Geological Survey331 Commerce Way, Suite 2Pembroke, NH [email protected] visit our website athttps://www.usgs.gov/centers/new-england-water
Publishing support provided by the Pembroke and Lafayette Publishing Service Centers

Flynn and Hayes—Flood-Inundation M
aps for Lake Champlain in Verm
ont and New
York—Scientific Investigations Report 2018–5169
ISSN 2328-0328 (online)https://doi.org/10.3133/sir20185169