flood inundation mapping of surat city a prospective …icfr2013.ex.ac.uk/papers/b1_patel.pdf ·...
TRANSCRIPT
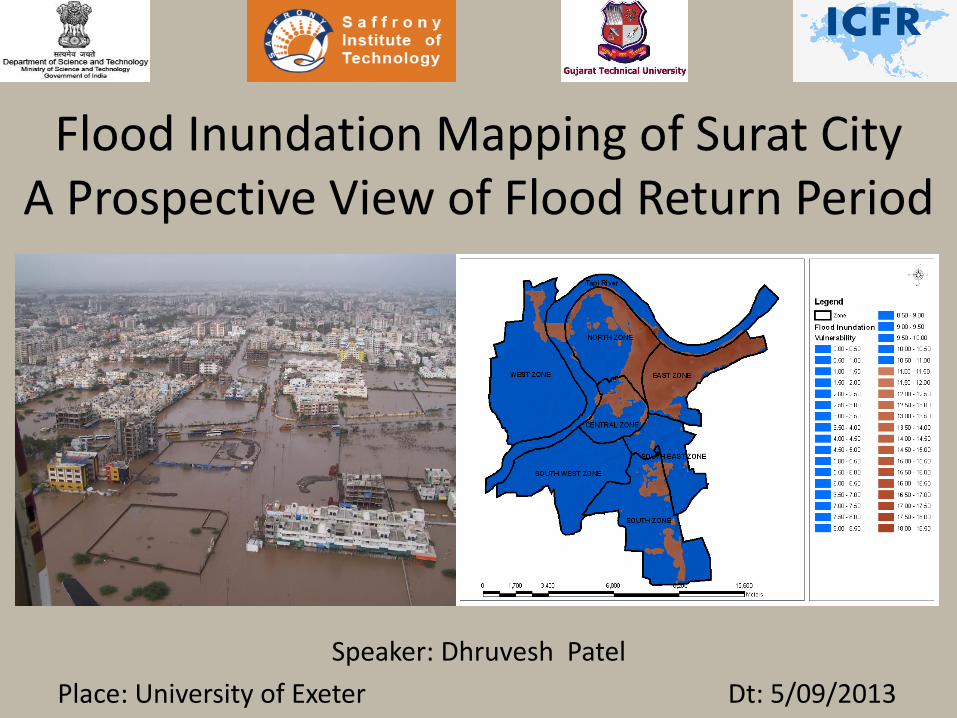
Flood Inundation Mapping of Surat City A Prospective View of Flood Return Period
Speaker: Dhruvesh Patel
Place: University of Exeter Dt: 5/09/2013
Introduction • Flood is defined as extremely high flows or levels of
rivers, lakes, ponds, reservoirs and any other water bodies, whereby water inundates outside of the water bodies area.
• In India, About 40Mha land flood prone, 12% of the total geographical area of 328 Mha
• Causing major damage to:
1. Property (human, housing, industry)
2. Productivity (agriculture, industry)
3. Infrastructure (road, bridge)
Therefore, Flood Prevention, Mitigation, Assessment are
MUST! and MOST- URGENT!!
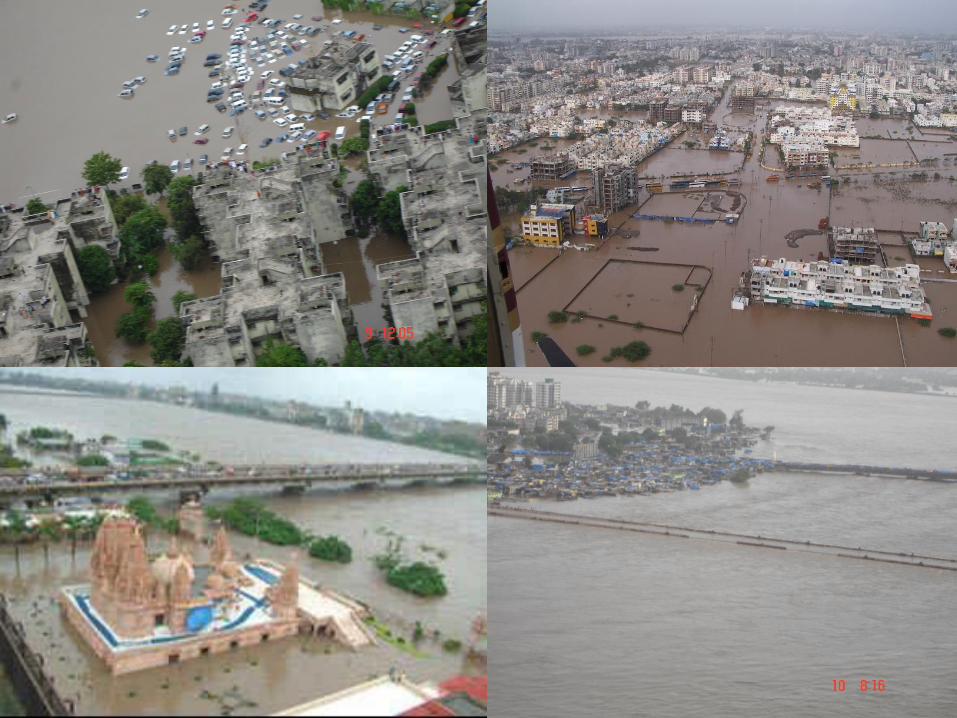
History of Flood at Surat City • The flood of 7-14 August 2006 is the major flood in the
history of Surat city.
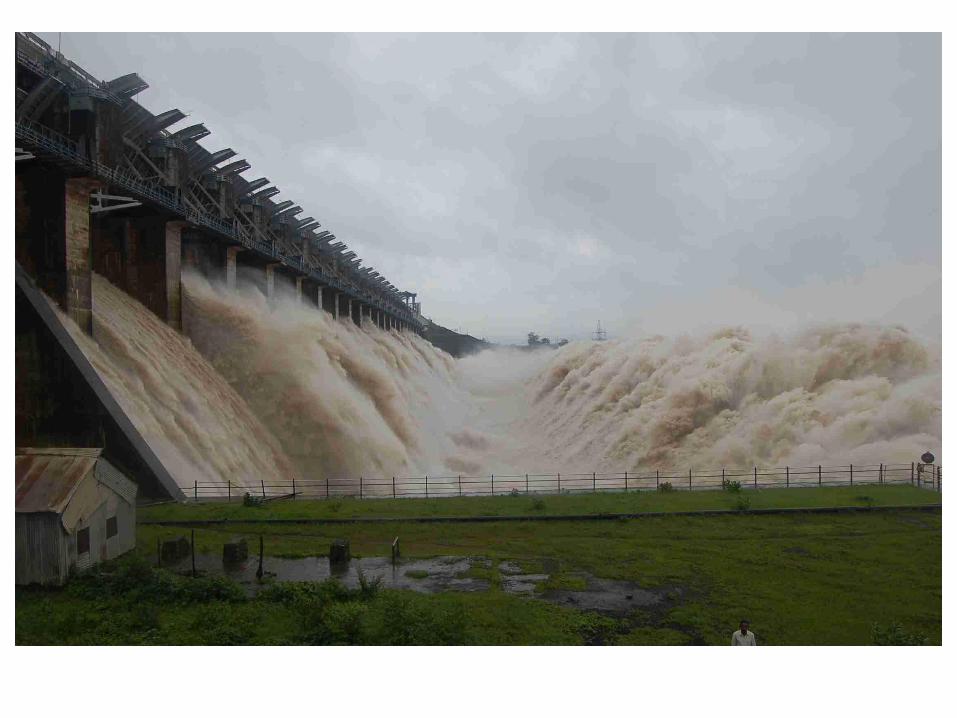
• 25485-25768 m3/s discharge from Ukai dam, spill from river section and result flood.
• 300 People Killed and INR 21000 Crore property loss
• 40 years back Tapi river could carry 28316 m3/s water. It has been reduced to 11326 m3/s in 1998 (According to SMC and Irrigation department).
• After 2006 flood, discharge carrying capacity of Tapi river near Hope Bridge is 5663 m3/s and warning level is 5.5 m which estimated 8.5 m at 1998 Flood.
Research problems • Low discharge carrying capacity of river Tapi surrounding
Suart city
• Lack of Information about inundation of water in low laying areas
• Lacking of Advance Flood Forecasting System (AFFS)
• Uncertain discharge lead by VareKhadi watersheds in lack of river gauge network
• Lack of information of Tidel flood due to Arabian Sea
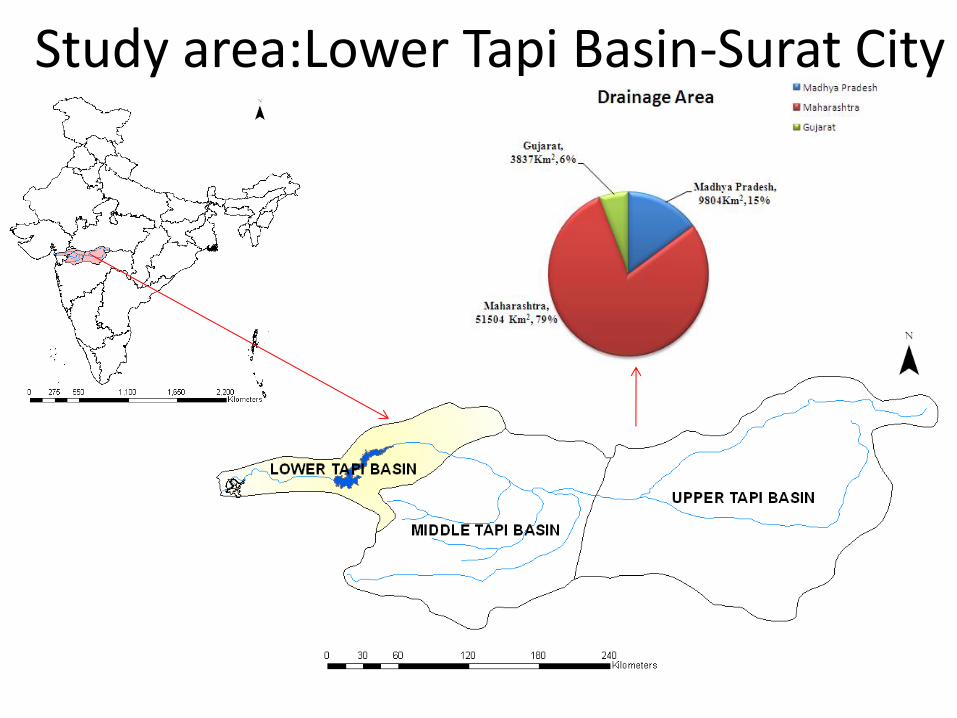
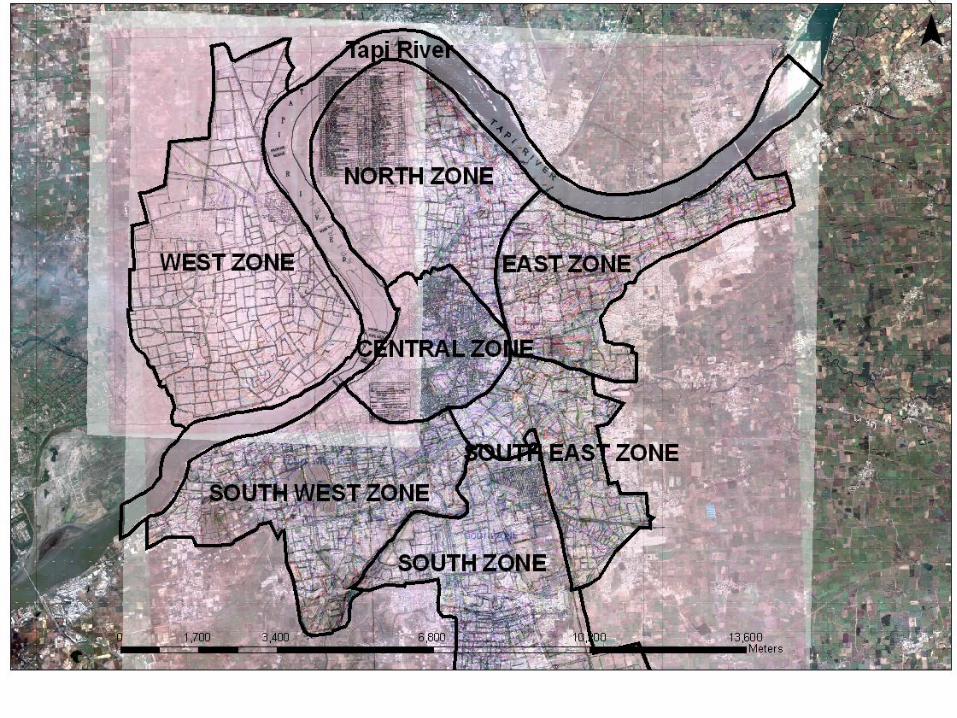
Study area:Lower Tapi Basin-Surat City
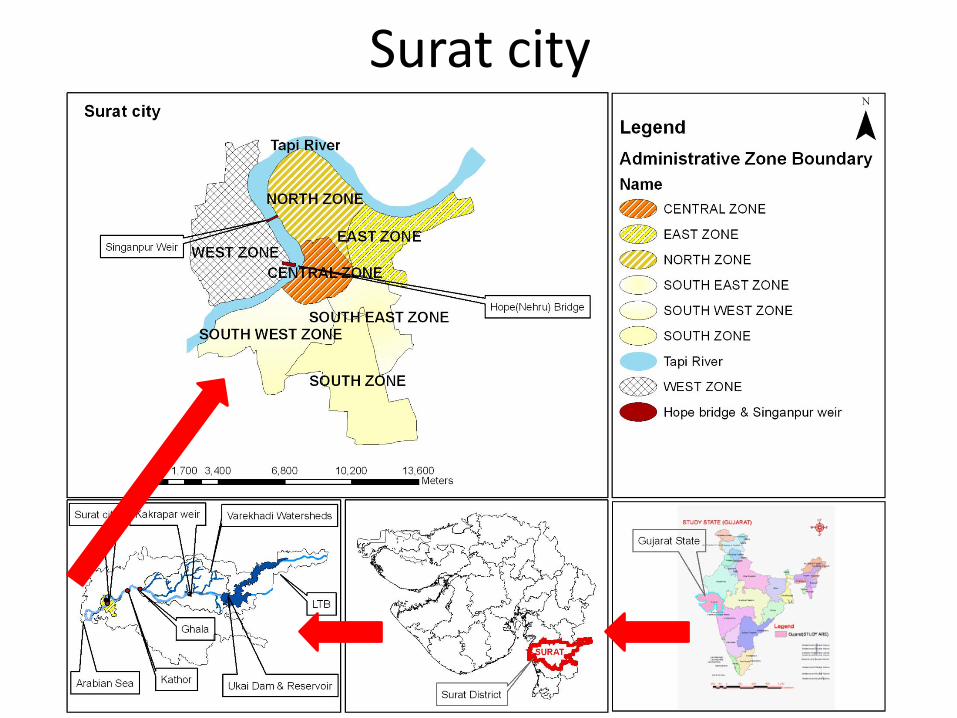
Surat city
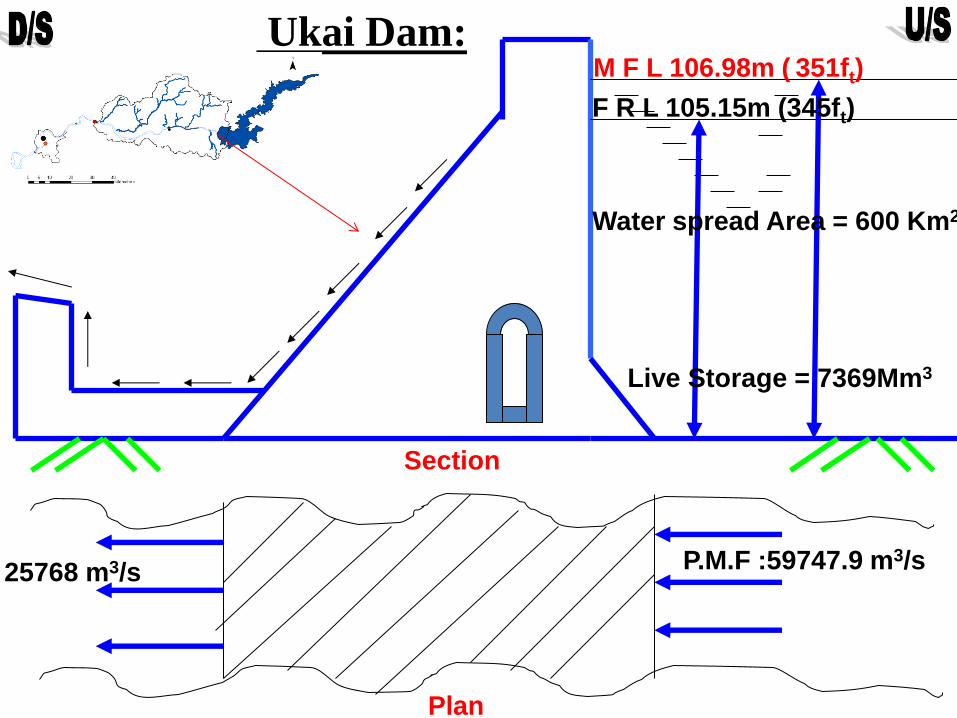
F R L 105.15m (345ft)
M F L 106.98m ( 351ft)
Live Storage = 7369Mm3
Water spread Area = 600 Km2
Plan
25768 m3/s
Ukai Dam:
Section
P.M.F :59747.9 m3/s
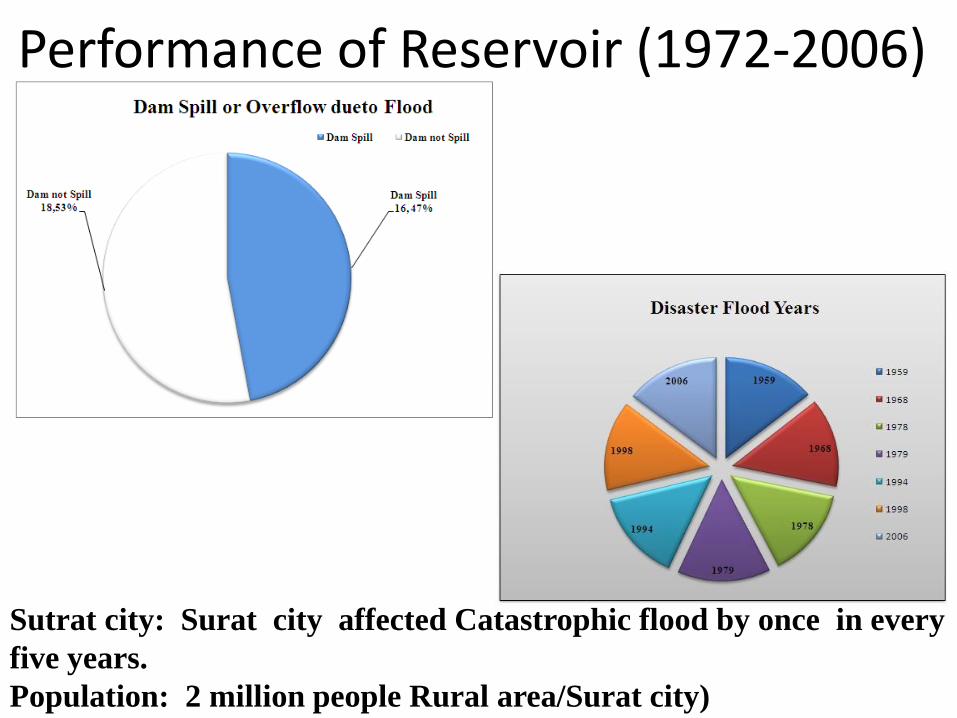
Sutrat city: Surat city affected Catastrophic flood by once in every
five years.
Population: 2 million people Rural area/Surat city)
Performance of Reservoir (1972-2006)
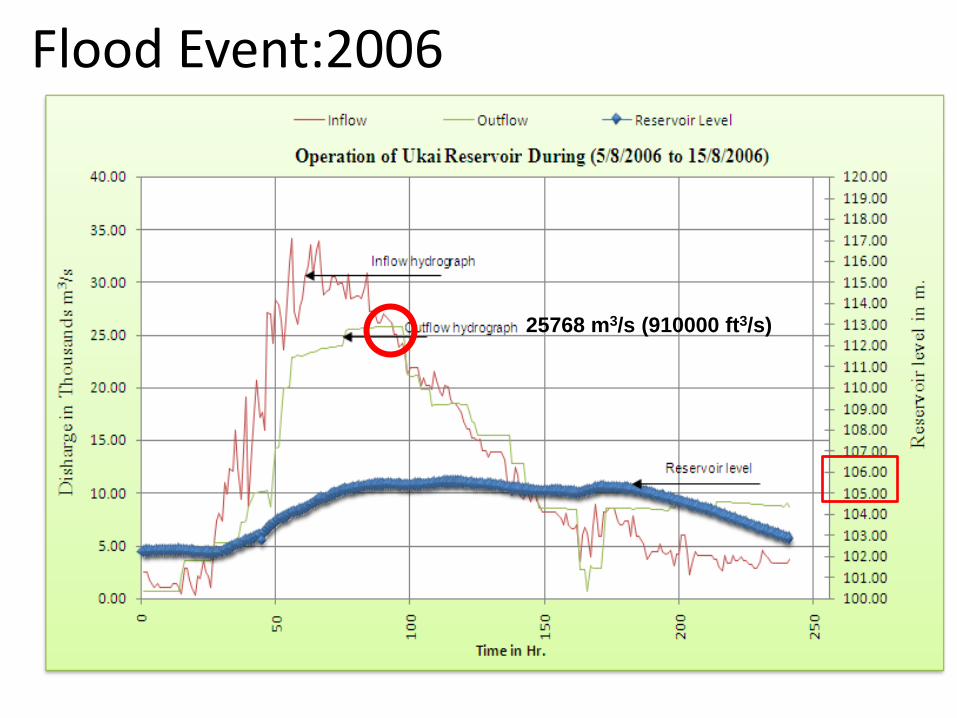
Flood Event:2006
25768 m3/s (910000 ft3/s)
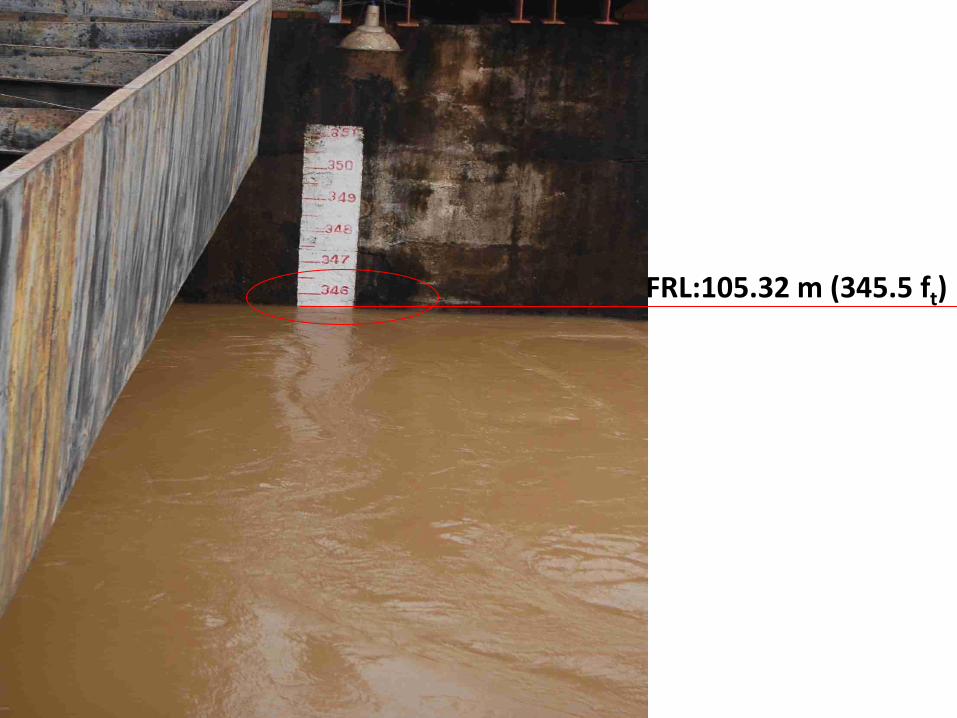
FRL:105.32 m (345.5 ft)
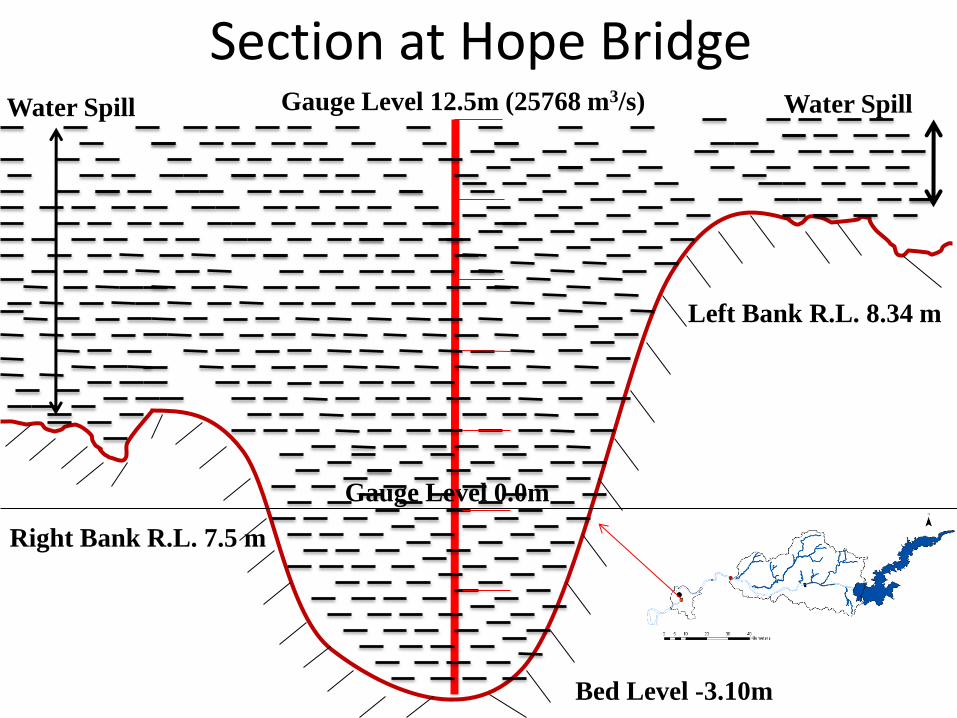
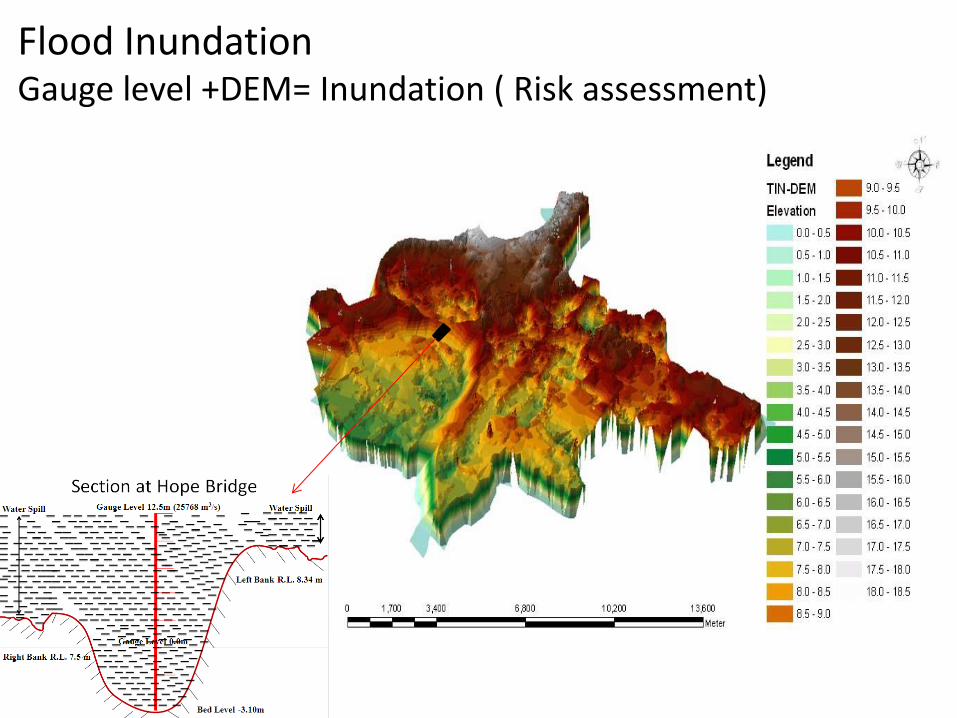
Gauge Level 12.5m (25768 m3/s)
Left Bank R.L. 8.34 m
Right Bank R.L. 7.5 m
Water Spill Water Spill
Gauge Level 0.0m
Bed Level -3.10m
Section at Hope Bridge
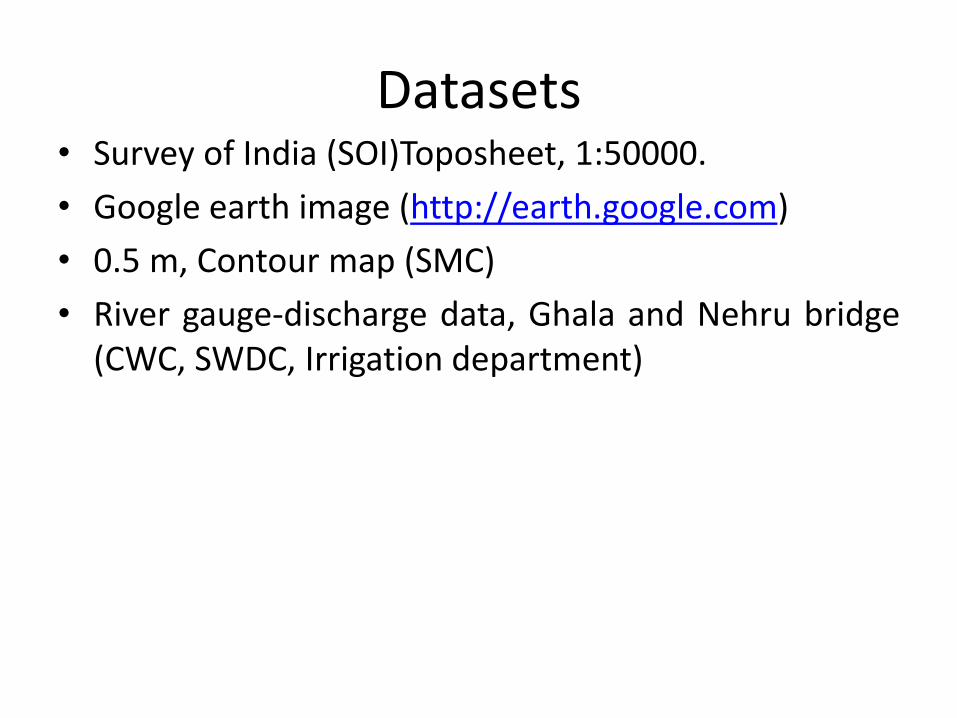
Datasets • Survey of India (SOI)Toposheet, 1:50000.
• Google earth image (http://earth.google.com)
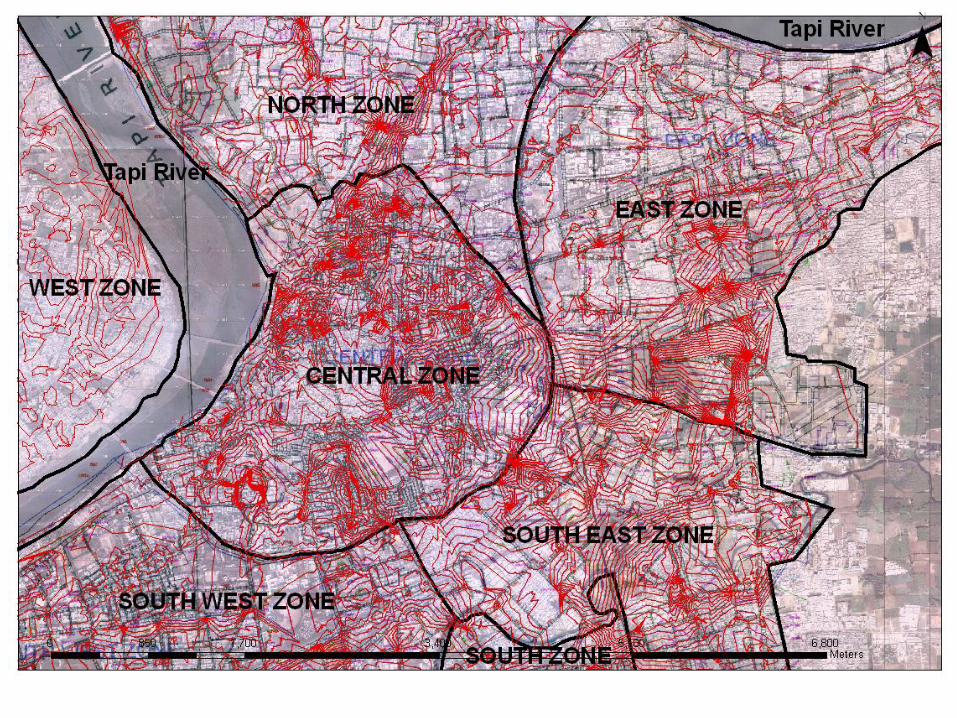
• 0.5 m, Contour map (SMC)
• River gauge-discharge data, Ghala and Nehru bridge (CWC, SWDC, Irrigation department)
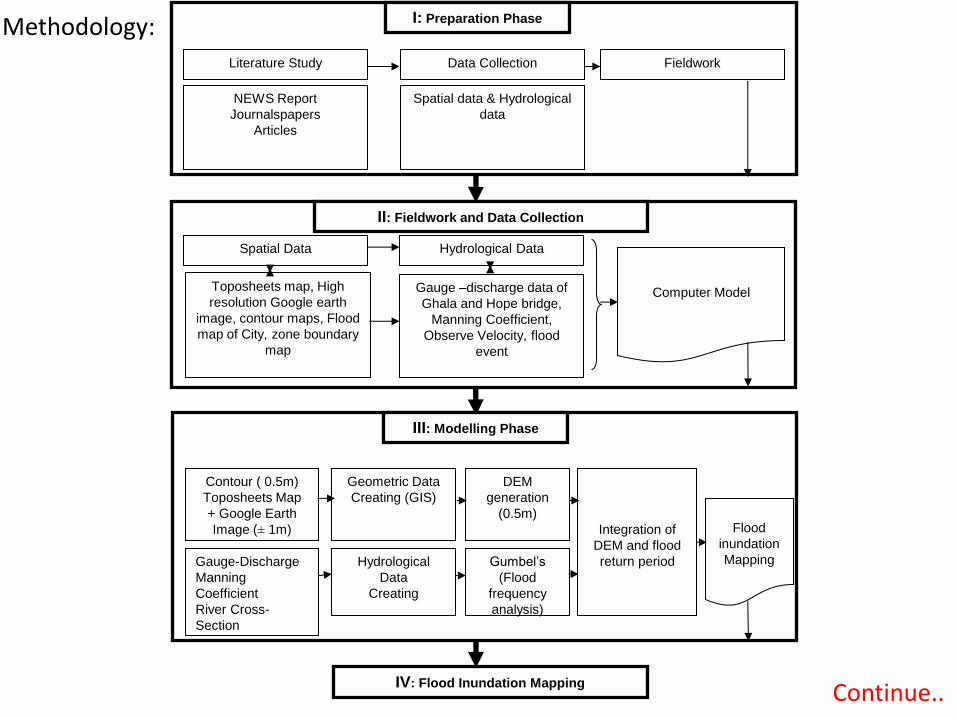
II: Fieldwork and Data Collection
Spatial Data Hydrological Data
Toposheets map, High
resolution Google earth
image, contour maps, Flood
map of City, zone boundary
map
Gauge –discharge data of
Ghala and Hope bridge,
Manning Coefficient,
Observe Velocity, flood
event
Computer Model
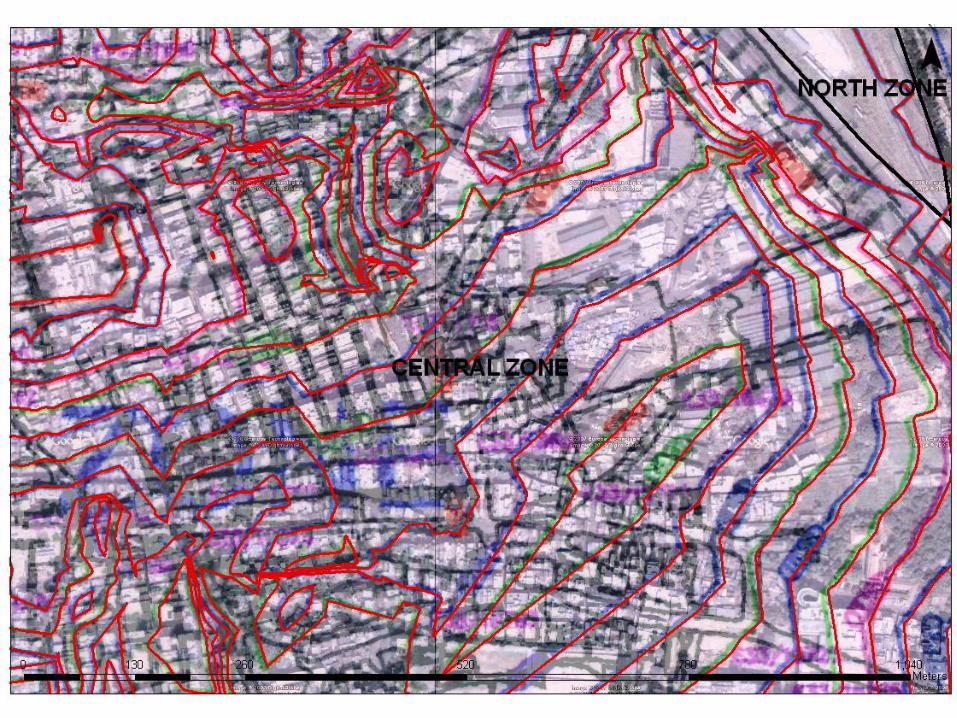
III: Modelling Phase
Contour ( 0.5m)
Toposheets Map
+ Google Earth
Image (± 1m)
Gauge-Discharge
Manning
Coefficient
River Cross-
Section
Geometric Data
Creating (GIS)
Hydrological
Data
Creating
DEM
generation
(0.5m)
Gumbel’s
(Flood
frequency
analysis)
Integration of
DEM and flood
return period
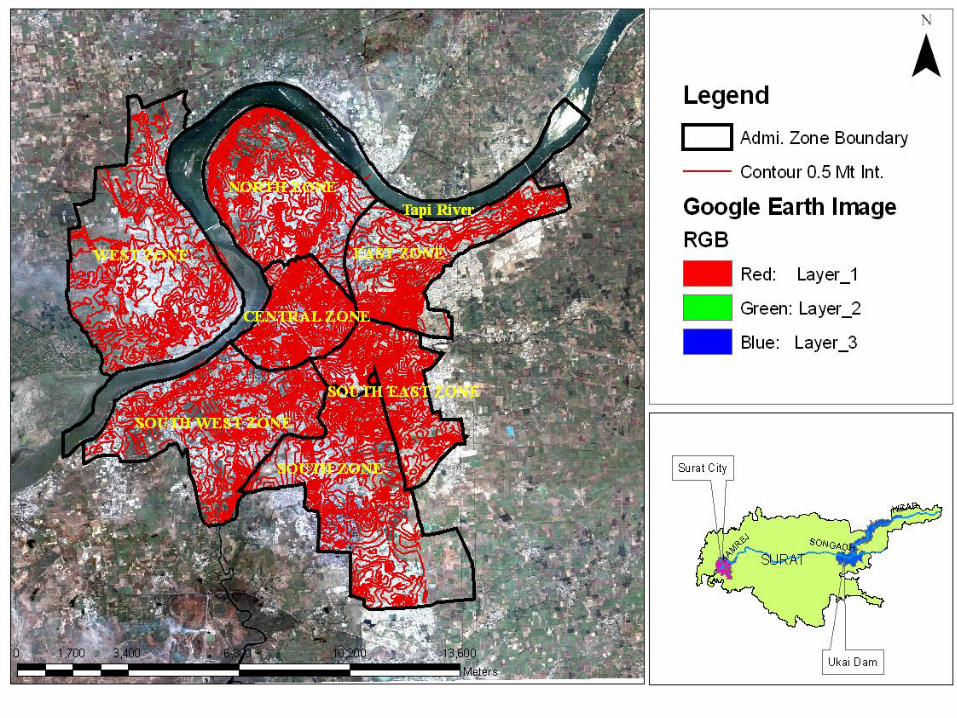
Flood
inundation
Mapping
IV: Flood Inundation Mapping
I: Preparation Phase
Literature Study Data Collection Fieldwork
NEWS Report
Journalspapers
Articles
Spatial data & Hydrological
data
Continue..
Methodology:
V: Reporting Phase/Conclusion
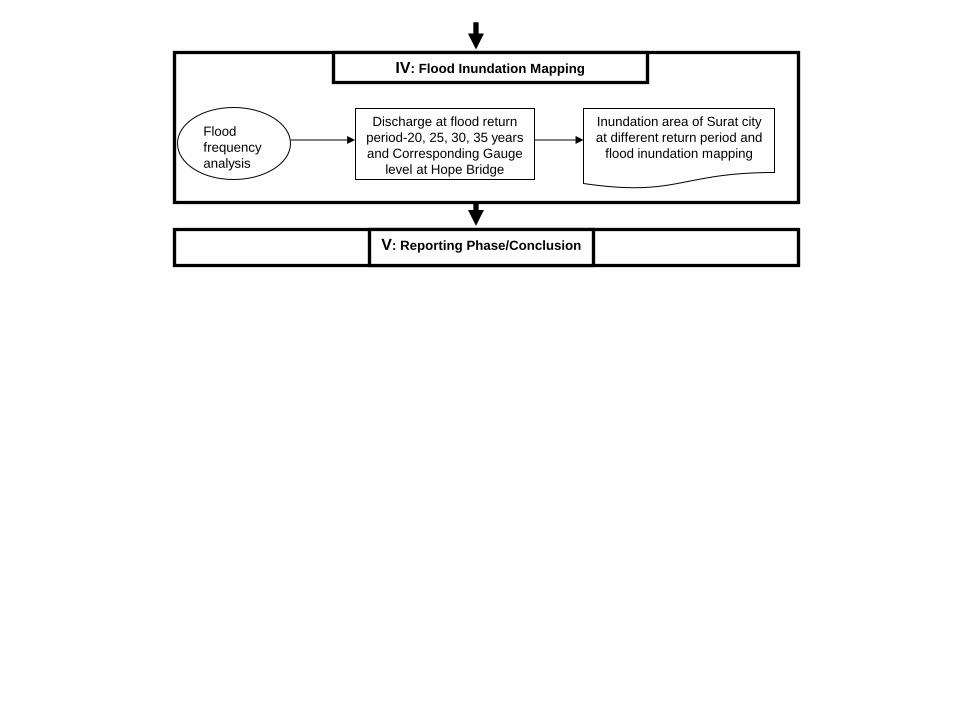
IV: Flood Inundation Mapping
Flood
frequency
analysis
Discharge at flood return
period-20, 25, 30, 35 years
and Corresponding Gauge
level at Hope Bridge
Inundation area of Surat city
at different return period and
flood inundation mapping
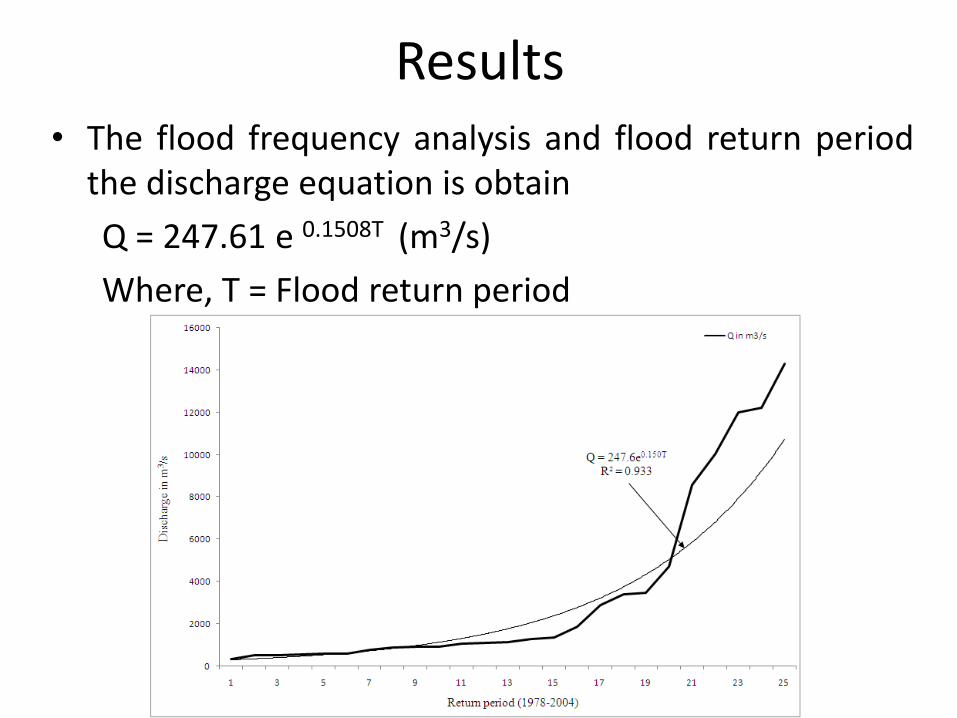
Results • The flood frequency analysis and flood return period
the discharge equation is obtain
Q = 247.61 e 0.1508T (m3/s)
Where, T = Flood return period
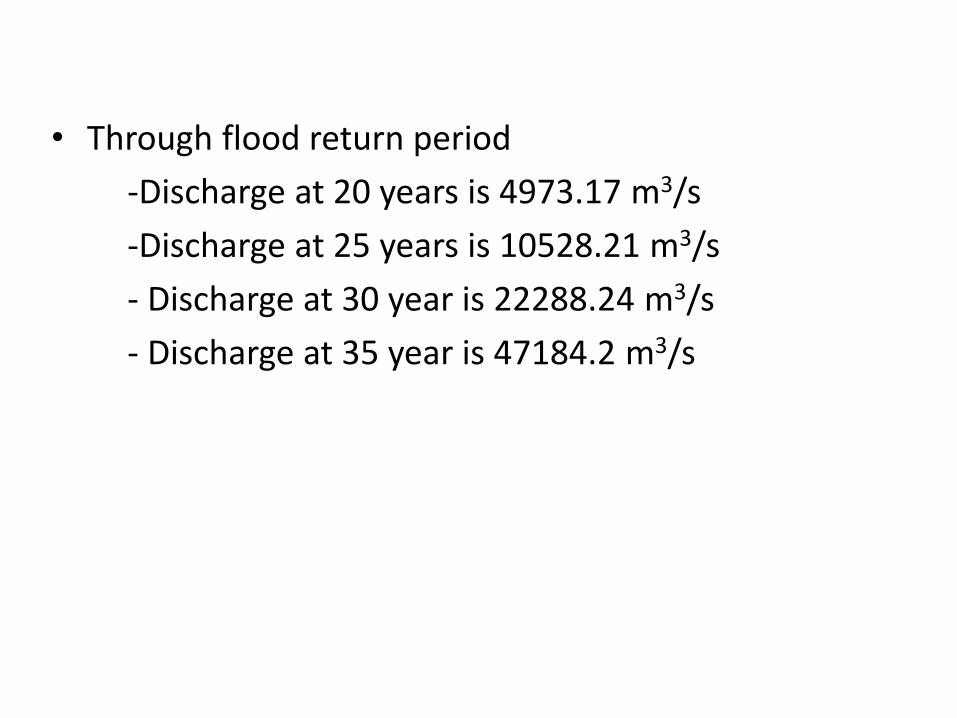
• Through flood return period
-Discharge at 20 years is 4973.17 m3/s
-Discharge at 25 years is 10528.21 m3/s
- Discharge at 30 year is 22288.24 m3/s
- Discharge at 35 year is 47184.2 m3/s
Flood
Return
Period
In
years
Discharge
in m3/s
Corresponding
Gauge level
at Hope Bridge
in m.
Inundate
Area
in m2
%
Submerge
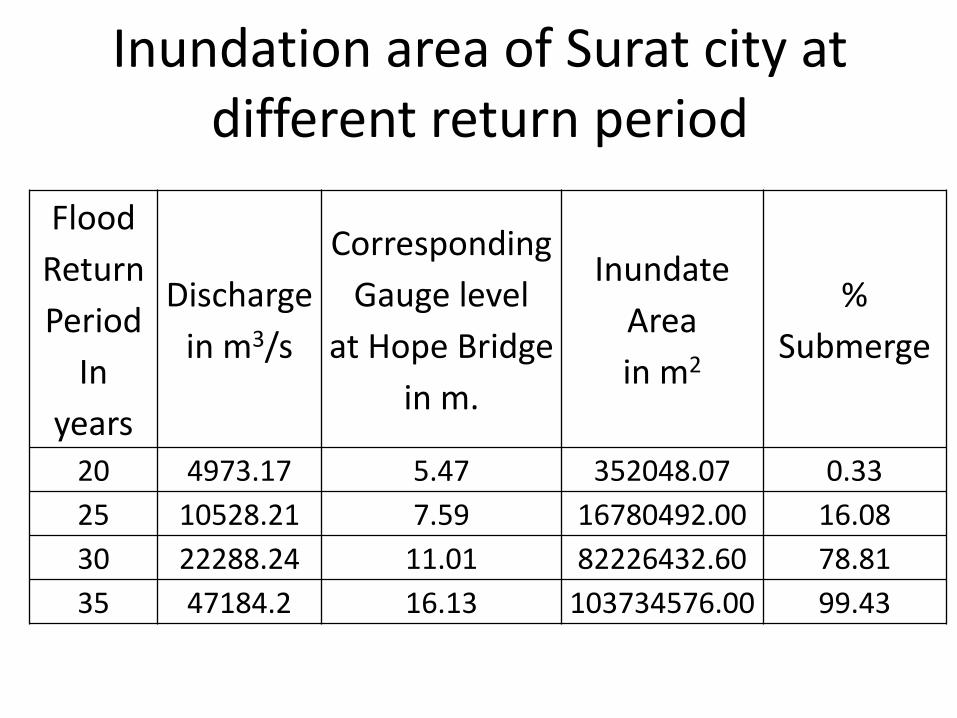
20 4973.17 5.47 352048.07 0.33
25 10528.21 7.59 16780492.00 16.08
30 22288.24 11.01 82226432.60 78.81
35 47184.2 16.13 103734576.00 99.43
Inundation area of Surat city at different return period
13/12/2007
Flood Inundation Gauge level +DEM= Inundation ( Risk assessment)
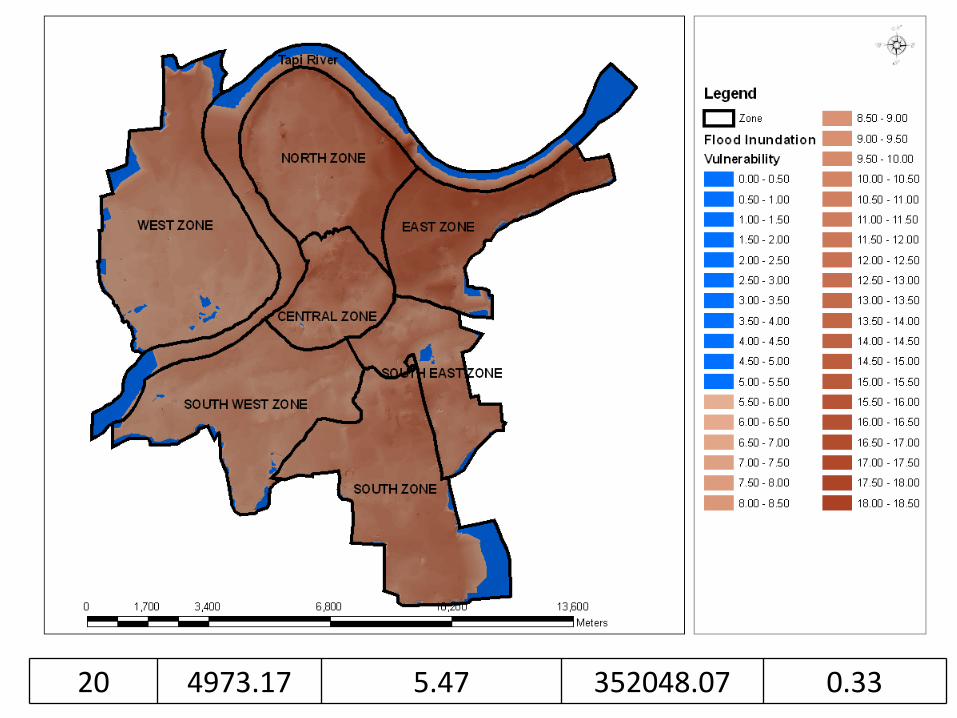
20 4973.17 5.47 352048.07 0.33
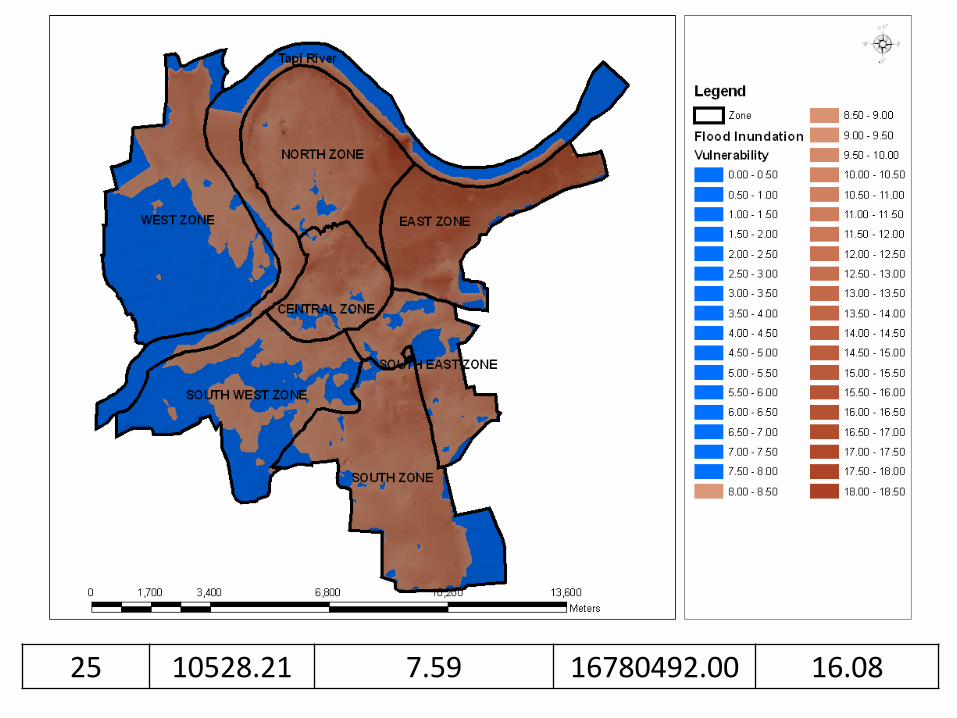
25 10528.21 7.59 16780492.00 16.08
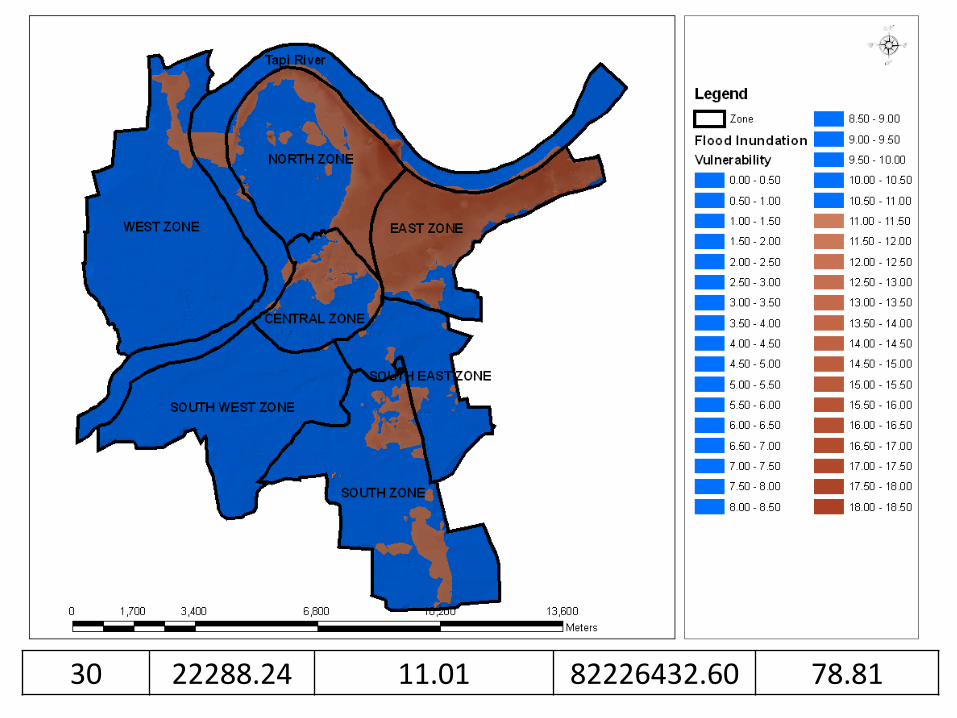
30 22288.24 11.01 82226432.60 78.81
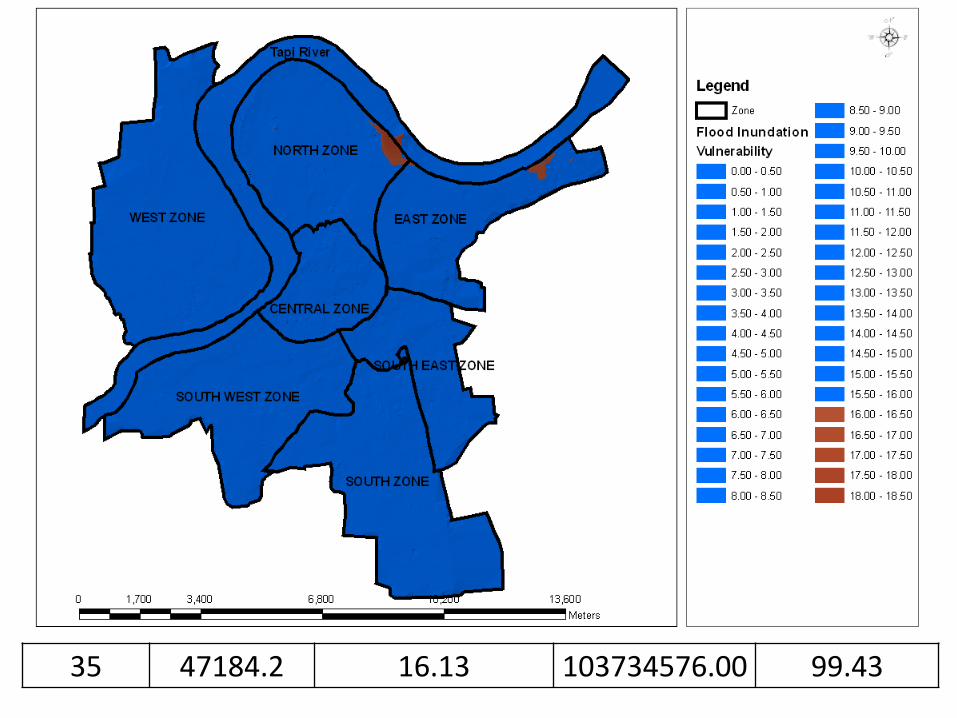
35 47184.2 16.13 103734576.00 99.43
Conclusions
• High resolution remote sensing combined with field data of river hydraulics is very powerful tool for delineating flood prone area.
• Flood frequency analysis Q = 247.61 e 0.1508T
• Discharge carrying capacity of river Tapi near Surat city is less than 25768 m3/s
• West zone and South west zone low laying area and highly flood prone while East zone is least
• About 99.43% Surat city under water for flood return period of 35 years
References
• Bates P, Marks K, and Horritt M (2003) Optimal use of high-resolution topographic data in flood inundation models. Hydrological Processes 17, 537-57.
• Bates PD, Horritt MS, and Fewtrell TJ (2010) A simple inertial formulation of the shallow water equations for efficient two-dimensional flood inundation modelling. Journal of Hydrology 387, 33-45.
• Parmar B and Rao B (2002) Flood Control Operation for Ukai Multipurpose Reservoir. In ICOLD Symposium on Reservoir Management in Tropical and Sub-tropical Regions, Brazil. (ed.), Vol. pp. 278,
• Patel DP and Dholakia MB (2010) Feasible Structural and Non-Structural Measures to Minimize Effect of Flood in Lower Tapi Basin. WSEAS TRANSACTIONS on FLUID MECHANICS 104-21.
• Patel DP and Srivastava PK (2013) Flood Hazards Mitigation Analysis Using Remote Sensing and GIS: Correspondence with Town Planning Scheme. Water Resources Management 1-16.
• Sanders BF (2007) Evaluation of on-line DEMs for flood inundation modeling. Advances in Water Resources 30, 1831-43.

Thank you
Questions and Suggestions