flood inundation mapping- kerala 2018; harnessing the
TRANSCRIPT

RESEARCH ARTICLE
Flood inundation mapping- Kerala 2018;
Harnessing the power of SAR, automatic
threshold detection method and Google Earth
Engine
Varun TiwariID1*, Vinay Kumar2, Mir Abdul Matin1, Amrit ThapaID
1, Walter Lee Ellenburg3,
Nishikant Gupta1, Sunil ThapaID1
1 International Centre for Integrated Mountain Development, Dehradun, India, 2 Indian Institute of Remote
Sensing, Indian Space Research Organization, Dehradun, India, 3 Earth System Science Center, University
of Alabama, Huntsville, Alabama, United States of America
Abstract
Flood inundation maps provide valuable information towards flood risk preparedness,
management, communication, response, and mitigation at the time of disaster, and can be
developed by harnessing the power of satellite imagery. In the present study, Sentinel-1
Synthetic Aperture RADAR (SAR) data and Otsu method were utilized to map flood inunda-
tion areas. Google Earth Engine (GEE) was used for implementing Otsu algorithm and pro-
cessing Sentinel—1 SAR data. The results were assessed by (i) calculating a confusion
matrix; (ii) comparing the submerge water areas of flooded (Aug 2018), non-flooded (Jan
2018) and previous year’s flooded season (Aug 2016, Aug 2017), and (iii) analyzing histori-
cal rainfall patterns to understand the flood event. The overall accuracy for the Sentinel-1
SAR flood inundation maps of 9th and 21st August 2018 was observed as 94.3% and
94.1% respectively. The submerged area (region under water) classified significant flooding
as compared to the non-flooded (January 2018) and previous year’s same season (August
2015–2017) classified outputs. Summing up, observations from Sentinel-1 SAR data using
Otsu algorithm in GEE can act as a powerful tool for mapping flood inundation areas at the
time of disaster, and enhance existing efforts towards saving lives and livelihoods of com-
munities, and safeguarding infrastructure and businesses.
Introduction
Any populated areas which normally fall in tropical regions are prone to floods which is con-
sidered as one of the hazardous natural disasters. Heavy rainfall enhances the accumulation of
water in the catchments and overflow of water flashing beyond its normal confines are termed
as floods. Flood usually varies from place to place and depends on numerous factors such as its
severity and time of occurrence. Water inundation due to this disastrous event causes signifi-
cant damage to human lives, properties, agricultural lands and infrastructure, subsequently
PLOS ONE
PLOS ONE | https://doi.org/10.1371/journal.pone.0237324 August 19, 2020 1 / 17
a1111111111
a1111111111
a1111111111
a1111111111
a1111111111
OPEN ACCESS
Citation: Tiwari V, Kumar V, Matin MA, Thapa A,
Ellenburg WL, Gupta N, et al. (2020) Flood
inundation mapping- Kerala 2018; Harnessing the
power of SAR, automatic threshold detection
method and Google Earth Engine. PLoS ONE 15(8):
e0237324. https://doi.org/10.1371/journal.
pone.0237324
Editor: Guy J-P. Schumann, Bristol University/
Remote Sensing Solutions Inc., UNITED STATES
Received: January 7, 2020
Accepted: July 24, 2020
Published: August 19, 2020
Copyright: © 2020 Tiwari et al. This is an open
access article distributed under the terms of the
Creative Commons Attribution License, which
permits unrestricted use, distribution, and
reproduction in any medium, provided the original
author and source are credited.
Data Availability Statement: All relevant data are
within the paper and its Supporting Information
files.
Funding: The authors received no specific funding
for this work.
Competing interests: The authors have declared
that no competing interests exist.

affecting the economy [1]. Flood mitigation planning and management requires knowledge of
land use as well as accurate identification and mapping of flood prone areas. Critical and
timely estimation for monitoring inundated areas during floods can play a significant role in
effective and prompt response for risk assessment. This also provides valuable information to
the policy cum decision makers for sustainable management and future preparedness [2].
Generation of real/near real time accurate water inundation maps are required to see the flow
of flood water in the affected areas during the time of disaster. Monitoring the flood extent
with the help of space based sensors are more effective in providing near real time information
as compared to the ground based techniques.
Space based sensors either optical or synthetic aperture radar (SAR) have shown their
potential for monitoring and mapping flood or water inundated areas [3,4]. SAR sensors can
penetrate through clouds and heavy rain, thus makes them capable of acquiring data during
floods while optical sensors such as multispectral are unable to do the same [5]. Earlier studies
have shown that SAR datasets are preferably being used for mapping and monitoring the flood
extent. [6–11]. The techniques used for flood mapping are broadly categorized as (i) conven-
tional and machine learning based classification approach [12–14]; and (ii) threshold based
approach [15,16]. The first approach requires ample training data from the field which is diffi-
cult to collect during or at the time of floods. Hence, these approaches are least recommended
for near real time preparation of flood maps [17,18]. However, threshold based techniques
(manual as well as automatic) seem to be more effective for flood map generation. Manual
threshold detection techniques are often difficult and challenging, as manually deriving the
threshold requires knowledge of a few number of training samples [19–21]. This technique
also leads to generation of less-accurate and inconsistent water inundated maps. This happens
due to variability in the manually selected threshold values for separating water and non-water
pixels [16].
However, an automatic threshold based approach detects the threshold values automatically
for separating water and non-water pixels without the use of any training samples [22,23].
This approach computes image statistics for deriving the optimum thresholds to classify water
and non-water pixels. Image tiling and split selection, Kittler and Illingworth’s technique,
Global minimum threshold method, Quality index thresholds, Split combination and Otsu
image threshold are some of the well-known automatic threshold based techniques used for
different applications [24–27]. The Otsu image threshold method is the most widely adopted
approach used for flood mapping [23,28,29]. This method is based on an adaptive threshold
method which measures to evaluate the between-class variance of a threshold at a given level
computed from a normalized image histogram. This method is less complex and requires least
user interaction making it suitable for large SAR image scenes. Tests of this Otsu algorithm
were conducted on eight large scenes of Radarsat-2 data for near-real time detection of water
bodies and monitoring their dynamic changes [29]. An operational and robust framework was
proposed for precise flood mapping by conducting tests in the large SAR scenes, for classifying
flood and non-flood areas. This Otsu method is capable of providing a more precise flood map
using Sentinel-1 SAR scenes for large areas [23]. Monitoring real time water extent during
large-scale flood events also requires data from several sources (social media, remote sensing
and topographic data). Rapid estimation of flood extent based on the information shared in
real-time using social media such as geo-tagged photographs helps in validation of inundation
for flood extent [30].
Various remote sensing based models with field observation have been used for monitoring
and mapping of Kerala 2018 extreme flood events. Hunt et al., explored the circumstances
which majorly caused this extreme flood by using Weather Research and Forecasting (WRF)
model in combination with a hydrological model (WRF-Hydro, run at 125 m resolution) [31].
PLOS ONE Flood inundation mapping
PLOS ONE | https://doi.org/10.1371/journal.pone.0237324 August 19, 2020 2 / 17

Haider et al., used downscaled future and historic climate projections from Coupled Model
Inter comparison Project (CMIP5) and the Noah-MP land surface hydrological model, to sim-
ulate and observe the projected changes in extreme precipitation and flood events [32]. The
extreme precipitation and runoff conditions observations made by Mishra et al. using the Var-
iable Infiltration Capacity (VIC) model, have shown that the 2018 extreme flood event was
unprecedented in the last seven decades from 1951–2018 [33]. The simulation results by Vis-
wanadhapalli et al., suggested that the high convective instability and transport of mid-tropo-
spheric moisture from the Bay of Bengal were the driving factors behind the heavy rainfall
over Kerala in 2018 [34]. The change in water levels of reservoir storage during extreme rain-
fall of Kerala in 2018 were also discussed by Ramasamy et al., Anandalekshmi et al.,. The exist-
ing six major reservoirs that serve the state would have needed to have 34% more capacity to
handle the heavy rainfall, and controlled release might have helped in alleviating the flood
disasters [35,36]. These studies suggested that extreme heavy rainfall was the major factor
behind this disastrous event and projected climate change could intensify these effects in the
near future.
Most of the studies on Kerala flood focused on a hydrological modeling-based approach to
study and analyze the reasons behind the flood event; whereas limited focus was on generating
near real time water inundation maps. The hydrological model based approach are not suitable
as it requires an up-to-date and accurate DEM, AWS (Automatic weather station) data as well
as computing infrastructure which is often not available. Lal et al., Vishnu et al., and SK et al.,
utilized SAR data (Sentinel-1 & ALOS-2 PALSAR) along with a manual threshold-based, con-
ventional and machine learning based classification approaches to prepare flood extent maps
and damage assessment [37–39]. Though these studies have shown good results, they used the
approach for map generation which requires ample training sample points. Also, the entire
process was performed on the desktop based data processing tools which requires enormous
time for downloading and processing data. This limits the timely response for providing the
flood maps to different decision making agencies for immediate and adequate action. Consid-
ering this above methods in a desktop based environment are not suitable for providing rapid
processing services critical for a flood response. On the other hand the cloud-based image pro-
cessing platform utilizing automatic threshold methods are the possible solution. Google Earth
Engine (GEE) is a cloud-based image processing platform enabling the rapid processing of
such big datasets covering a large area. The GEE has publically made available numerous satel-
lite image collections and provides image analysis functionality at large spatial scales [40]. In
the existing approaches for flood mapping in Kerala no study has been performed which com-
bines openly accessible SAR (Sentinel-1) data and automatic threshold detection techniques in
a cloud computing platform (GEE).
The main objective of this study was to evaluate the potential of automatic threshold detec-
tion techniques using large SAR scenes in cloud computing platform for rapid and precise
mapping of flood affected areas in Kerala, India. In this study, time-series Sentinel-1 SAR data
of pre and post flood events and Otsu algorithm [41,42] were utilized in GEE for mapping
flood extent or water inundated areas. Rainfall time series analysis was also performed to
understand the long term rainfall trend over Kerala.
Materials and methods
The study area selected was the state of Kerala (Fig 1), situated in the southwest part of India
(10.8505˚ N, 76.2711˚ E with elevation of 54 m Mean Sea Level). The area was severely affected
by floods in July-August 2018 which caused substantial loss of lives, and property worth USD
5.8 billion [43]. The major cities affected were: Chengannur, Pandanad, Edanad, Aranmula,
PLOS ONE Flood inundation mapping
PLOS ONE | https://doi.org/10.1371/journal.pone.0237324 August 19, 2020 3 / 17

Kozhencherry, Ayiroor, Ranni, Pandalam, Kuttanad, Malappuram, Aluva, Chalakudy, Thiru-
valla, Eraviperoor, Vallamkulam, N. Paravur and Cochin.
The satellite dataset utilized in the study was Sentinel 1 SAR Vertically transmitted Verti-
cally receive (VV) Polarization data (Table 1). VV was preferred over vertically transmitted
Horizontally receive (VH), as VV polarization was acquired with medium incident angle and
Fig 1. Maps of study area (Kerala India). Shapefile reprinted from GADM database under a CC BY license, with
permission from Global Administrative Areas (www.gadm.org), original copyright 2018. The figure was made with
ArcGIS 10.3 under a CC BY license, with permission from ESRI (www.esri.com).
https://doi.org/10.1371/journal.pone.0237324.g001
Table 1. Data specification.
Characteristics Sentinel -1 (SAR data) Sentinel– 2 (Optical data) CHIRPS
Acquisition Date Before Flood Aug. 13 2015 1981–2018
Aug. 7 2016
Aug. 14 2017
Jan. 5 2018
April 11
Starting of Flood July 28
During Flood Aug. 9 and Aug.21 Aug. 10 and Aug. 20 2018
After Flood Sept. 2, Sept.16 & Sept. 26 B8-NIR
B4- RED
B3- Green
Polarization VV polarization B8 –NIR; B4- RED; B3- Green NA
Bands 1 12 NA
Wavelength 5.5cm 443-1290nm NA
Spatial resolution 10 m 10m (resampled) 5 Km
Swath 250 Km 290 Km NA
Temporal resolution 12 Days 5.5 Days Daily
https://doi.org/10.1371/journal.pone.0237324.t001
PLOS ONE Flood inundation mapping
PLOS ONE | https://doi.org/10.1371/journal.pone.0237324 August 19, 2020 4 / 17

previous research have shown it being most suitable for flood inundation mapping [44–47].
Sentinel-2 optical data and Climate Hazards Group Infra-Red Precipitation with Station data
(CHIRPS) rainfall data of the flooded season (refer Table 1) were also utilized for validation of
the results.
Methodology
The flow chart of the detailed methodology adopted in the present study is shown in Fig 2. The
methodology was divided into the following steps:
Preprocessing of Sentinel 1 VV SAR images
Sentinel-1 images suffer from erroneous noise, (i.e. rigorous geometric, radiometric correc-
tions, thermal, and speckle) [48]. Any satellite data requires rigorous pre-processing before it
can be utilized for any application.
GEE provides Sentinel-1 VV polarization Ground Range Detected (GRD) images which are
already preprocessed using Sentinel-1 algorithm [48]. The preprocessing includes (i) Orbital
file correction to eliminate the orbital noise; (ii) Thermal noise correction to eliminate the
noise in the data produced by the sensors during data acquisition process onboard the satellite
[49]. Thermal noise can affect the quality of the data in the areas having low mean signal
response detected by the SAR system like lakes, standing water, rivers, etc., (iii) Radiometric
calibration, to calibrate RADAR reflectivity (DN) to backscattering coefficient (physical units)
which is mainly performed to compare the SAR images of different acquisition dates; and (iv)
Terrain correction, to convert Sentinel-1 SLC (Single look complex) data from slant range
geometry to a map coordinate system, and to rectify the distortions like foreshortening, lay-
over, or shadowing effects. [50].
The Lee speckle filter with kernel window size 5x5 was applied in GEE environment to
remove speckle noise from the dataset. [14,51]
Classification of water and non-water areas
After preprocessing of Sentinel-1 VV SAR images, the data was classified into two major clas-
ses: water and non-water, to determine the water inundated areas. Otsu’s automatic threshold
detection method was used to determine optimum threshold for this separation. The Otsu
method is typically used for deriving threshold for optical data [52]. However, some recent
studies have suggested that the Otsu method can also be applied in SAR data for separating
water and non-water classes [53,54].
Fig 2. Research methodology.
https://doi.org/10.1371/journal.pone.0237324.g002
PLOS ONE Flood inundation mapping
PLOS ONE | https://doi.org/10.1371/journal.pone.0237324 August 19, 2020 5 / 17

The Otsu’s method is a clustering based thresholding method used for separating two clas-
ses i.e. foreground from background. The technique assumes that the distribution of image
pixel intensities follows a bi-modal histogram, and separates those pixels into two classes (e.g.
foreground and background). The optimum threshold value is determined by minimizing the
weighted sum of within-class (intra-class) variances of the foreground and background pixels.
The mathematical algorithm of Otsu method is described as follows:
The pixels in a given image be represented in L gray levels (1, 2, 3, L). ni Represents the
number of pixels at level i, and N denote the total number of pixels,
N ¼ n1 þ n2n3 þ nL ð1Þ
The normalized grey level histogram and probability distribution can be expressed as Eqs 2
to 4
Pi ¼ ni=N ð2Þ
Pi � 0 ð3Þ
XL
i¼1P1 ¼ 1 ð4Þ
Threshold k divides the pixels into two classes (i.e. foreground and background). The opti-
mum value of k can be computed by maximizing the intra class variance (within the class).
The criterion function ρ is introduced and defined as
rðkÞ ¼ s2
BðkÞ=s2
BT ð5Þ
s2B and s2
BT can be expressed as:
s2
B ¼ o0 o1ðm1 � m0Þ2
ð6Þ
s2
T ¼XL
i¼1ði � mTÞ
2Zi ð7Þ
Where,
ρ = criteria function
s2B = Between class variance
s2BT = Total variance
ω0 = Probabilities of class occurrence for background
ω1 = Probabilities of class occurrence for foreground
μ0 = Class mean of background
μ1 = Class mean of foreground
μT = Total mean grey level of the image
k = Threshold value
Eqs 8 and 9 defines the probabilities of class occurrence and the class mean levels.
oðkÞ ¼Xk
i¼1Zi ð8Þ
mðkÞ ¼Xk
i¼1i Zi ð9Þ
PLOS ONE Flood inundation mapping
PLOS ONE | https://doi.org/10.1371/journal.pone.0237324 August 19, 2020 6 / 17

Validation and calculation of water inundated areas
The validation of the classified map was done through calculating a confusion matrix. The Sen-
tinel -1 SAR classified images of 9th and 21st August 2018 were validated utilizing correspond-
ing Sentinel-2 optical images, acquired on the 10th and 20th August 2018. The optical Sentinel
2 image acquired on 10th and 20th August were mostly affected with cloud cover therefore,
these images were first preprocessed to remove clouds/ bad pixels. The cloud masking utilizes
Sentinel-2 Band QA60, a quality flag band, to identify and mask out flagged cloud and cirrus
pixels. After that, reference samples were randomly identified and collected using visual inter-
pretation approach, for water and non-water class for the area that were not masked out due to
cloud cover. The areas which were masked out due to cloud cover in sentinel-2 data, the refer-
ence samples were collected using sentinel-1 data.
The collected reference samples (from sentinel-2) were overlaid on Sentinel-1 SAR images
of 9th and 21st August 2018. The backscatter values from water and non-water class were
extracted and examined. It was observed that water class (Backscatter value = -23.53±2.44 db)
exhibits low backscatter than non-water class (Backscatter value = -8.78±1.49 db) as shown in
Fig 3. Then the same rule was utilized for collecting reference samples from Sentinel -1 SAR
data (random sampling) for the areas which were affected by clouds. The aptness of the Otsu’s
method was assessed by deriving not only the overall accuracy, but also individual class accura-
cies. The validation was also performed by (i) comparing the area submerged under water in
the classified images of flooded (August 2018), non-flooded (January 2018) and previous
year’s same month data (August of 2015, 2016 and 2017); and (ii) analyzing the rainfall data
for confirming the flood event.
Analyzing the rainfall data
Climate Hazards Group Infra-Red Precipitation with Station data (CHIRPS) is a quasi-global
rainfall dataset prepared by blending satellite imagery with in-situ station data [55]. It has daily
temporal resolution with 0.05 degree spatial resolution. Studies has been done in the past to
evaluate the accuracy of the CHIRPS data over Indian region. Gupta, V. et al., [56] reported
higher correlation with station data (>0.80) and lower systematic error (<10%) of CHIRPS
rainfall over Kerala region. Similar results were also observed by Prakash, S. et al., [57]. This
signifies that the CHIRPS rainfall has good potential for hydro metrological studies in this
region. The linear trend analysis was performed to study the overall rainfall trend over the
study area. Cumulative rainfall plot is used to analyze the variation of precipitation during
monsoon season June, July and August (JJA) between 2015 and 2018. This period was selected
Fig 3. Backscatters values of non-water and water class.
https://doi.org/10.1371/journal.pone.0237324.g003
PLOS ONE Flood inundation mapping
PLOS ONE | https://doi.org/10.1371/journal.pone.0237324 August 19, 2020 7 / 17

to comply with the inundation analysis. Trend analysis during JJA (1981–2018) was also per-
formed to monitor the long term rainfall pattern. The selected period of rainfall data was
based on the recommendation of World Meteorological Organization (WMO)—WMO rec-
ommends a period of at least 30 years for the assessment of climatic change [58]. The advan-
tage of having climatic data for longer period enables us to perform comparison of trends
across different flood effected locations.
Results and discussion
Time series backscatter profile was also examined at the flooded location as shown in Fig 4.
The backscattered vs. time curve was smoothed utilizing Fourier transform smoothening tech-
nique [59]. Since water behaves as a smooth surface, the graph shows sudden decrease in the
backscatter signal at the time of the flood (August 2018). Changes in the backscatter value
describe the occurrence of the flood event in August 2018. The August 2018 flood event was
also reported in the news [60,61]. The low backscatter values (function of surface roughness)
in the month of August 2018 were due to the increase in water inundation (mainly due to the
flood event) which again went up in September 2018 because of the decrease in water inunda-
tion (post flood event).
Water inundation maps from 2015–2018 and different seasons of 2018 were developed as
depicted in Figs 5 and 6 respectively. Our analysis clearly show that the area submerged under
water increased in the classified map of August 2018 as compared to the maps of the same
month from 2015 to 2017 (Table 2). Similarly, in the classified images, water covered areas
observed were less in pre-flood and post flood acquired data of 2018 (January-April and Sep-
tember) (Fig 6 and Table 2).
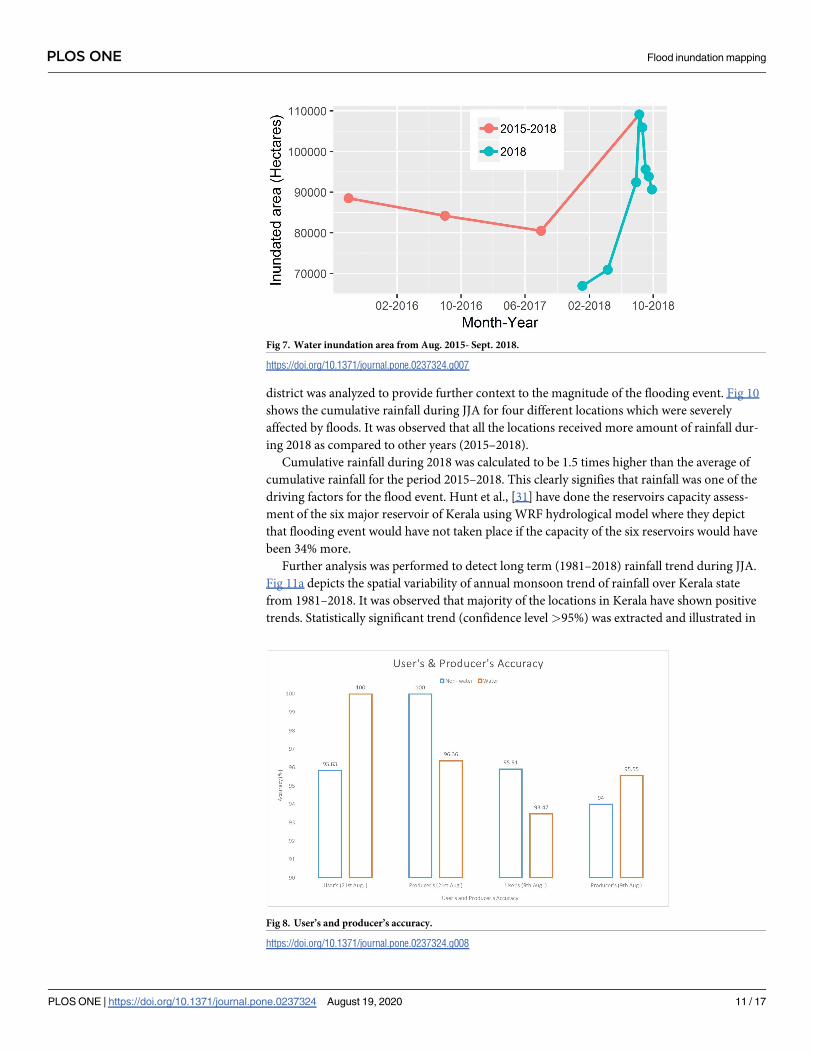
Fig 7 shows the graph between the different years (August 2015–2018) and the area sub-
merged under water; and Fig 5 depicts a graph between different seasons (2018) and the area
covered by water. It can be interpreted from the above graphs that the extent of the area in
August 2018 is maximum as compared to other years (2015–2017) and seasons (January-Sep-
tember 2018). This clearly indicates the occurrence of a flood event in August 2018.
The accuracy assessment was performed on the 9th and 21st August 2018 flood maps. The
overall accuracy of the classification was found to be 94.73% and 94.71% with a kappa coeffi-
cient of 0.87 and 0.88 respectively. The individual class accuracy of the classification is depicted
Fig 4. Time series backscatter signal at flooded location.
https://doi.org/10.1371/journal.pone.0237324.g004
PLOS ONE Flood inundation mapping
PLOS ONE | https://doi.org/10.1371/journal.pone.0237324 August 19, 2020 8 / 17

in Fig 8. High classification accuracy demonstrates the potential of the Otsu’s algorithm for
classifying the water and non-water pixels.
Sentinel-1 SAR operates in C band with its penetration capability ranges between ~5.6cm.
Presence of clouds and rain droplets with thickness more than 7.5 cm at the time of data acqui-
sition attenuates signal which result in noisy sentinel-1 images. This may be the reason for mis-
classification. However, using L or X band sensors can overcome this kind of uncertainty as
these sensors have high penetration capability then C band.
The variation of the backscatter values was also examined using non-water sample points
used in the validation. The backscatter response of the non-water sample points were exam-
ined for the month of Aug. 2015–2018 as depicted in Fig 9. It was observed that during the
flood event (Aug. 2018), the backscatter values of the non-water class exhibits low backscatter
values with a mean and average deviation value of -23.52 ± 2.14 db respectively. Contradictory,
the backscatter values of the non-water class in non-flood year’s shows low backscattering i.e.
-7.45 db�Mean backscatter� -6.23 db and average deviation of ±1.8 db respectively. In addi-
tion to inundation delineation of the 2018 flood event, cumulative rainfall for the Kerala
Fig 5. Water inundation map from Jan.–Sept. 2018. Shapefile reprinted from GADM database under a CC BY license, with permission from Global
Administrative Areas (www.gadm.org), original copyright 2018. The figure was made with ArcGIS 10.3 under a CC BY license, with permission from ESRI
(www.esri.com).
https://doi.org/10.1371/journal.pone.0237324.g005
PLOS ONE Flood inundation mapping
PLOS ONE | https://doi.org/10.1371/journal.pone.0237324 August 19, 2020 9 / 17

Fig 6. Water inundation map from Aug. (2015–2018). Shapefile reprinted from GADM database under a CC BY license, with permission from Global
Administrative Areas (www.gadm.org), original copyright 2018. The figure was made with ArcGIS 10.3 under a CC BY license, with permission from ESRI
(www.esri.com).
https://doi.org/10.1371/journal.pone.0237324.g006
Table 2. Water inundated area observed in different dates data.
Event Date Area (Hectares) Year
Before Flood Aug. 13 88540.11 2015
Aug.17 84210.56 2016
Aug.14 80516.85 2017
Jan. 5 66955.46 2018
April 11 70923.45
Starting of Flood July 28 92463.39
During Flood Aug.9 109147.67
Aug. 21 105967.76
After Flood Sept. 2 95617.21
Sept.14 93871.25
Sept 26 90695.02
https://doi.org/10.1371/journal.pone.0237324.t002
PLOS ONE Flood inundation mapping
PLOS ONE | https://doi.org/10.1371/journal.pone.0237324 August 19, 2020 10 / 17
district was analyzed to provide further context to the magnitude of the flooding event. Fig 10
shows the cumulative rainfall during JJA for four different locations which were severely
affected by floods. It was observed that all the locations received more amount of rainfall dur-
ing 2018 as compared to other years (2015–2018).
Cumulative rainfall during 2018 was calculated to be 1.5 times higher than the average of
cumulative rainfall for the period 2015–2018. This clearly signifies that rainfall was one of the
driving factors for the flood event. Hunt et al., [31] have done the reservoirs capacity assess-
ment of the six major reservoir of Kerala using WRF hydrological model where they depict
that flooding event would have not taken place if the capacity of the six reservoirs would have
been 34% more.
Further analysis was performed to detect long term (1981–2018) rainfall trend during JJA.
Fig 11a depicts the spatial variability of annual monsoon trend of rainfall over Kerala state
from 1981–2018. It was observed that majority of the locations in Kerala have shown positive
trends. Statistically significant trend (confidence level>95%) was extracted and illustrated in
Fig 7. Water inundation area from Aug. 2015- Sept. 2018.
https://doi.org/10.1371/journal.pone.0237324.g007
Fig 8. User’s and producer’s accuracy.
https://doi.org/10.1371/journal.pone.0237324.g008
PLOS ONE Flood inundation mapping
PLOS ONE | https://doi.org/10.1371/journal.pone.0237324 August 19, 2020 11 / 17

Fig 11b. It was observed that major flood affected locations (described in methods and material
section) in Kerala have shown statistically significant increasing trend of JJA rainfall from
1981–2018. The increasing trend varies between 5 to 20 mm per year. Similar findings were
depicted in Ali et al., [32] and Sharmila S, [62] where surface hydrological model was utilized
to observed and projected changes in extreme precipitation and flood events. Their study dem-
onstrate that the multi-day flood events are projected to increase with a faster rate in the future
than the single day events.
Conclusions and future recommendations
Swift and accurate estimation of water inundated areas can provide valuable and timely infor-
mation during flood events. In this study, we assessed the Otsu thresolding approach using
Sentinel-1 SAR for mapping flood areas. The analyses were done on the GEE platform. The
conclusions that can be drawn from this study are as follows: (i) currently available Sentinel-1
Fig 9. Backscatter values of non-water sample points from Aug. 2015–2018.
https://doi.org/10.1371/journal.pone.0237324.g009
Fig 10. Cumulative rainfall for June July Aug. from 2015–2018.
https://doi.org/10.1371/journal.pone.0237324.g010
PLOS ONE Flood inundation mapping
PLOS ONE | https://doi.org/10.1371/journal.pone.0237324 August 19, 2020 12 / 17

SAR allows data retrieval in all weather conditions therefore, has a good potential for mapping
water inundated areas at the time of floods specifically in Kerala where more flood are likely to
occur in near future (Fig 11a & 11b); (ii) Otsu’s method is capable of automatically detecting
thresholds for separating water and non-water pixels without requiring user dependent
parameter (reference points from the ground) unlike supervised machine learning methods;
and (iii) the GEE platform can be used for processing and analysis of the inundation maps
without the need for downloading data or high computing hardware. The automated and on-
the-fly performance at acceptable accuracy level proves the utility and potential of GEE appli-
cations for rapid response in flood inundation mapping. While this paper highlights a proof of
concept, further analysis is needed to explore the VH Polarization and band ratio techniques
such as VV/VH. Since the Otsu method has been implemented and tested in GEE environ-
ment, the method can be tried on other areas for mapping real time flood events without
requirement of ground sample points, except for validation. Though Otsu have shown good
performance with far and wide case studies for flood mapping. It has limitations, Otsu
assumed to have bimodal histogram distribution and also assumed to possess a deep and sharp
valley between two peaks. In the study area if the object area is small compared with the back-
ground area, the histogram no longer exhibits bimodality. Therefore, Two-dimensional Otsu’s
method can be consider as it performs better image segmentation in noisy images [63]. Addi-
tionally, how information can be utilized and shared through social media could be explored
for further validation and dissemination of the findings for rapid response as described in
Babu et al., [64].
It is important to note that the natural occurrence and impact of floods can be magnified by
socio-economic development, including encroachment on the floodplains and inadequate
drainage management [65]. In addition, traditional knowledge of dealing with floods has been
forgotten, which have the potential to offer site-specific knowledge and critical guidance to
planners and decision makers. Flooding causes economic and livelihood losses especially in
developing countries where low-income earners undergo great stress. Losses due to floods
Fig 11. a) Pixel wise trend analysis of annual monsoon rainfall from 1981–2018 over Kerala, India; b) Pixel wise
signification trend analysis (95% confidence level.) of annual monsoon rainfall from 1981–2018 over Kerala, India.
Shapefile reprinted from GADM database under a CC BY license, with permission from Global Administrative Areas
(www.gadm.org), original copyright 2018. The figure was made with ArcGIS 10.3 under a CC BY license, with
permission from ESRI (www.esri.com).
https://doi.org/10.1371/journal.pone.0237324.g011
PLOS ONE Flood inundation mapping
PLOS ONE | https://doi.org/10.1371/journal.pone.0237324 August 19, 2020 13 / 17

reduces the asset base of households, communities and societies through the destruction of
standing crops, dwellings, infrastructure, machinery and buildings, in addition to tragic loss
of life. Despite the rich natural resources and water, people living in these areas are poorer as
compared to the rest of the country, and this is primarily due to the annual floods and related
devastation. The resulting financial burden is often back-breaking for the communities. The
pressure to maintain the day to day expenses, education of children, rituals, health amongst
these disasters, increasing poverty, and few available adaptive mechanisms has sometimes led
to migration from such areas. Flood and migration have direct relation as higher the flood,
higher is the migration rate. It is important to note that floods impact different sections of soci-
ety differentially, and requires a thorough understanding of flood-related issues. Floods have
adverse impacts such as the risk to life and property in the coming years, both because floods
are likely to be more frequent, and because increase in population is likely to result in more
people settling in areas vulnerable to flooding. An increase in floods is likely to influence prev-
alence of water-related diseases and contaminate water sources whereas, the insufficient water
for hygiene purposes during dry periods is likely to increase the risk of water-washed diseases.
Given the projected changes in precipitation, it is likely that there is going to be serious costs
for communities and sectors here. In view of the above, there is an urgent need for actions
to assist communities and dependent sectors to adapt. Therefore, the various heavily water-
dependent sectors—agriculture, industry, energy, navigation and water supply and sanitation
—need to cooperate to work towards achieving a resilient State.
Supporting information
S1 File.
(7Z)
Acknowledgments
The authors express great gratitude to David Molden, Director General and Eklabya Sharma,
Deputy Director General of ICIMOD for their overall guidance.
The authors would also like to thank reviewers for reviewing the article and for providing
the valuable suggestions to improve the manuscript. The views and interpretations in this publi-
cation are those of the author’s and they are not necessarily attributable to their organizations.
Author Contributions
Conceptualization: Varun Tiwari.
Data curation: Varun Tiwari.
Formal analysis: Varun Tiwari, Vinay Kumar, Amrit Thapa.
Investigation: Varun Tiwari.
Methodology: Varun Tiwari, Vinay Kumar, Amrit Thapa.
Project administration: Varun Tiwari.
Resources: Varun Tiwari, Amrit Thapa.
Software: Varun Tiwari.
Supervision: Vinay Kumar.
Validation: Varun Tiwari.
PLOS ONE Flood inundation mapping
PLOS ONE | https://doi.org/10.1371/journal.pone.0237324 August 19, 2020 14 / 17

Visualization: Varun Tiwari, Sunil Thapa.
Writing – original draft: Varun Tiwari, Mir Abdul Matin, Nishikant Gupta.
Writing – review & editing: Varun Tiwari, Vinay Kumar, Mir Abdul Matin, Amrit Thapa,
Walter Lee Ellenburg, Nishikant Gupta.
References1. Brivio PA, Colombo R, Maggi M, Tomasoni R. Integration of remote sensing data and GIS for accurate
mapping of flooded areas. Int J Remote Sens. 2002 Jan; 23(3):429–41.
2. Armenakis C, Du E, Natesan S, Persad R, Zhang Y. Flood Risk Assessment in Urban Areas Based on
Spatial Analytics and Social Factors. Geosciences. 2017 Nov 27; 7(4):123.
3. Amitrano D, Di Martino G, Iodice A, Riccio D, Ruello G. Unsupervised Rapid Flood Mapping Using Sen-
tinel-1 GRD SAR Images. IEEE Trans Geosci Remote Sens. 2018 Jun; 56(6):3290–9.
4. Khan SI, Hong Y, Wang J, Yilmaz KK, Gourley JJ, Adler RF, et al. Satellite Remote Sensing and Hydro-
logic Modeling for Flood Inundation Mapping in Lake Victoria Basin: Implications for Hydrologic Predic-
tion in Ungauged Basins. IEEE Trans Geosci Remote Sens. 2011 Jan; 49(1):85–95.
5. Joyce KE, Belliss SE, Samsonov SV, McNeill SJ, Glassey PJ. A review of the status of satellite remote
sensing and image processing techniques for mapping natural hazards and disasters. Prog Phys Geogr
Earth Environ. 2009 Apr; 33(2):183–207.
6. OHKI M, WATANABE M, NATSUAKI R, MOTOHKA T, NAGAI H, TADONO T, et al. Flood Area Detec-
tion Using ALOS-2 PALSAR-2 Data for the 2015Heavy Rainfall Disaster in the Kanto and Tohoku Area,
Japan [Internet]. The Remote Sensing Society of Japan; 2016 [cited 2019 Dec 5]. https://doi.org/10.
11440/rssj.36.348
7. Voormansik K, Praks J, Antropov O, Jagomagi J, Zalite K. Flood Mapping With TerraSAR-X in Forested
Regions in Estonia. IEEE J Sel Top Appl Earth Obs Remote Sens. 2014 Feb; 7(2):562–77.
8. Greifeneder F, Wagner W, Sabel D, Naeimi V. Suitability of SAR imagery for automatic flood mapping
in the Lower Mekong Basin. Int J Remote Sens. 2014 Apr 18; 35(8):2857–74.
9. Rahman MdR, Thakur PK. Detecting, mapping and analysing of flood water propagation using synthetic
aperture radar (SAR) satellite data and GIS: A case study from the Kendrapara District of Orissa State
of India. Egypt J Remote Sens Space Sci. 2018 Jul; 21:S37–41.
10. Uddin, Matin, Meyer. Operational Flood Mapping Using Multi-Temporal Sentinel-1 SAR Images: A
Case Study from Bangladesh. Remote Sens. 2019 Jul 3; 11(13):1581.
11. Li Y, Martinis S, Wieland M, Schlaffer S, Natsuaki R. Urban Flood Mapping Using SAR Intensity and
Interferometric Coherence via Bayesian Network Fusion. Remote Sens. 2019 Sep 25; 11(19):2231.
12. Shahabi H, Shirzadi A, Ghaderi K, Omidvar E, Al-Ansari N, Clague JJ, et al. Flood Detection and Sus-
ceptibility Mapping Using Sentinel-1 Remote Sensing Data and a Machine Learning Approach: Hybrid
Intelligence of Bagging Ensemble Based on K-Nearest Neighbor Classifier. Remote Sens. 2020 Jan 13;
12(2):266.
13. Bayik C, Abdikan S, Ozbulak G, Alasag T, Aydemir S, Balik Sanli F. EXPLOITING MULTI-TEMPORAL
SENTINEL-1 SAR DATA FOR FLOOD EXTEND MAPPING. ISPRS—Int Arch Photogramm Remote
Sens Spat Inf Sci. 2018 Mar 6; XLII-3/W4:109–13.
14. Shen X, Anagnostou EN, Allen GH, Robert Brakenridge G, Kettner AJ. Near-real-time non-obstructed
flood inundation mapping using synthetic aperture radar. Remote Sens Environ V 221. 2019;302–15.
15. Psomiadis E. Flash flood area mapping utilising SENTINEL-1 radar data. 2016.
16. Manjusree P, Prasanna Kumar L, Bhatt CM, Rao GS, Bhanumurthy V. Optimization of threshold ranges
for rapid flood inundation mapping by evaluating backscatter profiles of high incidence angle SAR
images. Int J Disaster Risk Sci. 2012 Jun; 3(2):113–22.
17. Peter L, Matjaz M, Kristof O. Detection of Flooded Areas using Machine Learning Techniques: Case
Study of the Ljubljana Moor Floods in 2010. Disaster Adv. 2013; 6:9.
18. Kumar R. Flood Inundation and Hazard Mapping of 2017 Floods in the Rapti River Basin Using Senti-
nel-1A Synthetic Aperture Radar Images. In: Kumar P, Rani M, Chandra Pandey P, Sajjad H, Chaudh-
ary BS, editors. Applications and Challenges of Geospatial Technology [Internet]. Cham: Springer
International Publishing; 2019 [cited 2019 Jan 13]. p. 77–98. http://link.springer.com/10.1007/978-3-
319-99882-4_6
19. Manjusree P, Prasanna Kumar L, Bhatt CM, Rao GS, Bhanumurthy V. Optimization of threshold ranges
for rapid flood inundation mapping by evaluating backscatter profiles of high incidence angle SAR
images. Int J Disaster Risk Sci. 2012 Jun; 3(2):113–22.
PLOS ONE Flood inundation mapping
PLOS ONE | https://doi.org/10.1371/journal.pone.0237324 August 19, 2020 15 / 17

20. Liu C. Analysis of Sentinel-1 SAR data for mapping standing water in the Twente region.:47.
21. Malinowski R, Groom G, Schwanghart W, Heckrath G. Detection and Delineation of Localized Flooding
from WorldView-2 Multispectral Data. Remote Sens. 2015 Nov 6; 7(11):14853–75.
22. Haq M, Akhtar M, Muhammad S, Paras S, Rahmatullah J. Techniques of Remote Sensing and GIS for
flood monitoring and damage assessment: A case study of Sindh province, Pakistan. Egypt J Remote
Sens Space Sci. 2012 Dec; 15(2):135–41.
23. Cao H, Zhang H, Wang C, Zhang B. Operational Flood Detection Using Sentinel-1 SAR Data over
Large Areas. Water. 2019 Apr 16; 11(4):786.
24. Xue J-H, Zhang Y-J. Ridler and Calvard’s, Kittler and Illingworth’s and Otsu’s methods for image thresh-
olding. Pattern Recognit Lett. 2012 Apr; 33(6):793–7.
25. Papamarkos N, Gatos B. A New Approach for Multilevel Threshold Selection. CVGIP Graph Models
Image Process. 1994 Sep; 56(5):357–70.
26. Miasnikov AD, Rome JE, Haralick RM. A hierarchical projection pursuit clustering algorithm. In: Pro-
ceedings of the 17th International Conference on Pattern Recognition, 2004 ICPR 2004 [Internet]. Cam-
bridge, UK: IEEE; 2004 [cited 2019 Dec 10]. p. 268–271 Vol.1. http://ieeexplore.ieee.org/document/
1334104/
27. Martinis S, Twele A, Voigt S. Towards operational near real-time flood detection using a split-based
automatic thresholding procedure on high resolution TerraSAR-X data. Nat Hazards Earth Syst Sci.
2009 Mar 11; 9(2):303–14.
28. Kordelas G, Manakos I, Aragones D, Dıaz-Delgado R, Bustamante J. Fast and Automatic Data-Driven
Thresholding for Inundation Mapping with Sentinel-2 Data. Remote Sens. 2018 Jun 8; 10(6):910.
29. Li J, Wang S. An automatic method for mapping inland surface waterbodies with Radarsat-2 imagery.
Int J Remote Sens. 2015 Mar 4; 36(5):1367–84.
30. Rosser JF, Leibovici DG, Jackson MJ. Rapid flood inundation mapping using social media, remote
sensing and topographic data. Nat Hazards. 2017 May; 87(1):103–20.
31. Hunt KMR, Menon A. The 2018 Kerala floods: a climate change perspective. Clim Dyn. 2020 Feb; 54
(3–4):2433–46.
32. Ali H, Modi P, Mishra V. Increased flood risk in Indian sub-continent under the warming climate.
Weather Clim Extrem. 2019 Sep; 25:100212.
33. Mishra V, Shah HL. Hydroclimatological Perspective of the Kerala Flood of 2018. J Geol Soc India.
2018 Nov; 92(5):645–50.
34. Viswanadhapalli Y, Srinivas CV, Basha G, Dasari HP, Langodan S, Venkat Ratnam M, et al. A diagnos-
tic study of extreme precipitation over Kerala during August 2018. Atmospheric Sci Lett [Internet]. 2019
Dec [cited 2020 Mar 6]; 20(12). Available from: https://onlinelibrary.wiley.com/doi/abs/10.1002/asl.941
35. Ramasamy SM, Gunasekaran S, Rajagopal N, Saravanavel J, Kumanan CJ. Flood 2018 and the status
of reservoir-induced seismicity in Kerala, India. Nat Hazards. 2019 Oct; 99(1):307–19.
36. Anandalekshmi A, Panicker ST, Adarsh S, Muhammed Siddik A, Aloysius S, Mehjabin M. Modeling the
concurrent impact of extreme rainfall and reservoir storage on Kerala floods 2018: a Copula approach.
Model Earth Syst Environ. 2019 Dec; 5(4):1283–96.
37. Lal P, Prakash A, Kumar A, Srivastava PK, Saikia P, Pandey AC, et al. Evaluating the 2018 extreme
flood hazard events in Kerala, India. Remote Sens Lett. 2020 May 3; 11(5):436–45.
38. Sk M. Flood Inundation Mapping using Synthetic Aperture Radar (SAR) Data and its impact on Land
Use /Land Cover (LULC): A Case Study of Kerala Flood 2018, India. Disaster Adv. 2020; 13:8.
39. Vishnu CL, Sajinkumar KS, Oommen T, Coffman RA, Thrivikramji KP, Rani VR, et al. Satellite-based
assessment of the August 2018 flood in parts of Kerala, India. Geomat Nat Hazards Risk. 2019 Jan 1;
10(1):758–67.
40. Gorelick N, Hancher M, Dixon M, Ilyushchenko S, Thau D, Moore R. Google Earth Engine: Planetary-
scale geospatial analysis for everyone. Remote Sens Environ. 2017 Dec; 202:18–27.
41. Farrahi Moghaddam R, Cheriet M. AdOtsu: An adaptive and parameterless generalization of Otsu’s
method for document image binarization. Pattern Recognit. 2012 Jun; 45(6):2419–31.
42. Nakmuenwai P, Yamazaki F, Liu W. Automated Extraction of Inundated Areas from Multi-Temporal
Dual-Polarization RADARSAT-2 Images of the 2011 Central Thailand Flood. Remote Sens. 2017 Jan
15; 9(1):78.
43. G R. Flood damages in Kerala pegged at Rs 40,000 crore. Times of India [Internet]. 2018 Sep 13 [cited
2020 Mar 13]; https://timesofindia.indiatimes.com/city/thiruvananthapuram/kerala-lost-rs-40000-cr-
due-to-floods-report-will-be-submitted-to-centre/articleshow/65783705.cms
44. Psomiadis E. Flash flood area mapping utilising SENTINEL-1 radar data. 2016.
PLOS ONE Flood inundation mapping
PLOS ONE | https://doi.org/10.1371/journal.pone.0237324 August 19, 2020 16 / 17

45. Twele A, Cao W, Plank S, Martinis S. Sentinel-1-based flood mapping: a fully automated processing
chain. Int J Remote Sens. 2016 Jul 2; 37(13):2990–3004.
46. Carreño Conde F, De Mata Muñoz M. Flood Monitoring Based on the Study of Sentinel-1 SAR Images:
The Ebro River Case Study. Water. 2019 Nov 22; 11(12):2454.
47. Agnihotri AK, Ohri A, Gaur S, Shivam, Das N, Mishra S. Flood inundation mapping and monitoring
using SAR data and its impact on Ramganga River in Ganga basin. Environ Monit Assess. 2019 Dec;
191(12):760. https://doi.org/10.1007/s10661-019-7903-4 PMID: 31745827
48. Filipponi F. Sentinel-1 GRD Preprocessing Workflow. Proceedings. 2019 Jun 4;18(1):11.
49. Stasolla M, Neyt X. An Operational Tool for the Automatic Detection and Removal of Border Noise in
Sentinel-1 GRD Products. Sensors. 2018 Oct 14; 18(10):3454.
50. Veci L, Prats-Iraola P, Scheiber R, Collard F, Fomferra N, Engdahl M. The Sentinel-1 Toolbox. 2014.
1 p.
51. Marghany M, Sabu Z, Hashim M. Mapping coastal geomorphology changes using synthetic aperture
radar data. Int J Phys Sci.: 7.
52. Du Y, Zhang Y, Ling F, Wang Q, Li W, Li X. Water Bodies’ Mapping from Sentinel-2 Imagery with Modi-
fied Normalized Difference Water Index at 10-m Spatial Resolution Produced by Sharpening the SWIR
Band. Remote Sens. 2016 Apr 22; 8(4):354.
53. Clement MA, Kilsby CG, Moore P. Multi-temporal synthetic aperture radar flood mapping using change
detection: Multi-temporal SAR flood mapping using change detection. J Flood Risk Manag. 2018 Jun;
11(2):152–68.
54. Cao H, Zhang H, Wang C, Zhang B. Operational Flood Detection Using Sentinel-1 SAR Data over
Large Areas. Water. 2019 Apr 16; 11(4):786.
55. Funk C, Peterson P, Landsfeld M, Pedreros D, Verdin J, Shukla S, et al. The climate hazards infrared
precipitation with stations—a new environmental record for monitoring extremes. Sci Data. 2015 Dec 8;
2:150066. https://doi.org/10.1038/sdata.2015.66 PMID: 26646728
56. Gupta V, Jain MK, Singh PK, Singh V. An assessment of global satellite-based precipitation datasets in
capturing precipitation extremes: A comparison with observed precipitation dataset in India. Int J Clima-
tol. 2019 Dec 16;joc.6419.
57. Prakash S. Performance assessment of CHIRPS, MSWEP, SM2RAIN-CCI, and TMPA precipitation
products across India. J Hydrol. 2019 Apr; 571:50–9.
58. Kundzewicz ZW, Robson AJ. Change detection in hydrological records—a review of the methodology /
Revue methodologique de la detection de changements dans les chroniques hydrologiques. Hydrol Sci
J. 2004 Feb; 49(1):7–19.
59. Menenti M, Azzali S, Verhoef W, van Swol R. Mapping agroecological zones and time lag in vegetation
growth by means of fourier analysis of time series of NDVI images. Adv Space Res. 1993 May; 13
(5):233–7.
60. Taylor A. Devastating Monsoon Floods in Kerala, India. The Atlantic [Internet]. 2018 Aug 22; Available
from: https://www.theatlantic.com/photo/2018/08/devastating-monsoon-floods-in-kerala-india/568171/
61. Jose T. Post-Disaster Needs Assessment: Kerala, India [Internet]. United Nations Developement Pro-
gramme; 2018 Oct. https://reliefweb.int/report/india/kerala-post-disaster-needs-assessment-floods-
and-landslides-august-2018-october-2018
62. Sharmila S, Joseph S, Sahai AK, Abhilash S, Chattopadhyay R. Future projection of Indian summer
monsoon variability under climate change scenario: An assessment from CMIP5 climate models. Glob
Planet Change. 2015 Jan; 124:62–78.
63. Yi-bing L, Ting M, Ao L. Two-Dimensional Otsu Image Segmentation Algorithm Based on the Particle
Swarm Optimization Algorithm. In: Deng W, editor. Future Control and Automation [Internet]. Berlin,
Heidelberg: Springer Berlin Heidelberg; 2012 [cited 2020 Mar 9]. p. 115–20. (Lecture Notes in Electrical
Engineering; vol. 172). http://link.springer.com/10.1007/978-3-642-31006-5_14
64. Babu AS. Impact of Social Media in Dissemination of Information during a Disaster- a Case Study on
Kerala Floods 2018. 2019; 8(7):4.
65. Dutta D, Babel MS, Gupta AD. 2004-CB01NSY-Dutta Final Report submitted to APN.:214.
PLOS ONE Flood inundation mapping
PLOS ONE | https://doi.org/10.1371/journal.pone.0237324 August 19, 2020 17 / 17