flood inundation modeling in ungauged basins using
TRANSCRIPT

Earth Observation and Geomatics Engineering 4(1) (2020) 44–55
__________
* Corresponding author
E-mail addresses: [email protected] (A. Yavari); [email protected] (S. Homayouni); [email protected] (Kh.
Oubennaceur); [email protected] (K. Chokmani)
DOI: 10.22059/eoge.2020.297824.1075
44
ABSTRACT
This paper presents a new framework for floodplain inundation modeling in an ungauged basin using
unmanned aerial vehicles (UAVs) imagery. This method is based on the integrated analysis of high-
resolution ortho-images and elevation data produced by the structure from motion (SfM) technology. To
this end, the Flood-Level Marks (FLMs) were created from high-resolution UAV ortho-images and
compared to the flood inundated areas simulated using the HEC-RAS hydraulic model. The flood
quantiles for 25, 50, 100, and 200 return periods were then estimated by synthetic hydrographs using the
Natural Resources Conservation Service (NRCS). The proposed method was applied to UAV image data
collected from the Khosban village, in Taleghan County, Iran, in the ungauged sub-basin of the Khosban
River. The study area is located along one kilometre of the river in the middle of the village. The results
showed that the flood inundation areas modeled by the HEC-RAS were 33%, 19%, and 8% less than
those estimated from the UAV’s FLMs for 25, 50, and 100 years return periods, respectively. For return
periods of 200 years, this difference was overestimated by more than 6%, compared to the UAV’s FLM.
The maximum flood depth in our four proposed scenarios of hydraulic models varied between 2.33 to
2.83 meters. These analyses showed that this method, based on the UAV imagery, is well suited to
improve the hydraulic modeling for seasonal inundation in ungauged rivers, thus providing reliable
support to flood mitigation strategies.
S KEYWORDS
UAV Imagery and Mapping
Khosban-River
Flood-Level Marks
HEC-RAS
Flood Inundation
Ungagged Basin
Hydraulic Modelling
1. Introduction
Flood has been one of the natural hazards affecting
human activities since the beginning of civilization and has
always caused economic and human damage in many
countries (Azizian, 2018; Yahya et al., 2010; Bernet et al.,
2018; Domeneghetti et al., 2019). One of the strategies to
reduce future flood risks is hydraulic modeling of streams
in order to identify the flood risk areas (Li et al., 2018; Das,
2019; Golshan et al., 2016; Aishwaryalakshmi et al., 2017;
Bezak et al., 2018; Merwade et al. 2008; Rahman &Ali,
2016, Zeleňáková et al., 2019). Heavy rainfalls or snow
melting causes increase river water levels and flood risk
(Sumalan et al., 2017). Torrential rains can occur even in
arid and semi-arid regions with relatively low rainfall,
surfacefloods. Therefore, monitoringcausing seasonal -
level flooding is essential for developing flood hazard
zoning and mapping (Kirk, 2013). As a solution, hydraulic
modeling is a useful and efficient tool in the simulation of
floods. The spatial resolution and the geometric accuracy of
topographic data may affect hydraulic flood modeling
(Mourato et al., 2014).
Due to their impact on hydrograph and flood extent,
modeling ground surfaces is critical for hydraulic
simulation results. A hydraulic model with a high spatial
resolution is particularly useful when large-scale processes
have to be considered in predicting the model (Coveney &
Roberts, 2017). For example, in complex environments, a
high-resolution Digital Elevations Model (DEM) is
essential for simulating floodplains (Mourato et al., 2014).
webs i t e : h t t ps : / / eoge .u t . ac . i r
Flood inundation modeling in ungauged basins using Unmanned Aerial
Vehicles imagery
Adel Yavari1,2,*, Saeid Homayouni3, Khalid Oubennaceur3, Karem Chokmani3
1 Department of Civil Engineering, University of Qom, Qom, Iran 2 Isfahan Province Water & Waste Water Company, Isfahan, Iran 3 Institut National de la Recherche Scientifique, Centre Eau Terre Environnement, 490, rue de la Couronne Québec (QC) G1K 9A9, Canada
Article history:
Received: 10 January 2019, Received in revised form: 26 April 2020, Accepted: 2 May 2020

Yavari et al, 2020
45
A combination of ortho-mosaic images and DEM with high
spatial resolution as inputs of hydrological models can
result in a better 3D simulation of areas under the flood
simulations with different intensities (Baggio & Rouquette,
2006). This 3D simulation provides an adequate
understanding of the interactions between water and terrain
surface and an accurate locating of flood-prone areas
(Horritt et al., 2001; Mourato et al., 2014). The invention of
remote sensing made a vital step for mapping impervious
areas and landscape changes.
Most studies on the extraction of impervious surfaces
from remote sensing data focused on satellite images
(Weng, 2012). However, Some researchers have used high-
resolution unmanned aerial vehicles (UAVs) imagery to
monitor flood characteristics (Cook & Merwade, 2009;
Geerling et al.,2009; Flener et al., 2013; Lee et al., 2013;
Feng et al., 2015; Dietrich, 2016; Perks et al., 2016;
Popescu et al., 2017; Hashemi-Beni et al., 2018; Rong et
al., 2019; Şerban et al., 2016; Watanabe & Kawahara,
2016), hydrodynamic modeling (Yalcin, 2018), flood risk
management (Hashemi-Beni et al., 2018), early warning
systems (Schumann et al., 2019), and post-flood damage
estimation (Zeleňáková et al., 2019). In hydrology, UAVs
have a crucial role to characterize the surface flow
quantitatively, allowing for remotely accessing the water
body of interest. UAVs’ spreading use paved the way for
integrating drone technology and optical sensing, hydraulic
data such as inundated areas, surface flow measurements,
and water level estimations. This image-based technology is
well suited in the framework of the Prediction in Ungauged
Basins (PUB) decade as this method can be used to retrieve
hydraulic data in ungauged sites (Sivapalan et al., 2003;
Ridolfi et al., 2016; Niedzielski et al., 2016; Bandini et al.,
2017; Tauro et al., 2014). Casado et al. (2015) used a
framework based on UAV imagery to recognize hydro-
morphological features from high-resolution aerial imagery
using a new Artificial Neural Network (ANN) method. This
method enhances UAV use for environmental politics and
shows the high potential of ANN and high-resolution
images to control and manage rivers (Casado et al., 2015).
Diakakis et al. (2019) surveyed the flood area during and
after the flood using a combination of systematic ground
and aerial observation data with UAV aid to reconstruct the
flood’s essential physical and hydrological characteristics
its impacts (Diakakis et al., 2019). Zazo et al. (2015) used
Reduced Cost Aerial Precision Photogrammetry (RC-APP)
technique, based on a motorized technology Ultra-light
Aircraft Ultra-light Motor (ULM). This technique is applied
in river engineering for the geometric modeling and risk
assessment of floods (Zazo et al., 2015). Watanabe and
Kawahara (2016) used UAV photogrammetry to monitor
the changes in river topography and vegetation. The Digital
Surface Model (DSM) calculated using this method
efficiently represents the variations in topography and
ground with a maximum error of 4 cm. In addition, the
changes in DSM, before and after the flood, were due to
vegetation cover on sand and gravel (Watanabe
&Kawahara, 2016). Nguyen et al. (2020) proposed a novel
modeling approach for spatial prediction of flash floods
based on the tree intelligence-based CHAID (Chi-square
Automatic Interaction Detector). In this method, a forest of
tree intelligence constructed through the random subspace
ensemble, and then, the swarm intelligence was employed
to train and optimize the model (Neguyen et al., 2020).
Research works present various techniques for detecting
geomorphological effects (e.g., deforestation, population
growth, land-use changes, etc.) on floodplain using UAV
and satellite imagery (Langhammer & Vackova, 2018;
Barasa & Perrera, 2018; Alexakis et al., 2014). Feng et al.
(2015) presented a combinatorial method for flood
inundation mapping using the Random Forest algorithm and
analysis based on high-resolution drone images. The
random forest consisted of 200 branches of the decision tree
and was exploited to acquire flood inundation (Feng et
al.,2015). The UAV offers a fast and accurate way to
acquire aerial images at a relatively low cost with resolution
and accuracy, typically in the range of a few cms.
Compared to traditional remote sensing data, the UAV
enables the rapid operation to obtain high-frequency multi-
temporal and high-resolution images.
Tokarczyk et al. (2015) investigated the quality of digital
elevation models (DEMs) generated using UAV imagery
from urban drainage modeling applications and found that a
realistic representation (resolution < 1 m) plays a
fundamental role in surface flow modeling (Tokarczyk et
al., 2015).
Ungagged basins have been challenging in developing
countries for natural hazards and flood monitoring for many
years. In particular, the lack of hydrometric and synoptic
affects thethatlimitationan essentialisstations data
accuracy and reliability of hydrologic and hydraulic
models. To this end, topographic information collected by
the terrestrial surveying techniques, satellite imagery, or
UAV photogrammetry is needed. This research proposed a
framework to identify and map the areas under the flood
risk using high-resolution ortho-images and DSM/DEM
from UAV imagery in the ungagged basins.
This methodology helps experts consider large-scale
processes in predicting hydraulic and hydrological
modeling and provide details that are not recognizable by
terrestrial surveying and mapping, and satellite imagery.
For such an application, accurate topographic information
that affects the river’s flow regime and helps extract
accurate FLMs is essential. This method can be very
thewhererivers,small and seasonaladvantageous for
catchment has no hydrological data. This approach is
expected to provide substantial support to the monitoring
and management of rivers and flood monitoring.

Earth Observation and Geomatics Engineering 4(1) (2020) 44–55
46
2. Case study and Methodology
2.1. Case study
This research area is one of the sub-basins of Taleghan
County, located in the Alborz Province in Iran (Figure 1).
The main imaged river is the Khosban River, with a length
of 1 km. This region is located between longitudes 50 47’
4.3” to 50 47’ 42.35” E and latitudes 36 11’ 44.6” to 36 12’
15.82” N. The maximum and minimum elevations in the
basin are 2095 and 1953 m, respectively, and the annual
precipitation in the area is 540 to 610 mm.
2.2. Methodology
To predict the characteristic of a flood in a specified
area, it is better to measure and record several floods that
have occurred previously in the region, then by statistical
analysis on the hydrometric data, the most probabilistic
floods that will occur in the future will be predicted. In
cases where this data is not available, the use of empirical
relationships, regional analysis, logical methods, or push
the curve number method is an alternative (Alizadeh, 2011).
Since no hydrometric stations were available in the study
area, we used the Natural Resources Conservation Service
and synthetic unit hydrograph of NRCS methods to
estimate the flood discharges with 25, 50, 100, and 200
years of return. The NRCS method uses a hypothetical
design storm and an empirical nonlinear runoff equation to
compute runoff volumes and a dimensionless unit
hydrograph to convert the volumes into runoff hydrographs.
The methodology is particularly useful for comparing pre-
and post-development peak rates, volumes, and
hydrographs. The NRCS runoff equation’s critical
component is the NRCS Curve Number (CN), based on soil
permeability, surface cover, hydrologic condition, and
antecedent moisture. Watershed or drainage area time of
concentration is the crucial component of the dimensionless
unit hydrograph. Figure 2 shows an overview of the
processing and simulation workflow of flood inundation
modeling in the Khosban River.
(a) (b)
(c) (d)
Figure 1. location of the Khosban River watershed in Iran (a); location of the Khosban basin and simulated flood area by UAV (b); the digital
surface model (c); and the ortho-mosaic of the study area (d)

Yavari et al, 2020
47
Figure 2. A general overview of the workflow in flood inundation of the Khosban River
The workflow starts with the processing of UAV
images in AgiSoft Photoscan Software, recently renamed to
Metashape (www.agisoft.com). Agisoft PhotoScan is a 3D
modeling software that is capable of creating outputs that
can be compared to those of the other software. To extract
the hydrologic parameters of the catchment, the outputs of
the AgiSoft-PhotoScan, including ortho-mosaic image and
DEM, were used in ArcHydro. In addition, the HEC-
GeoRAS extension of ArcGIS 10.5 developed by the
Hydrologic Engineering Center (HEC) of the United States
Army Corps of Engineers Hydrologic Engineering Center
was used to produce the geometric parameters of the river
that was imported into HEC-RAS. The flood discharge was
estimated using the Win-TR55 software and based on
different return periods of 6-hour rainfall in Storm-water
Management and Design Aid (SMADA) software.
Moreover, the Curve Numbers (CNs) of the basin were
extracted using the Normalized Difference Vegetation
Index (NDVI) from satellite images. Finally, the flood
inundation modeled by 25, 50, 100, and 200 years return
periods in HEC-RAS, and in the following, they were
entered in the GIS environment to differentiate with Flood-
Level Mark of the river that delineated from UAV images
and TIN as observation data.
2.2.1. UAV Image Processing
T theevaluateo estimate and accuracymapping’s
using UAV images, Nama Pardaz Rayaneh (NPR)
Company carried out an experimental project in Khosban
Village in the spring of 2017 (www.nprco.com). The study
area was imaged using a fixed-wing eBee Plus UAV system
from SenseFly (https://www.sensefly.com). In a 24-minute
flight and with a longitudinal and lateral overlap of 75 and
65 percent, respectively, a total of 145 photographs with a
Ground Sample Distance (GSD) of 5 cm were collected at a
flight height of 239 meters. The images cover an area of
about 44.9 hectares covered by the UAV. This system is
equipped with a Real-Time Kinematic and Post Processed
Kinematic (RTK/PPK) positioning system. Therefore, the
images captured by the photographic camera of this system,
i.e., Sensor Optimized for Drone Applications (SODA),
have a positional accuracy of about 2 cm. In addition, eight
Ground Control Points (GCP) were measured in the area
using a dual-frequency GPS receiver to ensure coincidence
of positioning. These points were used as reference points
to retrieve the geometric accuracy of the final geospatial
output products. Table 1 shows the results of horizontal and
vertical accuracies calculated on GCPs.
The collection images were processed using the
Agisoft PhotoScan software based on the structure from
motion (SFM) technology. The outputs from this step are a
dense-point cloud model with more than 17 million points.
From this point cloud, a digital elevation model with a pixel
size of 5 cm was extracted. It should be noted that using
dense DSM points, the clouds of trees were removed to
create the Digital Train Model (DTM). The DTM and the
ortho-mosaic map were used to model the physical and
hydrological parameters of the river.
2.2.2. Hydrologic Parameters Extraction
T the region,hydrological parameters ofo extract
and HECArcHydro - Hydrologic(GeospatialGeoHMS
Modeling System) tools were used. These tools allow
visualizing spatial information and extracting the properties
of the basin from a DEM. There are various
geomorphological forms, such as ditches, which may be
identified as basin outlets. Therefore, before the process
starts, these objects should be filled by preprocessing the
DEM. To this end, the delineated FLMs from the UAV
ortho-image should be used along with DEM to identify the
•Inputs:145 Images captured by eBee plus UAV
•Outputs of AgiSoft-Photoscan: Digital Elevation Model (DEM), Ortho-mosaic image, Dense Point Cloud, Digital
Surface Model(DSM)
Step 1: Processing of UAV images in AgiSoft-Photoscan Software
•Inputs: DEM and Ortho-mosaic image
•Outputs of ArcHydro: Drainages and streams, Batch point of basin, Boundary of basin
Step 2: Extracting Hydrological Parameters of Khosban-Basin in
ArcHydro
•Inputs: Ortho-mosaic image, DEM
•Outputs of HEC-GeoRAS: Digitized stream centerline, banks,cross sections
Step 3: Extracting Geometric Parameters of Khosban-River in
HEC-GeoRAS
•Inputs: Curve Number of basin according to NRCS method, peak discharges according to NRCS Synthetic Unit Hydrograph method (Step 2 and 3 was used as basic data to calculte inputs of
step 4)
•Outputs of HEC-RAS: Depth, inundation, velocity and shear stress of flood river
Step 4: Hydraulic Simulation of Flood Inundation in HEC-RAS
Earth Observation and Geomatics Engineering 4(1) (2020) 44–55
48
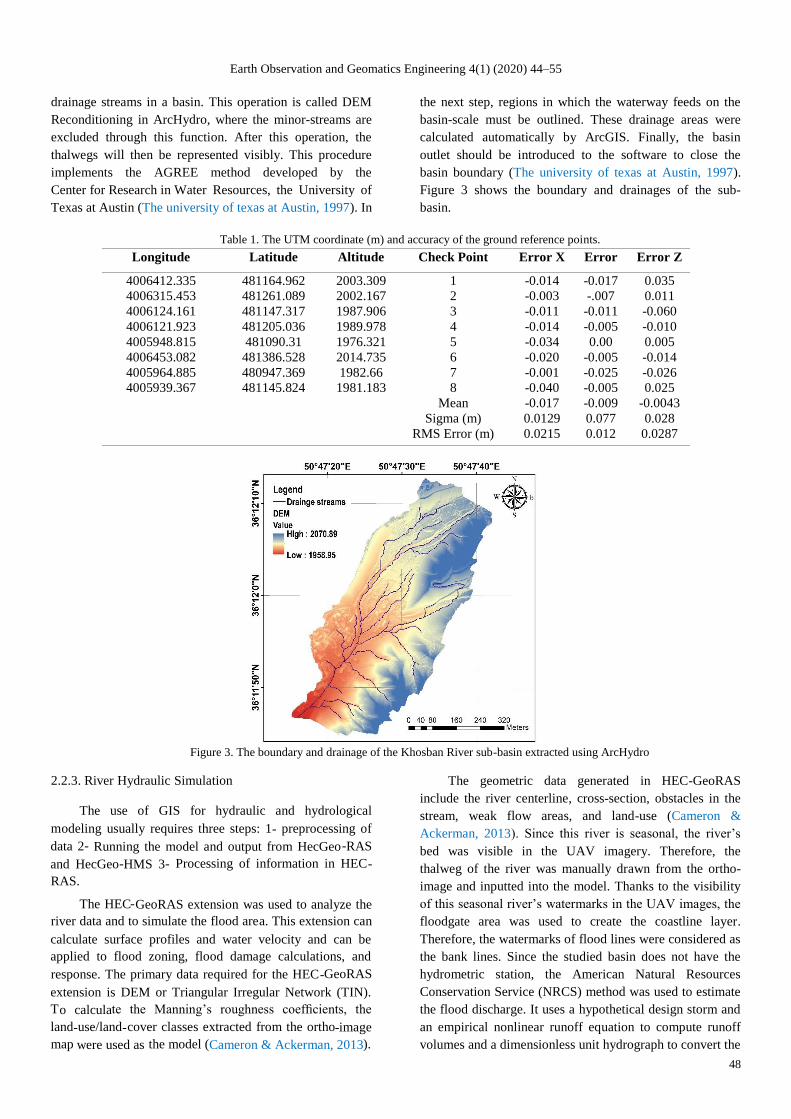
drainage streams in a basin. This operation is called DEM
Reconditioning in ArcHydro, where the minor-streams are
excluded through this function. After this operation, the
thalwegs will then be represented visibly. This procedure
implements the AGREE method developed by the
Center for Research in Water Resources, the University of
Texas at Austin (The university of texas at Austin, 1997). In
the next step, regions in which the waterway feeds on the
basin-scale must be outlined. These drainage areas were
calculated automatically by ArcGIS. Finally, the basin
outlet should be introduced to the software to close the
basin boundary (The university of texas at Austin, 1997).
Figure 3 shows the boundary and drainages of the sub-
basin.
Table 1. The UTM coordinate (m) and accuracy of the ground reference points.
Error Z Error Error X Check Point Altitude Latitude Longitude
0.035
0.011
-0.060
-0.010
0.005
-0.014
-0.026
0.025
-0.0043
0.028
0.0287
-0.017
-.007
-0.011
-0.005
0.00
-0.005
-0.025
-0.005
-0.009
0.077
0.012
-0.014
-0.003
-0.011
-0.014
-0.034
-0.020
-0.001
-0.040
-0.017
0.0129
0.0215
1
2
3
4
5
6
7
8
Mean
Sigma (m)
RMS Error (m)
2003.309
2002.167
1987.906
1989.978
1976.321
2014.735
1982.66
1981.183
481164.962
481261.089
481147.317
481205.036
481090.31
481386.528
480947.369
481145.824
4006412.335
4006315.453
4006124.161
4006121.923
4005948.815
4006453.082
4005964.885
4005939.367
Figure 3. The boundary and drainage of the Khosban River sub-basin extracted using ArcHydro
2.2.3. River Hydraulic Simulation
The use of GIS for hydraulic and hydrological
modeling usually requires three steps: 1- preprocessing of
data 2- Running the model and output from HecGeo-RAS
and HecGeo-HMS 3- Processing of information in HEC-
RAS.
The HEC-GeoRAS extension was used to analyze the
river data and to simulate the flood area. This extension can
calculate surface profiles and water velocity and can be
applied to flood zoning, flood damage calculations, and
response. The primary data required for the HEC-GeoRAS
extension is DEM or Triangular Irregular Network (TIN).
To calculate the Manning’s roughness coefficients, the
land-use/land-cover classes extracted from the ortho-image
map were used as the model (Cameron & Ackerman, 2013).
The geometric data generated in HEC-GeoRAS
include the river centerline, cross-section, obstacles in the
stream, weak flow areas, and land-use (Cameron &
Ackerman, 2013). Since this river is seasonal, the river’s
bed was visible in the UAV imagery. Therefore, the
thalweg of the river was manually drawn from the ortho-
image and inputted into the model. Thanks to the visibility
of this seasonal river’s watermarks in the UAV images, the
floodgate area was used to create the coastline layer.
Therefore, the watermarks of flood lines were considered as
the bank lines. Since the studied basin does not have the
hydrometric station, the American Natural Resources
Conservation Service (NRCS) method was used to estimate
the flood discharge. It uses a hypothetical design storm and
an empirical nonlinear runoff equation to compute runoff
volumes and a dimensionless unit hydrograph to convert the

Yavari et al, 2020
49
methodology ishydrographs. Therunoffvolumes into
particularly useful for comparing pre- and post-
development peak rates, volumes, and hydrographs. The
NRCS runoff equation’s critical component is the NRCS
curve number (CN), based on soil permeability, surface
cover, hydrologic condition, and antecedent moisture.
Watershed or drainage area time of concentration is the
critical component of the dimensionless unit hydrograph.
One of the advantages of using this research is using high-
resolution and high-accuracy UAV imagery-based DEM,
DSM, and ortho-mosaic products with a 5-centimetre GSD
and better than 5 cm of geo-referencing accuracy. In
addition to the bare ground’s elevation values, a DSM
contains other objects such as buildings, trees, and other
vegetation. As a result, DSM can be used as the basis for
reliable and accurate collecting of the river cross-sections
and the flood-level marks to compare with hydraulic
modeling. Such relevant information for small riverbeds
simulation is rare or very difficult to provide by the
operational satellite sensors due to low spatial resolution
(e.g., 5 to 15 meters).
The NRCS method is the most comprehensive model,
which uses rainfall statistics rather than flood hydrographs.
Since, in most cases, the meteorological stations’ network is
denser than the hydrometric stations, at least if there is no
flood data, the rainfall statistics will be available. In this
method, rainfall statistics used to get flood hydrographs
(Nasiri & Alipur, 2014). On the other hand, in the NRCS
synthetic unit hydrograph method, a maximum 24-hr
rainfall was used since most meteorological stations record
24-hr rainfall data (Alizadeh, 2011). The basin’s
concentration-time was 22.6 minutes using the Kirpich Eq.
(7) (Kamath et al., 2012; Salimi et al., 2017). Based on the
NRCS method, if the concentration-time is under 6 hours,
the design rainfall must be considered 6-hr rainfall. This
rainfall time was calculated using Eq. (1) (Alizadeh, 2011).
6,T
24,
1.48
TPP (1)
where P24,T and P6,T are the 24-hr and 6-hr rainfall with
T year return period, respectively.
flooddischarge ofmethod models theThe NRCS
widely used in hydrology, drainage, and surface water
collection. This method assumes that Eq. (2) exists between
runoff and water accumulation on the ground.
a d d
a
P I Q Q
S P I
(2)
Where P is the amount of precipitation, Ia is the initial
rainfall losses, including interception drain, depression
storage, and infiltration, S is the maximum or potential of
keeping moisture on the ground, and Qd is the runoff height
in the basin, all in centimetre. In Eq. (3), usually,
precipitation losses are estimated 10 to 30 percent of the
potential retention or about 0.1S to 0.3S, usually assumed to
be equal 0.2S. Eq. (3) was obtained from Eq. (2), usually
used by experts (Alizadeh, 2011).
20.2
0.8d
P SQ
P S
(3)
The value of S also depends on CN isvalueitsand,
according to Eq. (4) in the metric system.
2540
25.4CN
S
(4)
The geology map at the 1:250,000 scale and Landsat-8
were used to calculate CN. The NDVI values were classified
according to Table 3 into four categories; the values greater
than 0.65 represent forests, the values ranging from 0.57 to
0.65 rangelands, 0.40 to 0.57 farmlands, and those less than
0.40 show the surfaces without cover vegetation. Each class
was again subdivided into several sub-classes based on the
Fractional Vegetation Cover (FVC) index, according to Eq.
(6). When the FVC index is more significant than 0.75 is
considered a healthy condition if the index is between 0.5
and 0.75 as a suitable condition and if the index is less than
0.5 considered an unsatisfactory condition (Salimi Kouchi
et al., 2013). In the Taleghan dam basin, the soil type was
classified according to Table 2.
NIR REDNDVI
NIR RED
(5)
0
0
NDVI NDVIFVC
NDVI NDVI
(6)
Table 2. Hydrologic Group Soils of the Taleghan dam basin
Hydrologic Group of Soil Type of Soil
A
C
Inceptisols
Mollisols
D Rock Outcrops/Ent isols
In Eq. (5), NIR and RED are the near-infrared and red
band, respectively, equal to bands 5 and 4 of the Landsat-8
satellite. NDVI0 is also NDVI for bare soil, and NDVI∞ is the
NDVI index for vegetation that is considered the maximum
NDVI value (Salimi Kouchi et al., 2013). The basin curve
number was obtained based on NDVI and FVC and a
hydrologic group of the soil, according to Table 3.
One of the model’s critical parameters is the
Concentration Time (Tc) of the basin and is defined as the
maximum time that the water from the farthest point of the
basin has travelled its hydrological route to reach the outlet
point. The concentration-time was calculated using the
Kripich equation according to Eq. (7).
0.77
0.3850.0078C
LT
S� § � ·
� � ¨ � ¸� © � ¹
(7)

Earth Observation and Geomatics Engineering 4(1) (2020) 44–55
50
In the above equation, L is the most significant length
of the basin’s waterway in meters, and S is the mean slope
of the basin. The concentration-time of the basin was
acquired using Eq. (7), as 22.6 minutes. The flood
discharges of the selected return period: 25, 50, 100, and
200 years were estimated using the flood frequency
analysis
,
which acquired 24.44, 35.89, 49.82, and 66.49
cubic Syntheticrespectively.second,permeters
hydrographs of the flood were acquired based on 6-hr
rainfall, according to Figure 4. Flood inundation simulation
was performed using a steady flow with a peak flow
discharge of flood hydrograph and is shown in Figure 5.
Table 3. Basin Curve Number based on NDVI and FVC indexes (Fan et al., 2013)
Hydrologic Group Vegetation Vigor NDVI Vegetation
D C B A
83 77 66 45 Poor: V<50%
79 73 60 36 Fair: 50%<V<75% NDVI>0.65 Forest
77 70 55 30 Good: V>75%
86 82 73 57 Poor: V<50%
82 76 65 43 Fair: 50%<V<75% 0.57<NDVI<0.65 Grass and Bush
79 72 58 32 Good: V>75%
91 88 81 72 Poor: V<50%
89 85 78 67 Good: V>50% 0.4<NDVI<0.57 Farmland
86 82 74 59 NDVI<0.4 None-Vegetated
Figure 4. Synthetic hydrograph of floods with 25, 50, 100, and 200 years return period
0
10
20
30
40
50
60
70
0 5 10 15 20 25 30
Dis
char
ge(c
ms)
Time (hr)25 Year 50 Year 100 Year 200 Year

Yavari et al, 2020
51
(a) (b)
Figure 5. The flood inundation of 200 years of the Khosban River and the companion with the FLM (a), and a zoom on the residential area (b)
3. Results and Discussion
asources,common datainlimitationstheDue to
combination of the spatial data products based on
photogrammetric images of UAV, DEM, and the extracted
spatial features are used to detect different flood conditions.
Hydraulic modeling of the river surface profile is based on
a steady flow; this system can be used for all channels or
single branch rivers. This simulation can be done for the
and misubcritical, supercritical, Theflow regimes.xed
onethesolvingonis basedmethodcomputation -
wasThe energy lossdimensional energy equation.
andequation)Manningevaluated due to friction (the
expansion/contraction multiplied by the velocity head
change. The momentum equation is used for conditions
where the water velocity profile is changing rapidly. These
conditions include mixed flow regime
calculations (hydraulic jump), hydraulics of bridges, and
calculating the profile at the rivers’ intersection. The effect
of various obstacles such as bridges/culvert, dams,
overflow, and other structures may be considered in
calculating the flood zonation. A steady flow system is
designed for or application in flood plain management.
Also, there is the capability to evaluate water surface profile
changes due to repair canals and embankments (Brunner
2010 ).
The hydraulic modeling was performed for four
discharges that were acquired based on estimates of peak
flow. The free surface width of the stream in contact with
free air along the river is shown according to Figure 6.
The hydraulic depth is the ratio of the cross -section
area of the stream (A) to the free surface width (T),
calculated by Eq. (8). Figure 7 shows the hydraulic depth of
water in the Khosban River.
AHydraulic DepthT
� (8)
In this study, the created watermark flood was taken
from UAV and TIN’s ortho-mosaic image as observation
data compared with hydraulic modeled according to
different return period discharges. The processes illustrated
that the flood area extracted by the watermark in RGB
images, modeling based on 25, 50, 100, and 200 years
return period were 1.778, 1.195, 1.443, 1.643, and 1.890
acres, respectively. These areas, modeled by the HEC-RAS,
represent 33%, 19%, and 8% less difference compared to
the FLM for 25, 50, and 100 years return periods,
respectively. While for 200 years of the return period, this
difference was overestimated by more than 6% compared to
the FLM. Moreover, the maximum depth of flood in the
hydraulic modeling performed with four scenarios varies
between 2.33 and 2.83 meters.

Earth Observation and Geomatics Engineering 4(1) (2020) 44–55
52
Figure 6. The free surface width of floods along the Khosban River
Figure 7. Hydraulic depth of water (in meters) along the Khosban River
4. Conclusion
Small rivers with a width smaller than 100 meters
require land surveying or aerial images to delineate the
small rivers’ geometric parameters. The use of satellite
imagery due to the low spatial resolution cannot lead to
solid modeling. Consequently, the UAV imagery is
essential to observe and map the river’s topographic and
hydrological details.
This paper proposed a novel methodology for
floodplain inundation modeling based on a UAV system’s
high-resolution imagery. Several products, including points
cloud, DSM, DEM, and orthophoto maps, were extracted
using the Structure from the Motion technology and were
used for this modeling. In this study, high-resolution UAV
data collected from the Khosban Village near the Taleghan
Dam. The Khosban River is seasonal and was dry during
the image acquisition mission.
The flood zonation of the Khosban River is of high
importance due to the average annual precipitation of over
500 mm and the presence of springs and mountainous
peaks, and the flow of the river from the middle of the
village residential houses. Since basins do not have enough
statistical data, and there is no hydrometric station in the
study area, the use of logical methods, curve push, regional
analysis, or empirical relationships is inevitable. In this
theresearch, the basin curve number obtained using
Landsat- geologicUAV imagery, and8 satellite and the
maps using the NRCS method provided by NRCS.
0
5
10
15
20
25
30T
OP
WID
TH
SU
RF
AC
E (
ME
TE
R)
RIVER DISTANCE (METER)
25 year flood top Width surface 50 year flood top Width surface
100 year flood top Width surface 200 year flood top Width surface
0
0.2
0.4
0.6
0.8
1
1.2
HY
DR
AU
LIC
DE
PT
H (
ME
TE
R)
RIVER DISTANCE (METER)25 year Hydraulic Depth 50 year Hydraulic Depth
100 year Hydraulic Depth 200 year Hydraulic Depth

Yavari et al, 2020
53
In this project, the river’s cross-section was taken with
5 cm GSD, and hydrological characteristics and geometric
parameters were modeled. The flood simulation showed
that a part of the residential texture would be submerged
caused by flood, and there is a need to review and
implement river engineering measures to prevent a flood
from entering residential buildings. Also, since rivers’
banks are considered national territories and personal abuse
cause contravention of the river margins, flood inundation
can determine the river bank and prevent the riverside’s
illegal possession. The estimated flood area based on 6-hr
rainfall and synthetic hydrograph of floods with 25, 50,
100, and 200 years of return period were 1.195, 1.443,
1.643, and 1.890 square meters. As can be seen, the
hydraulic simulation of 200 years returns period of flood
has the most adjustments with flood areas of FLM.
Acknowledgments
The authors thank Mr. Mehdi Boroumand, Nama
Pardaz Rayaneh Company, and field crews for providing
eBee Plus SenseFly images of the Khosban River used in
this research.
References
N., Prathap, M.G., &Aishwaryalakshmi, V., Kumar,
B. (2017).Abinaya, forFlood inundation mapping
Sathanur Dam. CivilofInternational Journal
Engineering and Technology. 8, 1306-1311.
Alexakis, D.D, Grillakis, M.G., Koutroulis, A.G., Agapiou,
A., Themistocleous, K., Tsanis, I.K., & alis, A. (2014).
GIS and remote sensing techniques for the assessment of
land use change impact on flood hydrology: the case
study of Yialias basin in Cyprus. Natural Hazards and
Earth System Sciences. 14, 413-426.
Alizadeh, A. (2011). Principles of applied hydrology, Astan
Quds Razavi: Mashhad, Iran.
Azizian, A. (2018). Investigating the application of remote
sensing-based dams on for inundation mapping and
hydraulic modeling. Iran-Water Resources Research.14,
212-223.
Baggio, S., & Rouquette, M.L. (2006). The Social
Representation of the Flood: The Overlapping Influence
of Proximity to Risk and the Importance of the Stake.
Bulletin de psychologie, 1, 103-117.
ReynaOlesen, D.,F., Jakobsen, J.,Bandini, -Gutierrez,
J.A.,& Bauer-Gottwein, P. (2017). Measuring water
level in rivers and lakes from lightweight Unmanned
Aerial Vehicles. Journal of Hydrology. 548, 237-250.
Barasa, B.N., & Perera, E.D.P. (2018). Analysis of land use change impacts on flash flood occurrences in the Sosiani
River basin Kenya. International journal of river basin management. 16, 179-188.
Bernet, D.B., Zischg, A.P., Prasuhn, V., & Weingartner, R.
(2018). Modeling the extent of surface water floods in
rural areas: Lessons learned from the application of
various uncalibrated models. Environmental modelling
& software. 109, 134-151.
Bezak, N., Šraj, M., Rusjan, S., & Mikoš, M. (2018).
Impact of the Rainfall Duration and Temporal Rainfall
Distribution Defined Using the Huff Curves on the
Hydraulic Flood Modelling Results. Geosciences. 8, 69.
Brunner, G.W. (2010). HEC-RAS River Analysis System
User’s Manual Version 4.1. US Army Corps of
Engineers Institute for Water Resources Hydrologic
Engineering Center (HEC), California, USA.
Cameron, T., & Ackerman, PE. (2013). HEC-GeoRAS GIS
Tools for Support of HEC-RAS using ArcGIS.
Hydrologic Engineering Center: extraído de, USA.
Casado, M.R., Gonzalez, R.B., Kriechbaumer, T., & Veal,
A. (2015). Automated identification of river
hydromorphological features using UAV high resolution
aerial imagery. Sensors. 15, 27969-27989.
Cook, A., & Merwade, V. (2009). Effect of topographic
data, geometric configuration and modeling approach on
flood inundation mapping. Journal of Hydrology, 377,
131-142.
UAVLightweight(2017).S., & Roberts, K.Coveney,
orthoimagery foranddigital elevation models
evaluationdata accuracyapplications:environmental
and potential for river flood risk modelling.
International journal of remote sensing. 38, 3159-3180.
Das, S. (2019). Geospatial mapping of flood susceptibility
and hydro-geomorphic response to the floods in Ulhas
basin, India. Remote Sensing Applications: Society and
Environment.14, 60-74.
Diakakis, M., Andreadakis, E., Nikolopoulos, E.I., Spyrou,
N.I., Gogou, M.E., Deligiannakis, G., & Tsaprouni, K.
(2019). An integrated approach of ground and aerial
observations in flash flood disaster investigations. The
case of the 2017 Mandra flash flood in Greece.
International Journal of Disaster Risk Reduction. 33,
290-309.
Dietrich, J.T. (2016). Riverscape mapping with helicopter-
based Structure-from-Motion photogrammetry.
Geomorphology. 252, 144-157.
Domeneghetti, A., Schumann, G.J.P., & Tarpanelli, A.
(2019). Preface: Remote Sensing for Flood Mapping and
Monitoring of Flood Dynamics. Remote Sensing, 11,
943.
Fan, F., Deng, Y., Hu, X., & Weng, Q. (2013). Estimating composite curve number using an improved SCS-CN
method with remotely sensed variables in Guangzhou,
China. Remote Sensing. 5, 1425-143.

Earth Observation and Geomatics Engineering 4(1) (2020) 44–55
54
Feng, Q., Liu, J., & Gong, J. (2015). Urban flood mapping
based on unmanned aerial vehicle remote sensing and
random forest classifier—A case of Yuyao, China. Water.
7, 1437-1455.
Flener, C., Vaaja, M., Jaakkola, A., Krooks, A., Kaartinen,
H., Kukko, A., & Alho, P. (2013). Seamless mapping of
river channels at high resolution using mobile LiDAR
and UAV-photography. Remote Sensing. 5, 6382-6407.
Geerling, G.W., Vreeken‐ Buijs, M.J., Jesse, P., Ragas,
A.M.J., & Smits, A.J.M. (2009). Mapping river
floodplain ecotopes by segmentation of spectral (CASI)
and structural (LiDAR) remote sensing data. River
research and applications. 25, 795-813.
Golshan, M., Jahanshahi, A., & Afzali, A. (2016). Flood
hazard zoning using HEC-RAS in GIS environment and
impact of Manning roughness coefficient changes on
flood zones in Semi-arid climate. Desert. 21, 24-34.
Hashemi-Beni, L., Jones, J., Thompson, G., Johnson, C., &
Gebrehiwot, A. (2018). Challenges and opportunities for
UAV-based digital elevation model generation for
flood-risk management: A case of princeville, north
carolina. Sensors. 18, 3843.
spatialHorritt, M.S., & Bates, P.D. (2001). Effects of
resolution on a raster- flow.floodofbased model
Journal of Hydrology. 253, 239-249.
Kamath, A.M., Varun, V.M., Dwarakish, G.S., Kavyashree,
B., & Shwetha, H.R. (2012). Soil loss estimation
through MUSLE using Kirpich and Williams times of
concentration using RS and GIS techniques: a case
study. ISH Journal of Hydraulic Engineering, 18, 1-10.
Kirk, J. A. (2013). Methodology for Developing GIS-based
Maps forInundationFloodRiverineProbabilistic
Tonawanda Creek in Western New York. Doctoral
dissertation degree, Kent State University.
Langhammer, J., & Vackova, T. (2018). Detection and
Mapping of the Geomorphic Effects of Flooding Using
UAV Photogrammetry. Pure and Applied Geophysics.
175, 3223-3245.
Lee, I., Kang, J., & Seo, G. (2013). Applicability analysis of
ultra-light UAV for flooding site survey in South Korea.
Remote Sensing and Spatial Information Sciences. 40,
185-189.
Li, J., Li, J., & Yao, K. (2018). Inundation Analysis of Reservoir Flood Based on Computer-Aided Design
(CAD) and Digital Elevation Model (DEM). Water.10, 530.
Merwade, V., Olivera, F., Arabi, M., & Edleman, S. (2008).
Uncertainty in flood inundation mapping: current issues and future directions. Journal of Hydrologic
Engineering. 13(7): 608-620.
Merwade, V. (2012). Stream network and watershed
delineation using spatial analyst hydrology tools. School
of Civil Engineering, Purdue University.
Mourato, S., Fernandez, P., Pereira, L., & Moreira, M.
(2017). Improving a DSM Obtained by Unmanned
Aerial Vehicles for Flood Modelling. In IOP Conference
Series: Earth and Environmental Science.
Nasiri, A., & Alipur, H. (2014). Determination the Curve
Number Catchment by Using GIS and Remote Sensing.
Int. Journal of Environmental, Chemical, Ecological,
Geological and Geophysical Engineering. 8, 342-345.
onlineAvailableNama Pardaz Rayaneh. URL(2017):
www.nprco.com
Nguyen, V-N., Yariyan, P., Amiri, M., Dang Tran, A.,
Pham, T.D., Do, MP., Thi Ngo, P.T., Nhu, V-H., Quoc
Long, N., & Tien Bui, D. (2020). A New Modeling
Approach for Spatial Prediction of Flash Flood with
Biogeography Optimized CHAID Tree Ensemble and
Remote Sensing Data. Remote Sensing. 12,1373.
Niedzielski, T., Witek, M., & Spallek, W. (2016).
Observing river stages using unmanned aerial vehicles.
Hydrology and Earth System Sciences. 20, 3193-3205.
Perks, M.T., Russell, A.J., & Large, A.R. (2016). Advances
in flash flood monitoring using unmanned aerial
vehicles (UAVs). Hydrology and Earth System Sciences.
20, 4005-4015.
Popescu, D., Ichim, L., & Stoican, F. (2017). Unmanned aerial vehicle systems for remote estimation of flooded
areas based on complex image processing. Sensors. 17, 446.
Rahman, M.M., & Ali, M.M. (2016). Flood Inundation
Mapping of Floodplain of the Jamuna River using HEC-
RAS and HEC-GeoRAS. Presidency. 3, 24-32.
Ridolfi, E., Rianna, M., Trani, G., Alfonso, L., Di
Baldassarre, G., Napolitano, F., & Russo, F. (2016). A new methodology to define homogeneous regions
through an entropy-based clustering method. Advances in water resources. 96, 237-250.
Rong, Y., Zhang, T., Zheng, Y., Hu, C., Peng, L., & Feng, P. (2019). Three-dimensional urban flood inundation
simulation based on digital aerial photogrammetry.
Journal of Hydrology, 124308.
Salimi, ET., Nohegar, A., Malekian, A., Hoseini, M., &
Holisaz, A. (2017). Estimating time of concentration in
large watersheds. Paddy and water environment. 15,
123-132.
Salimi Kouchi, H., Sahebi, M.R., Abkar, AA, & Valadan
Zoej, M.J. (2013). Fractional vegetation cover
estimation in urban environments. ISPRS-International
Archives of the Photogrammetry, Remote Sensing and Spatial Information Sciences. 3, 357-360.

Yavari et al, 2020
55
Schumann, G.J. P., Muhlhausen, J., & Andreadis, K.M.
(2019). Rapid mapping of small-scale river-floodplain
environments using UAV SfM supports classical theory.
Remote Sensing. 11, 982.
Şerban, G., Rus, I., Vele, D., Breţcan, P., Alexe, M., &
Petrea, D. (2016). Flood-prone area delimitation using
UAV technology, in the areas hard-to-reach for classic
aircrafts: case study in the north-east of Apuseni
Mountains, Transylvania. Natural Hazards. 82, 1817-
1832.
URL(2020):onlineSensefly Company. Available
https://www.sensefly.com/
Sivapalan, M., Takeuchi, K., Franks, S.W., Gupta, V.K.,
Karambiri, H., Lakshmi, V., & Oki, T. (2003). IAHS
Decade on Predictions in Ungauged Basins (PUB),
2003–201 for thefuturean excitingShaping2:
sciences.hydrological journalsciencesHydrological .
48, 857-880.
Sumalan, A. L., Popescu, D., & Ichim, L. (2017). Flooded
and vegetation areas detection from UAV images using
multiple descriptors. 21st International Conference on
System Theory, Control and Computing (ICSTCC). 447-
452.
Tauro, F., Porfiri, M., & Grimaldi, S. (2014). Orienting the
camera and firing lasers to enhance large scale particle
image velocimetry for streamflow monitoring. Water
Resources Research. 50, 7470-7483.
The university of texas at Austin (Civil, Architectural and
Environmental Engineering). Available online: (1997).
URL
http://www.ce.utexas.edu/prof/maidment/gishydro/ferdi/
research/agree/agree.html
Tokarczyk, P., Leitão, J.P., Rieckermann, J., & Blumensaat,
F. (2015). High-quality observation of surface
imperviousness for urban runoff modelling using UAV
imagery. Hydrology and Earth System Sciences. 19,
4215-4228.
& Kawahara, Y. (2016). UAVWatanabe, Y.,
photogrammetry for monitoring changes in river
topography and vegetation. Procedia Engineering. 154,
317-325.
Weng, Q. (2012). Remote sensing of impervious surfaces in
the urban areas: Requirements, methods and trends.
Remote sensing of Environment. 117, 34-49.
Yalcin, E. (2018). Generating of high-resolution digital
surface models for urban flood modeling using UAV
imagery. WIT Transactions on Ecology and the
Environment. 215, 357-366.
Yahya, BM., Devi, N.M., & Umrikar, B. (2010). Flood
hazard mapping by integrated GIS-SCS model.
International Journal of Geomatics and Geosciences. 1,
489.
Zazo, S., Molina, J.L., & Rodríguez-Gonzálvez, P. (2015).
Analysis of flood modeling through innovative geomatic methods. Journal of Hydrology. 524, 522-537.
Zeleňáková, M., Fijko, R., Labant, S., Weiss, E., Markovič, G., & Weiss, R. (2019). Flood risk modelling of the Slatvinec stream in Kružlov village, Slovakia. Journal
of cleaner production. 212, 109-118.
I
n
t
h
i
s
p
r
o
j
e
c
t
,
t
h
e
r
i
v
e
r
’
s
c
r
o
s
s
-
s
e
c
t
i
o
n
w
a
s