zao unicredit bank · zao unicredit bank consolidated financial statements consolidated statement...
TRANSCRIPT

Audited by KPMG. See separate report.
ZAO UniCredit Bank Consolidated Financial Statements Year ended 31 December 2012

ZAO UniCredit Bank Consolidated Financial Statements
CONTENTS
INDEPENDENT AUDITORS’ REPORT
Consolidated Statement of Financial Position ............................................................................................................................. 1 Consolidated Statement of Comprehensive Income .................................................................................................................. 2 Consolidated Statement of Changes in Equity ............................................................................................................................. 3 Consolidated Statement of Cash Flows
NOTES TO THE CONSOLIDATED FINANCIAL STATEMENTS
......................................................................................................................................... 4
1. Principal activities ................................................................................................................................................................. 52. Basis of preparation ............................................................................................................................................................. 53. Summary of accounting policies ........................................................................................................................................ 64. Significant accounting judgements and estimates ......................................................................................................... 185. Operating segments ........................................................................................................................................................... 186. Cash and cash balances ..................................................................................................................................................... 207. Trading securities ................................................................................................................................................................ 218. Amounts due from credit institutions ............................................................................................................................ 219. Derivative financial instruments ...................................................................................................................................... 2210. Loans to customers ............................................................................................................................................................ 2311. Investment securities ......................................................................................................................................................... 3112. Transfers of financial assets .............................................................................................................................................. 3213. Fixed assets .......................................................................................................................................................................... 3314. Intangible assets .................................................................................................................................................................. 3415. Taxation ............................................................................................................................................................................... 3416. Other assets and liabilities ................................................................................................................................................. 3617. Amounts due to credit institutions .................................................................................................................................. 3618. Amounts due to customers ............................................................................................................................................... 3719. Debt securities issued ........................................................................................................................................................ 3720. Subordinated debt .............................................................................................................................................................. 3821. Shareholder’s equity ........................................................................................................................................................... 3822. Commitments and contingencies .................................................................................................................................... 3823. Gains on financial assets and liabilities held for trading .............................................................................................. 3924. Fee and commission income ............................................................................................................................................ 3925. Personnel and other administrative expenses ................................................................................................................ 4026. Risk management ............................................................................................................................................................... 4027. Fair values of financial instruments ................................................................................................................................ 5428. Related party disclosures ................................................................................................................................................... 5529. Capital ................................................................................................................................................................................... 57


ZAO UniCredit Bank Consolidated Financial Statements CONSOLIDATED STATEMENT OF COMPREHENSIVE INCOME
For the year ended 31 December 2012
(Thousands of Russian Roubles)
The accompanying notes on pages 5 to 58 are an integral part of these consolidated financial statements. 2
Notes 2012 2011 Interest income
Loans to customers 40 274 293 32 897 534 Amounts due from credit institutions 4 058 869 3 343 096 Trading and investment securities 3 262 042 2 187 918 Other 2 996 310 196 931 50 591 514 38 625 479
Interest expense Amounts due to customers (15 835 206) (10 969 271) Amounts due to credit institutions (8 668 563) (4 632 916) Debt securities issued (2 830 163) (1 251 615) (27 333 932) (16 853 802)
Net interest income 23 257 582 21 771 677
Fee and commission income 24 5 468 307 4 642 161 Fee and commission expense (745 026) (661 695) Net fee and commission income 4 723 281 3 980 466
Dividend income 59 478 23 134 Gains on financial assets and liabilities held for trading 23 4 797 090 3 576 862 Fair value adjustments in portfolio hedge accounting (406) 339 Gains on disposal of:
- loans 134 227 184 793 - available-for-sale financial assets 3 154 569 3 248 218
OPERATING INCOME 36 125 821 32 785 489
Impairment on loans 10 (2 783 324) (2 661 838)
NET INCOME FROM FINANCIAL ACTIVITIES 33 342 497 30 123 651
Personnel expenses 25 (5 949 934) (5 248 444) Other administrative expenses 25 (3 964 239) (3 979 686) Depreciation of fixed assets 13 (711 695) (814 281) Amortization of intangible assets 14 (452 845) (348 408) Other provisions (5 196) (38 171) Net other operating (expense) income (58 188) 140 367 Operating costs (11 142 097) (10 288 623)
Share of gains of associate 50 403 35 978 Losses on disposal of fixed assets (8 157) (4 735) PROFIT BEFORE INCOME TAX EXPENSE 22 242 646 19 866 271
Income tax expense 15 (4 764 462) (4 078 434)
PROFIT FOR THE YEAR 17 478 184 15 787 837
Other comprehensive income Cash flow hedge reserve - effective portion of changes in fair value 15 341 787 (626 522) Revaluation reserve for available-for-sale securities - net change 15 (2 874 979) 7 646 707
Other comprehensive (loss) income for the period, net of tax (2 533 192) 7 020 185
TOTAL COMPREHENSIVE INCOME FOR THE YEAR 14 944 992 22 808 022

ZAO UniCredit Bank Consolidated Financial Statements CONSOLIDATED STATEMENT OF CHANGES IN EQUITY
For the year ended 31 December 2012
(Thousands of Russian Roubles)
The accompanying notes on pages 5 to 58 are an integral part of these consolidated financial statements. 3
Share capital
Share premium
Cash flow hedge reserve
Revaluation reserve for available-for-sale
securities
Retained earnings
Total equity
1 January 2011 28 613 826 437 281 (675 847) (50 339) 41 432 382 69 757 303 Total comprehensive income Profit for the year – – – – 15 787 837 15 787 837 Other comprehensive income
Change in cash flow hedge reserve, net of tax –
–
(626 522)
–
–
(626 522)
Net change in revaluation reserve for available-for-sale assets, net of tax –
–
–
7 646 707
–
7 646 707 Total other comprehensive income –
–
(626 522)
7 646 707
–
7 020 185
Total comprehensive income – – (626 522) 7 646 707 15 787 837 22 808 022 Transactions with owner, recorded directly in equity
Increase of share capital (Note 21) 3 173 985
–
–
–
–
3 173 985
Dividends paid on ordinary shares –
–
–
–
(7 409 580)
(7 409 580)
Purchase of subsidiary under common control –
–
–
–
(21 586)
(21 586)
Total transactions with owners 3 173 985
–
–
–
(7 431 166)
(4 257 181)
31 December 2011 31 787 811 437 281 (1 302 369) 7 596 368 49 789 053 88 308 144 1 January 2012 31 787 811 437 281 (1 302 369) 7 596 368 49 789 053 88 308 144 Total comprehensive income Profit for the year – – – – 17 478 184 17 478 184 Other comprehensive income
Change in cash flow hedge reserve, net of tax –
–
341 787
–
–
341 787
Net change in revaluation reserve for available-for-sale assets, net of tax –
–
–
(2 874 979)
–
(2 874 979) Total other comprehensive income –
–
341 787
(2 874 979)
–
(2 533 192)
Total comprehensive income – – 341 787 (2 874 979) 17 478 184 14 944 992 Transactions with owner, recorded directly in equity
Increase of share capital (Note 21) 9 999 995
–
–
–
–
9 999 995
Total transactions with owners 9 999 995
–
–
–
–
9 999 995
31 December 2012 41 787 806 437 281 (960 582) 4 721 389 67 267 237 113 253 131

ZAO UniCredit Bank Consolidated Financial Statements CONSOLIDATED STATEMENT OF CASH FLOWS
For the year ended 31 December 2012
(Thousands of Russian Roubles)
The accompanying notes on pages 5 to 58 are an integral part of these consolidated financial statements. 4
Notes 2012 2011 Cash flows from operating activities Interest received 46 578 568 39 129 896 Interest paid (20 283 662) (12 437 908) Fees and commissions received 5 468 307 4 642 161 Fees and commissions paid (745 026) (661 695) Net receipts from trading securities 145 300 32 405 Net payments from derivatives and dealing in foreign currencies (1 843 108) (4 122 008) Other income received 3 253 687 2 007 376 Salaries and benefits paid (4 985 260) (4 068 599) Other operating expenses paid (3 358 392) (2 302 750) Cash flows from operating activities before changes in
operating assets and liabilities 24 230 414
22 218 878 Net decrease (increase) in operating assets Obligatory reserve with the CBR 2 193 874 (4 913 826) Trading securities (2 437 411) 32 600 522 Amounts due from credit institutions (57 700 192) (99 263 908) Loans to customers (44 798 399) (69 065 455) Other assets (176 519) (203 334) Net increase (decrease) in operating liabilities Amounts due to credit institutions 32 707 076 19 584 530 Amounts due to customers 49 092 142 122 585 626 Promissory notes 63 777 289 961 Other liabilities (668 614) 732 145 Net cash flows from operating activities before income tax 2 506 148 24 565 139 Income tax paid (3 748 860) (2 912 008) Net cash (used in) from operating activities (1 242 712) 21 653 131 Cash flows from investing activities Dividends received 59 478 23 134 Net purchase of available-for-sale securities (20 316 233) (30 055 821) Proceeds from redemption of held-to-maturity securities – 265 000 Proceeds from sale of fixed and intangible assets 9 538 10 435 Purchase of fixed and intangible assets (1 462 214) (3 536 053) Net cash used in investing activities (21 709 431) (33 293 305) Cash flows from financing activities Purchase of subsidiary under common control – (846 000) Proceeds from issuance of bonds 19 20 000 000 10 000 000 Redemption of bonds issued (5 479 788) – Redemption of subordinated debt (1 958 127) (58 707) Increase of share capital 21 9 999 995 3 173 985 Dividends paid – (7 409 580) Net cash from financing activities 22 562 080 4 859 698 Effect of exchange rates changes on cash and cash balances (81 822) 65 831 Net decrease in cash and cash balances (471 885) (6 714 645) Cash and cash balances, beginning 24 491 991 31 206 636 Cash and cash balances, ending 6 24 020 106 24 491 991

ZAO UniCredit Bank Notes to the Consolidated Financial Statements
(Thousands of Russian Roubles)
5
1. Principal activities
These consolidated financial statements include the financial statements of ZAO UniCredit Bank (hereinafter – the “Bank”), its subsidiary and associate. ZAO UniCredit Bank, its subsidiary and associate are hereinafter collectively referred to as the “Group”. The Bank (the former International Moscow Bank) was established as a closed joint stock company under the laws of the Russian Federation in 1989. The Bank operates under General Banking License No. 1 reissued by the Central Bank of Russia (hereinafter – the “CBR”) on 23 March 2012 as well as the CBR license for operations with precious metals issued on 20 December 2007. The Bank also possesses licenses for securities transactions and custody services from the Federal Service for the Securities Market issued on 25 April 2003, the license to act as an exchange broker on transactions with futures and options issued on 27 May 2008 and Russian Federal Customs Service permission to act as a guarantor in relation to customs authorities issued on 1 October 2010. The Bank is a member of the state deposit insurance system in the Russian Federation. The Bank’s registered legal address is 9, Prechistenskaya Embankment, Moscow, Russian Federation, 119034. As at 31 December 2012 the Bank has 13 branches and 13 representative offices throughout the Russian Federation and one representative office in the Republic of Belarus. As at 31 December 2012 the Group comprises the Bank, the leading operating entity of the Group, CJSC Bank Sibir and LLC UniCredit Leasing Company, a leasing company. The primary activities of the Group are deposit taking, lending, providing payments and settlement services, transactions with foreign currencies and securities and providing finance leases. As at 31 December 2012 the sole shareholder of the Group is UniCredit Bank Austria AG. UniCredit Bank Austria AG, a member of UniCredit Group, is responsible for the commercial banking in Central and Eastern Europe within the UniCredit Group.
2. Basis of preparation
Statement of compliance
These consolidated financial statements are prepared in accordance with International Financial Reporting Standards (hereinafter - “IFRS”).
Basis of measurement
These consolidated financial statements are prepared on the historical cost basis except that financial instruments held for trading, available-for-sale assets and derivative financial instruments are stated at fair value.
Presentation currency
These consolidated financial statements are presented in Russian Roubles (“RUB”). Amounts in Russian Roubles are rounded to the nearest thousand.

ZAO UniCredit Bank Notes to the Consolidated Financial Statements
(Thousands of Russian Roubles)
6
3. Summary of accounting policies
The following significant accounting policies are applied in the preparation of the consolidated financial statements.
Principles of consolidation
Subsidiaries are those enterprises controlled by the Group. Control exists when the Group has the power, directly or indirectly, to govern the financial and operating policies of an enterprise so as to obtain benefits from its activities. The control is normally evidenced when the Group owns, either directly or indirectly, more than 50% of voting rights of a company’s share capital and is able to govern financial and operating policies of an enterprise. The financial statements of subsidiaries are included in the consolidated financial statements from the date that control effectively commences until the date that control effectively ceases.
Associates are those enterprises in which the Bank has significant influence, but not control, over the financial and operating policies. The significant influence is normally evidenced when the Group owns, either directly or indirectly, between 20% and 50%. The consolidated financial statements include the Bank’s share of the total recognised gains and losses of associates on an equity accounted basis, from the date that significant influence effectively commences until the date that significant influence effectively ceases. When the Bank’s share of losses exceeds the Bank’s interest in the associate, that interest is reduced to nil and recognition of further losses is discontinued except to the extent that the Bank has incurred obligations in respect of the associate. Intra-group balances and transactions, and any unrealised gains arising from intra-Group transactions, are eliminated in preparing the consolidated financial statements. Unrealised gains resulting from transactions with associates are eliminated against the investment in the associate. Unrealised losses are eliminated in the same way as unrealised gains except that they are only eliminated to the extent that there is no evidence of impairment.
Where necessary, accounting policies of subsidiary and associate are changed to conform with the accounting policies adopted by the Group.
The consolidated financial statements include the following subsidiary and associate:
Entities Ownership, %
2012 2011 Country Industry CJSC Bank Sibir 100% 100% Russia Finance LLC UniCredit Leasing Company 40% 40% Russia Finance
Financial assets
Initial recognition
Financial assets in the scope of International Accounting Standard 39 Financial Instruments: Recognition and Measurement are classified as either financial assets at fair value through profit or loss, loans and receivables, held-to-maturity investments, or available-for-sale financial assets, as appropriate. When financial assets are recognised initially, they are measured at fair value, plus, in the case of financial assets not at fair value through profit or loss, directly attributable transaction costs. The Group determines the classification of its financial assets upon initial recognition. Derivative financial instruments and financial instruments designated as at fair value through profit or loss upon initial recognition are not reclassified out of at fair value through profit or loss category. Financial assets that would have met the definition of loan and receivables may be reclassified out of the fair value through profit or loss or available-for-sale category if the entity has an intention and ability to hold it for the foreseeble future or until maturity. Other financial instruments may be reclassified out of fair value through profit or loss category only in rare circumstances. Rare circumstances arise from a single event that is unusual and highly unlikely to recur in the near term.
The Group recognises financial assets and liabilities on its consolidated statement of financial position when it becomes a party to the contractual provisions of the instrument. All regular way purchases of financial assets and liabilities are recognised at the settlement date.

ZAO UniCredit Bank Notes to the Consolidated Financial Statements
(Thousands of Russian Roubles)
7
3. Summary of accounting policies (continued)
Financial assets (continued)
Financial instruments at fair value through profit or loss
Financial instruments at fair value through profit or loss are financial assets or liabilities that are:
- acquired or incurred principally for the purpose of selling or repurchasing in the near term; - part of a portfolio of identified financial instruments that are managed together and for which there is evidence of a recent actual pattern of short-term profit-taking; - derivative financial instruments (except for derivative financial instruments that are designated and effective hedging instruments); or, - upon initial recognition, designated by the Group as at fair value through profit or loss.
The Group designates financial assets and liabilities at fair value through profit or loss where either:
- the assets or liabilities are managed and evaluated on a fair value basis; - the designation eliminates or significantly reduces an accounting mismatch which would otherwise arise; or - the asset or liability contains an embedded derivative that significantly modifies the cash flows that would otherwise be required under the contract.
Gains or losses on financial assets held for trading are recognised in profit or loss.
Held-to-maturity investments
Non-derivative financial assets with fixed or determinable payments and fixed maturity are classified as held-to-maturity when the Group has the positive intention and ability to hold them to maturity other than those that:
- the Group upon initial recognition designates as at fair value through profit or loss; - the Group designates as available-for-sale; or, - meet the definition of loans and receivables.
Held-to-maturity investments are subsequently measured at amortised cost. Gains and losses are recognised in profit or loss when the investments are impaired, as well as through the amortisation process.
Loans and receivables
Loans and receivables are non-derivative financial assets with fixed or determinable payments that are not quoted in an active market, other than those that the Group:
- intends to sell immediately or in the near term; - upon initial recognition designates as at fair value through profit or loss; - upon initial recognition designates as available-for-sale; or, - may not recover substantially all of its initial investment, other than because of credit deterioration.
Such assets are carried at amortised cost using the effective interest method. Gains and losses are recognised in profit or loss when the loans and receivables are derecognised or impaired, as well as through the amortisation process.
Available-for-sale financial assets
Available-for-sale financial assets are those non-derivative financial assets that are designated as available-for-sale or are not classified in any of the three preceding categories. After initial recognition available-for-sale financial assets are measured at fair value with gains or losses being recognised as other comprehensive income in equity until the investment is derecognised or until the investment is determined to be impaired at which time the cumulative gain or loss previously reported in equity is included in profit or loss. Interest income calculated using the effective interest method is recognised in profit or loss.
Available-for-sale assets are subsequently measured at fair value. Non-marketable equity instruments, for which it is impracticable to determine fair value, are stated at cost.

ZAO UniCredit Bank Notes to the Consolidated Financial Statements
(Thousands of Russian Roubles)
8
3. Summary of accounting policies (continued)
Financial assets (continued)
Determination of fair value
The fair value for financial instruments traded in an active market at the reporting date is based on their quoted market price or dealer price quotations (bid price for long positions and ask price for short positions), without any deduction for transaction costs. If a quoted market price is not available, the fair value of the instrument is estimated using valuation techniques with a maximum use of market inputs. Such valuation techniques include reference to recent arm’s length market transactions, current market prices of substantially similar instruments, discounted cash flow and option pricing models and other techniques commonly used by market participants to price the instrument.
Where discounted cash flow techniques are used, estimated future cash flows are based on management’s best estimates and the discount rate is a market related rate at the reporting date for an instrument with similar terms and conditions. Where pricing models are used, inputs are based on market related measures at the reporting date.
The fair value of derivatives that are not exchange-traded is estimated at the amount that the Group would receive or pay to terminate the contract at the reporting date taking into account current market conditions and the current creditworthiness of the counterparties.
Offsetting
Financial assets and liabilities are offset and the net amount is reported in the consolidated statement of financial position when there is a legally enforceable right to set off the recognised amounts and there is an intention to settle on a net basis, or to realise the asset and settle the liability simultaneously.
Cash and cash balances
The Group considers cash and nostro accounts with the CBR to be cash and cash balances. The obligatory reserve deposit with the CBR is not considered to be in this category due to restrictions on its availability.
Derivative financial instruments
In the normal course of business, the Group enters into various derivative financial instruments including futures, forwards, foreign exchange and interest rate swaps. Such financial instruments are held for trading and are recorded at fair value. The fair values are estimated based on quoted market prices or pricing models that take into account the current market and contractual prices of the underlying instruments and other factors. Derivatives are carried as assets when their fair value is positive and as liabilities when it is negative. Gains and losses resulting from these instruments, except for derivatives designated for hedging, are included in profit or loss as gains or losses on financial assets and liabilities held for trading.
Hedge accounting
In hedge accounting, the Group distinguishes between cash flow hedges and fair value hedges. To qualify for hedge accounting in accordance with IAS 39, hedges must be highly effective. Derivatives used for hedging purposes are measured at fair value in the consolidated statement of financial position.
At inception of the hedge relationship, the Group formally documents the relationship between the hedged item and the hedging instrument, including the nature of the risk, the objective and strategy for undertaking the hedge and the method that will be used to assess the effectiveness of the hedging relationship.
Also at the inception of the hedge relationship, a formal assessment is undertaken to ensure the hedging instrument is expected to be highly effective in offsetting the designated risk in the hedged item. Hedges are formally assessed for effectiveness on monthly basis. A hedge is regarded as highly effective if the changes in the fair value of cash flows attributable to the hedged risk are expected to offset in a range of 80% to 125% during the hedging period.
Where a derivative is designated as a hedge of the variability in cash flows attributable to a particular risk associated with a recognised asset or liability or a highly probable forecast transaction that could affect profit or loss, the effective portion of changes in the fair value of the derivative is recognised as other comprehensive income in equity. The amount recognised in equity is removed and included in profit or loss in the same period as the hedged cash flows affect profit or loss. Any ineffective portion of changes in the fair value of the derivative is recognised immediately in profit or loss.

ZAO UniCredit Bank Notes to the Consolidated Financial Statements
(Thousands of Russian Roubles)
9
3. Summary of accounting policies (continued)
Hedge accounting (continued)
If the derivative expires or is sold, terminated, or exercised, or no longer meets the criteria for cash flow hedge accounting, or the designation is revoked, hedge accounting is discontinued and the amount recognised in equity remains in equity until the forecast transaction affects profit or loss. If the forecast transaction is no longer expected to occur, hedge accounting is discontinued and the balance in equity is recognised immediately in profit or loss.
Fair value hedge is defined as a hedge of the exposure to changes in fair value of a recognised asset or liability that is attributable to a particular risk and could affect profit or loss. In a fair value hedge assets or liabilities are hedged against future fair value changes, if those changes affect the Group`s results and are caused by a determinable risk. The hedging instrument is stated at its fair value, and any gains or losses on the hedging instrument are recognised in profit or loss as gains or losses on financial assets and liabilities held for trading. Gains and losses which are attributable to the hedged risk adjust the carrying value of the hedged item. Changes in the fair value of portfolio hedged items are presented separately in the consolidated statement of financial position and recognized in the consolidated statement of comprehensive income as gains or losses on financial assets and liabilities held for trading.
Repurchase and reverse repurchase agreements and securities lending
Repurchase and reverse repurchase agreements are utilized by the Group as an element of its treasury management and trading business. These agreements are treated as secured financing transactions. Securities sold under repurchase agreements are retained in the consolidated statement of financial position and, in case the transferee has the right by contract or custom to sell or repledge them, reclassified as securities pledged under repurchase agreements. The corresponding liability is presented within amounts due to credit institutions or customers. Securities purchased under agreements to resell (“reverse repo”) are recorded as amounts due from credit institutions or loans to customers, as appropriate. The difference between sale and repurchase price is treated as interest and accrued over the life of repurchase agreements using the effective interest method.
Securities lent to counterparties are retained in the consolidated statement of financial position. Securities borrowed are not recorded in the consolidated statement of financial position, unless they are sold to third parties, in which case the purchase and sale are recorded within net gains or losses from trading securities in profit or loss. The obligation to return them is recorded at fair value as a trading liability.
Securities purchased under agreements to resell (“reverse repo”) and then sold under repurchase agreements are not recorded in the consolidated statement of financial position.
Borrowings
Financial instruments or their components are classified as liabilities, where the substance of the contractual arrangement results in the Group having an obligation either to deliver cash or another financial asset to the holder, or to satisfy the obligation other than by the exchange of a fixed amount of cash or another financial asset for a fixed number of own equity instruments. Such instruments include amounts due to credit institutions, amounts due to customers, subordinated debt and debt securities issued. After initial recognition, borrowings are subsequently measured at amortised cost using the effective interest method. Gains and losses are recognised in profit or loss when the borrowings are derecognised as well as through the amortisation process.
If the Group purchases its own debt, it is removed from the statement of financial position and the difference between the carrying amount of the liability and the consideration paid is recognised in profit or loss.
Leases
Operating lease
Where the Group is the lessee in a lease agreement where the lessor does not transfer substantially all of the risks and rewards incidental to ownership of the asset, the arrangement is accounted for as an operating lease. The leased asset is not recognised in the consolidated financial statements, and lease payments are recognised in profit or loss on a straight-line basis over the period of the lease.
When an operating lease is terminated before the lease period has expired, any payment required to be made to the lessor by way of penalty is recognised as an expense in the period in which termination takes place.

ZAO UniCredit Bank Notes to the Consolidated Financial Statements
(Thousands of Russian Roubles)
10
3. Summary of accounting policies (continued)
Impairment of financial assets
The Group assesses at each reporting date whether there is any objective evidence that a financial asset or a group of financial assets is impaired. A financial asset or a group of financial assets is deemed to be impaired if, and only if, there is objective evidence of impairment as a result of one or more events that has occurred after the initial recognition of the asset (an incurred ‘loss event’) and that loss event (or events) has an impact on the estimated future cash flows of the financial asset or the group of financial assets that can be reliably estimated. Evidence of impairment may include indications that the borrower or a group of borrowers is experiencing significant financial difficulty, default or delinquency in interest or principal payments, the probability that they will enter bankruptcy or other financial reorganisation and where observable data indicate that there is a measurable decrease in the estimated future cash flows, such as changes in arrears or economic conditions that correlate with defaults.
Amounts due from credit institutions and loans to customers
For amounts due from credit institutions and loans to customers carried at amortised cost, the Group first assesses individually whether objective evidence of impairment exists individually for financial assets that are individually significant, or collectively for financial assets that are not individually significant. If the Group determines that no objective evidence of impairment exists for an individually assessed financial asset, whether significant or not, it includes the asset in a group of financial assets with similar credit risks characteristics and collectively assesses them for impairment. Assets that are individually assessed for impairment and for which an impairment loss is, or continues to be, recognised are not included in a collective assessment of impairment.
If there is an objective evidence that an impairment loss has been incurred, the amount of the loss is measured as the difference between the assets’ carrying amount and the present value of estimated future cash flows (excluding future expected credit losses that have not yet been incurred). The carrying amount of the asset is reduced through the use of an allowance account and the amount of the loss is recognised in profit or loss. Interest income continues to be accrued on the reduced carrying amount based on the original effective interest rate of the asset. Loans together with the associated allowance are written off when there is no realistic prospect of future recovery and all collateral has been realised or has been transferred to the Group. If, in a subsequent year, the amount of the estimated impairment loss increases or decreases because of an event occurring after the impairment was recognised, the previously recognised impairment loss is increased or reduced by adjusting the allowance account. If a write-off is later recovered, the recovery is credited to allowance account in profit or loss.
The present value of the estimated future cash flows is discounted at the financial asset’s original effective interest rate. If a loan has a variable interest rate, the discount rate for measuring any impairment loss is the current effective interest rate.
The calculation of the present value of the estimated future cash flows of a collateralised financial asset reflects the cash flows that may result from foreclosure less costs for obtaining and selling the collateral.
For the purpose of a collective evaluation of impairment, financial assets are grouped on the basis of the Bank’s internal credit grading system that considers credit risk characteristics such as asset type, borrower’s financial position, industry, geographical location, collateral type, past-due status and other relevant factors.
Future cash flows on a group of financial assets that are collectively evaluated for impairment are estimated on the basis of historical loss experience for assets with credit risk characteristics similar to those in the group. Historical loss experience is adjusted on the basis of current observable data to reflect the effects of current conditions that did not affect the years on which the historical loss experience is based and to remove the effects of conditions in the historical period that do not exist currently. Estimates of changes in future cash flows reflect, and are directionally consistent with, changes in related observable data from year to year (such as changes in property prices, payment status, or other factors that are indicative of incurred losses in the group or their magnitude). The methodology and assumptions used for estimating future cash flows are reviewed regularly to reduce any differences between loss estimates and actual loss experience.
Held-to-maturity financial investments
For held-to-maturity investments the Group assesses individually whether there is objective evidence of impairment. If there is objective evidence that an impairment loss has been incurred, the amount of the loss is measured as the difference between the asset’s carrying amount and the present value of estimated future cash flows. The carrying amount of the asset is reduced and the amount of the loss is recognised in profit or loss.

ZAO UniCredit Bank Notes to the Consolidated Financial Statements
(Thousands of Russian Roubles)
11
3. Summary of accounting policies (continued)
Impairment of financial assets (continued)
Held-to-maturity financial investments (continued)
If, in a subsequent year, the amount of the estimated impairment loss decreases because of an event occurring after the impairment was recognised, any amounts formerly charged are credited to profit or loss.
Available-for-sale financial investments
For available-for-sale financial investments, the Group assesses at each reporting date whether there is objective evidence that an investment or a group of investments is impaired.
Impairment losses on available-for-sale financial assets are recognised by transferring the cumulative loss that is recognised in other comprehensive income to profit or loss as a reclassification adjustment. The cumulative loss that is reclassified from other comprehensive income to profit or loss is the difference between the acquisition cost, net of any principal repayment and amortisation, and the current fair value, less any impairment loss previously recognised in profit or loss. Changes in impairment provisions attributable to time value are reflected as a component of interest income.
In the case of debt instruments classified as available-for-sale, impairment is assessed based on the same criteria as financial assets carried at amortised cost. Future interest income is based on the reduced carrying amount and is accrued using the rate of interest used to discount the future cash flows for the purpose of measuring the impairment loss. The interest income is recorded in profit or loss. If, in a subsequent year, the fair value of a debt instrument increases and the increase can be objectively related to an event occurring after the impairment loss was recognised in profit or loss, the impairment loss is reversed through profit or loss.
Renegotiated loans
Where possible, the Group seeks to restructure loans rather than to take possession of collateral. This may involve extending the payment arrangements and the agreement of new loan conditions. Once the terms have been renegotiated, the loan is no longer considered past due. Management continuously reviews renegotiated loans to ensure that all criteria are met and that future payments are likely to occur. The loans continue to be subject to an impairment assessment, calculated using the loan’s original effective interest rate.
Non-financial assets
Other non-financial assets, other than deferred taxes, are assessed at each reporting date for any indications of impairment.
The recoverable amount of non-financial assets is the greater of their fair value less costs to sell and value in use. In assessing value in use, the estimated future cash flows are discounted to their present value using a pre-tax discount rate that reflects current market assessments of the time value of money and the risks specific to the asset. For an asset that does not generate cash inflows largely independent of those from other assets, the recoverable amount is determined for the cash-generating unit to which the asset belongs. An impairment loss is recognised when the carrying amount of an asset or its cash-generating unit exceeds its recoverable amount.
All impairment losses in respect of non-financial assets are recognised in profit or loss and reversed only if there has been a change in the estimates used to determine the recoverable amount. Any impairment loss reversed is only reversed to the extent that the asset’s carrying amount does not exceed the carrying amount that would have been determined, net of depreciation or amortisation, if no impairment loss had been recognised.

ZAO UniCredit Bank Notes to the Consolidated Financial Statements
(Thousands of Russian Roubles)
12
3. Summary of accounting policies (continued)
Derecognition of financial assets and liabilities
Financial assets
A financial asset (or, where applicable a part of a financial asset or part of a group of similar financial assets) is derecognised where:
- the rights to receive cash flows from the asset have expired; - the Group has transferred its rights to receive cash flows from the asset, or retained the right to receive cash flows from the asset, but has assumed an obligation to pay them in full without material delay to a third party under a ‘pass-through’ arrangement; and - the Group either (a) has transferred substantially all the risks and rewards of the asset, or (b) has neither transferred nor retained substantially all the risks and rewards of the asset, but has transferred control of the asset.
Where the Group has transferred its rights to receive cash flows from an asset and has neither transferred nor retained substantially all the risks and rewards of the asset nor transferred control of the asset, the asset is recognised to the extent of the Group’s continuing involvement in the asset. Continuing involvement that takes the form of a guarantee over the transferred asset is measured at the lower of the original carrying amount of the asset and the maximum amount of consideration that the Group could be required to repay.
Financial liabilities
A financial liability is derecognised when the obligation under the liability is discharged or cancelled or expires.
Where an existing financial liability is replaced by another financial liability from the same lender on substantially different terms, or the terms of an existing liability are substantially modified, such an exchange or modification is treated as a derecognition of the original liability and the recognition of a new liability, and the difference in the respective carrying amounts is recognised in profit or loss.
Taxation
Income tax comprises current and deferred tax. Income tax is recognised in profit or loss except to the extent that it relates to items of other comprehensive income or transactions with shareholders recognised directly in equity, in which case it is recognised within other comprehensive income or directly within equity.
The current income tax expense is calculated in accordance with the regulations of the Russian Federation and of the regions in which the Group has offices, or where its branches, subsidiaries and associates are located. Current tax expense is the expected tax payable on the taxable income for the year, using tax rates enacted or substantially enacted at the reporting date, and any adjustment to tax payable in respect of previous years.
Deferred income taxes are provided for all temporary differences arising between the tax bases of assets and liabilities and their carrying values for financial reporting purposes, except where the deferred income tax arises from the initial recognition of goodwill or of an asset or liability in a transaction that is not a business combination and, at the time of the transaction, affects neither the accounting profit nor taxable profit or loss. The amount of deferred tax provided is based on the expected manner of realisation or settlement of the carrying amount of assets and liabilities, using tax rates enacted or substantially enacted at the reporting date. Deferred tax assets are reduced to the extent that it is no longer probable that the related tax benefits will be realised.
A deferred tax asset is recorded only to the extent that it is probable that taxable profit will be available against which the deductible temporary differences can be utilised.
Russia also has various operating taxes that are assessed on the Group’s activities. These taxes are included as a component of other administrative expenses in the consolidated statement of comprehensive income.
New transfer pricing legislation enacted in the Russian Federation starting from 1 January 2012 provides for major modifications making local transfer pricing rules closer to OECD guidelines, but creating additional uncertainty in practical application of tax legislation in certain circumstances. Since there is no practice of applying the new transfer pricing rules by the tax authorities and courts, it is difficult to predict the effect of the new transfer pricing rules on these consolidated financial statements.

ZAO UniCredit Bank Notes to the Consolidated Financial Statements
(Thousands of Russian Roubles)
13
3. Summary of accounting policies (continued)
Fixed assets
Fixed assets are carried at cost, excluding the costs of day-to-day servicing, less accumulated depreciation and any accumulated impairment. Depreciation of an asset begins when it is available for use. Depreciation is calculated on a straight-line basis over the following estimated useful lives:
Years Buildings 20-30 Furniture and fixtures 5 Computer equipment 5 Leasehold improvements lesser of the useful life of the asset and period of lease Other fixed assets 3-5
Costs related to repairs and renewals are charged when incurred and included in other operating expenses, unless they qualify for capitalization.
Intangible assets including goodwill
Intangible assets other than goodwill include licenses and computer software. Licenses are stated at historical cost net of accumulated amortisation and any accumulated impairment losses. Amortisation is provided so as to write down the cost of an asset on a straight-line basis over its estimated useful economic life. The useful life is currently assessed as not more than 10 years.
Software development costs (relating to the design and testing of new or substantially improved software) are recognised as intangible assets only when the Group can demonstrate the technical feasibility of completing the software so that it will be available for use or sale, its intention to complete and its ability to use the asset, how the asset will generate future economic benefits, the availability of resources to complete and the ability to measure reliably the expenditure during the development. Other software development costs are recognised as an expense as incurred. Computer software development costs recognised as intangible assets, as well as acquired computer software, are initially recorded at historical cost and are subsequently amortised using the straight-line method over their useful lives, but not exceeding a period of three years.
Goodwill is initially measured at cost, being the excess of the cost of an acquisition over the net fair value of the Group’s share of the identifiable assets, liabilities and contingent liabilities of the acquired subsidiary or associate at the date of acquisition. Following initial recognition, goodwill is measured at cost less any accumulated impairment losses.
Goodwill is reviewed for impairment annually or more frequently if events or changes in circumstances indicate that the carrying amount may be impaired. For the purpose of impairment testing, goodwill is allocated to the Group’s cash-generating units that are expected to benefit from the synergies of the combination, irrespective of whether other assets or liabilities of the Group are assigned to those units or groups of units.
Impairment is determined by assessing the recoverable amount of the cash-generating unit to which the goodwill relates. Where the recoverable amount of the cash-generating unit is less than its carrying amount, an impairment loss is recognised.
Negative goodwill arising on an acquisition is recognised immediately in profit or loss.
Investment property
Investment property is property held either to earn rental income or for capital appreciation or for both, but not for sale in normal course of business, or for the use in production or supply of goods or services or for administrative purposes. Investment property is measured at cost less accumulated depreciation and any accumulated impairment. Depreciation is calculated on a straight-line basis over the useful life applicable for the fixed assets.

ZAO UniCredit Bank Notes to the Consolidated Financial Statements
(Thousands of Russian Roubles)
14
3. Summary of accounting policies (continued)
Credit related commitments
In the normal course of business, the Group enters into credit related commitments, comprising undrawn loan commitments, letters of credit and guarantees, and provides other forms of credit insurance.
Financial guarantees are contracts that require the Group to make specified payments to reimburse the holder for a loss it incurs because a specified debtor fails to make payment when due in accordance with the terms of a debt instrument.
A financial guarantee liability is recognised initially at fair value net of associated transaction costs, and is measured subsequently at the higher of the amount initially recognised less cumulative amortisation or the amount of provision for losses under the guarantee. Provisions for losses under financial guarantees and other credit related commitments are recognised when losses are considered probable and can be measured reliably.
Financial guarantee liabilities and provisions for other credit related commitment are included in other liabilities.
Other provisions
Provisions are recognised when the Group has a present legal or constructive obligation as a result of past events, it is probable that an outflow of resources embodying economic benefits will be required to settle the obligation and a reliable estimate of the amount of obligation can be made.
Retirement and other employee benefit obligations
The Group makes contributions to the State pension system of the Russian Federation, which requires current contributions by the employer calculated as a percentage of current gross salary payments; such expense is charged in the period the related salaries are earned.
The Group also provides defined contribution pension coverage for employees. The coverage provided does not represent contributions into a separate legal entity, nor are its assets and liabilities segregated from the assets and liabilities of the Group. Contributions accrued by the Group during the period are included in profit or loss as personnel expenses, and related liabilities to employees are recorded within other liabilities.
Share capital
Ordinary shares are classified as equity. Any excess of the fair value of consideration received over the par value of shares issued is recognised as share premium.
Dividends are recognised as a liability and deducted from equity at the reporting date only if they are declared before or on the reporting date. Dividends are disclosed when they are proposed before the reporting date or proposed or declared after the reporting date but before the consolidated financial statements are authorised for issue.
Segment reporting
An operating segment is a component of a Group that engages in business activities from which it may earn revenues and incur expenses (including revenues and expenses relating to transactions with other components of the same Group); whose operating results are regularly reviewed by the chief operating decision maker to make decisions about resources to be allocated to the segment and assess its performance, and for which discrete financial information is available.
Contingencies
Contingent liabilities are not recognised in the consolidated statement of financial position but are disclosed unless the possibility of any outflow in settlement is remote. A contingent asset is not recognised in the consolidated statement of financial position but disclosed when an inflow of economic benefits is probable.
Recognition of income and expenses
Revenue is recognised to the extent that it is probable that the economic benefits will flow to the Group and the revenue can be reliably measured.
ZAO UniCredit Bank Notes to the Consolidated Financial Statements
(Thousands of Russian Roubles)
15
3. Summary of accounting policies (continued)
Recognition of income and expenses (continued)
Interest and similar income and expense
For all financial instruments measured at amortised cost and interest bearing securities classified as trading or available-for-sale, interest income or expense is recorded at the effective interest rate, which is the rate that exactly discounts estimated future cash payments or receipts through the expected life of the financial instrument or a shorter period, where appropriate, to the net carrying amount of the financial asset or financial liability. The calculation takes into account all contractual terms of the financial instrument (for example, prepayment options) and includes any fees or incremental costs that are directly attributable to the instrument and are an integral part of the effective interest rate, but not future credit losses. The carrying amount of the financial asset or financial liability is adjusted if the Group revises its estimates of payments or receipts. The adjusted carrying amount is calculated based on the original effective interest rate and the change in carrying amount is recorded as interest income or expense.
Once the recorded value of a financial asset or a group of similar financial assets has been reduced due to an impairment loss, interest income continues to be recognised using the original effective interest rate applied to the new carrying amount.
Fee and commission income
The Group earns fee and commission income from a diverse range of services it provides to its customers. Fee income can be divided into the following two categories:
- Fee income earned from services that are provided over a certain period of time
Fees earned for the provision of services over a period of time are accrued over that period. These fees include commission income and asset management, custody and other management and advisory fees. Loan commitment fees for loans that are likely to be drawn down and other credit related fees are deferred (together with any incremental costs) and recognised as an adjustment to the effective interest rate on the loan.
- Fee income from providing transaction services
Fees arising from negotiating or participating in the negotiation of a transaction for a third party – such as the arrangement of the acquisition of shares or other securities or the purchase or sale of businesses – are recognised on completion of the underlying transaction. Fees or components of fees that are linked to a certain performance are recognised after fulfilling the corresponding criteria.
Dividend income
Dividend income is recognised in profit or loss on the date when the dividend is declared.
Foreign currency translation
Each entity in the Group determines its own functional currency and items included in the financial statements of each entity are measured using that functional currency. Management determined the functional currency for all Group entities to be the RUB as it reflects the economic substance of the underlying events and circumstances of the Group. Transactions in foreign currencies are translated to the functional currency at the foreign exchange rate ruling at the date of the transaction. Monetary assets and liabilities denominated in foreign currencies are retranslated at the functional currency rate of exchange ruling at the reporting date. Gains and losses resulting from the translation of foreign currency transactions are recognised in profit or loss as gains or losses on financial assets and liabilities held for trading. Non-monetary items that are measured in terms of historical cost in a foreign currency are translated using the exchange rates as at the dates of the initial transactions. Differences between the contractual exchange rate of a transaction in a foreign currency and the CBR exchange rate on the date of the transaction are included in gains or losses on financial assets and liabilities held for trading.

ZAO UniCredit Bank Notes to the Consolidated Financial Statements
(Thousands of Russian Roubles)
16
3. Summary of accounting policies (continued)
New standards and interpretations not yet adopted
A number of new standards, amendments to standards and interpretations are not yet effective as at 31 December 2012, and are not applied in preparing these consolidated financial statements. Of these pronouncements, potentially the following will have an impact on the financial position and performance. The Group plans to adopt these pronouncements when they become effective. The Group has not yet analysed the likely impact of these pronouncements on its consolidated financial statements.
• IFRS 9 Financial Instruments will be effective for annual periods beginning on or after 1 January 2015. The new standard is to be issued in phases and is intended ultimately to replace International Financial Reporting Standard IAS 39 Financial Instruments: Recognition and Measurement. The first phase of IFRS 9 was issued in November 2009 and relates to the classification and measurement of financial assets. The second phase regarding classification and measurement of financial liabilities was published in October 2010. The remaining parts of the standard are expected to be issued during 2013. The Group recognises that the new standard introduces many changes to the accounting for financial instruments and is likely to have a significant impact on Group’s consolidated financial statements. The impact of these changes will be analysed during the course of the project as further phases of the standard are issued. The Group does not intend to adopt this standard early.
• IFRS 10 Consolidated Financial Statements will be effective for annual periods beginning on or after 1 January 2013. The new standard supersedes IAS 27 Consolidated and Separate Financial Statements and SIC-12 Consolidation – Special Purpose Entities. IFRS 10 introduces a single control model which includes entities that are currently within the scope of SIC-12. Under the new three-step control model, an investor controls an investee when it is exposed, or has rights, to variable returns from its involvement with that investee, has the ability to affect those returns through its power over that investee and there is a link between power and returns. Consolidation procedures are carried forward from IAS 27 (2008). When the adoption of IFRS 10 does not result in a change in the previous consolidation or non-consolidation of an investee, no adjustments to accounting are required on initial application. When the adoption results in a change in the consolidation or non-consolidation of an investee, the new standard may be adopted with either full retrospective application from date that control was obtained or lost or, if not practicable, with limited retrospective application from the beginning of the earliest period for which the application is practicable, which may be the current period. Early adoption of IFRS 10 is permitted provided an entity also early-adopts IFRS 11, IFRS 12, IAS 27 (2011) and IAS 28 (2011).
• IFRS 11 Joint Arrangements will be effective for annual periods beginning on or after 1 January 2013 with retrospective application required. The new standard supersedes IAS 31 Interests in Joint Ventures. The main change introduced by IFRS 11 is that all joint arrangements are classified either as joint operations, which are consolidated on a proportionate basis, or as joint ventures, for which the equity method is applied. The type of arrangement is determined based on the rights and obligations of the parties to the arrangement arising from joint arrangement’s structure, legal form, contractual arrangement and other facts and circumstances. When the adoption of IFRS 11 results in a change in the accounting model, the change is accounted for retrospectively from the beginning of the earliest period presented. Under the new standard all parties to a joint arrangement are within the scope of IFRS 11 even if all parties do not participate in the joint control. Early adoption of IFRS 11 is permitted provided the entity also early-adopts IFRS 10, IFRS 12, IAS 27 (2011) and IAS 28 (2011).
• IFRS 12 Disclosure of Interests in Other Entities will be effective for annual periods beginning on or after 1 January 2013. The new standard contains disclosure requirements for entities that have interests in subsidiaries, joint arrangements, associates and unconsolidated structured entities. Interests are widely defined as contractual and non-contractual involvement that exposes an entity to variability of returns from the performance of the other entity. The expanded and new disclosure requirements aim to provide information to enable the users to evaluate the nature of risks associated with an entity’s interests in other entities and the effects of those interests on the entity’s financial position, financial performance and cash flows. Entities may early present some of the IFRS 12 disclosures without a need to early-adopt the other new and amended standards. However, if IFRS 12 is early-adopted in full, then IFRS 10, IFRS 11, IAS 27 (2011) and IAS 28 (2011) must also be early-adopted.
• Amendments to IFRS 7 Financial Instruments: Disclosures - Offsetting Financial Assets and Financial Liabilities contain new disclosure requirements for financial assets and liabilities that are offset in the statement of financial position or subject to master netting arrangements or similar agreements. The amendments are effective for annual periods beginning on or after 1 January 2013, and are to be applied retrospectively.

ZAO UniCredit Bank Notes to the Consolidated Financial Statements
(Thousands of Russian Roubles)
17
3. Summary of accounting policies (continued)
New standards and interpretations not yet adopted (continued)
• IAS 27 (2011) Separate Financial Statements will become effective for annual periods beginning on or after 1 January 2013. The amended standard carries forward the existing accounting and disclosure requirements of IAS 27 (2008) for separate financial statements with some clarifications. The requirements of IAS 28 (2008) and IAS 31 for separate financial statements have been incorporated into IAS 27 (2011). Early adoption of IAS 27 (2011) is permitted provided the entity also early-adopts IFRS 10, IFRS 11, IFRS 12 and IAS 28 (2011).
• IAS 28 (2011) Investments in Associates and Joint Ventures combines the requirements in IAS 28 (2008) and IAS 31 that were carried forward but not incorporated into IFRS 11 and IFRS 12. The amended standard will become effective for annual periods beginning of or after 1 January 2013 with retrospective application required. Early adoption of IAS 28 (2011) is permitted provided the entity also early-adopts IFRS 10, IFRS 11, IFRS 12 and IAS 27 (2011).
• IFRS 13 Fair Value Measurement will be effective for annual periods beginning on or after 1 January 2013. The new standard replaces the fair value measurement guidance contained in individual IFRSs with a single source of fair value measurement guidance. It provides a revised definition of fair value, establishes a framework for measuring fair value and sets out disclosure requirements for fair value measurements. IFRS 13 does not introduce new requirements to measure assets or liabilities at fair value, nor does it eliminate the practicability exceptions to fair value measurement that currently exist in certain standards. The standard is applied prospectively with early adoption permitted. Comparative disclosure information is not required for periods before the date of initial application.
• Amendments to IAS 32 Financial Instruments: Presentation - Offsetting Financial Assets and Financial Liabilities do not introduce new rules for offsetting financial assets and liabilities; rather they clarify the offsetting criteria to address inconsistencies in their application. The Amendments specify that an entity currently has a legally enforceable right to set-off if that right is not contingent on a future event; and enforceable both in the normal course of business and in the event of default, insolvency or bankruptcy of the entity and all counterparties. The amendments are effective for annual periods beginning on or after 1 January 2014, and are to be applied retrospectively.
• Various Improvements to IFRSs have been dealt with on a standard-by-standard basis. All amendments, which result in accounting changes for presentation, recognition or measurement purposes, will come into effect not earlier than 1 January 2013. The Group has not yet analysed the likely impact of the improvements on its financial position or performance.
Reclassifications
With effect from 31 March 2012, the Group presents the client related part of foreign currency exchange and derivative transactions within gain on financial assets and liabilities held for trading in the consolidated statement of comprehensive income. The Group previously presented the client related part of foreign currency exchange and derivative transactions within fee and commission income in the consolidated statement of comprehensive income for the year ended 31 December 2011.

ZAO UniCredit Bank Notes to the Consolidated Financial Statements
(Thousands of Russian Roubles)
18
3. Summary of accounting policies (continued)
The following reclassifications are made to the consolidated statement of comprehensive income for the year ended 31 December 2011 to conform to the 2012 presentation: As previously
reported Effect of
reclassifications As adjusted
Consolidated statement of comprehensive income for the year ended 31 December 2011
Fee and commission income
6 770 315
(2 128 154)
4 642 161
Gains on financial assets and liabilities held for trading 1 448 708 2 128 154 3 576 862
4. Significant accounting judgements and estimates
Management makes a number of estimates and assumptions relating to the reporting of assets and liabilities and the disclosure of contingent assets and liabilities to prepare these consolidated financial statements in conformity with IFRS. Actual results could differ from those estimates.
In particular, information about significant areas of estimation uncertainty and critical judgments in applying accounting policies related to loan impairment is described in the Note 10.
5. Operating segments
For management purposes, the Group has three reporting business segments:
Corporate and Investment banking (hereinafter – “CIB”) includes corporate lending, project and commodity and corporate structured finance, corporate sight and term deposit services, securities, foreign currency and derivatives trading and custody services.
Retail banking comprises private banking services, credit and debit card services, retail sight and term deposit services, retail lending (consumer loans, car loans and mortgages).
Other – represents the Group’s funding activities and other unallocated items.
Information about each segment is measured on the same basis as the information used for decision making purposes for allocating resources to segments and assessing segment performance and is prepared on the same basis as the consolidated financial statements.
Transactions between the business segments are on normal commercial terms and conditions. Funds are ordinarily reallocated between segments, resulting in funding cost transfers included in segment revenue. Interest charged for these funds is based on the Group’s funds transfer pricing policy.
Segment breakdown of assets and liabilities is set out below:
31 December
2012 31 December
2011 Assets CIB 577 773 209 494 536 132 Retail banking 111 526 692 82 245 432 Other 179 175 681 195 195 350 Total assets 868 475 582 771 976 914 Liabilities CIB 439 303 604 403 622 397 Retail banking 94 553 138 88 303 350 Other 221 365 709 191 743 023 Total liabilities 755 222 451 683 668 770

ZAO UniCredit Bank Notes to the Consolidated Financial Statements
(Thousands of Russian Roubles)
19
5. Operating segments (continued)
Segment information for the operating segments for the year ended 31 December 2012 and 2011 is set out below:
CIB
Retail Banking Other Total
Net interest income (expense) from external customers for the year ended 31 December 2012 12 875 374 10 600 086 (217 878) 23 257 582 Net interest income (expense) from external customers for the year ended 31 December 2011 17 664 940 8 105 730 (3 998 993) 21 771 677 Inter-segment (expense) income for the year ended 31 December 2012 (1 827 444) (3 611 404) 5 438 848 – Inter-segment (expense) income for the year ended 31 December 2011 (4 329 030) (2 088 920) 6 417 950 – Net interest income for the year ended 31 December 2012 11 047 930 6 988 682 5 220 970 23 257 582 Net interest income for the year ended 31 December 2011 13 335 910 6 016 810 2 418 957 21 771 677 Net fee and commission income (expenses) from external customers for the year ended 31 December 2012 2 295 198 2 428 279 (196) 4 723 281 Net fee and commission income (expense) from external customers for the year ended 31 December 2011 2 070 070 1 967 622 (57 226) 3 980 466 Dividend income for the year ended 31 December 2012 – – 59 478 59 478 Dividend income for the year ended 31 December 2011 – – 23 134 23 134 Gains on financial assets and liabilities held for trading from external customers for the year ended 31 December 2012 4 265 007 530 604 1 479 4 797 090 Gains on financial assets and liabilities held for trading from external customers for the year ended 31 December 2011 2 928 809 593 911 54 142 3 576 862 Fair value adjustments in portfolio hedge accounting for the year ended 31 December 2012 – – (406) (406) Fair value adjustments in portfolio hedge accounting for the year ended 31 December 2011 – – 339 339 Gains on disposals of financial assets for the year ended 31 December 2012 270 788 10 958 3 007 050 3 288 796 Gains on disposals of financial assets for the year ended 31 December 2011 217 403 4 342 3 211 266 3 433 011 Operating income for the year ended 31 December 2012 17 878 923 9 958 523 8 288 375 36 125 821 Operating income for the year ended 31 December 2011 18 552 192 8 582 685 5 650 612 32 785 489 (Impairment) recovery on loans for the year ended 31 December 2012 (1 604 014) (1 224 068) 44 758 (2 783 324) Impairment of loans for the year ended 31 December 2011 (2 168 695) (239 107) (254 036) (2 661 838) Net income from financial activities for the year ended 31 December 2012 16 274 909 8 734 455 8 333 133 33 342 497 Net income from financial activities for the year ended 31 December 2011 16 383 497 8 343 578 5 396 576 30 123 651 Operating costs for the year ended 31 December 2012 (3 639 979) (7 182 877) (319 241) (11 142 097) Operating costs for the year ended 31 December 2011 (3 092 135) (7 037 545) (158 943) (10 288 623) Share of gains of associate for the year ended 31 December 2012 – – 50 403 50 403 Share of gains of associate for the year ended 31 December 2011 – – 35 978 35 978

ZAO UniCredit Bank Notes to the Consolidated Financial Statements
(Thousands of Russian Roubles)
20
5. Operating segments (continued)
CIB Retail
Banking Other Total Losses on disposal of fixed assets for the year ended 31 December 2012 – – (8 157) (8 157) Losses on disposal of fixed assets for the year ended 31 December 2011 – – (4 735) (4 735) Profit before income tax expense for the year ended 31 December 2012 12 634 930 1 551 578 8 056 138 22 242 646 Profit before income tax expense for the year ended 31 December 2011 13 291 362 1 306 033 5 268 876 19 866 271 Income tax expense for the year ended 31 December 2012 (4 764 462) Income tax expense for the year ended 31 December 2011 (4 078 434) Profit for the year ended 31 December 2012 17 478 184 Profit for the year ended 31 December 2011 15 787 837 Cash flow hedge reserve for the year ended 31 December 2012 341 787 Cash flow hedge reserve for the year ended 31 December 2011 (626 522) Revaluation reserve for available-for-sale securities for the year ended 31 December 2012 (2 874 979) Revaluation reserve for available-for-sale securities for the year ended 31 December 2011 7 646 707 Total comprehensive income for the year ended 31 December 2012 14 944 992 Total comprehensive income for the year ended 31 December 2011 22 808 022 Information about major customers and geographical areas
The Group operates in the Russian Federation and foreign countries. In presenting geographical information the allocation of revenue is based on the geographical location of customers and assets.
Geographical information on revenues and assets for 2012 is presented below:
Revenues Assets Russian Federation 49 862 313 630 941 574 OECD countries 9 695 399 214 971 301 Non-OECD countries 1 299 199 22 562 707 Total 60 856 911 868 475 582
Geographical information on revenues and assets for 2011 is presented below:
Revenues Assets Russian Federation 39 109 937 554 303 664 OECD countries 6 139 474 192 221 299 Non-OECD countries 1 595 091 25 451 951 Total 46 844 502 771 976 914
6. Cash and cash balances
Cash and cash balances comprise:
2012 2011 Cash on hand 8 308 350 7 696 175 Current accounts with the CBR 15 711 756 16 795 816 Cash and cash balances 24 020 106 24 491 991

ZAO UniCredit Bank Notes to the Consolidated Financial Statements
(Thousands of Russian Roubles)
21
6. Cash and cash balances (continued)
Included in cash and cash balances as at 31 December 2012 is amount of RUB 862 000 thousand (31 December 2011: RUB 500 000 thousand) pledged as collateral for mortgage-backed bonds issued by the Group in September 2011 (see Note 19 for details).
7. Trading securities
Trading securities comprise:
2012 2011 USD denominated Russian Government Eurobonds 3 827 3 450 Corporate bonds – 84 555 RUB denominated Russian Government Bonds 2 504 247 1 253 984 Corporate bonds 1 832 454 596 733 Trading securities 4 340 528 1 938 722
As at 31 December 2012 approximately 88% of trading securities held by the Group were issued by organisations rated not lower than “BBB-“ (31 December 2011: 80%).
Nominal interest rates and maturities of trading securities are as follows: 2012 2011
% Maturity % Maturity Russian Government Bonds 6.8 – 11.2% 2014 – 2027 6.7 – 11.3% 2012 – 2018
Russian Government Eurobonds 7.5 – 12.75% 2018, 2028, 2030 7.5 – 12.75% 2018, 2028, 2030
Corporate bonds 8.5 – 9.4% 2022 7.5 – 8.75% 2014, 2022 – 2023
8. Amounts due from credit institutions
Amounts due from credit institutions comprise:
2012 2011 Current accounts with credit institutions 29 361 664 8 524 623 Time deposits 200 825 815 161 892 332 Reverse repurchase agreements with credit institutions 9 616 833 20 890 670 Obligatory reserve with the CBR 6 641 876 8 835 750 Amounts due from credit institutions 246 446 188 200 143 375
Credit institutions are required to maintain a non-interest earning cash deposit (obligatory reserve) with the CBR, the amount of which depends on the level of funds attracted by the credit institution. The Bank’s ability to withdraw such deposit is significantly restricted by the statutory legislation.
As at 31 December 2012, there are four counterparties with balances that individually exceeded 10% of equity. As at 31 December 2012, the aggregate amount of these balances is RUB 198 765 111 thousand (31 December 2011: two counterparties with aggregate amount of RUB 153 857 978 thousand).
As at 31 December 2012, the Group entered into reverse repurchase agreements with a number of Russian banks. Pledged under these agreements are Russian Government bonds, municipal bonds and corporate and bank bonds issued by Russian companies and banks with the total fair value of RUB 10 524 122 thousand (31 December 2011: RUB 22 454 878 thousand).
As at 31 December 2012 approximately 96% (31 December 2011: 84%) of current accounts with credit institutions and term deposits were placed with banks rated not lower than “BBB-“. As at 31 December 2012 100% (31 December 2011: 89%) of total amount of reverse repurchase agreements with credit institutions were placed with non-rated banks or banks rated lower than “BBB-“ .
As at 31 December 2012 the Group has term placements with CBR of RUB 25 006 148 thousand (31 December 2011: none).

ZAO UniCredit Bank Notes to the Consolidated Financial Statements
(Thousands of Russian Roubles)
22
9. Derivative financial instruments
The Group enters into derivative financial instruments principally for trading and hedging purposes. The tables below show the fair values of derivative financial instruments, recorded as assets or liabilities, together with their notional amounts. The notional amount, recorded gross, is the amount of a derivative’s underlying asset or notional amount to which reference rate or index is applied and is the basis upon which changes in the value of derivatives are measured. The notional amounts indicate the volume of transactions outstanding at the year end and are indicative of neither the market risk nor the credit risk.
The Bank values the derivative financial instruments using widely accepted valuation techniques which are based on market interest rates and forward currency rates. Significant changes in these variables could cause the fair value of the derivatives to change materially.
The table below shows the fair value derivative instruments held for trading, recorded as assets or liabilities, together with their notional amounts.
2012 2011
Notional principal
Fair value Notional principal
Fair value Asset Liability Asset Liability
Cross-currency interest rate swaps 120 279 430 3 204 544 1 899 534 100 384 731 5 258 181 4 061 327 Interest rate swaps and options 306 839 794 5 317 432 4 714 982 301 725 380 4 143 272 4 729 554 Foreign exchange forwards 69 837 962 1 542 327 695 462 177 093 920 3 465 626 4 102 913 Futures on foreign exchange and securities 2 837 500 – – 8 060 000 – – Total derivative assets/liabilities 10 064 303 7 309 978 12 867 079 12 893 794
The table below shows the fair values of financial instruments designated for hedging, recorded as assets or liabilities, together with their notional amounts.
2012 2011
Notional principal
Fair value Notional principal
Fair value Asset Liability Asset Liability
Cash flow hedge Interest rate swaps 113 217 772 2 712 468 117 466 80 625 660 1 142 153 16 595 Cross-currency interest rate swaps 60 666 859 1 909 910 585 421 46 919 330 172 679 2 520 389 Total cash flow hedge 4 622 378 702 887 1 314 832 2 536 984 Fair value hedge Interest rate swaps 283 365 959 2 727 708 5 519 555 281 538 885 2 461 851 4 736 382 Total fair value hedge 2 727 708 5 519 555 2 461 851 4 736 382 Total derivative financial assets/liabilities designated for hedging 7 350 086 6 222 442 3 776 683 7 273 366
Portfolio Fair Value Hedge Accounting (hereinafter – the “PFVHA”) is a part of interest rate risk hedging strategy of the Group that helps to avoid discrepancies between the economic substance of deals concluded for hedging purposes and their accounting treatment. PFVHA allows managing interest rate risks associated with a portfolio of financial assets or financial liabilities designated as hedged items. The Group designates interest rate swaps as hedging instruments. The hedging instruments are stated at their fair value and changes in fair value are recognized in the consolidated statement of comprehensive income.
Hedging instruments to hedge variability of fair value are measured at fair value with changes in fair value of RUB 1 142 636 thousand recognised as a loss in the consolidated statement of comprehensive income in fair value adjustments in portfolio hedge accounting for the year ended 31 December 2012 (31 December 2011: RUB 495 031 thousand). The changes in the fair value of hedged items (portfolio of financial assets and financial liabilities) that are attributable to the hedged risk are recognised as gains of RUB 1 142 230 thousand in the consolidated statement of comprehensive income in fair value adjustments in portfolio hedge accounting for the year ended 31 December 2012 (31 December 2011: RUB 495 370 thousand).

ZAO UniCredit Bank Notes to the Consolidated Financial Statements
(Thousands of Russian Roubles)
23
9. Derivative financial instruments (continued)
Along with PFVHA the Group uses the Portfolio Cash Flow hedging.
The Group designates certain interest rate swaps and cross-currency interest rate swaps as hedging instruments to hedge variability in cash flows and fair value resulting from interest rate mismatch of the banking book position. The hedged cash flows are expected to occur and to affect the statement of comprehensive income until 2024 for interest rate swaps. As at 31 December 2012, the effective portion of changes in the fair value of derivative financial instruments designated as hedging instruments recognised as part of other comprehensive income in equity was RUB 960 582 thousand (31 December 2011: RUB 1 302 369 thousand), net of tax RUB 240 146 thousand (31 December 2011: RUB 325 593 thousand).
The Group recognised RUB 2 996 310 thousand of gains on the cash flows and fair value hedging instruments in other interest income for the year ended 31 December 2012 in relation to the interest rate swaps and cross-currency interest rate swaps (31 December 2011: RUB 196 931 thousand).
10. Loans to customers
Loans to customers comprise:
2012 2011 Corporate customers 385 884 479 392 480 466 Retail customers, including SME 117 555 112 87 323 721 Reverse repurchase agreements with companies 16 663 201 8 122 974 Other – 548 242 Gross loans to customers 520 102 792 488 475 403 Allowance for loan impairment (15 907 718) (15 777 309) Loans to customers 504 195 074 472 698 094
A reconciliation of the provisions for impairment by classes of loans to customers for the year ended 31 December 2012 is as follows:
Corporate customers Retail customers Other Total
At 1 January 2012 10 482 898 5 097 041 197 370 15 777 309 Charge for the year 1 695 307 1 259 403 (171 386) 2 783 324 Loans sold during the year (2 319 470) (8 021) (25 407) (2 352 898) Loans written-off during the year (23 545) (7 133) (577) (31 255) Effect of exchange rate changes (168 906) (99 856) – (268 762) At 31 December 2012 9 666 284 6 241 434 – 15 907 718
A reconciliation of the provisions for impairment by classes of loans to customers for the year ended 31 December 2011 is as follows:
Corporate customers Retail customers Other Total
At 1 January 2011 10 417 619 4 897 669 – 15 315 288 Acquisition of subsidiary – – 116 328 116 328 Charge for the year 2 288 248 142 641 230 949 2 661 838 Loans sold during the year (2 115 447) (3 417) (149 907) (2 268 771) Loans written-off during the year (219 947) (35 790) – (255 737) Effect of exchange rate changes 112 425 95 938 – 208 363 At 31 December 2011 10 482 898 5 097 041 197 370 15 777 309

ZAO UniCredit Bank Notes to the Consolidated Financial Statements
(Thousands of Russian Roubles)
24
10. Loans to customers (continued)
The following table shows gross loans and related impairment as at 31 December 2012:
Gross loans Impairment Net loans Corporate customers Loans for which no indications of impairment have been
identified on an individual basis, not past due 369 488 719 (1 226 750) 368 261 969 Loans for which no specific impairment is identified, past
due - Past due less than 31 days 201 688 (1 942) 199 746 Impaired loans - Not past due 6 873 711 (956 204) 5 917 507 - Past due less than 31 days 361 481 (29 057) 332 424 - Past due 31 - 90 days 496 113 (122 785) 373 328 - Past due 90 - 180 days 1 124 753 (882 562) 242 191 - Past due over 180 days 7 338 014 (6 446 984) 891 030 Total loans to corporate customers 385 884 479 (9 666 284) 376 218 195 Retail customers Standard loans, not past due 106 465 077 (748 649) 105 716 428 Standard loans, past due - Past due less than 31 days 2 495 983 (166 015) 2 329 968 - Past due 31 - 90 days 774 562 (124 516) 650 046 Impaired loans - Not past due 178 571 (132 350) 46 221 - Past due 31 - 90 days 6 038 (5 818) 220 - Past due 90 - 180 days 474 203 (202 843) 271 360 - Past due over 180 days 7 160 678 (4 861 243) 2 299 435 Total loans to retail customers 117 555 112 (6 241 434) 111 313 678 Reverse repurchase agreements with companies Loans for which no indications of impairment have been
identified on an individual basis, not past due 16 663 201 – 16 663 201
Total loans to customers 520 102 792 (15 907 718) 504 195 074

ZAO UniCredit Bank Notes to the Consolidated Financial Statements
(Thousands of Russian Roubles)
25
10. Loans to customers (continued)
The following table shows gross loans and related impairment as at 31 December 2011:
Gross loans Impairment Net loans Corporate customers Loans for which no indications of impairment have been
identified on an individual basis, not past due 373 190 313 (1 128 535) 372 061 778 Loans for which no specific impairment is identified, past
due - Past due 31 - 90 days 4 199 (38) 4 161
Impaired loans - Not past due 7 628 049 (849 045) 6 779 004 - Past due less than 31 days 89 627 (49 339) 40 288 - Past due 31 - 90 days 838 080 (564 629) 273 451 - Past due 90 - 180 days 453 694 (281 338) 172 356 - Past due over 180 days 10 276 504 (7 609 974) 2 666 530
Total loans to corporate customers 392 480 466 (10 482 898) 381 997 568 Retail customers Standard loans, not past due 77 832 941 (287 838) 77 545 103 Standard loans, past due
- Past due less than 31 days 1 254 445 (88 862) 1 165 583 - Past due 31 - 90 days 637 780 (123 047) 514 733
Impaired loans - Not past due 13 832 (3 605) 10 227 - Past due 31 - 90 days 195 (23) 172 - Past due 90 - 180 days 449 722 (139 807) 309 915 - Past due over 180 days 7 134 806 (4 453 859) 2 680 947
Total loans to retail customers 87 323 721 (5 097 041) 82 226 680 Reverse repurchase agreements with companies Loans for which no indications of impairment have been
identified on an individual basis, not past due 8 122 974 – 8 122 974 Other Loans for which no indications of impairment have been
identified on an individual basis, not past due 234 596 (39 245) 195 351 Impaired loans
- Not past due 294 192 (142 839) 151 353 - Past due less than 31 days 2 961 (1 184) 1 777 - Past due 31 - 90 days 15 684 (13 293) 2 391 - Past due 90 - 180 days 809 (809) –
Total other 548 242 (197 370) 350 872 Total loans to customers 488 475 403 (15 777 309) 472 698 094
Key assumptions and judgments for estimating the loan impairment
Loan impairment results from one or more events that occurred after the initial recognition of the loan and that have an impact on the estimated future cash flows associated with the loan, and that can be reliably estimated. Loans without individual signs of impairment do not have objective evidence of impairment that can be directly attributed to them.

ZAO UniCredit Bank Notes to the Consolidated Financial Statements
(Thousands of Russian Roubles)
26
10. Loans to customers (continued)
The objective indicators of loan impairment for loans to corporate customers include the following:
• a breach of contract, such as a default or delinquency in interest or principal payments;
• significant difficulties in the financial conditions of the borrower;
• deterioration in business environment, negative changes in the borrower’s markets.
The Group estimates loan impairment for loans to corporate customers based on an analysis of the future cash flows for impaired loans and based on its past loss experience for portfolios of loans for which no indications of impairment has been identified.
In determining the impairment allowance for loans to corporate customers, management makes the following general key assumptions:
• The principal collateral taken into account in the estimation of future cash flows comprises marketable collateral, mainly real estate. Valuations for real estate have been discounted by 30-40 percent depending on type of the real estate to reflect current market conditions.
• a delay of 12 months in obtaining proceeds from the foreclosure of collateral.
Changes in these estimates could affect the loan impairment provision. For example, to the extent that the net present value of the estimated cash flows differs by one percent, the impairment allowance on loans to corporate customers as at 31 December 2012 would be RUB 3 762 181 thousand lower/higher (2011: RUB 3 819 976 thousand lower/higher).
The Group estimates loan impairment for loans to retail customers based on its internal model which takes into account historical loss experience on each type of loan, probability of default and loss given default.
In determining the impairment allowance for loans to retail customers, management makes the following key assumptions:
• loss given default rate varies from 10% to 100% depending on the risk profile of the portfolio;
• probability of default varies from 0.11% to 100 %.
Changes in these estimates could effect the loan impairment provision. For example, to the extent that the net present value of the estimated cash flows differs by plus minus one percent, the impairment allowance on loans to retail customers as at 31 December 2012 would be RUB 1 113 137 thousand lower/higher (2011: RUB 822 267 thousand).
Impaired loans
Accrued interest income on impaired loans as at 31 December 2012 comprised RUB 722 617 thousand (31 December 2011: RUB 718 461 thousand).
Collateral and other credit enhancements
The amount and type of collateral required depends on an assessment of the credit risk of the counterparty as well as on the nature of the transaction. Guidelines are implemented regarding the acceptability of types of collateral and valuation parameters.
The main types of collateral obtained are as follows:
• for reverse repurchase transactions, securities; • for commercial lending to corporate customers, pledge over real estate properties, inventories and trade receivables; • for retail lending, mortgages over residential properties and motor vehicles.
The primary purpose of collateral arrangements is to reduce the potential credit loss in case of a workout of the credit exposure. Estimates of value are based on the value of collateral assessed at the time of borrowing.

ZAO UniCredit Bank Notes to the Consolidated Financial Statements
(Thousands of Russian Roubles)
27
10. Loans to customers (continued)
Collateral and other credit enhancements (continued) The following table shows the fair value of collateral and other credit enhancements, excluding overcollateralization, securing loans to corporate customers (including Reverse repurchase agreements with companies), net of impairment, by types of collateral as at 31 December 2012:
Fair value of collateral
– for collateral assessed as of reporting date
Fair value of collateral
– for collateral assessed as of loan
inception date Loans to customers,
carrying amount Loans for which no indications of impairment have been identified on an individual basis Securities – 18 896 916 18 896 916 Real estate 36 654 895 – 36 654 895 Motor vehicles – 7 862 270 7 862 270 Guarantees – 8 183 107 8 183 107 Other collateral – 140 526 111 140 526 111 No collateral or other credit enhancement – – 174 230 309 Gross loans for which no indications of impairment have been identified on an individual basis 36 654 895 175 468 404 386 353 608 Impaired loans Securities – 105 943 105 943 Real estate 3 796 472 – 3 796 472 Motor vehicles – 119 761 119 761 Guarantees – 33 082 33 082 Other collateral – 7 991 785 7 991 785 No collateral or other credit enhancement – – 4 147 029 Gross impaired loans 3 796 472 8 250 571 16 194 072 Total gross loans to corporate customers 40 451 367 183 718 975 402 547 680 Allowance for loan impairment (9 666 284) Total loans to corporate customers 392 881 396

ZAO UniCredit Bank Notes to the Consolidated Financial Statements
(Thousands of Russian Roubles)
28
10. Loans to customers (continued)
The following table shows the fair value of collateral and other credit enhancements, excluding overcollateralization, securing loans to corporate customers (including Reverse repurchase agreements with companies), net of impairment, by types of collateral as at 31 December 2011:
Fair value of collateral
- for collateral assessed as of reporting date
Fair value of collateral
– for collateral assessed as of loan
inception date Loans to customers,
carrying amount Loans for which no indications of impairment have been identified on an individual basis Securities 12 904 697 12 904 697 Real estate 38 662 614 – 38 662 614 Motor vehicles – 5 763 449 5 763 449 Guarantees – 7 380 187 7 380 187 Other collateral – 151 213 342 151 213 342 No collateral or other credit enhancement – – 165 393 197 Gross loans for which no indications of impairment have been identified on an individual basis 38 662 614 177 261 675 381 317 486 Impaired loans Securities 719 315 719 315 Real estate 3 142 297 – 3 142 297 Motor vehicles – 119 327 119 327 Guarantees – 28 600 28 600 Other collateral – 6 267 879 6 267 879 No collateral or other credit enhancement – – 9 008 536 Gross impaired loans 3 142 297 7 135 121 19 285 954 Total gross loans to corporate customers 41 804 911 184 396 796 400 603 440 Allowance for loan impairment (10 482 898) Total loans to corporate customers 390 120 542

ZAO UniCredit Bank Notes to the Consolidated Financial Statements
(Thousands of Russian Roubles)
29
10. Loans to customers (continued)
The following table shows the fair value of collateral and other credit enhancements, excluding overcollateralization, securing loans to retail customers, net of impairment, by types of collateral as at 31 December 2012:
Fair value of collateral
– for collateral assessed as of reporting date
Fair value of collateral
– for collateral assessed as of loan
inception date Loans to customers,
carrying amount Standard loans, including past due Real estate 24 647 519 – 24 647 519 Motor vehicles – 60 641 950 60 641 950 Guarantees – 40 251 40 251 Other collateral – 2 213 182 2 213 182 No collateral or other credit enhancement – – 22 192 720 Gross standard loans 24 647 519 62 895 383 109 735 622 Impaired loans Real estate 3 072 840 – 3 072 840 Motor vehicles – 1 711 869 1 711 869 Other collateral – 62 281 62 281 No collateral or other credit enhancement – – 2 972 500 Gross overdue or impaired loans 3 072 840 1 774 150 7 819 490 Total gross loans to retail customers 27 720 359 64 669 533 117 555 112 Allowance for loan impairment (6 241 434) Total loans to retail customers 111 313 678 The following table shows the fair value of collateral and other credit enhancements, excluding overcollateralization, securing loans to retail customers, net of impairment, by types of collateral as at 31 December 2011:
Fair value of collateral
– for collateral assessed as of reporting date
Fair value of collateral
– for collateral assessed as of loan
inception date Loans to customers,
carrying amount Standard loans, including past due Real estate 22 142 298 – 22 142 298 Motor vehicles – 33 909 430 33 909 430 Guarantees – 247 921 247 921 Other collateral – 1 450 436 1 450 436 No collateral or other credit enhancement – – 21 975 081 Gross standard loans 22 142 298 35 607 787 79 725 166 Impaired loans Real estate 2 608 391 – 2 608 391 Motor vehicles – 238 699 238 699 Other collateral – 35 225 35 225 No collateral or other credit enhancement – – 4 716 240 Gross overdue or impaired loans 2 608 391 273 924 7 598 555 Total gross loans to retail customers 24 750 689 35 881 711 87 323 721 Allowance for loan impairment (5 097 041)
Total loans to retail customers 82 226 680
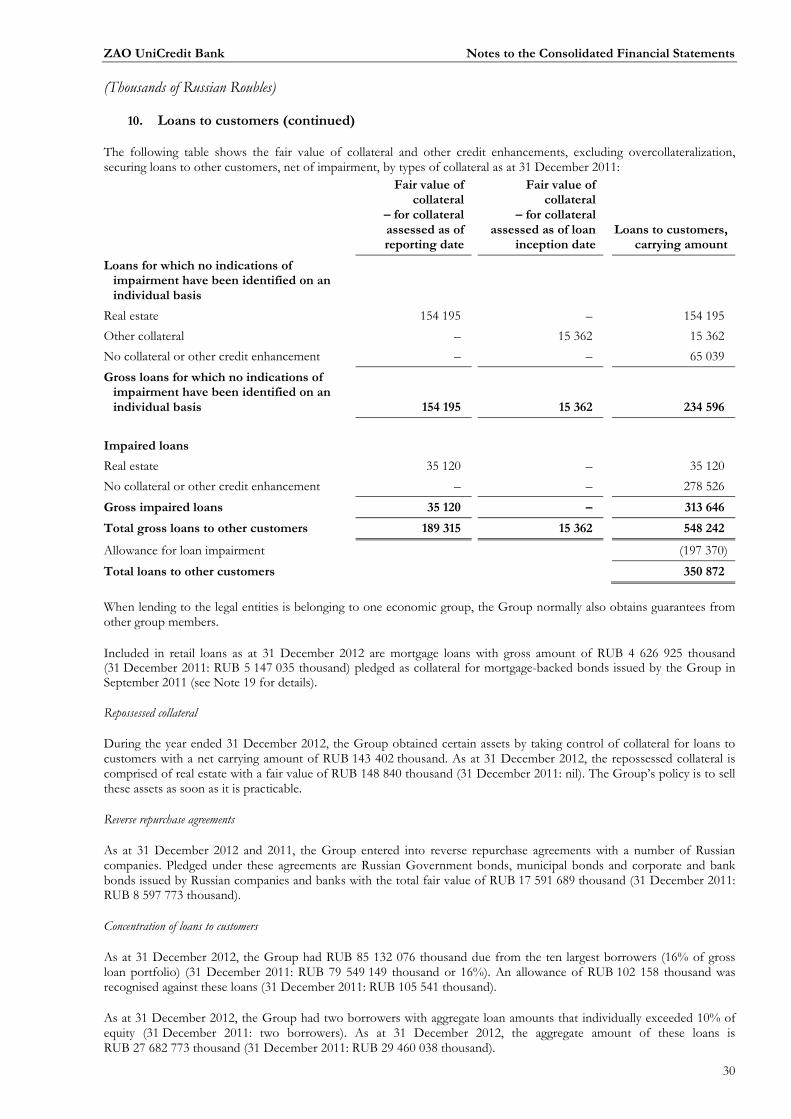
ZAO UniCredit Bank Notes to the Consolidated Financial Statements
(Thousands of Russian Roubles)
30
10. Loans to customers (continued)
The following table shows the fair value of collateral and other credit enhancements, excluding overcollateralization, securing loans to other customers, net of impairment, by types of collateral as at 31 December 2011:
Fair value of collateral
– for collateral assessed as of reporting date
Fair value of collateral
– for collateral assessed as of loan
inception date Loans to customers,
carrying amount Loans for which no indications of
impairment have been identified on an individual basis
Real estate 154 195 – 154 195 Other collateral – 15 362 15 362 No collateral or other credit enhancement – – 65 039
Gross loans for which no indications of impairment have been identified on an individual basis 154 195 15 362 234 596
Impaired loans Real estate 35 120 – 35 120 No collateral or other credit enhancement – – 278 526
Gross impaired loans 35 120 – 313 646 Total gross loans to other customers 189 315 15 362 548 242
Allowance for loan impairment (197 370)
Total loans to other customers 350 872
When lending to the legal entities is belonging to one economic group, the Group normally also obtains guarantees from other group members.
Included in retail loans as at 31 December 2012 are mortgage loans with gross amount of RUB 4 626 925 thousand (31 December 2011: RUB 5 147 035 thousand) pledged as collateral for mortgage-backed bonds issued by the Group in September 2011 (see Note 19 for details).
Repossessed collateral
During the year ended 31 December 2012, the Group obtained certain assets by taking control of collateral for loans to customers with a net carrying amount of RUB 143 402 thousand. As at 31 December 2012, the repossessed collateral is comprised of real estate with a fair value of RUB 148 840 thousand (31 December 2011: nil). The Group’s policy is to sell these assets as soon as it is practicable.
Reverse repurchase agreements
As at 31 December 2012 and 2011, the Group entered into reverse repurchase agreements with a number of Russian companies. Pledged under these agreements are Russian Government bonds, municipal bonds and corporate and bank bonds issued by Russian companies and banks with the total fair value of RUB 17 591 689 thousand (31 December 2011: RUB 8 597 773 thousand).
Concentration of loans to customers
As at 31 December 2012, the Group had RUB 85 132 076 thousand due from the ten largest borrowers (16% of gross loan portfolio) (31 December 2011: RUB 79 549 149 thousand or 16%). An allowance of RUB 102 158 thousand was recognised against these loans (31 December 2011: RUB 105 541 thousand).
As at 31 December 2012, the Group had two borrowers with aggregate loan amounts that individually exceeded 10% of equity (31 December 2011: two borrowers). As at 31 December 2012, the aggregate amount of these loans is RUB 27 682 773 thousand (31 December 2011: RUB 29 460 038 thousand).
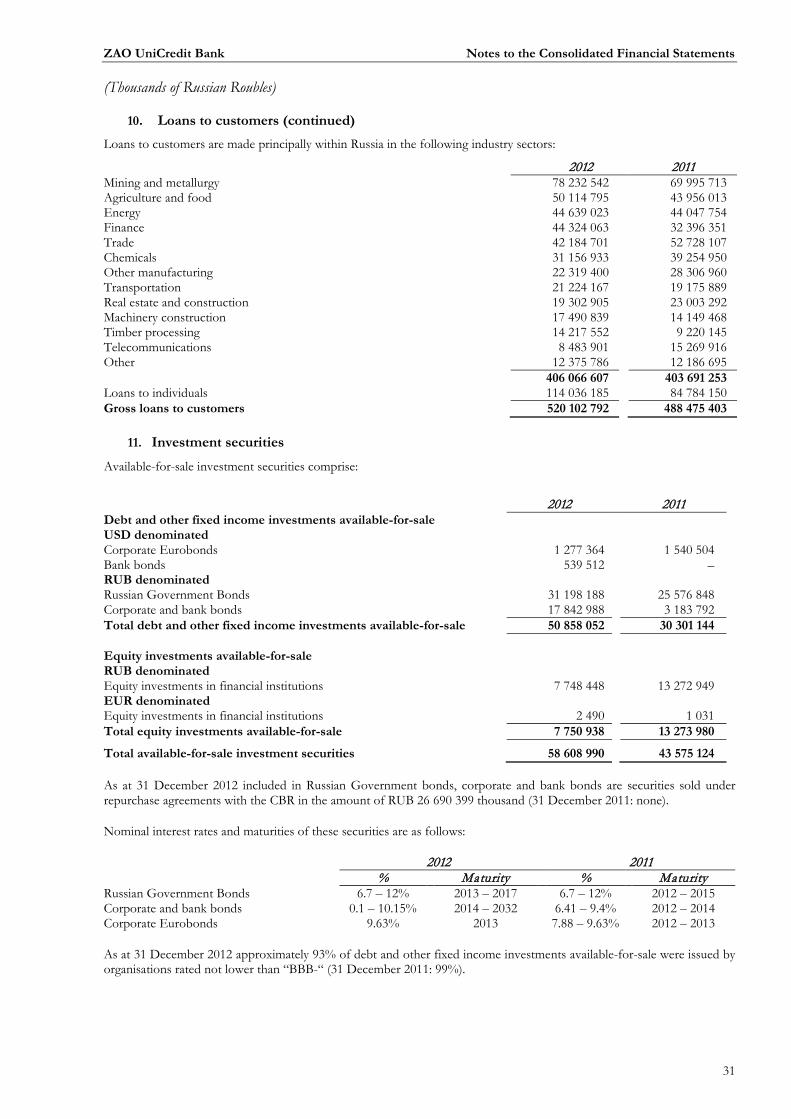
ZAO UniCredit Bank Notes to the Consolidated Financial Statements
(Thousands of Russian Roubles)
31
10. Loans to customers (continued) Loans to customers are made principally within Russia in the following industry sectors:
2012 2011 Mining and metallurgy 78 232 542 69 995 713 Agriculture and food 50 114 795 43 956 013 Energy 44 639 023 44 047 754 Finance 44 324 063 32 396 351 Trade 42 184 701 52 728 107 Chemicals 31 156 933 39 254 950 Other manufacturing 22 319 400 28 306 960 Transportation 21 224 167 19 175 889 Real estate and construction 19 302 905 23 003 292 Machinery construction 17 490 839 14 149 468 Timber processing 14 217 552 9 220 145 Telecommunications 8 483 901 15 269 916 Other 12 375 786 12 186 695 406 066 607 403 691 253 Loans to individuals 114 036 185 84 784 150 Gross loans to customers 520 102 792 488 475 403
11. Investment securities
Available-for-sale investment securities comprise:
2012
2011 Debt and other fixed income investments available-for-sale USD denominated Corporate Eurobonds 1 277 364 1 540 504 Bank bonds 539 512 – RUB denominated Russian Government Bonds 31 198 188 25 576 848 Corporate and bank bonds 17 842 988 3 183 792 Total debt and other fixed income investments available-for-sale 50 858 052 30 301 144 Equity investments available-for-sale RUB denominated Equity investments in financial institutions 7 748 448 13 272 949 EUR denominated Equity investments in financial institutions 2 490 1 031 Total equity investments available-for-sale 7 750 938 13 273 980
Total available-for-sale investment securities 58 608 990 43 575 124 As at 31 December 2012 included in Russian Government bonds, corporate and bank bonds are securities sold under repurchase agreements with the CBR in the amount of RUB 26 690 399 thousand (31 December 2011: none).
Nominal interest rates and maturities of these securities are as follows:
2012 2011 % Maturity % Maturity
Russian Government Bonds 6.7 – 12% 2013 – 2017 6.7 – 12% 2012 – 2015 Corporate and bank bonds 0.1 – 10.15% 2014 – 2032 6.41 – 9.4% 2012 – 2014 Corporate Eurobonds 9.63% 2013 7.88 – 9.63% 2012 – 2013
As at 31 December 2012 approximately 93% of debt and other fixed income investments available-for-sale were issued by organisations rated not lower than “BBB-“ (31 December 2011: 99%).

ZAO UniCredit Bank Notes to the Consolidated Financial Statements
(Thousands of Russian Roubles)
32
11. Investment securities (continued)
As at 31 December 2012 included in debt and other fixed income investments available-for-sale are bonds blocked as collateral for “overnight” loans with the CBR in the amount of RUB 14 166 678 thousand (31 December 2011: RUB 18 460 096 thousand).
As at 31 December 2012 the Group has 135 835 335 shares in MICEX-RTS Open Joint Stock Company (hereinafter – “MICEX-RTS”), corresponding to 6.182% stake in the company. The revaluation of the Group’s stock is based on the price of RUB 57 per share. The Group reviewed information on actual market deals with MICEX-RTS shares during the second half of 2012, financial indicators of MICEX-RTS and other applicable market information and concluded that price of RUB 57 per share to be a best estimate of fair value of MICEX-RTS share as at 31 December 2012.
Net change in revaluation reserve for available-for-sale assets recognized in other comprehensive income in the amount of RUB 2 874 979 thousand includes RUB 2 320 363 thousand reclassified from equity to profit and loss and the remaining amount of RUB 554 616 thousand which relates to fair value changes of available-for-sale assets.
Held-to-maturity investment securities comprise:
2012 2011 Nominal value Carrying value Nominal value Carrying value
Corporate bonds 300 000 311 805 300 000 311 662 Held-to-maturity investment securities 311 805 311 662
Nominal interest rates and maturities of these securities are as follows:
2012 2011 % Maturity % Maturity Corporate bonds 7.95% 2014 7.95% 2014
12. Transfers of financial assets
As at 31 December 2012 transferred financial assets that are not derecognized in their entirety comprise:
Financial assets available for sale
Carrying amount of assets 26 690 399 Carrying amount of associated liabilities 25 357 504
The Group has transactions to sell securities classified as available-for-sale under agreements to repurchase and to purchase securities under agreements to resell (Note 11).
The securities sold under agreements to repurchase are transferred to a third party and the Group receives cash in exchange. These financial assets may be repledged or resold by counterparties in the absence of default by the Group, but the counterparty has an obligation to return the securities at the maturity of the contract. The Group has determined that it retains substantially all the risks and rewards of these securities and therefore has not derecognised them. These securities are presented as “pledged under sale and repurchase agreements” in Note 11. In addition, the Group recognises a financial liability for cash received as collateral included in deposits and balances from banks (Note 17).
These transactions are conducted under terms that are usual and customary to standard lending, as well as requirements determined by exchanges where the Group acts as intermediary.

ZAO UniCredit Bank Notes to the Consolidated Financial Statements
(Thousands of Russian Roubles)
33
13. Fixed assets
The movements in fixed assets were as follows:
Buildings
Computers and equipment
Other fixed assets
Leasehold improvements Total
Cost 1 January 2012 6 326 793 3 326 131 642 097 773 519 11 068 540 Additions 284 265 612 432 52 287 3 987 952 971 Disposals (23 648) (98 521) (51 832) – (174 001) 31 December 2012 6 587 410 3 840 042 642 552 777 506 11 847 510
Accumulated depreciation
1 January 2012 (974 999) (2 362 056) (510 214) (637 361) (4 484 630) Depreciation charge (175 540) (399 046) (65 519) (71 590) (711 695) Disposals 2 657 92 423 46 462 – 141 542 31 December 2012 (1 147 882) (2 668 679) (529 271) (708 951) (5 054 783)
Net book value: 31 December 2012 5 439 528 1 171 363 113 281 68 555 6 792 727
Buildings
Computers and equipment
Other fixed assets
Leasehold improvements Total
Cost 1 January 2011 4 214 454 2 758 283 628 535 769 962 8 371 234 Acquisition of subsidiary 282 660 16 527 4 747 – 303 934 Additions 2 102 135 628 900 50 985 3 557 2 785 577 Disposals (272 456) (77 579) (42 170) – (392 205) 31 December 2011 6 326 793 3 326 131 642 097 773 519 11 068 540
Accumulated depreciation
1 January 2011 (814 355) (2 008 443) (477 968) (530 234) (3 831 000) Acquisition of subsidiary (19 248) (12 793) (2 696) – (34 737) Depreciation charge (234 158) (402 599) (70 397) (107 127) (814 281) Disposals 92 762 61 779 40 847 – 195 388 31 December 2011 (974 999) (2 362 056) (510 214) (637 361) (4 484 630)
Net book value: 31 December 2011 5 351 794 964 075 131 883 136 158 6 583 910

ZAO UniCredit Bank Notes to the Consolidated Financial Statements
(Thousands of Russian Roubles)
34
14. Intangible assets
The movements in intangible assets and goodwill were as follows:
Intangible assets Goodwill Total Cost
1 January 2012 2 642 048 389 911 3 031 959 Additions 683 244 – 683 244 Disposals (13) – (13) 31 December 2012 3 325 279 389 911 3 715 190
Accumulated amortisation
1 January 2012 (1 287 801) – (1 287 801) Amortisation charge (452 845) – (452 845) Disposals 13 – 13 31 December 2012 (1 740 633) – (1 740 633)
Net book value: 31 December 2012 1 584 646 389 911 1 974 557
Intangible assets Goodwill Total Cost
1 January 2011 2 147 541 389 911 2 537 452 Acquisition of subsidiary 18 099 – 18 099 Additions 494 598 – 494 598 Disposals (18 190) – (18 190) 31 December 2011 2 642 048 389 911 3 031 959
Accumulated amortisation
1 January 2011 (950 407) – (950 407) Acquisition of subsidiary (7 176) – (7 176) Amortisation charge (348 408) – (348 408) Disposals 18 190 – 18 190 31 December 2011 (1 287 801) – (1 287 801)
Net book value: 31 December 2011 1 354 247 389 911 1 744 158
15. Taxation
The corporate income tax expense comprises:
2012 2011 Current tax charge 4 175 276 2 856 832 Deferred tax charge - origination of temporary differences 589 186 1 221 602 Income tax expense 4 764 462 4 078 434
Russian legal entities must file individual tax declarations. The tax rate for banks and companies for profits other than on state securities was 20% for 2012 and 2011. The tax rate for interest income on state securities was 15% for 2012 and 2011.

ZAO UniCredit Bank Notes to the Consolidated Financial Statements
(Thousands of Russian Roubles)
35
15. Taxation (continued)
The effective income tax rate differs from the statutory income tax rates. A reconciliation of the effective income tax rate and the statutory income tax rate is as follows:
2012 2011 Profit before tax 22 242 646 19 866 271 Statutory tax rate 20% 20% Theoretical income tax expense at the statutory rate 4 448 529 3 973 254 Effect of income taxed at lower tax rates (133 829) (88 285) Non-deductible costs and non-taxable income 449 762 199 145 Tax refund – (5 680) Income tax expense 4 764 462 4 078 434
Deferred tax assets and liabilities as at 31 December 2012 and 2011 comprise:
Assets Liabilities Net 2012 2011 2012 2011 2012 2011 Fixed and intangible assets 389 277 349 006 (858 511) (1 043 213) (469 234) (694 207) Trading securities and derivatives 2 815 422 2 427 709 (3 468 323) (2 410 475) (652 901) 17 234 Available-for-sale securities – – (1 478 454) (2 566 879) (1 478 454) (2 566 879) Loan impairment and credit related commitments 651 715 720 363 (929 468) (1 549 132) (277 753) (828 769) Deferred revenue 267 606 430 019 – – 267 606 430 019 Other items 692 828 908 349 (892 211) (119 979) (199 383) 788 370 Total deferred tax assets/(liabilities) 4 816 848 4 835 446 (7 626 967) (7 689 678) (2 810 119) (2 854 232)
Movement in deferred tax assets and liabilities during the year ended 31 December 2012 is presented in the table below:
1 January 2012 Recognised in profit or loss
Recognised in other comprehensive
income 31 December 2012 Fixed and intangible assets (694 207) 224 973 – (469 234) Trading securities and derivatives 17 234 (584 689) (85 446) (652 901) Available-for-sale securities (2 566 879) 369 680 718 745 (1 478 454) Loan impairment and credit related commitments (828 769) 551 016 – (277 753) Deferred revenue 430 019 (162 413) – 267 606 Other items 788 370 (987 753) – (199 383) (2 854 232) (589 186) 633 299 (2 810 119)
Movement in deferred tax assets and liabilities during the year ended 31 December 2011 is presented in the table below:
1 January 2011 Recognised in profit or loss
Recognised in other comprehensive
income 31 December 2011 Fixed and intangible assets (284 695) (409 512) – (694 207) Trading securities and derivatives 366 358 (505 755) 156 631 17 234 Available-for-sale securities – (655 203) (1 911 676) (2 566 879) Loan impairment and credit related commitments (542 429) (286 340) – (828 769) Deferred revenue 264 010 166 009 – 430 019 Other items 319 171 469 199 – 788 370 122 415 (1 221 602) (1 755 045) (2 854 232)

ZAO UniCredit Bank Notes to the Consolidated Financial Statements
(Thousands of Russian Roubles)
36
15. Taxation (continued)
Tax effect relating to components of other comprehensive income comprise:
2012 2011
Amount
before tax Tax
expense Amount
net-of-tax Amount
before tax Tax
expense Amount
net-of-tax Cash flow hedge reserve 427 233 (85 446) 341 787 (783 153) 156 631 (626 522) Revaluation reserve for available-for-sale securities (3 593 724) 718 745 (2 874 979) 9 558 383 (1 911 676) 7 646 707 Other comprehensive income (3 166 491) 633 299 (2 533 192) 8 775 230 (1 755 045) 7 020 185
16. Other assets and liabilities
Other assets comprise:
2012 2011 Advances, prepayments and deferred expenses 1 295 863 1 525 579 Settlements with derivatives clearers 255 758 435 658 Repossessed collateral 148 840 – Other 549 092 460 477 Other assets 2 249 553 2 421 714
Other liabilities comprise:
2012 2011 Accrued compensation expense 2 459 454 2 094 652 Liability arising on initial designation of fair value macro hedge 1 585 630 2 002 315 Accounts payable 902 960 606 961 Deferred income 584 339 574 548 Transit accounts 154 894 190 963 Taxes payables 174 695 156 922 Other provisions 16 327 66 991 Other 91 625 73 673 Other liabilities 5 969 924 5 767 025
17. Amounts due to credit institutions
Amounts due to credit institutions comprise:
2012 2011 Current accounts 13 954 824 5 526 661 Time deposits and loans 128 467 349 142 646 788 Repurchase agreements with credit institutions 30 010 875 – Subordinated debt (Note 20) 15 090 657 17 653 220 Amounts due to credit institutions 187 523 705 165 826 669
As at 31 December 2012, the ten largest deposits (excluding subordinated debt) represented 85% of total amounts due to credit institutions (31 December 2011: 94%).
As at 31 December 2012, the Group had three counterparties with aggregate balances that individually exceeded 10% of equity (31 December 2011: two counterparties). As at 31 December 2012, the aggregate amount of these balances is RUB 123 568 043 thousand (31 December 2011: RUB 105 970 692 thousand).
As at 31 December 2012 the Group has term deposits due to the CBR in the amount of RUB 26 057 855 thousand and repurchase agreements with CBR in the amount of 29 898 989 thousand (31 December 2011: none).

ZAO UniCredit Bank Notes to the Consolidated Financial Statements
(Thousands of Russian Roubles)
37
18. Amounts due to customers
The amounts due to customers include the following:
2012 2011 Current accounts 90 662 208 83 133 578 Time deposits 413 207 014 379 574 924 Subordinated debt (Note 20) – 214 048 Amounts due to customers 503 869 222 462 922 550
As at 31 December 2012, approximately 56% of total amounts due to customers (excluding subordinated debt) was placed with the Group by its ten largest customers (31 December 2011: 62%).
Analysis of customer accounts by type of customer is as follows:
2012 2011 Corporate Current accounts 32 149 917 25 898 985 Time deposits 377 159 952 353 854 069 Subordinated debt – 214 048 Total corporate accounts 409 309 869 379 967 102
Retail
Current accounts 58 512 291 57 234 593 Time deposits 36 047 062 25 720 855 Total retail accounts 94 559 353 82 955 448 Amounts due to customers 503 869 222 462 922 550
Included in retail time deposits are deposits of individuals in the amount of RUB 23 344 972 thousand (31 December 2011: RUB 17 522 930 thousand). In accordance with the Russian Civil Code, the Group is obliged to repay such deposits upon demand of the depositor. In case a term deposit is repaid upon demand of the depositor prior to maturity, the related interest rate on it is paid based on the interest rate for demand deposits, unless a different interest rate is specified in the contract. The remaining part of retail time deposits in the amount of RUB 12 702 090 thousand (31 December 2011: RUB 8 197 925 thousand) is represented by deposits placed by small business enterprises.
19. Debt securities issued
Debt securities issued consisted of the following:
2012 2011 Bonds issued 40 251 779 25 320 325 Promissory notes 540 968 512 857 Debt securities issued 40 792 747 25 833 182 On 2 March 2012 the Group placed a RUB 5 000 000 thousand bonds issue with a three-year maturity. The bonds each have a face value of RUB one thousand and carry six semi-annual interest coupons. The coupon rate was set as 8.5% for the first three semi-annual periods. In August 2013 the coupon rate will be set for the remaining three semi-annual periods. The Group has an obligation to buy the bonds back at their nominal value upon the bond holders request just before the end of the third semi-annual period. On 7 March 2012 the Group placed a RUB 5 000 000 thousand bonds issue with a three-year maturity. The bonds each have a face value of RUB one thousand and carry six semi-annual interest coupons. The coupon rate was set as 8.5% for the first three semi-annual periods. In September 2013 the coupon rate will be set for the remaining three semi-annual periods. The Group has an obligation to buy the bonds back at their nominal value upon the bond holders request just before the end of the third semi-annual period. On 26 October 2012 the Group placed a RUB 5 000 000 thousand bonds issue with a three-year maturity. The bonds each have a face value of RUB one thousand and carry six semi-annual interest coupons. The coupon rate was set as 9.1% for the first four semi-annual periods. In October 2014 the coupon rate will be set for the remaining two semi-annual periods. The Group has an obligation to buy the bonds back at their nominal value upon the bond holders request just before the end of the fourth semi-annual period.

ZAO UniCredit Bank Notes to the Consolidated Financial Statements
(Thousands of Russian Roubles)
38
19. Debt securities issued (continued)
On 30 October 2012 the Group placed a RUB 5 000 000 thousand bonds issue with a three-year maturity. The bonds each have a face value of RUB one thousand and carry six semi-annual interest coupons. The coupon rate was set as 9.1% for the first four semi-annual periods. In October 2014 the coupon rate will be set for the remaining two semi-annual periods. The Group has an obligation to buy the bonds back at their nominal value upon the bond holders request just before the end of the fourth semi-annual period. As at 31 December 2012 mortgage-backed bonds with the carrying value of RUB 5 123 224 thousand (31 December 2011: RUB 5 121 315 thousand) are secured by a pool of mortgage loans with the carrying value of RUB 4 626 925 thousand (31 December 2011: RUB 5 147 035 thousand) and by cash in the amount of RUB 862 000 thousand (31 December 2011: RUB 500 000 thousand) (see Note 6 and Note 10 for details).
20. Subordinated debt
2012 2011 UniCredit Bank Austria AG, Vienna
12 655 191
14 214 639
USD 30 000 thousand, semi-annual interest payment, maturing November 2012, LIBOR+2.5% p.a.; USD 50 000 thousand, semi-annual interest payment, maturing November 2013, LIBOR+1.43%p.a.; USD 100 000 thousand, semi-annual interest payment, maturing June 2014, LIBOR+1.43%p.a.; EUR 100 000 thousand, semi-annual interest payment, maturing November 2017,
EURIBOR+1.83% p.a.; EUR 100 000 thousand, semi-annual interest payment, maturing February 2018,
EURIBOR+2.15% p.a. UniCredit Bank AG
2 435 466
2 582 390
USD 30 000 thousand, semi-annual interest payment, maturing February 2013, LIBOR+2.3% p.a.; USD 50 000 thousand, semi-annual interest payment, maturing August 2013, LIBOR+1.5%p.a.
Deutsche Investitions-und Entwicklungsgesellschaft (DEG)
–
856 191 EUR 20 000 thousand, semi-annual interest payment, maturing January 2012, EURIBOR+4% p.a.
Finnish Fund for Industrial Cooperation Ltd., Helsinki EUR 5 000 thousand, semi-annual interest payment, maturing January 2012, EURIBOR+4% p.a. – 214 048 Subordinated Debt 15 090 657 17 867 268
21. Shareholder’s equity
As at 31 December 2012, the authorised, issued and outstanding share capital comprises 2 404 181 ordinary shares (31 December 2011: 1 809 651 ordinary shares) with a par value of RUB 16 820 each. During 2012, 594 530 ordinary shares were issued at their nominal value (2011: 188 703 ordinary shares).
22. Commitments and contingencies
Credit related commitments
2012 2011 Undrawn loan commitments 184 423 053 147 427 274 Guarantees issued 105 248 952 65 018 063 Letters of credit 13 502 933 15 646 415 Gross undrawn commitments, guarantees and letters of credit 303 174 938 228 091 752 Provisions for unrecognised commitments (21 978) – Total undrawn commitments, guarantees and letters of credit 303 152 960 228 091 752
The Group issues guarantees and letters of credit for its customers. These instruments bear a credit risk similar to that of loans granted. With respect to the documentary instruments shown above, as at 31 December 2012, collateral deposits of RUB 4 039 772 thousand were held by the Group (31 December 2011: RUB 5 528 605 thousand).
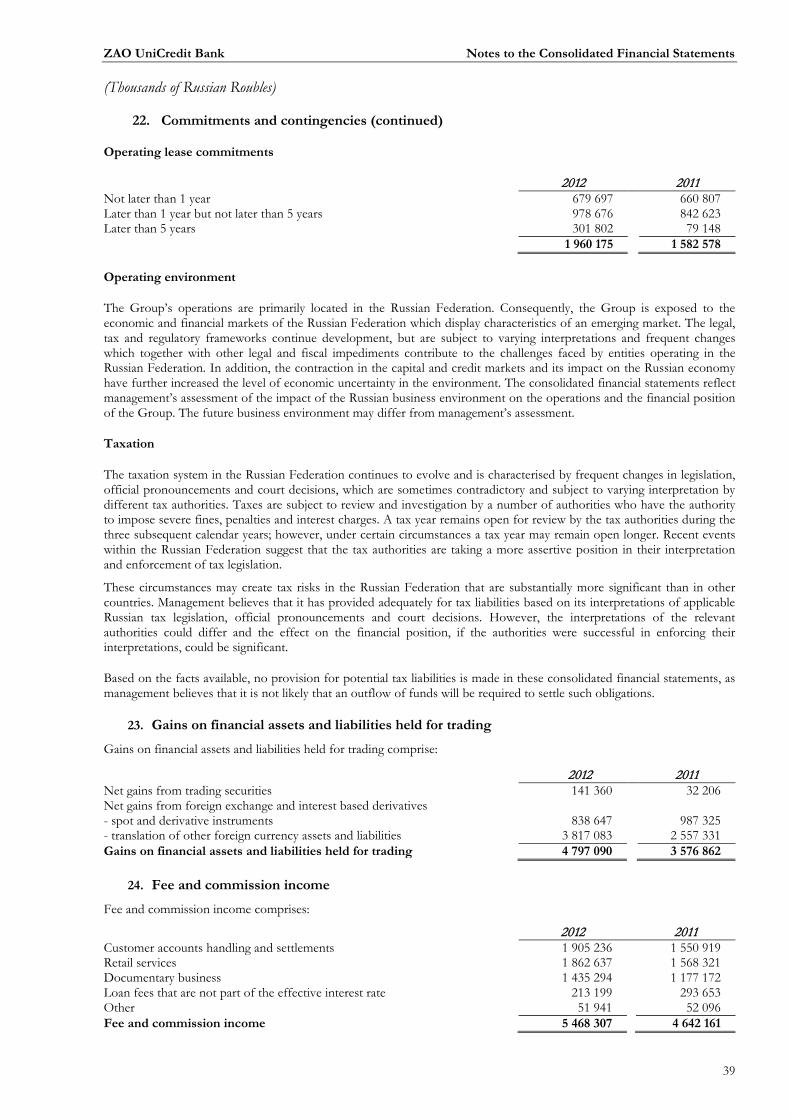
ZAO UniCredit Bank Notes to the Consolidated Financial Statements
(Thousands of Russian Roubles)
39
22. Commitments and contingencies (continued)
Operating lease commitments
2012 2011 Not later than 1 year 679 697 660 807 Later than 1 year but not later than 5 years 978 676 842 623 Later than 5 years 301 802 79 148 1 960 175 1 582 578
Operating environment
The Group’s operations are primarily located in the Russian Federation. Consequently, the Group is exposed to the economic and financial markets of the Russian Federation which display characteristics of an emerging market. The legal, tax and regulatory frameworks continue development, but are subject to varying interpretations and frequent changes which together with other legal and fiscal impediments contribute to the challenges faced by entities operating in the Russian Federation. In addition, the contraction in the capital and credit markets and its impact on the Russian economy have further increased the level of economic uncertainty in the environment. The consolidated financial statements reflect management’s assessment of the impact of the Russian business environment on the operations and the financial position of the Group. The future business environment may differ from management’s assessment.
Taxation
The taxation system in the Russian Federation continues to evolve and is characterised by frequent changes in legislation, official pronouncements and court decisions, which are sometimes contradictory and subject to varying interpretation by different tax authorities. Taxes are subject to review and investigation by a number of authorities who have the authority to impose severe fines, penalties and interest charges. A tax year remains open for review by the tax authorities during the three subsequent calendar years; however, under certain circumstances a tax year may remain open longer. Recent events within the Russian Federation suggest that the tax authorities are taking a more assertive position in their interpretation and enforcement of tax legislation.
These circumstances may create tax risks in the Russian Federation that are substantially more significant than in other countries. Management believes that it has provided adequately for tax liabilities based on its interpretations of applicable Russian tax legislation, official pronouncements and court decisions. However, the interpretations of the relevant authorities could differ and the effect on the financial position, if the authorities were successful in enforcing their interpretations, could be significant.
Based on the facts available, no provision for potential tax liabilities is made in these consolidated financial statements, as management believes that it is not likely that an outflow of funds will be required to settle such obligations.
23. Gains on financial assets and liabilities held for trading
Gains on financial assets and liabilities held for trading comprise:
2012 2011 Net gains from trading securities 141 360 32 206 Net gains from foreign exchange and interest based derivatives - spot and derivative instruments 838 647 987 325 - translation of other foreign currency assets and liabilities 3 817 083 2 557 331 Gains on financial assets and liabilities held for trading 4 797 090 3 576 862
24. Fee and commission income
Fee and commission income comprises:
2012 2011 Customer accounts handling and settlements 1 905 236 1 550 919 Retail services 1 862 637 1 568 321 Documentary business 1 435 294 1 177 172 Loan fees that are not part of the effective interest rate 213 199 293 653 Other 51 941 52 096 Fee and commission income 5 468 307 4 642 161

ZAO UniCredit Bank Notes to the Consolidated Financial Statements
(Thousands of Russian Roubles)
40
25. Personnel and other administrative expenses
Personnel and other administrative expenses comprise:
2012 2011 Salaries and bonuses 4 519 048 4 057 689 Social security costs 329 457 334 067 Other compensation expenses 240 980 195 941 Other employment taxes 860 449 660 747 Personnel expenses 5 949 934 5 248 444 Rent, repairs and maintenance 1 418 782 1 397 999 Communication and information services 601 425 579 302 Advertising and marketing 450 704 632 005 Security expenses 273 393 261 667 Other taxes 162 090 129 304 Legal, audit and other professional services 91 380 204 953 Insurance 63 960 50 515 Other 902 505 723 941 Other administrative expenses 3 964 239 3 979 686
26. Risk management
Management of risk is fundamental to the banking business and is an essential element of the Group’s operations. The Group has exposure to risks, which include credit, market, foreign exchange, liquidity, and operational risks. The Group’s aim is to maintain an appropriate balance between risks and return and to minimise potential adverse effect on the Group’s financial performance.
Risk management structure
The Group’s risk management policies aim to identify, analyse, measure and manage the risks taken by the Group, to establish appropriate risk limits and methods of monitoring, and to continuously monitor risk levels and compliance with the established limits. Risk management policies and procedures are reviewed regularly to reflect changes in market conditions, products and services offered and emerging best practice in risk management.
The operational risk management functions are aimed at developing and ensuring proper functioning of internal processes and procedures that minimise the Group’s exposure to internal and external risk factors.
The Supervisory Board of the Bank has overall responsibility for the oversight of the risk management framework, overseeing the management of key risks.
The Board of Management has overall responsibility for monitoring and implementation of risk mitigation measures and making sure that the Bank operates within the established risk parameters.
The Chief Risk Officer (hereinafter – “CRO”) is responsible for the overall risk management function, ensuring the implementation of common principles and methods for identifying, underwriting, measuring, managing and risk reporting for both financial and non-financial risks. The CRO is the Member of the Board of Management of the Bank.
Credit, market and liquidity risks, both at portfolio and transactional levels, are managed through a system of Credit Approval Authorities as well as an Asset and Liability Management Committee. In order to facilitate efficient decision-making, the Bank has established a hierarchy of Credit Approval Authorities, which includes four Credit Committees, including Large Credit Committee, Small Credit Committee, Special Credit Committee and Credit Committee of the Small and Medium Enterprises and several levels of joint and single personal approval authority, depending on amount of exposure, type and risk associated with a customer.

ZAO UniCredit Bank Notes to the Consolidated Financial Statements
(Thousands of Russian Roubles)
41
26. Risk management (continued)
Risk management structure (continued)
Credit risk policies and underwriting guidelines are under the CRO’s responsibility. Internal local policies, rules, guidelines and operational instructions for lending to individuals and to the Small and Medium Enterprises (hereinafter – “SME”) are in line with Group Credit Policies and agreed with CRO and approved by the Board of Management of the Bank (excluding operational instructions which are approved by the Head of responsible Unit). The four-eyes principle is applied for the credit decision-making process. Credit approval authority is exercised through the submission and approval of a credit application. For standardized products in lending process to individuals decision-making is done by Operations Function, to which CRO Function delegates authority through respective underwriting guidelines and rules and/or implementation of credit scoring. For standardized products in lending process to SMEs decision-making is done by Business Function, to which CRO Function delegates authority through respective guidelines and rules. All deviations/exceptions from standardized products have to be approved by the CRO.
The Group’s risk underwriting, assessment, reporting and control procedures vary by risk type, but share a common principle to be concentrated under the supervision of the CRO.
Credit risk
Credit risk is the risk of financial loss occurring as a result of default by a borrower or counterparty on their obligation to the Group and arises principally from the Group’s loans to customers and credit institutions and other unrecognised credit exposures.
For risk management purposes, credit risk arising from positions in trading securities is managed and reported on a daily basis.
Credit risk governance
Credit risk management policies, procedures and manuals are approved by the Board of Management of the Bank.
The following Credit Committees are responsible for approving corporate and retail credit risk exposures:
• The Large Credit Committee reviews and approves all loan/credit applications from customers and issuers above EUR 10 million or equivalent in other currencies. It is chaired by President of the Board of Management and meets on a weekly basis;
• The Small Credit Committee reviews and approves all loan/credit applications from customers in the amount up to EUR 10 million or equivalent in other currencies. It is chaired by the Head of Credit Underwriting Department and meets on a weekly basis;
• The Credit Committee of the SME is responsible for approval of the loan applications of SME in the amount up to EUR 1 million or equivalent in other currencies. The Committee meets once in a two-week period;
• The Special Credit Committee is responsible for considerations of the applications related to restructuring/refinancing of problem debts.
The Bank also has a system of personal credit approval authorities with the four-eyes principle in place – approval is done jointly by representatives from both business and risk functions; for SME lending process proposal is done by business function and approval is done by risk function.
All credit exposures above EUR 30 million or equivalent in other currencies as well as restructuring/refinancing applications above EUR 15 million have to be approved by the UniCredit Group (by the authorized members of Supervisory Board).
The Group limits concentrations of exposure to individual customers, counterparties and issuers (for securities), as well as groups of related customers. Exposure to credit risk is managed through regular analysis of the borrower’s creditworthiness and by changing/adjusting lending limits where appropriate.
The Group’s credit policies and product guidelines establish:
• procedures and standards for approval and review of loan/credit applications; • methodology for the credit assessment of borrowers (corporate, retail); • methodology for the credit assessment of counterparties, issuers and insurance companies; • methodology for the evaluation of collateral; • credit documentation requirements; • procedures for the ongoing monitoring of loans and other credit exposures.

ZAO UniCredit Bank Notes to the Consolidated Financial Statements
(Thousands of Russian Roubles)
42
26. Risk management (continued)
Credit risk (continued)
Credit risk governance (continued)
The relevant relationship managers and Corporate Lending Department originate corporate loan/credit applications jointly. The application could be solely prepared by relationship managers, depending on the respective authority granted to a given relationship manager. The credit applications consist of a structured analysis focusing on the customer’s business and financial performance. The loan/credit applications are then independently reviewed by the Credit Underwriting and a second opinion is given accompanied by a check that credit policy requirements have been met. The relevant Approval Authority reviews the loan/credit application accompanied by the Credit Underwriting opinion.
In order to provide better assessment of customers’ creditworthiness, separate units specialising on analysis of different industries were created within the Credit Underwriting department. This business model allows the Bank to quickly and thoroughly analyse changes in various industries, adjust strategies and take adequate decisions. Along with the industry divisioning there is also a set of regional risk managers that monitor the situation in the main regions of Bank’s operations. This allows the Bank to manage its credit portfolio both on industry and regional levels.
Credit portfolio diversification by client types (large corporate clients, SME, individual clients) and industries allows the Bank to maintain high credit portfolio quality. In order to provide an adequate risk assessment, the Bank uses various internal rating models which take into account specifics of different client segments, provides effective differentiation of clients by credit risk level and precise assessment of their probability of default in accordance with Basel II principles. Internal ratings are used in credit decision-making, pricing, capital allocation and risk management processes.
All existing credit deals/approved limits for corporate clients are subject to annual review according to the procedure similar to that for the approval of the credit application.
The Bank continuously monitors the performance of individual credit exposures and regularly reassesses the creditworthiness of its customers. The review is based on the customer’s most recent financial statements and other information submitted by the borrower, or otherwise obtained by the Bank. As the result of the review, the borrower’s internal credit rating may be changed. The Bank monitors concentrations of credit risk by industry/sector and by the exposure to top 10, 50 and 100 borrowers.
Retail loan applications are approved according to internal local policies, rules, guidelines and operational instructions for lending to individuals and SME. Information is obtained on every customer. The extent of the information required and frequency of its update depend on the regulatory requirements, the customer category, creditworthiness of the customer and type of a transaction. The business unit obtains and analyzes the information from different sources (information from the customer, on-site visits, internal/external sources).
In order to reduce the risk of potential losses in the Bank’s credit transactions a Monitoring Unit was established. The Unit implements procedures for systematic identification and assessment of negative signals, analysis and situation monitoring as well as strategies and action plans for potentially troubled corporate borrowers.
The Group continues active work to manage and decrease the problem loan portfolio. During 2011 the Restructuring Department of the Bank
Settlement risk
further developed and improved the systemic approach for handling problem loans. Under Watch List procedures monitoring of corporate customers and warning signals were applied on a daily basis.
The Group’s activities may give rise to settlement risk at the time of settlement of transactions. Settlement risk is the risk of loss due to the failure of counterparty to honour its obligations to deliver cash, securities or other assets as contractually agreed.
For certain types of transactions the Group mitigates this risk by conducting settlements through settlement/clearing agents to ensure that a trade is settled only when both parties have fulfilled their contractual settlement obligations. Acceptance of settlement risk on free settlement transactions requires transaction specific and/or counterparty specific settlement limits that form part of the counterparty limit approval/monitoring process described above.

ZAO UniCredit Bank Notes to the Consolidated Financial Statements
(Thousands of Russian Roubles)
43
26. Risk management (continued)
Credit risk (continued)
Settlement risk (continued)
The table below shows the maximum exposure to credit risk for the components of the statement of financial position, including derivatives. The maximum exposure is shown gross, before the effect of mitigation through the use of master netting and collateral agreements.
Notes
Maximum gross exposure
31 December 2012
Maximum gross exposure
31 December 2011
Cash and cash balances (excluding cash on hand) 6 15 711 756 16 795 816 Trading securities: 7 4 340 528 1 938 722 Amounts due from credit institutions 8 246 446 188 200 143 375 Derivative financial assets 9 10 064 303 12 867 079 Derivative financial assets designated for hedging 9 7 350 086 3 776 683 Loans to customers 10 504 195 074 472 698 094 Investment securities: 11
- available-for-sale - held by the Group 31 918 591 43 575 124 - pledged under repurchase agreement 26 690 399 –
- held-to-maturity 311 805 311 662 Investments in associate 979 435 929 032 Other assets 16 1 551 621 1 961 237 849 559 786 754 996 824 Financial commitments and contingencies 22 303 152 960 228 091 752 Total credit risk exposure 1 152 712 746 983 088 576
Where financial instruments are recorded at fair value, the amounts shown above represent the current credit risk exposure but not the maximum risk exposure that could arise in the future as a result of changes in values.
The credit quality of financial assets is managed by the Bank using internal credit ratings. The table below shows the credit quality by class of asset for consolidated statement of financial position items, based on the Bank's credit rating system as at 31 December 2012 and 2011:
Neither past due nor impaired Past due or impaired Total 2012 Notes High grade Standard
Cash and cash balances (excluding cash on hand) 6 15 711 756 – – 15 711 756 Trading securities 7 4 340 528 – – 4 340 528 Amounts due from credit institutions 8 246 446 188 – – 246 446 188 Derivative financial assets 9 10 064 303 – – 10 064 303 Derivative financial assets designated for hedging 9 7 350 086 – – 7 350 086 Loans to customers 10
Corporate customers 205 348 641 162 913 328 7 956 226 376 218 195 Retail customers 82 858 599 22 857 829 5 597 250 111 313 678 Reverse repurchase agreements with companies 16 663 201 – – 16 663 201
Investment securities: 11 - available-for-sale
- held by the Group 31 918 591 – – 31 918 591 - pledged under repurchase agreement 26 690 399 – – 26 690 399
- held-to-maturity 311 805 – – 311 805 Total 647 704 097 185 771 157 13 553 476 847 028 730

ZAO UniCredit Bank Notes to the Consolidated Financial Statements
(Thousands of Russian Roubles)
44
26. Risk management (continued)
Credit risk (continued)
Neither past due nor impaired Past due or impaired Total 2011 Notes High grade Standard
Cash and cash balances (excluding cash on hand) 6 16 795 816 – – 16 795 816 Trading securities 7 1 938 722 – – 1 938 722 Amounts due from credit institutions 8 200 143 375 – – 200 143 375 Derivative financial assets 9 12 867 079 – – 12 867 079 Derivative financial assets designated for hedging 9 3 776 683 – – 3 776 683 Loans to customers 10
Corporate customers 356 422 748 15 639 030 9 935 790 381 997 568 Retail customers 75 047 870 2 497 233 4 681 577 82 226 680 Reverse repurchase agreements with companies 8 122 974 – – 8 122 974 Other – 195 351 155 521 350 872
Investment securities: 11 - available-for-sale 43 575 124 – – 43 575 124 - held-to-maturity 311 662 – – 311 662
Total 719 002 053 18 331 614 14 772 888 752 106 555
Liquidity risk and funding management
Liquidity risk refers to the availability of sufficient funds to meet deposit withdrawals and other financial commitments associated with financial instruments as they actually fall due. Liquidity risk exists when the maturities of assets and liabilities do not match. The matching and/or controlled mismatching of the maturities and interest rates of assets and liabilities is fundamental to the management of financial institutions. It is unusual for financial institutions ever to be completely matched since a lot of business transactions are of uncertain term and different types. An unmatched position could potentially enhance profitability, but also could increase the risk of failure to meet obligations.
The approach to liquidity management is to ensure, as far as possible, that the Group always has sufficient liquidity to meet its obligations, under both normal and stressed conditions, without incurring unacceptable losses or risking damage to the Group reputation.
Assets and Liabilities Committee (hereinafter – “ALCO”) is responsible for management of liquidity risk of the Bank. ALCO delegates to the Finance Department and Markets Department the responsibility to monitor and maintain within limits the Bank’s liquidity profile on a daily basis. At the same time Market Risk Unit controls compliance with liquidity limits and informs ALCO in case of limit breaches. Both Finance Department and Market Risk Unit report to local and to the UniCredit Group ALCO on a weekly basis.
According to the liquidity management policy:
1. The approach to funding and structural liquidity is described in the annual funding plan, which is based on annual budget data. On a monthly basis, the funding plan is updated taking into account the current recognised and unrecognised positions, changes in the asset and liability mismatches of the Bank, available funding sources and market analysis. The Bank has adopted contingency funding plans, the UniCredit Group standard risk management instrument, which describes potential funding sources in case of crisis situation. The contingency funding plan is updated in the event of crisis, but at least once a year by ALCO, after annual funding plan approval.
2. Structural liquidity of the Bank is analysed by Finance Department using the liquidity gap approach and reported to
local ALCO and to the UniCredit Group on a weekly basis. Liquidity limits and requirements both established by the UniCredit Group and the CBR are taken into account.

ZAO UniCredit Bank Notes to the Consolidated Financial Statements
(Thousands of Russian Roubles)
45
26. Risk management (continued)
Liquidity risk and funding management (continued)
3. Short-term liquidity is monitored on the basis of cash flow models in total and separately by major currencies: • Scenarios (going concern, market crisis, foreign exchange market crisis scenario, etc.) are assessed to forecast
future cash flows and corresponding liquidity needs for the nearest three months. Market crisis scenario includes “haircuts” to liquid security positions, failure of Bank’s counterparties to meet their obligations with regard to money market deals, run on retail deposits, inability to make swaps at reasonable prices, etc. Decisions with regard to switches between going-concern and crisis scenarios are taken by ALCO;
• ALCO sets limits on cash flow positions that depend on available liquidity sources and level of liquid assets (portfolio of assets that can be quickly liquidated to meet obligations without significant price decline).
4. Funding structure concentration is monitored and managed on a constant basis:
• ALCO sets an internal limit on the maximum volume of borrowings from a single group of clients; • Reports on customer funds concentration are reported to management and analyzed on a weekly basis.
5. Liquidity ratios in line with regulatory requirements (the CBR) are to be monitored and met: • On daily basis Finance Department evaluates N2 and calculates projections of N4 ratio for one month horizon.
Markets Department calculates projections of N3 ratio for one month horizon: o Instant liquidity Ratio (N2) is the ratio of liquid assets to sight and overnight liabilities; o Current liquidity ratio (N3) is the ratio of liquid assets to liabilities maturing within 30 calendar days; o Long-term liquidity ratio (N4) is the ratio of assets maturing after one year to the sum of capital and
liabilities maturing after one year.
As at 31 December 2012 and 2011, these ratios were as follows:
2012, % 2011, % N2 “Instant liquidity Ratio” (minimum 15%) 85.0 108.9 N3 “Current Liquidity Ratio” (minimum 50%) 84.4 66.4 N4 “Long-Term Liquidity Ratio” (maximum 120%) 92.7 98.5 The following table shows the liquidity gap profile as at 31 December 2012. This information is prepared using the internal Assets and Liabilities Management system according to the approved internal approach. The mapping approach is compliant with the requirements of the UniCredit Group liquidity policy. This information is used internally for risk management purposes and differs from financial statement amounts.

ZAO UniCredit Bank Notes to Consolidated Financial Statements
(Thousands of Russian Roubles)
46
26. Risk management (continued)
Liquidity risk and funding management (continued)
The information presented below relates to assets and liabilities of the Bank only prepared using statutory accounting methods. The table below presents the liquidity gap profile according to the approved internal approach as at 31 December 2012:
2012
Less than
1 month 1 month to
3 months 3 months to
6 months 6 months to
1 year 1 year to
3 years More than
3 years No stated
maturity Total Assets Cash and cash balances 24 020 106 – – – – – – 24 020 106 Trading securities 3 040 854 – – 1 300 000 – – – 4 340 854 Amounts due from credit institutions 228 764 840 17 496 012 – – – – – 246 260 852 Loans to customers 58 954 315 24 613 023 37 923 894 106 670 883 172 375 747 103 004 837 – 503 542 699 Investment securities:
- available-for-sale 1 450 865 7 607 592 – – 24 407 672 17 476 004 7 742 614 58 684 747 - held-to-maturity – – – – 302 430 – – 302 430
Fixed assets – – – – – – 6 793 444 6 793 444 Other assets 106 – – 5 914 902 – – – 5 915 008 Total assets 316 231 086 49 716 627 37 923 894 113 885 785 197 085 849 120 480 841 14 536 058 849 860 140 Liabilities Amounts due to credit institutions 106 168 653 10 650 450 8 264 719 4 165 200 45 665 264 12 437 419 – 187 351 705 Amounts due to customers
- current accounts 48 709 370 3 765 925 3 765 925 4 518 393 7 262 792 21 664 608 – 89 687 013 - time deposits 244 515 038 49 131 447 30 370 688 33 306 777 38 515 523 17 479 054 – 413 318 527
Debt securities issued – – – 514 439 34 520 212 5 000 000 – 40 034 651 Other liabilities 6 723 – – 6 318 963 – – – 6 325 686 Equity – – – – – – 113 142 558 113 142 558 Total equity and liabilities 399 399 784 63 547 822 42 401 332 48 823 772 125 963 791 56 581 081 113 142 558 849 860 140 Net position (83 168 698) (13 831 195) (4 477 438) 65 062 013 71 122 058 63 899 760 (98 606 500) – Accumulated gap (83 168 698) (96 999 893) (101 477 331) (36 415 318) 34 706 740 98 606 500 –
The Group estimates that the negative accumulated gap in 1 month to 1 year periods will be sufficiently covered by the Group’s money market daily borrowing capacity, issue of unsecured bonds and secured refinancing with the CBR.

ZAO UniCredit Bank Notes to Consolidated Financial Statements
(Thousands of Russian Roubles)
47
26. Risk management (continued)
Liquidity risk and funding management (continued)
The table below presents the liquidity gap profile according to the approved internal approach as at 31 December 2011:
2011
Less than
1 month 1 month to
3 months 3 months to
6 months 6 months to
1 year 1 year to
3 years More than
3 years No stated
maturity Total Assets Cash and cash balances 24 468 219 – – – – – – 24 468 219 Trading securities 1 536 718 – 240 000 162 004 – – – 1 938 722 Amounts due from credit institutions 88 864 121 1 054 433 5 070 000 8 164 231 96 508 909 149 119 – 199 810 813 Loans to customers 18 625 579 24 710 798 46 858 279 93 141 957 196 212 739 92 258 403 – 471 807 755 Investment securities:
- available-for-sale 26 732 310 – 1 268 221 2 300 612 – – 13 273 230 43 574 373 - held-to-maturity – – – – 311 964 – – 311 964
Fixed assets – – – – – – 6 583 910 6 583 910 Other assets 10 676 – – 4 663 127 – – – 4 673 803 Total assets 160 237 623 25 765 231 53 436 500 108 431 931 293 033 612 92 407 522 19 857 140 753 169 559 Liabilities Amounts due to credit institutions 55 455 024 39 835 575 10 854 806 6 690 612 35 751 622 18 076 406 – 166 664 045 Amounts due to customers
- current accounts 48 925 782 3 785 124 3 683 502 7 047 308 697 343 18 881 860 – 83 020 919 - time deposits 181 916 404 14 603 865 10 298 981 15 764 778 152 805 942 3 947 163 – 379 337 133
Debt securities issued – – – 10 832 852 10 000 000 5 000 330 – 25 833 182 Other liabilities 98 142 – – 9 081 390 – 10 899 – 9 190 431 Equity – – – – – – 89 123 849 89 123 849 Total equity and liabilities 286 395 352 58 224 564 24 837 289 49 416 940 199 254 907 45 916 658 89 123 849 753 169 559 Net position (126 157 729) (32 459 333) 28 599 211 59 014 991 93 778 705 46 490 864 (69 266 709) – Accumulated gap (126 157 729) (158 617 062) (130 017 851) (71 002 860) 22 775 845 69 266 709 –

ZAO UniCredit Bank Notes to Consolidated Financial Statements
(Thousands of Russian Roubles)
48
26. Risk management (continued)
Liquidity risk and funding management (continued)
Analysis of financial assets and liabilities by remaining contractual maturities
The tables below summarise the maturity profile of financial assets and liabilities as at 31 December 2012 and 31 December 2011 based on contractual undiscounted repayment obligations. Repayments which are subject to notice are treated as if notice were to be given immediately. However, the Group expects that many customers will not request repayment on the earliest date the Group could be required to pay. The tables do not reflect the expected cash flows indicated by the Bank’s deposit retention history.
Less than
1 month 1 month to
3 months 3 months to
6 months 6 to 12 months 1 year to
3 years More than
3 years Total Financial assets as at 31 December 2012 Cash and cash balances 24 020 106 – – – – – 24 020 106 Trading securities 4 340 528 – – – – – 4 340 528 Amounts due from credit institutions 225 980 319 19 172 622 455 486 495 743 554 768 965 922 247 624 860 Derivative financial assets: - Contractual amounts payable (20 095 181) (4 404 466) (4 697 136) (13 915 991) (6 243 326) (2 332 412) (51 688 512) - Contractual amounts receivable 20 578 058 6 909 406 6 825 545 14 581 445 11 462 009 4 613 492 64 969 955 Derivative financial assets designated for hedging: - Contractual amounts payable (13 916) (17 594) (30 359) (2 049 097) (1 929 634) (625 760) (4 666 360) - Contractual amounts receivable 3 084 669 1 790 054 1 045 339 2 021 844 3 380 924 1 627 618 12 950 448 Loans to customers 29 746 947 46 353 249 53 776 645 105 360 236 259 311 933 144 806 041 639 355 051 Investment securities - available-for-sale
- held by the Group 1 541 366 2 442 907 424 472 841 507 15 136 760 10 697 026 31 084 038 - pledged under repurchase agreements 111 666 5 634 256 573 260 780 105 13 724 604 11 526 356 32 350 247
- held-to-maturity 11 892 – – 23 784 311 892 – 347 568 Total undiscounted financial assets 289 306 454 77 880 434 58 373 252 108 139 576 295 709 930 171 278 283 1 000 687 929 Financial liabilities as at 31 December 2012 Amounts due to credit institutions 85 148 903 32 485 461 8 729 432 4 602 864 48 558 949 12 659 618 192 185 227 Derivative financial liabilities: - Contractual amounts payable 12 188 808 9 259 486 6 599 446 7 979 855 7 427 614 7 404 143 50 859 352 - Contractual amounts receivable (12 188 304) (8 118 250) (4 340 942) (7 393 108) (2 095 966) (869 636) (35 006 206) Derivative financial liabilities designated for hedging: - Contractual amounts payable 197 915 1 790 597 2 794 546 1 103 839 5 887 390 5 104 535 16 878 822 - Contractual amounts receivable (5 261) (102 790) (108 051) (462 314) (1 154 195) (180 883) (2 013 494) Amounts due to customers 375 690 126 36 460 877 28 663 744 31 197 087 34 911 564 1 711 990 508 635 388 Debt securities issued 501 765 – – 1 719 262 41 681 794 5 813 279 49 716 100 Total undiscounted financial liabilities 461 533 952 71 775 381 42 338 175 38 747 485 135 217 150 31 643 046 781 255 189

ZAO UniCredit Bank Notes to Consolidated Financial Statements
(Thousands of Russian Roubles)
49
26. Risk management (continued)
Liquidity risk and funding management (continued)
Analysis of financial assets and liabilities by remaining contractual maturities (continued)
The maturity profile of the financial assets and liabilities at 31 December 2011 was the following:
Less than
1 month 1 month to
3 months 3 months to
6 months 6 to 12 months 1 year to
3 years More than
3 years Total Financial assets as at 31 December 2011 Cash and cash balances 24 491 991 – – – – – 24 491 991 Trading securities 1 938 722 – – – – – 1 938 722 Amounts due from credit institutions 84 674 771 1 394 240 6 201 494 7 875 431 103 955 217 425 638 204 526 791 Derivative financial assets: - Contractual amounts payable (20 558 804) (48 908 164) (21 790 105) (14 374 831) (31 706 405) (1 958 600) (139 296 909) - Contractual amounts receivable 21 553 464 50 628 919 24 714 093 14 454 930 34 676 049 3 875 693 149 903 148 Derivative financial assets designated for hedging: - Contractual amounts payable (432 352) (147 704) (656 827) (2 741 464) (8 695 574) (819 422) (13 493 343) - Contractual amounts receivable 1 935 003 328 180 1 356 116 1 685 371 10 649 625 2 060 099 18 014 394 Loans to customers 7 970 509 36 145 997 48 383 167 82 782 092 173 771 346 215 526 269 564 579 380 Investment securities: - available-for-sale 149 495 921 118 351 986 5 693 867 26 888 006 191 172 34 195 644 - held-to-maturity 11 892 – – 11 892 347 568 – 371 352 Total undiscounted financial assets 121 734 691 40 362 586 58 559 924 95 387 288 309 885 832 219 300 849 845 231 170 Financial liabilities as at 31 December 2011 Amounts due to credit institutions 56 388 107 40 904 349 11 474 287 9 470 902 30 544 383 22 865 838 171 647 866 Derivative financial liabilities: - Contractual amounts payable 15 109 864 46 329 106 35 069 123 14 514 437 35 842 318 7 841 600 154 706 448 - Contractual amounts receivable (15 159 367) (44 631 956) (31 755 840) (13 593 471) (31 898 513) (1 786 818) (138 825 965) Derivative financial liabilities designated for hedging: - Contractual amounts payable 193 188 3 897 728 7 211 299 4 187 099 29 978 722 15 270 544 60 738 580 - Contractual amounts receivable (228 842) (2 997 167) (6 165 108) (3 435 386) (27 865 008) (11 662 090) (52 353 601) Amounts due to customers 265 808 874 13 987 752 11 215 806 10 493 214 169 667 564 1 419 049 472 592 259 Debt securities issued – 392 040 572 238 1 509 825 8 107 951 22 614 973 33 197 027 Total undiscounted financial liabilities 322 111 824 57 881 852 27 621 805 23 146 620 214 377 417 56 563 096 701 702 614

ZAO UniCredit Bank Notes to Consolidated Financial Statements
(Thousands of Russian Roubles)
50
26. Risk management (continued)
Liquidity risk and funding management (continued)
Analysis of financial liabilities by remaining contractual maturities (continued)
The maturity analysis does not reflect the historical pattern of stable balances on current accounts. Withdrawals of current accounts historically are taking place over a longer period than indicated in the tables above. These balances are included in amounts due in less than one month in the tables above.
Included in due to customers are term deposits of individuals. In accordance with the Russian legislation, the Group is obliged to repay such deposits upon demand (please refer to Note 18).
The table below shows the contractual expiry by maturity of financial commitments and contingencies.
Less than 1 month
1 to 3 months
3 to 6 months
6 to 12 months
1 to 3 years
More than 3 years Total
2012 22 453 552 39 841 451 75 898 568 96 951 136 57 253 829 10 754 424 303 152 960 2011 12 635 241 15 892 889 53 648 502 83 786 610 40 133 020 21 995 490 228 091 752
The Group expects that not all of the contingent liabilities or commitments will be drawn before expiry of the commitments.
Market risk
Market risk is the risk that the fair value or future cash flows of financial instruments will fluctuate due to changes in market variables such as interest rates, foreign exchange rates and equity prices.
The Group distinguishes four market risk categories:
1. Interest Rate Risk is the risk that changes in interest rates will affect future cash flows or fair values of financial instruments.
2. Currency Risk is the risk that the value of financial instruments will fluctuate due to changes in foreign exchange rates. 3. Spread Risk is the risk that changes in credit spreads will affect bond prices. 4. Residual Risk is the risk that a price of a particular instrument will change due to its specific characteristics.
On a daily basis the Group assesses interest rate and currency risks for both the trading portfolio and banking book. Moreover, spread and residual risks are calculated for fixed income positions.
The Group applies a Value-at-Risk (hereinafter – “VAR”) methodology for the measuring of all risks mentioned above. VAR measure adopted by the Group estimates the potential negative change in the market value of a portfolio at a 99% confidence level over a 1-day horizon. The Group distinguishes the following types of VAR:
1. Total VAR is calculated for all risk factors taken in aggregate; 2. Interest Rate VAR is originated from interest rate risk exposure of the portfolio; 3. Foreign exchange VAR is originated from currency risk exposure of the portfolio; 4. Spread VAR is originated from spread risk exposure of the bond portfolio; 5. Residual VAR is originated from other factors exposure of the bond portfolio.
The Group also started to calculate Incremental Risk Charge (hereinafter – “IRC”) that complements additional standards being applied to VAR modelling framework according to amendments to Basel II. IRC is an estimate of the default and migration risks of unsecured credit products over a one year capital horizon at 99.9% confidence level.
For interest rate risk management and control the Group also uses a Basis Point Value (hereinafter – “BPV”) measure, which shows a change of present value of the Group’s position if interest rate changes by one basis point. The measure is calculated for all currencies in which the Group has interest rate exposures. In addition, for bonds the Group established Credit Point Value (hereinafter – “CPV”) measure that reflects a change of the bond position present value in case of credit spread changes by one basis point.

ZAO UniCredit Bank Notes to Consolidated Financial Statements
(Thousands of Russian Roubles)
51
26. Risk management (continued)
Market risk (continued)
Since monitoring of VAR, BPV and CPV is an integral part of the risk management procedures, VAR, CPV and BPV limits have been established and exposures are reviewed daily against the limits by Market Risk Unit (hereinafter – “MRU”). IRC exposure is reviewed weekly.
The Group has adopted the following limits:
• Total VAR limit for whole portfolio; • IRC limit for total bond position; • Total BPV limit for whole portfolio; • BPV limit split by currencies; • Open foreign exchange position limits; • CPV limit for total bond position.
Usage of VAR enables management of a position taking into consideration complex relationships and interdependencies between different risk factors. Typically MRU analyses VAR figures and sets BPV limits which help traders and the Finance Department to optimize risk profiles in volatile market environments. On a monthly basis MRU provides stress-testing of all four market risk categories, in other words, the estimation of total portfolio present value change according to several predefined scenarios of market risk factor movements. In addition, the MRU monitors on a daily basis the financial result of the trading operations and thoroughly investigates any significant variances.
All limit violations are analyzed by the MRU on a daily basis, and all limit breaches are escalated and reported to local ALCO and to UniCredit Bank Austria AG.
In 2012 MRU significantly improved the control of economical and regulatory open foreign currency position that is performed on a daily basis. MRU continued to upgrade the internal methodologies and procedures according to international standards and UniCredit Group methodologies. In particular, new methodologies of risk estimation based on Basel 2.5 were implemented and implementation of Basel 3 regulatory standards was started. Thus, implementation of Credit Valuation Adjustment (modification of derivatives market value taking into account counterparty credit risk) and corresponded impact on Capital was done. Also, the requirements of minimum mark-up of derivatives were applied. To improve the control of the Bank’s trading strategy the sensitivity analysis of statement of comprehensive income in terms of risk factors was created and implemented.
Interest rate risk management of the banking book
The Bank uses the active interest rate risk management concept, which aims to minimize the net interest income volatility of the banking book.
In banking book interest rate risk position there is a discrepancy between economic (behavioural) and contractual maturities of financial instruments. It concerns both instruments with fixed contractual maturities (loans and time deposits) and instruments without contractual maturities (current accounts, capital). Based on historical observation the Bank developed models that allowed applying behavioural approach to such kinds of banking book items for construction of interest rate risk position with the aim of better interest rate risk management by means of preventing over-hedging and encouraging self-hedging. The Bank applies behavioural models to current accounts, short-term customer time deposits and time deposits with auto-rollover option as well as to capital. The Bank has developed prepayment model for retail loans and implemented it in interest rate risk position. For avoiding accounting discrepancy between hedged items of banking book calculated on accrual basis and hedging instruments calculated on mark-to-market basis and, as a result, to stabilize net interest income the Bank uses hedge accounting methodology. During the period from 2008 until 2011 the Bank sequentially implemented the following hedge accounting approaches: Micro Cash Flow Hedge, Macro Cash Flow Hedge, Micro Fair Value Hedge, Portfolio Fair Value Hedge for interest rate risk management.

ZAO UniCredit Bank Notes to Consolidated Financial Statements
(Thousands of Russian Roubles)
52
26. Risk management (continued)
Market risk (continued)
Objectives and limitation of VAR methodology
The Group uses a Basel II compliant VAR methodology based on historical simulations. Historical simulation is a method that allows to calculate VAR without making any assumptions about the a priori statistical distribution of the portfolio value movements. This approach involves the construction of the hypothetical distribution of the yields (profit and losses) of a portfolio of financial instruments directly by means of the historical fluctuations of the market prices. Once the hypothetical distribution has been calculated, the VAR is given by the percentile evaluation with the 99% confidence interval.
The VAR methodology described above replaces the previous approach based on historical and Monte-Carlo simulations, where 1000 scenarios of joint risk factors behaviour are modelled. The portfolios were revalued according to the scenarios set. The VAR measure resulted as the 99% quantile of the above distribution. Interest and exchange rates were modelled on a historical data basis. Bonds credit spread changes were modelled using the Student 5 distribution.
VAR estimates are based on historical data and therefore have some limitations. The volatility of interest and exchange rates observed in the past might not match the current market conditions, which could lead to underestimation of the future losses. The VAR measure does not account for any losses that may occur beyond the 99% confidence level.
The adequacy of the models used by the Group is controlled using a back-testing method, which compares VAR measures with realized mark-to-market revaluation for traded instruments and mark-to-model revaluation for non-traded instruments. This analysis is provided by MRU on a monthly basis.
Computational results
The following table shows estimation of the potential losses that could occur on all risk positions as a result of movements in market rates and prices by one BPV:
2012 2011 Total VAR 283 825 199 286 Interest Rate VAR 209 654 161 371 Spread VAR 200 816 137 748 Foreign exchange VAR 6 413 16 897
The banking book includes corporate and retail loans and bonds from the investment portfolio on the asset side and deposits on the liability side offset by internal interest rate swaps to transfer interest rate risk to the trading book. A new prepayment model for retail loans has been implemented in 2011.
The following table shows estimation of the potential losses that could occur on banking book risk positions as a result of movements in market rates and prices by one BPV: 2012 2011 Total VAR 24 920 56 261 Interest Rate VAR 24 842 58 693 Spread -VAR 2 019 [1] 2 972 Foreign exchange VAR – [2] –
[1]Spread risk in the banking book arises from bonds comprising investment portfolio.
[2] Foreign exchange risk is defined as the risk arising from the net open position of the Bank and allocated to the trading book. The foreign exchange risk component of the banking book is therefore considered to be zero.
The following table shows estimation of the potential losses that could occur on trading book risk positions as a result of movements in market rates and prices by one BPV:
2012 2011 Total VAR 273 178 184 490 Interest Rate VAR 201 589 146 319 Spread VAR 200 089 135 651 Foreign exchange VAR 6 413 16 897
The following table shows estimation of the potential losses that could occur on trading bond portfolio position as a result of movements in market rates and prices by one BPV:
2012 2011 Total VAR 282 982 213 487 Interest Rate VAR 185 482 130 518 Spread VAR 168 591 136 723
ZAO UniCredit Bank Notes to Consolidated Financial Statements
(Thousands of Russian Roubles)
53
26. Risk management (continued)
Operational risk
Operational Risk Definition and Risk Management Principles
The UniCredit Group and the Bank define as “operational” the risk of loss resulting from inadequate or failed internal processes, people and systems or from external events. The definition of Operational Risk includes legal risk but excludes strategic and reputation risk. Legal risk includes but is not limited to exposure to fines, penalties or punitive damages resulting from supervisory actions as well as private settlements.
The management of Operational Risk as defined above is based on the following fundamental principles: • involvement of corporate governing bodies in all the relevant decisions regarding the Operational Risk
management framework; • independence of Operational Risk management function from the risk taking functions; • effective system of controls at different control levels (line, second level and third level); • involvement of Operational Risk management function in evaluation the risks of new products, process and
markets; • efficient escalation and decision-making process; • adequate and periodical disclosure and reporting process.
Operational Risk Management Framework
The Bank is fully compliant with the UniCredit Group’s operational risk management framework in its guiding standards and principles as well as with the legislation of the Russian Federation.
Management Board of the Bank holds the responsibility for the establishment, governance and monitoring of the effective and efficient Operational Risk management system. The Management Board establishes the general policies of the Bank’s Operational Risk management system and has control over its due implementation and its actual operations including but not limiting to:
• approval of the Operational Risk framework and any essential changes to it as well as all internal normative documents of the Bank guiding the Operational Risk management system;
• establishment of an Operational Risk management function being of appropriate independence of judgement and having the adequate personnel and other resources;
• assurance that the tasks and responsibilities of the functions involved in the Operational Risk management system are assigned in a clear and appropriate manner with special regard to avoidance of conflicts of interest;
• establishment of informing and reporting system providing accurate, complete and timely information on Operational Risk exposure and other significant Operational Risk management issues.
Operational Risk Committee of the Bank is a governing body primarily responsible for making decisions on Operational Risk topics and ongoing monitoring of developments affecting the Bank’s business and promoting the exchange of information among the divisions and individual operating functions (Retail Banking, CIB, CFO, Legal, HR, Security) representing line controls. The Bank’s Operational Risk Management Unit (hereinafter – “ORM Unit”) performing the second level controls is fully independent from risk taking functions performing the line level controls. The ORM’s main methodologies, tools and activities to identify, assess, monitor and mitigate Operational Risk are focused on but not limited to:
• loss data collection including general ledger analysis, accounts reconciliation, transitory and suspense accounts monitoring, data quality control;
• key Operational Risk indicators; • scenario analysis; • Operational Risk limits control; • insurance coverage; • capital at risk allocation according to the Basel II Standardized Approach; • new products/processes analysis from the Operational Risk impact perspective; • credit bureaus cooperation; • reporting and escalating any of the essential Operational Risk issues to the Management Board, Internal Audit
Department and competent UniCredit Group functions.

ZAO UniCredit Bank Notes to Consolidated Financial Statements
(Thousands of Russian Roubles)
54
26. Risk management (continued)
Operational risk (continued)
Operational Risk Management Framework (continued)
In order to assure the efficacy of the Operational Risk identification and mitigation processes, a Permanent Workgroup is established at the Bank which aims at identifying the source of Operational Risk and reduce the Operational Risk exposure of the Bank, leveraging mainly on the expertise of the ORM and Organization functions.
The Internal Audit Department performing the third level controls cooperates with the ORM Unit in terms of setting, development, implementation and maintenance of the Operational Risk management system, Operational Risk identification and the inherent local internal validation process.
27. Fair values of financial instruments
The following disclosure of the estimated fair value of financial instruments is made in accordance with the requirements of IFRS 7 Financial Instruments: Disclosures. Fair value is defined as the amount at which the instrument could be exchanged in a current transaction between knowledgeable willing parties on arm’s length conditions, other than in forced sale or liquidation. As no readily available market exists for a significant part of the Group’s financial instruments, judgment is necessary in arriving at fair value, based on current economic conditions and the specific risks attributable to the instrument. The estimates presented herein are not necessarily indicative of the amounts the Group could realise in a market exchange from the sale of its full holdings of a particular instrument.
The estimated fair values of trading securities, bonds issued, and liquid investment securities are based on quoted market prices at the reporting date without any deduction for transaction costs. For securities and derivative financial instruments not traded in an active market, the fair value is estimated by using valuation techniques that include the use of recent arm’s length transactions and discounted cash flow analysis.
The estimated fair values of all other financial assets and liabilities are calculated using discounted cash flow techniques based on estimated future cash flows.
Where discounted cash flow techniques are used, estimated future cash flows are based on management’s best estimates and applicable interest rates as at 31 December 2012 (Mosprime rates varying from 8% to 11.21%, LIBOR rates – from 2.51% to 6.16%, EURIBOR rates – from 1.99% to 5.22% for RUB, USD and EUR instruments respectively, and discount rates varying from 1% to 25.33%).
The following table summarises the carrying amounts and fair values of those financial assets and liabilities not presented in the consolidated statement of financial position at fair value.
2012 2011 Carrying amount Fair value Carrying amount Fair value
Financial assets Amounts due from credit institutions 246 446 188 246 446 188 200 143 375 200 143 375 Loans to customers 504 195 074 484 170 598 472 698 094 468 924 332 Investment securities held-to-maturity 311 805 305 826 311 662 311 697 Financial liabilities Amounts due to credit institutions 187 523 705
187 523 705 165 826 669 165 826 669
Amounts due to customers 503 869 222 502 403 373 462 922 550 463 908 528 Debt securities issued 40 792 747 40 307 268 25 833 182 24 715 781
Financial instruments recorded at fair value
The Group measures fair values for financial instruments recorded on the consolidated statement of financial position using the following fair value hierarchy that reflects the significance of the inputs used in making the measurements:
• Level 1: Quoted market price (unadjusted) in an active market for an identical instrument. • Level 2: Valuation techniques based on observable inputs, either directly (i.e, as prices) or indirectly (i.e, derived
from prices). This category includes instruments valued using: quoted market prices in active markets for similar instruments; quoted prices for identical or similar instruments in markets that are considered less than active; or other valuation techniques where all significant inputs are directly or indirectly observable from market data.
• Level 3: Valuation techniques using significant unobservable inputs. This category includes all instruments where the valuation technique includes inputs not based on observable data and the unobservable inputs have a significant effect on the instrument’s valuation. This category includes instruments that are valued based on quoted prices for similar instruments where significant unobservable adjustments or assumptions are required to reflect differences between the instruments.

ZAO UniCredit Bank Notes to Consolidated Financial Statements
(Thousands of Russian Roubles)
55
27. Fair values of financial instruments (continued) The table below analyses financial instruments measured at fair value at 31 December 2012, by the level in the fair value hierarchy into which the fair value measurement is categorised: Level 1 Level 2 Level 3 Total 2012 Financial assets Trading securities 4 340 528 – – 4 340 528 Available-for-sale securities
- held by the Group 22 630 017 1 537 635 7 742 614 31 910 266 - pledged under repurchase agreement 25 779 069 911 330 – 26 690 399
Derivative financial assets – 10 064 303 – 10 064 303 Derivative financial assets designated for hedging – 7 350 086 – 7 350 086 52 749 614 19 863 354 7 742 614 80 355 582 Financial liabilities Derivative financial liabilities – 7 309 978 – 7 309 978 Derivative financial liabilities designated for hedging – 6 222 442 – 6 222 442 – 13 532 420 – 13 532 420
The table below analyses financial instruments measured at fair value at 31 December 2011, by the level in the fair value hierarchy into which the fair value measurement is categorised: Level 1 Level 2 Level 3 Total 2011 Financial assets Trading securities 1 646 189 292 533 – 1 938 722 Available-for-sale securities 28 242 821 2 058 323 13 267 115 43 568 259 Derivative financial assets – 12 867 079 – 12 867 079 Derivative financial assets designated for hedging – 3 776 683 – 3 776 683
29 889 010 18 994 618 13 267 115 62 150 743 Financial liabilities Derivative financial liabilities – 12 893 794 – 12 893 794 Derivative financial liabilities designated for hedging – 7 273 366 – 7 273 366 – 20 167 160 – 20 167 160 Financial instruments of Level 3 represent equity investment in MICEX-RTS which is not quoted on an active market and is revalued based on the price of RUR 57 per share.
The following table shows reconciliation for the years ended 31 December 2012 and 2011 for fair value measurements in Level 3 of the fair value hierarchy: 2012 2011
Equity investments
available-for-sale Equity investments
available-for-sale Balance at beginning of the year 13 267 115 – Total gains or losses: - in profit or loss 3 007 049 3 211 266 - in other comprehensive income (4 256 550) 9 702 731 Disposals (4 275 000) – Transfers into level 3 – 353 118 Balance at the end of the year 7 742 614 13 267 115 Loss on financial instruments of Level 3 of RUB 4 256 550 thousand is presented in other comprehensive income within revaluation reserve for available-for-sale securities.
28. Related party disclosures
The Bank’s ultimate parent is the UniCredit Group. The Bank’s immediate parent is UniCredit Bank Austria AG. Both entities produce publicly available financial statements. In accordance with IAS 24 Related Party Disclosures, parties are considered to be related if one party has the ability to control the other party or exercise significant influence over the other party in making financial or operational decisions. In considering each possible related party relationship, attention is directed to the substance of the relationship, not merely the legal form. Related parties may enter into transactions which unrelated parties might not, and transactions between related parties may not be effected on the same terms, conditions and amounts as transactions between unrelated parties.

ZAO UniCredit Bank Notes to Consolidated Financial Statements
(Thousands of Russian Roubles)
56
28. Related party disclosures (continued) Balances and transactions with UniCredit Bank Austria AG (the immediate parent) and more senior parents within the UniCredit Group were as follows:
31 December
2012 Average interest
rate, % 31 December
2011 Average
interest rate, % Amounts due from credit institutions
- In Russian Roubles 1 805 998 6.8% 7 313 510 6.8% - In EUR 94 207 212 2.5% 143 482 611 2.8% - In USD 63 788 242 0.2% 3 061 857 0.4%
Other assets 78 232 85 450 Amounts due to credit institutions
- In Russian Roubles 9 366 136 7.1% 23 736 953 7.3% - In EUR 8 241 285 2.4% 37 592 789 2.0% - In USD 44 566 913 2.3% 25 684 219 2.0%
Derivative financial liabilities – – Debt securities issued 1 004 672 9.0% 1 004 192 9.0% Other liabilities 179 527 94 216 Commitments and guarantees issued 1 879 274 2 276 613 Commitments and guarantees received 1 781 822 1 189 686 2012 2011 Interest income 3 129 230 1 977 662 Interest expense (2 634 271) (2 805 220) Fee and commission income 12 267 12 264 Fee and commission expense (19 366) (22 323) Gains on financial assets and liabilities held for trading 45 804 595 691 Personnel expenses (33 533) (29 782)
Balances and transactions with other companies controlled by the UniCredit Group are as follows:
31 December
2012 Average
interest rate, % 31 December
2011 Average interest
rate, % Amounts due from credit institutions
- In EUR 10 844 253 0.0% 567 409 0.0% - In USD 294 0.0% – - In other currencies 55 244 0.0% 20 129 0.0%
Derivative financial assets 2 262 301 3 537 856 Derivative financial assets designated for
hedging 4 130 765 3 573 532 Loans to customers
- In EUR 1 618 669 6.2% 600 216 6.6% Other assets 621 326 626 152 Amounts due to credit institutions
- In Russian Roubles 551 111 2.3% 821 587 0.0% - In EUR – 602 489 3.3% - In USD 6 104 863 2.3% 5 824 153 2.4% - In other currencies 1 903 0.0% –
Derivative financial liabilities 4 548 547 5 023 326 Derivative financial liabilities designated
for hedging 3 905 127 5 904 556 Amounts due to customers
- In Russian Roubles 114 411 5.7% 519 989 2.2% - In EUR 311 594 0.6% 251 961 1.6% - In USD 253 268 1.2% 486 478 1.2%
Debt securities issued – 3 873 877 7.0% Other liabilities 76 375 69 221 Commitments and guarantees issued 15 961 786 16 267 095 Commitments and guarantees received 2 974 011 1 356 662

ZAO UniCredit Bank Notes to Consolidated Financial Statements
(Thousands of Russian Roubles)
57
28. Related party disclosures (continued) 2012 2011 Interest income 5 212 239 3 586 040 Interest expense (3 426 256) (2 890 527) Fee and commission income 31 145 27 474 Fee and commission expense (21 515) (9 535) Losses on financial assets and liabilities held for trading (764 513) (2 297 332) Other income 895 398 Personnel expenses (46 105) (7 504) Other administrative expenses (20 972) (16 117)
Subordinated loans from the members of the UniCredit Group were as follows for 2012 and 2011:
2012 2011
UniCredit Bank Austria AG and
more senior parents within the UniCredit
Group
Other companies
controlled by the UniCredit
Group
UniCredit Bank Austria AG and
more senior parents within the UniCredit
Group
Other companies controlled by the UniCredit Group
Subordinated loans at the beginning of the year 14 214 639 2 582 390 13 621 564 2 444 330 Subordinated debt repaid during the year (949 665) – – – Accrual of interest, net of interest paid (47 713) (1 054) 15 959 524 Effect of exchange rates changes (562 070) (145 870) 577 116 137 536 Subordinated loans at the end of the year 12 655 191 2 435 466 14 214 639 2 582 390
Total compensation of the key management personnel included in personnel expenses for the years ended 31 December 2012 and 2011 comprised short-term benefits in the amount of RUB 101 741 thousand and other long-term benefits in the amount of RUB 67 505 thousand (2011: RUB 85 269 thousand and RUB 75 996 thousand, respectively) and post-employment benefits in the amount of RUB 985 thousand (2011: RUB 1 232 thousand).
There were no outstanding balances for transactions with the key management personnel as at 31 December 2012. As at 31 December 2011 outstanding balances for transactions with the key management personnel are as follows:
2011 Average
interest rate, % Loans outstanding at 31 December, gross 7 718 9.5% Less loan impairment at 31 December (8) Loans outstanding at 31 December, net 7 710
29. Capital
The Group maintains an actively managed capital base to cover risks inherent in the business. The adequacy of capital is monitored using, among other measures, the ratios established by the Basel Capital Accord 1988 and the ratios established by the CBR.
The primary objectives of capital management are to ensure that the Group complies with externally imposed capital requirements and that the Group maintains strong credit ratings and healthy capital ratios in order to support its business and to maximise shareholders’ value.
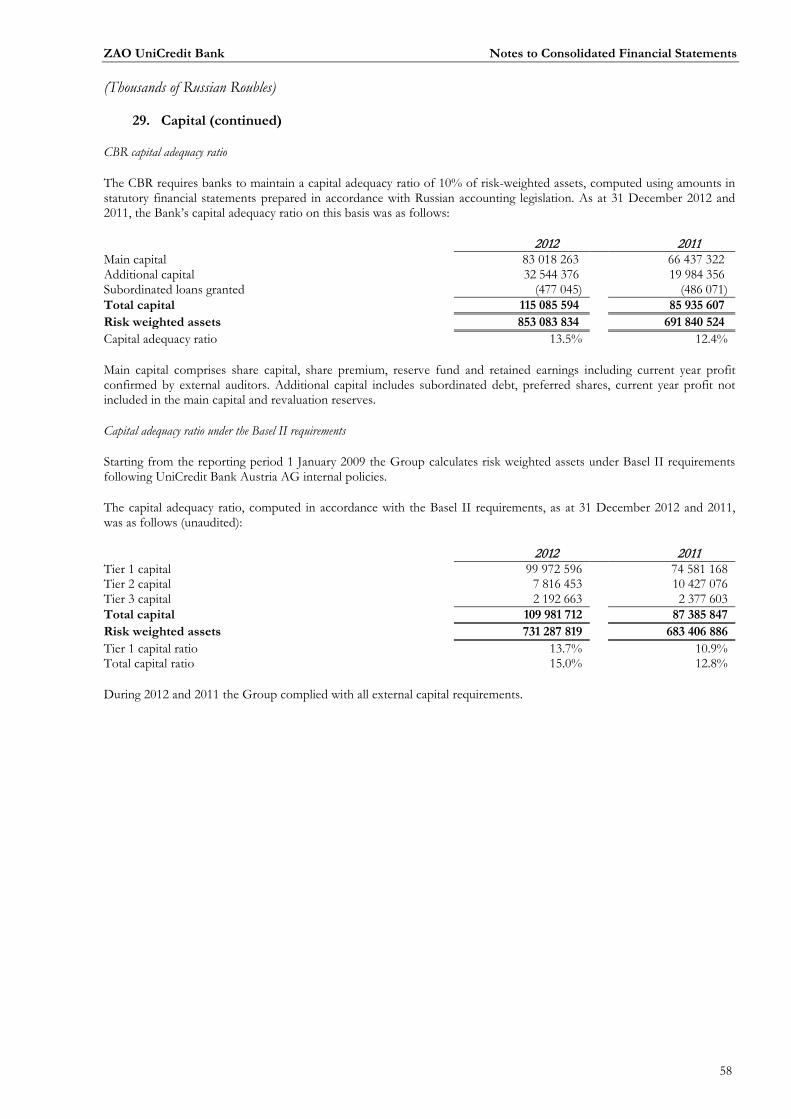
ZAO UniCredit Bank Notes to Consolidated Financial Statements
(Thousands of Russian Roubles)
58
29. Capital (continued)
CBR capital adequacy ratio
The CBR requires banks to maintain a capital adequacy ratio of 10% of risk-weighted assets, computed using amounts in statutory financial statements prepared in accordance with Russian accounting legislation. As at 31 December 2012 and 2011, the Bank’s capital adequacy ratio on this basis was as follows:
2012 2011 Main capital 83 018 263 66 437 322 Additional capital 32 544 376 19 984 356 Subordinated loans granted (477 045) (486 071) Total capital 115 085 594 85 935 607 Risk weighted assets 853 083 834 691 840 524 Capital adequacy ratio 13.5% 12.4%
Main capital comprises share capital, share premium, reserve fund and retained earnings including current year profit confirmed by external auditors. Additional capital includes subordinated debt, preferred shares, current year profit not included in the main capital and revaluation reserves.
Capital adequacy ratio under the Basel II requirements
Starting from the reporting period 1 January 2009 the Group calculates risk weighted assets under Basel II requirements following UniCredit Bank Austria AG internal policies.
The capital adequacy ratio, computed in accordance with the Basel II requirements, as at 31 December 2012 and 2011, was as follows (unaudited):
2012 2011 Tier 1 capital 99 972 596 74 581 168 Tier 2 capital 7 816 453 10 427 076 Tier 3 capital 2 192 663 2 377 603 Total capital 109 981 712 87 385 847 Risk weighted assets 731 287 819 683 406 886 Tier 1 capital ratio 13.7% 10.9% Total capital ratio 15.0% 12.8%
During 2012 and 2011 the Group complied with all external capital requirements.