za 2015 - stellenbosch university · 2015 technical report za potential for integration of...
TRANSCRIPT

2015
TECHNICALREPORT
ZA
Potential for integration of distributed solar photovoltaic systems in Drakenstein municipality
Energy

EXECUTIVE SUMMARYUsing Drakenstein Municipality as a case study, this report analyses the potential impacts of the installation of roof top PV by residential and industrial users on the municipal revenue generated by electricity sales. Secondly, the report investigates the potential for Municipalities to play a more pro-active role in rolling out of distributed energy to address electricity constraints and generate income. This is done through an analysis of three municipal buildings to determine their suitability for rooftop PV followed by a pre-feasibility report (both technical and financial) in respect of the optimal building selected.
The overall analysis of solar potential of the area shows that a typical site within the Drakenstein Municipality has a fair solar resource and PV yield. If a PV array is installed within the municipal area, orientated to the north and inclined at an optimised angle of 29°, a performance ratio of approximately 77% is achieved. The high temperature in the summer months reduces the efficiency of the PV panels and the presence of Paarl Mountain limits the late afternoon generation capacity. However, in comparison to other sites in South Africa, a typical site in the area of focus has a good solar yield.
Using available data from two case studies, one residential and one industrial user, together with an additional analysis, the maximum amount of PV that can be installed in the Drakenstein municipal district before grid studies are needed is quantified. The electricity generated from this calculated installed PV capacity is compared with the load profiles at the substations, where load data was available, to evaluate the impact of such PV installations. A conservative approach based on the electricity load profiles at substation level, indicates that just over 24 MWp of distributed solar PV could easily be installed in Drakenstein without causing grid instability.
The impact that the installation of 24 MWp of rooftop PV installations will have on the revenue of Drakenstein municipality will depend on the type of customer installing the rooftop PV as well as the tariff structure that the customers were on before and are on after the installations.
The absolute worst case scenario - when all the customers installing PV are billed on a residential tariff and do not switch to the new SSEG tariff – translates into a net potential loss to the municipality of R 24 million for the 2014/2015 financial year, should these systems have already been installed. This is less than 3% of electricity revenue to Drakenstein. It needs to be pointed out that this high penetration of rooftop PV is highly unlikely in the short and medium term.
After an analysis of three possible municipal sites, the study concludes with a prefeasibility analysis to determine the economic viability of a PV installation on the roof of municipal owned building at 1 Market Street, Paarl. The available solar resources are evaluated, the potential electricity generated and the financial projections for the site are modelled.
In this PV installation pre-feasibility study, a 25 kWp and a 50 kWp system are proposed and through financial assessments carried out. The most feasible case found is the 25 kWp system, where the building remains on the Bulk Time of Use
Page 2 | Potential for integration of distributed solar photovoltaic systems in Drakenstein municipality

Medium Voltage tariff. For the 50% grant funded case an IRR of 8.35% is seen, a payback period of 13 years and LCOE of R 1.49. Less savings are seen by the building owners if the building moves over to the proposed embedded generation tariff after the installation of PV on the building’s roof top.
It is clear from this study, that potential impact of private PV installation on the municipal income generated from electricity sales will probably have less of an impact than commonly believed in the short term. However, a breakthrough in the costs and practicality of battery storage technology could be a leap enabler, leading to a large scale increase in self-sufficient off-grid consumers. Municipalities will have no choice but to relook their present role of energy distribution in the value chain and develop new business models for local energy systems. The focus of this study was self-generation using PV panels to address energy security and generate revenue, but there are other options that municipalities can explore.
ACKNOWLEDGEMENTSThe authors are grateful to WWF-SA for the financial support provided to undertake this research as well as for inputs provided on the contents of the report.
We also thank the Drakenstein Municipality, and in particular the Manager: Infrastructure, Deon Louw, and the Manager: Electricity, Willie Albertyn, who gave their time and expertise to make this study possible.
Potential for integration of distributed solar photovoltaic systems in Drakenstein municipality | Page 3

CONTENTSExecutive summary 2
Acknowledgements 3
List of Figures 6
List of Tables 9
List of Abbreviations 10
Introduction 11
Background 13
Location 13
Solar PV Production Potential 14
The potential for PV in Drakenstein 17
Introduction 17
Drakenstein Case Studies 17
Methodology to calculate maximum installable PV in Drakenstein 23
PV potential using NRS097-3 rules 25
Impact of maximum PV generation on the load profile 26
Potential PV Systems by analysing electricity use 33
Conclusion 35
Impact of PV installations on municipal revenue in Drakenstein 36
Introduction 36
Reduction of Eskom bill for Drakenstein 36
Reduction of municipal income if all PV installations were done by residential users 38
Reduction of municipal income if all PV installations were done by industrial and commercial users 40
Conclusion 41
PV opportunities for the Drakenstein municipal owned buildings 42
Introduction 42
Paarl Electricity Building 43
Civic Centre 47
1 Market Street building 51
Discussion and comparison of sites 55
Conclusion 59
Page 4 | Potential for integration of distributed solar photovoltaic systems in Drakenstein municipality

Prefeasability study for the installation of PV on 1 Market Street Paarl 60
Introduction 60
Site Information 60
Assessment Method 62
Assessment Results 63
Financial Feasibility 76
Conclusion 123
Conclusion 125
Appendix 1 126
List of installed PV in the WC (excluding off grid and REIPPPP) 126
Appendix 2 129
Maximum demand in kVA per substation for 2013-2014 129
Appendix 3 130
Drakenstein Eskom accounts for 2014 130
Potential for integration of distributed solar photovoltaic systems in Drakenstein municipality | Page 5

LIST OF FIGURESFigure 1: The location of the three analysed
buildings in the PV Opportunities Report 12Figure 2: Satellite view of Paarl Town from
Google Earth 13Figure 3: PV output map for South Africa,
measured in annual kWh production per kWp installed 14
Figure 4: Terrain horizon and day length for 1 Market Street, Paarl 15
Figure 5: Google Earth image of IMPERIAL Cargo site from 1 April 2010 18
Figure 6: Google Earth image of IMPERIAL Cargo site from 31 January 2015 18
Figure 7: The 30kWp PV installation at IMPERIAL Cargo with battery storage 19
Figure 8: Monthly PV production for the IMPERIAL Cargo site 20
Figure 9: Total electricity use per month for IMPERIAL Cargo for 1 July 2013 to 31 December 2014 20
Figure 10: Fuel switching, energy efficient and renewable energy technologies installed by the home owner as compared to electricity usage averaged over 6 months: 2010 to 2014 22
Figure 11: The 4.25 kWp installation at a private home in Paarl 22
Figure 12: Total electricity purchased from Drakenstein and consumed from PV generation for the residential user had the PV been installed since January 2010 23
Figure 13: Summary of simplified connection criteria 24
Figure 14: Impact of PV generation on the load profile of three substations in Drakenstein for a summer week 28
Figure 15: Impact of PV generation on the load profile Dalweiding substation for a summer week 28
Figure 16: Impact of PV generation on the load profile Hugenote substation for a summer week 29
Figure 17: Impact of PV generation on the load profile Dwarsrivier substation for a summer week 29
Figure 18: Impact of PV generation on the load profile Hugenote substation for a winter week 30
Figure 19: Impact of PV generation on the load profile three substations in Drakenstein for a summer day 31
Figure 20: Impact of PV generation on the load profile Hugenote substations for a summer day 31
Figure 21: Impact of PV generation on the load profile Dalweiding substations for a summer day 32
Figure 22: Impact of PV generation on the load profile Dwarsrivier substations for a summer day 32
Figure 23: Impact of PV generation on the load profile of Hugenote substations for a cloudy winter day 33
Figure 24: Impact of PV generation on the load profile of Hugenote substations for a sunny winter day 33
Figure 25: Monthly electricity use in Drakenstein per substation 34
Figure 26: Eskom defined time periods 37Figure 27: The location of the 3 sites in relation to
Paarl Mountain 42Figure 28: Top view of the Paarl electricity
building, Google maps 43Figure 29: Side view of the Paarl electricity
building, Google Maps 44Figure 30: Monthly sum of global irradiation and
the daily air temperature 45Figure 31: Monthly sum of specific electricity
produced and the performance ratio of the system 46
Figure 32: Top view of the Civic Centre, Google maps 47
Figure 33: Side view of the Civic Conference Centre, Google Maps 48
Figure 34: Front view of the Civic Centre, Google Maps 48
Figure 35: Monthly sum of global irradiation and the daily air temperature 50
Figure 36: Monthly sum of specific electricity produced and the performance ratio of the system 50
Figure 37: Top view of the 1 Market Street Building, Google maps 52
Figure 38: Side view of the Civic Centre, Google Maps 52
Page 6 | Potential for integration of distributed solar photovoltaic systems in Drakenstein municipality

Figure 39: Monthly sum of global irradiation and the daily air temperature 54
Figure 40: Monthly sum of specific electricity produced and the performance ratio of the system 54
Figure 41: Shading diagram for the Electricity Building 56
Figure 42: Shading diagram for the Civic Centre 56Figure 43: Shading diagram for the 1 Market
Street Building 57Figure 44: Roof concerns of the Electricity building 58Figure 45: Shading concerns of the Civic Centre 58Figure 46: The location of the three analysed
buildings in the PV Opportunities Report 60
Figure 47: Top view of 1 Market Street, Paarl, Google maps 61
Figure 48: Side view of the Civic Centre, Google Maps 62
Figure 49: Raw data plot 30 min intervals 64Figure 50: Electricity Usage: Hourly averaged
plots for each month of the year 64Figure 51: Electricity Usage: Hourly averaged
plots for each month of the year, weekdays only 65
Figure 52: Power Usage: Average power usage for each day of the week for each month of the year 66
Figure 53: Power Usage: Hourly power usage averaged for each day of the week 66
Figure 54: Proposed panel layout for the 25 kWp system 67
Figure 55: Sun path diagram, indicating the shading losses for the proposed 25 kWp
system 68Figure 56: Monthly electricity production by the
25 kWp PV system 69Figure 57: Hind cast load profile after PV array is
installed for a typical day in December 70Figure 58: Hind cast load profile after PV array is
installed for a typical day in June 70Figure 59: Comparison between electricity
consumed and electricity produced by the proposed 25 kWp PV plant 71
Figure 60: Proposed panel layout for the 50 kWp system 72
Figure 61: Corresponding shading diagram for the 50 kWp system 72
Figure 62: Monthly electricity production by the 50 kWp PV system 74
Figure 63: Load profile after PV array is installed for a typical day in December 74
Figure 64: Load profile after PV array is installed for a typical day in June 75
Figure 65: Comparison between electricity consumed and electricity produced by the proposed 50 kWp PV plant 75
Figure 66: Current division of the bill on Bulk Time of Use Medium Voltage Tariff 79
Figure 67: Scenario 1, 25 kWp system: Annual Cash flow: 100% grant funded case at R18/Wp 82
Figure 68: Scenario 1, 25 kWp system: Annual Cash flow: 50% grant funded case at R18/Wp 82
Figure 69: Scenario 1, 25 kWp system: Annual Cash flow: 100% debt funded case at R18/Wp 83
Figure 70: Scenario 1, 25 kWp system: Cumulative net cash flow with 100% grant funded case at R18/Wp 83
Figure 71: Scenario 1, 25 kWp system: Cumulative net cash flow with 50% grant funded case at R18/Wp 84
Figure 72: Scenario 1, 25 kWp system: Cumulative net cash flow for the 100 % debt funded case at R18/Wp 84
Figure 73: Scenario 1, 25 kWp system: Cumulative cost for the 100% grant funded case at R18/Wp 85
Figure 74: Scenario 1, 25 kWp system: Cumulative cost for the 50% grant funded case at R18/Wp 85
Figure 75: Scenario 1, 25 kWp system: Cumulative cost for the 100% debt funded case at R18/Wp 86
Figure 76: Current division of the bill on the Eskom Megaflex local authority tariff 88
Figure 77: Scenario 2, 25 kWp system: Annual Cash flow: 100% grant funded case at R18/Wp 91
Figure 78: Scenario 2, 25 kWp system: Annual Cash flow: 50% grant funded case at R18/Wp 91
Figure 79: Scenario 2, 25 kWp system: Annual Cash flow: 100% debt funded case at R18/Wp 92
Potential for integration of distributed solar photovoltaic systems in Drakenstein municipality | Page 7

Figure 80: Scenario 2, 25 kWp system: Cumulative net cash flow with 100% grant funded case at R18/Wp 92
Figure 81: Scenario 2, 25 kWp system: Cumulative net cash flow with 50% grant funded case at R18/Wp 93
Figure 82: Scenario 2, 25 kWp system: Cumulative net cash flow for the 100 % debt funded case at R18/Wp 93
Figure 83: Scenario 2, 25 kWp system: Cumulative cost for the 100% grant funded case at R18/Wp 94
Figure 84: Scenario 2, 25 kWp system: Cumulative cost for the 50% grant funded case at R18/Wp 94
Figure 85: Scenario 2, 25 kWp system: Cumulative cost for the 100% debt funded case at R18/Wp 95
Figure 86: Current division of the bill 96Figure 87: Scenario 1, 50 kWp system: Annual
Cash flow: 100% grant funded case at R18/Wp 99
Figure 88: Scenario 1, 50 kWp system: Annual Cash flow: 50% grant funded case at R18/Wp 99
Figure 89: Scenario 1, 50 kWp system: Annual Cash flow: 100% debt funded case at R18/Wp 100
Figure 90: Scenario 1, 50 kWp system: Cumulative net cash flow with 100% grant funded case at R18/Wp 100
Figure 91: Scenario 1, 50 kWp system: Cumulative net cash flow with 50% grant funded case at R18/Wp 101
Figure 92: Scenario 1, 50 kWp system: Cumulative net cash flow for the 100% debt funded case at R18/Wp 101
Figure 93: Scenario 1, 50 kWp system: Cumulative cost for the 100% grant funded case at R18/Wp 102
Figure 94: Scenario 1, 50 kWp system: Cumulative cost for the 50% grant funded case at R18/Wp 102
Figure 95: Scenario 1, 50 kWp system: Cumulative cost for the 100% debt funded case at R18/Wp 103
Figure 96: Current division of the bill on the Eskom Megaflex local authority tariff 104
Figure 97: Scenario 2, 50 kWp system: Annual Cash flow: 100% grant funded case at R18/Wp 107
Figure 98: Scenario 2, 50 kWp system: Annual Cash flow: 50% grant funded case at R18/Wp 108
Figure 99: Scenario 2, 50 kWp system: Annual Cash flow: 100% debt funded case at R18/Wp 108
Figure 100: Scenario 2, 50 kWp system: Cumulative net cash flow with 100% grant funded case at R18/Wp 109
Figure 101: Scenario 2, 50 kWp system: Cumulative net cash flow with 50% grant funded case at R18/Wp 109
Figure 102: Scenario 2, 50 kWp system: Cumulative net cash flow for the 100 % debt funded case at R18/Wp 110
Figure 103: Scenario 2, 50 kWp system: Cumulative cost for the 100% grant funded case at R18/Wp 110
Figure 104: Scenario 2, 50 kWp system: Cumulative cost for the 50% grant funded case at R18/Wp 111
Figure 105: Scenario 2, 50 kWp system: Cumulative cost for the 100% debt funded case at R18/Wp 111
Figure 106: Scenario 3, 50 kWp system: Annual Cash flow: 100% grant funded case at R18/Wp 115
Figure 107: Scenario 3, 50 kWp system: Annual Cash flow: 50% grant funded case at R18/Wp 116
Figure 108: Scenario 3, 50 kWp system: Annual Cash flow: 100% debt funded case at R18/Wp 116
Figure 109: Scenario 3, 50 kWp system: Cumulative net cash flow with 100% grant funded case at R18/Wp 117
Figure 110: Scenario 3, 50 kWp system: Cumulative net cash flow with 50% grant funded case at R18/Wp 117
Figure 111: Scenario 3, 50 kWp system: Cumulative net cash flow for the 100% debt funded case at R18/Wp 118
Figure 112: Scenario 3, 50 kWp system: Cumulative cost for the 100% grant funded case at R18/Wp 118
Figure 113: Scenario 3, 50 kWp system: Cumulative cost for the 50% grant funded case at R18/Wp 119
Figure 114: Scenario 3, 50 kWp system: Cumulative cost for the 100% debt funded case at R18/Wp 119
Page 8 | Potential for integration of distributed solar photovoltaic systems in Drakenstein municipality

LIST OF TABLESTable 1: PV output comparison across South
Africa 15Table 2: Electricity use for IMPERIAL Cargo
for 2014 21Table 3: Drakenstein maximum PV installations 26Table 4: Substation energy usage for 2014 and
potential PV energy generation 27Table 5: Reduction of Eskom bill when
24 244 kWp PV is installed 37Table 6: Fixed monthly charges for Drakenstein
residential electricity customers 39Table 7: Reduction in electricity income for
Drakenstein municipality from 8 000 x 3 kWp residential PV installations 39
Table 8: Fixed monthly charges for Drakenstein commercial electricity customers 40
Table 9: Reduction in electricity income for Drakenstein municipality from 800 x 30 kWp commercial PV installations 41
Table 10: Electricity Building Site Information 43Table 11: PV system specifications 44Table 12: Average yearly sum of global irradiation
for different system configurations 45Table 13: System losses and Performance ratio 46Table 14: Civic Centre Site Information 47Table 15: PV system specifications 48Table 16: Average yearly sum of global irradiation
for different system configurations 49Table 17: System losses and Performance ratio 51Table 18: 1 Market Street Building Site
Information 51Table 19: PV system specifications 53Table 20: Average yearly sum of global irradiation
for different system configurations 53Table 21: System losses and Performance ratio 55Table 22: Site comparison 55Table 23: 1 Market Street, Paarl: Building Site
Information 61Table 24: 25 kWp system production output and
production losses 69Table 25: 50 kWp system production output and
production losses 73Table 26: Financial model assumptions 76
Table 27: Bulk Time of Use Medium Voltage Tariff 2014/2015 78
Table 28: Potential savings for year 1 79Table 29: Financial results for scenario 1 @ R 16/
Wp, 25 kWp system 80Table 30: Financial results for scenario 1 @ R 18/
Wp, 25 kWp system 80Table 31: Financial results for scenario 1 @ R 20/
Wp, 25 kWp system 81Table 32: Eskom Megaflex – Local authority rates
2014/2015 87Table 33: Potential savings for year 1 on the
Eskom Megaflex tariff 88Table 34: Financial results for scenario 1 @ R 16/
Wp, 25kWp system 89Table 35: Financial results for scenario 1 @ R 18/
Wp,25 kWp system 89Table 36: Financial results for scenario 1 @ R 20/
Wp, 25kWp system 90Table 37: Bulk Time of Use Medium Voltage
Tariff 2014/2015 96Table 38: Potential savings for year 1 for scenario
1: 50 kWp system 96Table 39: Financial results for scenario 1 @ R 16/
Wp, 50 kWp system 97Table 40: Financial results for scenario 1 @ R 18/
Wp, 50 kWp system 97Table 41: Financial results for scenario 1 @ R 20/
Wp, 50 kWp system 98Table 42: Megaflex – Local authority rates
2014/2015 104Table 43: Potential savings for year 1 on the
Eskom Megaflex tariff 105Table 44: Financial results for scenario 2 @ R 16/
Wp,50 kWp system 105Table 45: Financial results for scenario 2 @ R 18/
Wp,50 kWp system 106Table 46: Financial results for scenario 2 @
R 20/Wp, 50 kWp system 106Table 47: Large Power Users Small Scale
Embedded Generation Medium Voltage 2014/2015 112
Table 48: Potential savings for year 1 on the Large Power Users Small Scale Embedded Generation Medium Voltage tariff 113
Table 49: Financial results for scenario 3 @ R 16/Wp, 50 kWp system 113
Potential for integration of distributed solar photovoltaic systems in Drakenstein municipality | Page 9

LIST OF ABBREVIATIONSAC Alternating CurrentBoS Balance of SystemBoQ Bill of QuantityCRSES Centre for Renewable and Sustainable
Energy StudiesCSP Concentrated Solar PowerDC Direct CurrentDNI Direct Normal IrradiationDoE Department of EnergyEPC Engineering, Procurement and ConstructionEG Embedded GenerationGHI Global Horizontal Irradiation GTI Global Tilt IrradiationGW GigawattGWh Gigawatt hourHV High VoltagekW KilowattLCOE Levelised Cost of ElectricitykWh Kilowatt hourkWp Kilowatt peak LV Low Voltage MPPT Maximum Power Point TrackingMV Medium Voltage MW MegawattMWh Megawatt hourMWp Megawatt peakMYPD Multi-Year Price DeterminationNERSA National Energy Regulator of South Africa NMD Notified Maximum DemandO&M Operation and Maintenance PPA Power Purchase AgreementPR Performance RatioPV PhotovoltaicRE Renewable Energy REIPPPP Renewable Energy Independent Power
Producers Procurement ProgrammeSTC Standard Testing ConditionsVAT Value Added TaxWWF-SA World Wide Fund for Nature South Africa
Table 50: Financial results for scenario 3 @ R 18/Wp, 50 kWp system 114
Table 51: Financial results for scenario 3 @ R 20/Wp, 50 kWp system 114
Table 52: Summary of the financial feasibility of the 25 kWp system at R18/Wp 121
Table 53: Summary of the financial feasibility of the 50 kWp system at R18/Wp 122
Page 10 | Potential for integration of distributed solar photovoltaic systems in Drakenstein municipality

INTRODUCTIONThe utility scale renewable energy market has achieved much success in the South African energy market and is making a notable difference within the energy mix of South Africa. However, on a much smaller scale, distributed embedded generation such as rooftop PV can also help relieve some of the pressure on the constrained electricity grid. However, in the municipal context, the challenges experienced to manage the uptake embedded RE generation as new plants become operational, and micro or distributed grids emerge, the role of the managing municipality and service requirements of consumers at source needs to be addressed.
Electricity revenue and municipal financial survival are often closely linked in South African municipalities operating as electricity distributors in that surplus electricity revenue is fed into municipal coffers, subsidising a range of other municipal services. In addition, revenue from ‘high-end’ users (larger residential and other consumers) is routinely used to cross subsidise ‘losses’ from providing power to poor households which are not fully covered by the national Equitable Share grant1.
The threat of revenue loss linked to reduced sales from energy efficiency and solar water heating programmes has often resulted in resistance by municipal electricity departments to such initiatives. However, today it is widely accepted that such changes are inevitable, as increasing numbers of consumers are installing electricity saving technologies and even generating their own electricity in response to the high electricity prices and increasing availability of cheaper alternatives (e.g. solar PV).
Although municipalities realise the climate change mitigation potential from renewable energy, they often see private installations as a threat to their revenue from electricity sales, have concerns about electricity supply quality and safety, and fear the possibility of the increased administrative burden2. Drakenstein Municipality is no different. Increasingly, it is losing revenue from high-end and/or large consumers that are investing in renewable energy technologies. These customers are key revenue generators for the municipality and important for enabling cross-subsidisation of the ever increasing proportions of poor households.
Existing research3 shows that municipalities can protect the financial viability of their electricity supply operations by ensuring that the cost of network connectivity of each customer is recovered, even when PV zeroes the net energy consumption, and that the cost at which energy is bought from a PV exporter is no more than the equivalent cost paid by the municipality to Eskom. Drakenstein have taken cognizance of this, but is of the opinion that their future strategy should be more proactive and that they should investigate the potential of a micro and or distributed grid to enable them to also generate their own electricity and on-selling to their consumers. Pursuing such a strategy would not only address decreasing revenue, energy security and climate change, but might also speak to the grid challenges.
1 Janish.A.&Others.2014.Thepotentialimpactofefficiencymeasuredanddistributedgenerationonmunicipalelectricityrevenue:DoublyewhammiesanddeathSpirals.Availableat:http://www.cityenergy.org.za/uploads/resource_23.pdf[accessedon8/92014]
2 http://www.crses.sun.ac.za/files/services/events/forums/services_events_forum_kritzinger(2).pdf3 CRSESstudy
Potential for integration of distributed solar photovoltaic systems in Drakenstein municipality | Page 11

The report is divided in three parts. Part A of the report presents two case studies of current instances of installed private PV systems within the Drakenstein municipality. The case studies examine both an industrial and residential case. Extrapolating from these cases, an analysis is carried out to determine the effects the maximum installable amount of PV, before grid studies need to be carried out, will have on the load profiles of the substations in Drakenstein municipality. Typical summer and winter days are examined in detail.
Making use of the results of Part A, Part B indicates the impact that these installations will have on municipal revenue. The monthly electricity usage profiles for electricity users in Drakenstein is then analysed and the financial impact on the municipality is calculated.
Part C of the report identifies opportunities for the municipality to install solar photovoltaic technologies on municipal owned buildings and/or municipal land, based on generic data. The three municipal sites identified are (see Figure 1) the electricity building (1 Jan Van Riebeeck Drive), the Civic Centre (Bergriver Boulevard) and the Civil Engineering building (1 Market Street).
In Part D, a full prefeasibility study is conducted on the 1 Market Street building to determine the viability of installing solar PV. This site was identified in consultation with Drakenstein municipality.
Figure 1: The location of the three analysed buildings in the PV Opportunities Report
.
Page 12 | Potential for integration of distributed solar photovoltaic systems in Drakenstein municipality

Location
Drakenstein Municipality is a local municipality located within the Cape Winelands District Municipality, in the Western Cape province of South Africa. The municipality covers a total area of 1,538 square kilometres in the valley of the Berg River. It stretches about 75 kilometres from Saron in the north to beyond Paarl in the south. The neighbouring municipalities are the Witzenberg Municipality and Breede Valley Municipality to the east, the Stellenbosch Municipality to the south, the City of Cape Town and the Swartland Municipality to the west, and the Bergrivier Municipality to the north. According to the 2011 census Drakenstein municipality has a population of 251,262 people in 59,774 households.
The principal town and location of the municipal headquarters is Paarl, situated in the south of the municipality, which as of 2011 has a population of 112,045 people. Paarl is the southernmost part of a continuous built-up area along the Berg River which also includes Mbekweni (pop. 30,875) and Wellington (pop. 55,543). In the northern part of the municipality are the smaller towns of Gouda (pop. 3,441) and Saron (pop. 7,843).
The town of Paarl is located at the coordinates of -33.724° S; 18.956° E. Figure 2 shows that the town is located in a valley with Paarl Mountain to the west and Haweqwa mountain range to the east.
Figure 2: Satellite view of Paarl Town from Google Earth
BACKGROUND
Potential for integration of distributed solar photovoltaic systems in Drakenstein municipality | Page 13

Solar PV Production Potential
The solar resource for Paarl town is examined. PV panel power production is directly proportional to the solar irradiance (solar energy) incident on the panel surface. For the suggested type of PV plant, the irradiation component of interest in assessing the solar resource is the Global Tilt Irradiation (GTI). Considering the solar resource and the optimally mounted angle for PV panels at each location, which maximises energy generation, a PV output map can be generated for South Africa, Figure 3.
PV systems’ production potential is measured as the amount of electricity (kWh) that can be produced during a year, for the peak amount of PV power installed (kWp) on the same area. The units for PV production potential (specific yield) are kWh/kWp per year.
Figure 3: PV output map for South Africa, measured in annual kWh production per kWp installed
Table 1 shows this output for various locations around South Africa, as obtained from PVPlanner software. Note that this is merely an approximation, as the local shading effects are not taken into account.
Page 14 | Potential for integration of distributed solar photovoltaic systems in Drakenstein municipality

Table 1: PV output comparison across South Africa4
Location Annual PV output (optimally inclined)
Paarl 1632kWh/kWp
Pretoria 1731kWh/kWp
Kimberley 1854kWh/kWp
The sun path diagram, Figure 45, show the shading effects due to the mountains surrounding Paarl. The diagram allows the visual representation of the sun’s movement and shading effect on the PV system during different times of the day and different seasons, throughout the year.
Figure 4: Terrain horizon and day length for 1 Market Street, Paarl
The effect of the mountain ranges on either side of Paarl town is seen clearly in Figure 4, with the predominant loss of generation in the late afternoon due to shading causes by Paarl Mountain. In summer Paarl mountain will limit PV production from 18:00 (upper curve) and in winter from 16:00 (lower curve). However it must also be noted that even though these shading effects shorten the PV production day, during the late afternoon PV panels will not produce electricity at rated power due to the low incidence angle of the sun on the PV panels. The localised orientation and azimuth effects will be considered when a detailed solar analysis of the building is carried out.
4 OutputforvariouslocationsaroundSouthAfrica,asobtainedfromPVPlannersoftware.Notethatthisismerelyanapproximation,asthelocalshadingeffectsarenottakenintoaccount.
5 ShadingdiagramproducedbyPVPlannersoftware,GeoModelSolar
Potential for integration of distributed solar photovoltaic systems in Drakenstein municipality | Page 15

By sourcing the average yearly data, Table 1, it is found that Paarl has a fair solar resource when compared to other locations in South Africa. In South Africa, projects in the range of 1 600 kWh/kWp to 1 800 kWh/kWp per year are considered to be a feasible range for PV projects, above this is considered to be excellent and below is considered to be poor. However, feasible projects have been completed in ranges below 1 600 kWh/kWp, but an extended payback period is seen. It should however be noted here that Germany, the country with the highest penetration of PV in the world, has a PV production (specific yield) of below 1 000 kWh/kWp per year.
Page 16 | Potential for integration of distributed solar photovoltaic systems in Drakenstein municipality

Introduction
The potential for embedded generation solar photovoltaic (PV) technology in Drakenstein by the private sector is investigated.
The following information was received from Drakenstein Municipality to aid in the research;
� Monthly invoices from Eskom for the five substations in Drakenstein � Load profiles for three of these substations; � Monthly electricity purchases for all prepaid customers in Drakenstein for July
2012 to February 2015 � Monthly metered electricity statistics for all credit customers in Drakenstein for
the period July 2013 to January 2015
The maximum amount of PV that can be installed in Drakenstein before grid studies are required is quantified. The electricity generated from this calculated installed PV capacity is compared to the load profiles at three substations in Drakenstein.
Drakenstein Case Studies
Two case studies of currently installed embedded PV are presented to illustrate the impact of that such installations can possibly have on municipal electricity sales. An industrial and residential installation is examined and represents typical embedded generation installations for these user groups.
Case Study 1: Industrial installation
“Transforming a dumpsite to a Western Cape ‘Green Logistics’ Landmark”6
The offices and warehouses of IMPERIAL Cargo are located on a four hectare site between Paarl and Wellington. The property houses offices for 120 employees, a 2 000 m2 warehouse, wash bays and a workshop. IMPERIAL Cargo considers this site to be a renewable energy landmark in the logistics sector. The property was developed as a Greenfield project opening its doors in June 2011.
6 Formoreinformationsee:http://www.imperiallogistics.co.za/documents/IMPERIAL-CARGO-GREEN-HUB.pdf
THE POTENTIAL FOR PV IN DRAKENSTEIN
Potential for integration of distributed solar photovoltaic systems in Drakenstein municipality | Page 17

Figure 5: Google Earth image of IMPERIAL Cargo site from 1 April 2010
Figure 6: Google Earth image of IMPERIAL Cargo site from 31 January 2015
Page 18 | Potential for integration of distributed solar photovoltaic systems in Drakenstein municipality

On top of many other innovative green technologies incorporated in the IMPERIAL Cargo site, including optimal use of natural light, solar geysers, low energy lights and motion sensors, the rooftop of the warehouse also has a 30kWp PV installation. This was one of the largest PV installations in the Western Cape when it was installed.
The PV system consists of eleven identical subsystems and includes some battery storage. It is thus safe to assume that no electricity is fed back into the grid and all electricity generated is used as self-consumption.
IMPERIAL Cargo purchases its electricity from Drakenstein municipality on the “Commercial 3 phase 150 Amp” tariff structure and purchased 311 081 kWh from Drakenstein municipality in 2014.
Figure 7: The 30kWp PV installation at IMPERIAL Cargo with battery storage
PVPlanner software7 was used to calculate the yearly PV production for the IMPERIAL Cargo site. The azimuth used in the software was 305 degrees (northwest)8, which is the actual orientation of the roof. The inclination was taken as 30 degrees. The specific yield for this site is 1 527 kWh/kWp per year. For the PV installation of 30 kWp, the average yearly PV electricity generation amounts to 45 810 kWh per year.
The monthly PV electricity generation for this site varies from 2 241 kWh for June to 5 301 kWh for January. The monthly generation of electricity can be seen in Figure 8.
7 http://solargis.info/pvplanner8 thisis55degreesWestofNorth
Potential for integration of distributed solar photovoltaic systems in Drakenstein municipality | Page 19

Figure 8: Monthly PV production for the IMPERIAL Cargo site
The total electricity use for 2014 for Imperial Cargo is 357 879 kWh: 45 798 kWh form PV and 311 081 kWh purchased from Drakenstein Municipality. The electricity used from the PV and purchased from Drakenstein municipality can be seen in Figure 9.
Figure 9: Total electricity use per month for IMPERIAL Cargo for 1 July 2013 to 31 December 2014
The electricity generated by the PV is about 13% of total electricity use for this period. This differs from as high as 22% in the summer months to as low as 7% in the winter months. See Table 2.
Page 20 | Potential for integration of distributed solar photovoltaic systems in Drakenstein municipality

Table 2: Electricity use for IMPERIAL Cargo for 2014
Total electricity use
Electricity use from PV (30 kWp)
PV generation as a percentage of total use
January2014 23902 5301 22%
February2014 35935 4518 13%
March2014 29545 4 422 15%
April 2014 21 174 3336 16%
May2014 27921 2625 9%
June2014 30862 2 241 7%
July2014 24775 2544 10%
August2014 37928 2910 8%
September2014 29580 3537 12%
October2014 26723 4491 17%
November2014 34726 4743 14%
December2014 33808 5130 15%
Total for 2014 Jan toDec
356879 45798 12.83%
Case Study 2: Residential Installation
A home owner from Paarl, who wished to remain anonymous, installed a 4.25 kWp PV system on the roof of his home at the end of 2014.
There is an extended family living on the property and all adults work from home. The family has installed a number of energy efficient and fuel-switching options over the years, as can be seen in Figure 10.
Potential for integration of distributed solar photovoltaic systems in Drakenstein municipality | Page 21

Figure 10: Fuelswitching,energyefficientandrenewableenergytechnologies installed by the home owner as compared to electricity usage averaged over 6 months: 2010 to 2014
Figure 11: The 4.25 kWp installation at a private home in Paarl
PVPlanner software9 was used to calculate the yearly PV production for this site. The azimuth used in the software two degrees west of North, which is the actual orientation of the roof. The inclination was taken as 30 degrees. The PV potential production for this site is 1 596 kWh/kWp/year. For the PV installation of 4.25 kWp, the average yearly PV electricity generation amounts to 6 758 kWh per year.
The monthly PV electricity generation for this site varies from 357 kWh for June to 727 kWh for January.
This home owner purchases electricity from Drakenstein Municipality on a credit meter and is on the single phase 160 Amp tariff for residential users. They purchased 15 444 kWh of electricity from Drakenstein Municipality in 2013 and 13 541 kWh for 2014.
9 http://solargis.info/pvplanner
Page 22 | Potential for integration of distributed solar photovoltaic systems in Drakenstein municipality

The impact that the PV installation could have had on the monthly electricity bill for this homeowner had it been installed in January 2010 is estimated in Figure 12.
Figure 12: Total electricity purchased from Drakenstein and consumed from PV generation for the residential user had the PV been installed since January 2010
Methodology to calculate maximum installable PV in Drakenstein
Embedded Generation Rules in South Africa
There are no specific standards or regulations currently in place in South Africa for small-scale embedded generation (SSEG), but the National Regulation, NRS 097-2-1:2010, covers the utility interface of grid interconnected embedded generation. In the 2010 edition of the NRS097-2-1 document, the size of an embedded generator is limited to the rating of the supply point on the premises while the NRS097-2-3:2014 specification sets out the technical requirements for the utility interface, the embedded generator and the utility distribution network with respect to embedded generation. The specification applies to embedded generators smaller than 100 kW connected to low-voltage (LV) networks.
Section 4.5 of the NRS097-2-3:2014 specification gives a summary of the connection criteria as shown in Figure 13.
Potential for integration of distributed solar photovoltaic systems in Drakenstein municipality | Page 23

Figure 13: Summaryofsimplifiedconnectioncriteria
Solar Data
The solar data used in the hind cast model to predict the PV plant production output is sourced from SoDa solar radiation data. The Solar irradiation data that is supplied by SoDa is from the HelioClim database, which combines measurements from ground stations and satellite data, and provides hourly GHI data that is used in the PVsyst software for detailed modelling. The layout of the panels and area covered is determined by the selected equipment and spacing thereof.
PVsyst software is used to model final production estimates. PVsyst software allows for detailed modelling, taking into account the effects of local shading, equipment losses, and panel- and string layouts, among other features. There are standard industry practices used in the report, which will not be described in detail.
In order to model the potential production of a PV array, a specific PV panel and inverter needs to be selected. The choice of reference equipment is based on global statistics on the manufacturers’ production volumes, age of the company and the manufacturer having an established presence in South Africa.
The reference PV panel that is used for modelling purposes is the polycrystalline panel available from Yingli Solar, YL250P-29b. Yingli Solar is one of the top global producers of PV panels that has been manufacturing for more than 15 years and fall in the Gigawatt production category. The panels are assumed to be north facing with a tilt angle optimised for maximum annual production. The reference inverter used is a SMA Sunny Boy 2,5 kW inverter. SMA is currently the largest inverter manufacturer globally, with more than 25 years of experience and an established
Page 24 | Potential for integration of distributed solar photovoltaic systems in Drakenstein municipality

local market. Both of the reference equipment manufacturers are very large globally and in South Africa with proven reliability.
The study and its results are impacted by data inconsistencies, loss assumptions and equipment selection. Owing to the unpredictable nature of the climate and the variety of installation setups, the actual production of the installation can differ from the predicted values. The results of the study is therefore for decision making purposes and should not be used as an accurate prediction of the PV production of the installed system.
Information received from Drakenstein municipality
There are five substations in Drakenstein municipality that are billed monthly by Eskom, namely;
� Dalweiding, 60 000 kVA: Noorder Paarl, Daljosafat Industrial and Paarl East � Hugenote, 60 000 kVA: Central Business district, Denneburg, Boschenmeer � Dwarsrivier, 30 000 kVA: Pniel, Hollanse Molen, Victor Verster, Pearl Valley and
Val de Vie � Wellington, 30 000 kVA � Slot, 30 000 kVA
The Eskom accounts for these substations, the transformer capacity, firm capacity and some hourly load data was made available to this study by Drakenstein Municipality. The maximum load figures were derived from the Eskom accounts. See Appendix 2.
Hourly load data was made available for the following substations; � Dalweiding: 4 February 2015 to 20 April 2015 in one minute intervals � Hugenote: 15 April 2014 to 21 April 2015 in half an hour intervals � Dwarsrivier: 25 January 2015 to 20 April 2015 in one minute intervals
PV potential using NRS097-3 rules
To quantify the maximum installation capacity of PV in Drakenstein, a conservative approach is taken by using 15% of maximum load at the substations. This data is derived from the Eskom accounts and can be seen in Appendix 2. This is the amount of embedded generation capacity that can be installed before a grid study is needed. It is possible that detailed grid studies will reveal that the potential is much higher, but this is the potential that can be installed in a reasonably short time.
Looking at Figure 13, it is shown that embedded generation should not exceed 25% of the notified maximum demand where customers are supplied by shared low voltage feeders and where dedicated low voltage feeders exist the embedded generation should not exceed 75% of the notified maximum demand. Higher up in the supply chain it is suggested that embedded generation does not exceed 15% of the demand from a medium voltage feeder.
If the NRS097-3 rules are applied to the maximum load at substation level, over 24 MWp
10 of PV can be installed in Drakenstein as seen in Table 3. This is equal
10 Thisisequalto24244kWp
Potential for integration of distributed solar photovoltaic systems in Drakenstein municipality | Page 25

to over 800 installations the size of IMPERIAL Cargo (30 kWp) or over 5 700 installations the size of the homeowner (4.25 kWp) as discussed in
Case Study 2: Residential Installation. To put this into perspective, this is more than twice as much as all the installations in the Western Cape to date (see Appendix 1 for a list of installations).
Table 3: Drakenstein maximum PV installations
Transmis-sion Sub-station Name
In-stalled Trans-former Ca-pacity [kVA]
N-1 [kVA]
NMD [kVA]
Peak Load [kW]
15% of in-stalled capac-ity - PV [kW]
15% of NMD [kVA]
15% of Peak Load – PV [kWp]
Dalweiding 60 000 45000 55000 50407 9000 8250 7561
Dwarsrivier 30000 15000 20 000 10 422 4500 3000 1536
Hugenote 60 000 45000 60 000 65699 9000 9000 9855
Wellington 30000 15000 25000 24907 4500 3750 3736
Slot 30000 15000 12 000 10191 4500 1800 1529
TOTAL 210 000 135000 172 000 31500 25800 24 244
Four typical 250 Wp solar PV modules (giving 1 000 Wp or 1 kWp) will cover an area of about 6.5 m2. If allowance is made for spacing between panels, wiring, brackets etc., it can be conservatively estimated that the area needed to install 1 kWp of PV is about 10 m2. This means that the area needed to install 1 MWp of PV is about 1 hectare (ha).
Impact of maximum PV generation on the load profile
PVsyst software was used to model final production estimates per hour for 2014 and 2015. These production estimates were then plotted against the load profiles per transmission substation where this was available to show the impact that solar PV can have. The Civic Centre in central Paarl was taken as the site and the mounting angle of the PV modules was optimised for annual energy production.
Impact of PV on energy demand
The energy demand on the individual substations is shown in Table 4, along with the energy that could have been supplied by solar PV if 31.5 MWp of PV or 24.2 MWp of PV was installed in the Drakenstein in 2014. As a comparison, 31.5 MWp PV would have generated 53 213 MWh of energy, the equivalent to providing more than 9 700 houses with electricity for a full year11.
11 Thisfigureiscalculatedwiththeassumptionthatahouseholdconsumes15kWhperday.
Page 26 | Potential for integration of distributed solar photovoltaic systems in Drakenstein municipality

Table 4: Substation energy usage for 2014 and potential PV energy generation1213
Trans-mission Substation Name
Installed Trans-former Capacity [kVA]
Energy used during 2014 [MWh]12
15% of Transformer Capacity
15 % of Peak load
Poten-tial PV installed [kW]
Poten-tial PV Energy for 2014 [MWh]13
Poten-tial PV installed [kWp]
Poten-tial PV Energy for 2014 [MWh]
Dalweiding 60 000 263774 9000 15204 7561 12773
Dwarsrivier 30000 72 441 4500 7 602 1536 2595
Hugenot 60 000 252287 9000 15204 9855 16648
Wellington 30000 121864 4500 7 602 3736 6311
Slot 30000 29300 4500 7 602 1529 2583
TOTAL 210 000 739665 31500 53213 24 244 40910
ImpactofPVontheloadprofileforasummerweek
The impact of Solar PV on the combined load profile of the Dalweiding, Hugenote and Dwarsrivier substations for a summer week is shown in Figure 14. The fall in the load seen on Monday, 9 February and Saturday, 14 February 2015, is the effect of load shedding on two of the substations14. The energy contributions are shown for the conservative case (yellow on figure) where 15% of the peak energy demand was used to calculate the PV contribution and the additional solar energy (orange on graph) is shown that could have been generated if 15% of the installed transformer capacity was used to estimate the PV production15. Outlined in black on the graph is the total energy demand profile of the three substations for 9 to 15 February 2015, while the grey area would be the resulting load Eskom would have had to supply if these potential solar PV installations were contributing to the network.
12 FromtheEskomaccounts13 1689kWh/kWp/year,ascalculatedbyPVSystSoftware,Northfacingwithoptimaltiltusingthe
DrakensteinCivicCentreincentralPaarlasthereferencesite14 ThePVsystemsalonewillnotbeableprovideelectricityduringloadshedding.Ifelectricityisneeded
duringloadshedding,thePVsystemswillneedtobesupplementedwithbatteriesand/orothergenerators.
15 AsthepeakloadaccordingtotheEskomaccountsfortheHugenotesubstationwasmorethantheinstalledcapacity,15%ofinstalledcapacitywastakenastheconservativecapacityand15%ofthepeakloadasadditionalpossiblecapacity.
Potential for integration of distributed solar photovoltaic systems in Drakenstein municipality | Page 27

Figure 14: ImpactofPVgenerationontheloadprofileofthreesubstations16 in Drakenstein for a summer week17
The impact of solar PV for a summer week on the three individual substations that hourly load data was available for, can be seen in Figure 15, Figure 16 and Figure 17.
Figure 15: ImpactofPVgenerationontheloadprofileDalweidingsubstation for a summer week18
16 Dwarsrivier,DalweidingandHugenote17 Instantaneouspowervaluesforanhourisaveragedoverthehour,resultinginthekWvalueindicated
onthey-axis18 Instantaneouspowervaluesforanhourisaveragedoverthehour,resultinginthekWvalueindicated
onthey-axis
Page 28 | Potential for integration of distributed solar photovoltaic systems in Drakenstein municipality

Figure 16: ImpactofPVgenerationontheloadprofileHugenotesubstation for a summer week
Figure 17: ImpactofPVgenerationontheloadprofileDwarsriviersubstation for a summer week19
19 Instantaneouspowervaluesforanhourisaveragedoverthehour,resultinginthekWvalueindicatedonthey-axis
Potential for integration of distributed solar photovoltaic systems in Drakenstein municipality | Page 29

ImpactofPVontheloadprofileforawinterweek
The only substation in Drakenstein where load data was available for a winter week is the Hugenote substation. This substation feeds electricity to the Paarl central business district, Denneburg and Boschenmeer. The impact of Solar PV on the load profile of the Hugenote substation for a winter week is shown in Figure 18.
Figure 18: ImpactofPVgenerationontheloadprofileHugenotesubstation for a winter week
As can be seen in Figure 18, the Monday, Saturday and Sunday from this specific week, were cloudy winter days and Tuesday to Friday were sunny winter days.
ImpactofPVontheloadprofileofasummerday
The impact of Solar PV on the load profile of the three substations that load data was available for, as well as the combined load profile of Drakenstein is shown in the Figure 19, Figure 20, Figure 21 and Figure 22. The energy contribution is shown for the conservative case (yellow on figure) where only 15% of the peak energy demand was used to calculate the PV contribution and the additional solar energy (orange on graph) is shown that could have been generated if 15% of the installed transformer capacity was used to estimate the PV production20. Outlined in black on the graph is the total energy demand profile of Drakenstein, while the grey area would be the resulting load Eskom would have had to supply if these potential solar PV installations were contributing to the network.
20 AsthepeakloadaccordingtotheEskomaccountsfortheHugenotesubstationwasmorethantheinstalledcapacity,15%ofinstalledcapacitywastakenastheconservativecapacityand15%ofthepeakloadasadditionalpossiblecapacity.
Page 30 | Potential for integration of distributed solar photovoltaic systems in Drakenstein municipality

Figure 19: ImpactofPVgenerationontheloadprofilethreesubstationsin Drakenstein for a summer day21
Figure 20: ImpactofPVgenerationontheloadprofileHugenotesubstations for a summer day22
21 Instantaneouspowervaluesforanhourisaveragedoverthehour,resultinginthekWvalueindicatedonthey-axis
22 Instantaneouspowervaluesforanhourisaveragedoverthehour,resultinginthekWvalueindicatedonthey-axis
Potential for integration of distributed solar photovoltaic systems in Drakenstein municipality | Page 31

Figure 21: ImpactofPVgenerationontheloadprofileDalweidingsubstations for a summer day
Figure 22: ImpactofPVgenerationontheloadprofileDwarsriviersubstations for a summer day23
ImpactofPVontheloadprofileofawinterday
The only winter load data that was available, is for Hugenote substation. The impact of Solar PV on the load profile on a sunny winter and a cloudy winter day is can only be shown for Hugenote substation. The total electricity generation for 24 244 kWp of solar PV installations for a cloudy day, 9 June 2014, was 9 638 kWh. The equivalent electricity generation for a sunny winter day (11 June 2014) was four times as much, at 40 014 kWh for the same capacity of installations24. See Figure 23 and Figure 24.
23 Instantaneouspowervaluesforanhourisaveragedoverthehour,resultinginthekWvalueindicatedonthey-axis
24 TheelectricitygenerationforthesamecapacityofsolarPVinstallationsforSaturday,15June2015wasevenlowerat5838kWh.
Page 32 | Potential for integration of distributed solar photovoltaic systems in Drakenstein municipality

Figure 23: ImpactofPVgenerationontheloadprofileofHugenotesubstations for a cloudy winter day25
Figure 24: ImpactofPVgenerationontheloadprofileofHugenotesubstations for a sunny winter day26
Potential PV Systems by analysing electricity use
In the section above, the maximum PV system installations in Drakenstein was calculated, using the substation capacities. In this section, the electricity user profiles of Drakenstein municipality is analysed to see what the actual potential for PV system installations are from the electricity users’ perspective.
25 Instantaneouspowervaluesforanhourisaveragedoverthehour,resultinginthekWvalueindicatedonthey-axis
26 Instantaneouspowervaluesforanhourisaveragedoverthehour,resultinginthekWvalueindicatedonthey-axis
Potential for integration of distributed solar photovoltaic systems in Drakenstein municipality | Page 33

Potential PV installations on residential homes
Drakenstein municipality purchased a total of 739 665 MWh of electricity from Eskom in 201427. The months with the highest electricity use, was February and March and the months with the lowest electricity use, were April and September. Electricity use is highest in the summer months, lower in the winter and at its lowest in spring and autumn.
Figure 25: Monthly electricity use in Drakenstein per substation28
There were about 32 000 residential users purchasing prepaid electricity in 2014. About half of these customers regularly purchase more than 200 kWh of electricity per month, and about 7 000 regularly purchase more than 500 kWh per month.
There were about 9 000 residential electricity users with credit meters in Drakenstein in 2014. Of the users, about 4 500 users regularly use more than 500 kWh per month.
In total there were about 11 500 residential electricity users in Drakenstein who regularly use more than 500 kWh of electricity per month. In Table 3 it was seen that the technical maximum solar PV that can be installed in Drakenstein before grid studies are needed, is 24 244 kWp. This amounts to over 5 700 residential users installing solar PV systems of the size seen in 0 [???????]
Case Study 2: Residential Installation. If a more reasonable 3 kWp is taken as the average residential installation, this equates to over 8 000 residential installations29.
This equates means that between 50 and 70% of Drakenstein residences who regularly use more than 500 kWh of electricity per month can install rooftop PV before grid studies are needed.
27 AswasshowninTable428 DatafromtheDrakensteinmuniciplaityEskombills.AlsoseeAppendix3.29 Itisassumedherethatresidentswhouselessthan500kWhofelectricitypermonthareunlikelyto
installsolarPVontheirrooftops.
Page 34 | Potential for integration of distributed solar photovoltaic systems in Drakenstein municipality

Should all the residential customers in Drakenstein who use more than 500 kWh per month install rooftop PV of 3 kWp each, this would amount to 34 500 kWp, about 40 % more than what would be allowed before requiring grid studies. This is, however a very unlikely scenario.
Potential PV installations on industrial buildings
There were about 600 business customers on prepaid for 2014. Most of these prepaid customers purchase less than 1 000 kWh of electricity per month and are unlikely to install large solar PV on their rooftops.
There were about 2 500 credit customers in Drakenstein for 2014 on industrial, rural and commercial tariffs. In Table 3 it was seen that the technical maximum solar PV that can be installed in Drakenstein before grid studies are needed, is 24 244 kWp. This adds up to over 800 commercial users installing solar PV systems of the size seen in A.2.1: Case Study 1: Industrial installation. This amounts to about 30% of these customers. If larger, 100 kWp installations are taken, this amounts to about 240 of these customers – or about 10%.
Should all of these customers install rooftop PV of 30 kWp average, this would amount to 75 000 kWp installations, 3 times more than the allowable PV installations before grid studies are needed. This is, however an unlikely scenario.
Conclusion
Part A quantifies the maximum amount of PV that can be installed in the Drakenstein municipal district before grid studies are needed. The electricity generated from this calculated installed PV capacity was then compared with the load profiles at the substations that load data was available for, to evaluate the impact.
A conservative approach based on the electricity load profiles at substation level, indicates that just over 24 MWp of distributed solar PV could easily be installed in Drakenstein
Furthermore, if this PV potential is installed across the Drakenstein, the electricity generation from these installations will complement the load profiles well at substation level.
It is further confirmed, when analysing electricity use per customer, that it is highly unlikely that installations of PV systems in Drakenstein will exceed 24 MWp in the short to medium term.
Potential for integration of distributed solar photovoltaic systems in Drakenstein municipality | Page 35

IMPACT OF PV INSTALLATIONS ON MUNICIPAL REVENUE IN DRAKENSTEIN
Introduction
Making use of the results in Part A, the impact that these installations will have on municipal revenue is examined. In Table 3, it was shown that the maximum PV installations in Drakenstein before grid studies will be needed is 24 244 kWp. In this section the effect on the Drakenstein municipal revenue is calculated should this high amount of PV be installed.
The following information was received from Drakenstein Municipality to aid in the research;
� Monthly invoices from Eskom for the five substations in Drakenstein � Load profiles for three of these substations; � Monthly electricity purchases for all prepaid customers in Drakenstein for July
2012 to February 2015 � Monthly metered electricity statistics for all credit customers in Drakenstein for
the period July 2013 to January 2015
The monthly electricity usage profiles for electricity users in Drakenstein is then analysed and the financial impact on the municipality is calculated.
Reduction of Eskom bill for Drakenstein
In Table 3, it was shown that the maximum PV installations in Drakenstein before grid studies will be needed is 24 244 kWp. In this section the impact on the Drakenstein municipal revenue is calculated should this high amount of PV be installed.
Most of the Drakenstein Eskom accounts are billed at Megaflex Diversity. The impact that the installation of 24 244 kWp of PV installations will have on the Drakenstein Eskom account for a full year is calculated on the Megaflex Diversity tariff for 2014 / 2015. Only the active energy charges are considered30.
Eskom defined time periods as can be seen in Figure 2631 were used in the calculations.
30 kVAchargesmightbereducedtoo,butarenotconsideredhere.31 NewYear’sDay,GoodFriday,FamilyDay,ChristmasDayandDayofGoodwillweretreatedas
Sundays.AllotherpublicholidaysweretreatedasSaturdaysunlessitfellonaSundayinwhichcaseitwastreatedasaSunday.
Page 36 | Potential for integration of distributed solar photovoltaic systems in Drakenstein municipality

Figure 26: Eskomdefinedtimeperiods
As can be seen in Table 5, the Eskom bill for Drakenstein would have been reduced by R 23 370 896 for the year, if 24 244 kWp of PV was installed32.
Table 5: Reduction of Eskom bill when 24 244 kWp PV is installed
PV generation
per per 1 kWp PV (kWh)
PV generation per 24 244
kWp PV (kWh)
R/kWh (Megaflex diversity
2014 / 2015)
Total reduction of Eskom bill (VAT excl)
LowSeason-S
eptembertoMay
MondaytoFridayoffpeak
0 0 R0.3165 R0
MondaytoFridayStandard
755 18294771 R0.4989 R9127261
MondaytoFridayPeak
154 3734857 R0.7249 R2707397
Saturdayoffpeak
136 3303503 R0.3165 R1045558
Saturdaystandard
97 2361178 R0.4989 R1177991
Sundayoffpeak
227 5503490 R0.3165 R1741854
32 AscalculatedusingtheEskomMegaflexDiversityTarifffor2014/2015.
Potential for integration of distributed solar photovoltaic systems in Drakenstein municipality | Page 37

PV generation
per per 1 kWp PV (kWh)
PV generation per 24 244
kWp PV (kWh)
R/kWh (Megaflex diversity
2014 / 2015)
Total reduction of Eskom bill (VAT excl)
HighSeason-JunetoAugust
MondaytoFridayoffpeak
0 0 R0.3656 R0
MondaytoFridayStandard
184 4468308 R0.6732 R3008064
MondaytoFridayPeak
23 547768 R2.2224 R1217360
Saturdayoffpeak
29 694618 R0.3656 R253952
Saturdaystandard
18 435808 R0.6732 R293385
Sundayoffpeak
48 1160994 R0.3656 R424459
ReliabilityCharge
1 671 40505295 R0.0027 R109364
Electrificationandruralsubsidy
1 671 40505295 R0.0559 R2264245
TOTAL R23370896
Reduction of municipal income if all PV installations were done by residential users
In this section, the impact on income from electricity for Drakenstein municipality will be calculated, should all of the potential 24 244 kWp of PV be installed by residential users only. In the first scenario, it is assumed that the households all stay on their current tariff and thereafter a switch to the SSEG tariff is proposed. It should be noted that the maximum amount of PV that can be installed in Drakenstein before grid studies are needed (24 244 kWp) is a high penetration, as was noted in A.6.1: Potential PV installations on residential homes.
The new Drakenstein SSEG tariff increases the household’s monthly fixed charge as can be seen in Table 6.
Page 38 | Potential for integration of distributed solar photovoltaic systems in Drakenstein municipality

Table 6: Fixed monthly charges for Drakenstein residential electricity customers33
SSEG monthly fixed charge
Current tariff monthly fixed charge
Difference Total increase in monthly charge for 1 143 households on each tariff33
1 phase 40 Amp R300 R209 R91 R1260688
1 phase 60 Amp R440 R301 R139 R1925666
1phase80Amp R580 R393 R187 R2590644
3phase40Amp R685 R532 R153 R2119618
3phase60Amp R1000 R778 R222 R3075524
3phase80Amp R1315 R1024 R291 R4031430
3phase100Amp R1630 R1270 R360 R4987337
R19990909
The impact that the installation of 8 000 residential installations of 3 kWp will have on the municipal income of Drakenstein can be seen in Table 7.
Table 7: Reduction in electricity income for Drakenstein municipality from 8 000 x 3 kWp residential PV installations34
Increase in income from change in fixed monthly charges
Reduction in income due to new kWh tariff34
Reduction in income due to PV generation
Net reduction in income for Drakenstein
Householdsstayonthesame tariff
-R47796247 -R47796247
HouseholdchangetoSSEGtariff
R19990909 -R6912000 -R47796247 -R34717338
From this it is clear that the municipal electricity revenue of Drakenstein municipality would have been reduced by a maximum of R24 425 35035 if the maximum technically possible amount of solar rooftop PV is installed on residential roofs in the municipal area. This is about 5% of the Drakenstein Eskom accounts for 201436 and less than 3% of the yearly income from electricity for Drakenstein. Should all households change to the new SSEG tariff, the reduction in revenue would have been R11 346 44137.
33 Atotalof8000residentialcustomerswitha3kWpsystemeach34 CurrenttariffisR1.18perkWh.ThenewSSEGtariffisR1.00perkWh.AremainingmonthlykWhper
householdof400kWhpermonthisassumed.35 R47796247(reductioninincometoDrakenstein)–R24425351(reductionofEskombill)=
R2442535036 SeeAppendix3fortheDrakensteinEskomaccountsfor201437 R34717338(reductioninincometoDrakenstein)–R24425351(reductionofEskombill)=
R11436442
Potential for integration of distributed solar photovoltaic systems in Drakenstein municipality | Page 39

It should be pointed out again that this scenario is for the maximum technical possible amount of rooftop PV installations before grid studies are needed. It is highly unlikely that this amount of PV will be installed in the short to midterm in Drakenstein.
Reduction of municipal income if all PV installations were done by industrial and commercial users
In this section, the impact on income from electricity for Drakenstein municipality will be calculated, should all of the potential 24 244 kWp of PV be installed by industrial and commercial users only. In the first scenario, it is assumed that the commercial users all stay on their current tariff and thereafter a switch to the SSEG tariff is proposed. It should be noted that the maximum amount of PV that can be installed in Drakenstein before grid studies are needed (24 244 kWp) is a high penetration, as was noted in A.6.2: Potential PV installations on industrial buildings.
The new Drakenstein SSEG tariff increases the commercial customers’ monthly fixed charge as can be seen in Table 8.
Table 8: Fixed monthly charges for Drakenstein commercial electricity customers38
SSEG fixed charge
Current tariff fixed charge
Difference Total increase in monthly charge for 800 commercial users38
1 phase 40 Amp R300.00 R200.00 R100.00 R106667
1 phase 60 Amp R440.00 R300.00 R140.00 R149333
1phase80Amp R580.00 R400.00 R180.00 R192000
1 phase 100 Amp R720.00 R450.00 R270.00 R288000
3phase40Amp R815.00 R480.00 R335.00 R357333
3phase60Amp R1190.00 R720.00 R470.00 R501333
3phase80Amp R1560.00 R960.00 R600.00 R640000
3phase100Amp R1930.00 R1200.00 R730.00 R778667
3phase150Amp R2200.00 R1800.00 R400.00 R426667
R3440000
The impact that the installation of 800 PV installations of 30 kWp on the rooftops of commercial electricity customers will have on the municipal income of Drakenstein can be seen in Table 9.
38 Evenlydistributedbetweencustomercategories.
Page 40 | Potential for integration of distributed solar photovoltaic systems in Drakenstein municipality

Table 9: Reduction in electricity income for Drakenstein municipality from 800 x 30 kWp commercial PV installations3940
Increase in income from change in fixed monthly charges39
Reduction in income due to new kWh tariff40
Reduction in income due to PV generation
Net reduction in income for Drakenstein municipality
Commercialcustomersstayon the same tariff
-R10085818 -R10085818
CommercialcustomerschangetoSSEGtariff
R3440000 -R23904000 -R10085818 -R30549818
From this it is clear that the municipal electricity revenue of Drakenstein municipality would have been increased by R13 285 07941 if the maximum technically possible amount of solar rooftop PV is installed on the roofs of commercial customers in the municipal area and all of these customers stay on their current tariff structure. Should all of these commercial customers have switched to the new SSEG tariff there would have a loss of revenue to Drakenstein municipality of R7 178 921 for the year42. This is less than 1% of the Eskom bills for 201443.
It should be pointed out again that this scenario is for the maximum technical possible amount of rooftop PV installations before grid studies are needed. It is highly unlikely that this amount of PV will be installed in the short to midterm in Drakenstein.
Conclusion
The impact that the installation of 24 MWp of rooftop PV installations will have on the revenue of Drakenstein municipality will depend on the type of customer installing the rooftop PV as well as the tariff structure that the customers were on before and are on after the installations.
The absolute worst case scenario, when all the customers installing PV are on a residential tariff and do not switch to the new SSEG tariff, is a net potential loss to the municipality of R24 million for the 2014/2015 financial year, should these systems have already been installed. This is less than 3% of electricity revenue to Drakenstein. It needs to be pointed out that this high penetration of rooftop PV is highly unlikely in the short and medium term.
39 Thiswascalculatedbytaking800Installationsof30kWpequallydividedbetweenthe9commercialtariffsforDrakensteinmunicipality.TheexistingbulkTimeofUsetariffswerenotincludedinthiscalculation.ThefinancialimpactfromauserpointofviewforthebulkTimeofUsetariffcanbeseeninPartD.
40 Anassumptionismadeof800commercialelectricityuserswitharemaining10000kWhpermonthbillremainingaftertheinstallationofPVandthisremainingelectricityisbilledatR1.00perkWhinsteadofR1.259perkWh.
41 ThenetofareductioninincomeofR10085818andareductionintheEskombillofR23370897.ThisgivesanetgaininrevenueofR13285079fortheyear.
42 ThenetofareductioninincomeofR30549818andareductionintheEskombillofR2337089743 SeeAppendix3fortheDrakensteinEskomaccountsfor2014
Potential for integration of distributed solar photovoltaic systems in Drakenstein municipality | Page 41

Introduction
In the sections above, it was seen that an accelerated installation rate of PV systems in Drakenstein is technically possible and might have some effect on municipal income.
Shifting focus from the private to the municipal sector, Part C now examines the possibility for Drakenstein Municipal owned building to reduce their carbon footprint, off-set their energy usage and reduce their monthly electricity bill.
This section identifies opportunities for the municipality to install solar photovoltaic technologies on municipal owned buildings and/or municipal land, based on generic data. The overall solar resource in Paarl is examined and compared to other sites in South Africa, followed by closer inspection of three identified sites, where the impact of building orientation and roof incline is considered. The three municipal sites identified are (see Figure 27) the electricity building (1 Jan Van Riebeeck Drive), the Civic Centre (Bergriver Boulevard) and the Civil Engineering building (1 Market Street). One of these three sites is identified in consultation with Drakenstein municipality. Part D sees a full prefeasibility study on this site to determine the viability of installing solar PV on this specific building.
Figure 27: The location of the 3 sites in relation to Paarl Mountain
PV OPPORTUNITIES FOR THE DRAKENSTEIN MUNICIPAL OWNED BUILDINGS
Page 42 | Potential for integration of distributed solar photovoltaic systems in Drakenstein municipality

Paarl Electricity Building
Site
The Paarl Electricity Building is situated at 1 Jan Van Riebeeck Drive, in western-central Paarl. (See Figure 27). The site details are presented in Table 10. A general analysis of the site and its orientation and azimuth is carried out but no specific localised shading is considered in this analysis.
Table 10: Electricity Building Site Information
Site name Paarl,Electricitybuilding
Coordinates 33°44’26.54”S,18°58’36.12”E
Elevation a.s.l. 115m
Slope inclination 5°
Slope azimuth 277°west
Figure 28: Top view of the Paarl electricity building, Google maps
Figure 28 and Figure 29 show that the buildings have flat roofs that are at multiple levels. A significant draw back for this building is that the highest roof is located in the north. This tall building in the north will throw a shadow on the buildings behind it, limiting the space that can be used to install PV panels. However, even though the building is facing east, the flat roofs will enable that the panels be installed facing north at an optimised angle, which will maximise the electricity out of the PV array.
Potential for integration of distributed solar photovoltaic systems in Drakenstein municipality | Page 43

Figure 29: Side view of the Paarl electricity building, Google Maps
System
As this analysis is done for comparative purposes, only the specific yield of a system and not the total yield is of interest here. For this reason, a 1 kW system is proposed and analysed for the location. Table 11 outlines the system specifications.
Table 11: PVsystemspecifications
Installed power 1.0kWp
Type of modules crystallinesilicon(c-Si)
Mounting system fixedmounting,freestanding
Azimuth/inclination 0°north/29°Inverter Euro eff. 97.5%
DC / AC losses 5.5%/1.5%
Availability 99.0%
Potential PV production
As stated previously, the PV production is directly proportional to the irradiation falling on the panels. Table 12 compares the irradiation falling on the panels’ surface for different system configurations. The system configuration chosen for this building is a panel inclined at 29° (the optimum angle), north facing and mounted on the flat roofs. A 2-axis tracking system performs better, but for non-concentrated solar options the additional cost and maintenance far outweighs the additional electricity production.
Page 44 | Potential for integration of distributed solar photovoltaic systems in Drakenstein municipality

Table 12: Averageyearlysumofglobalirradiationfordifferentsystemconfigurations
Global tilt irradiation Relative to optimally inclined
[kWh/m2] [%]
Optimallyinclined(29°) 2105 100
Horizontal 1886 89.6
2-axistracking 2818 133.9
The panel performance is also affected by the ambient air temperature. This correlation can be seen clearly in Figure 30 and Figure 31 where the performance ratio (PR) is higher in the colder months of the year. The performance ratio indicates the effective yield a module has actually produced in relation to the maximum theoretical yield possible for the module. The PR is fairly low in summer, dropping down to approximately 75% compared to the winter months where a PR of up to 81.5% is seen. This is predominately due to the high ambient temperature in summer. The higher solar irradiance in the summer months, however, more than makes up for the loss due to PR. Detailed system losses are shown in Table 13.
Figure 30: Monthly sum of global irradiation and the daily air temperature
Potential for integration of distributed solar photovoltaic systems in Drakenstein municipality | Page 45

Figure 31: Monthlysumofspecificelectricityproducedandtheperformance ratio of the system
Table 13: System losses and Performance ratio
Energy output
Energy loss
Energy loss
Performance ratio
[kWh/kWp]
[kWh/kWp]
[%] [partial %]
[cumul. %]
1.Globalin-planeirradiation(input)
2117 100.0 100.0
2.Globalirradiationreducedbyterrainshading
2104 -13.0 -0.6 99.4 99.4
3.Globalirradiationreducedbyreflectivity
2049 -55.0 -2.6 97.4 96.8
4.ConversiontoDCinthemodules
1830 -219.0 -10.7 89.3 86.4
5.OtherDClosses 1729 -101.0 -5.5 94.5 81.7
6.Inverters(DC/ACconversion)
1686 -43.0 -2.5 97.5 79.6
7.TransformerandACcablinglosses
1661 -25.0 -1.5 98.5 78.5
8.Reducedavailability 1644 -17.0 -1.0 99.0 77.7
Totalsystemperformance
1644 -473.0 -22.3 77.7
Page 46 | Potential for integration of distributed solar photovoltaic systems in Drakenstein municipality

Civic Centre
Site
The Paarl Civic Centre is situated in Bergriver Boulevard, central Paarl (see Figure 27). The site details are presented in Table 14. A general analysis of the site and its orientation and azimuth is carried out but no specific localised shading is considered in this analysis.
Table 14: Civic Centre Site Information
Site name Paarl,CivicCentre
Coordinates 33°44’13.6”S,18°58’4.68”E
Elevation a.s.l. 110 m
Slope inclination 0°
Slope azimuth 286°west
Figure 32: Top view of the Civic Centre, Google maps
Figure 32, Figure 33 and Figure 34 show that the buildings have flat roofs that are at multiple levels. Owing to the orientation of the building, the shading effects on the lower roofs will not be significant. As with the electricity building, even though the building is facing north west, the flat roofs will enable the panels to be installed facing north at an optimised angle which will maximise the electricity output of the PV array.
Potential for integration of distributed solar photovoltaic systems in Drakenstein municipality | Page 47

Figure 33: Side view of the Civic Conference Centre, Google Maps
Figure 34: Front view of the Civic Centre, Google Maps
System
As this analysis is done for comparative purposes, only the specific yield of a system and not the total yield is of interest here. For this reason, a 1 kW system is proposed and analysed for the location. Table 15 outlines the system specifications.
Table 15: PVsystemspecifications
Installed power 1.0kWp
Type of modules crystallinesilicon(c-Si)
Mounting system fixedmounting,freestanding
Azimuth/inclination 0°north/29°
Inverter Euro eff. 97.5%
DC / AC losses 5.5%/1.5%
Availability 99.0%
Page 48 | Potential for integration of distributed solar photovoltaic systems in Drakenstein municipality

Potential PV production
As stated previously the PV production is directly proportional to the irradiation falling on the panels. Table 16 compares the irradiation falling on the panels’ surface for different system configurations. The system configuration chosen for this building is a panel inclined at 29° (the optimum angle), north facing and mounted on the flat roofs. A 2-axis tracking system does perform better but for non-concentrated solar options the additional cost and maintenance far outweighs the additional electricity production.
Table 16: Averageyearlysumofglobalirradiationfordifferentsystemconfigurations
Global tilt irradiation Relative to optimally inclined
[kWh/m2] [%]
Optimallyinclined(29°) 2104 100
Horizontal 1882 89.4
2-axistracking 2786 132.4
The panel performance is also affected by the ambient air temperature. This correlation is clearly seen in Figure 35 and Figure 36 where the performance ratio (PR) is higher in the colder months of the year. The performance ratio indicates the effective yield a module has actually produced in relation to the maximum theoretical yield possible for the module. The PR is fairly low in summer, dropping down to approximately 75% compared to the winter months where a PR of up to 80.5% is seen. This is predominately due to the high ambient temperature in summer. The higher solar irradiance in the summer months, however, more than makes up for the loss due to PR. Detailed system losses are shown in Table 17.
Potential for integration of distributed solar photovoltaic systems in Drakenstein municipality | Page 49

Figure 35: Monthly sum of global irradiation and the daily air temperature
Figure 36: Monthlysumofspecificelectricityproducedandtheperformance ratio of the system
Page 50 | Potential for integration of distributed solar photovoltaic systems in Drakenstein municipality

Table 17: System losses and Performance ratio
Energy output
Energy loss
Energy loss
Performance ratio
[kWh/kWp]
[kWh/kWp]
[%] [partial %]
[cumul. %]
1.Globalin-planeirradiation(input)
2121 100.0 100.0
2.Globalirradiationreducedbyterrainshading
2104 -17.0 -0.8 99.2 99.2
3.Globalirradiationreducedbyreflectivity
2049 -55.0 -2.6 97.4 96.6
4.ConversiontoDCinthemodules
1829 -220.0 -10.7 89.3 86.2
5.OtherDClosses 1729 -100.0 -5.5 94.5 81.5
6.Inverters(DC/ACconversion)
1685 -44.0 -2.5 97.5 79.4
7.TransformerandACcablinglosses
1660 -25.0 -1.5 98.5 78.3
8.Reducedavailability 1643 -17.0 -1.0 99.0 77.5
Totalsystemperformance
1643 -478.0 -22.5 77.5
1 Market Street building
Site
The Civil Engineering Building is situated at 1 Market Street, in eastern-central Paarl (see Figure 27). The site details are presented in Table 18. A general analysis of the site and its orientation and azimuth is carried out but no specific localised shading is considered in this analysis.
Table 18: 1 Market Street Building Site Information
Site name Paarl,1MarketStreet
Coordinates 33°44’20.03”S,18°57’47.11”E
Elevation a.s.l. 121 m
Slope inclination 3°
Slope azimuth 79°east
Potential for integration of distributed solar photovoltaic systems in Drakenstein municipality | Page 51

Figure 37: Top view of the 1 Market Street Building, Google maps
Figure 37 and Figure 38 show that the buildings consist of two adjacent flat roofs. The roofs are at the same level, however the ornamental gables on the facades of the building, causes some localised shadings. As these gables are located on the east and west sides of the building, the PV arrays on both roofs will be affected. The building is orientated north and the roofs are flat, allowing the panels to be installed facing north at an optimised angle, which will maximise the electricity out of the PV array.
Figure 38: Side view of the Civic Centre, Google Maps
System
As this analysis is done for comparative purposes, only the specific yield of a system and not the total yield is of interest here. For this reason, a 1 kW system is proposed and analysed for the location. Table 19 outlines the system specifications.
Page 52 | Potential for integration of distributed solar photovoltaic systems in Drakenstein municipality

Table 19: PVsystemspecifications
Installed power 1.0kWp
Type of modules crystallinesilicon(c-Si)
Mounting system fixedmounting,freestanding
Azimuth/inclination 352°north/29°
Inverter Euro eff. 97.5%
DC / AC losses 5.5%/1.5%
Availability 99.0%
Potential PV production
As stated previously the PV production is directly proportional to the irradiation falling on the panels. Table 20 compares the irradiation falling on the panels’ surface for different system configurations. The system configuration chosen for this building is a panel inclined at 29° (the optimum angle), north facing and mounted on the flat roofs. A 2-axis tracking system does perform better but for non-concentrated solar options the additional cost and maintenance far outweighs the additional electricity production.
Table 20: Averageyearlysumofglobalirradiationfordifferentsystemconfigurations
Global tilt irradiation Relative to optimally inclined
[kWh/m2] [%]
Optimallyinclined(29°) 2080 100
Horizontal 1865 89.7
2-axistracking 2717 130.7
The panel performance is also affected by the ambient air temperature. This correlation is clearly seen in Figure 39 and Figure 40 where the performance ratio (PR) is higher in the colder months of the year. The performance ratio indicates the effective yield a module has actually produced in relation to the maximum theoretical yield possible for the module. The PR is fairly low in summer, dropping down to approximately 75% compared to the winter months where a PR of up to 79.8% is seen. This is predominately due to the high ambient temperature in summer. The higher solar irradiance in the summer months, however, more than makes up for the loss due to PR. Detailed system losses are shown in Table 21.
Potential for integration of distributed solar photovoltaic systems in Drakenstein municipality | Page 53

Figure 39: Monthly sum of global irradiation and the daily air temperature
Figure 40: Monthlysumofspecificelectricityproducedandtheperformance ratio of the system
Page 54 | Potential for integration of distributed solar photovoltaic systems in Drakenstein municipality

Table 21: System losses and Performance ratio
Energy output
Energy loss
Energy loss
Performance ratio
[kWh/kWp]
[kWh/kWp]
[%] [partial %]
[cumul. %]
1.Globalin-planeirradiation(input)
2125 100.0 100.0
2.Globalirradiationreducedbyterrainshading
2080 -45.0 -2.1 97.9 97.9
3.Globalirradiationreducedbyreflectivity
2029 -51.0 -2.5 97.5 95.5
4.ConversiontoDCinthemodules
1808 -221.0 -10.9 89.1 85.1
5.OtherDClosses 1709 -99.0 -5.5 94.5 80.4
6.Inverters(DC/ACconversion)
1666 -43.0 -2.5 97.5 78.4
7.TransformerandACcablinglosses
1641 -25.0 -1.5 98.5 77.2
8.Reducedavailability 1625 -16.0 -1.0 99.0 76.5
Totalsystemperformance
1625 -500.0 -23.5 76.5
Discussion and comparison of sites
Table 22 summarises the performance of each site.
Table 22: Site comparison
Electricity building Civic Centre 1 Market Street
GHI[kWh/m2] 2105 2104 2080
PR[%] 77.7 77.5 76.5
SpecificYield[kWh/kWp]
1644 1643 1625
The slight difference in performance at each site can be attributed to the distance of the site to Paarl Mountain, see Figure 27. This is clearly visualised through the shading diagrams for each location shown in Figure 41 to Figure 43.
Potential for integration of distributed solar photovoltaic systems in Drakenstein municipality | Page 55

Figure 41: Shading diagram for the Electricity Building
Figure 42: Shading diagram for the Civic Centre
Page 56 | Potential for integration of distributed solar photovoltaic systems in Drakenstein municipality

Figure 43: Shading diagram for the 1 Market Street Building
Figure 41 to Figure 43 show how the PV production day becomes shorter, the closer the site is to Paarl Mountain, with all generation stopping just before 18h in the summer for the 1 Market Street building, and at about 18:15 in the summer for both the Electricity Building and the Civic Centre. This correlates with the =/- 1% difference in electricity production between the buildings as discussed earlier.
The PV yield is only one factor to consider when choosing an optimal PV installation. Other factors are; matching the load to the electricity produced and the condition of the roof. All the analysed buildings are predominantly used for office activities, which match well with the diurnal solar cycle indicating that the generated electricity will be used by the building. However, weekends and public holidays, especially the shutdown period over the festive season, pose as a problem as the usage during these periods is significantly lower. The 1 Market Street building contains the Paarl library which is open on a Saturday, which will help alleviate part of this problem for this building.
The condition of the roofs for each of the buildings was assessed with the use of Google Earth, since no site visits have been carried out for this preliminary assessment. From this vantage point, the Electricity building appears to have very little useable roof space as large part of the visible roofing is corrugated iron which is unsuitable for PV installation while the case concrete part of the roof has many shading concerns as a result of the raised centre and parapets surrounding the roof (As seen in Figure 44). Owing to these concerns, the Electricity building this building will not be further considered for PV installation.
Potential for integration of distributed solar photovoltaic systems in Drakenstein municipality | Page 57

Figure 44: Roof concerns of the Electricity building
The roof of the Civic Centre appears to be structurally sound for a PV installation. Hhowever there are concerns around the possible localised shading due to the different heights of the various roofs of the building. This is illustrated in Figure 45. Most of the raised sections are to the north of most of the available roof space which will have a negative impact on the local shading of the PV panels.
Figure 45: Shading concerns of the Civic Centre
.
As seen from Table 22, the 1 Market Street building has the poorest performance (by 1%, thus minimal) of the 3 sites, but has a better capacity to off take the generated load as discussed with the presence of the library on the ground floor. This building
Page 58 | Potential for integration of distributed solar photovoltaic systems in Drakenstein municipality

also has a gravel covered concrete roof, which will be able to hold the weight of a PV installation with minimal shading concerns. For these reasons, and after consultation with Drakenstein municipal officials, a pre-feasibility study into the economic viability of installing PV panels on the roof of this building will be done for this building.
Conclusion
The analysis shows that a typical site within the Drakenstein Municipality has a good solar resource and PV yield. If a PV array is installed in within the municipal area, orientated to the north and inclined at an optimised angle of 29° a performance ratio of approximately 77% is achieved. The high temperature in the summer months reduces the efficiency of the PV panels and the presence of Paarl Mountain limits the late afternoon generation capacity. However, in comparison to other sites in South Africa, a typical site in the area of focus has a good solar yield. Since the specific yield for all three analysed sites is greater than 1600 kWh/kWp economically viable projects are expected.
Potential for integration of distributed solar photovoltaic systems in Drakenstein municipality | Page 59

PREFEASABILITY STUDY FOR THE INSTALLATION OF PV ON 1 MARKET STREET PAARL
Introduction
As determined in Part C, the solar resource within the Drakenstein municipal area is good and should result in economically viable PV projects. Through this study a prefeasibility analysis is carried out to determine the economic viability of a Photovoltaic (PV) installation on the roof of 1 Market Street, Paarl. The location of this building is seen in Figure 46. The available solar resources are evaluated, the potential electricity generated and the financial projections for the site are modelled.
Figure 46: The location of the three analysed buildings in the PV Opportunities Report
.
Site Information
The town of Paarl is located at the coordinates of -33.724° S, 18.956° E, and 1 Market Street, at -33.7389° S, 18.9631° E (site information is given in Table 18). The town is located in a valley with Paarl Mountain to the west and Haweqwa mountain range to the east. Owing to this location there are foreseeable drawbacks with regards to the electricity production from a PV installation on a macro scale (discussed in detail in Part C). The town sits at the foot of the Paarl Mountain, which obscures the late afternoon sun, reducing the period of time that the PV array will produce electricity.
Page 60 | Potential for integration of distributed solar photovoltaic systems in Drakenstein municipality

The town is located further from the Haweqwa range and thus this range should not have such a great impact on the early morning electricity production.
Table 23: 1 Market Street, Paarl: Building Site Information
Site name 1MarketStreet,Paarl
Coordinates 33°44’20.03”S,18°57’47.11”E
Elevation a.s.l. 121 m
Slope inclination 3°
Slope azimuth 79°east
Figure 47: Top view of 1 Market Street, Paarl, Google maps
The building has two adjacent flat roofs, as can be seen in Figure 47. The roofs are at the same elevation, however the presence of the large middle dome separating the two roofs may prove problematic in respect to localised shadings. Together with the raised centre dome, the ornamental gables on the facades of the building will also cause localised shadings, Figure 48. The red areas in Figure 47 show the spaces where PV panels can possibly be installed. As the gables are located on the east and west sides of the building, the PV arrays on both roofs will be affected. The building is orientated 5° west of north and the roofs are flat, allowing the panels to be installed at an optimised angle, maximising the electricity output of the PV array. The general solar resource in the Paarl area and possible PV production for this building has been analysed in the PV Opportunities Report with a detailed analysis following in this report.
Potential for integration of distributed solar photovoltaic systems in Drakenstein municipality | Page 61

Figure 48: Side view of the Civic Centre, Google Maps
Assessment Method
For the successful implementation of a PV system, it is imperative to match the electricity produced by the PV array to the electricity demand of the building. Thus, the load profiles of the building must be analysed together with the behaviour of the PV array. The available usage data consists of monthly bills over a two-year period and half-hourly temporal data over a 10-month period. The half-hourly data is of great interest, as through an analysis, the daily, weekly and monthly load trends of the building are illuminated.
PVPlanner and PVsyst software are among the tools used to derive the most suitable locations for PV panel installations. The solar data is sourced from two different sources, SoDa and SolarGIS, depending on the purpose. The layout of the panels and area covered is determined by the selected equipment and spacing thereof.
The identified roof areas are modelled in PVsyst to obtain the final production estimates. PVsyst software allows for detailed modelling, taking into account the effects of local shading, equipment losses, and panel- and string layouts, among other features. The same annual data as used for the macro scale study (the PV Opportunities Report) will not provide the necessary accuracy for the detailed modelling. Solar irradiation data, HelioClim, which combines measurements from ground stations and satellite data, is sourced from SoDa to provide hourly GHI data that is used in the PVsyst software for detailed modeling. There are standard industry practices used in the report, which will not be described in detail, however concerns specific to this installation location will be discussed.
In order to model the potential production of a PV array, a specific PV panel and inverter needs to be selected. The choice of reference equipment is based on global statistics on the manufacturers’ production volumes, age of the company and the manufacturer having an established presence in South Africa.
The reference PV panel that is used for modelling purposes is the polycrystalline panel available from Yingli Solar, YL240P-29b. Yingli Solar is one of the top global producers of PV panels that has been manufacturing for more than 15 years and
Page 62 | Potential for integration of distributed solar photovoltaic systems in Drakenstein municipality

fall in the Gigawatt production category. The reference inverter used is a SMA Sunny Tripower 25 kW inverter. SMA is currently the largest inverter manufacturer globally, with more than 25 years of experience and an established local market. Both of the reference equipment manufacturers are very large globally and in South Africa with proven reliability.
The study and its results are impacted by data inconsistencies, loss assumptions and equipment selection. Owing to the unpredictable nature of the climate and the variety of installation setups, the actual production of the installation can differ from the predicted values. The results of the study is therefore for decision making purposes and should not be used as an accurate prediction of the PV production of the installed system.
Assessment Results
Electricity energy consumption and characterisation
In order to match the PV production to the required building load the temporal load data is analysed. Half-hourly data is available the 15th April 2014 to the 10th of February 2015. The raw data for the real power and apparent power is plotted in Figure 49.
Figure 49 shows that the power demand rarely drops below 20 kW. Time periods when the usage drops to zero, a power cut or load shedding is assumed. From this plot, in order to avoid any feed back into the grid the PV system should be no greater than 20 kWp. To fully utilise a PV system it should be matched to the lowest demand on an annual basis, thus the usage trends are evaluated. Such an analysis will indicate which period of the day saving can be achieved and the associated cost savings per kWh of PV generated electricity. An hourly analysis will determine how well matched the proposed PV system and the usage profiles will be.
Potential for integration of distributed solar photovoltaic systems in Drakenstein municipality | Page 63

Figure 49: Raw data plot 30 min intervals
Figure 50: ElectricityUsage:Hourlyaveragedplotsforeachmonthofthe year
Figure 50 shows the hourly power usage averaged for each month and Figure 51 shows the hourly power usage averaged for each month for weekdays only. Figure 51 shows that the peak, daily weekday demand takes place between 9:00 to 16:00. This usage profile makes the application of a PV system desirable as it coincides with the diurnal solar cycle. It is typically during these hours that electricity is produced by the PV array and will thus off set the required electricity from the municipality feed in point. This will result in not only active energy savings but also demand charge savings as the consumption peak occurs during daylight hours. These plots also show that the electricity usage is at a peak in the mornings when all the air-conditioners
Page 64 | Potential for integration of distributed solar photovoltaic systems in Drakenstein municipality

are running at full. A further trend that is observed shows that the highest usage occurs in the summer months and this electricity usage trend matches well with the electricity production of a PV system which will be the highest during this period.
Figure 51: ElectricityUsage:Hourlyaveragedplotsforeachmonthofthe year, weekdays only
Figure 52 shows the average power demand for each day of the week for each month of the year. It is seen that Saturday and Sunday require less electricity than the rest of the week, thus the minimum load needs to be matched to these demand profiles. Figure 53 shows that the daylight minimum is 20 kW and thus the PV system must be matched to this minimum demand if all the electricity produced is to be used for self-consumption. However, since Drakenstein municipality has recently established a co-generation tariff, a larger system will be allowed. The size of this system will be constrained by the available roof space. If there is available roof space it is suggested that this system be no bigger than 120 kWp which is the weekday maximum demand.
Potential for integration of distributed solar photovoltaic systems in Drakenstein municipality | Page 65

Figure 52: Power Usage: Average power usage for each day of the week for each month of the year
Figure 53: PowerUsage:Hourlypowerusageaveragedforeachdayofthe week
Achievable Energy Savings through PV installation
From the macro solar analysis carried out in the PV Opportunities Report, a specific yield of 1 624 kWh/kWp with a performance ratio (PR) of 76.5% was found. Such a macro scale analysis does not take the local shading effects of the building into account, thus a detailed analysis is carried out through the use of PVsyst software with HelioClim hourly solar irradiation data. One of the main concerns of installing
Page 66 | Potential for integration of distributed solar photovoltaic systems in Drakenstein municipality

PV panels in the Paarl area is the high daily temperatures that will affect the performance of the PV panels reducing the PV panel efficiency.
The detailed shading analysis is based on measured irradiation for the year 2014. The roof areas are modelled as per the architectural layout drawings provided and various photographs. Areas with significant shading impact are identified and the PV panel layout adjusted to reduce the impact where possible.
25 kWp System
In order to achieve a nominal power out of approximately 20 kWp with the preliminary indicated PR of 76.5%, a 25 kWp system is proposed. The PR value is an averaged value and due to daily variation the proposed 25 kWp system can possibly exceed the 20 kWp threshold. This concern will be addressed when the hourly output from the numerical PV simulation is analysed. During the modelling process significant shading effects are seen due to the gables situated on the east and west sides of the building (Figure 38) and the centre dome. Owing to this shading, the layout shown in Figure 54 is proposed with the PV panels located in the centre of each roof. The building is orientated 5° towards the west, and the panels follow this orientation.
Figure 54: Proposed panel layout for the 25 kWp system
Figure 55 shows the sun’s movement and shading effect on the PV system during different times of the day and different seasons, throughout the year.
Owing to the height of the gables and centre dome roof significant amount of shading is shed on the PV panels, with the worst effects seen in winter, when the sun is at a
Potential for integration of distributed solar photovoltaic systems in Drakenstein municipality | Page 67

low angle. In order to minimize these shading effects, the panels are placed in the centre of each roof. The seen shading profile may be problematic with respect to reducing the morning peak (highest peak of the day), but the system will lower the electricity usage between 9:00 and 16:30 in summer and 10:00 and 15:30 in winter on clear days.
Figure 55: Sun path diagram, indicating the shading losses for the proposed 25 kWp system
Table 24 outlines the system’s production output and production losses. Figure 56 shows the monthly PV electricity supply. Figure 57 and Figure 58 show the load profile with the installation of the PV array of a typical summer and winter day respectively in order to visually see the energy savings that can be realised through the installation of a PV array. Figure 59 shows the comparison between the hourly PV production and the hourly power usage of the building.
Page 68 | Potential for integration of distributed solar photovoltaic systems in Drakenstein municipality

Table 24: 25 kWp system production output and production losses
Parameter Value
Production Output
Performance Ratio 77.4%
Specific Yield 1643kWh/kWp/year
Produced Electricity 41.41MWh/year
Production Losses (System layout specific)
Far shading losses 1.9%
Near shading losses 1.7%
Shading: electrical loss due to strings 0.2%
Temperature Losses 10.2 %
Table 24 shows a reasonable specific yield and performance ratio that should result in an economically feasible system. Table 24 highlights that the major loss of PV production is due to high ambient temperatures that is an order larger than the shading losses. Figure 57 and Figure 58 show that the morning and afternoon peaks are still significant and thus the maximum demand will not be reduced as significantly as the active energy. To overcome this problem, a staggering of the usage load (putting air-conditioners on a timer to combat the morning start up peak), is suggested to even out the peaks and in turn increasing savings.
Figure 56: Monthly electricity production by the 25 kWp PV system
Potential for integration of distributed solar photovoltaic systems in Drakenstein municipality | Page 69

Figure 57: HindcastloadprofileafterPVarrayisinstalledforatypicalday in December
Figure 58: HindcastloadprofileafterPVarrayisinstalledforatypicalday in June
The hind cast model results are presented in Figure 59. Figure 59 shows that during December there may be times when not all the electricity produced by the PV system is used. When the 10 months of available electricity usage data is compared with the hind cast PV model, the total excess electricity amounts to 74.8 kWh, which is seen as negligible when compared to the total 27 763 kWh produced over this same period of time. This assumption can hold for the entire year as the period over which the comparison is carried out encompasses the majority of South Africa’s public holidays (times of little electricity usage) and the summer months (period of highest
Page 70 | Potential for integration of distributed solar photovoltaic systems in Drakenstein municipality

PV production). The economic validity of this system will be carried out in the next chapter of this report.
Figure 59: Comparison between electricity consumed and electricity produced by the proposed 25 kWp PV plant
50 kWp System
The largest system that can be accommodated on the roof of 1 Market Street, is a 50 kWp system. The panels will cover the entire roof space and the shading effects of the gables and centre dome cannot be avoided. The layout of this system is shown in Figure 60. The building is orientated 5° towards the west and the panels follow this orientation.
Figure 61 shows the sun’s movement and shading effect on the PV system during different times of the day and different seasons, throughout the year. The height of the gables and centre dome roof, shed significant amount of shading on the PV panels, with the worst effects seen in winter when the sun is at a low angle. At the extreme case of winter equinox, production will only take place between 12:00 and 14:00 on 1% of the panels, and between 10:30 and 15:15 on 10% of the panels. Ideally all shading is to be avoided, however due to the limited roof space, the shading cannot be avoided, and the string layout of the panels must be carefully considered to minimize the shading impact.
Potential for integration of distributed solar photovoltaic systems in Drakenstein municipality | Page 71

Figure 60: Proposed panel layout for the 50 kWp system
Figure 61: Corresponding shading diagram for the 50 kWp system
Table 25 outlines the 50 kWp system’s production output and production losses. Figure 62 shows the monthly PV electricity supply. Figure 63 and Figure 64 show the load profile with the installation of the PV array of a typical summer and winter
Page 72 | Potential for integration of distributed solar photovoltaic systems in Drakenstein municipality

day respectively in order to visually see the electricity savings that can be realised through the installation of a PV array. Figure 65 shows the comparison between the hourly PV production and the hourly power usage of the building.
Table 25: 50 kWp system production output and production losses
Parameter Value
Production Output
PerformanceRatio 76.2%
SpecificYield 1619kWh/kWp/year
ProducedElectricity 81.57MWh/year
Production Losses (System layout specific)
Farshadinglosses 1.9%
Nearshadinglosses 2.6%
Shading:electricallossduetostrings
0.7%
TemperatureLosses 10.1 %
Table 25 shows that even with the large localized shadings a reasonable specific yield is realised, only 1.2% lower than the 25 kWp system. Figure 62 and Figure 63 show that the morning and afternoon peaks are still significant, but for the summer day the morning and afternoon peaks are reduced by approximately 30 kW. The PV system will not be producing at rated power at 9:00 and 15:00 (times when peaks are seen) due to the incidence angle of the incoming solar radiation. In winter only one daily peak is seen at 10:00 and the PV installation reduces this peak by 20 kW, shifting the peak consumption to 9:00.
When the 10 months of available electricity usage data is compared with the hind cast PV model, Figure 65, the total excess electricity amounts to 4 100 kWh, which is 7.5% of the total electricity produced over this period. It is important to take note of when this excess electricity (wastage if not billed on a net metering tariff) occurs as this building is billed on a time of use tariff and this excess electricity can result in a small monetary value due to time of occurrence with the larger system promoting demand reduction. The economic validity of this system will be carried out in the next chapter of this report.
Potential for integration of distributed solar photovoltaic systems in Drakenstein municipality | Page 73

Figure 62: Monthly electricity production by the 50 kWp PV system
Figure 63: LoadprofileafterPVarrayisinstalledforatypicaldayinDecember
Page 74 | Potential for integration of distributed solar photovoltaic systems in Drakenstein municipality

Figure 64: LoadprofileafterPVarrayisinstalledforatypicaldayinJune
Figure 65: Comparison between electricity consumed and electricity produced by the proposed 50 kWp PV plant
Potential for integration of distributed solar photovoltaic systems in Drakenstein municipality | Page 75

Financial Feasibility
Input parameters
In order for the implementation of the proposed PV array to be successful the financial feasibility of the project needs to be determined. The feasibility of the 25 kWp and the 50 kWp system will be investigated so that the best solution can be found for this building. Since the building is municipal owned, three scenarios are modelled;
� Building is seen as a private entity buying electricity from Drakenstein Municipality only for self-consumption on the Bulk Time-of-Use Medium Voltage tariff.
� Building is seen as a Drakenstein Municipality entity reducing the active energy and demand required from Eskom and savings are calculated from the Eskom Megaflex tariff.
� Building is seen as a private entity buying electricity from Drakenstein Municipality on Large Power Users Small Scale Embedded Generation Medium Voltage tariff (only the 50 kWp system).
For each of these scenarios, a comparison between a fully grant funded project, a 50% grant funded project and a 100% debt funded project is examined. The grant funding will be treated as upfront available capital for the project. National government will possibility award grant funding for this project and thus the grant funded cases presented can be used as the business case to present this project to National government. For the debt-funded cases, it is assumed the loan will be repaid over a 20 year period at a rate of 10% with a fixed repayment schedule.
For each of these funding cases, a range of capital costs are evaluated, as cost per watt peak of PV is the greatest variable in determining the cost of the project. Prior involvement of CRSES in a tender process for roof mounted PV system of a 20 kWp size estimated values at R 16/Wp – R 20/Wp for turnkey solutions. It should be mentioned however that the cost per watt for PV in the tenders included warranties and guarantees and in some cases also maintenance cost.
For all cases evaluated the following assumptions are used: � The model generated assumes cash flows to originate from the savings (active
energy and demand charge) incurred by the PV system. � The financial model assumes a lifetime of 20 years however in general, projects
can generate electricity beyond this life span.
Table 26 shows the assumptions used as inputs to the financial model.
Table 26: Financial model assumptions
Funding scenarios Fullygrantfunded,50%grantfundedand100%loanfunded
Capital Costs scenarios investigated
R16/Wp,R18/WpandR20/Wp
Annual electricity increase over 20 years
12.2%yearonyearforthefirst2years,8%forthenext10andthen6%fortheremaining8years
Page 76 | Potential for integration of distributed solar photovoltaic systems in Drakenstein municipality

Inflation rate 5.5%
PV production degradation Linearto80%oforiginalproductioninyear20
Project lifetime 20years
Inverter replacement cost R3.20/Wp
O&M 0.35%ofinitialprojectcostannually
Depreciation Depreciatedoverprojectlifetime
Discount rate 5.5%
Lending Rate 10%
Business tax is excluded as municipalities do not pay tax, and thus the tax incentives available in South Africa for renewable energy projects are not considered in this report.
Further, as seen in Table 26 the associated risks with the Drakenstein Municipality electricity costs are only accounted for by an assumed price increase of 12.2% every year for the first 2 years, 8% over the next 10 years and 6% for the remaining 8 years. This assumption disregards any new build programmes in future that might require additional price increases to consumers. Keep in mind that by 2045, most of the current coal fire stations will be decommissioned. This proposed electricity price increase is thus very conservative.
Demand charge savings are taken into consideration as a hind cast solar and electricity usage model is set up, and thus these savings can be predicted. The manner in which the demand charge is billed is: the charge payable per unit of the maximum demand supplied during any 30 consecutive minutes of the billing period (e.g. a month) measured in kilovolt-ampere (kVA). Owing to this manner of billing there are risks involved in predicting the demand charge savings. In order to predict these savings as accurately as possible, a hind cast model is set up for the past year whereby the half-hourly energy usage is compared to the output generated by the numerical PV model. The numerical PV model uses hind cast climatic data over the same period of time as input so that the theoretical maximum demand can be found had the PV installation been active. In this manner the demand savings for each month of the past year can be found. Since actual climatic data is used as the input to the PV model, times when there is cloud cover are accounted for and this, coupled with the actual energy usage data allows some of the uncertainties to be minimized. Other uncertainties such as plant down time (3 random days a year) and soiling factors (1.5%) are built into the numerical PV model.
As mentioned, there are risks associated in predicting the demand savings as one spike in energy usage that does not coincide with PV production can cause the savings for the month to the nullified. Similarly if the PV plant is down during the peak usage period of the day for one day of the month the savings again will not be realised. The unavailability of the PV plant is taken into consideration in the numerical model, but unforeseen incidents can occur. CRSES wants the client to be aware of these risks when considering the financial outcome when demand savings are considered.
The found savings from the active energy charge and the demand charge are used as the input into the financial model at year 1. Since only one year of hind cast data is
Potential for integration of distributed solar photovoltaic systems in Drakenstein municipality | Page 77

available only one year’s savings can be found and it is known that not every year will see these same savings. However since these savings are extrapolated over a 20 year period, the years experiencing peaks and dips in savings will be levelised over this period and thus this input is seen as realistic.
The following financial feasibility indictors are presented for each scenario and range of capital costs:
� Total cost over project lifetime � Initial capital cost � Cost for Business-as-usual � Profit/Savings Incurred � Project IRR � Net present value (NPV) of project � Payback period [years] � LCOE of PV energy over duration of project � LCOE of Utility energy over duration of project
The future costs of the project are not discounted in the total project cost figure. Similarly, neither LCOE value makes use of discounted future values, however the NPV and IRR of the project use discounted future values.
25 kWp System
Scenario 1
In this scenario, the building is seen as a private entity, buying electricity from Drakenstein Municipality only for self-consumption on the Bulk Time-of-Use Medium Voltage tariff
a. Achievable Savings
Together with the use of the listed input parameters that define the financial model, the tariff structure on which each building is billed must be considered, as this will determine the magnitude of the achievable savings. The tariff structure determines the associated cost of electricity, the avoided costs with the use of the PV system and thus determines the savings, payback period and internal rate of return (IRR) of the project. The tariff structure for this scenario is listed in Table 27.
Table 27: BulkTimeofUseMediumVoltageTariff2014/2015
Fixed Charge R1296.00
Demand Charge per kVA R44.00
Access Charge per kVA (12 months)
R37.00
Active Energy Charge Highdemandseason [Jun-Aug]
Lowdemandseason [Sept-May]
Peak [R/kWh] R1.853 R1.1369
Standard [R/kWh] R0.7778 R0.6358
Page 78 | Potential for integration of distributed solar photovoltaic systems in Drakenstein municipality

Off peak [R/kWh] R0.4463 R0.3947
Reactive Energy per kVArh R0.0200
The Bulk Time of Use Medium Voltage tariff structure consists of a fixed service charge, an access charge, a demand charge, and an active energy charge. It is assumed that savings will only be realised from the reduction of active energy [kWh] and demand [kVA]. Figure 66 shows the division of the bill with this tariff structure. The bill consists of 66% active energy charge and 21% demand charge indicating that the majority of the savings will be realised from the reduction of required active energy.
Figure 66: Current division of the bill on Bulk Time of Use Medium VoltageTariff
The achievable savings for 1 year is based on the 2014/2015 rates which are applicable from 1st July 2014 for the proposed 25 kWp PV system. These found savings are used as the input into the financial model.
Table 28: Potential savings for year 1
Saved [ZAR] % of total savings
EnergyCharge R27282.65 86.5%
DemandCharge R4272.63 13.5%
Potential for integration of distributed solar photovoltaic systems in Drakenstein municipality | Page 79

b. Results
The information and assumptions in Table 26 and Table 28 are used as input into the financial model. The summary of results is presented in Table 29, Table 30 and Table 31.
Table 29: Financialresultsforscenario1@R16/Wp, 25 kWp system
@ R 16/Wp
100% Grant funded 50% Grant funded 100% Debt funded
Totalcostoverprojectlifetime
R528815.65 R798654.14 R1068492.64
Initialcapitalcost R400000.00 R200000.00 R0.00
CostforBusiness-as-usual
R1315725.62 R1315725.62 R1315725.62
Profit/SavingsIncurred
R786909.98 R517071.48 R247232.98
ProjectIRR 10.44% 10.74% 12.30%
NPV R221191.14 R144662.71 R68134.29
Paybackperiod[years]
10 11 14
LCOEofPVenergyoverdurationofproject
R0.71 R1.33 R1.96
LCOEofUtilityenergyoverdurationofproject
R1.76 R1.76 R1.76
Table 30: Financialresultsforscenario1@R18/Wp, 25 kWp system
@ R 18/Wp
100% Grant funded 50% Grant funded 100% Debt funded
Totalcostoverprojectlifetime
R584917.60 R888485.91 R1192054.22
Initialcapitalcost R450000.00 R225000.00 R0.00
CostforBusiness-as-usual
R1315725.62 R1315725.62 R1315725.62
Profit/SavingsIncurred
R730808.02 R427239.71 R123671.40
ProjectIRR 9.02% 8.35% 5.37%
NPV R170653.19 R84558.71 -R1535.77
Page 80 | Potential for integration of distributed solar photovoltaic systems in Drakenstein municipality

@ R 18/Wp
100% Grant funded 50% Grant funded 100% Debt funded
Paybackperiod[years]
11 13 17
LCOEofPVenergyoverdurationofproject
R0.78 R1.49 R2.19
LCOEofUtilityenergyoverdurationofproject
R1.76 R1.76 R1.76
Table 31: Financialresultsforscenario1@R20/Wp, 25 kWp system
@ R 20/Wp
100% Grant funded 50% Grant funded 100% Debt funded
Totalcostoverprojectlifetime
R641019.56 R978317.68 R1315615.80
Initialcapitalcost R500000.00 R250000.00 R0.00
CostforBusiness-as-usual
R1315725.62 R1315725.62 R1315725.62
Profit/SavingsIncurred
R674706.07 R337407.94 R109.82
ProjectIRR 7.80% 6.28% 0.00%
NPV R120115.24 R24454.71 -R71205.82
Paybackperiod[years]
12 14 19
LCOEofPVenergyoverdurationofproject
R0.86 R1.64 R2.42
LCOEofUtilityenergyoverdurationofproject
R1.76 R1.76 R1.76
The LCOE values found for the 100% grant funded and 50% grant funded cases for the turnkey installed solution of all R16/Wp, R18/Wp and R20/Wp show that savings can be realised through the installation of the PV project. For all the capital costs investigated, the 100% debt funded scenario returns LCOE values larger than the utility LCOE values with extended payback periods seen.
Considering the case where the installed turnkey solution is R 18/W the annual cash flow, accumulative net cash flow and accumulative cost is investigated. The avoided costs constitute the cash flow for the project. Here the total savings are subtracted from the associated expenses as seen in Figure 67, Figure 68 and Figure 69 for the 3 differently funded cases. Figure 70 to Figure 75 shows the cumulative costs associated with the PV project and compare these costs with the situation
Potential for integration of distributed solar photovoltaic systems in Drakenstein municipality | Page 81

where no intervention is made and the management of 1 Market Street, continues paying Drakenstein Municipality to deliver electricity. Figure 70, Figure 71 and Figure 72 show the payback period and Figure 73, Figure 74 and Figure 75 shows the accumulative cost associated with both the PV installation and the cost of electricity bought from Drakenstein Municipality.
Figure 67: Scenario 1, 25 kWpsystem:AnnualCashflow:100%grantfundedcaseatR18/Wp
Figure 68: Scenario 1, 25 kWpsystem:AnnualCashflow:50%grantfundedcaseatR18/Wp
Page 82 | Potential for integration of distributed solar photovoltaic systems in Drakenstein municipality

As seen from Figure 68, 50% of the initial project capital is invested in the project. Important to note is that the savings incurred covers the debt repayment annually from year 1. Year 10 sees a negative cash flow and is related to the replacement of the inverter, this can however be financed out of the initial loan but was left out in this instance.
Figure 69: Scenario 1, 25 kWpsystem:AnnualCashflow:100%debtfundedcaseatR18/Wp
Figure 70: Scenario 1, 25 kWpsystem:Cumulativenetcashflowwith100%grantfundedcaseatR18/Wp
Potential for integration of distributed solar photovoltaic systems in Drakenstein municipality | Page 83

Figure 71: Scenario 1, 25 kWpsystem:Cumulativenetcashflowwith50%grantfundedcaseatR18/Wp
Figure 72: Scenario 1, 25 kWpsystem:Cumulativenetcashflowforthe100%debtfundedcaseatR18/Wp
Page 84 | Potential for integration of distributed solar photovoltaic systems in Drakenstein municipality

Figure 73: Scenario 1, 25 kWpsystem:Cumulativecostforthe100%grantfundedcaseatR18/Wp
Figure 74: Scenario 1, 25 kWpsystem:Cumulativecostforthe50%grantfundedcaseatR18/Wp
Potential for integration of distributed solar photovoltaic systems in Drakenstein municipality | Page 85

Figure 75: Scenario 1, 25 kWpsystem:Cumulativecostforthe100%debtfundedcaseatR18/Wp
A payback period of 11, 13 and 17 years is achieved for the 100% grant funded, 50% grant funded and 100% debt funded cases respectively. From the accumulative cost graphs it is seen that savings will be achieved from installing a PV system versus the situation where 1 Market Street management continues buying electricity from the Drakenstein municipality with a positive business case made for a grant funded project.
Scenario 2
In this scenario, the building is seen as a Drakenstein Municipality entity reducing the active energy and demand required from Eskom and savings are calculated from the Eskom Megaflex tariff
a. Achievable Savings
The tariff structure determines the associated cost of electricity, the avoided costs with the use of the PV system and thus determines the savings, payback period and internal rate of return (IRR) of the project. Drakenstein Municipality buys electricity in bulk from Eskom on a 66 kV line in the >900 km transmission zone. The tariff structure for this scenario is listed in Table 32.
Page 86 | Potential for integration of distributed solar photovoltaic systems in Drakenstein municipality

Table 32: EskomMegaflex–Localauthorityrates2014/2015
Service charge R/Account/day R2813.83
Administration charge R/POD/day R89.86
Transmission network charge per kVA R5.73
Network access charge per kVA R4.12
Network demand charge per kVA R7.62
Urban low voltage subsidy charge per kVA R10.09
Reliability service charge per kWh R0.0027
Electrification and rural network subsidy charge per kWh
R0.0559
Active Energy Charge High demand season [Jun-Aug]
Low demand season [Sept-May]
Peak [R/kWh] R2.2224 R0.7249
Standard [R/kWh] R0.6732 R0.4989
Off peak [R/kWh] R0.3656 R0.3165
Reactive Energy per kVArh R0.1010 R0.00
The Megaflex tariff structure consists of a service charge, an administration charge, transmission network charge, network access charge, network demand charge, urban low voltage subsidy charge, reliability service charge, electrification and rural network subsidy charge and an active energy charge. It is assumed that savings will only be realised from the reduction of active energy [kWh] and demand [kVA]. Figure 76 shows the division of the bill (as seen on the Megaflex tariff) with respect to the kWh and kVA charges, where the urban low voltage subsidy charge, reliability service charge, electrification and rural network subsidy charge are added to the active energy charges. The bill consists of 94% active energy charge and 6% demand charge indicating that the majority of the savings will be realised from the reduction of required active energy.
Potential for integration of distributed solar photovoltaic systems in Drakenstein municipality | Page 87

Figure 76: CurrentdivisionofthebillontheEskomMegaflexlocalauthoritytariff
The achievable savings for 1 year is based on the 2014/2015 rates, which are applicable from 1st July 2014 for the proposed 25 kWp PV system. These found savings are used as the input into the financial model. When Table 33 is compared to Table 28 the achievable savings are less when the building is billed on the Megaflex tariff. Although the Eskom Megaflex tariff has a higher peak active energy charge than the Drakenstein Bulk Time of Use medium voltage tariff, the majority of the savings occur at the standard energy charge, which in the Eskom Megaflex tariff is lower than the Drakenstein Bulk Time of Use tariff.
Table 33: Potentialsavingsforyear1ontheEskomMegaflextariff
Saved [ZAR] % of total savings
EnergyCharge R23974.52 97.00%
DemandCharge R739.94 3.00%
b. Results
The information and assumptions in Table 26 and Table 33 are used as input into the financial model. The summary of results is presented in Table 34, Table 35 and Table 36.
Page 88 | Potential for integration of distributed solar photovoltaic systems in Drakenstein municipality

Table 34: Financialresultsforscenario1@R16/Wp, 25kWp system
@ R 16/Wp
100% Grant funded 50% Grant funded 100% Debt funded
Totalcostoverprojectlifetime
R528815.65 R798654.14 R1068492.64
Initialcapitalcost R400000.00 R200000.00 R0.00
CostforBusiness-as-usual
R1030491.44 R1030491.44 R1030491.44
Profit/SavingsIncurred
R501675.79 R231837.29 -R38001.21
ProjectIRR 7.34% 5.48% -1.90%
NPV R75967.22 -R561.21 -R77089.63
Paybackperiod[years]
12 15 20+
LCOEofPVenergyoverdurationofproject
R0.71 R1.33 R1.96
LCOEofUtilityenergyoverdurationofproject
R1.37 R1.37 R1.37
Table 35: Financialresultsforscenario1@R18/Wp,25 kWp system
@ R 18/Wp
100% Grant funded 50% Grant funded 100% Debt funded
Totalcostoverprojectlifetime
R584917.60 R888485.91 R1192054.22
Initialcapitalcost R450000.00 R225000.00 R0.00
CostforBusiness-as-usual
R1030491.44 R1030491.44 R1030491.44
Profit/SavingsIncurred
R445573.83 R142005.52 -R161562.79
ProjectIRR 6.07% 3.19% -7.85%
NPV R25429.27 -R60665.21 -R146759.69
Paybackperiod[years]
13 17 20+
LCOEofPVenergyoverdurationofproject
R0.78 R1.49 R2.19
LCOEofUtilityenergyoverdurationofproject
R1.37 R1.37 R1.37
Potential for integration of distributed solar photovoltaic systems in Drakenstein municipality | Page 89

Table 36: Financialresultsforscenario1@R20/Wp, 25kWp system
@ R 20/Wp
100% Grant funded 50% Grant funded 100% Debt funded
Totalcostoverprojectlifetime
R641019.56 R978317.68 R1315615.80
Initialcapitalcost R500000.00 R250000.00 R0.00
CostforBusiness-as-usual
R1030491.44 R1030491.44 R1030491.44
Profit/SavingsIncurred
R389471.88 R52173.76 -R285124.37
ProjectIRR 4.98% 1.13% -14.18%
NPV -R25108.68 -R120769.21 -R216429.74
Paybackperiod[years]
14 18 20+
LCOEofPVenergyoverdurationofproject
R0.86 R1.64 R2.42
LCOEofUtilityenergyoverdurationofproject
R1.37 R1.37 R1.37
The 100% grant funded case for the capital costs of R 16/Wp and R 18/Wp are the only positive business cases realised.
Considering the case where the installed turnkey solution is R 18/W the annual cash flow, accumulative net cash flow and accumulative cost is investigated. The avoided costs constitute the cash flow for the project. Here the total savings are subtracted from the associated expenses as seen in Figure 77, Figure 78 and Figure 79 for the 3 differently funded cases. Figure 80 to Figure 85 shows the cumulative costs associated with the PV project and compare these costs with the situation where no intervention is made and the management of 1 Market Street continues paying Eskom to deliver electricity. Figure 80, Figure 81 and Figure 82 show the payback period and Figure 83, Figure 84 and Figure 85 shows the accumulative cost associated with both the PV installation and the cost of electricity bought from Drakenstein Municipality.
Page 90 | Potential for integration of distributed solar photovoltaic systems in Drakenstein municipality

Figure 77: Scenario 2, 25 kWpsystem:AnnualCashflow:100%grantfundedcaseatR18/Wp
Figure 78: Scenario 2, 25 kWpsystem:AnnualCashflow:50%grantfundedcaseatR18/Wp
As seen from Figure 78, 50% of the initial project capital is invested in the project. Important to note is that the savings incurred covers the debt repayment annually from year 3, unlike scenario 1 where the savings cover the debt repayment from year 1. Year 10 sees a negative cash flow and is related to the replacement of the inverter, this can however be financed out of the initial loan but was left out in this instance.
Potential for integration of distributed solar photovoltaic systems in Drakenstein municipality | Page 91
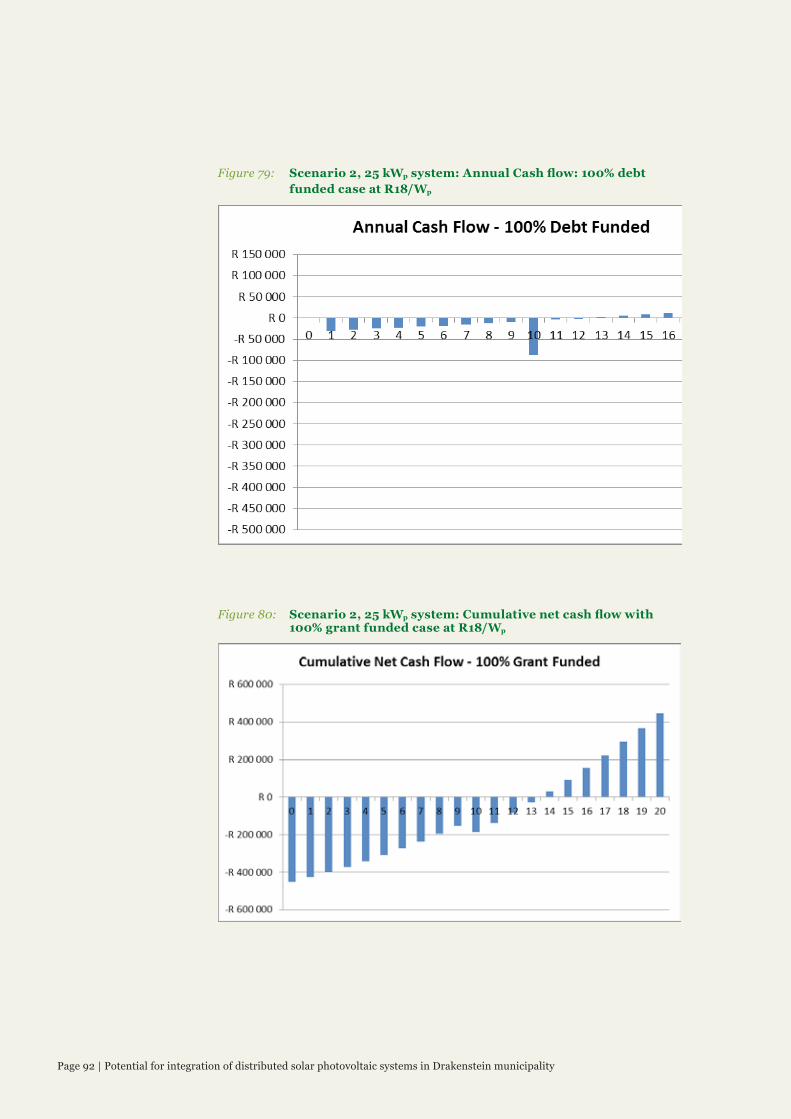
Figure 79: Scenario 2, 25 kWpsystem:AnnualCashflow:100%debtfundedcaseatR18/Wp
Figure 80: Scenario 2, 25 kWpsystem:Cumulativenetcashflowwith100%grantfundedcaseatR18/Wp
Page 92 | Potential for integration of distributed solar photovoltaic systems in Drakenstein municipality

Figure 81: Scenario 2, 25 kWpsystem:Cumulativenetcashflowwith50%grantfundedcaseatR18/Wp
Figure 82: Scenario 2, 25 kWpsystem:Cumulativenetcashflowforthe100%debtfundedcaseatR18/Wp
Potential for integration of distributed solar photovoltaic systems in Drakenstein municipality | Page 93

Figure 83: Scenario 2, 25 kWpsystem:Cumulativecostforthe100%grantfundedcaseatR18/Wp
Figure 84: Scenario 2, 25 kWpsystem:Cumulativecostforthe50%grantfundedcaseatR18/Wp
Page 94 | Potential for integration of distributed solar photovoltaic systems in Drakenstein municipality

Figure 85: Scenario 2, 25 kWpsystem:Cumulativecostforthe100%debtfundedcaseatR18/Wp
A payback period of 13, 17 and 20+ years is achieved for the 100% grant funded, 50% grant funded and 100% debt funded cases respectively. This compares poorly to scenario 1 where payback periods of 11, 13 and 17 years are realised for the 100% grant funded, 50% grant funded and 100% debt funded cases respectively. From the accumulative cost graphs it is seen that savings will be achieved from installing a PV system if the capital cost of R18/Wp or less is realised versus the situation where 1 Market Street management continues buying electricity from Eskom.
50 kWp System
Scenario 1
In this scenario the building is seen as a private entity buying electricity from Drakenstein Municipality only for self-consumption on the Bulk Time-of-Use Medium Voltage tariff.
a. Achievable Savings
Together with the use of the listed input parameters that define the financial model, the tariff structure on which the building is billed must be considered. The tariff structure determines the associated cost of electricity, the avoided costs with the use of the PV system and thus determines the savings, payback period and internal rate of return (IRR) of the project. The tariff structure for this scenario is listed in Table 29, repeated here for convenience in Table 37. The division of the bill on this tariff structure is also repeated in Figure 86.
Potential for integration of distributed solar photovoltaic systems in Drakenstein municipality | Page 95

Table 37: BulkTimeofUseMediumVoltageTariff2014/2015
Fixed Charge R1296.00
Demand Charge per kVA R44.00
Access Charge per kVA (12 months)
R37.00
Active Energy Charge High demand season [Jun-Aug]
Low demand season [Sept-May]
Peak [R/kWh] R1.853 R1.1369
Standard [R/kWh] R0.7778 R0.6358
Off peak [R/kWh] R0.4463 R0.3947
Reactive Energy per kVArh
R0.0200
Figure 86: Current division of the bill
The achievable savings for 1 year is based on the 2014/2015 rates, which are applicable from 1st July 2014 for the proposed 50 kWp PV system. These found savings are used as the input into the financial model. The excess energy monetary value amounts to R 1 833.34 which insignificant in comparison to the total savings.
Table 38: Potential savings for year 1 for scenario 1: 50 kWp system
Saved [ZAR] % of total savings
EnergyCharge R51682.19 87.43%
DemandCharge R7430.92 12.57%
Page 96 | Potential for integration of distributed solar photovoltaic systems in Drakenstein municipality

b. Results
The information and assumptions in Table 26 and Table 38 are used as input into the financial model. The summary of results is presented in Table 39, Table 40 and Table 41.
Table 39: Financialresultsforscenario1@R16/Wp, 50 kWp system
@ R 16/Wp
100% Grant funded 50% Grant funded 100% Debt funded
Totalcostoverprojectlifetime
R1057631.29 R1597308.29 R2136985.29
Initialcapitalcost R800000.00 R400000.00 R0.00
CostforBusiness-as-usual
R2464773.31 R2464773.31 R2464773.31
Profit/SavingsIncurred
R1407142.02 R867465.02 R327788.02
ProjectIRR 9.58% 9.30% 7.98%
NPV R357520.00 R204463.15 R51406.30
Paybackperiod[years]
11 12 15
LCOEofPVenergyoverdurationofproject
R0.75 R1.42 R2.09
LCOEofUtilityenergyoverdurationofproject
R1.76 R1.76 R1.76
Table 40: Financialresultsforscenario1@R18/Wp, 50 kWp system
@ R 18/Wp
100% Grant funded 50% Grant funded 100% Debt funded
Totalcostoverprojectlifetime
R1169835.20 R1776971.82 R2384108.45
Initialcapitalcost R900000.00 R450000.00 R0.00
CostforBusiness-as-usual
R2464773.31 R2464773.31 R2464773.31
Profit/SavingsIncurred
R1294938.11 R687801.49 R80664.86
ProjectIRR 8.20% 6.96% 1.77%
NPV R256444.10 R84255.14 -R87933.81
Potential for integration of distributed solar photovoltaic systems in Drakenstein municipality | Page 97

@ R 18/Wp
100% Grant funded 50% Grant funded 100% Debt funded
Paybackperiod[years]
11 13 19
LCOEofPVenergyoverdurationofproject
R0.83 R1.59 R2.34
LCOEofUtilityenergyoverdurationofproject
R1.76 R1.76 R1.76
Table 41: Financialresultsforscenario1@R20/Wp, 50 kWp system
@ R 20/Wp
100% Grant funded 50% Grant funded 100% Debt funded
Totalcostoverprojectlifetime
R1282039.11 R1956635.36 R2631231.61
Initialcapitalcost R1000000.00 R500000.00 R0.00
CostforBusiness-as-usual
R2464773.31 R2464773.31 R2464773.31
Profit/SavingsIncurred
R1182734.20 R508137.95 -R166458.30
ProjectIRR 7.02% 4.91% -3.47%
NPV R155368.20 -R35952.86 -R227273.92
Paybackperiod[years]
12 15 20+
LCOEofPVenergyoverdurationofproject
R0.91 R1.75 R2.59
LCOEofUtilityenergyoverdurationofproject
R1.76 R1.76 R1.76
Similar to the 25 kWp system, the LCOE values found all the different funded cases for the turnkey installed solution of R 16/Wp or R 18/Wp show that savings can be realised through the installation of the PV project. If the installed cost is R 20/Wp
then the business case becomes questionable for the debt funded cases if the decision is based purely on financial returns.
Considering the case where the installed turnkey solution is R 18/W the annual cash flow, accumulative net cash flow and accumulative cost is investigated. The avoided costs constitute the cash flow for the project. Here the total savings are subtracted from the associated expenses as seen in Figure 87, Figure 88 and Figure 89 for the 3 differently funded cases. Figure 90 to Figure 95 shows the cumulative costs associated with the PV project and compare these costs with the situation
Page 98 | Potential for integration of distributed solar photovoltaic systems in Drakenstein municipality

where no intervention is made and the management of 1 Market Street continues paying Drakenstein Municipality to deliver electricity. Figure 90, Figure 91 and Figure 92 show the payback period and Figure 93, Figure 94 and Figure 95 shows the accumulative cost associated with of both the PV installation and the cost of electricity bought from Drakenstein Municipality.
Figure 87: Scenario 1, 50 kWpsystem:AnnualCashflow:100%grantfundedcaseatR18/Wp
Figure 88: Scenario 1, 50 kWpsystem:AnnualCashflow:50%grantfundedcaseatR18/Wp
Potential for integration of distributed solar photovoltaic systems in Drakenstein municipality | Page 99

As seen from Figure 88, 50% of the initial project capital is invested in the project. Important to note is that the savings incurred covers the debt repayment annually from year 1. Year 10 sees a negative cash flow and is related to the replacement of the inverter, this can however be financed out of the initial loan but was left out in this instance.
Figure 89: Scenario 1, 50 kWpsystem:AnnualCashflow:100%debtfundedcaseatR18/Wp
Figure 90: Scenario 1, 50 kWpsystem:Cumulativenetcashflowwith100%grantfundedcaseatR18/Wp
Page 100 | Potential for integration of distributed solar photovoltaic systems in Drakenstein municipality

Figure 91: Scenario 1, 50 kWpsystem:Cumulativenetcashflowwith50%grantfundedcaseatR18/Wp
Figure 92: Scenario 1, 50 kWpsystem:Cumulativenetcashflowforthe100%debtfundedcaseatR18/Wp
Potential for integration of distributed solar photovoltaic systems in Drakenstein municipality | Page 101

Figure 93: Scenario 1, 50 kWpsystem:Cumulativecostforthe100%grantfundedcaseatR18/Wp
Figure 94: Scenario 1, 50 kWpsystem:Cumulativecostforthe50%grantfundedcaseatR18/Wp
Page 102 | Potential for integration of distributed solar photovoltaic systems in Drakenstein municipality

Figure 95: Scenario 1, 50 kWpsystem:Cumulativecostforthe100%debtfundedcaseatR18/Wp
A payback period at R 18/Wp of 11 years is achieved for the 100% grant funded, 13 years for the 50% grant funded and 19 years for the 100% debt funded case. The payback period is comparable to the 25 kWp system bar the 100% debt funded case. Although the payback periods compare well, the IRR of the 25 kWp system shows a more positive business case. The IRR of the 50 kWp system at R 18/Wp is 8.20% is achieved for the 100% grant funded, 6.96% for the 50% grant funded and 1.77% for the 100% debt funded case. The IRR of the 25 kWp system at R 18/Wp is 9.02% is achieved for the 100% grant funded, 8.35% for the 50% grant funded and 5.37% for the 100% debt funded case, indicating that the 25 kWp system will be a better investment. From the accumulative cost graphs it is seen that savings will be achieved from installing the 50 kWp PV system versus the situation where 1 Market Street management continues buying electricity from the Drakenstein municipality.
Scenario 2
In this scenario the building is seen as a Drakenstein Municipality entity reducing the active energy and demand required from Eskom and savings are calculated from the Eskom Megaflex tariff.
a. Achievable Savings
The tariff structure for this scenario is listed in Table 32, repeated here in Table 42 for convenience. Similarly the division of the bill is repeated in Figure 96.
Potential for integration of distributed solar photovoltaic systems in Drakenstein municipality | Page 103

Table 42: Megaflex–Localauthorityrates2014/2015
Service charge R/Account/day R2813.83
Administration charge R/POD/day R89.86
Transmission network charge per kVA R5.73
Network access charge per kVA R4.12
Network demand charge per kVA R7.62
Urban low voltage subsidy charge per kVA
R10.09
Reliability service charge per kWh R0.0027
Electrification and rural network subsidy charge per kWh
R0.0559
Active Energy Charge Highdemandseason[Jun-Aug]
Lowdemandseason[Sept-May]
Peak [R/kWh] R2.2224 R0.7249
Standard [R/kWh] R0.6732 R0.4989
Off peak [R/kWh] R0.3656 R0.3165
Reactive Energy per kVArh R0.1010 R0.00
Figure 96: CurrentdivisionofthebillontheEskomMegaflexlocalauthoritytariff
The achievable savings for 1 year is based on the 2014/2015 rates which are applicable from 1st July 2014 for the proposed 50 kWp PV system. These found savings are used as the input into the financial model. When Table 43 and Table 38 are compared the achievable savings are less when the building usage is billed on the Megaflex tariff. Although the Megaflex tariff has a higher peak active energy
Page 104 | Potential for integration of distributed solar photovoltaic systems in Drakenstein municipality

charge, the majority of the savings will occur at the standard energy charge, which in the Megaflex tariff is lower than the Drakenstein bulk time of use tariff. The excess energy monetary value for this scenario amounts to R 1 708.70 which insignificant in comparison to the total savings.
Table 43: Potentialsavingsforyear1ontheEskomMegaflextariff
Saved [ZAR] % of total savings
EnergyCharge R45346.77 97.24%
DemandCharge R1286.90 2.76%
b. Results
The information and assumptions in Table 26 and Table 43 are used as input into the financial model. The summary of results is presented in Table 44, Table 45 and Table 46.
Table 44: Financialresultsforscenario2@R16/Wp,50 kWp system
@ R 16/Wp
100% Grant funded
50% Grant funded
100% Debt funded
Totalcostoverprojectlifetime R1057631.29 R1597308.29 R2136985.29
Initialcapitalcost R800000.00 R400000.00 R0.00
CostforBusiness-as-usual R1944432.00 R1944432.00 R1944432.00
Profit/SavingsIncurred R886800.71 R347123.72 -R192553.28
ProjectIRR 6.65% 4.24% -4.98%
NPV R92593.81 -R60463.04 -R213519.89
Paybackperiod[years] 13 16 20+
LCOEofPVenergyoverdurationofproject
R0.72 R1.35 R1.99
LCOEofUtilityenergyoverdurationofproject
R1.32 R1.32 R1.32
Potential for integration of distributed solar photovoltaic systems in Drakenstein municipality | Page 105

Table 45: Financialresultsforscenario2@R18/Wp,50 kWp system
@ R 18/Wp
100% Grant funded
50% Grant funded
100% Debt funded
Totalcostoverprojectlifetime R1169835.20 R1776971.82 R2384108.45
Initialcapitalcost R900000.00 R450000.00 R0.00
CostforBusiness-as-usual R1944432.00 R1944432.00 R1944432.00
Profit/SavingsIncurred R774596.80 R167460.18 -R439676.44
ProjectIRR 5.40% 1.95% -11.33%
NPV -R8482.09 -R180671.04 -R352860.00
Paybackperiod[years] 14 18 20+
LCOEofPVenergyoverdurationofproject
R0.79 R1.51 R2.22
LCOEofUtilityenergyoverdurationofproject
R1.32 R1.32 R1.32
Table 46: Financialresultsforscenario2@R20/Wp, 50 kWp system
@ R 20/Wp
100% Grant funded
50% Grant funded
100% Debt funded
Totalcostoverprojectlifetime R1282039.11 R1956635.36 R2631231.61
Initialcapitalcost R1000000.00 R500000.00 R0.00
CostforBusiness-as-usual R1944432.00 R1944432.00 R1944432.00
Profit/SavingsIncurred R662392.89 -R12203.36 -R686799.60
ProjectIRR 4.33% -0.14% Negative
NPV -R109557.98 -R300879.05 -R492200.11
Paybackperiod[years] 14 20 20+
LCOEofPVenergyoverdurationofproject
R0.87 R1.66 R2.46
LCOEofUtilityenergyoverdurationofproject
R1.32 R1.32 R1.32
The 100% grant funded, capital cost of R 16/Wp is the only positive business case. However the LCOE values found for the range of capital cost for the 100% grant funded case show that savings can be realised through the installation of the PV project if this funding case can be realised.
Considering the case where the installed turnkey solution is R 18/W the annual cash flow, accumulative net cash flow and accumulative cost is investigated. The avoided
Page 106 | Potential for integration of distributed solar photovoltaic systems in Drakenstein municipality

costs constitute the cash flow for the project. Here the total savings are subtracted from the associated expenses as seen in Figure 97, Figure 98 and Figure 99 for the 3 differently funded cases. Figure 100 to Figure 105 shows the cumulative costs associated with the PV project and compare these costs with the situation where no intervention is made and the management of 1 Market Street continues paying Drakenstein Municipality to deliver electricity. Figure 100, Figure 101 and Figure 102 show the payback period and Figure 103, Figure 104 and Figure 105 shows the accumulative cost associated with of both the PV installation and the cost of electricity bought from Drakenstein Municipality.
Figure 97: Scenario 2, 50 kWpsystem:AnnualCashflow:100%grantfundedcaseatR18/Wp
Potential for integration of distributed solar photovoltaic systems in Drakenstein municipality | Page 107

Figure 98: Scenario 2, 50 kWpsystem:AnnualCashflow:50%grantfundedcaseatR18/Wp
As seen from Figure 68, 50% of the initial project capital is invested in the project. Important to note is that the savings incurred covers the debt repayment annually from year 3, unlike scenario 1 where the savings cover the debt repayment from year 1. Year 10 sees a negative cash flow and is related to the replacement of the inverter, this can however be financed out of the initial loan but was left out in this instance.
Figure 99: Scenario 2, 50 kWpsystem:AnnualCashflow:100%debtfundedcaseatR18/Wp
Page 108 | Potential for integration of distributed solar photovoltaic systems in Drakenstein municipality

Figure 100: Scenario 2, 50 kWpsystem:Cumulativenetcashflowwith100%grantfundedcaseatR18/Wp
Figure 101: Scenario 2, 50 kWpsystem:Cumulativenetcashflowwith50%grantfundedcaseatR18/Wp
Potential for integration of distributed solar photovoltaic systems in Drakenstein municipality | Page 109

Figure 102: Scenario 2, 50 kWpsystem:Cumulativenetcashflowforthe100%debtfundedcaseatR18/Wp
Figure 103: Scenario 2, 50 kWpsystem:Cumulativecostforthe100%grantfundedcaseatR18/Wp
Page 110 | Potential for integration of distributed solar photovoltaic systems in Drakenstein municipality

Figure 104: Scenario 2, 50 kWpsystem:Cumulativecostforthe50%grantfundedcaseatR18/Wp
Figure 105: Scenario 2, 50 kWpsystem:Cumulativecostforthe100%debtfundedcaseatR18/Wp
A payback period of 14 year is achieved for the 100% grant funded case, 18 years for the 50% grant funded case and 20+ years for the 100% debt funded cases respectively for a capital cost of R 18/Wp. The validity if the business case must be carefully considered with these extended payback periods.
Potential for integration of distributed solar photovoltaic systems in Drakenstein municipality | Page 111

Scenario 3
In the scenario the building is seen as a private entity buying electricity from Drakenstein Municipality on Large Power Users Small Scale Embedded Generation Medium Voltage tariff.
a. Achievable Savings
Together with the use of the listed input parameters that define the financial model, the tariff structure on which the building is billed must be considered. The tariff structure determines the associated cost of electricity, the avoided costs with the use of the PV system and thus determines the savings, payback period, and internal rate of return (IRR) of the project. The tariff structure for this scenario is listed in Table 47.
Table 47: Large Power Users Small Scale Embedded Generation MediumVoltage2014/201544
Fixed Charge R1495.00
Demand Charge per kVA R52.00
Access Charge per kVA (12 months) R44.00
Active Energy Charge Highdemandseason [Jun-Aug]
Lowdemandseason [Sept-May]
Peak [R/kWh] R1.5924 R0.9771
Standard [R/kWh] R0.6684 R0.5464
Off peak [R/kWh] R0.3836 R0.3392
Reactive Energy per kVArh R0.0200
When the Large Power Users Small Scale Embedded Generation Medium Voltage tariff is compared to the bulk consumers time of use medium voltage tariff it is noted that service, demand and access charge is higher but the active energy charges are lower. This will result in larger demand charge savings if the energy usage peaks are reduced significantly. For this tariff all the generated electricity is used thus the kWh’s saved will increase. However an additional expense is the smart meter required when billed on this tariff structure. An estimated cost of R 3300 for the smart meter is incorporated into the system costs.
The achievable savings for 1 year is based on the 2014/2015 rates, which are applicable from 1st July 2014 for the proposed 50 kWp PV system. These found savings are used as the input into the financial model.
44 Note that the building requires a smart meter to be installed if this tariff structure is to be implemented
Page 112 | Potential for integration of distributed solar photovoltaic systems in Drakenstein municipality

Table 48: Potential savings for year 1 on the Large Power Users Small ScaleEmbeddedGenerationMediumVoltagetariff
Saved [ZAR] % of total savings
EnergyCharge(usedwhenproduced) R44415.34 83.97%
EnergyCharge(accountedforthroughnet-metering)
R1575.59
DemandCharge R8781.99 16.03%
Table 48 shows the energy charge savings due to net metering (excess energy) is small in comparison to the savings due to instantaneous reduction of required electricity. The excess savings amounts to 3.6%. This increase in savings is less than the decrease in active energy charge (14%) and together with the increase in access and basic service charge positive returns are not expected.
b. Results
The information and assumptions in Table 26 and Table 48 are used as input into the financial model. The summary of results is presented in Table 49, Table 50 and Table 51.
Table 49: Financialresultsforscenario3@R16/Wp, 50 kWp system
@ R 16/Wp
100% Grant funded 50% Grant funded 100% Debt funded
Totalcostoverprojectlifetime
R1060931.29 R1602834.46 R2144737.62
Initialcapitalcost R803300.00 R401650.00 R0.00
CostforBusiness-as-usual
R2283805.81 R2283805.81 R2283805.81
Profit/SavingsIncurred R1222874.52 R680971.35 R139068.19
ProjectIRR 8.56% 7.58% 3.37%
NPV R262254.38 R108566.17 -R45122.04
Paybackperiod[years] 11 13 18
LCOEofPVenergyoverdurationofproject
R0.72 R1.36 R2.00
LCOEofUtilityenergyoverdurationofproject
R1.55 R1.55 R1.55
Potential for integration of distributed solar photovoltaic systems in Drakenstein municipality | Page 113

Table 50: Financialresultsforscenario3@R18/Wp, 50 kWp system
@ R 18/Wp
100% Grant funded
50% Grant funded
100% Debt funded
Totalcostoverprojectlifetime
R1173135.20 R1782497.99 R2391860.78
Initialcapitalcost R903300.00 R451650.00 R0.00
CostforBusiness-as-usual
R2283805.81 R2283805.81 R2283805.81
Profit/SavingsIncurred R1110670.61 R501307.82 -R108054.97
ProjectIRR 7.24% 5.29% -2.44%
NPV R161178.48 -R11641.84 -R184462.15
Paybackperiod[years] 12 15 20+
LCOEofPVenergyoverdurationofproject
R0.79 R1.51 R2.23
LCOEofUtilityenergyoverdurationofproject
R1.55 R1.55 R1.55
Table 51: Financialresultsforscenario3@R20/Wp, 50 kWp system
@ R 20/Wp
100% Grant funded
50% Grant funded
100% Debt funded
Totalcostoverprojectlifetime
R1285339.11 R1962161.53 R2638983.94
Initialcapitalcost R1003300.00 R501650.00 R0.00
CostforBusiness-as-usual
R2283805.81 R2283805.81 R2283805.81
Profit/SavingsIncurred R998466.70 R321644.28 -R355178.13
ProjectIRR 6.10% 3.25% -7.84%
NPV R60102.58 -R131849.84 -R323802.26
Paybackperiod[years] 13 16 20+
LCOEofPVenergyoverdurationofproject
R0.87 R1.67 R2.47
LCOEofUtilityenergyoverdurationofproject
R1.55 R1.55 R1.55
The LCOE values found for the 100% grant funded and 50% grant funded case for the turnkey installed solution of R 18/Wp or less show that savings can be realised through the installation of the PV project. If the installed cost is R 20/Wp then the business case becomes questionable.
Page 114 | Potential for integration of distributed solar photovoltaic systems in Drakenstein municipality

Considering the case where the installed turnkey solution is R 18/Wp the annual cash flow, accumulative net cash flow and accumulative cost is investigated. The avoided costs constitute the cash flow for the project. Here the total savings are subtracted from the associated expenses as seen in Figure 106, Figure 107 and Figure 108 for the 3 differently funded cases. Figure 109 to Figure 114 shows the cumulative costs associated with the PV project and compare these costs with the situation where no intervention is made and the management of 1 Market Street continues paying Drakenstein Municipality to deliver electricity. Figure 109, Figure 110 and Figure 111 show the payback period and Figure 112, Figure 113 and Figure 114 shows the accumulative cost associated with of both the PV installation and the cost of electricity bought from Drakenstein Municipality.
Figure 106: Scenario 3, 50 kWpsystem:AnnualCashflow:100%grantfundedcaseatR18/Wp
Potential for integration of distributed solar photovoltaic systems in Drakenstein municipality | Page 115

Figure 107: Scenario 3, 50 kWpsystem:AnnualCashflow:50%grantfundedcaseatR18/Wp
As seen from Figure 107, 50% of the initial project capital is invested in the project. Important to note is that the savings incurred covers the debt repayment annually from year 1. Year 10 sees a negative cash flow and is related to the replacement of the inverter, this can however be financed out of the initial loan but was left out in this instance.
Figure 108: Scenario 3, 50 kWpsystem:AnnualCashflow:100%debtfundedcaseatR18/Wp
Page 116 | Potential for integration of distributed solar photovoltaic systems in Drakenstein municipality

Figure 109: Scenario 3, 50 kWpsystem:Cumulativenetcashflowwith100%grantfundedcaseatR18/Wp
Figure 110: Scenario 3, 50 kWpsystem:Cumulativenetcashflowwith50%grantfundedcaseatR18/Wp
Potential for integration of distributed solar photovoltaic systems in Drakenstein municipality | Page 117

Figure 111: Scenario 3, 50 kWpsystem:Cumulativenetcashflowforthe100%debtfundedcaseatR18/Wp
Figure 112: Scenario 3, 50 kWpsystem:Cumulativecostforthe100%grantfundedcaseatR18/Wp
Page 118 | Potential for integration of distributed solar photovoltaic systems in Drakenstein municipality

Figure 113: Scenario 3, 50 kWpsystem:Cumulativecostforthe50%grantfundedcaseatR18/Wp
Figure 114: Scenario 3, 50 kWpsystem:Cumulativecostforthe100%debtfundedcaseatR18/Wp
A payback period of 12 years is achieved for the 100% grant funded case, 15 years for 50% grant funded case and 20+ years for the 100% debt funded cases respectively. The payback period for the 50 kWp system on the Bulk Time of Use tariff shows a better business case even with the lesser energy savings due to the higher cost of electricity in this tariff. From the accumulative cost graphs it is seen that savings will be achieved from installing a PV system versus the situation where 1 Market Street management continues buying electricity from the Drakenstein municipality.
Potential for integration of distributed solar photovoltaic systems in Drakenstein municipality | Page 119

Summary
Table 52 and Table 53 present a summary for each system at R 18/Wp. When all the scenarios are compared, the most feasible business case is achieved from the 25 kWp system if 1 Market Street, remains on the Bulk Time of Use Medium Voltage tariff. The 100% grant funded case sees an IRR of 9.02% and a payback period of 11 years. For the 50% grant funded case, an IRR of 8.35% is seen and a payback period of 13 years. The 50 kWp does not perform as well as the 25 kWp system due to the increased shading losses and lower specific yield of the system. For this reason the 50 kWp system on the Large Power Users Small Scale Embedded Generation Medium Voltage tariff does not produce the savings expected.
Further, if the building is to switch over to the Large Power Users Small Scale Embedded Generation Medium Voltage tariff the PV system needs to be larger so that the excess produced electricity, over and above that electricity used to reduce the instantaneous electricity demand can significantly reduce the overall energy usage through the use of net metering. The high ambient temperatures are of concern in the examined area and careful consideration must be given to the type of panels installed in this area.
Page 120 | Potential for integration of distributed solar photovoltaic systems in Drakenstein municipality

Tabl
e 52
:Summaryofthefinancialfeasibilityofthe25kW
psystematR
18/W
p 25 k
Wp S
yste
m
Scen
ario
1@
R 1
8/W
p
(Bui
ldin
g bi
lled
on B
ulk
Tim
e of
Use
Med
ium
Vol
tage
Ta
riff
)
Scen
ario
2@
R 1
8/W
p
(Bui
ldin
g bi
lled
on B
ulk
Tim
e of
Esk
om M
egafl
ex T
ariff
)
100%
Gra
nt
fund
ed
50%
Gra
nt
fund
ed
100%
Deb
t fu
nded
10
0% G
rant
fu
nded
50
% G
rant
fu
nded
10
0% D
ebt
fund
ed
Totalcostoverp
rojectlifetim
eR584917.60
R888485.91
R1192054.22
R584917.60
R888485.91
R1192054.22
Initialcapitalcost
R450000.00
R225000.00
R0.00
R450000.00
R225000.00
R0.00
CostforBusiness-as-usual
R1315725.62
R1315725.62
R1315725.62
R1030491.44
R1030491.44
R1030491.44
Profit/SavingsIncurred
R730808.02
R427239.71
R123671.40
R445573.83
R142005.52
-R161562.79
ProjectIR
R9.02%
8.35%
5.37%
6.07
%3.19%
-7.85%
NPV
R170653.19
R8455
8.71
-R1535.77
R25429.27
-R6066
5.21
-R146759.69
Paybackperiod[years]
1113
1713
1720
+
LCOEofP
Venergyoverdurationof
project
R0.78
R1.49
R2.19
R0.78
R1.49
R2.19
LCOEofU
tilityenergyoverduration
ofproject
R1.76
R1.76
R1.76
R1.37
R1.37
R1.37
Potential for integration of distributed solar photovoltaic systems in Drakenstein municipality | Page 121

Tabl
e 53
:Summaryofthefinancialfeasibilityofthe50kW
psystematR
18/W
p
50 k
Wp S
yste
m
Scen
ario
1@
R18
/Wp
(Bui
ldin
g bi
lled
on B
ulk
Tim
e of
Use
Med
ium
Vo
ltage
Tar
iff)
Scen
ario
2@
R18
/Wp
(Bui
ldin
g bi
lled
on B
ulk
Tim
e of
Esk
om
Meg
aflex
Tar
iff)
Scen
ario
3@
R18
/Wp
(Bui
ldin
g bi
lled
on B
ulk
Tim
e of
Lar
ge P
ower
U
sers
Sm
all S
cale
Em
bedd
ed G
ener
atio
n M
ediu
m V
olta
ge ta
riff
)
100%
Gra
nt
fund
ed
50%
Gra
nt
fund
ed
100%
Gra
nt
fund
ed
50%
Gra
nt
fund
ed
100%
Deb
t fu
nded
10
0% D
ebt
fund
ed
50%
Gra
nt
fund
ed
100%
Deb
t fu
nded
10
0% D
ebt
fund
ed
Tota
l cos
t overproject
lifet
ime
R1169
835.20
R1776
971.82
R2384
108.45
R1169
835.20
R1776
971.82
R2384
108.45
R1173
135.20
R1782
497.99
R2391
860.78
Initialcapital
cost
R900000.00
R450000.00
R0.00
R900000.00
R450000.00
R0.00
R903300.00
R451650.00
R0.00
Costfor
Business-as-
usual
R2464
773.31
R2464
773.31
R2464
773.31
R1944
432.00
R1944
432.00
R1944
432.00
R2283
805.81
R2283
805.81
R2283
805.81
Profit/Savings
Incurred
R1294
938.11
R687801.49
R8066
4.86
R774596
.80
R167460.18
-R439676.44
R1110
670.
61R501307.82
-R108054.97
ProjectIR
R8.20%
6.96%
1.77
%5.40%
1.95%
-11.33%
7.24
%5.29%
-2.44%
NPV
R256444.10
R84255.14
-R87933.81
-R8482.09
-R180671.04
-R352860.00
R161178.48
-R11641.84
-R184462.15
Payback
perio
d[years]
1113
1914
1820
+12
1520
+
LCOEofP
V
energyover
durationof
project
R0.83
R1.59
R2.34
R0.79
R1.51
R2.22
R0.79
R1.51
R2.23
LCOEof
Utilityenergy
overduration
ofproject
R1.76
R1.76
R1.76
R1.32
R1.32
R1.32
R1.55
R1.55
R1.55
Page 122 | Potential for integration of distributed solar photovoltaic systems in Drakenstein municipality

Conclusion
This prefeasibility study made use of half-hourly metered data that was available over a 10 month period to determine the electricity usage profile of the building. Detailed roof layout drawings were obtained and used to model two potential PV systems on the roof of 1 Market Street, Paarl. Hourly solar data was used as input into the numerical PV model in order to create a hind cast model where historical usage data is compared to hind cast PV production data.
A 25 kWp and a 50 kWp system are proposed and through financial assessments carried out. The most feasible case found is the 25 kWp system, where the building remains on the Bulk Time of Use Medium Voltage tariff. For the 100% grant funded case an IRR of 9.02%, a payback period of 11 years and LCOE of R 0.78 is achieved. For the 50% grant funded case an IRR of 8.35% is seen, a payback period of 13 years and LCOE of R 1.49. It is hypothesised that these savings can be increased if the usage profiles are altered to decrease the morning and afternoon peaks. It is suggested that air-conditioners be placed on timers so that the start-up is staggered from early morning, reducing the 9:00 peak.
CRSES is aware that an energy efficiency programme is currently being rolled out for this building and recommends that prior to installing the PV array, the reduction in usage load is evaluated to ensure that the 25 kWp system is still well matched to the required usage load.
Owing to the site concerns surrounding the high ambient temperature in the Paarl area, CRSES suggests that should Drakenstein Municipality decide to install PV panels on the roof of 1 Market Street, the service providers investigate the use of thin film panels that are less affected by temperature. The drawback to these panels are however, that such an array cannot achieve the same power density as with the poly crystalline panels, and roof space is already a constraint in this project.
CRSES concludes that if grant funding is awarded for this project, the installation of a 25 kWp PV array will be successful. For this building, with the shading concerns and restricted roof space CRSES suggest that the PV system that is implemented does not feed back into the grid and all produced energy is for self-consumption. It does not make business sense for this building to move over to the Large Power Users Small Scale Embedded Generation tariff with the implementation of this size PV system, however this tariff may be applicable to larger PV installations.
CRSES trusts that the implementation of the described promising PV system will not only reduce the energy required from an already over constrained grid, it will also promote the green mandate of the Drakenstein Municipality.
Tabl
e 53
:Summaryofthefinancialfeasibilityofthe50kW
psystematR
18/W
p
50 k
Wp S
yste
m
Scen
ario
1@
R18
/Wp
(Bui
ldin
g bi
lled
on B
ulk
Tim
e of
Use
Med
ium
Vo
ltage
Tar
iff)
Scen
ario
2@
R18
/Wp
(Bui
ldin
g bi
lled
on B
ulk
Tim
e of
Esk
om
Meg
aflex
Tar
iff)
Scen
ario
3@
R18
/Wp
(Bui
ldin
g bi
lled
on B
ulk
Tim
e of
Lar
ge P
ower
U
sers
Sm
all S
cale
Em
bedd
ed G
ener
atio
n M
ediu
m V
olta
ge ta
riff
)
100%
Gra
nt
fund
ed
50%
Gra
nt
fund
ed
100%
Gra
nt
fund
ed
50%
Gra
nt
fund
ed
100%
Deb
t fu
nded
10
0% D
ebt
fund
ed
50%
Gra
nt
fund
ed
100%
Deb
t fu
nded
10
0% D
ebt
fund
ed
Tota
l cos
t overproject
lifet
ime
R1169
835.20
R1776
971.82
R2384
108.45
R1169
835.20
R1776
971.82
R2384
108.45
R1173
135.20
R1782
497.99
R2391
860.78
Initialcapital
cost
R900000.00
R450000.00
R0.00
R900000.00
R450000.00
R0.00
R903300.00
R451650.00
R0.00
Costfor
Business-as-
usual
R2464
773.31
R2464
773.31
R2464
773.31
R1944
432.00
R1944
432.00
R1944
432.00
R2283
805.81
R2283
805.81
R2283
805.81
Profit/Savings
Incurred
R1294
938.11
R687801.49
R8066
4.86
R774596
.80
R167460.18
-R439676.44
R1110
670.
61R501307.82
-R108054.97
ProjectIR
R8.20%
6.96%
1.77
%5.40%
1.95%
-11.33%
7.24
%5.29%
-2.44%
NPV
R256444.10
R84255.14
-R87933.81
-R8482.09
-R180671.04
-R352860.00
R161178.48
-R11641.84
-R184462.15
Payback
perio
d[years]
1113
1914
1820
+12
1520
+
LCOEofP
V
energyover
durationof
project
R0.83
R1.59
R2.34
R0.79
R1.51
R2.22
R0.79
R1.51
R2.23
LCOEof
Utilityenergy
overduration
ofproject
R1.76
R1.76
R1.76
R1.32
R1.32
R1.32
R1.55
R1.55
R1.55
Potential for integration of distributed solar photovoltaic systems in Drakenstein municipality | Page 123

Page 124 | Potential for integration of distributed solar photovoltaic systems in Drakenstein municipality

CONCLUSION This research proves that there is a PV system installation potential in Drakenstein municipal area of 24 MWp before grid studies are needed. When this PV installation potential is compared to the electricity user profiles in Drakenstein, it is shown that it is unlikely that this technical maximum will be exceeded in the short to medium term. This research further demonstrated that the installation of these potential PV systems might have a negative impact on the municipal electricity revenue of 3%.
This research also indicates that there is a good potential for Drakenstein municipality to install PV systems on the roofs of their own buildings, with a feasible financial outcome.
Potential for integration of distributed solar photovoltaic systems in Drakenstein municipality | Page 125

APPENDIX 1 List of installed PV in the WC (excluding off grid and REIPPPP)45
Description / Location Application Size (kWp)
SomersetCollege Commercial 2
ZooteeStudios 2
Hi Temp Johan Residential 3
ClanWilliam 3.2
Houtbay 3.3
Constantia 3.3
Constantia 3.7
Llandudno 4.5
Constantia 4.5
Houtbay 4.5
Tokai 4.5
Durbanville 4.5
Durbanville 4.5
TwoOceansAquarium 5
Claremont 5
Houtbay 5.5
Durbanville 5.8
Christianbrotherscentre Commercial 7
Somersetwest Residential 7
CapeTown 8
Wolwedans Commercial 9
Houtbay 10
Wellington 10
StellekayaWineFarm Agricultural 10
HouseWhitaker Commercial 12
CavendishSquare Commercial 15
KhayalitshaEnvironmentalHealthOffices 17
Cybersmart Commercial 20
VineyardHotelspa 20
45 From:http://pqrs.co.za/s-a-solar-pv-list-2/solar-pv-list/
Page 126 | Potential for integration of distributed solar photovoltaic systems in Drakenstein municipality

Description / Location Application Size (kWp)
Chaloner Commercial 21
SolarirrigationsystemMontague Agricultural 24
KhayalitshaDistricHospital Commercial 25
Koppie Alleen Commercial 25
Kleinood Agricultural 28
ImpahlaClothing Industrial/Manufacturing
30
Store-agePinehurst Commercial 30
ImperialLogistics Commercial 30
HessequaMunicipality Commercial 33
BeaufortWestMunicipality Commercial 33
RectronCapeTown Commercial 34
Lelienfontein Agricultural 35
OldenburgVineyards Agricultural 45
Bolandbottlingplant Commercial 48
BosmanFamilyvineyards Agricultural 53
CavalliWineandStudFarm Agricultural 58
LaMotteWinery Agricultural 60
KleinConstantia Agricultural 60
EricMiles Commercial 62
CapeTownMitchellsplainhospital Commercial/Industrial
62
BPOffices Commercial 67
GlenellyWineEstate commercial 70
Cornerstone Commercial 81
Historicwine Commercial 84
J.C.Bosman&Groenfontein Agricultural 88
Bloemhof Commercial 100
QuoinRockWinery Agricultural 102
HQFoodsCapeTown Commercial 103
Woolworths 108
Bluejayfruit Agricultural 127
VillieraWineEstate Agricultural 132
GlaxoSmithKline Industrial 143
Bo-RadynFarm Agricultural 162
DeGrendelWinery Agricultural 210
CapeQuarter 212
Potential for integration of distributed solar photovoltaic systems in Drakenstein municipality | Page 127

Description / Location Application Size (kWp)
Vrede&Lust 218
BowlerPlasticsPhillipi 280
Applewarehouse Agricultural 288
PicknPayDistribution Commercial 300
StellenpakFruitpackers 420
Arbeidsvreugd Agricultural 450
VilliersdorpColdstorage Commercial 450
Lourensford Agricultural 500
BaysideMall Commercial 500
VodacomCenturyCity 542
Wembleysquare 576
SilverstreambusinessPark 691
CeresColdrooms Commercial 1015
BlackRiverPark Industrial 1200
TOTAL 10229
Page 128 | Potential for integration of distributed solar photovoltaic systems in Drakenstein municipality

APPENDIX 2Maximum demand in kVA per substation for 2013-201446
Municipality Paarl
(Dalweiding)
Dwarsrivier Hugenot Wellington Slot
Jan-13 59522 22755
Feb-13 39635 10422 60800 21839 9886
Mar-13 61879 23160
Apr-13 51732 21758 3465
May-13 47181 7621
Jun-13 49669 8977 40556 23368 3567
Jul-13 49063 8602 38881 23264 3406
Aug-13 42005 9413 47423 20796 3438
Sep-13 46245 8490 37991 22240 3164
Oct-13 37263 7421 43680 18105 5177
Nov-13 37029 8191 50584 18166 5343
Dec-13 38638 7487 55384 20780 6839
Jan-14 43727 8666 61386 22737 9063
Feb-14 42201 8970 65699 24907 10191
Mar-14 44868 8086 59646 23204 9338
Apr-14 42166 7228 53710 21694 6016
May-14 45414 7485 39976 21329 3208
Jun-14 50407 9719 43217 21389 3892
Jul-14 41186 9676 45764 20822 3634
Aug-14 46647 20568
Sep-14 44953 20304
Oct-14 38678 7516 48720 19435 5925
Nov-14 40802 8750 53672 21089 6723
Dec-14 41998 8896 55348 21006 7301
46 DatafromEskomaccountstoDrakensteinmuniciplaity.EmptycellsarewheretheEskomaccountwasnotavailabletotheresearchers
Potential for integration of distributed solar photovoltaic systems in Drakenstein municipality | Page 129

APPENDIX 3Drakenstein Eskom accounts for 2014
Total Eskom account (excl. VAT)
January2014 R35512600
February2014 R36078374
March2014 R35970208
April 2014 R32578097
May2014 R33605639
June2014 R55536920
July2014 R62451027
August2014 R59249816
September2014 R35330105
October2014 R37147505
November2014 R35935136
December2014 R35215781
R494611209
(Footnotes)
1 FromtheEskomaccounts
2 1689kWh/kWp/year,ascalculatedbyPVSystSoftware,NorthfacingwithoptimaltiltusingtheDrakensteinCivicCentreincentralPaarlasthereferencesite
3 Atotalof8000residentialcustomerswitha3kWpsystemeach
4 CurrenttariffisR1.18perkWh.ThenewSSEGtariffisR1.00perkWh.AremainingmonthlykWhperhouseholdof400kWhpermonthisassumed.
5 Evenlydistributedbetweencustomercategories
6 Thiswascalculatedbytaking800Installationsof30kWpequallydividedbetweenthe9commercialtariffsforDrakensteinmunicipality.TheexistingbulkTimeofUsetariffswerenotincludedinthiscalculation.ThefinancialimpactfromauserpointofviewforthebulkTimeofUsetariffcanbeseeninPartD.
7 Anassumptionismadeof800commercialelectricityuserswitharemaining10000kWhpermonthbillremainingaftertheinstallationofPVandthisremainingelectricityisbilledatR1.00perkWhinsteadofR1.259perkWh
Page 130 | Potential for integration of distributed solar photovoltaic systems in Drakenstein municipality

CRSES
The Centre for Renewable and Sustainable Energy Studies at Stellenbosch University was established in 2007 as the national hub for postgraduate programmes in renewable and sustainable energy (RE) through a grant form the Department of Science and Technology. The Centre has a duel purpose: the training of scientists and engineers with the required technical expertise to unlock the country’s RE resources, and the implementation of appropriate technologies for the sustainable use of RE.
The Centre acts as a central point of entry into Stellenbosch University for the general field of RE. The work of the Centre focuses on contract research, postgraduate modules in RE and the coordination of other training courses in RE. Some contract research projects are completed within the Centre while others are channelled to the relevant academic departments or research groups of the University.
http://www.crses.sun.ac.za
Contributors
Author/s:K.KritzingerI.MeyerProf.J.L.VanNiekerkL.Scholtz
Special contributors:Theauthorwouldliketothank everyoneinvolvedfortheircollaboration andcontributionswhichhelpedto improvethefinalreport.
For WWF-South AfricaL Living Planet Unit:[email protected]
WWF South Africa: Living Planet UnitBridgeHouse1stFlooBoundaryTerracesMariendahlLaneNewlands
POBox23273Claremont7735SouthAfrica
www.panda.org/climateandenergy
Design: FarmDesign,www.farmdesign.co.zaCover Photograph: Daleen Loest, Shutterstock.com
Publication DetailsPublishedinAugust2015byWWFInternational(WorldWideFundforNature(formerlyWorldWildlifeFund),Gland,Switzerland.Anyreproductioninfullorinpartofthispublicationmustmentionthetitleandcredittheabove-mentionedpublisherasthecopyrightowner. Recommended citation:WWF,2015,PotentialforintegrationofdistributedsolarphotovoltaicsystemsinDrakensteinmunicipality.WWF-SA,SouthAfrica.©Textandgraphics:2015WWFAllrightreserved. Reproductionofthispublicationforeducationalorothernon-commericalpurposesisauthorisedwithoutpriorwrittenpermissionfromthecopyrightholder.However,WWFdoesrequestadvancewrittennotificationandappropriateacknowledgement.Reproductionofthispublicationforresaleorothercommercialpurposesisprohibitedwithoutpriorwrittenpermissionofthecopyrightholder.
WWF
WWF is one of the world’s largest and most experienced independent conservation organisations, with over 5 million supporters and a global network active in more than 100 countries. WWF’s mission is stop the degradation of the planet’s natural environment and to build a future in which humans live in harmony with nature, by conserving the world’s biological diversity, ensuring that the use of renewable natural resources is sustainable, and promoting the reduction of pollution and wasteful consumption.
The Global Climate & Energy Initiative (GCEI) is WWF’s global programme addressing climate change and a move to 100% renewable energy through engagement with business, promoting renewable and sustainable energy, scaling green finance and working nationally and internationally on low carbon frameworks. The team is based over three hubs – Mexico, South Africa and Belgium.
www.panda.org/climateandenergy

Why we are here
wwf.panda.org/climateandenergy
To stop the degradation of the planet’s natural environment andto build a future in which humans live in harmony with nature.
POTENTIAL FOR INTEGRATION OF DISTRIBUTED SOLAR PHOTOVOLTAIC SYSTEMS IN DRAKENSTEIN MUNICIPALITYWWW.PANDA.ORG / CLIMATEANDENERGY
©1986PandaSymbolWWF-WorldWideFundforNature(FormerlyWorldWildlifeFund)®“WWF”isaWWFRegisteredTrademark.WWF,AvenueduMont-Blanc, 1196Gland,Switzerland–Tel.+41223649111Fax+41223640332.Forcontactdetails andfurtherinformation,pleasevisitourinternationalwebsiteatwwf.panda.org
Potential for integration of distributed solar photovoltaic systems in Drakenstein municipality
PHO
TO: SH
UTTER
STOCK
.COM
INSTALLATION OF 24 000 KWPis technically possible for the whole of Drakenstein, following a conservative approach based on the electricity load profiles at substation level
3% POTENTIAL IMPACTon Drakenstein municipal revenue might result from the installation of 24 000 kWp PV systems
INSTALLATION OF 25KWPis proposed for the 1 Market Street building, owned by Drakenstein municipality
PV POTENTIALis highly place specific, determined by the solar resource, existing electricity use and access to public and/or private finance
NEW MODELSin municipal electricity generation and distribution (financial and technical) is required from municipalities