york central partnership york central leeman road...
TRANSCRIPT

York Central Partnership
York Central
Leeman Road - Transport Modelling
Issue | October 2017
This report takes into account the particular instructions and requirements of our client.
It is not intended for and should not be relied upon by any third party and no responsibility is undertaken to any third party. Job number 251869-00
Ove Arup & Partners Ltd Admiral House Rose Wharf 78 East Street Leeds LS9 8EE United Kingdom www.arup.com

York Central Partnership York CentralLeeman Road - Transport Modelling
| Issue | October 2017
J:\250000\251869-00\0 ARUP\0-11 TRANSPORTATION\0-11-08 REPORTS\2017-08 LEEMAN ROAD OPEN - MODELLING\2017-10_LEEMAN ROAD MODELLING_ISSUE V5(FINAL).DOCX
Contents Page
Executive Summary 1
City-wide Transport Impacts 1
Impacts at Local Junctions 3
Traffic Flows through the York Central Development 4
1 Introduction 6
1.1 Background 6
1.2 Report Structure 7
2 Methodology 8
2.1 Model Extent 8
2.2 Modelling Scenarios 8
2.3 Trip Generation 9
2.4 Forecasting Outputs 11
2.5 Junction Impacts 11
3 Saturn Modelling Outputs 12
3.1 May 2017 Development Scenario Proposal 12
3.2 August 2017 Development Scenario 14
3.3 Bus Gate Impacts 17
3.4 Impacts on Traffic Flows within York Central 17
4 Junction Performance 21
4.1 Introduction 21
4.2 Considered Junctions 21
4.3 Further Junction Modelling 23
4.4 Junction Modelling Results 25
5 Conclusions 33
Appendices
Appendix A
May 2017 Development Scenario Proposal Flow Difference Plots
Appendix B
August 2017 Development Scenario Flow Difference Plots
Appendix C

York Central Partnership York CentralLeeman Road - Transport Modelling
| Issue | October 2017
J:\250000\251869-00\0 ARUP\0-11 TRANSPORTATION\0-11-08 REPORTS\2017-08 LEEMAN ROAD OPEN - MODELLING\2017-10_LEEMAN ROAD MODELLING_ISSUE V5(FINAL).DOCX
Cinder Lane Traffic Flows
Appendix D
Plots of Identified Junctions

York Central Partnership York CentralLeeman Road - Transport Modelling
| Issue | October 2017
J:\250000\251869-00\0 ARUP\0-11 TRANSPORTATION\0-11-08 REPORTS\2017-08 LEEMAN ROAD OPEN - MODELLING\2017-10_LEEMAN ROAD MODELLING_ISSUE V5(FINAL).DOCX
Page 1
Executive Summary
Ove Arup and Partners Ltd (Arup) has been commissioned by York Central Partnership to test the traffic impact of different development quantum options and different highway configurations (access location; Leeman Road open/closed) for the York Central site. Development scenarios at May 2017 (hereon referred to as the May 2017 Development Scenario) which informed the Access Options study, and at August 2017 (hereon referred to the August 2017 Development Scenario) have been considered in this report.
Table 1: Development Scenarios & Trips Generated below summarises the development scenarios and identifies the number of additional vehicle trips which are generated by the proposed development based on the trip ratios proposed in the Transport Assessment Scoping Report (submitted separated to City of York Council Highways Department).
Table 1: Development Scenarios & Trips Generated
Development Scenario
Development Vehicle Trips Generated in peak hour
AM Peak PM Peak
May 2017 Development Scenario: 1,685 residential dwellings (houses / apartments) 61,000m2 commercial (B1 Office)
826 939
August 2017 Development Scenario: 2,460 residential dwellings (houses / apartments) 77,000 m2 commercial (B1 office) 10,100 m2 retail 9,800 m2 community / primary school 13,500 m2 hotel
1,148 1,058
City-wide Transport Impacts
City of York’s current strategic highway model (CYC’s SATURN model as of Summer 2017) has been used to assess the impact of the additional vehicle trips shown in Table 1 on the network. The SATURN model has also been used to assess an alternative scenario that includes the impact of placing a bus gate on Leeman Road which would prevent private vehicles using the site as a through route.(ie those vehicles which do not start/finish their journeys within the York Central development)
Analysis of the traffic flows from the strategic highway model shows that, even without the York Central development (the Do-Minimum Scenario), there is a general trend for increasing traffic volumes across the network. This is driven by general background traffic growth and additional traffic associated with the other developments set out in the York Local Plan. Comparison of the “Do-minimum scenario” (which excludes York Central” with the “Do-something scenarios” (which include York Central) allow the magnitude of the impacts generated by York Central to be assessed.

York Central Partnership York CentralLeeman Road - Transport Modelling
| Issue | October 2017
J:\250000\251869-00\0 ARUP\0-11 TRANSPORTATION\0-11-08 REPORTS\2017-08 LEEMAN ROAD OPEN - MODELLING\2017-10_LEEMAN ROAD MODELLING_ISSUE V5(FINAL).DOCX
Page 2
The modelling for the development scenarios for York Central does identify some localised decreases in traffic on parts of the network - in particular on roads close to the York Central site - for the “with bus gate” modelling scenarios as existing through flows of traffic are directed elsewhere. Further localised reductions in traffic on outer parts of the network will occur as a result of the displacement of traffic. This is less noticeable for the “without bus gate” scenarios as there is less traffic displacement due to the availability of a route through the York Central site.
The results of the analysis show that, at a city-wide level, Access Option E generates less additional congestion than Access Option A in both the “with” or “without bus-gate” scenarios. Placing a bus-gate on Leeman Road will force through traffic to use other routes and therefore the “with bus gate scenarios” generate more additional congestion than the “without bus gate scenarios”. Unsurprisingly, the August 2017 Development Scenario generates higher additional congestion due to the greater number of vehicle trips generated.
At a local level, a number of roads around the York Central site experience increases in traffic with changes in traffic levels in excess of 10% for both Option A and Option E. This includes Holgate Road, Clifton and Water End. These increases are likely to be as a result of the additional development traffic as well as the displacement of traffic to/from other routes. Holgate Road west of York Road does, however, experience a decrease in traffic flows during the PM peak hour for Option E in the “without bus” gate scenario.
The impact of the proposed development has also been analysed in terms of the overall delay to all vehicle movements across the city relative to the base case (the base case being predicated traffic levels in 2031). These results are summarised in Table 2 and are expressed as a change in the annual delay when compared against the Do-Minimum scenario
Table 2: Saturn model outputs - Total Network Delay in the AM Peak Hour
Development Scenario
Access Option Scenario
Change in Annual Delay on the Network PCU1 Hours (300 days) and
% change from base case in AM Peak
With Bus Gate Without bus gate
May 2017 Development Scenario
Access Option A 9,330 (+8.9%) 4,680 (+4.7%)
Access Option E 5,430 (+5.5%) 2,280 (+2.9%)
August 2017 Development Scenario
Access Option A 11,280 (+11.7%) 6,420 (+7.3%)
Access Option E 7,110 (+8.0%) 3,960 (+5.7%)
The magnitude of this change relative to the base case (i.e. traffic levels in 2031 without development) ranges from +2.9% to +11.7% depending on which development scenario and highway configuration combination is chosen.
1 PCU = passenger car units, where typically cars and light goods vehicles (LGVs) are one PCU, buses and coaches are two PCUs and heavy goods vehicles (HGVs) are 2.3 PCUs.

York Central Partnership York CentralLeeman Road - Transport Modelling
| Issue | October 2017
J:\250000\251869-00\0 ARUP\0-11 TRANSPORTATION\0-11-08 REPORTS\2017-08 LEEMAN ROAD OPEN - MODELLING\2017-10_LEEMAN ROAD MODELLING_ISSUE V5(FINAL).DOCX
Page 3
Impacts at Local Junctions
To further assess the impact of the proposals, where the SATURN model forecast significant changes in traffic flow through road junctions and/or where junction capacity was approaching saturation, LinSig and Junctions 9 modelling was used to assess the performance of individual junctions. In total, 14 junctions were analysed assuming the August 2017 Development Scenario for the “with” and “without bus gate” scenarios for both Access Option A and Access Option E to assess the degree of spare capacity that remains. The results are presented in Table 3.
In all but three junctions, the overall level of delay experienced at the assessed junctions does not increase significantly when compared with the Do-Minimum2 for Options A and E. This applies to both the “with” and “without” bus gate options for the AM and PM peak hours.
As highlighted in Table 3, three junctions operate at close to maximum capacity during the peak hour periods. The additional delay at these junctions may however be tolerable given the general increase in delay experienced in the Do Minimum scenario – i.e. as a result of background growth and other Local Plan developments. The implementation of the Travel Plan for the York Central site will help mitigate these impacts by seeking to reduce the number of vehicle trips generated by the site through a series of sustainable travel measures and this will have a positive impact on reducing network delays. The modelling shows that the development scenarios should be achievable subject to more detailed discussions with the Highways Authority as part of the preparation of a Transport Assessment to support a future Planning Application.
Table 3: Summary of Peak Hour Junction Analysis
Junction Access Option No bus gate
With bus gate
Mitigation Considered
A59 Holgate Road/Acomb Road/Poppleton Road (The Fox)
Option A & Option E
No issues - junction operates with spare capacity
No modifications proposed.
Water End/A59 Boroughbridge Road
Option A & Option E
No issues - junction operates with spare capacity
No modifications proposed.
Water End/Salisbury Road
Option A & Option E
No issues - junction operates with spare capacity
No modifications proposed.
Clifton/Water End/Water Lane
Option A & Option E
No issues - junction operates with spare capacity
No modifications proposed.
A59 Holgate Road/Hamilton Drive
Option A Junction impacted (minor)
No issues - all junctions operate with spare capacity
No modifications proposed.
2 The situation without the York Central development but including background traffic growth and additional growth associated with those other developments set out in the York Local Plan

York Central Partnership York CentralLeeman Road - Transport Modelling
| Issue | October 2017
J:\250000\251869-00\0 ARUP\0-11 TRANSPORTATION\0-11-08 REPORTS\2017-08 LEEMAN ROAD OPEN - MODELLING\2017-10_LEEMAN ROAD MODELLING_ISSUE V5(FINAL).DOCX
Page 4
Junction Access Option No bus gate
With bus gate
Mitigation Considered
Option E Junction impacted
Junction impacted
No modifications proposed – junction is physically constrained but will continue to function, albeit less efficiently.
A1036 The Mount/Dalton Terrace/Albermarle Road
Option A & Option E
No issues - junction operates with spare capacity
No modifications proposed.
A1036 The Mount/Scarcroft Road
Option A & Option E
No issues - junction operates with spare capacity
No modifications proposed.
A59 Holgate Road/Blossom Street
Option A & Option E
No issues - junction operates with spare capacity
No modifications proposed.
A1036 Blossom Street/Queen Street/Nunnery Lane
Option A & Option E
No issues - junction operates with spare capacity
No modifications proposed.
A1036 Bishopthorpe Road/Scarcroft Road
Option A & Option E
No issues - junction operates with spare capacity
No modifications proposed.
Tadcaster Road/St Helen’s Road
Option A No issues - junction operates with spare capacity
No modifications proposed.
Option E No issues - junction operates with spare capacity
Junction impacted
No modifications proposed – junction is physically constrained but will continue to function, albeit less efficiently
A59 Holgate Road/Dalton Terrace
Option A No issues - junction operates with spare capacity
No modifications proposed.
Option E Junction impacted
Junction impacted
No modifications proposed – junction is physically constrained but will continue to function, albeit less efficiently
B1363 Wigginton Road/Crichton Avenue
Option A & Option E
No issues - junction operates with spare capacity
No modifications proposed.
A19 Bootham/A1036 St. Leonard’s Place/Gillygate
Option A & Option E
No issues - junction operates with spare capacity
No modifications proposed.
Traffic Flows through the York Central Development
The SATURN analysis also enables traffic flows through the York Central development to be assessed.
For Option A, the level of traffic experienced within the York Central site increases for both of the “without bus gate” scenarios (May 2017 and August
York Central Partnership York CentralLeeman Road - Transport Modelling
| Issue | October 2017
J:\250000\251869-00\0 ARUP\0-11 TRANSPORTATION\0-11-08 REPORTS\2017-08 LEEMAN ROAD OPEN - MODELLING\2017-10_LEEMAN ROAD MODELLING_ISSUE V5(FINAL).DOCX
Page 5
2017 Development Scenarios) and with the August 2017 “with bus gate” development scenario when compared to the Do-Minimum traffic flows on Leeman Road. The modelling also shows that between 43% and 76% of the total traffic travelling through the York Central site are development related trips (ie those vehicles which start/finish their journey within York Central) with the lower percentages relating to the “without bus gate” scenarios. Given that the trips to non-York Central development uses (such as to/from the station car parks) will be the same for the “with” and “without bus gate” scenarios, the modelling shows that, in the “without bus gate scenario”, the provision of new highway infrastructure results in a greater volume of non-development related traffic using the site roads.
Similarly, for Option E, the level of through traffic travelling across the York Central site for the “without bus gate” scenarios and the “with bus gate” increases when compared to the Do-Minimum traffic flows on Leeman Road. Of the total traffic travelling through the York Central site, the proportion of traffic which is directly associated with the York Central development (i.e. development related trips) varies from 42% to 58%, again with the lower percentages relating to the “without bus gate” scenarios. As for Option A, the trips to non-York Central uses (such as to/from the station car parks) will be the same for the “with” and “without bus gate” scenarios. Therefore, under the “without bus gate” scenario, the provision of new highway infrastructure results in an increase in through traffic using the York Central site.
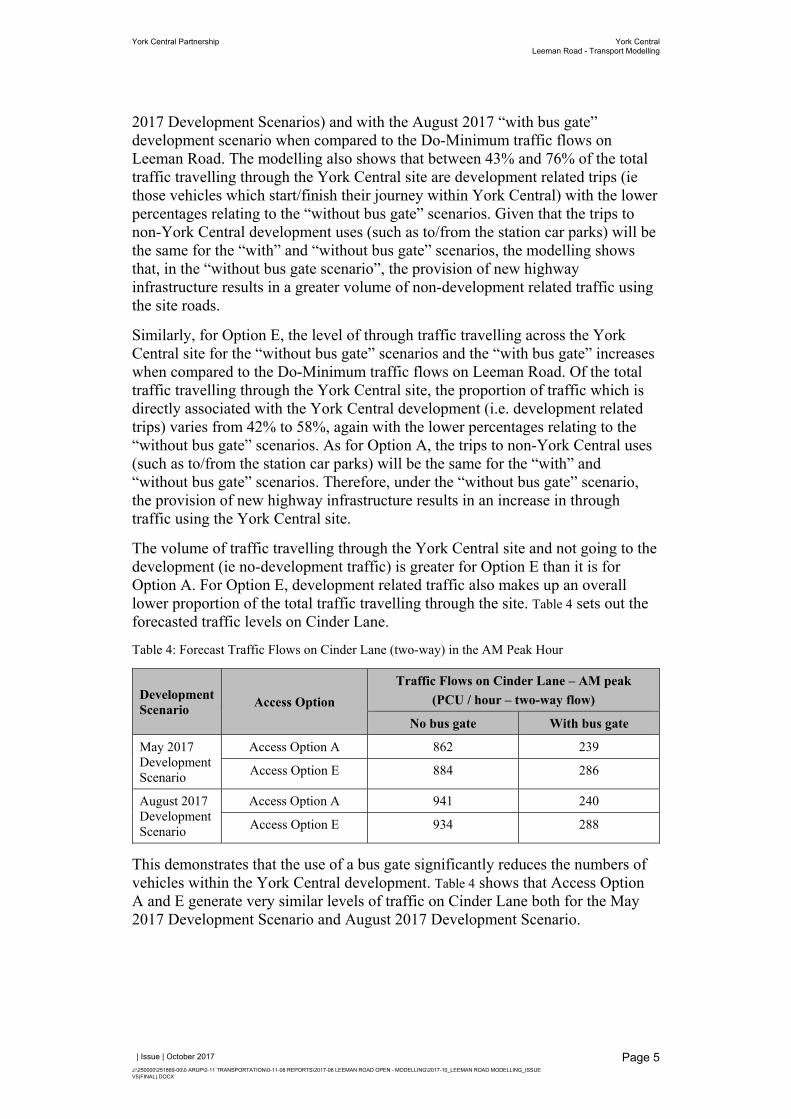
The volume of traffic travelling through the York Central site and not going to the development (ie no-development traffic) is greater for Option E than it is for Option A. For Option E, development related traffic also makes up an overall lower proportion of the total traffic travelling through the site. Table 4 sets out the forecasted traffic levels on Cinder Lane.
Table 4: Forecast Traffic Flows on Cinder Lane (two-way) in the AM Peak Hour
Development Scenario
Access Option
Traffic Flows on Cinder Lane – AM peak
(PCU / hour – two-way flow)
No bus gate With bus gate
May 2017 Development Scenario
Access Option A 862 239
Access Option E 884 286
August 2017 Development Scenario
Access Option A 941 240
Access Option E 934 288
This demonstrates that the use of a bus gate significantly reduces the numbers of vehicles within the York Central development. Table 4 shows that Access Option A and E generate very similar levels of traffic on Cinder Lane both for the May 2017 Development Scenario and August 2017 Development Scenario.

York Central Partnership York CentralLeeman Road - Transport Modelling
| Issue | October 2017
J:\250000\251869-00\0 ARUP\0-11 TRANSPORTATION\0-11-08 REPORTS\2017-08 LEEMAN ROAD OPEN - MODELLING\2017-10_LEEMAN ROAD MODELLING_ISSUE V5(FINAL).DOCX
Page 6
1 Introduction
1.1 Background
Ove Arup and Partners Ltd (Arup) has been commissioned by York Central Partnership to test possible development quantum options and highway configurations for the York Central site using the York Central highway assignment model.
The assessment of York Central access options has been undertaken using the City of York Council (CYC) strategic traffic model (SATURN). The current modelling / assessment follows on from previous modelling, comprising:
2015/16 – Modelling of Access Option E (Southern), with 1,500 homes and 100,000m2 commercial development (approximately 1,000 development trips in the AM and PM peak hours). Models were tested with and without a bus gate to prevent the use of York Central as a through route (Leeman Road closed/open scenarios).
2017 (Access Options study) – Improvements were made to the 2015/16 base model and modelling of Access Options A1/A2 (Western) and E (Southern) was undertaken assuming 1,685 homes & 61,000m2 commercial development with 10% added for other uses (equating to approximately 1,000 development trips in the AM and PM peak hours). Models were only run with the bus gate control (i.e. Leeman Road closed and no alternative west to east general traffic route through the site).
The purpose of this transport modelling work is to assess the impact on the highway network of two different development quanta and two different access options, and also, for comparison purposes, to test them with a bus gate on Leeman Road closed to general through traffic) and without a bus gate on Leeman Road (i.e. open to all traffic). The development quantum assessed reflects the May 2017 Development Iteration Scenario (hereon referred to as the May 2017 Development Scenario), which is the development quantum assessed as part of the June Access Options study, and a development option considered in August 2017 (hereon referred to as the August 2017 Development Scenario).
Following a review of the SATURN strategic model outputs, junctions requiring further detailed assessment have been identified and local junction assessments undertaken to determine whether this results in the potential need for further highway mitigation from that previously identified.
It is important to note that a separate Transport Assessment (TA) scoping process is ongoing through which the trips rates to the used in the TA will be agreed with CYC transport/highways officers and Highways England. Feedback has been received from CYC transport/highway officers and further investigation of the trip rates for commercial development may be required as part of the TA process. The trip rates presented in this report are consistent with those presented in the TA Scoping Report. In addition, a new strategic highway model is being developed by CYC which will be provided for use as part of the TA.

York Central Partnership York CentralLeeman Road - Transport Modelling
| Issue | October 2017
J:\250000\251869-00\0 ARUP\0-11 TRANSPORTATION\0-11-08 REPORTS\2017-08 LEEMAN ROAD OPEN - MODELLING\2017-10_LEEMAN ROAD MODELLING_ISSUE V5(FINAL).DOCX
Page 7
The analysis is presented at a point in time as part of the development of the York Central masterplan and is based on specific iterations of the development at the time of preparation. As the scheme develops, the quantum may change which would alter the results of the trip generation and the transport modelling.
1.2 Report Structure
This report provides a summary of the methodology used to undertake the assessment at Chapter 2. The results of the SATURN model outputs are provided at Chapter 3 to identify the impacts and present a comparison of the with and without bus gate scenario testing. Chapter 4 presents the results of the local junction assessments. Chapter 5 presents a summary and conclusion of the findings of the analysis.

York Central Partnership York CentralLeeman Road - Transport Modelling
| Issue | October 2017
J:\250000\251869-00\0 ARUP\0-11 TRANSPORTATION\0-11-08 REPORTS\2017-08 LEEMAN ROAD OPEN - MODELLING\2017-10_LEEMAN ROAD MODELLING_ISSUE V5(FINAL).DOCX
Page 8
2 Methodology
2.1 Model Extent
The York SATURN model provided by CYC forms the basis for the assessment. The model was developed for a base year of 2015 and represents an average weekday. The modelled time periods are the AM peak hour (08:00 to 09:00) and the PM peak hour (17:00 to 18:00). The future year of the model is 2031.
The extent of the York SATURN model covers the city of York in the fully modelled area and areas further afield in the buffer network. Figure 1 shows the extent of the York SATURN model.
Figure 1: SATURN Model Extent
It is noted that CYC are currently in the process of updating their base city-wide SATURN model as well as developing a number of future year models. As such, all modelling will be required to be updated for future TA work. The results presented below are therefore indicative, for access option comparison purposes and may be subject to change in future assessments.
2.2 Modelling Scenarios
The access option model developed in May 2017 for the Access Options Study tested the May 2017 Development scenario with the bus gate on Leeman Road (closed). YCP has not committed to closing Leeman Road and wish to understand the impact of the May 2017 Development Scenario for both access options with

York Central Partnership York CentralLeeman Road - Transport Modelling
| Issue | October 2017
J:\250000\251869-00\0 ARUP\0-11 TRANSPORTATION\0-11-08 REPORTS\2017-08 LEEMAN ROAD OPEN - MODELLING\2017-10_LEEMAN ROAD MODELLING_ISSUE V5(FINAL).DOCX
Page 9
no bus gate on Leeman Road (i.e. an east-west route would be available through the development). The impact of August 2017 Development Scenario both with and without the bus gate has also been tested for both access options.
This technical note compares the impact of the proposed development for the scenarios outlined in Table 5.
Table 5: Assessment Scenarios
Development Quantum
Leeman Road Access Option
May 2017 Development Scenario
With bus gate Option A Option E
Without bus gate Option A Option E
August 2017 Development Scenario
With bus gate Option A Option E
Without bus gate Option A Option E
All modelling scenarios have been tested in the 2031 future year model with full build out of the York Central scheme and including CYC Local Plan development.
2.2.1 May 2017 Development Scenario
The May 2017 Development Scenario at York Central, as modelled for the May 2017 Access Options study, comprises:
1,685 residential dwellings (houses / apartments);
61,000m2 commercial (B1 Office); and
Other community land uses – not specified.
2.2.2 August 2017 Development Scenario
The August 2017 Development Scenario included in this assessment comprises:
2,460 residential dwellings (houses / apartments);
77,000m2 commercial (B1 Office);
10,100m2 retail;
9,800m2 community / primary school; and
13,500m2 hotel.
2.3 Trip Generation
Trip generation estimates have been calculated based on the methodology set out within the TA Scoping Study.
Person trips rates associated with the proposed land uses on the site, other than residential uses, have been estimated using the latest version of TRICS database (TRICS 7.4.1). Site specific trip rates were derived for residential developments based on surveys in 2015 as part of a previous Stage 1 Transport Appraisal for

York Central Partnership York CentralLeeman Road - Transport Modelling
| Issue | October 2017
J:\250000\251869-00\0 ARUP\0-11 TRANSPORTATION\0-11-08 REPORTS\2017-08 LEEMAN ROAD OPEN - MODELLING\2017-10_LEEMAN ROAD MODELLING_ISSUE V5(FINAL).DOCX
Page 10
York Central. A further review of the residential trips rates with TRICS has been undertaken, based on higher proportions of apartments.
Mode shares for each land use have been based on TRICS mode shares as well 2011 Census Journey to Work data. Further detail of the trip rates for each proposed land use category is set out in the TA Scoping Report, dated August 2017.
The trip generation methodology is currently under discussion with CYC and Highways England as part of the TA scoping process. There may therefore be some changes to the trip generation methodology as the scheme assessment progresses.
2.3.1 May 2017 Development Scenario
The May 2017 Development Scenario comprises up to 1,685 residential dwellings and 61,000m2 commercial office uses. The residential trip rates are based on the 2015 survey data comprising a mix of residential houses and apartments. For the earlier access option testing, the other / community uses at the site had not been determined. For assessment purposes, the potential trip generation associated with these other uses was included as an additional 10% of the residential and commercial total trips for each time period. The vehicle trip generation associated with the May 2017 Development Scenario is provided in Table 6.
Table 6: York Central Trip Generation – May 2017 Development Scenario
Land use
AM Peak Hour
08:00 to 09:00
PM Peak Hour
17:00 to 18:00
Arr. Dep. Total Arr. Dep. Total
Residential 118 256 374 297 199 495
Commercial 351 26 377 16 343 358
Total 469 282 751 312 541 854
+10% 516 310 826 344 596 939
2.3.2 August 2017 Development Scenario
The August 2017 Development Scenarios comprise up to 2,460 residential dwellings and 77,000m2 commercial office uses. The residential trip rates are based on a revised trip rate from TRICS with a higher proportion of residential apartments. The other / community uses, used for assessment include retail and hotel development as well as a primary school. It is acknowledged that trips associated with the other / community uses may not all be new / additional to the site. A proportion of tips will be linked to other site uses, for example residents may stop at retail development. A detailed methodology to account for this has not been agreed with CYC and Highways England at this stage, therefore for the purposes of this assessment we have assumed 10% of retail trips are new / additional to the other site uses. All predicted trips associated with the primary school and hotel are included in this assessment to provide a robust assessment.

York Central Partnership York CentralLeeman Road - Transport Modelling
| Issue | October 2017
J:\250000\251869-00\0 ARUP\0-11 TRANSPORTATION\0-11-08 REPORTS\2017-08 LEEMAN ROAD OPEN - MODELLING\2017-10_LEEMAN ROAD MODELLING_ISSUE V5(FINAL).DOCX
Page 11
The vehicle trip generation associated with the August 2017 Development Scenario is provided in Table 7.
Table 7: York Central Trip Generation – August 2017 Development Scenario
Land use
AM Peak Hour
08:00 to 09:00
PM Peak Hour
17:00 to 18:00
Arr. Dep. Total Arr. Dep. Total
Residential 108 251 251 278 187 465
Commercial 367 25 392 18 350 368
Retail (10%) 59 58 117 55 61 116
School 212 102 314 12 24 36
Hotel 22 53 75 50 23 73
Total 767 489 1,148 413 646 1,058
The trip matrices have been revised to include the estimated trip generation from the proposed August 2017 Development Scenario and these matrices are used to model the August 2017 Development Scenario.
2.4 Forecasting Outputs
The traffic impacts of the proposed York Central developments have been assessed by comparing the 2031 Do-Minimum and Do-Something scenarios for each access option and development scenario as set out in Section 2.2. The impact of the scheme has been compared based on the network wide impact – delay / travel time / distance.
The results of the assessment are provided in Chapter 3.
2.5 Junction Impacts
The impact at junctions on the local and wider highway network has been reviewed based on the following criteria extracted from the CYC SATURN model:
Criteria 1: Increase in flow of greater than 50 Passenger Car Units (PCU)3 per hour; and
Criteria 2: Ratio of volume to capacity (V/C) of greater than 80%4 in Do-Minimum (DM) or Do-Something (for each option and time period). 5
3 PCU = passenger car units, where typically cars and light goods vehicles (LGVs) are one PCU, buses and coaches are two PCUs and heavy goods vehicles (HGVs) are 2.3 PCUs. 4 Indicating spare capacity at the junction of less than 20% 5 The Do-Minimum scenario is the future baseline scenario without no development at York Central but including background traffic growth and additional growth associated with those other developments set out in the York Local Plan. The Do-Something scenario includes the York Central development.

York Central Partnership York CentralLeeman Road - Transport Modelling
| Issue | October 2017
J:\250000\251869-00\0 ARUP\0-11 TRANSPORTATION\0-11-08 REPORTS\2017-08 LEEMAN ROAD OPEN - MODELLING\2017-10_LEEMAN ROAD MODELLING_ISSUE V5(FINAL).DOCX
Page 12
3 Saturn Modelling Outputs
Data has been extracted from the SATURN model for all identified assessment scenarios, as set out below. The performance of the wider network is reviewed based on the total network delays, total network travel times and total network travel distance.
3.1 May 2017 Development Scenario Proposal
Table 8 to Table 10 present the total network delay, total travel time and total travel distance for Options A and Option E with and without the bus gate for the AM and PM peak hours for the May 2017 Development Scenario.
Table 8: Total Network Delay – May 2017 Development Scenario 2031
Option A With Bus Gate Without Bus Gate
AM PM AM PM
DM Total Network Delay (PCU Hrs) 205.5 218.7 205.5 218.7
DS Total Network Delay (PCU Hrs) 223.7 231.6 215.2 224.6
Change in Total Network Delay (PCU Hrs) 18.2 12.9 9.7 5.9
Change in Annual Delay PCU Hrs (300 days) 9,330 4,680
Option E With Bus Gate Without Bus Gate
AM PM AM PM
DM Total Network Delay (PCU Hrs) 205.5 218.7 205.5 218.7
DS Total Network Delay (PCU Hrs) 216.9 225.4 211.4 220.4
Change in Total Network Delay (PCU Hrs) 11.4 6.7 5.9 1.7
Change in Annual Delay PCU Hrs (300 days) 5,430 2,280
The results indicate that the predicted network wide delay is lower for Access Option E (southern) than Option A in both the AM and PM peak hours. The predicted annual delay without the bus gate in place on Leeman Road is approximately half that with the bus gate in place. This is due to the re-routing of traffic on other roads in the vicinity due to the closure of Leeman Road to general traffic.

York Central Partnership York CentralLeeman Road - Transport Modelling
| Issue | October 2017
J:\250000\251869-00\0 ARUP\0-11 TRANSPORTATION\0-11-08 REPORTS\2017-08 LEEMAN ROAD OPEN - MODELLING\2017-10_LEEMAN ROAD MODELLING_ISSUE V5(FINAL).DOCX
Page 13
Table 9: Total Network Travel Time – May 2017 Development Scenario Proposal 2031
Option A With Bus Gate Without Bus Gate
AM PM AM PM
DM Total Network Travel Time (PCU Hrs) 9,010 9,473 9,010 9,473
DS Total Network Travel Time (PCU Hrs) 9,638 9,717 9,497 9,655
Change in Total Network Travel Time (PCU Hrs) 628 244 488 182
Option E With Bus Gate Without Bus Gate
AM PM AM PM
DM Total Network Travel Time (PCU Hrs) 9,010 9,473 9,010 9,473
DS Total Network Travel Time (PCU Hrs) 9,485 9,655 9,305 9,585
Change in Total Network Travel Time (PCU Hrs) 475 181 295 112
The results indicate that the predicted network wide travel time is lower for Access Option E (southern) than Option A in both the AM and PM peak hours. The predicted increase in travel time is less without the bus gate in place on Leeman Road.
Table 10: Total Network Travel Distance – May 2017 Development Scenario Proposal 2031
Option A With Bus Gate Without Bus Gate
AM PM AM PM
DM Total Network Travel Distance (PCU Kms) 365,665 373,847 365,665 373,847
DS Total Network Travel Distance (PCU Kms) 376,856 385,134 374,194 382,883
Change in Total Network Travel Distance (PCU Kms) 11,191 11,288 8,528 9,037
Option E With Bus Gate Without Bus Gate
AM PM AM PM
DM Total Network Travel Distance (PCU Kms) 365,665 373,847 365,665 373,847
DS Total Network Travel Distance (PCU Kms) 374,610 384,100 372,874 382,827
Change in Total Network Travel Distance (PCU Kms) 8,945 10,253 7,209 8,980
The results indicate that the predicted network wide travel distance is lower for Access Option E (southern) than Option A in both the AM and PM peak hours. The predicted increase in travel distance is less without the bus gate in place on Leeman Road.
Flow difference plots for the May 2017 Development Scenarios are provided in Appendix A. The flow difference plots compare each scenario with the 2031 Do-Minimum scenario (ie the situation with no development at York Central but considering background traffic growth and traffic growth associated with the other developments proposed in the York Local Plan). The difference plots show that the general trend is that the volume of traffic is increasing (shown in green) across the network when compared with the Do-Minimum scenario. There would, however, be increases in traffic on the network without the York Central development.

York Central Partnership York CentralLeeman Road - Transport Modelling
| Issue | October 2017
J:\250000\251869-00\0 ARUP\0-11 TRANSPORTATION\0-11-08 REPORTS\2017-08 LEEMAN ROAD OPEN - MODELLING\2017-10_LEEMAN ROAD MODELLING_ISSUE V5(FINAL).DOCX
Page 14
There are some decreases in traffic (shown in blue). For the with bus gate scenarios for Option A, there are some reductions close to the York Central site due to the changes to the road network with other minor increases, including the A1036/A19 Fulford Road in the AM peak hour. During the PM peak, hour, there are some minor decreases on the out ring road to the south-west of the city. For Option E with the bus gate, there are similar decreases to Option A although the roads in the area between the York Central site and the outer ring road to the west of the city does experience additional decreases in both the AM and PM peak hours. This is due to diversionary effects.
For the without bus gate scenario for Option A, there is generally less decreases in traffic in York although there are some local decreases close to the site. This is because a route through the site is maintained which does not result in any significant diversions of traffic through the site. For Option E, there are further decreases experienced on the outer ring road to the south-west of the city with a number of roads in the area between the York Central site and the outer ring road to the west of the city also experiencing a decrease in traffic due to diversionary effects.
Additional diagrams of the traffic flows on some of the roads in the immediate vicinity of the York Central site are also provided in Appendix A, showing the percentage change in the flow at these locations. This shows the following:
The with bus gate scenarios generally see a reduction in the traffic flows on Leeman Road/Kingsland Terrace with corresponding increases in traffic on a number of roads surrounding the site. These increases are due to the implementation of the bus gate, which restricts traffic movement through the site. The locations of the increases are similar for Options A and Option E with increases in traffic in excess of 10% experienced at a number of locations, significantly so at some locations.
For Option A, the without bus gate scenarios generally see a reduction in the traffic flows on Leeman Road/Kingsland Terrace. At two of the locations identified, the traffic increase by more than 10% during the PM peak hour. These locations are Holgate Road close to Wilton Rise (with a 13% increase) and Clifton (with a 43% increase). This is likely due to the displacement of traffic from other parts of the network.
For Option E without the bus gate, Leeman Road experiences an increase in traffic, due to the availability of a through route. There are a number of the identified locations which experience an increase of 10% during the AM and PM peak hours. These locations include Water End, Holgate Road east of York Road and Clifton.
3.2 August 2017 Development Scenario
Table 11 to Table 13 present the total network delay, total travel time and total travel distance for Options A and Option E with and without the bus gate for the AM and PM peak hours for the August 2017 Development Scenario.

York Central Partnership York CentralLeeman Road - Transport Modelling
| Issue | October 2017
J:\250000\251869-00\0 ARUP\0-11 TRANSPORTATION\0-11-08 REPORTS\2017-08 LEEMAN ROAD OPEN - MODELLING\2017-10_LEEMAN ROAD MODELLING_ISSUE V5(FINAL).DOCX
Page 15
Table 11: Total Network Delay – August 2017 Development Scenario 2031
Option A With Bus Gate Without Bus Gate
AM PM AM PM
DM Total Network Delay (PCU Hrs) 205.5 218.7 205.5 218.7
DS Total Network Delay (PCU Hrs) 229.5 232.3 220.6 225
Change in Total Network Delay (PCU Hrs) 24.0 13.6 15.1 6.3
Change in Annual Delay PCU Hrs (300 days) 11,280 6,420
Option E With Bus Gate Without Bus Gate
AM PM AM PM
DM Total Network Delay (PCU Hrs) 205.5 218.7 205.5 218.7
DS Total Network Delay (PCU Hrs) 221.9 226 217.2 220.2
Change in Total Network Delay (PCU Hrs) 16.4 7.3 11.7 1.5
Change in Annual Delay PCU Hrs (300 days) 7,110 3,960
Table 12: Total Network travel Time – August 2017 Development Scenario 2031
Option A With Bus Gate Without Bus Gate
AM PM AM PM
DM Total Network Travel Time (PCU Hrs) 9,010 9,473 9,010 9,473
DS Total Network Travel Time (PCU Hrs) 9,897 9,770 9,747 9,708
Change in Total Network Travel Time (PCU Hrs) 888 296 738 234
Option E With Bus Gate Without Bus Gate
AM PM AM PM
DM Total Network Travel Time (PCU Hrs) 9,010 9,473 9,010 9,473
DS Total Network Travel Time (PCU Hrs) 9,675 9,710 9,515 9,642
Change in Total Network Travel Time (PCU Hrs) 665 237 505 169
Table 13: Total Travel Distance – August 2017 Development Scenario 2031
Option A With Bus Gate Without Bus Gate
AM PM AM PM
DM Total Network Travel Distance (PCU Kms) 365,665 373,847 365,665 373,847
DS Total Network Travel Distance (PCU Kms) 381,607 386,642 378,649 384,185
Change in Total Network Travel Distance (PCU Kms) 15,942 12,795 12,983 10,338
Option E With Bus Gate Without Bus Gate
AM PM AM PM
DM Total Network Travel Distance (PCU Kms) 365,665 373,847 365,665 373,847
DS Total Network Travel Distance (PCU Kms) 378,646 385,445 376,941 384,165
Change in Total Network Travel Distance (PCU Kms) 12,981 11,598 11,276 10,318
York Central Partnership York CentralLeeman Road - Transport Modelling
| Issue | October 2017
J:\250000\251869-00\0 ARUP\0-11 TRANSPORTATION\0-11-08 REPORTS\2017-08 LEEMAN ROAD OPEN - MODELLING\2017-10_LEEMAN ROAD MODELLING_ISSUE V5(FINAL).DOCX
Page 16
The results for the August 2017 Development Scenario reflect the results for the May 2017 Development Scenario. The predicted delay, travel time and travel distance are lower for Access Option E (southern) than Option A. The predicted network wide delays, travel times and travel distances are lower without the bus gate in place on Leeman Road. As expected, the August 2017 Development Scenario results is greater network delay, travel time and travel distance than the May 2017 Development Scenario, as modelled in May 2017 for the Access Options Study.
Flow difference plots for this level of development are provided in Appendix B. The flow difference plots compare each scenario with the 2031 Do-Minimum scenario. The overall trend in traffic is similar to the May 2017 Development Scenarios presented in Section 3.1. However, the overall magnitude of increase is greater given that the York Central development generates a higher level of traffic for the August 2017 Development Scenarios. Some traffic displacements or are greater which results in some decreases in traffic. This is also as a result of the greater level of traffic generated.
Additional diagrams of the traffic flows on some of the roads in the immediate vicinity of the York Central site are also provided in Appendix B, showing the percentage change in the flow at these locations. This shows the following:
The with bus gate scenarios generally see a reduction in the traffic flows on Leeman Road/Kingsland Terrace. The magnitude of the reduction is, however, lower than the May 2017 Development Scenario scenarios. A number of roads around the site also experience an increase in traffic as a result of the bus gate implementation. The locations of the increases are similar for Options A and Option E with increases in traffic in excess of 10% experienced at a number of locations, significantly so at some locations. Some links, particular those off Holgate Road, experience a small reduction in traffic which is likely due to displacement of traffic to other routes.
For Option A, the without bus gate scenarios also generally see a reduction in the traffic flows on Leeman Road/Kingsland Terrace. There are four locations where traffic increase by more than 10% and these are only during the PM peak hour. The locations are Holgate Road close to Wilton Rise (14%), Holgate Road close to Water End (18%), Grantham Drive (12%) and Clifton (42%). This is likely due to the displacement of traffic from other parts of the network.
For Option E without the bus gate, Leeman Road experiences an increase in traffic, likely due to the availability of a through route. There are a number of other locations which do experience an increase in traffic of greater than 10% during the AM and PM peak hours. These locations include Water End, Holgate Road east of York Road, Holgate Road east of Hamilton Drive and Clifton (PM peak hour only), Holgate Road close to Water End does experience a 10% decrease in the AM peak hour and 13% decrease in the PM peak hour.

York Central Partnership York CentralLeeman Road - Transport Modelling
| Issue | October 2017
J:\250000\251869-00\0 ARUP\0-11 TRANSPORTATION\0-11-08 REPORTS\2017-08 LEEMAN ROAD OPEN - MODELLING\2017-10_LEEMAN ROAD MODELLING_ISSUE V5(FINAL).DOCX
Page 17
3.3 Bus Gate Impacts
The SATURN modelling indicates that the wider highway network is predicted to operate better without the bus gate on Leeman Road. The predicted network delays, travel time and travel distance are less in the “Without bus gate” scenario compared to the “With bus gate” scenario. The introduction of the bus gate would result in greater re-routing of trips on the highway network as Leeman Road is closed as a through route for general traffic.
It is, however, noted, that by not introducing a bus gate, routes through the York Central site, including the diverted Leeman Road (as a result of NRM expansion), will be busier. York Central trips to / from the city centre will use the eastern access and existing local trips could use Leeman Road / the site as a cut through, as currently occurs.
3.4 Impacts on Traffic Flows within York Central
3.4.1 Leeman Road
The only connection across the existing York Central site is via Leeman Road which can be accessed from Salisbury Road and Kingsland Terrace to the north-west and Station Road/Station Rise to the east. The Do-Minimum traffic flow on Leeman Road (west of Cinder Lane) is as follows:
695 vehicles (two-way) in the AM peak hour; and
828 vehicles (two-way) in the PM peak hour.
This would comprise traffic accessing the NRM, station car parking and station operational facilities on Cinder Lane and through traffic.
In all development scenarios, traffic would not be permitted to use Leeman road on its current alignment. However, there would still be route through the site available from Kingsland Terrance and the western extent of Leeman Road. Both access options (A and E) would therefore provide a second route through the site. The provision of the bus gate on Leeman Road would affect whether a through route for traffic is available or not.
3.4.2 Traffic within York Central
The level of traffic travelling to, from and through the development for access Options A and E has been considered. This accounts for the traffic associated with the residential and employment zones of the development (i.e. York Central trips), which is provided as a percentage of the overall total traffic. The analysis considers traffic at the following points:
Access Option A – within the development west of Cinder Lane and east of the point where traffic from Kingsland Terrace/Leeman Road will join the main development route; and

York Central Partnership York CentralLeeman Road - Transport Modelling
| Issue | October 2017
J:\250000\251869-00\0 ARUP\0-11 TRANSPORTATION\0-11-08 REPORTS\2017-08 LEEMAN ROAD OPEN - MODELLING\2017-10_LEEMAN ROAD MODELLING_ISSUE V5(FINAL).DOCX
Page 18
Access Option E - within the development west of Cinder Lane and east of the point where traffic from Kingsland Terrace/Leeman Road will join the main development route along with traffic entering the site from Chancery Rise.
The results of this analysis for Access Option A are shown in Table 14. The Do-Minimum traffic flows on Leeman Road have been provided for comparison.
Table 14: Access Option A – Two-way Traffic within York Central
Scenario Total Traffic
York Central Traffic
% York Central Traffic
% Non-York Central Traffic
AM PM AM PM AM PM AM PM
Do-Minimum 695 828 0 0 0% 0% 100% 100%
May 2017 Development Scenario
With bus gate 561 642 384 395 69% 62% 31% 38%
Without bus gate 876 881 374 455 43% 52% 57% 48%
August 2017 Development Scenario
With bus gate 718 804 548 558 76% 69% 24% 31%
Without bus gate 954 937 537 519 56% 55% 44% 45%
This shows that the level of traffic within the York Central site would be greater than the Do-Minimum Traffic flows on Leeman Road for all but one scenario. In general, the “without bus gate” flows through the site are higher than the “with bus gate” flows, and that these flows also account for an overall lower proportion of the total traffic. Given that the trips to/from non-York Central uses (such as the station car parks) would not change between the “with” and “without bus gate” scenarios, this shows that, for the “without bus gate” scenarios, there is an increase in through traffic using the York Central site.
The results of this analysis for Access Option E are shown in Table 15. The Do-Minimum traffic flows on Leeman Road have been provided for comparison.
Table 15: Access Option E – Two-way Traffic within York Central
Scenario
Total Traffic
York Central Traffic
% York Central Traffic
% Non-York Central Traffic
AM PM AM PM AM PM AM PM
Do-Minimum 695 828 0 0 0% 0% 100% 100%
May 2017 Development Scenario
With bus gate 774 780 347 403 45% 52% 55% 48%
Without bus gate 1,045 1,036 384 435 37% 42% 63% 58%
August 2017 Development Scenario
With bus gate 903 801 525 429 58% 53% 42% 47%
Without bus gate 1,209 1,037 592 451 49% 43% 51% 57%
This shows that the level of traffic within the York Central site would be greater than the Do-Minimum Traffic flows on Leeman Road for all scenarios. The

York Central Partnership York CentralLeeman Road - Transport Modelling
| Issue | October 2017
J:\250000\251869-00\0 ARUP\0-11 TRANSPORTATION\0-11-08 REPORTS\2017-08 LEEMAN ROAD OPEN - MODELLING\2017-10_LEEMAN ROAD MODELLING_ISSUE V5(FINAL).DOCX
Page 19
“without bus” gate flows through the site are higher than the “with bus gate” flows, with these flows also accounting for an overall lower proportion of the total traffic. This shows that, for the “without bus gate” scenario, there is an increase in through traffic using the York Central site.
It is noted that the level of traffic travelling through the York Central site is greater for Option E, compared to Option A
3.4.3 Cinder Lane
The traffic flows within the York Central Development will vary depending on the access option and whether a bus gate is implemented on Leeman Road or not. As such, consideration as been given to the levels of traffic that would be experienced on Cinder Lane for all scenarios. The traffic flows on Cinder Lane for Option A and Option E are provided in Table 16 and Table 17. The Do-Minimum traffic flows have also been provided in Table 16 and Table 17. The traffic flows on Cinder Lane vary from those presented in Section 3.4.2 due as not all of the York Central traffic will use Cinder Lane (e.g, some trips will start/terminate before reaching Cinder Lane).
Table 16: Option A - Traffic Flows on Cinder Lane
Development Scenario
Highway arrangement
Traffic Flows on Cinder Lane
(PCU / hour – two way flow)
AM Peak Hour PM Peak Hour
Do-Minimum Existing 81 114
May 2017 Development Scenario
With bus gate 239 313
Without bus gate 862 819
August 2017 Development Scenario
With bus gate 240 313
Without bus gate 941 875
Table 17: Option E - Traffic Flows on Cinder Lane
Development Scenario
Highway arrangement
Traffic Flows on Cinder Lane
(PCU / hour – two way flow)
AM Peak Hour PM Peak Hour
Do-Minimum Existing 81 114
May 2017 Development Scenario
With bus gate 286 349
Without bus gate 884 885
August 2017 Development Scenario
With bus gate 288 350
Without bus gate 934 901
The analysis shows that the level of traffic using Cinder Lane would increase for both Options A and Option E with and without the bus gate, with much more significant increases for the without bus gate scenarios, as would be expected. Approximately 900 vehicle movements an hour equates to approximately one

York Central Partnership York CentralLeeman Road - Transport Modelling
| Issue | October 2017
J:\250000\251869-00\0 ARUP\0-11 TRANSPORTATION\0-11-08 REPORTS\2017-08 LEEMAN ROAD OPEN - MODELLING\2017-10_LEEMAN ROAD MODELLING_ISSUE V5(FINAL).DOCX
Page 20
vehicle every four seconds (one every eight seconds in each direction), meaning that Cinder Lane would feel urban and create a severance across the proposed square.
In the Do-Minimum scenario, the traffic flows on Cinder Lane are primarily vehicular traffic accessing the car park and National Railway Museum. In the without bus gate scenarios, traffic from the proposed York Central access roads (both Options A and E) will be able to travel along this link resulting in an increase.
The use of a bus gate significantly reduces the numbers of vehicles within the York Central development. The lower traffic flows generated by a bus gate would enable a more “shared space” approach to be adopted.
In general, Option E experiences a higher level of traffic flow on Cinder Lane when compared with Option A. This applies to the with and without the bus gate scenarios. However, with the exception of one scenarios (May 2017 Development Scenario without bus gate), the differences in the vehicle flows are less than 50 PCU/hr.
Details on the increases in the traffic flows are provided in Appendix C.

York Central Partnership York CentralLeeman Road - Transport Modelling
| Issue | October 2017
J:\250000\251869-00\0 ARUP\0-11 TRANSPORTATION\0-11-08 REPORTS\2017-08 LEEMAN ROAD OPEN - MODELLING\2017-10_LEEMAN ROAD MODELLING_ISSUE V5(FINAL).DOCX
Page 21
4 Junction Performance
4.1 Introduction
The impact at junctions on the local and wider highway network has been reviewed based on the following criteria extracted from the CYC SATURN model:
Criteria 1: Increase in flow greater than 50 PCU per hour; and
Criteria 2: V/C greater than 80% in DM or DS (for each option and time period).
Junctions that satisfy the above criteria are identified for further investigation. Criteria 1 was used to determine the number of junctions that would be subject to further investigation while Criteria 2 was used to determine whether any further junction modelling should be undertaken. These criteria were selected on the basis that if the V/C was less than 80%, the junction performance would be acceptable.
It should be noted that the junction performance assessment has been undertaken for the August 2017 Development Scenario only on the basis that the outcome of the modelling would be a busiest-case scenario. However, this has been undertaken for both Options A and E for the with and without bus gate scenario. Based on the outcome of the assessment presented in the following sections, no further mitigation would be required for the August 2017 Development Scenario and therefore this would also apply to the lower development quantum.
The analysis in this section will enable a comparison between the Option A and Option E with and without bus gate scenarios to be drawn. The analysis will also compare with the 2016 Stage 1 Transport Appraisal to determine whether any further mitigation, on top of that identified as part of the Stage 1 Transport Appraisal, is required.
4.2 Considered Junctions
Following consideration of the increases in flows of greater than 50 PCU (Criteria 1) and differences in the junction V/C (Criteria 2), a number of junctions were considered for further investigation for the AM and PM peak hours for the Options A and E for the with and without bus gate scenarios. The total number of junctions considered for each options and scenario is set out in Table 18.
Table 18: Junctions considered for further investigation
Option With Bus Gate Without Bus Gate
AM PM AM PM
Option A 20 14 17 10
Option E 17 9 9 8
Plots of the identified junctions can be found in Appendix D for each of the scenarios identified in Table 18. Upon further investigation of the outputs of the

York Central Partnership York CentralLeeman Road - Transport Modelling
| Issue | October 2017
J:\250000\251869-00\0 ARUP\0-11 TRANSPORTATION\0-11-08 REPORTS\2017-08 LEEMAN ROAD OPEN - MODELLING\2017-10_LEEMAN ROAD MODELLING_ISSUE V5(FINAL).DOCX
Page 22
strategic modelling, it was found that the majority of the identified links were located on the York Outer Ring Road. The results were then further interrogated to identify the percentage increase in the traffic flows at the junctions (on the approach arms which was identified as being greater than PCU per hour). The actual increases in the V/C have also been considered.
A summary of this analysis of the outer ring is presented is Table 19.
Table 19: Outer Ring Road - Further Analysis of Strategic Modelling Results
Scenario / Option
Summary of Findings
Option A without bus gate
AM peak hour - % change in traffic flows is less than 10% for all junctions. Given total traffic flow on the outer ring road, this increase is not considered significant. Where the V/C is over 80% on any approach for the Option A scenario, it is also over 80% for the Do-Minimum scenarios. One junction was identified to have a V/C of 100% for the Option A scenario. However, the V/C for the Do-Minimum was 98%.
PM peak hour – all junctions with the exception of one experience a flow increase of less than 10% with only small increases in the V/C where the V/C is over 80%. One junction, does, however, experience an increase in flow of 12% with a corresponding increase in V/C of 9% to 81%. Given that the Option A V/C is just greater than 80%, no has further assessment been considered.
Option A with bus gate
AM peak hour - % change in traffic flows is less than 10% for all junctions. Given total traffic flow on the outer ring road, this increase is not considered significant. Where the V/C is over 80% on any approach for the Option A scenario, it is also over 80% for the Do-Minimum scenario.
PM peak hour – all junctions with the exception of one experience a change in flow of less than 10% with only small increases in the V/C where the V/C is over 80%. One junction, does, however, experience an increase in flow of 15% with a corresponding increase in V/C of 10% to 83%. Given that the Option A V/C is just greater than 80%, no has further assessment been considered.
Option E without bus gate
AM peak hour - % change in traffic flows is less than 10% for all junctions. Given total traffic flow on the outer ring road, this increase is not considered significant. Where the V/C is over 80% on any approach for the Option E scenario, it is also over 80% for the Do-Minimum scenario.
PM peak hour – all junctions with the exception of one experience a change in flow of less than 10% with only small increases in the V/C where the V/C is over 80%. One junction, does, however, experience an increase in flow of 14% with a corresponding increase in V/C of 10% to 82%. Given that the Option A V/C is just greater than 80%, no has further assessment been considered.
Option E with bus gate
AM peak hour - % change in traffic flows is less than 10% for all junctions. Given total traffic flow on the outer ring road, this increase is not considered significant. Where the V/C is over 80% on any approach for the Option E scenario, it is also over 80% for the Do-Minimum scenario.
PM peak hour – all junctions with the exception of one experience a change in flow of less than 10% with only small increases in the V/C where the V/C is over 80%. One junction, does, however, experience an increase in flow of 14% with a corresponding increase in V/C of 10% to 83%. Given that the Option A V/C is just greater than 80%, no has further assessment been considered.

York Central Partnership York CentralLeeman Road - Transport Modelling
| Issue | October 2017
J:\250000\251869-00\0 ARUP\0-11 TRANSPORTATION\0-11-08 REPORTS\2017-08 LEEMAN ROAD OPEN - MODELLING\2017-10_LEEMAN ROAD MODELLING_ISSUE V5(FINAL).DOCX
Page 23
As a result of the analysis of the outer ring road junctions outlined in Table 19, no further assessment of the outer ring road junctions has been considered at this stage.
Two junctions which are located within the outer ring road has been identified to experience a flow increase of over 50 PCU and have a V/C of greater than 80% in at least one scenarios. These junctions are:
A19 Bootham with A1036 St. Leonard’s Place and Gillygate (Node 1034 as identified in the plans in Appendix D); and
B1363 Wigginton Road with Crichton Avenue (Node 1010 as identified in the plans in Appendix D).
These junctions have been subject to further assessment as described in Section 4.3.
4.3 Further Junction Modelling
4.3.1 Junctions Assessed
As well as the two junctions identified for further assessment in Section 4.2, 12 further junctions have been assessed to understand the level of impact. The 12 junctions assessed were included in the 2016 Stage 1 Transport Appraisal. These junctions were assessed as part of the Stage 1 Transport Appraisal at the request of CYC. All junctions assess are detailed in Table 20.

York Central Partnership York CentralLeeman Road - Transport Modelling
| Issue | October 2017
J:\250000\251869-00\0 ARUP\0-11 TRANSPORTATION\0-11-08 REPORTS\2017-08 LEEMAN ROAD OPEN - MODELLING\2017-10_LEEMAN ROAD MODELLING_ISSUE V5(FINAL).DOCX
Page 24
Table 20: Summary of Junctions Modelled by Arup
Ref. No. Location Type
1 A59 Holgate Road/Acomb Road/Poppleton Road (The Fox Junction) Traffic Signals
2 Water End/A59 Boroughbridge Road Traffic Signals
3 Water End/Salisbury Road Traffic Signals
4 Clifton/Water End/Water Lane Traffic Signals
5 A59 Holgate Road/Hamilton Drive Priority Junction
6 A1036 The Mount/Dalton Terrace/Albermarle Road Traffic Signals
7 A1036 The Mount/Scarcroft Road Traffic Signals
8 A59 Holgate Road/Blossom Street Traffic Signals
9 A1036 Blossom Street/Queen Street/Nunnery Lane Traffic Signals
10 A1036 Bishopthorpe Road/Scarcroft Road Traffic Signals
11 Tadcaster Road/St Helen’s Road Traffic Signals
12 A59 Holgate Road/Dalton Terrace Priority Junction
13 B1363 Wigginton Road/Crichton Avenue Traffic Signals
14 A19 Bootham/A1036 St. Leonard’s Place/Gillygate Traffic Signals
4.3.2 Junction Modelling Methodology
Where a junction is under traffic signal control, ‘LinSig’ software has been used. LinSig is used to indicate the performance of a signalised junction under a given set of traffic flows. The software calculates the Degree of Saturation (DoS), expressed as a percentage, for each approach to a junction. Approaches where the degree of saturation is forecast to exceed 90% are considered over-capacity. Alongside this the mean maximum queue (MMQ), is calculated, to represent the average position of the furthest vehicle from the stop line in each cycle. All junctions with are under traffic signal control, as identified in Table 20, have been modelled using LinSig.
Where a junction is priority (give-way) control or is a roundabout, ‘Junctions 9’ software has been used. Junction 9 is used to indicate the performance priority junctions and roundabouts junction under a given set of traffic flows. The software calculates the Ratio of Flow to Capacity (RFC) expressed as a percentage, for each approach to a junction. Approaches where the degree of saturation is forecast to exceed 85% are considered over-capacity. Alongside this, the MMQ, is calculated, to represent the average position of the furthest vehicle from the stop line in each cycle. All junctions with are under priority control, as identified in Table 20, have been modelled using LinSig.
4.3.3 Modelling Inputs
To enable junction assessments to be undertaken, CYC has provided the following information:
SATURN modelling demand traffic flows;

York Central Partnership York CentralLeeman Road - Transport Modelling
| Issue | October 2017
J:\250000\251869-00\0 ARUP\0-11 TRANSPORTATION\0-11-08 REPORTS\2017-08 LEEMAN ROAD OPEN - MODELLING\2017-10_LEEMAN ROAD MODELLING_ISSUE V5(FINAL).DOCX
Page 25
Traffic signal timing information as included in the models used for the Stage 1 Transport Appraisal, where the junctions were previously modelled;
Signal staging and arrangements for the two additional junctions considered as part of this assessment; and
Measurements from Google Earth to inform estimates of saturation flows (lane widths) and intergreens for the signalled junctions.
4.4 Junction Modelling Results
Findings from the junction modelling for each scenario are presented in the following sections. For each scenario, the results present the spare junction capacity for the assessed scenarios (i.e. the with and without bus gate scenarios for access Options A and E) as well as the average delay (seconds per PCU) for these scenarios. The spare capacity provides an indication of the ability of the junction cope with the additional traffic with a higher percentage spare capacity indicating a greater ability of a junction to do so. A junction would be at capacity at 0% and over capacity with a negative percentage.
The Do-Minimum6 average delay is also provided to show the change in delay resulting from the York Central development. For signalised junctions, the average delay is calculated based on the weighted average of the delay per PCU one each approach while for priority junctions, the average delay is the highest average delay on any approach to the junction. The delay percentage is the average delay for individual vehicles (in seconds).
4.4.1 Option A – with bus gate
A concise summary Option A with bus gate junction modelling results are presented in Table 21.
Table 21: Option A with Bus Gate Modelling Results
Ref. No.
Junction
2031 ‘Spare’ Capacity
Average Delay (seconds/PCU)
– Do Something
Average Delay (seconds/PCU)
– Do Minimum
AM Peak
PM Peak
AM Peak
PM Peak
AM Peak
PM Peak
1 A59 Holgate Road/Acomb Road/Poppleton Road
50% 62% 23s 20s 23s 7s
2 Water End/A59 Boroughbridge Road
18% 18% 39s 43s 35s 36s
3 Water End/Salisbury Road 16% 55% 35s 30s 33s 32s
4 Clifton/Water End/Water Lane
7% 10% 53s 50s 48s 41s
6 The situation without any York Central development but with additional background traffic growth and growth associated with the York Local Plan development

York Central Partnership York CentralLeeman Road - Transport Modelling
| Issue | October 2017
J:\250000\251869-00\0 ARUP\0-11 TRANSPORTATION\0-11-08 REPORTS\2017-08 LEEMAN ROAD OPEN - MODELLING\2017-10_LEEMAN ROAD MODELLING_ISSUE V5(FINAL).DOCX
Page 26
Ref. No.
Junction
2031 ‘Spare’ Capacity
Average Delay (seconds/PCU)
– Do Something
Average Delay (seconds/PCU)
– Do Minimum
AM Peak
PM Peak
AM Peak
PM Peak
AM Peak
PM Peak
5 A59 Holgate Road/Hamilton Drive
2% 9% 33s 27s 39s 38s
6 A1036 The Mount/Dalton Terrace/Albermarle Road
42% 38% 37s 34s 34s 34s
7 A1036 The Mount/Scarcroft Road
226% 122% 16s 17s 13s 15s
8 A59 Holgate Road/Blossom Street
37% 41% 24s 24s 24s 22s
9 A1036 Blossom Street/Queen Street/Nunnery Lane
14% 7% 54s 69s 51s 63s
10 A1036 Bishopthorpe Road/Scarcroft Road
27% 39% 25s 23s 24s 28s
11 Tadcaster Road/St Helen’s Road
3% 24% 40s 26s 32s 24s
12 A59 Holgate Road/Dalton Terrace
8% 7% 26s 26s 24s 37s
13 B1363 Wigginton Road/Crichton Avenue
31% 40% 31s 25s 29s 24s
14 A19 Bootham/A1036 St. Leonard’s Place/Gillygate
18% 5% 48s 56s 49s 54s
For Option A with the bus gate, the results show that all junctions would operate with spare capacity for the AM and PM peak hours. Overall, the average delay at each junction does not vary significantly from the Do-Minimum scenario. No further mitigation would be required for this scenario.
4.4.2 Option A – without bus gate
A concise summary Option A without bus gate junction modelling results are presented in Table 22.
Table 22: Option A without Bus Gate Modelling Results
Ref. No.
Junction
2031 Do Something
‘Spare’ Capacity
Average Delay (seconds/PCU)
– Do Something
Average Delay (seconds/PCU)
– Do Minimum
AM Peak
PM Peak
AM Peak
PM Peak
AM Peak
PM Peak
1 A59 Holgate Road/Acomb Road/Poppleton Road
74% 15% 23s 19s 23s 7s
2 Water End/A59 Boroughbridge Road
30% 33% 38s 39s 35s 36s

York Central Partnership York CentralLeeman Road - Transport Modelling
| Issue | October 2017
J:\250000\251869-00\0 ARUP\0-11 TRANSPORTATION\0-11-08 REPORTS\2017-08 LEEMAN ROAD OPEN - MODELLING\2017-10_LEEMAN ROAD MODELLING_ISSUE V5(FINAL).DOCX
Page 27
Ref. No.
Junction
2031 Do Something
‘Spare’ Capacity
Average Delay (seconds/PCU)
– Do Something
Average Delay (seconds/PCU)
– Do Minimum
AM Peak
PM Peak
AM Peak
PM Peak
AM Peak
PM Peak
3 Water End/Salisbury Road 60% 90% 30s 27s 33s 32s
4 Clifton/Water End/Water Lane
12% 20% 49s 45s 48s 41s
5 A59 Holgate Road/Hamilton Drive
-2% 2% 39s 33s 39s 38s
6 A1036 The Mount/Dalton Terrace/Albermarle Road
51% 34% 37s 35s 34s 34s
7 A1036 The Mount/Scarcroft Road
204% 111% 16s 17s 13s 15s
8 A59 Holgate Road/Blossom Street
37% 42% 23s 22s 24s 22s
9 A1036 Blossom Street/Queen Street/Nunnery Lane
20% 13% 51s 66s 51s 63s
10 A1036 Bishopthorpe Road/Scarcroft Road
20% 35% 27s 23s 24s 28s
11 Tadcaster Road/St Helen’s Road
12% 29% 34s 25s 32s 24s
12 A59 Holgate Road/Dalton Terrace
5% 24% 28s 18s 24s 37s
13 B1363 Wigginton Road/Crichton Avenue
34% 43% 30s 25s 29s 24s
14 A19 Bootham/A1036 St. Leonard’s Place/Gillygate
18% 5% 49s 57s 49s 54s
For Option A without the bus gate, the results show that all junctions with the exception of A59 Holgate Road/Hamilton Drive would operate with spare capacity for the AM and PM peak hours. At the junction of A59 Holgate Road/Hamilton Drive, the spare capacity has been identified as -2% for the AM peak hour. However, the highest RFC at the junction is 72% with a MMQ of two PCU. In terms of the average delay, overall there is little change to the average delay is similar to the Do-Minimum scenario for all junctions. The potential for mitigation is considered further in Section 4.4.5.
Compared with Option A with the bus gate, there is, in general, a greater level of space capacity available at the assessed junctions.
4.4.3 Option E – with bus gate
A concise summary Option E with bus gate junction modelling results are presented in.

York Central Partnership York CentralLeeman Road - Transport Modelling
| Issue | October 2017
J:\250000\251869-00\0 ARUP\0-11 TRANSPORTATION\0-11-08 REPORTS\2017-08 LEEMAN ROAD OPEN - MODELLING\2017-10_LEEMAN ROAD MODELLING_ISSUE V5(FINAL).DOCX
Page 28
Table 23: Option E with Bus Gate Modelling Results
Ref. No.
Junction
2031 Do Something
‘Spare’ Capacity
Average Delay (seconds/PCU)
– Do Something
Average Delay (seconds/PCU) – Do Minimum
AM Peak
PM Peak
AM Peak
PM Peak
AM Peak
PM Peak
1 A59 Holgate Road/Acomb Road/Poppleton Road
83% 100% 22s 18s 23s 7s
2 Water End/A59 Boroughbridge Road
40% 53% 35s 36s 35s 36s
3 Water End/Salisbury Road 19% 40% 34s 33s 33s 32s
4 Clifton/Water End/Water Lane 5% 10% 54s 50s 48s 41s
5 A59 Holgate Road/Hamilton Drive
-8% 15% 53s 24s 39s 38s
6 A1036 The Mount/Dalton Terrace/Albermarle Road
39% 33% 39s 39s 34s 34s
7 A1036 The Mount/Scarcroft Road
225% 128% 15s 17s 13s 15s
8 A59 Holgate Road/Blossom Street
37% 40% 24s 24s 24s 22s
9 A1036 Blossom Street/Queen Street/Nunnery Lane
14% 14% 54s 66s 51s 63s
10 A1036 Bishopthorpe Road/Scarcroft Road
27% 31% 26s 24s 24s 28s
11 Tadcaster Road/St Helen’s Road
-3% 11% 47s 31s 32s 24s
12 A59 Holgate Road/Dalton Terrace
-15% 7% 359s 26s 24s 37s
13 B1363 Wigginton Road/Crichton Avenue
31% 41% 31s 25s 29s 24s
14 A19 Bootham/A1036 St. Leonard’s Place/Gillygate
19% 4% 48s 57s 49s 54s
For Option E with the bus gate, the results show that all except three junctions operate with spare capacity for the AM and PM peak hours. Potential issues have been highlighted at the following junctions:
At the junction of A59 Holgate Road/Hamilton Drive, the spare capacity has been identified as -8% for the AM peak hour. However, the highest RFC at the junction is 58% with a MMQ of one PCU;
At the junction of Tadcaster Road/St. Helen’s Road in the AM peak hour, the spare capacity has been identified as -3% in the AM peak hour. The highest DoS recorded is 93% with a MMQ of 25 PCU; and
At the junction of A59 Holgate Road with Dalton Terrace, the spare capacity has been identified as -15% in the AM peak hour. The highest RFC is recorded as 0.98 with a MMQ of 14 PCU.

York Central Partnership York CentralLeeman Road - Transport Modelling
| Issue | October 2017
J:\250000\251869-00\0 ARUP\0-11 TRANSPORTATION\0-11-08 REPORTS\2017-08 LEEMAN ROAD OPEN - MODELLING\2017-10_LEEMAN ROAD MODELLING_ISSUE V5(FINAL).DOCX
Page 29
With the exception of the junctions identified above, the overall level of delay experienced do not vary significantly from the Do-Minimum Scenario. The additional delays, where more significant, would be acceptable given the level of increases in delay overall.
The potential for mitigation at these junctions is considered further in Section 4.4.5.
4.4.4 Option E – without bus gate
A concise summary Option E without bus gate junction modelling results are presented in Table 24.
Table 24: Option E without Bus Gate Modelling Results
Ref. No.
Junction
2031 Do Something
‘Spare’ Capacity
Average Delay (seconds/PCU)
– Do Something
Average Delay (seconds/PCU) – Do Minimum
AM Peak
PM Peak
AM Peak
PM Peak
AM Peak
PM Peak
1 A59 Holgate Road/Acomb Road/Poppleton Road
88% 111% 21s 19s 23s 7s
2 Water End/A59 Boroughbridge Road
39% 56% 35s 35s 35s 36s
3 Water End/Salisbury Road 22% 36% 35s 34s 33s 32s
4 Clifton/Water End/Water Lane 5% 16% 55s 46s 48s 41s
5 A59 Holgate Road/Hamilton Drive
-16% 6% 167s 29s 39s 38s
6 A1036 The Mount/Dalton Terrace/Albermarle Road
40% 35% 38s 39s 34s 34s
7 A1036 The Mount/Scarcroft Road
200% 178% 12s 14s 13s 15s
8 A59 Holgate Road/Blossom Street
45% 72% 23s 21s 24s 22s
9 A1036 Blossom Street/Queen Street/Nunnery Lane
14% 30% 53s 63s 51s 63s
10 A1036 Bishopthorpe Road/Scarcroft Road
37% 37% 24s 24s 24s 28s
11 Tadcaster Road/St Helen’s Road
6% 22% 37s 26s 32s 24s
12 A59 Holgate Road/Dalton Terrace
-9% 2% 91s 32s 24s 37s
13 B1363 Wigginton Road/Crichton Avenue
33% 45% 30s 24s 29s 24s
14 A19 Bootham/A1036 St. Leonard’s Place/Gillygate
19% 4% 49s 57s 49s 54s

York Central Partnership York CentralLeeman Road - Transport Modelling
| Issue | October 2017
J:\250000\251869-00\0 ARUP\0-11 TRANSPORTATION\0-11-08 REPORTS\2017-08 LEEMAN ROAD OPEN - MODELLING\2017-10_LEEMAN ROAD MODELLING_ISSUE V5(FINAL).DOCX
Page 30
For Option E without the bus gate, the results show that all except two junctions operate with spare capacity for the AM and PM peak hours. Potential issues have been highlighted at the following junctions:
At the junction of A59 Holgate Road/Hamilton Drive, the spare capacity has been identified as -16% for the AM peak hour. However, the highest RFC at the junction is 98% with a MMQ of nine PCU;
At the junction of A59 Holgate Road with Dalton Terrace, the spare capacity has been identified as -15% in the AM peak hour. The highest RFC is recorded as 89% with a MMQ of seven PCU.
With the exception of the junctions identified above, the overall level of delay experienced do not vary significantly from the Do-Minimum Scenario. The additional delays, where more significant, would be acceptable given the level of increases in delay overall.
The potential for mitigation at these junctions is considered further in Section 4.4.5.
Compared with Option E without the bus gate, there is, in general, a greater level of space capacity available at the assessed junctions.
4.4.5 Summary of Analysis and Mitigation Considered
Table 25 outlines a summary of the analysis and whether any junction modification is required.
Table 25: Summary of Analysis and Mitigation Considered
Junction Ref. No.
Junction Mitigation Considered
1 A59 Holgate Road/Acomb Road/Poppleton Road (The Fox)
No junction modification proposals have been progressed for the Fox junction. The results show significant spare capacity for all scenarios during the AM and PM peaks.
2 Water End/A59 Boroughbridge Road
No junction modification proposals have been progressed for the Water End/A59 Boroughbridge Road junction. The results show significant spare capacity for all scenarios during the AM and PM peaks.
3 Water End/Salisbury Road
No junction modification proposals have been progressed for Water End/Salisbury Road junction. The results show significant spare capacity for all scenarios during the AM and PM peaks.
4 Clifton/Water End/Water Lane
No junction modification proposals have been progressed for Clifton/Water End/Water Lane junction. The results show spare capacity for all scenarios during the AM and PM peaks.
5 A59 Holgate Road/Hamilton Drive
Whilst the results forecast the junction to be over capacity during the AM peak for the Option A without bus gate scenario and the Option E with and without bus gate scenarios, this capacity issue only

York Central Partnership York CentralLeeman Road - Transport Modelling
| Issue | October 2017
J:\250000\251869-00\0 ARUP\0-11 TRANSPORTATION\0-11-08 REPORTS\2017-08 LEEMAN ROAD OPEN - MODELLING\2017-10_LEEMAN ROAD MODELLING_ISSUE V5(FINAL).DOCX
Page 31
Junction Ref. No.
Junction Mitigation Considered
affects one lane of one leg of the junction and is considered to be minor in nature.
Whilst the RFC is greater than 85% and the junction will not operate as efficiently for Option E with and without the bus gate, it is not fully saturated and will continue to function.
Modifications to the junction are likely to be difficult due to the physical constraints at the site. On this basis, junction modifications are not proposed.
6 A1036 The Mount/Dalton Terrace/Albermarle Road
No junction modification proposals have been progressed at the A1036 The Mount/Dalton Terrace/Albermarle Road junction. The results show spare capacity for all scenarios during the AM and PM peaks.
7 A1036 The Mount/Scarcroft Road
No junction modification proposals have been progressed at the A1036 The Mount/Scarcroft Road junction. The results show significant spare capacity for all scenarios during the AM and PM peaks.
8 A59 Holgate Road/Blossom Street
No junction modification proposals have been progressed at the A59 Holgate Road/Blossom Street junction. The results show spare capacity for all scenarios during the AM and PM peaks.
9 A1036 Blossom Street/Queen Street/Nunnery Lane
No junction modification proposals have been progressed at the A1036 Blossom Street/Queen Street/Nunnery Lane junction. The results show spare capacity for all scenarios during the AM and PM peaks.
10 A1036 Bishopthorpe Road/Scarcroft Road
No junction modification proposals have been progressed at the A1036 Bishopthorpe Road/Scarcroft Road junction. The results show spare capacity for all scenarios during the AM and PM peaks.
11 Tadcaster Road/St Helen’s Road
Whilst the results forecast the junction to be over capacity during the AM peak for the Option E with bus gate, this capacity issue only affects one lane of one leg of the junction and is considered to be minor in nature.
Whilst the DoS is greater than 90% and the junction will not operate as efficiently for Option E with bus gate, it is not fully saturated and will continue to function.
Modifications to the junction are likely to be difficult due to the physical constraints at the site. On this basis, junction modifications are not proposed.
12 A59 Holgate Road/Dalton Terrace
Whilst the results forecast the junction to be over capacity during the AM peak for the Option E with and without the bus gate, this capacity issue only affects one lane of one leg of the junction and is considered to be minor in nature.

York Central Partnership York CentralLeeman Road - Transport Modelling
| Issue | October 2017
J:\250000\251869-00\0 ARUP\0-11 TRANSPORTATION\0-11-08 REPORTS\2017-08 LEEMAN ROAD OPEN - MODELLING\2017-10_LEEMAN ROAD MODELLING_ISSUE V5(FINAL).DOCX
Page 32
Junction Ref. No.
Junction Mitigation Considered
Whilst the RFC is greater than 85% and the junction will not operate as efficiently for Option E with and without the bus gate, it is not fully saturated and will continue to function.
Modifications to the junction are likely to be difficult due to the physical constraints at the site. On this basis, junction modifications are not proposed.
13 B1363 Wigginton Road/Crichton Avenue
No junction modification proposals have been progressed at the B1363 Wigginton Road/Crichton Avenue junction. The results show spare capacity for all scenarios during the AM and PM peaks.
14 A19 Bootham/A1036 St. Leonard’s Place/Gillygate
No junction modification proposals have been progressed at the A19 Bootham/A1036 St. Leonard’s Place/Gillygate junction. The results show spare capacity for all scenarios during the AM and PM peaks.
The modelling undertaken assumes optimised signal timings (for signalised junctions) and while physical mitigation measures have not been suggested, there may be opportunities for CYC to explore on-street optimisation of signal timings to ensure coordination between junctions (not limited to those included as part of this assessment). This could be explored as part of the microsimulation modelling which will be undertaken as part of the full Transport Assessment.
In addition, a Travel Plan will be required to support the York Central development which will seek to implement a range of measures to encourage sustainable travel. The Travel Plan will set targets to increase the mode share by walking, cycling and public transport with corresponding targets for the reduction in private vehicle trips. Other sustainable measures such as car sharing (to reduce single occupancy vehicle trips) will also be considered. A Travel Plan Framework will be prepared as part of the full Transport Assessment for the York Central scheme which will be submitted as part of the planning submission.

York Central Partnership York CentralLeeman Road - Transport Modelling
| Issue | October 2017
J:\250000\251869-00\0 ARUP\0-11 TRANSPORTATION\0-11-08 REPORTS\2017-08 LEEMAN ROAD OPEN - MODELLING\2017-10_LEEMAN ROAD MODELLING_ISSUE V5(FINAL).DOCX
Page 33
5 Conclusions
This report has been prepared to provide a comparison of the impacts of Leeman Road with the bus gate (closed to general traffic) and without the bus gate (open) for both access Options A (western) and E (southern). At the same time, both the May 2017 Development Scenario proposals, and a August 2017 Development Scenario, have been tested. In doing this, a strategic and local assessment has been carried out. The report also serves to identify what level of mitigation might be required.
The strategic assessment found that for both the May 2017 Development Scenario and August 2017 Development Scenarios, the predicted delay, travel time and travel distance are lower for Access Option E rather than Option A. The predicted network wide delays, travel times and travel distances are lower without the bus gate in place on Leeman Road. As expected, August 2017 Development Scenario results in greater network delay, travel time and travel distance than the May 2017 Development Scenario, as modelled in May 2017 for the Access Options Study.
The SATURN modelling indicates that the wider highway network is predicted to operate better without the bus gate on Leeman Road. The predicted network delays, travel time and travel distance are less in the without bus gate scenario than with the bus gate. However, by not introducing a bus gate, routes through the York Central site, including the diverted Leeman Road (as a result of NRM expansion), will be busier. York Central trips to / from the city centre will use the eastern access and existing local trips could use Leeman Road / the site as a cut through, as currently occurs.
Analysis of the traffic flows from the strategic model shows that general trend is that the volume of traffic is increasing across the network. There are some decreases in traffic, particularly close to the York Central site for the “with bus gate” scenarios. Reductions in traffic on outer parts of the network will occur as a result of the displacement of traffic. This is, however, less noticeable for the “without bus gate” scenarios as there is less traffic displacement due to the availability of a route through the York Central site.
This analysis shows that at a city-wide level, Access Option E generates less congestion that Access Option A. Placing a bus-gate on Leeman Road will force through traffic to use other routes and therefore the “with bus gat”e scenarios generate greater congestion than the “without bus gate” scenarios, particularly so for the August 2017 Development Scenario.
At a more local level and close to the York Central site, there is generally a decrease in the level of traffic using Leeman Road for the with bus gate scenarios with the exception of Option E for the August 2017 Development Scenario without the bus gate.
A number of roads around the site do experience increases in traffic with many in excess of 10% for both Option A and Option E. This includes Holgate Road, Clifton and Water End. These increases are likely to be as a result of the additional development traffic as well as the displacement of traffic to/from other routes. Holgate Road west of York Road does, however, experience a decrease in

York Central Partnership York CentralLeeman Road - Transport Modelling
| Issue | October 2017
J:\250000\251869-00\0 ARUP\0-11 TRANSPORTATION\0-11-08 REPORTS\2017-08 LEEMAN ROAD OPEN - MODELLING\2017-10_LEEMAN ROAD MODELLING_ISSUE V5(FINAL).DOCX
Page 34
traffic flows during the PM peak hour of Option E for the “without bus gate” scenario.
The impact of the development on the York outer ring road has also been considered for all scenarios. While some junctions do experience an increase in flow of greater than 50 PCU, the increase in traffic flows are typically less than 10% and where the V/C is greater than 80%, it is typically greater than 80% in the Do-Minimum scenarios also.
The local assessment has identified that majority of junctions assessed would have spare capacity for all scenarios during the AM and PM peak hours with and without the bus gate. While certain junctions, particularly the junctions of A59 Holgate/Dalton Street and A59 Holgate/Hamilton Drive East, would operate above capacity, it is only one arm of the junction in the AM peak hour of the affected scenarios that would operate with the RFC of greater than 85%. As such, the junction would continue to function. Modifications to these junctions are likely to be difficult due to the physical constraints at the site. On this basis, junction modifications are not likely to be required to these or any other junctions.
In general, with the exception of the aforementioned junctions, the overall level of delay experienced at the assessed junctions does not increase significantly when compared with the Do-Minimum for Options A and E in the “with” and “without bus gate” scenarios for the AM and PM peak hours. The additional delays, where more significant, may be acceptable given the level of increases in delay caused by background traffic increases and other developments. The implementation of the Travel Plan for the York Central site will seek to reduce the number of vehicle trips generated by the site through a series of sustainable travel measures.
The modelling shows that the development scenarios should be achievable subject to more detailed discussions with the Highways Authority as part of the preparation of a Transport Assessment to support a future Planning Application.

Appendix A
May 2017 Development Scenario Proposal Flow Difference Plots

York Central Partnership York CentralLeeman Road - Transport Modelling
| Issue | October 2017
J:\250000\251869-00\0 ARUP\0-11 TRANSPORTATION\0-11-08 REPORTS\2017-08 LEEMAN ROAD OPEN - MODELLING\2017-10_LEEMAN ROAD MODELLING_ISSUE V5(FINAL).DOCX
Page A1
A1 May 2017 Development Scenario with Bus Gate - Access Option A
Figure 2: Option A May 2017 Development Scenario with Bus Gate - AM Peak Hour Difference Plot
Figure 3: Option A May 2017 Development Scenario with Bus Gate - PM Peak Hour Difference Plot
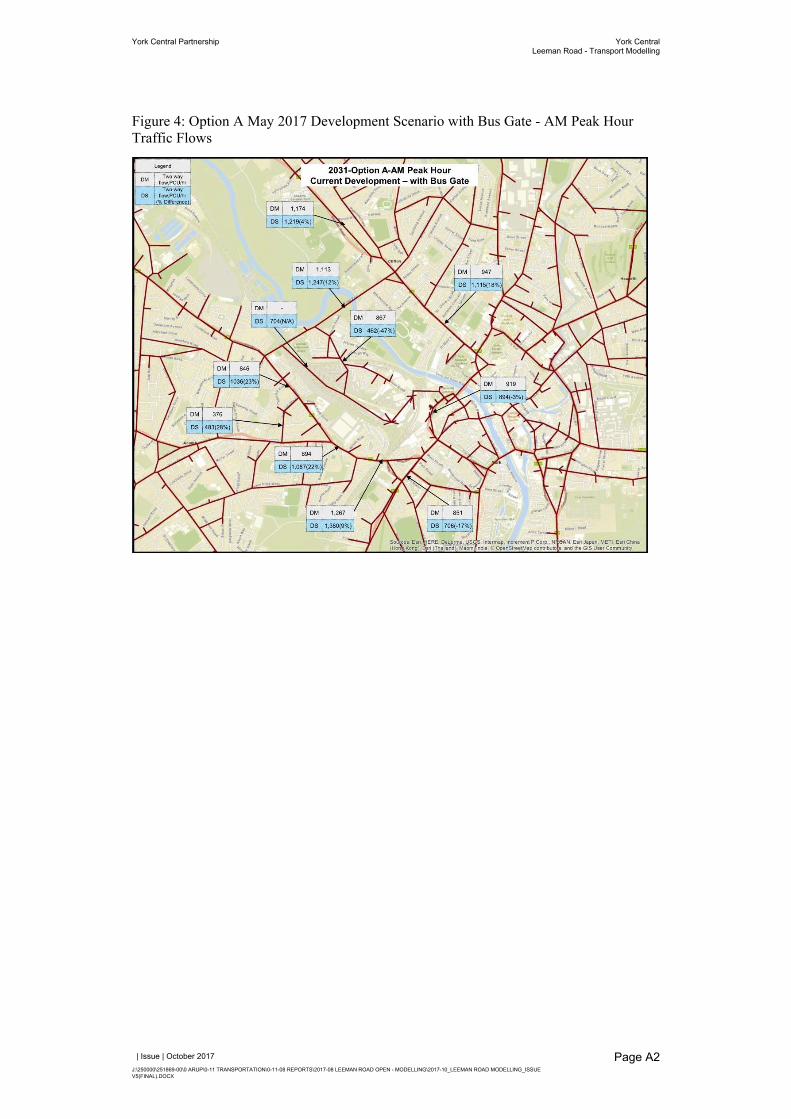
York Central Partnership York CentralLeeman Road - Transport Modelling
| Issue | October 2017
J:\250000\251869-00\0 ARUP\0-11 TRANSPORTATION\0-11-08 REPORTS\2017-08 LEEMAN ROAD OPEN - MODELLING\2017-10_LEEMAN ROAD MODELLING_ISSUE V5(FINAL).DOCX
Page A2
Figure 4: Option A May 2017 Development Scenario with Bus Gate - AM Peak Hour Traffic Flows

York Central Partnership York CentralLeeman Road - Transport Modelling
| Issue | October 2017
J:\250000\251869-00\0 ARUP\0-11 TRANSPORTATION\0-11-08 REPORTS\2017-08 LEEMAN ROAD OPEN - MODELLING\2017-10_LEEMAN ROAD MODELLING_ISSUE V5(FINAL).DOCX
Page A3
Figure 5: Option A May 2017 Development Scenario with Bus Gate - PM Peak Hour Traffic Flows

York Central Partnership York CentralLeeman Road - Transport Modelling
| Issue | October 2017
J:\250000\251869-00\0 ARUP\0-11 TRANSPORTATION\0-11-08 REPORTS\2017-08 LEEMAN ROAD OPEN - MODELLING\2017-10_LEEMAN ROAD MODELLING_ISSUE V5(FINAL).DOCX
Page A4
A2 May 2017 Development Scenario with Bus Gate - Access Option E
Figure 6: Option E May 2017 Development Scenario with Bus Gate - AM Peak Hour Difference Plot
Figure 7: Option E May 2017 Development Scenario with Bus Gate - PM Peak Hour Difference Plot

York Central Partnership York CentralLeeman Road - Transport Modelling
| Issue | October 2017
J:\250000\251869-00\0 ARUP\0-11 TRANSPORTATION\0-11-08 REPORTS\2017-08 LEEMAN ROAD OPEN - MODELLING\2017-10_LEEMAN ROAD MODELLING_ISSUE V5(FINAL).DOCX
Page A5
Figure 8: Option E May 2017 Development Scenario with Bus Gate - AM Peak Hour Traffic Flows
Figure 9: Option E May 2017 Development Scenario with Bus Gate - PM Peak Hour Traffic Flows

York Central Partnership York CentralLeeman Road - Transport Modelling
| Issue | October 2017
J:\250000\251869-00\0 ARUP\0-11 TRANSPORTATION\0-11-08 REPORTS\2017-08 LEEMAN ROAD OPEN - MODELLING\2017-10_LEEMAN ROAD MODELLING_ISSUE V5(FINAL).DOCX
Page A6
A3 May 2017 Development Scenariowithout Bus Gate - Access Option A
Figure 10: Option A May 2017 Development Scenario without Bus Gate - AM Peak Hour Difference Plot
Figure 11: Option A May 2017 Development Scenario without Bus Gate - PM Peak Hour Difference Plot

York Central Partnership York CentralLeeman Road - Transport Modelling
| Issue | October 2017
J:\250000\251869-00\0 ARUP\0-11 TRANSPORTATION\0-11-08 REPORTS\2017-08 LEEMAN ROAD OPEN - MODELLING\2017-10_LEEMAN ROAD MODELLING_ISSUE V5(FINAL).DOCX
Page A7
Figure 12: Option A May 2017 Development Scenario without Bus Gate - AM Peak Hour Traffic Flows
Figure 13: Option A May 2017 Development Scenario without Bus Gate - PM Peak Hour Traffic flows

York Central Partnership York CentralLeeman Road - Transport Modelling
| Issue | October 2017
J:\250000\251869-00\0 ARUP\0-11 TRANSPORTATION\0-11-08 REPORTS\2017-08 LEEMAN ROAD OPEN - MODELLING\2017-10_LEEMAN ROAD MODELLING_ISSUE V5(FINAL).DOCX
Page A8
A4 May 2017 Development Scenario without Bus Gate - Access Option E
Figure 14: Option E May 2017 Development Scenario without Bus Gate - AM Peak Hour Difference Plot
Figure 15: Option E May 2017 Development Scenario without Bus Gate - PM Peak Hour Difference Plot

York Central Partnership York CentralLeeman Road - Transport Modelling
| Issue | October 2017
J:\250000\251869-00\0 ARUP\0-11 TRANSPORTATION\0-11-08 REPORTS\2017-08 LEEMAN ROAD OPEN - MODELLING\2017-10_LEEMAN ROAD MODELLING_ISSUE V5(FINAL).DOCX
Page A9
Figure 16: Option E May 2017 Development Scenario without Bus Gate - AM Peak Traffic Flows
Figure 17: Option E May 2017 Development Scenario without Bus Gate - PM Peak Hour Traffic Flows

Appendix B
August 2017 Development Scenario Flow Difference Plots
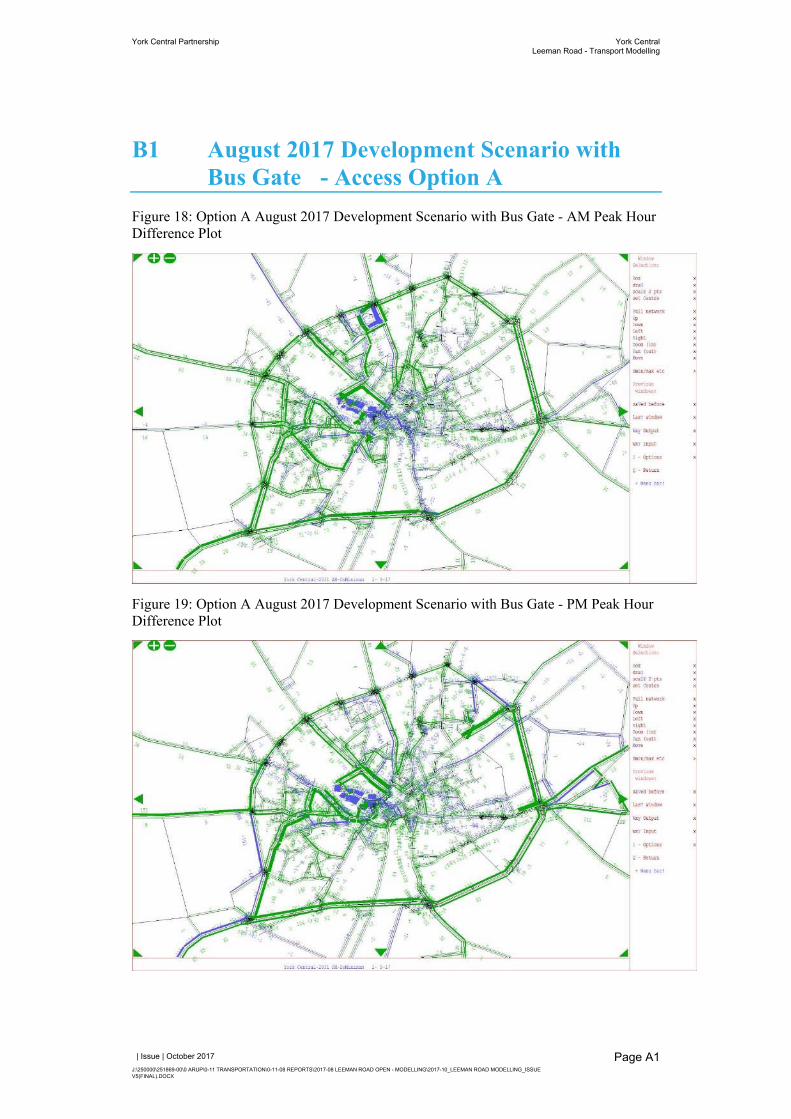
York Central Partnership York CentralLeeman Road - Transport Modelling
| Issue | October 2017
J:\250000\251869-00\0 ARUP\0-11 TRANSPORTATION\0-11-08 REPORTS\2017-08 LEEMAN ROAD OPEN - MODELLING\2017-10_LEEMAN ROAD MODELLING_ISSUE V5(FINAL).DOCX
Page A1
B1 August 2017 Development Scenario with Bus Gate - Access Option A
Figure 18: Option A August 2017 Development Scenario with Bus Gate - AM Peak Hour Difference Plot
Figure 19: Option A August 2017 Development Scenario with Bus Gate - PM Peak Hour Difference Plot

York Central Partnership York CentralLeeman Road - Transport Modelling
| Issue | October 2017
J:\250000\251869-00\0 ARUP\0-11 TRANSPORTATION\0-11-08 REPORTS\2017-08 LEEMAN ROAD OPEN - MODELLING\2017-10_LEEMAN ROAD MODELLING_ISSUE V5(FINAL).DOCX
Page A2
Figure 20: Option A August 2017 Development Scenario with Bus Gate - AM Peak Hour Traffic Flows
Figure 21: Option A August 2017 Development Scenario with Bus Gate - PM Peak Hour Traffic Flows
York Central Partnership York CentralLeeman Road - Transport Modelling
| Issue | October 2017
J:\250000\251869-00\0 ARUP\0-11 TRANSPORTATION\0-11-08 REPORTS\2017-08 LEEMAN ROAD OPEN - MODELLING\2017-10_LEEMAN ROAD MODELLING_ISSUE V5(FINAL).DOCX
Page A3
B2 August 2017 Development Scenario with Bus Gate - Access Option E
Figure 22: Option E August 2017 Development Scenario with Bus Gate - AM Peak Hour Difference Plot
Figure 23: Option E August 2017 Development Scenario with Bus Gate - PM Peak Hour Difference Plot

York Central Partnership York CentralLeeman Road - Transport Modelling
| Issue | October 2017
J:\250000\251869-00\0 ARUP\0-11 TRANSPORTATION\0-11-08 REPORTS\2017-08 LEEMAN ROAD OPEN - MODELLING\2017-10_LEEMAN ROAD MODELLING_ISSUE V5(FINAL).DOCX
Page A4
Figure 24: Option E August 2017 Development Scenario with Bus Gate - AM Peak Hour Traffic Flows
Figure 25: Option E August 2017 Development Scenario with Bus Gate - PM Peak Hour Traffic Flows

York Central Partnership York CentralLeeman Road - Transport Modelling
| Issue | October 2017
J:\250000\251869-00\0 ARUP\0-11 TRANSPORTATION\0-11-08 REPORTS\2017-08 LEEMAN ROAD OPEN - MODELLING\2017-10_LEEMAN ROAD MODELLING_ISSUE V5(FINAL).DOCX
Page A1
B3 August 2017 Development Scenario without Bus Gate - Access Option A
Figure 26: Option A August 2017 Development Scenario without Bus Gate - AM Peak Hour Difference Plot
Figure 27: Option A August 2017 Development Scenario without Bus Gate - PM Peak Hour Difference Plot

York Central Partnership York CentralLeeman Road - Transport Modelling
| Issue | October 2017
J:\250000\251869-00\0 ARUP\0-11 TRANSPORTATION\0-11-08 REPORTS\2017-08 LEEMAN ROAD OPEN - MODELLING\2017-10_LEEMAN ROAD MODELLING_ISSUE V5(FINAL).DOCX
Page A2
Figure 28: Option A August 2017 Development Scenario without Bus Gate - AM Peak Hour Traffic Flows
Figure 29: Option A August 2017 Development Scenario without Bus Gate - PM Peak Hour Traffic Flows
York Central Partnership York CentralLeeman Road - Transport Modelling
| Issue | October 2017
J:\250000\251869-00\0 ARUP\0-11 TRANSPORTATION\0-11-08 REPORTS\2017-08 LEEMAN ROAD OPEN - MODELLING\2017-10_LEEMAN ROAD MODELLING_ISSUE V5(FINAL).DOCX
Page A1
B4 August 2017 Development Scenario without Bus Gate - Access Option E
Figure 30: Option E August 2017 Development Scenario without Bus Gate - AM Peak Hour Difference Plot
Figure 31: Option E August 2017 Development Scenario without Bus Gate - PM Peak Hour Difference Plot

York Central Partnership York CentralLeeman Road - Transport Modelling
| Issue | October 2017
J:\250000\251869-00\0 ARUP\0-11 TRANSPORTATION\0-11-08 REPORTS\2017-08 LEEMAN ROAD OPEN - MODELLING\2017-10_LEEMAN ROAD MODELLING_ISSUE V5(FINAL).DOCX
Page A2
Figure 32: Option E August 2017 Development Scenario without Bus Gate - AM Peak Hour Traffic Flows
Figure 33: Option E August 2017 Development Scenario without Bus Gate - PM Peak Hour Traffic Flows

York Central Partnership York CentralLeeman Road - Transport Modelling
| Issue | October 2017
J:\250000\251869-00\0 ARUP\0-11 TRANSPORTATION\0-11-08 REPORTS\2017-08 LEEMAN ROAD OPEN - MODELLING\2017-10_LEEMAN ROAD MODELLING_ISSUE V5(FINAL).DOCX
Page A3

Appendix C
Cinder Lane Traffic Flows

York Central Partnership York CentralLeeman Road - Transport Modelling
| Issue | October 2017
J:\250000\251869-00\0 ARUP\0-11 TRANSPORTATION\0-11-08 REPORTS\2017-08 LEEMAN ROAD OPEN - MODELLING\2017-10_LEEMAN ROAD MODELLING_ISSUE V5(FINAL).DOCX
Page C1
C1 Cinder Lane Traffic Flows
Figure 34: Option A - AM Peak Hour
Figure 35: Option A - PM Peak Hour

York Central Partnership York CentralLeeman Road - Transport Modelling
| Issue | October 2017
J:\250000\251869-00\0 ARUP\0-11 TRANSPORTATION\0-11-08 REPORTS\2017-08 LEEMAN ROAD OPEN - MODELLING\2017-10_LEEMAN ROAD MODELLING_ISSUE V5(FINAL).DOCX
Page C2
Figure 36: Option E - AM Peak Hour
Figure 37: Option E - PM Peak Hour

Appendix D
Plots of Identified Junctions

York Central Partnership York CentralLeeman Road - Transport Modelling
| Issue | October 2017
J:\250000\251869-00\0 ARUP\0-11 TRANSPORTATION\0-11-08 REPORTS\2017-08 LEEMAN ROAD OPEN - MODELLING\2017-10_LEEMAN ROAD MODELLING_ISSUE V5(FINAL).DOCX
Page D1
D1 August 2017 Development Scenario – with Bus Gate
Figure 38: Option A August 2017 Development Scenario with Bus Gate - AM Peak Identified Junctions
York Central Partnership York CentralLeeman Road - Transport Modelling
| Issue | October 2017
J:\250000\251869-00\0 ARUP\0-11 TRANSPORTATION\0-11-08 REPORTS\2017-08 LEEMAN ROAD OPEN - MODELLING\2017-10_LEEMAN ROAD MODELLING_ISSUE V5(FINAL).DOCX
Page D2
Figure 39: Option A August 2017 Development Scenario with Bus Gate - PM Peak Identified Junctions
Figure 40: Option A August 2017 Development Scenario without Bus Gate - AM Peak Identified Junctions

York Central Partnership York CentralLeeman Road - Transport Modelling
| Issue | October 2017
J:\250000\251869-00\0 ARUP\0-11 TRANSPORTATION\0-11-08 REPORTS\2017-08 LEEMAN ROAD OPEN - MODELLING\2017-10_LEEMAN ROAD MODELLING_ISSUE V5(FINAL).DOCX
Page D3
Figure 41: Option A August 2017 Development Scenario without Bus Gate - PM Peak Identified Junctions
Figure 42: Option E August 2017 Development Scenario with Bus Gate - AM Peak Identified Junctions

York Central Partnership York CentralLeeman Road - Transport Modelling
| Issue | October 2017
J:\250000\251869-00\0 ARUP\0-11 TRANSPORTATION\0-11-08 REPORTS\2017-08 LEEMAN ROAD OPEN - MODELLING\2017-10_LEEMAN ROAD MODELLING_ISSUE V5(FINAL).DOCX
Page D4
Figure 43: Option E August 2017 Development Scenario with Bus Gate - PM Peak Identified Junctions
Figure 44: Option E August 2017 Development Scenario without Bus Gate - AM Peak Identified Junctions

York Central Partnership York CentralLeeman Road - Transport Modelling
| Issue | October 2017
J:\250000\251869-00\0 ARUP\0-11 TRANSPORTATION\0-11-08 REPORTS\2017-08 LEEMAN ROAD OPEN - MODELLING\2017-10_LEEMAN ROAD MODELLING_ISSUE V5(FINAL).DOCX
Page D5
Figure 45: Option E August 2017 Development Scenario without Bus Gate - PM Peak Identified Junctions