yadkin county (nc) june 2013 - yadkinville, north …df95938a-529b-4171-8cda...yadkin county (nc)...
TRANSCRIPT
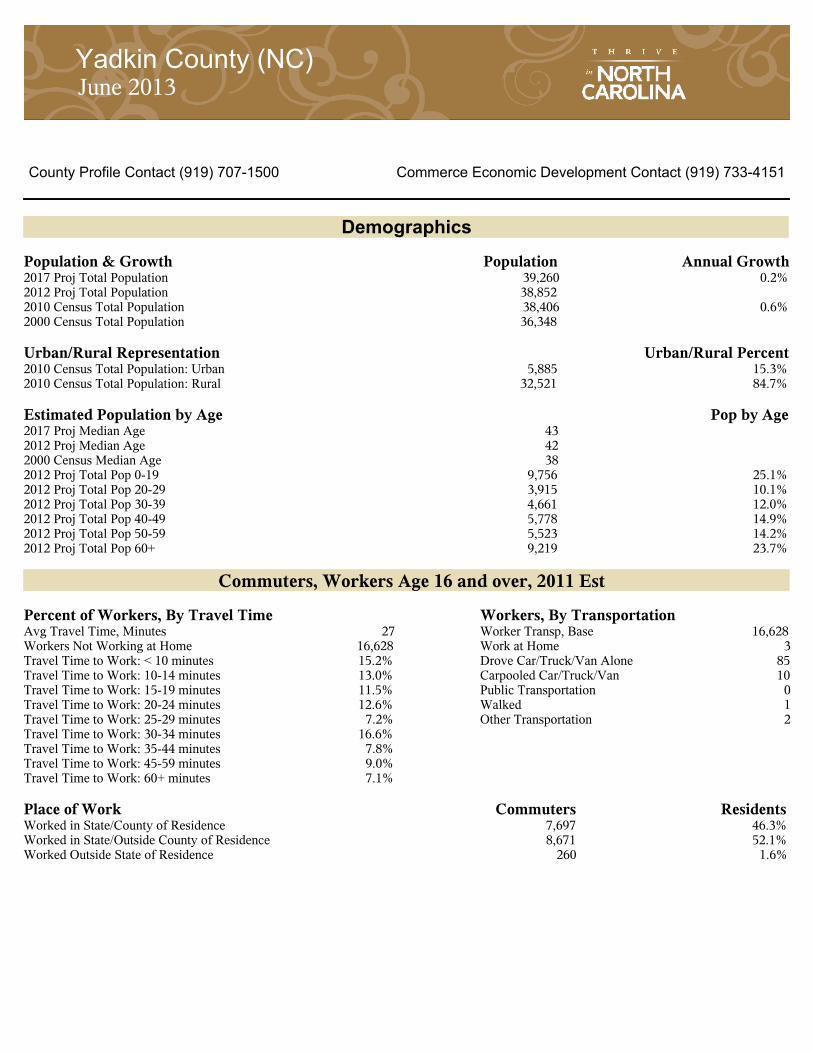
Yadkin County (NC) June 2013 Yadkin County (NC) June 2013
County Profile Contact (919) 707-1500 Commerce Economic Development Contact (919) 733-4151
Demographics
Population & Growth Population Annual Growth2017 Proj Total Population 39,260 0.2%2012 Proj Total Population 38,8522010 Census Total Population 38,406 0.6%2000 Census Total Population 36,348
Urban/Rural Representation Urban/Rural Percent2010 Census Total Population: Urban 5,885 15.3%2010 Census Total Population: Rural 32,521 84.7%
Estimated Population by Age Pop by Age2017 Proj Median Age 432012 Proj Median Age 422000 Census Median Age 382012 Proj Total Pop 0-19 9,756 25.1%2012 Proj Total Pop 20-29 3,915 10.1%2012 Proj Total Pop 30-39 4,661 12.0%2012 Proj Total Pop 40-49 5,778 14.9%2012 Proj Total Pop 50-59 5,523 14.2%2012 Proj Total Pop 60+ 9,219 23.7%
Commuters, Workers Age 16 and over, 2011 Est
Percent of Workers, By Travel Time Workers, By TransportationAvg Travel Time, Minutes 27 . . Worker Transp, Base 16,628Workers Not Working at Home 16,628 Work at Home 3Travel Time to Work: < 10 minutes 15.2% Drove Car/Truck/Van Alone 85Travel Time to Work: 10-14 minutes 13.0% Carpooled Car/Truck/Van 10Travel Time to Work: 15-19 minutes 11.5% Public Transportation 0Travel Time to Work: 20-24 minutes 12.6% Walked 1Travel Time to Work: 25-29 minutes 7.2% Other Transportation 2Travel Time to Work: 30-34 minutes 16.6%Travel Time to Work: 35-44 minutes 7.8%Travel Time to Work: 45-59 minutes 9.0%Travel Time to Work: 60+ minutes 7.1%
Place of Work Commuters ResidentsWorked in State/County of Residence 7,697 46.3%Worked in State/Outside County of Residence 8,671 52.1%Worked Outside State of Residence 260 1.6%
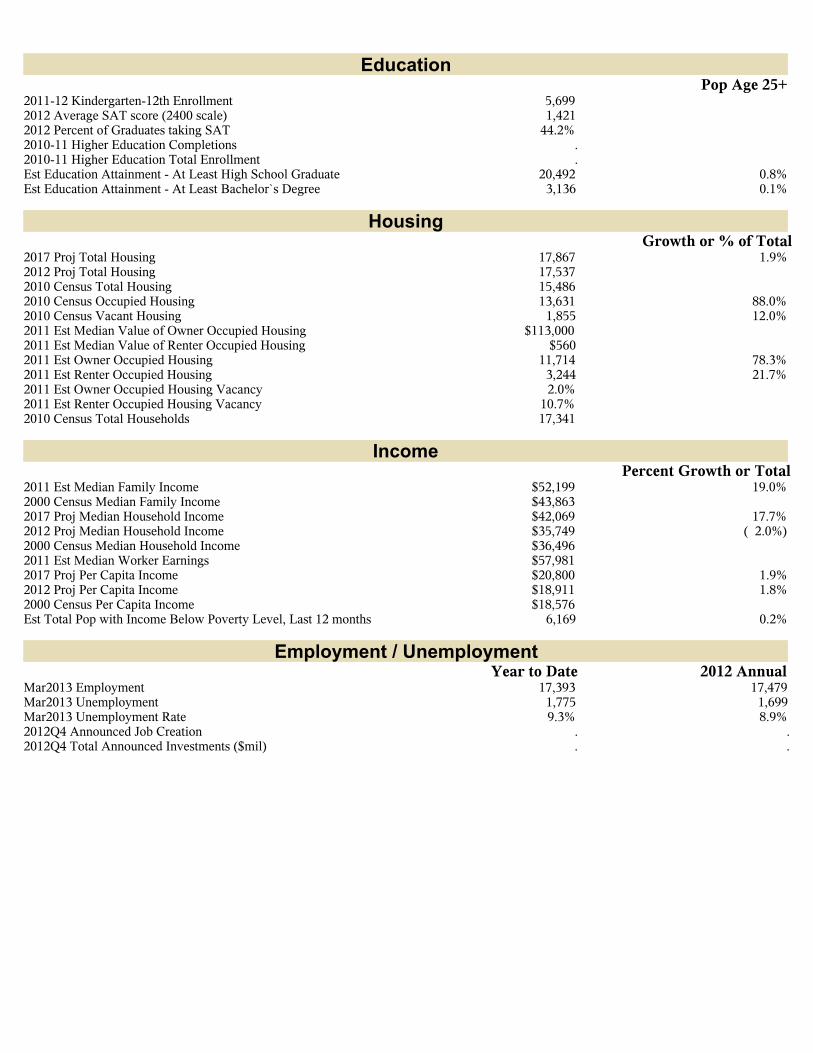
EducationPop Age 25+
2011-12 Kindergarten-12th Enrollment 5,6992012 Average SAT score (2400 scale) 1,4212012 Percent of Graduates taking SAT 44.2%2010-11 Higher Education Completions .2010-11 Higher Education Total Enrollment .Est Education Attainment - At Least High School Graduate 20,492 0.8%Est Education Attainment - At Least Bachelor`s Degree 3,136 0.1%
HousingGrowth or % of Total
2017 Proj Total Housing 17,867 1.9%2012 Proj Total Housing 17,5372010 Census Total Housing 15,4862010 Census Occupied Housing 13,631 88.0%2010 Census Vacant Housing 1,855 12.0%2011 Est Median Value of Owner Occupied Housing $113,0002011 Est Median Value of Renter Occupied Housing $5602011 Est Owner Occupied Housing 11,714 78.3%2011 Est Renter Occupied Housing 3,244 21.7%2011 Est Owner Occupied Housing Vacancy 2.0%2011 Est Renter Occupied Housing Vacancy 10.7%2010 Census Total Households 17,341
IncomePercent Growth or Total
2011 Est Median Family Income $52,199 19.0%2000 Census Median Family Income $43,8632017 Proj Median Household Income $42,069 17.7%2012 Proj Median Household Income $35,749 ( 2.0%)2000 Census Median Household Income $36,4962011 Est Median Worker Earnings $57,9812017 Proj Per Capita Income $20,800 1.9%2012 Proj Per Capita Income $18,911 1.8%2000 Census Per Capita Income $18,576Est Total Pop with Income Below Poverty Level, Last 12 months 6,169 0.2%
Employment / UnemploymentYear to Date 2012 Annual
Mar2013 Employment 17,393 17,479Mar2013 Unemployment 1,775 1,699Mar2013 Unemployment Rate 9.3% 8.9%2012Q4 Announced Job Creation . .2012Q4 Total Announced Investments ($mil) . .

Employment / Wages by Industry 2012 3rd QtrEmployment
2011 AnnualEmployment
2012 3rd Qtr Avg WeeklyWage
2011 Avg WeeklyWage
Total All Industries 9,906 9,835 $543 $552Total Government 1,253 459 $652 $653Total Private Industry 7,609 8,302 $535 $535Agriculture ForestryFishing & Hunting
68 65 $575 $586
Mining 0 0 $0 $0Utilities 0 0 $0 $0Construction 592 606 $684 $705Manufacturing 2,162 2,124 $658 $650Wholesale Trade 239 237 $671 $696Retail Trade 897 836 $373 $409Transportation and Warehousing 946 821 $657 $682Information 204 217 $1,093 $1,096Finance and Insurance 165 191 $746 $861Real Estate and Rental and Leasing 27 69 $504 $689Professional and Technical Services 163 132 $630 $597Mgt of Companies, Enterprises 63 69 $770 $903Administrative and Waste Services 932 799 $369 $346Educational Services 779 3 $643 $437Health Care and Social Assistance 0 1,028 . $424Arts, Entertainment and Recreation 83 43 $209 $225Accommodation and Food Services 933 955 $225 $221Other Services Ex. Public Admin 207 179 $305 $311Public Administration 401 387 $637 $633Unclassified 0 0 $0 $0
Commercial/Retail/Industrial
Local Businesses . . Local Retail BusinessJun2013 Available Industrial Buildings 2 2012 Total Retail Sales (With Food/Drink) ($mil) $213.22012Q3 Establishments: Total Private Industry 641 2012 Total Retail Businesses (With Food/Drink) 2562012Q3 Establishments: Manufacturing 46 2012 Avg Sales/Business Total (with Food/Drink) $832,9642011 Est Self Employed 1,109
Quality of Life
Taxes ChildcareFY2012-13 Property Tax Rate per $100 Value $0.6900 2013Q1 Licensed Child Care Facilities 34FY2011-12 Annual Taxable Retail Sales ($mil) $159.0 2013Q1 Licensed Child Care Enrollment 8422013 Tier designation 2
Weather Healthcare ProvidersAnnual Rainfall 34 2011 Number of Physicians 19Annual Snowfall 9 2011 Physicians per 10,000 population 4.9Average Annual Temperature 58 2011 RNs per 10,000 population 27.6Average Annual High Temperature 72 2011 Dentists per 10,000 population 1.8Average Annual Low Temperature 48 2011 Pharmacists per 10,000 population 3.4
Sources: ESRI for demographics, housing, income, crime, and retail data. http://www.esri.comApplied Geographic Solutions for weather. www.appliedgeographic.com.NC Dept. of Education for SAT data by county system. http://www.ncpublicschools.org US Dept. of Education, National Center for Education Statistics forhigher education data. http://nces.ed.gov/ipeds/ NC Commerce, Labor and Economic Analysis Division, for announced new jobs and investment, NC tiers,lost jobs and affected establishments data, occupational data, and industrial buildings. http://www.nccommerce.com/en NC Dept. of Health & Human Servicesfor childcare data. http://www.ncdhhs.gov/ UNC Sheps Center for healthcare provider statistics. http://www.shepscenter.unc.edu/US Bureau of Labor Statistics for employment and unemployment, wages and establishments by industry. http://www.bls.gov US Census, 2010 Census,2007-11 American Community Survey for demographics, commuters, place of work, educational attainment, housing, and income. http://factfinder2.census.govNotes: Data are the latest available at the date the profile was prepared. SAT scores use the new scoring system including a writing test for a perfect scoreof 2400 and represent county systems. ESRI 2012/2017 data are projections and noted as proj. Some data may be available only for North Carolina.2010 Census data is noted as such. American Community Survey (ACS) data is noted as an estimate (est) and is from the 2007-11, 5 year surveyand data is as of 2011 with dollars inflated to 2011.For further details or questions, please check the Data Sources Guide at https://edis.commerce.state.nc.us/docs/bibliography/Data_Sources_Guide.pdf,or click on it under the map on the homepage.

Forsyth
Iredell
Wilkes
Yadkin
Surry Stokes
Davie¬«901
¬«268
¬«268
¬«67
£¤421
£¤158
£¤21
£¤601
£¤21
£¤52
§̈¦40
§̈¦77
§̈¦77
StateRoad
Rockford
EastBend
Boonville
PleasantHill
ElkinJonesville
Arlington
Enon
Lewisville
Yadkinville
Farmington
Prepared by North Carolina Department of Commerce, Labor & Economic Analysis Division, April 2013
/3Miles
Yadkin, North CarolinaUSA Airports InterstateUS HighwayState Highway
Rivers
WaterPark
County Boundary
International/Regional/MunicipalÆ̀Æ̀Æ̀Military/Seaplane BaseZZ
Railroads
Legend
Municipal BoundariesNational Forests
Public /Private Univ./ Comm Col.®v Hospital
"ñ"ñnm
[· Other Airports