xrd, ir and esr study of experimental … · clay minerals (1989) 24, 617--630 xrd, ir and esr...
TRANSCRIPT

Clay Minerals (1989) 24, 617--630
X R D , IR A N D ESR S T U D Y OF E X P E R I M E N T A L A L T E R A T I O N OF A L - N O N T R O N I T E INTO M I X E D -
L A Y E R K A O L I N I T E / S M E C T I T E
B. D E L V A U X , M. M. M E S T D A G H , L. V I E L V O Y E * AND A. J. H E R B I L L O N t
Unit$ CIFA, Facult~ des Sciences Agronomiques, Universit~ Catholique de Louvain, Place Croix du Sud, 1, 1348 Louvain-la-Neuve, *Section Physico-chimie, Mus~e Royal de l'Afrique Centrale, Place Croix du Sud, 1,
1348 Louvain-la-Neuve, Belgium, and tCentre de P~dologie Biologique, UP 6831 du CNRS associbe l'Universit$ de Nancy L BP 5, 54501 Vandoeuvre-les-Nancy Cedex, France
(Received 6 December 1988; revised 10 July 1989)
A B ST R AC T: The formation of kaolinite from A1 hydroxy interlayered Garfield nontronite has been carried out at 225~ in hydrothermal conditions. The kaolinitization process, which proceeds through mixed-layer kaolinite/smectite intermediates, was followed by XRD, IR and ESR spectroscopy, chemical analysis and charge properties. The smectite content of the clay products decreases regularly with the duration of the hydrothermal treatment. The CEC and the structural Fe content of the deferrated products show a similar trend. IR features specific to nontronite disappear and are barely detectable as the smectite content of the mixed-layer clay falls below 30~o. In contrast, the ESR spectrum of nontronite is characterized by a broad g2 signal that remains even after prolonged hydrothermal treatment. The calibration of the g2 ESR signal, due to Fe-smectite, shows that the synthetic kaolinites have low Fe contents (~ 1~ Fe203) indicating that the kaolinitization process involves destruction of the 2:1 layers and the subsequent neoformation of kaolinite and Fe oxides, As illustrated by the study of deferrated soil clay samples, representing a weathering sequence Fe-smectite ~ kaolinite + Fe oxides, ESR spectroscopy proved to be a powerful Fe probe for detecting Fe-rich smectite in kaolinite/Fe- smectite mixed-layer clays.
The origin of Fe-bearing smectites in soils derived from basic rocks is now well documented, and in a recent review, Wilson (1987) concluded that most of these smectites have the characterist ic composit ion of the beidell i te-nontronite series.
In tropical and subtropical environments, Fe-smecti tes are transitory weathering products and are usually confined to the bottom parts of soil profiles. As the soil surface is approached, the schematic reaction Fe-smecti te -~ kaolinite + Fe oxides takes place (Craig & Loughnan, 1964). Occasionally, 1:1/2:1 mixed-layer clays also form (see e.g. Herbil lon et al., 1981; Norr ish & Pickering, 1983; Yer ima et al., 1985).
The present study describes the experimental alteration, in hydrothermal conditions, of a chloritized nontronite into kaolinite through a series of intermediate 1:1/2:1 mixed-layer clays. This paper is a imed at evaluating to what extent I R and ESR spectroscopic methods may complement the X-ray data to elucidate better (i) the nature of these interstratified clay minerals, and (ii) the mechanisms of the processes involved in the hydrothermal reaction Fe- smectite ~ kaolinite + Fe oxides. In fact, as noted by Cradwick & Wilson (1972) and Srodofi
�9 1989 The Mineralogical Society

618 B. Delvaux et al.
(1980b), the X-ray identification of smectitic components present in 1:1/2:1 mixed-layer clay minerals is not easy when there is a high content of kaolinite.
M A T E R I A L S A N D M E T H O D S
The clay fraction (< 2/~m) of Garfield nontronite (Washington, USA, A.P. 1. H33b) was used as starting material. The pretreatments to chloritize the nontronite and the hydrothermal experiments were carried out according to the methods outlined by Poncelet & Brindley (1967).
Nontronite was first interlayered with Al-hydroxy polymers (1500 mEq A13 +/100 g), using 0.1 M NaOH and 0-2 M A1C13 solutions (A1/OH ratio = 2.7; Barnhisel & Rich, 1963). After an ageing period of 15 days, the chloritized nontronite (denoted A1-OH N) was washed free of salt, centrifuged, and air dried. 10 ml of 0-1 u HC1 were added to known amounts of Na § chloritized nontronite (1 g) and sealed in teflon vessels with screw-type tops. The samples were then submitted to a hydrothermal treatment at 225~ for periods varying from 1 (sample NK1) to 60 days (sample NK60). After hydrothermal treatment, the solid phase was deferrated by the oxalate-UV treatment of de Endredy (1963), then air dried and kept for characterization.
Electron microscope (EM) micrographs were obtained using a JEOL JEM-100 C (TEMSCAN model) microscope and the observations were made in the transmission mode under a potential of 100 kV. X-ray diffraction (XRD) patterns were obtained with a Philips diffractometer using Ni-filtered Cu-Ka radiation, on oriented clays which had been treated with ethylene glycol (EG) vapour under vacuum (10 -z mbar) for 12 h at room temperature, and heated at 225 ~ and 550~ Infrared (IR) spectra were obtained between 4000 and 500 cm -~ on a Fourier Transform IR Brucker IFS88 spectrometer using 400 scans and a resolution of 2 cm -~ ; KBr pellets with 2~ clay, i.e. 0.68 mg/cm 2, were examined after 9 h dehydration pretreatment at 180~ in vacuum-tight quartz cells with NaC1 windows; the residual pressures in the cells were of the order of 10-* torr. Powder electron spin resonance (ESR) measurements were performed at 25~ on X-band Varian E-IT' spectrometer as previously described by Mestdagh et al. (1980). The elemental analyses were carried out after sulphuric-hydrofluoric-acid attack and digestion of the calcined deferrated samples (Voinovitch et aL, 1962); A1, Fe and Mg were determined by atomic absorption spectrophotometry. The cation exchange capacities (CEC) of the deferrated clays were measured with 1 M ammonium acetate at pH 7 (Mackenzie, 1952).
Some natural soil clay fractions were also analysed by ESR spectroscopy. They originated from selected horizons (B21 (15-30 cm), B22 (30-66) and C (300 cm)) of a basalt-derived soil from Burundi (Herbillon et al., 1981). Prior to their examination by E SR spectroscopy, these clays were deferrated by dithionite-citrate-bicarbonate (DCB) reagent according to the method described by Mehra & Jackson (1960).
R E S U L T S A N D D I S C U S S I O N
The hydrothermal transformation of the Al-interlayered Garfield nontronite leads to the formation of kaolinite and hematite. On opening the teflon capsules, most of the free iron oxide phase appeared as a distinct suspension of reddish colour covering a light purple solid deposit composed of kaolinite, unreacted nontronite and possibly some hematite. Thus a

XRD, IR and ESR o f altered clays 619
simple decantation enabled a first concentration of the solid phase which was then submitted to the oxalate-UV treatment resulting in the disappearance of the purple colour.
E M micrographs
Fig. 1 illustrates the particle morphology of the synthetic products. The shape of the synthetic kaolinites closely resembles that of either natural kaolinites or natural 1:1/2:1 mixed-layer clays (see e.g. Schultz et al., 1971): thin pseudo-hexagonal platelets are observed. Such morphologies are quite different from those reported for synthetic kaolinites obtained by the hydrothermal transformation of aluminosilicate gels (Rodrique et al., 1972; Angel et al., 1975) but their small size (i.e. <0.5 #m) is in the same range.
FIG. 1. TEM photograph of the synthetic undeferrated products obtained after 15 days hydrothermal treatment.
X R D patterns
Fig. 2 presents the XRD patterns of Garfield Nontronite (Na+-nontronite), the chloritized nontronite (A1-OH N) and the hydrothermal products obtained after 1, 2, 4, 8, and 15 days (NK1 . . . . NK15). The hydrothermal alteration sequence clearly shows the rapid and progressive disappearance of the typical 001 reflection due to the chloritized nontronite. After 1 day (NK1), a broad diffraction band appears at ~8.8 A; the 6.1 and 3.16 A diffraction peaks can be attributed to the 020 and 120 reflections, respectively, of boehmite, the appearance of which can be related to the demixing of A1 hydroxide during the hydrothermal alteration of the chloritized smectite (Oberlin & Couty, 1970). These boehmite reflections disappear with prolonged treatment. After 2 or more days of alteration, the main XRD features consist of intense, but often broad and asymmetric reflections close to 7 and 3.5 A. In all cases, however, these reflections have positions slightly different from the basal reflections of kaolinite; they shift during the treatment from 7.8 to 7.4 A, and from 3.5 to 3-54 A, indicating the presence of 1:1/2:1 mixed-layer clays.

620 B. Delvaux et al.
NK15
t
N K 8
t N K 4
t
N K 2
t
NK1
r . ~ r ~ . , . . . , ~ , , ~ Na+_Nontronite
FIG. 2. XRD patterns of air dried, oriented samples of Garfield nontronite and oxalate-UV deferrated Na+-clay samples produced after A1-OH interlayering (A1-OH N) and 1, 2, 4, 8 and 15
days hydrothermal treatment (NK1 . . . . NK15).
Fig. 3 shows the sequence of X-ray traces obtained when the clays are subjected to chemical and thermal treatments which, according to Cradwick & Wilson (1972), should generate the diagnostic criteria for the identification of mixed-layer kaolinite/smectite clays. Although the starting material is a chloritized nontronite (2:1:1 clay), all the X-ray reflections in the 7.4-8.4/k region can be related to those characteristic for kaolinite/smectite interstratified clays, i.e. the combined reflections 001K/002 Sm-EG after glycolation, and 001K/001Sm after heating at 225~ (Cradwick & Wilson, 1972). Comparison of Fig. 2 and 3 shows that the combined reflections shift to smaller values after glycolation, i.e. from 001/001 (7/12.6 .A) to 001/002 (7/8.5 /~) system. Such a shift shows the expandible character of the 2 : 1 component, suggesting the presence of smectite rather than chloritized nontronite in the 1:1/2:1 phase. This interpretation agrees with (i) the positions of the combined reflections after heating at 225~ and (ii) the demixing of the AI hydroxide during the hydrothermal alteration of the chloritized nontronite, as mentioned above.
Smectite proportions in the mixed-layer clays can be estimated from the peak migration curves computed by Cradwick & Wilson (1972) after glycolation (7/8.5 A) and/or heating

XRD, IR and ESR of altered clays 621
r13r
NK15 " ~ 749 737 ' i
NK8
r 2_5 NK4
r/- ~ j 61
NK1
l 14 2 4g
EG 225 *C 550"C
FIG. 3. XRD patterns of oriented samples of deferrated clay samples produced after 1, 2, 4, 8 and 15 days hydrothermal treatment and submitted to EG and thermal treatments.
(7/10/k). In this case, however, using the first system (7/8-5 tk) would probably underestimate the content of smectite because the complex Garfield nontronite-EG has a small basal spacing (16-6 A, ~rodofi, 1980a), and hence the second system should be more reliable. Plotting the position of the combined reflections (225~ in the above mentioned peak migration curve leads to the smectite contents listed in Table 1. As expected, the XRD Sm contents in the mixed-layer clay decrease with the length of alteration period and the CEC values of the clay samples.
Fig. 3 also shows that the 001 reflections of the 2 : 1 component are hardly detectable after dehydroxylation of the kaolinite layers (550~ A broad but weak diffraction band appears in the range 10-14 A, but only for samples NK2 and NK8. Such features, for which no clear

622 B. Delvaux et al.
TABLE 1. Smectite contents inferred from XRD and ESR, and CEC of the deferrated clay samples.
Smectite contents
CEC XRD ESR Sample (mEq/100 g clay) (~) (~)
N 97 100 100 A1-OH N 60 -- -- NK1 35 40 35 NK2 32 35 38 NK4 21 20 24 NK8 17 15 17 NK15 16 15 11
explanation seems to be presently available, have often been observed for natural 1:1/2:1 mixed-layer clays (see e.g. Herbillon et al., 1981; Quantin et al., 1984, and the references therein).
F T I R spectra
FTIR spectra also illustrate the progressive alteration of chloritized nontronite during the hydrothermal treatment (Fig. 4). The main variations in the spectra with the treatment period occur in well defined regions associated with the OH-stretching and librational vibrations characteristic of 1 : 1 and 2 : 1 clay minerals.
3800-3200 cm -1 region. The OH-stretching vibrations in the chloritized Garfield nontronite give rise to intense IR absorption at 3560 cm -1 (Goodman et al., 1976), and this is consistent with Fe3+Fe3+OH being the predominant grouping in the octahedral sheet (Farmer, 1974). Higher frequency IR bands also appear at 3690 and 3620 cm -1. As smaller bands do not appear in the spectrum of the initial Garfield nontronite, both untreated and oxalate treated, (results not shown), they are likely due to the stretching vibrations of OH groups of the A1 interlayer material (Brydon & Kodama, 1966; Weismiller et al., 1967).
As the kaolinitization process proceeds, the 3560 cm -~ absorption band remains clear for the hydrothermal products NK1, NK2, but with a much lower intensity, while the presence of boehmite in sample NK 1 is confirmed by the IR absorption at 3280 cm-I (Farmer, 1974). A very weak absorption at 3560 cm -1 is still noted for sample NK4 but it can no longer be distinguished from the background for samples NK8, NK 15, i.e. for samples that, according to the estimates in Table 1, contain < ~ 20~ Fe-smectite. Simultaneously, high frequency IR bands appear at 3697 and 3622 cm -~ with the 'absorption doublet' 3670-3655 cm -~ which is particularly clear in sample NK15. All these IR absorption bands are typical for kaolinite (Farmer, 1974).
For all the IRspectra related to the kaolinitized smectite (NK1 to NK15), the 3620 cm -1 absorption band presents a distinct shoulder at 3600 cm -~ which has been assigned to A1Fe3+OH octahedral groups in kaolinite (Mendelovici et al., 1979). It is worth noting that similar features were reported to occur in the IR spectra of Fe-rich kaolinites, both natural (Brindley et al., 1986; Muller & Bocquier, 1987) and synthetic (Petit et al., 1988).

XRD, IR and E SR of altered clays 623
36197
3622
/3SO0
NK15 ~ I
NK8 I
T . . . .
NK 4
i [
T " I
I
L/3s6o
NK2 J ~ - ~ I
I I
t i
h i 32Bo
NK1 I
~o
AI - OH N
] I L I
3800 3200
e77 9 3 5 ~ 9 1 'IA'
i 79~ 702
I eso
I
I
I i
I
s e o sl s
i i i i i i i i i
1000 60o 900 750
WAVENUMBER cm -1
FIG. 4. FTIR spectra of deferrated clay samples A1-OH N and NKI . . . . NK15.
760-960 cm -1 region. The A1-OH N spectrum shows a clear absorption at 818 cm -1 due to the libration of octahedral Fe3§ groups in nontronite (Farmer, 1974; Goodman et al., 1976). Towards the higher frequencies, the weaker bands at 850-880 cm -1 are thought to be associated with the librations of AIFe+3OH groups in 2:1 layers (Serratosa, 1960); the 850 cm-~ absorption band may also be assigned to A1MgOH groups (Farmer, 1974; Goodman et al., 1976). Towards lower frequencies, the distinct inflection at 785 cm -t has been attributed to Fe3+MgOH octahedral groups in nontronite (Goodman et al., 1976).
In Fig. 4, the evolution of the IR spectra with the duration of the hydrothermal treatment shows a rapid disappearance of typical IR features of nontronite in the 760-960 cm-1 region. After 1 day (NK 1), the proportion of smectite is ~ 40~ (Table 1). Nevertheless, the IR band at 810-820 cm-1 only appears as a weak shoulder of a lower frequency absorption band, while very weak IR bands around 850-880 cm -~ are scarcely observed. In contrast, an intense absorption band at 912 cm -1 with a shoulder at 935 cm -1 due to the libration of A1A1OH octahedral groups in kaolinite (Farmer, 1974) is noticeable in sample NK1. The resolution of these bands improves as Fe-smectite content further decreases in the 1:1/2:1 mixed-layer clays (NK2, NK4 . . . . ).

624 B. Delvaux et aL
The process of kaolinitization is well illustrated by the progressive appearance of all the IR features typical for this mineral. They show that, at the end of the process, the kaolinite forming is well ordered. However, and in spite of the fact that the characteristic IR features of nontronite and kaolinite occur in distinct and non-overlapping areas of their spectra, IR spectroscopy does not seem to be sensitive enough to detect relatively important amounts (i.e.
30~) of Fe-smectite in the products. This observation, which is also in line with those reported by Srodofi (1980b) for a similar system, may be due to different causes. The hydrothermal treatment may affect the hydroxylic structure of nontronite and then suppress the vibrations of the characteristic OH groups. The oxalate-UV treatment probably extracts some silicated iron from the 2:1 layers (de Endredy, 1963; Brigatti, 1983). Besides, Rousseaux (1978) has also documented the relatively poor sensitivity of IR spectroscopy to detect 2:1 clays admixed with kaolinite.
NK6O
T NK15
1 NK8
1 NK4
1 NK2
1 NK1
1 AI-DH N
g-4 g-2 gain
I ! x 10 3
!
0.8
1.6
0.8
0.63
0.32
_ _ _ J J 02=
~ ~ 0.16
MAGNETIC FIELD H
FIo. 5. ESR spectra of deferrated clay samples AI-OH N and NK1 . . . . NK15 and NK60.

X R D , 1R and E S R o f altered clays 625
E S R measurements
The features of the ESR spectra can also be used to follow the kaolinitization process (Fig. 5). As the length of the hydrothermal treatment increases, the intensity of the g4 bands characterizing kaolinite increases relative to the broad g2 band assigned to Fe-smectite.
The g4 bands can be attributed to isolated Fe 3+ ions in the octahedral sheet of kaolinite (Angel et al., 1974; Jones et al., 1974; Meads & Malden, 1975; Herbillon et al., 1976; Mestdagh et al., 1980). The broader g2 band is associated with Fe 3+ ions in adjacent structural sites in nontronite as observed in other Fe-bearing 2 : 1 clay minerals (e.g. Olivier et al., 1975; Goodman et al., 1988). The g2 ESR signal can not be attributed to a free iron oxide phase as the clay samples were deferrated. In fact, Fig. 6 illustrates that the ESR spectra obtained from the oxalate-treated sample NK15 show no change after one or two additional treatment(s) to remove iron. Moreover, comparing the ESR spectra of the oxalate treated samples (NK 15) with the one resolved on the same untreated clay suggests that the presence of free iron oxides does not significantly affect the shape and intensity of the g2 ESR signal, in spite of huge differences in total Fe content, as measured in the untreated sample and the deferrated ones (Fig. 6). This is due to the fact that the hematite particles give rise to a g2 signal with a huge line-width not detectable in the scanning conditions used. Consequently, the g2 signal appearing in Fig. 5 is assigned to the Fe 3+ cations in Fe-smectite only. This band still appears as an intense signal even for the clay produced after 60 days treatment, which has a very low smectite content (~ 5~).
An attempt was made to calibrate quantitatively the g2 ESR signal in terms of both Fe content in 2 : 1 layers and smectite content in the treatment products. The area of the g2 band
3x oxalate
2 x oxalate
l x oxalate
untreated
g-4 g-2 gain
L ~ , 1D 3
1.6
1,6
1.6
1000 G
Fe2O 3 %
1 1.93
2 0 8
2 9 8
26.31
MAGNETIC FIELD
FIG. 6. ESR spectra of clay sample NK15 performed without any treatment to remove iron, and after 1, 2 and 3 oxalate-UV treatment(s). Evolution of related total Fe contents.

626 B. De lvaux et al.
(So2) w a s calculated from the product of the intensity and the square of line width peak to peak in arbitrary units (Mestdagh et al., 1980) for both the untreated and the deferrated clays. Fig. 7 is a plot of the calculated area of the g2 band ($9'2) vs. total Fe content as determined by chemical analysis. As far as the oxalate treated clays are concerned, this graph shows a close relationship between both parameters S02 and ~Fe203 (r = 0-997). However, for the untreated run products, $9'2 seems to be independent of total Fe content. As mentioned above for sample NK15, this observation confirms that the presence of iron oxides in all the run products does not affect significantly the morphology of the g2 ESR signal.
Both Figs. 7 and 5 indicate that, as the duration of the experimental alteration increases, the kaolinitization process parallels (i) the regular decrease of $9'2 and structural Fe content, and (ii) the concomitant increase of the g4 band. Fig. 7 further suggests that structural Fe content in smectite can be estimated from the 89, 2 parameter through a calibration procedure (dotted line in Fig. 7) using the oxalate-treated nontronite as the reference point. The oxalate- UV treatment causes a sharp decrease in the Fe203 content of Garfield nontronite, from 33.4 to 17.3~ (Fig. 7). Since the run products have been treated similarly, the interstratified 2:1 mineral is probably no longer a true nontronite.
The calibration procedure leads to the estimation of the Fe content in smectite and kaolinite. The ESR-inferred Fe contents in 2 : 1 and 1 : 1 layers are given in Table 2, together with the total Fe content of the deferrated run products, as measured by chemical analysis. ESR-inferred Fe contents of smectite may be used to estimate smectite content in the oxalate treated clays. ESR-inferred Sm contents are given in Table 1, and agree fairly well with those
I 0 untreated
0 oxala te t reated N
r=
/ 0 0 20
~s
I/// 02
A 4 80 ~ / 0 Is
5 10 15 20 25 30 35
F[(~. 7. Relationship between the area of g2 ESR signal ($gz) and total Fe content as determined by chemical analysis. N denotes Garfield nontronite and figures refer to the number of days of hydrothermal treatment, i.e. 0 denoting A1-OH N and 1 , . . . 15 referring to N K ] . . . . NK15 samples, respectively. The regression line is computed for the oxa]ate-treated clays: the dotted
line is a calibration line est imating the structural Fe content of smectite.
estimated from XRD data, both ESR- and XRD-inferred Sm contents decreasing with CEC. The ESR-inferred Fe contents of the synthetic kaolinites, reported in Table 2, appear to be in the range of those previously reported for natural kaolinites (Mestdagh et al., 1980). Nevertheless, they are somewhat lower than those observed for disordered Fe-rich kaolinites from tropical soils (Herbillon et al., 1976).

XRD, IR and ESR of altered clays 627
TABLE 2. Total iron contents (oven dried basis, 105~ of the deferrated clays, as measured by chemical analysis, and iron distribution in smectite (Sm) and kaolinite (K), as inferred from ESR measurements. (K-Fe203 % = total Fe203 ~oo - Sm- Fe203 ~oo).
Total Fe203 Sm-Fe203 K-Fe203 Sample (~) (~o) (~o)
N* 17.30 17.30 0-00 A1-OH N 18.80 17.32 0.00 NK1 7.74 6.10 1.64 NK2 7.66 6.66 1.00 NK4 5.10 4-20 0.90 NK8 4.10 3.03 1.07 NK15 2.98 2.00 0.98
* Deferrated nontronite.
Despite the use of an Fe-rich 2:1 layer-silicate as starting material, the kaolinitization process does not lead to the formation of 1:1 layers with high octahedral Fe. It seems, therefore, that the mechanism involved in this process involves destruction of the octahedral sheet of the nontronite layers and the subsequent formation of iron oxide and kaolinite rather than a conservative reorganization of 1 : 1 layers from the 2:1 : 1 chloritized nontronite. The destruction of the octahedral sheet of nontronite is obvious since in kaolinite, octahedral Fe atoms are isolated (g ~ 4 features). The layer charge of the Garfield nontronite is known to be almost entirely of tetrahedral origin (Suquet et al., 1987), hence the formation of uncharged kaolinite from that mineral should involve the destruction of the tetrahedral sheet as well. As already discussed by Srodofi (1980b), the hydrothermal alteration of smectite into kaolinite is therefore more comparable to neoformation (sensu Millot, 1964) than to transformation.
Similar results were obtained when kaolinite was formed through the hydrothermal treatment of other smectites (Camp-Berteau montmoriUonite, Rohton beidellite). Analogous evolutions were recorded by ESR spectra and estimated Fe contents of the kaolinites produced were in a similar range (results not shown).
In conclusion and in contrast with IR spectroscopy, ESR proves to be useful not only in following the kaolinitization process but also in tracing the progressive disappearance of Fe-smectite up to a stage where a few percent of smectite remains.
A P P L I C A T I O N OF E S R S P E C T R O S C O P Y T O N A T U R A L 1 : 1 / 2 : 1 M I X E D - L A Y E R C L A Y M I N E R A L S
The ESR features related to the synthetic kaolinite/Fe-smectite mixed-layer clays reveal the high sensitivity of ESR spectroscopy as an Fe probe for detecting Fe-smectite in 1:1/2:1 mineral mixtures or interstratified systems. Such a probe was applied to natural deferrated clays extracted from selected horizons of a tropical pedon, in which smectite weathers into kaolinite as the soil surface is approached. These soil clays have already been characterized (Herbillon et al., 1981). Smectite is the dominant clay in the C horizon but kaolinite is also
628 B. Delvaux et al.
g-4 g-2 gain ! & l
B21 ~ 8,0 15-30 cm
:!;o 1,, 3 e m
. . . .
3 0 0 cm
D H
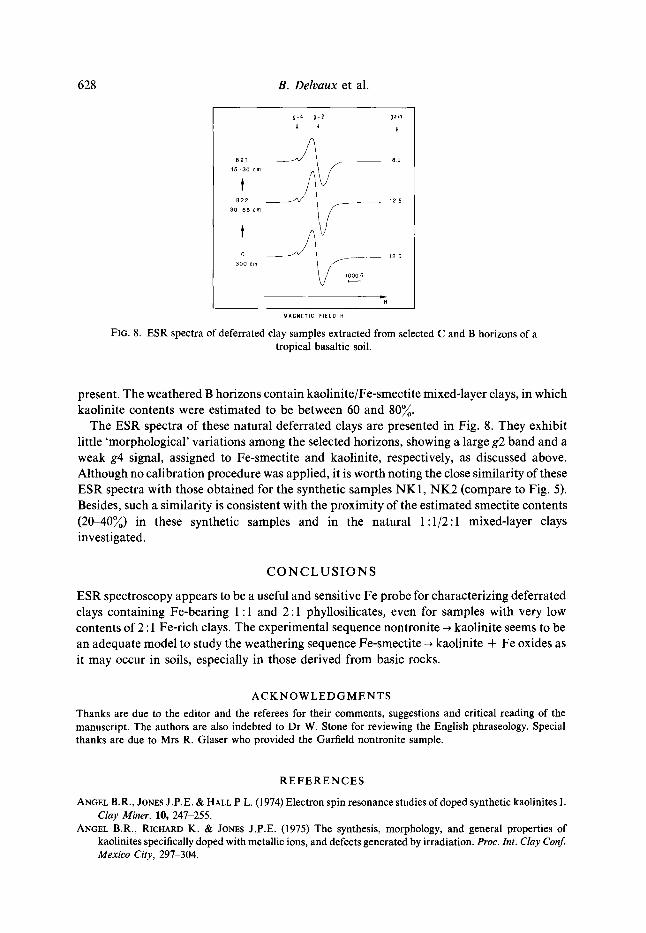
MAGNETIC FIELD H FIG. 8. ESR spectra of deferrated clay samples extracted from selected C and B horizons of a
tropical basaltic soil.
present. The weathered B horizons contain kaolini te/Fe-smecti te mixed-layer clays, in which kaolinite contents were est imated to be between 60 and 80~.
The ESR spectra of these natural deferrated clays are presented in Fig. 8. They exhibit little 'morphological ' variations among the selected horizons, showing a large g2 band and a weak g4 signal, assigned to Fe-smectite and kaolinite, respectively, as discussed above. Although no cal ibrat ion procedure was applied, it is worth noting the close similari ty of these ESR spectra with those obtained for the synthetic samples NK1, N K 2 (compare to Fig. 5). Besides, such a similari ty is consistent with the proximity of the est imated smectite contents (20-40~) in these synthetic samples and in the natural 1:1/2:1 mixed-layer clays investigated.
C O N C L U S I O N S
ESR spectroscopy appears to be a useful and sensitive Fe probe for characterizing deferrated clays containing Fe-bear ing 1:1 and 2:1 phyllosilicates, even for samples with very low contents of 2 : 1 Fe-r ich clays. The experimental sequence nontronite - kaolinite seems to be an adequate model to study the weathering sequence Fe-smecti te --, kaolinite + Fe oxides as it may occur in soils, especially in those derived from basic rocks.
A C K N O W L E D G M E N T S
Thanks are due to the editor and the referees for their comments, suggestions and critical reading of the manuscript. The authors are also indebted to Dr W. Stone for reviewing the English phraseology. Special thanks are due to Mrs R. Glaser who provided the Garfield nontronite sample.
REFERENCES
ANGEL B.R., JONES J.P.E. & HALL P.L. (1974) Electron spin resonance studies of doped synthetic kaolinites I. Clay Miner. 10, 247-255.
ANGEL B.R., RICHARD K. & JONES J.P.E. (1975) The synthesis, morphology, and general properties of kaolinites specifically doped with metallic ions, and defects generated by irradiation. Proc. Int. Clay Conf. Mexico City, 297-304.

XRD, IR and ESR of altered clays 629
B~NHISEL R.I. & RICH C.I. (1963) Gibbsite formation from aluminum-interlayers in montmorillonite. Soil Sci. Soc. Am. Proc. 27, 632-635.
BRIGAYrI M.F. (1983) Relationships between composition and structure in Fe-rich smectites. Clay Miner. 18, 177-186.
BRINDLEY G.W., KAO C.C., HARRISON J.L., LIPSICAS M. & RAYTHATHA R. (1986) Relation between structural disorder and other characteristics of kaolinites and dickites. Clays Clay Miner. 34, 239-249.
BRYDON J.E. & KOD~daA H. (1966) The nature of aluminum hydroxide-montmorillonite complexes. Am. Miner. 51, 875-889.
CRADWlCK P.D. & WILSON M.J. (1972) Calculated X-ray diffraction profiles for interstratified kaolinite- montmorillonite. Clay Miner. 9, 395-405.
CRAIG D.C. & LOUGHNAN F.C. (1964) Chemical and mineralogical transformations accompanying the weathering of basic volcanic rocks from New South Wales. Aust. J. Soil Res. 2, 218-234.
DE ENDREDY A.S. (1963) Estimation of free iron oxides in soils and clays by a photolytic method. Clay Miner. Bull. 5, 209-217.
FARMER V.C. (1974) The Infrared Spectra of Minerals. Mineralogical Society, London. GOODMAN B.A., NADEAU P.H. & CHADWICK J. (1988) Evidence for the multiphase nature of bentonites from
M6ssbauer and EPR spectroscopy. Clay Miner. 23, 147-159. GOODMAN B.A., RUSSELL J.D. & FRASER A.R. (1976) A M6ssbauer and I.R. spectroscopic study of the
structure of nontronite. Clays Clay Miner. 24, 53-59. HERBILLON A.J., FRANKART R. & VIELVOYE L. (1981) An occurrence of interstratified kaolinite-smectite
minerals in a red-black soil toposequence. Clay Miner. 16, 195-201. HERBILLON A.J., MESTDAGH M.M., VIELVOYE L. & DEROUANE E.G. (1976) Iron in kaolinite with special
reference to kaolinite from tropical soils. Clay Miner. 11, 201-220. JONES J.P.E., ANGEL B.R. & HALL P.L. (1974) Electron spin resonance studies of doped synthetic kaolinites II.
Clay Miner. 10, 257-269. MACKENZIE R.C. (1952) A micromethod for determination of cation exchange capacity of clays. Clay Miner.
Bull. 1, 203-205. MEADS R.E. & MALDEN P.J. (1975) Electron spin resonance in natural kaolinites containing Fe 3+ and other
transition metal ions. Clay Miner. 10, 313-345. MEHRA O.P. & JACKSON M.L. (1960) Iron oxides removal from soils and clays by dithionite-citrate system
buffered with sodium bicarbonate. Clays Clay Miner. 7, 317-327. MENDELOVICI E., Y~IV SH. & VILLALBA R. (1979) Iron-bearing kaolinite in Venezuelan laterites: I. Infrared
spectroscopy and chemical dissolution evidence. Clay Miner. 14, 323-331. MESTDAGH M.M., VIELVOYE L. & HERmLLON A.J. (1980) Iron in kaolinites: II. The relationship between
kaolinite cristallinity and iron content. Clay Miner. 15, 1-13. MILLOr G. (1964) G~ologie des Argiles. Masson & Cie, Paris. MULLER J.P. & BOCQUIER G. (1987) Textural and mineralogical relationships between ferruginous nodules
and surrounding clayey matrices in a laterite from Cameroon. Proc. Int. Clay Conf. Denver, 186-194. NORRISH K. & PICKERING J.G. (1983) Clay minerals. Pp. 281-308 in: Soils: an Australian Viewpoint.
Melbourne Academic Press, London. OBERLIN A. & COUTY R. (1970) Conditions of kaolinite formation during alteration of some silicates by water
at 200~ Clays Clay Miner. 18, 347-456. OLIVIER D., VEDRINE J.C. & PEZERAr H. (1975) Application de la r~sonance paramagn&ique +lectronique ~ la
localisation du Fe 3+ dans les smectites. Bull. Gr. franf. Argiles XXVII, 153-165. PETI;r S., DECARREAU A., EYMERY J.P. & THOMASSIN J,H. (1988) Synth~se de kaolinites ferriques gt 200~
Comparaison avec les kaolinites d'alt6ration superg~ne: teneur en fer, morphologie, cristaUinit6. C.R. Acad. Sc. Paris, T 307, s~rie II, 1961-1966.
PO~CELET G.M. & BRINDLEu G .W. (1967) Experimental formation of kaolinite from montmoriUonite at low temperature. Am. Miner. 52, 1161-1173.
QUANTIN P., HERBILLON A.J., JANOr C. & SIErrER~NN G. (1984) L'"halloysite" blanche riche en fer de Vate (Vanuatu). Hypoth~se d'un +difice interstratifi+ halloysite-hisingfirite. Clay Miner. 19, 629-643.
RODRIQUE L., PONCELET G. & HERBILLON A.J. (1972) Importance of the silica subtraction process during the hydrothermal kaolinitization of amorphous silico-aluminas. Proc. Int. Clay Conf. Madrid, 187-197.
ROUSSEAUX J.M. (1978) Quantitative estimation of kaolinite in sediments by differential infrared spectroscopy. Clays Clay Miner. 2,6, 202-208.
SCHULTZ L.G., SHEI'ARD A.O., BLACKMON P.D. & STARKEY H.C. (1971) Mixedqayer kaolinite- montmorillonite from the Yucatan peninsula, Mexico. Clays Clay Miner. 19, 137-150.

630 B. Delvaux et al.
SERRATOSA J.M. (1960) Dehydration studies by i.r. spectroscopy. Am. Miner. 45, 1101-1104. SRODON J. (1980a) Precise identification of illite/smectite interstratifications by X-ray powder diffraction.
Clays Clay Miner. 28, 401-411. SRODON J. (1980b) Synthesis of mixed-layer kaolinite/smectite. Clays Clay Miner. 6, 419-424. SUQUET H., MALARD C. & PEZERAT H. (1987) Structure et propri6t6s d'hydratation des nontronites. Clay
Miner. 22, 157-167. VOINOVlTCH I.A., Di~BRAS-GUEDON J. & LOUVRIER J. (1962) L'Analyse des Silicates, p. 160. Hermann, Paris. WEISmLLER R.A., AHLRICHS J.L. & WHITE J.L. (1967) Infrared studies of hydroxy-aluminum interlayer
material. Soil Sci. Soc. Am. Proc. 31, 459-463. WILSON M.J. (1987) Soil smectites and related interstratified minerals: recent developments. Proc. Int. Clay
Conf. Denver, 167-173. YIBltll~L~ B.P.K., CALHOUN F.G., SENKAYI A.L. & DIXON J.B. (1985) Occurrence of interstratified kaolinite-
smectite in El-Salvador vertisols. Soil Sci. Soc. Am. J. 49, 462-466.