xerox investor handout - amazon web...
TRANSCRIPT
Xerox Investor Handout
Xerox Strategy Overview / Quarter 3 2014 Results

Forward-Looking Statements
This presentation contains "forward-looking statements" as defined in the Private Securities Litigation Reform Act of 1995. The words
“anticipate,” “believe,” “estimate,” “expect,” “intend,” “will,” “should” and similar expressions, as they relate to us, are intended to identify
forward-looking statements. These statements reflect management’s current beliefs, assumptions and expectations and are subject to a
number of factors that may cause actual results to differ materially. These factors include but are not limited to: changes in economic
conditions, political conditions, trade protection measures, licensing requirements and tax matters in the United States and in the foreign
countries in which we do business; changes in foreign currency exchange rates; actions of competitors; our ability to obtain adequate
pricing for our products and services and to maintain and improve cost efficiency of operations, including savings from restructuring
actions and the relocation of our service delivery centers; the risk that multi-year contracts with governmental entities could be
terminated prior to the end of the contract term; the risk in the hiring and retention of qualified personnel; the risk that unexpected costs
will be incurred; the risk that subcontractors, software vendors and utility and network providers will not perform in a timely, quality
manner; our ability to recover capital investments; the risk that our Services business could be adversely affected if we are unsuccessful
in managing the start-up of new contracts; development of new products and services; our ability to protect our intellectual property
rights; our ability to expand equipment placements; the risk that individually identifiable information of customers, clients and employees
could be inadvertently disclosed or disclosed as a result of a breach of our security; service interruptions; interest rates, cost of
borrowing and access to credit markets; reliance on third parties, including subcontractors, for manufacturing of products and provision
of services; our ability to drive the expanded use of color in printing and copying; the outcome of litigation and regulatory proceedings to
which we may be a party; and other factors that are set forth in the “Risk Factors” section, the “Legal Proceedings” section, the
“Management’s Discussion and Analysis of Financial Condition and Results of Operations” section and other sections of our Quarterly
Reports on Form 10-Q for the quarters ended March 31, 2014 and June 30, 2014 and our 2013 Annual Report on Form 10-K filed with
the Securities and Exchange Commission. The Company assumes no obligation to update any forward-looking statements as a result of
new information or future events or developments, except as required by law.
2
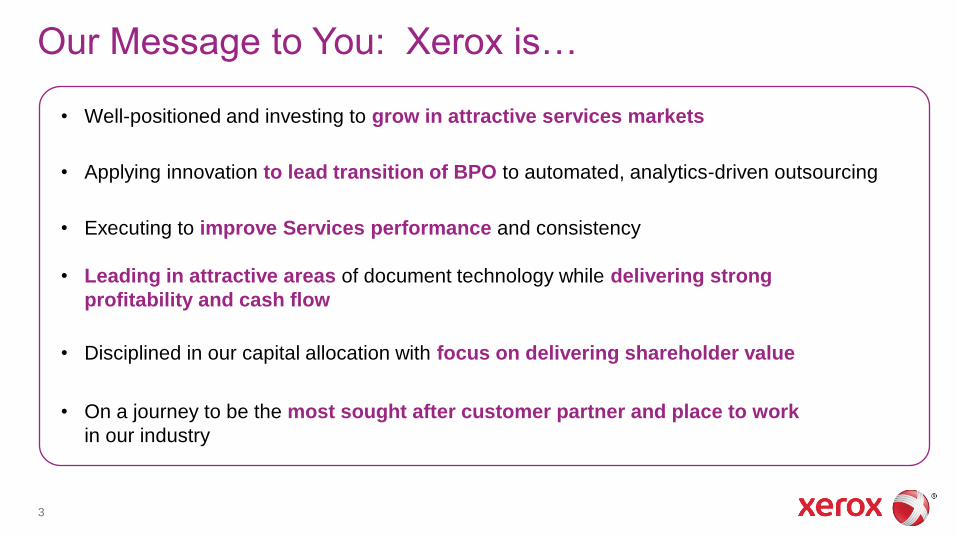
Our Message to You: Xerox is…
3
• Well-positioned and investing to grow in attractive services markets
• Applying innovation to lead transition of BPO to automated, analytics-driven outsourcing
• Executing to improve Services performance and consistency
• Leading in attractive areas of document technology while delivering strong
profitability and cash flow
• Disciplined in our capital allocation with focus on delivering shareholder value
• On a journey to be the most sought after customer partner and place to work
in our industry
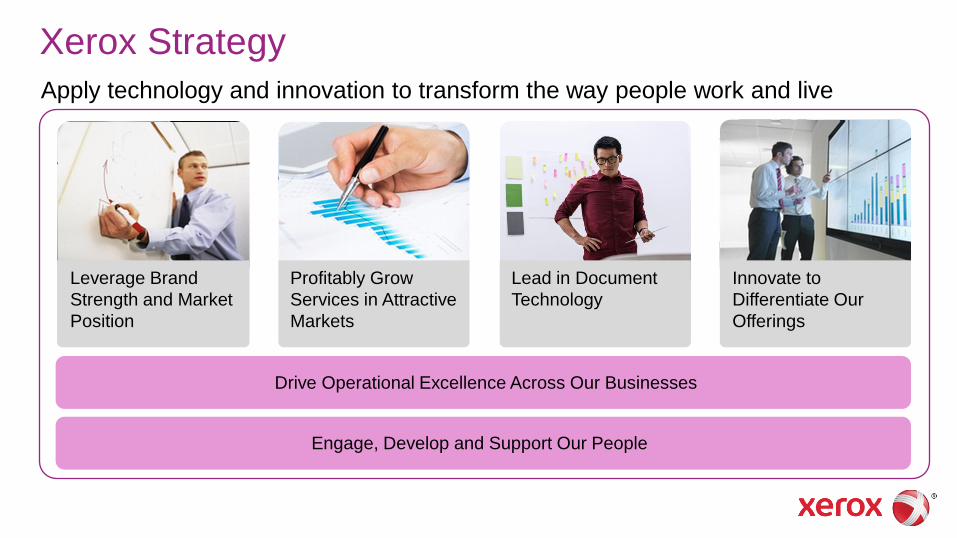
Xerox Strategy
Apply technology and innovation to transform the way people work and live
Drive Operational Excellence Across Our Businesses
Innovate to
Differentiate Our
Offerings
Leverage Brand
Strength and Market
Position
Profitably Grow
Services in Attractive
Markets
Lead in Document
Technology
Engage, Develop and Support Our People
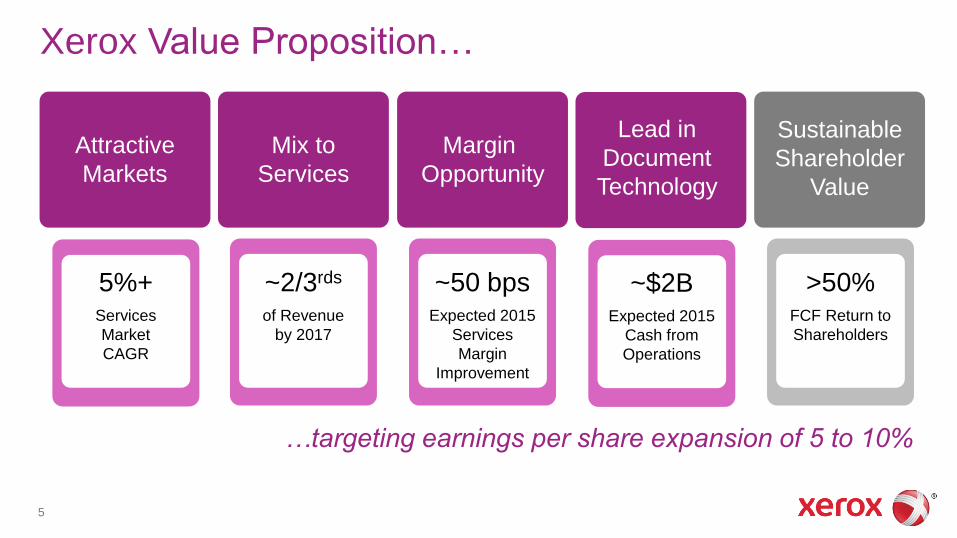
Xerox Value Proposition…
…targeting earnings per share expansion of 5 to 10%
Mix to
Services
~2/3rds
of Revenue
by 2017
Attractive
Markets
5%+ Services
Market
CAGR
Margin
Opportunity
~50 bps Expected 2015
Services
Margin
Improvement
Sustainable
Shareholder
Value
>50% FCF Return to
Shareholders
Lead in
Document
Technology
~$2B Expected 2015
Cash from
Operations
5
Document Technology
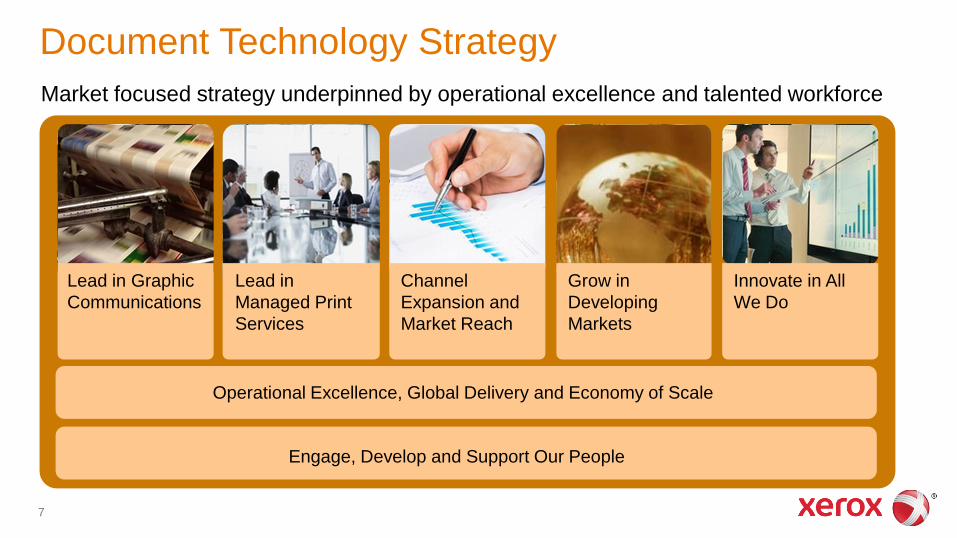
Document Technology Strategy
7
Grow in
Developing
Markets
Innovate in All
We Do
Market focused strategy underpinned by operational excellence and talented workforce
Operational Excellence, Global Delivery and Economy of Scale
Engage, Develop and Support Our People
Lead in
Managed Print
Services
Channel
Expansion and
Market Reach
Lead in Graphic
Communications
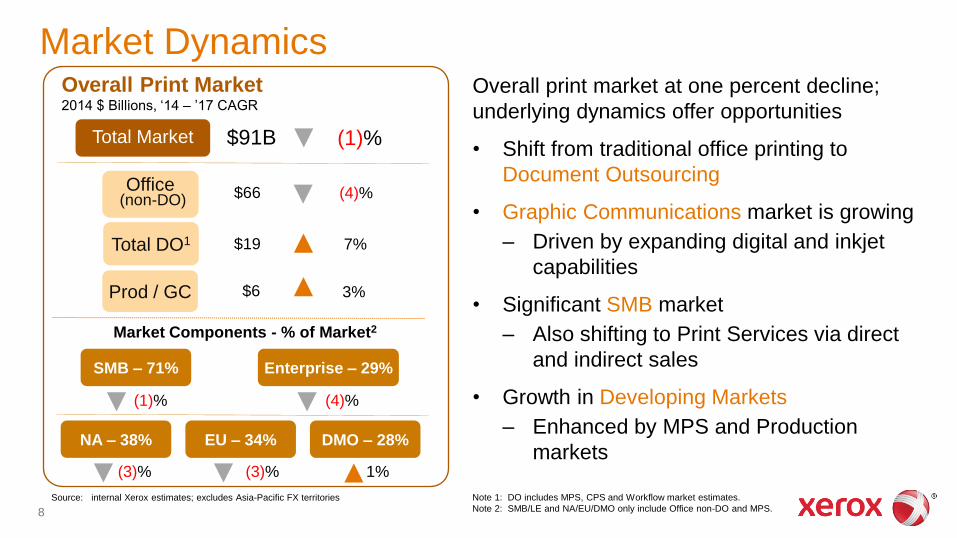
Market Dynamics
8
Overall print market at one percent decline;
underlying dynamics offer opportunities
• Shift from traditional office printing to
Document Outsourcing
• Graphic Communications market is growing
– Driven by expanding digital and inkjet
capabilities
• Significant SMB market
– Also shifting to Print Services via direct
and indirect sales
• Growth in Developing Markets
– Enhanced by MPS and Production
markets
Source: internal Xerox estimates; excludes Asia-Pacific FX territories
Overall Print Market 2014 $ Billions, ‘14 – ’17 CAGR
Office (non-DO)
Total DO1
Prod / GC
(4)%
7%
3%
$66
$19
Total Market $91B (1)%
SMB – 71% Enterprise – 29%
(1)% (4)%
$6
NA – 38% DMO – 28%
(3)% 1%
EU – 34%
(3)%
Note 1: DO includes MPS, CPS and Workflow market estimates.
Note 2: SMB/LE and NA/EU/DMO only include Office non-DO and MPS.
Market Components - % of Market2
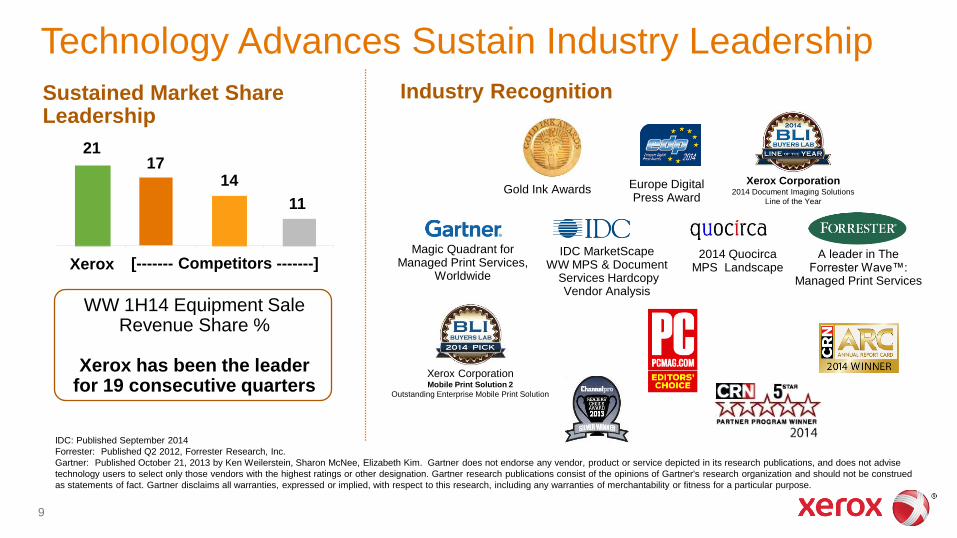
WW 1H14 Equipment Sale Revenue Share %
Xerox has been the leader
for 19 consecutive quarters
Technology Advances Sustain Industry Leadership
Sustained Market Share Leadership
Industry Recognition
Gold Ink Awards Europe Digital Press Award
Magic Quadrant for Managed Print Services,
Worldwide
IDC MarketScape WW MPS & Document
Services Hardcopy Vendor Analysis
2014 Quocirca MPS Landscape
A leader in The Forrester Wave™:
Managed Print Services
Xerox Corporation Mobile Print Solution 2
Outstanding Enterprise Mobile Print Solution
Xerox Corporation 2014 Document Imaging Solutions
Line of the Year
9
IDC: Published September 2014
Forrester: Published Q2 2012, Forrester Research, Inc.
Gartner: Published October 21, 2013 by Ken Weilerstein, Sharon McNee, Elizabeth Kim. Gartner does not endorse any vendor, product or service depicted in its research publications, and does not advise
technology users to select only those vendors with the highest ratings or other designation. Gartner research publications consist of the opinions of Gartner's research organization and should not be construed
as statements of fact. Gartner disclaims all warranties, expressed or implied, with respect to this research, including any warranties of merchantability or fitness for a particular purpose.
Xerox
21 17
14
11
[------- Competitors -------]

Market Leading Portfolio – SMB and Large Enterprise Broadest Portfolio of Print and Document Outsourcing Capabilities will enable MPS growth with the market and increased share of SMB market
15 New Workflow Offerings in 2014
Workflow Integration for Mobile and Cloud
Industry Leading Security
Cost Control and Sustainability
IT Enablers
ConnectKey®
Xerox® WorkCentre®
7845/7855
Xerox® WorkCentre®
5945/5955
Xerox® Color
C60/70
Xerox®
WorkCentre®
6655
Xerox® WorkCentre®
7220/7225
Xerox® WorkCentre®
7970
Xerox® WorkCentre® 3655
Xerox® WorkCentre®
5865/5875/5890
19 New Technology Offerings in 2014
ConnectKey®
ConnectKey®
ConnectKey®
ConnectKey®
ConnectKey®
ConnectKey®
10

Market Leading Portfolio – Graphic Communications Broadest Portfolio of Graphic Communications Offerings
to capture increased share of color growth and inkjet opportunity within the 50 trillion total production pages
Web-to-print
Variable Data Cross Media
Pre-press Color Management
Automation
7 New Workflow Offerings in 2014
Xerox® 8250 Production Printer
Xerox® Color J75 Press
Xerox® Color 800/1000 Presses
Xerox ® Versant 2100 Press
Xerox® Reference®
Xerox® CiPress® 500
Xerox® CiPress® 325
Xerox® eVolution® 150 /250
Xerox® iGen® 150 Digital Press
Xerox® Compact®
4 New Technology Offerings in 2014
11

Demonstrated Operational Excellence Across Value Chain…
Global Reach
Direct Sales Capability
Extensive Channels and
Partnerships
Broad Customer Relationships Sales Excellence and Productivity
Global Service
Remote Connectivity and Diagnostics
Global Delivery Center
Automation
Offering Innovation
Offshoring and Right-shoring
…drives sustained market share and strong operating margin.
Global Delivery
Manufacturing Productivity
Global Sourcing
Product Cost and Portfolio Simplification
RD&E Efficiency and Alignment
Infrastructure Optimization 20%
45%
31%
4%
SAG
Equipment
Post Sale
& Managed
Services
Over $9B of
Addressable Spend1
% of Total
RD&E
Note 1: Includes operating expenses for Document Technology and Document Outsourcing.
12

Services
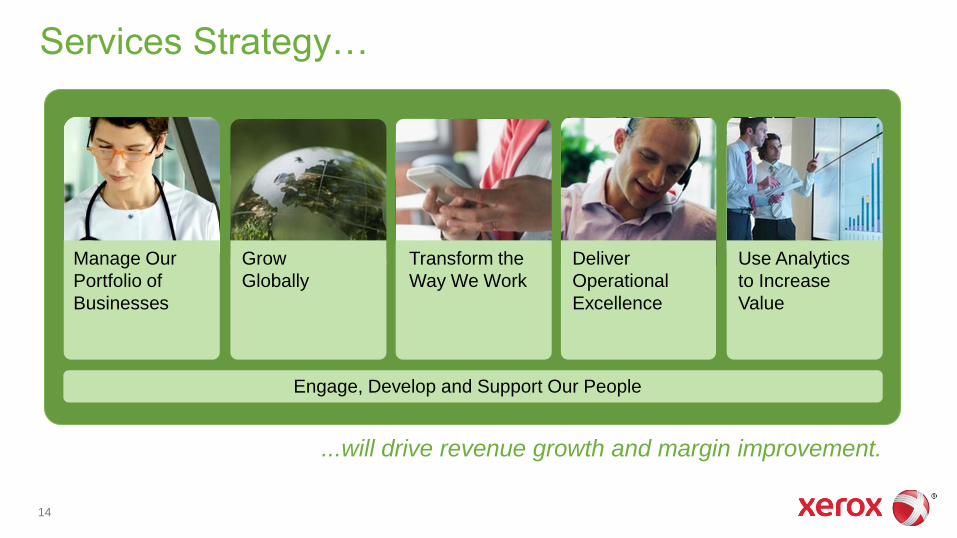
Services Strategy…
Manage Our
Portfolio of
Businesses
Grow
Globally
Transform the
Way We Work
Deliver
Operational
Excellence
Use Analytics
to Increase
Value
14
Engage, Develop and Support Our People
...will drive revenue growth and margin improvement.
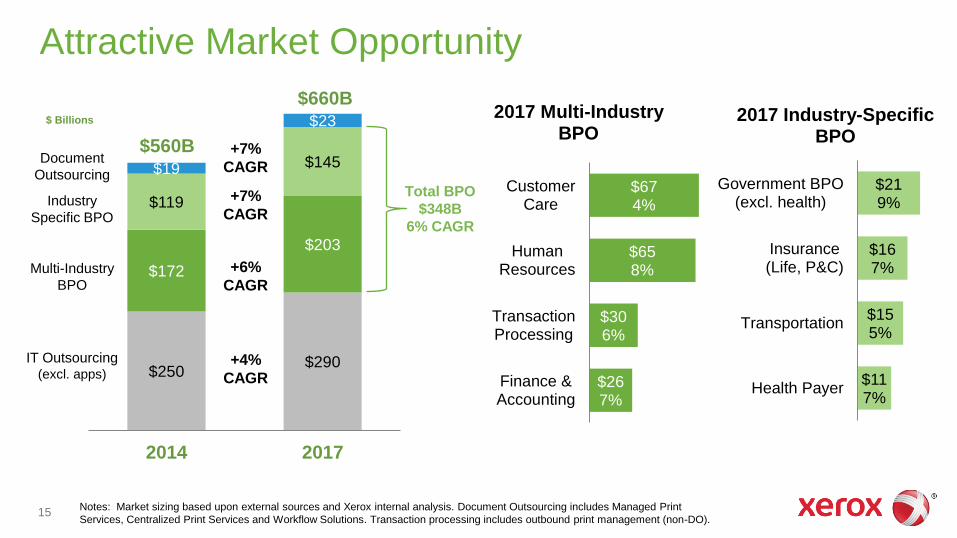
$250 $290
$172
$203
$119
$145 $19
$23
2014 2017
Attractive Market Opportunity
$26 7%
$30 6%
$65 8%
$67 4%
Finance &Accounting
TransactionProcessing
HumanResources
CustomerCare
2017 Multi-Industry BPO
Notes: Market sizing based upon external sources and Xerox internal analysis. Document Outsourcing includes Managed Print
Services, Centralized Print Services and Workflow Solutions. Transaction processing includes outbound print management (non-DO).
$ Billions
$560B
$660B
IT Outsourcing (excl. apps)
Industry
Specific BPO
Multi-Industry
BPO
Document
Outsourcing
+4%
CAGR
+7%
CAGR
+6%
CAGR
+7%
CAGR
$11 7%
$15 5%
$16 7%
$21 9%
Health Payer
Transportation
Insurance(Life, P&C)
Government BPO(excl. health)
2017 Industry-Specific BPO
Total BPO
$348B
6% CAGR
15
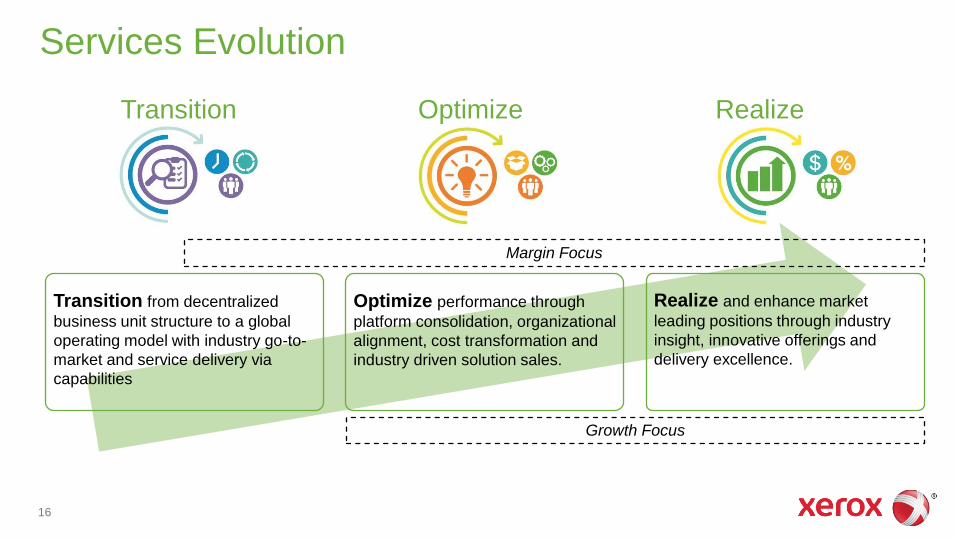
Services Evolution
Optimize Realize
Transition
16
Transition from decentralized
business unit structure to a global
operating model with industry go-to-
market and service delivery via
capabilities
Optimize performance through
platform consolidation, organizational
alignment, cost transformation and
industry driven solution sales.
Realize and enhance market
leading positions through industry
insight, innovative offerings and
delivery excellence.
Margin Focus
Growth Focus
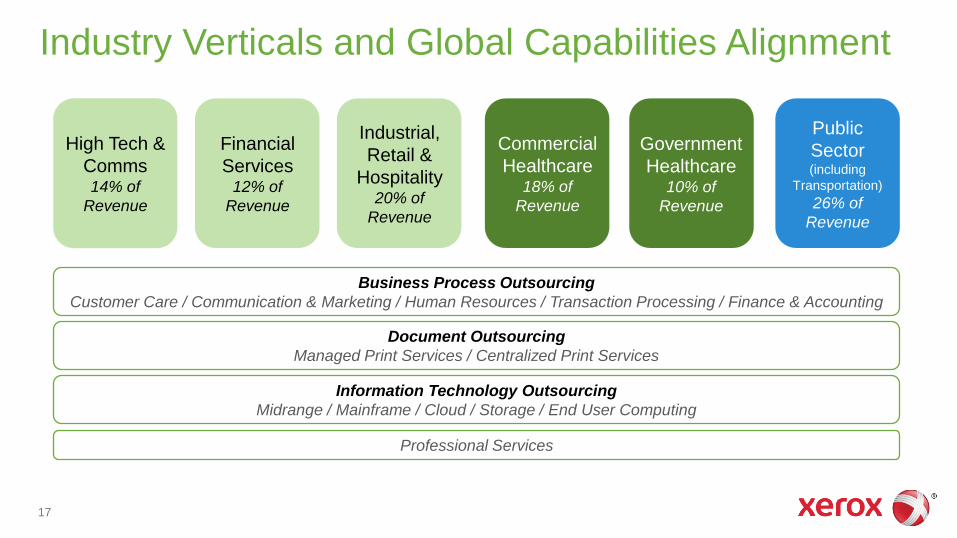
Industry Verticals and Global Capabilities Alignment
Financial
Services 12% of
Revenue
High Tech &
Comms 14% of
Revenue
Industrial,
Retail &
Hospitality 20% of
Revenue
Commercial
Healthcare 18% of
Revenue
Government
Healthcare 10% of
Revenue
Public
Sector (including
Transportation)
26% of
Revenue
Document Outsourcing
Managed Print Services / Centralized Print Services
Information Technology Outsourcing
Midrange / Mainframe / Cloud / Storage / End User Computing
Business Process Outsourcing
Customer Care / Communication & Marketing / Human Resources / Transaction Processing / Finance & Accounting
Professional Services
17
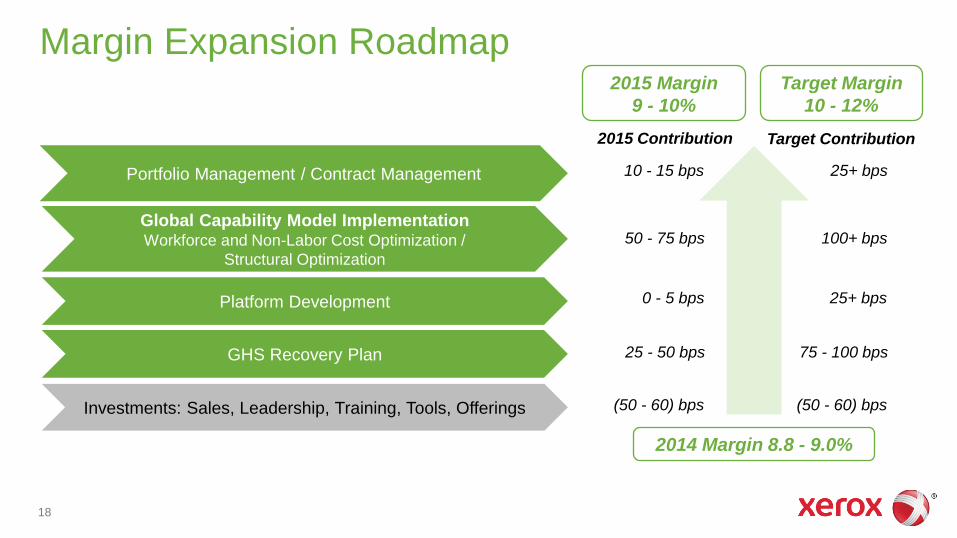
Margin Expansion Roadmap
GHS Recovery Plan
Global Capability Model Implementation Workforce and Non-Labor Cost Optimization /
Structural Optimization
Portfolio Management / Contract Management
18
2014 Margin 8.8 - 9.0%
Target Margin
10 - 12%
Investments: Sales, Leadership, Training, Tools, Offerings
10 - 15 bps
2015 Margin
9 - 10%
25+ bps
2015 Contribution Target Contribution
50 - 75 bps 100+ bps
25 - 50 bps 75 - 100 bps
(50 - 60) bps (50 - 60) bps
Platform Development 0 - 5 bps 25+ bps
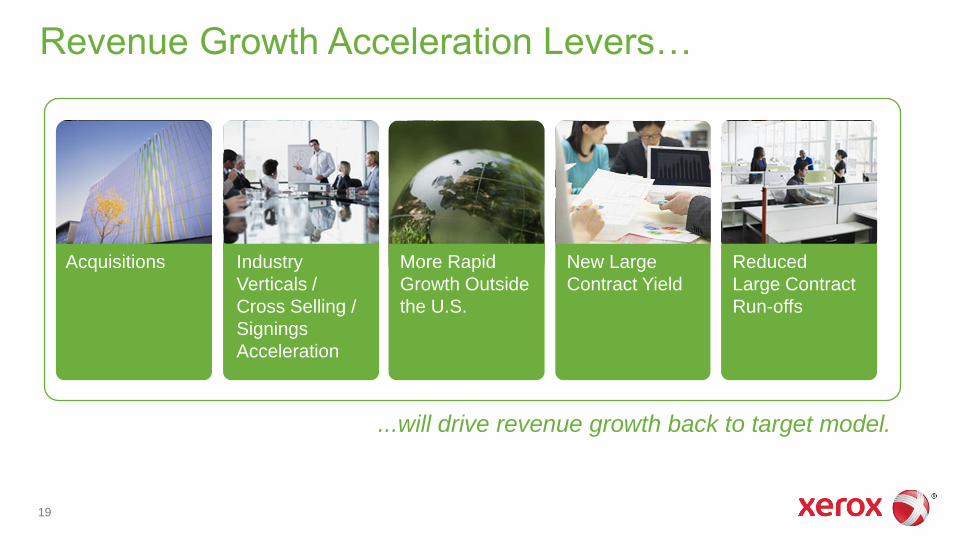
Revenue Growth Acceleration Levers…
Acquisitions More Rapid
Growth Outside
the U.S.
Industry
Verticals /
Cross Selling /
Signings
Acceleration
New Large
Contract Yield
Reduced
Large Contract
Run-offs
...will drive revenue growth back to target model.
19
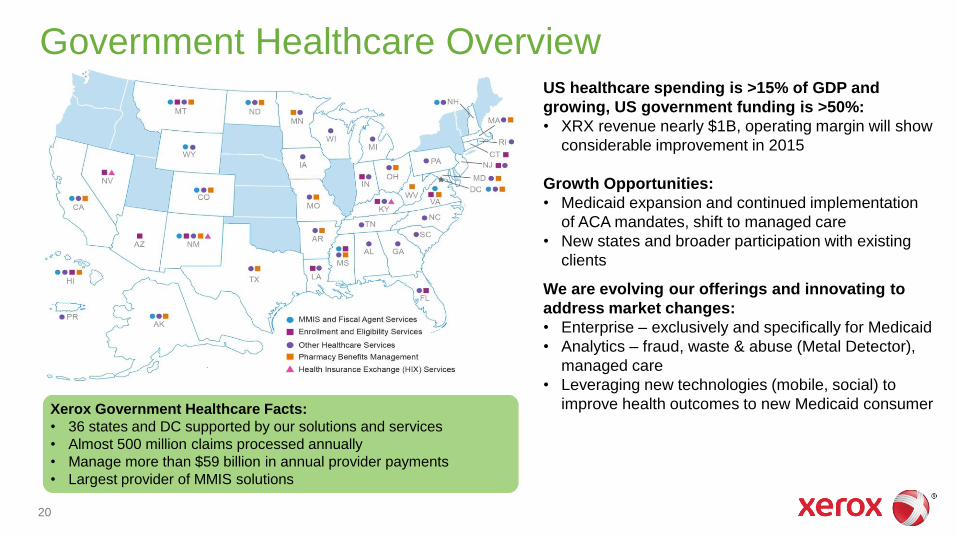
Government Healthcare Overview
Xerox Government Healthcare Facts:
• 36 states and DC supported by our solutions and services
• Almost 500 million claims processed annually
• Manage more than $59 billion in annual provider payments
• Largest provider of MMIS solutions
US healthcare spending is >15% of GDP and
growing, US government funding is >50%:
• XRX revenue nearly $1B, operating margin will show
considerable improvement in 2015
Growth Opportunities:
• Medicaid expansion and continued implementation
of ACA mandates, shift to managed care
• New states and broader participation with existing
clients
We are evolving our offerings and innovating to
address market changes:
• Enterprise – exclusively and specifically for Medicaid
• Analytics – fraud, waste & abuse (Metal Detector),
managed care
• Leveraging new technologies (mobile, social) to
improve health outcomes to new Medicaid consumer
20
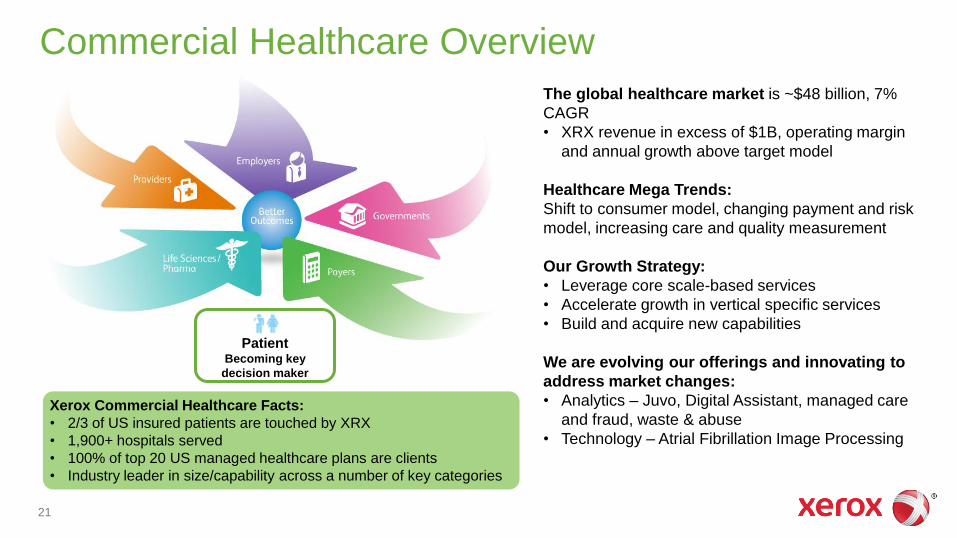
Commercial Healthcare Overview
The global healthcare market is ~$48 billion, 7%
CAGR
• XRX revenue in excess of $1B, operating margin
and annual growth above target model
Healthcare Mega Trends:
Shift to consumer model, changing payment and risk
model, increasing care and quality measurement
Our Growth Strategy:
• Leverage core scale-based services
• Accelerate growth in vertical specific services
• Build and acquire new capabilities
We are evolving our offerings and innovating to
address market changes:
• Analytics – Juvo, Digital Assistant, managed care
and fraud, waste & abuse
• Technology – Atrial Fibrillation Image Processing
Patient Becoming key
decision maker
21
Xerox Commercial Healthcare Facts:
• 2/3 of US insured patients are touched by XRX
• 1,900+ hospitals served
• 100% of top 20 US managed healthcare plans are clients
• Industry leader in size/capability across a number of key categories
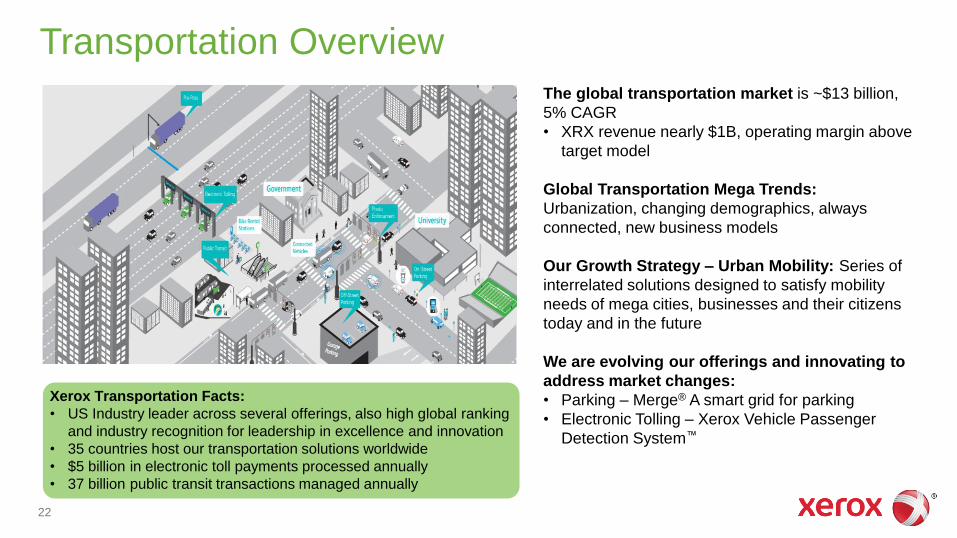
Transportation Overview
The global transportation market is ~$13 billion,
5% CAGR
• XRX revenue nearly $1B, operating margin above
target model
Global Transportation Mega Trends:
Urbanization, changing demographics, always
connected, new business models
Our Growth Strategy – Urban Mobility: Series of
interrelated solutions designed to satisfy mobility
needs of mega cities, businesses and their citizens
today and in the future
We are evolving our offerings and innovating to
address market changes:
• Parking – Merge® A smart grid for parking
• Electronic Tolling – Xerox Vehicle Passenger
Detection System™
Xerox Transportation Facts:
• US Industry leader across several offerings, also high global ranking
and industry recognition for leadership in excellence and innovation
• 35 countries host our transportation solutions worldwide
• $5 billion in electronic toll payments processed annually
• 37 billion public transit transactions managed annually
22
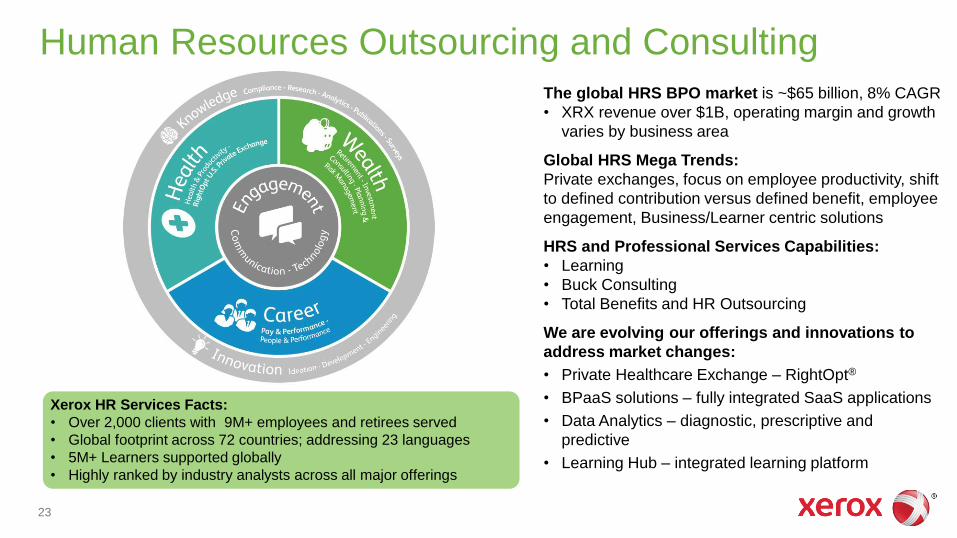
Human Resources Outsourcing and Consulting
The global HRS BPO market is ~$65 billion, 8% CAGR
• XRX revenue over $1B, operating margin and growth
varies by business area
Global HRS Mega Trends:
Private exchanges, focus on employee productivity, shift
to defined contribution versus defined benefit, employee
engagement, Business/Learner centric solutions
HRS and Professional Services Capabilities:
• Learning
• Buck Consulting
• Total Benefits and HR Outsourcing
We are evolving our offerings and innovations to
address market changes:
• Private Healthcare Exchange – RightOpt®
• BPaaS solutions – fully integrated SaaS applications
• Data Analytics – diagnostic, prescriptive and
predictive
• Learning Hub – integrated learning platform
23
Xerox HR Services Facts:
• Over 2,000 clients with 9M+ employees and retirees served
• Global footprint across 72 countries; addressing 23 languages
• 5M+ Learners supported globally
• Highly ranked by industry analysts across all major offerings
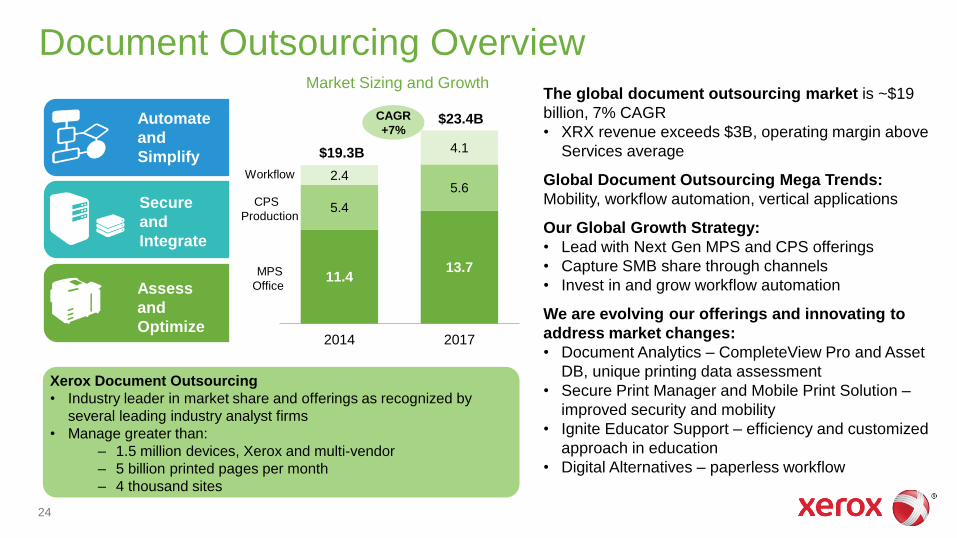
Document Outsourcing Overview
11.4 13.7
5.4
5.6 2.4
4.1
2014 2017
CAGR
+7%
$19.3B
$23.4B
Xerox Document Outsourcing
• Industry leader in market share and offerings as recognized by
several leading industry analyst firms
• Manage greater than:
– 1.5 million devices, Xerox and multi-vendor
– 5 billion printed pages per month
– 4 thousand sites
The global document outsourcing market is ~$19
billion, 7% CAGR
• XRX revenue exceeds $3B, operating margin above
Services average
Global Document Outsourcing Mega Trends:
Mobility, workflow automation, vertical applications
Our Global Growth Strategy:
• Lead with Next Gen MPS and CPS offerings
• Capture SMB share through channels
• Invest in and grow workflow automation
We are evolving our offerings and innovating to
address market changes:
• Document Analytics – CompleteView Pro and Asset
DB, unique printing data assessment
• Secure Print Manager and Mobile Print Solution –
improved security and mobility
• Ignite Educator Support – efficiency and customized
approach in education
• Digital Alternatives – paperless workflow
Automate
and
Simplify
Secure
and
Integrate
Assess
and
Optimize
Market Sizing and Growth
CPS
Production
24
MPS
Office
Workflow
Financial Overview
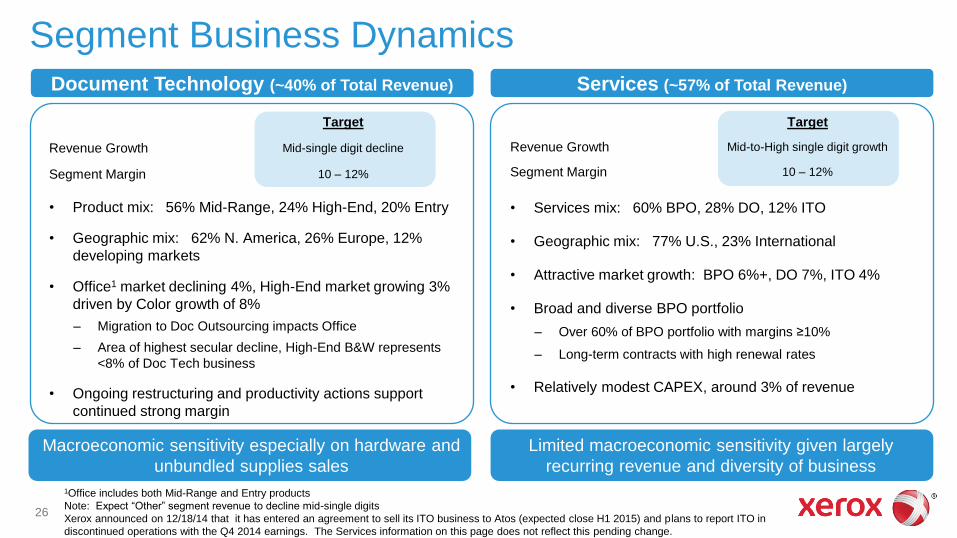
Segment Business Dynamics
Target
Revenue Growth Mid-to-High single digit growth
Segment Margin 10 – 12%
• Services mix: 60% BPO, 28% DO, 12% ITO
• Geographic mix: 77% U.S., 23% International
• Attractive market growth: BPO 6%+, DO 7%, ITO 4%
• Broad and diverse BPO portfolio
– Over 60% of BPO portfolio with margins ≥10%
– Long-term contracts with high renewal rates
• Relatively modest CAPEX, around 3% of revenue
Services (~57% of Total Revenue) Document Technology (~40% of Total Revenue)
Macroeconomic sensitivity especially on hardware and
unbundled supplies sales
Limited macroeconomic sensitivity given largely
recurring revenue and diversity of business
1Office includes both Mid-Range and Entry products
Note: Expect “Other” segment revenue to decline mid-single digits
Xerox announced on 12/18/14 that it has entered an agreement to sell its ITO business to Atos (expected close H1 2015) and plans to report ITO in
discontinued operations with the Q4 2014 earnings. The Services information on this page does not reflect this pending change.
Target
Revenue Growth Mid-single digit decline
Segment Margin 10 – 12%
26
• Product mix: 56% Mid-Range, 24% High-End, 20% Entry
• Geographic mix: 62% N. America, 26% Europe, 12%
developing markets
• Office1 market declining 4%, High-End market growing 3%
driven by Color growth of 8%
– Migration to Doc Outsourcing impacts Office
– Area of highest secular decline, High-End B&W represents
<8% of Doc Tech business
• Ongoing restructuring and productivity actions support
continued strong margin
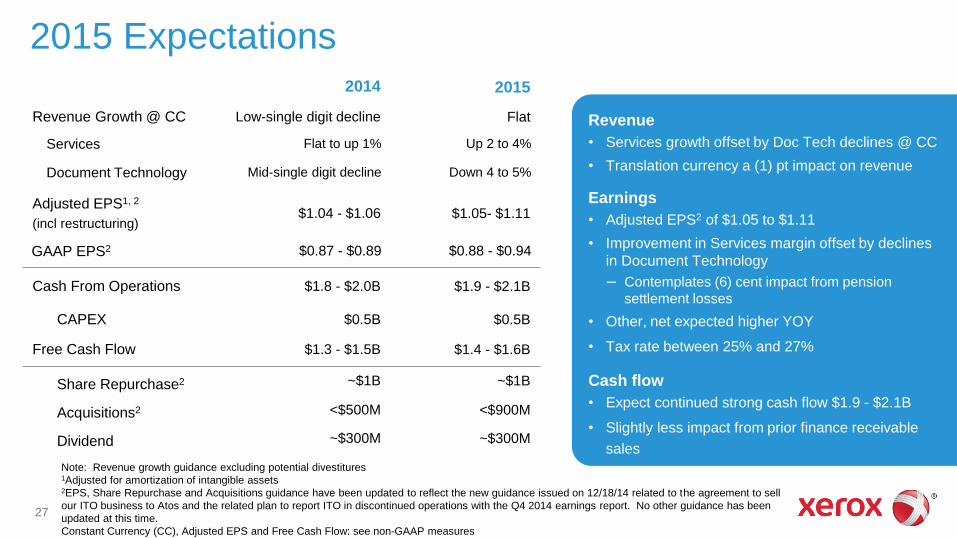
2015 Expectations
Note: Revenue growth guidance excluding potential divestitures 1Adjusted for amortization of intangible assets 2EPS, Share Repurchase and Acquisitions guidance have been updated to reflect the new guidance issued on 12/18/14 related to the agreement to sell
our ITO business to Atos and the related plan to report ITO in discontinued operations with the Q4 2014 earnings report. No other guidance has been
updated at this time.
Constant Currency (CC), Adjusted EPS and Free Cash Flow: see non-GAAP measures
27
2014 2015
Revenue Growth @ CC Low-single digit decline Flat
Services Flat to up 1% Up 2 to 4%
Document Technology Mid-single digit decline Down 4 to 5%
Adjusted EPS1, 2
(incl restructuring) $1.04 - $1.06 $1.05- $1.11
GAAP EPS2 $0.87 - $0.89 $0.88 - $0.94
Cash From Operations $1.8 - $2.0B $1.9 - $2.1B
CAPEX $0.5B $0.5B
Free Cash Flow $1.3 - $1.5B $1.4 - $1.6B
Share Repurchase2 ~$1B ~$1B
Acquisitions2 <$500M <$900M
Dividend ~$300M ~$300M
Revenue
• Services growth offset by Doc Tech declines @ CC
• Translation currency a (1) pt impact on revenue
Earnings
• Adjusted EPS2 of $1.05 to $1.11
• Improvement in Services margin offset by declines
in Document Technology
– Contemplates (6) cent impact from pension
settlement losses
• Other, net expected higher YOY
• Tax rate between 25% and 27%
Cash flow
• Expect continued strong cash flow $1.9 - $2.1B
• Slightly less impact from prior finance receivable
sales
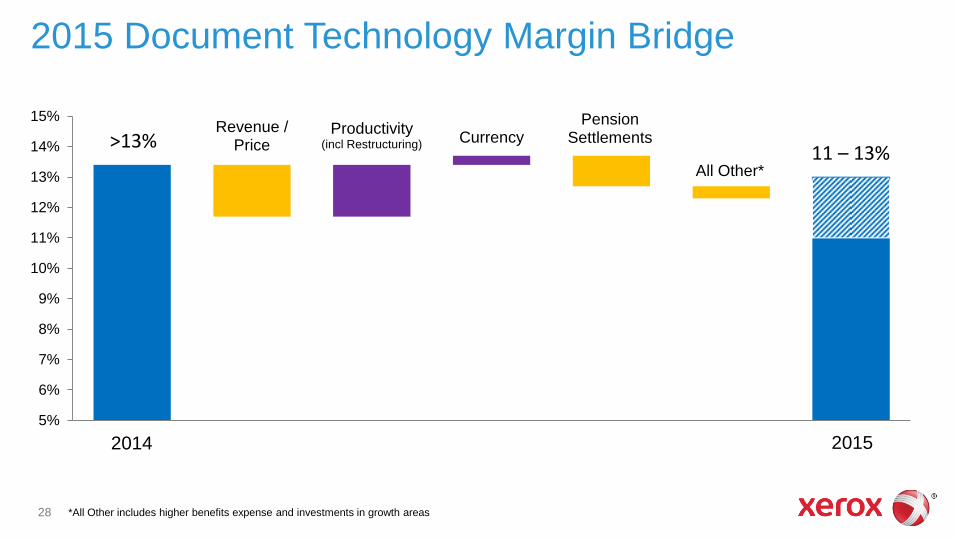
>13% 11 – 13%
Revenue / Price
Productivity (incl Restructuring)
Currency Pension
Settlements
All Other*
5%
6%
7%
8%
9%
10%
11%
12%
13%
14%
15%
2014 Productivity inclRestructuring
Pension Settlement 2015
28
2015 Document Technology Margin Bridge
2015 2014
*All Other includes higher benefits expense and investments in growth areas
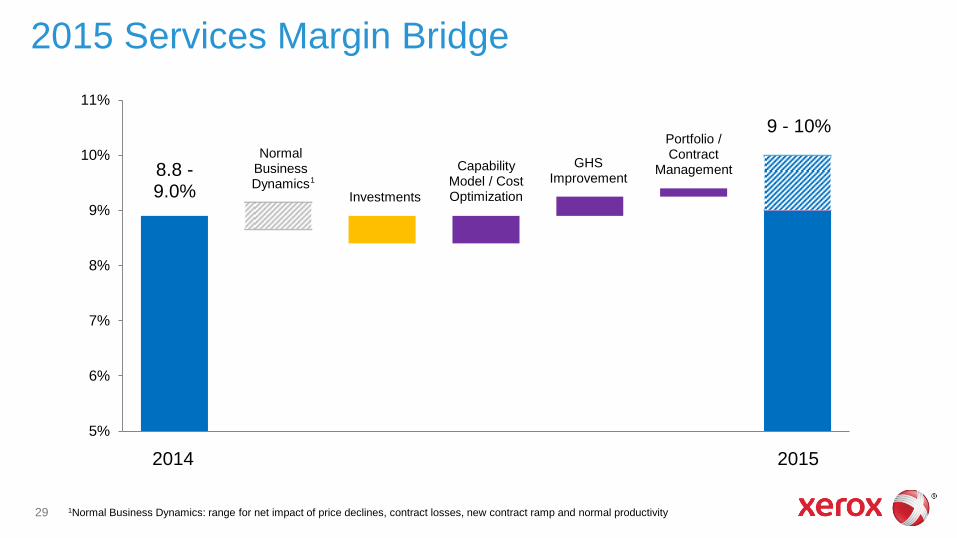
2015 Services Margin Bridge
1Normal Business Dynamics: range for net impact of price declines, contract losses, new contract ramp and normal productivity
8.8 - 9.0%
9 - 10%
Normal Business Dynamics
Investments
GHS Improvement
Portfolio / Contract
Management Capability Model / Cost Optimization
5%
6%
7%
8%
9%
10%
11%
2014 Normal businessdynamics
Investments PortfolioManagement
Govt HealthcareImprovement
Cost Optimization 20152015 2014
29
1
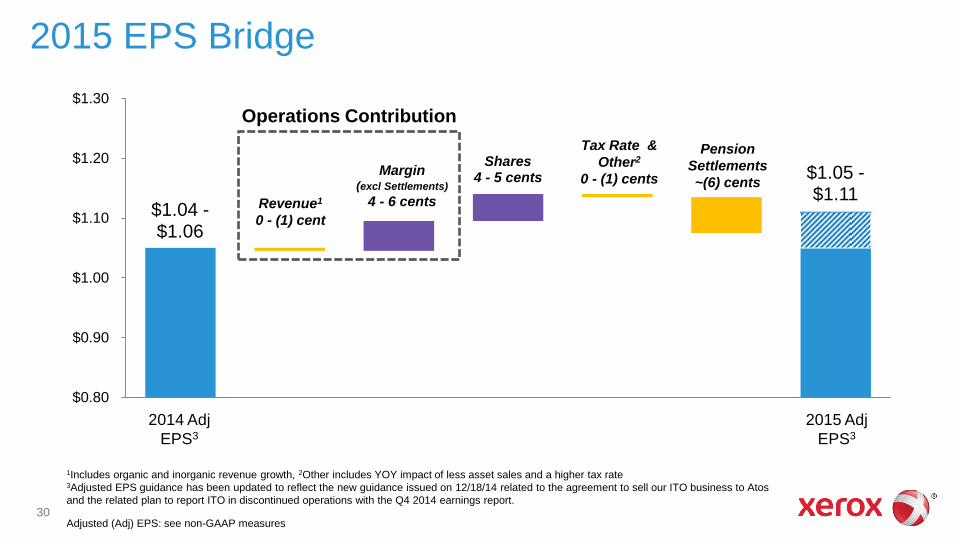
$1.04 - $1.06
$1.05 - $1.11
Shares 4 - 5 cents
$0.80
$0.90
$1.00
$1.10
$1.20
$1.30
2014 Adj EPS RevenueGrowth
Margin exclSettlements
Shares Tax Rate/Other PensionSettlements
2014 Adj EPS
Revenue1
0 - (1) cent
Pension
Settlements
~(6) cents
Tax Rate &
Other2
0 - (1) cents Margin
(excl Settlements)
4 - 6 cents
2015 EPS Bridge
1Includes organic and inorganic revenue growth, 2Other includes YOY impact of less asset sales and a higher tax rate 3Adjusted EPS guidance has been updated to reflect the new guidance issued on 12/18/14 related to the agreement to sell our ITO business to Atos
and the related plan to report ITO in discontinued operations with the Q4 2014 earnings report.
Operations Contribution
30
2014 Adj
EPS3
2015 Adj
EPS3
Adjusted (Adj) EPS: see non-GAAP measures
$0
$100
$200
$300
$400
2012 2013 2014E 2015E
DB Plan Cost DB Settlement Loss DC Plan Cost
$0
$100
$200
$300
$400
$500
2012 2013 2014E 2015E
DB Cash Contribution DB Stock Contribution
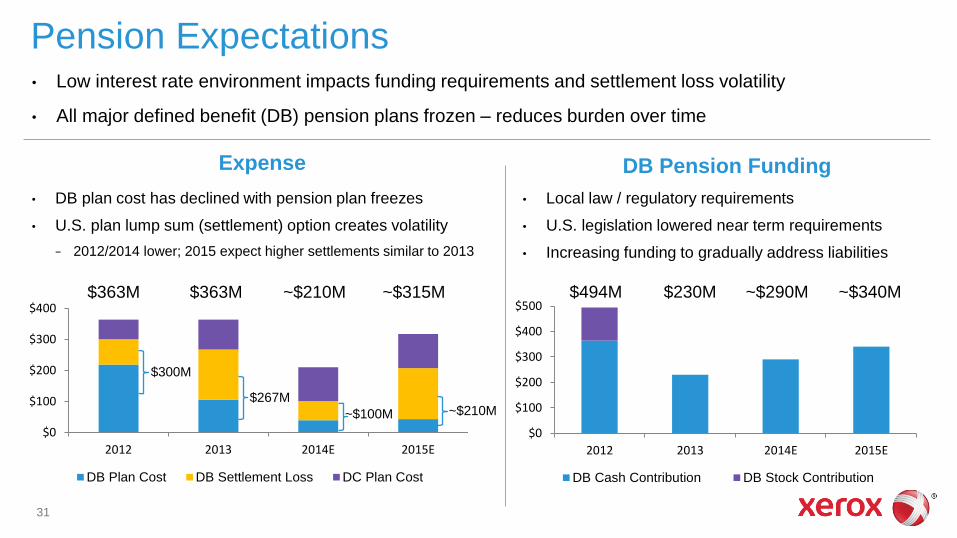
Pension Expectations
Expense DB Pension Funding
• DB plan cost has declined with pension plan freezes
• U.S. plan lump sum (settlement) option creates volatility
− 2012/2014 lower; 2015 expect higher settlements similar to 2013
$230M
• Local law / regulatory requirements
• U.S. legislation lowered near term requirements
• Increasing funding to gradually address liabilities
• Low interest rate environment impacts funding requirements and settlement loss volatility
• All major defined benefit (DB) pension plans frozen – reduces burden over time
~$340M ~$290M $363M ~$210M ~$315M $363M
$300M
$267M
~$100M ~$210M
$494M
31

Cash Flow Dynamics
Continued strong cash flow
2015 reflects moderating impact
from previous Finance Receivable
sales
• Partially offset by higher pension
funding
No Finance Receivable sales
planned in 2015
32
(in billions) 2012 2013 2014 Est. 2015 Est.
Operating Cash Flow (OCF) $2.6 $2.4 $1.8 - $2.0 $1.9 - $2.1
Adjustments:
Cash from F/R Sales $(0.6) $(0.6) - -
Impact from prior F/R Sales - $0.3 ~$0.4 ~$0.3
Underlying OCF* $2.0 $2.1 $2.2 - $2.4 $2.2 - $2.4
Operating Cash Flow Trend
*Underlying OCF is reported OCF adjusted for the impacts of Finance Receivable sales. See non-GAAP measures.
$0
$1
$2
$3
2012 2013 2014E 2015E
OCF Underlying OCF
(in
bill
ion
s)
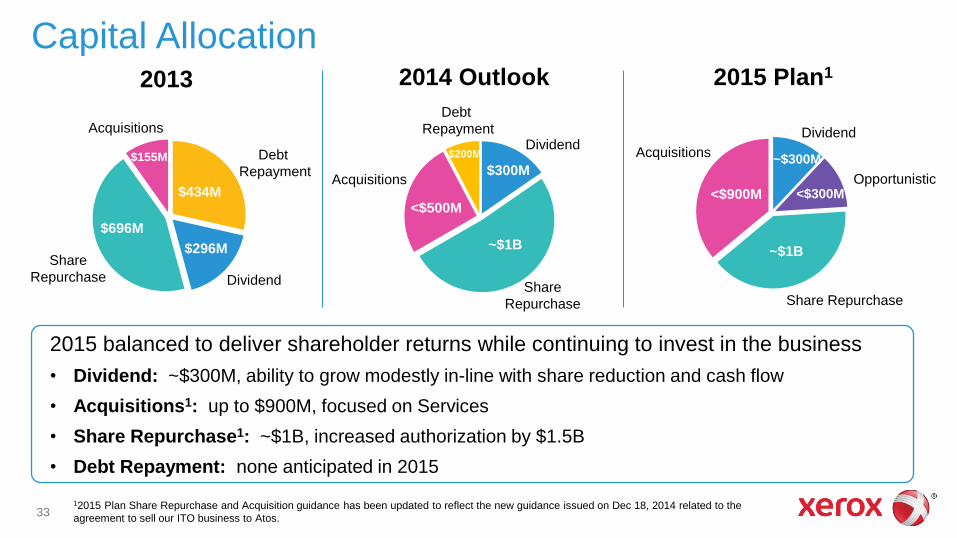
Capital Allocation
2013
2015 balanced to deliver shareholder returns while continuing to invest in the business
• Dividend: ~$300M, ability to grow modestly in-line with share reduction and cash flow
• Acquisitions1: up to $900M, focused on Services
• Share Repurchase1: ~$1B, increased authorization by $1.5B
• Debt Repayment: none anticipated in 2015
2015 Plan1
Opportunistic
Acquisitions
Share Repurchase
Dividend Acquisitions
Dividend
Debt
Repayment
Share
Repurchase
$696M
$296M
$434M
$155M
33
Share
Repurchase
Dividend
Debt
Repayment
Acquisitions
2014 Outlook
~$1B
<$500M
$300M
$200M
~$1B
<$300M <$900M
~$300M
12015 Plan Share Repurchase and Acquisition guidance has been updated to reflect the new guidance issued on Dec 18, 2014 related to the
agreement to sell our ITO business to Atos.
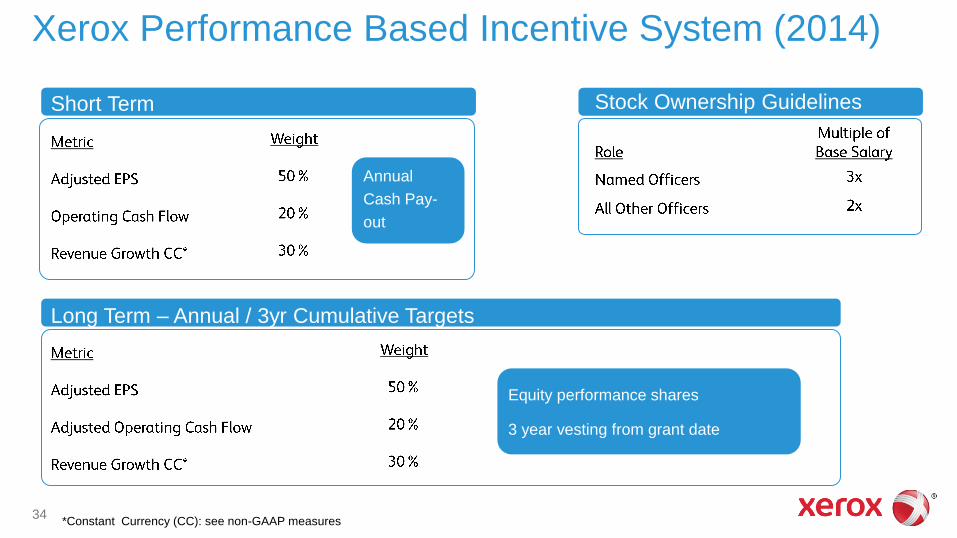
Xerox Performance Based Incentive System (2014)
Short Term Stock Ownership Guidelines
Annual
Cash Pay-
out
34
Long Term – Annual / 3yr Cumulative Targets
Equity performance shares
3 year vesting from grant date
*Constant Currency (CC): see non-GAAP measures

Third-Quarter 2014 Earnings Presentation Ursula Burns Chairman & CEO
Kathy Mikells Chief Financial Officer
October 22, 2014

Xerox Direction
Annuity 85% of Total Revenue
Services 57% of Total Revenue
• Grow revenue
• Generate profits in line with industry’s best
• Strengthen and differentiate the portfolio
• Support customers and our people
• Allocate capital to enhance shareholder
returns
36

Third-Quarter Overview
Adjusted EPS1 of 27 cents, GAAP EPS2 of 22 cents Total revenue of $5.1B, down 2%
Services revenue up 1% or flat CC1; margin of 8.9%
• Revenue growth improves in BPO; offsets decline in ITO
• Margin increased sequentially driven by BPO
Document Technology revenue down 6%; margin of 14.0%
• Profit expansion driven by continued productivity initiatives as well as currency and pension benefits
Operating margin1 of 9.5%, up 10 bps YOY Cash from operations of $595M in Q3, $1.2B YTD
• Share repurchase of $251M in Q3, $730M YTD
• Acquisitions of $25M in Q3, $306M YTD
1Adjusted EPS, Constant Currency (CC) and Operating Margin: see non-GAAP measures
2GAAP EPS from Continuing Operations 37
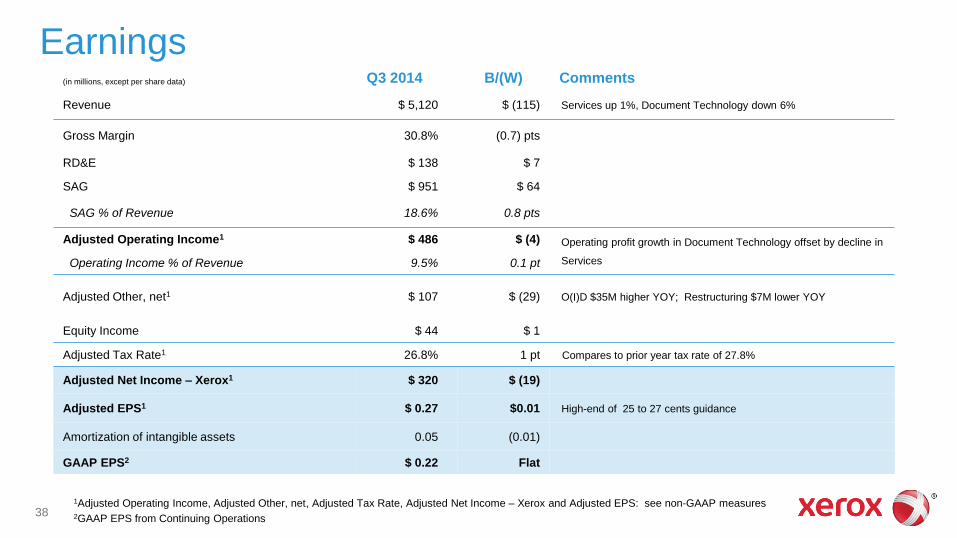
Earnings (in millions, except per share data) Q3 2014 B/(W) Comments
Revenue $ 5,120 $ (115) Services up 1%, Document Technology down 6%
Gross Margin 30.8% (0.7) pts
RD&E $ 138 $ 7
SAG $ 951 $ 64
SAG % of Revenue 18.6% 0.8 pts
Adjusted Operating Income1 $ 486 $ (4) Operating profit growth in Document Technology offset by decline in
Services Operating Income % of Revenue 9.5% 0.1 pt
Adjusted Other, net1 $ 107 $ (29) O(I)D $35M higher YOY; Restructuring $7M lower YOY
Equity Income $ 44 $ 1
Adjusted Tax Rate1 26.8% 1 pt Compares to prior year tax rate of 27.8%
Adjusted Net Income – Xerox1 $ 320 $ (19)
Adjusted EPS1 $ 0.27
$0.01
High-end of 25 to 27 cents guidance
Amortization of intangible assets 0.05 (0.01)
GAAP EPS2 $ 0.22
Flat
1Adjusted Operating Income, Adjusted Other, net, Adjusted Tax Rate, Adjusted Net Income – Xerox and Adjusted EPS: see non-GAAP measures 2GAAP EPS from Continuing Operations
38

Services Segment
BPO revenue up 2%, DO flat and ITO down 3%
Margin up sequentially; short of expectations
Multi-plank strategy progressing
• Re-aligning organization to leverage our scale, gain
efficiencies and improve customer value
Signings
• BPO/ITO renewal rate of 82%
• New business signings2 down 18% YOY and 6% TTM
• Significant deals awarded, not yet signed
Q3 % B/(W) YOY
(in millions) 2014 Act Cur CC1
Total Revenue $2,948 1% Flat
Segment Profit $262 (10)%
Segment Margin 8.9% (1.1) pts
Segment Margin Trend
Revenue Growth Trend (CC1)
Signings (TCV) Q3
Business Process Outsourcing $1.4
Document Outsourcing $0.7
Information Technology Outsourcing $0.2
Total $2.3B
YOY Growth (21)%
TTM Growth (17)%
39 1Constant currency (CC): see non-GAAP measures 2New Business Signings = ARR (Annual Recurring Revenue) + NRR (Non-Recurring Revenue)
Note: Historical data updated to reflect Truckload Management Services divestiture and reclassification to Discontinued Operations
4%
6%
3%
(2)% 0%
1% 0%
(4)%
0%
4%
8%
Q1 '13 Q2 '13 Q3 '13 Q4 '13 Q1 '14 Q2 '14 Q3 '14
9.4%
10.2% 10.0% 9.6%
8.6% 8.6% 8.9%
5%
7%
9%
11%
Q1 '13 Q2 '13 Q3 '13 Q4 '13 Q1 '14 Q2 '14 Q3 '14
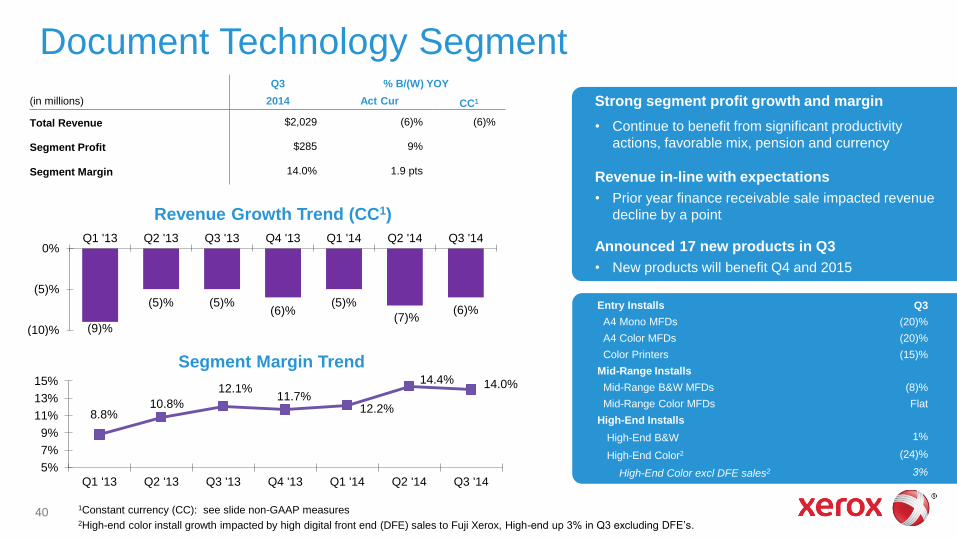
Document Technology Segment
Segment Margin Trend
Revenue Growth Trend (CC1)
Q3 % B/(W) YOY
(in millions) 2014 Act Cur CC1
Total Revenue $2,029 (6)% (6)%
Segment Profit $285 9%
Segment Margin 14.0% 1.9 pts
Strong segment profit growth and margin
• Continue to benefit from significant productivity
actions, favorable mix, pension and currency
Revenue in-line with expectations
• Prior year finance receivable sale impacted revenue
decline by a point
Announced 17 new products in Q3
• New products will benefit Q4 and 2015
Entry Installs Q3
A4 Mono MFDs (20)%
A4 Color MFDs (20)%
Color Printers (15)%
Mid-Range Installs
Mid-Range B&W MFDs (8)%
Mid-Range Color MFDs Flat
High-End Installs
High-End B&W 1%
High-End Color2 (24)%
High-End Color excl DFE sales2 3%
40 1Constant currency (CC): see slide non-GAAP measures 2High-end color install growth impacted by high digital front end (DFE) sales to Fuji Xerox, High-end up 3% in Q3 excluding DFE’s.
(9)%
(5)% (5)% (6)%
(5)%
(7)% (6)%
(10)%
(5)%
0%Q1 '13 Q2 '13 Q3 '13 Q4 '13 Q1 '14 Q2 '14 Q3 '14
8.8% 10.8%
12.1% 11.7%
12.2%
14.4% 14.0%
5%
7%
9%
11%
13%
15%
Q1 '13 Q2 '13 Q3 '13 Q4 '13 Q1 '14 Q2 '14 Q3 '14

Cash Flow
41
(in millions) Q3 2014 YTD 2014
Net Income $ 272 $ 830
Depreciation and amortization 349 1,070
Restructuring and asset impairment charges 28 93
Restructuring payments (31) (103)
Contributions to defined benefit pension plans (101) (206)
Inventories (34) (137)
Accounts receivable and Billed portion of finance receivables1 10 (153)
Accounts payable and Accrued compensation 126 38
Equipment on operating leases (81) (204)
Finance receivables1 48 144
Other 9 (166)
Cash from Operations
$ 595 $ 1,206
Cash from Investing
$ (128) $ (574)
Cash from Financing $ (417) $ (1,327)
Change in Cash and Cash Equivalents 8 (749)
Ending Cash and Cash Equivalents $ 1,015 $ 1,015
Cash From Ops $595M, $1.2B YTD
• Underlying Cash from Ops2 $697M
in Q3, $1,543M YTD
Q3 YOY impact from Finance
Receivable sales was $(418)M3
Working capital continues to
improve
CAPEX $112M
Acquisitions $25M
Share Repurchase of $251M and
$77M of Common Stock Dividends
1Accounts receivable includes collections of deferred proceeds from sales of receivables and finance receivables includes collections on
beneficial interest from sales of finance receivables 2See Underlying Cash Flow slide in Appendix 3YOY estimated impact to operating cash flows from prior years finance receivable sales
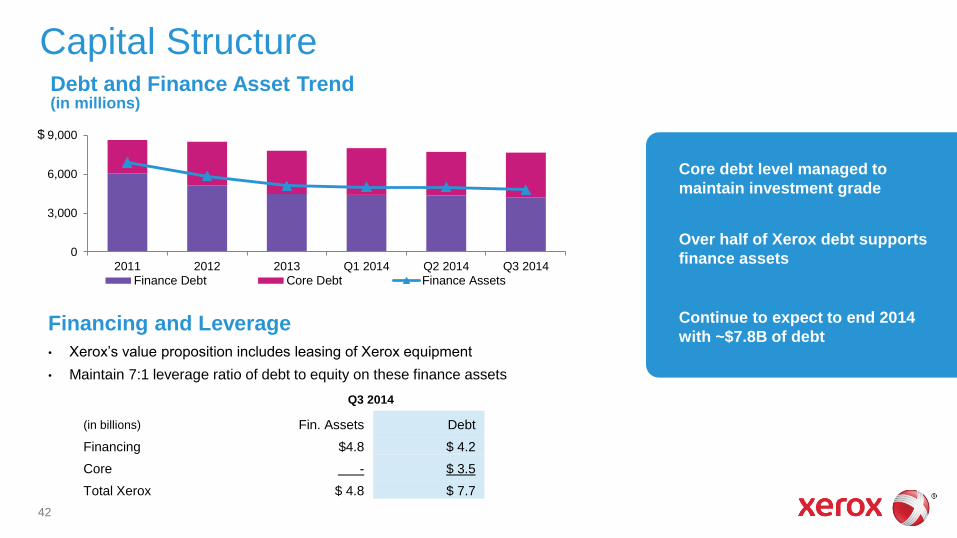
Capital Structure
Core debt level managed to
maintain investment grade
Over half of Xerox debt supports
finance assets
Continue to expect to end 2014
with ~$7.8B of debt
42
Financing and Leverage
• Xerox’s value proposition includes leasing of Xerox equipment
• Maintain 7:1 leverage ratio of debt to equity on these finance assets
Debt and Finance Asset Trend (in millions)
Q3 2014
(in billions) Fin. Assets Debt
Financing $4.8 $ 4.2
Core - $ 3.5
Total Xerox $ 4.8 $ 7.7
0
3,000
6,000
9,000
2011 2012 2013 Q1 2014 Q2 2014 Q3 2014
Finance Debt Core Debt Finance Assets
$
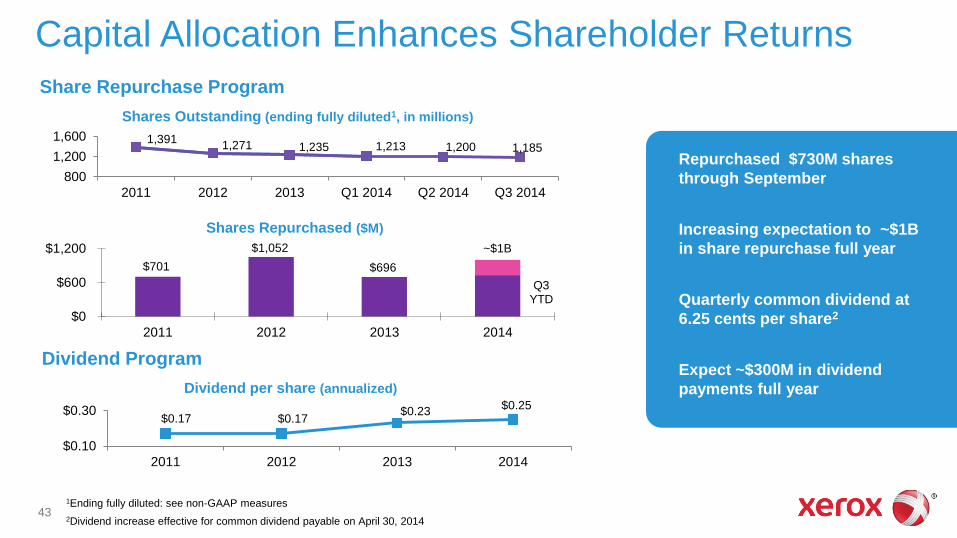
Capital Allocation Enhances Shareholder Returns
Repurchased $730M shares
through September
Increasing expectation to ~$1B
in share repurchase full year
Quarterly common dividend at
6.25 cents per share2
Expect ~$300M in dividend
payments full year
43
Share Repurchase Program
Dividend Program
1Ending fully diluted: see non-GAAP measures
2Dividend increase effective for common dividend payable on April 30, 2014
Shares Repurchased ($M)
Shares Outstanding (ending fully diluted1, in millions)
$0.17 $0.17 $0.23
$0.25
$0.10
$0.30
2011 2012 2013 2014
Dividend per share (annualized)
1,391 1,271 1,235 1,213 1,200 1,185
800
1,200
1,600
2011 2012 2013 Q1 2014 Q2 2014 Q3 2014
$701
$1,052
$696
Q3 YTD
~$1B
$0
$600
$1,200
2011 2012 2013 2014
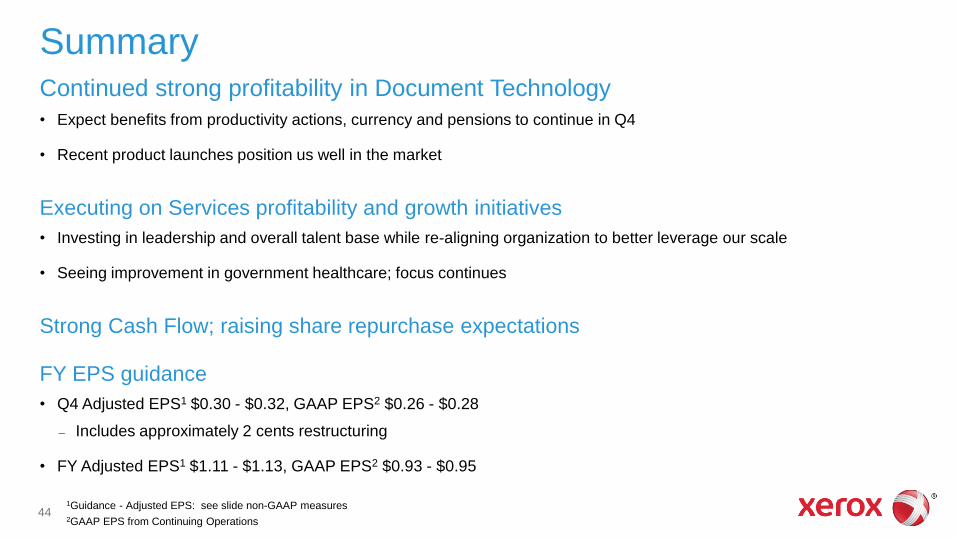
Summary Continued strong profitability in Document Technology
• Expect benefits from productivity actions, currency and pensions to continue in Q4
• Recent product launches position us well in the market
Executing on Services profitability and growth initiatives
• Investing in leadership and overall talent base while re-aligning organization to better leverage our scale
• Seeing improvement in government healthcare; focus continues
Strong Cash Flow; raising share repurchase expectations
FY EPS guidance
• Q4 Adjusted EPS1 $0.30 - $0.32, GAAP EPS2 $0.26 - $0.28
– Includes approximately 2 cents restructuring
• FY Adjusted EPS1 $1.11 - $1.13, GAAP EPS2 $0.93 - $0.95
44 1Guidance - Adjusted EPS: see slide non-GAAP measures
2GAAP EPS from Continuing Operations

Appendix

Revenue Trend
(in millions) FY Q1 Q2 Q3 Q4 FY Q1 Q2 Q3 YTD
Total Revenue $21,634 $5,182 $5,376 $5,235 $5,548 $21,341 $5,099 $5,281 $5,120 $15,500
Growth (1)% (2)% 1% Flat (3)% (1)% (2)% (2)% (2)% (2)%
CC1 Growth Flat (2)% 1% (1)% (4)% (2)% (2)% (3)% (2)% (2)%
Annuity $18,158 $ 4,458 $4,521 $4,424 $4,579 $17,982 $4,384 $4,500 $4,372 $13,256
Growth 1% (1)% 1% Flat (3)% (1)% (2)% Flat (1)% (1)%
CC1 Growth 2% (1)% 1% (1)% (3)% (1)% (2)% Flat (1)% (2)%
Annuity % Revenue
84% 86% 84% 85% 83% 84% 86% 85% 85% 86%
Equipment $3,476 $724 $855 $811 $969 $3,359 $715 $781 $748 $2,244
Growth (10)% (11)% 1% 1% (4)% (3)% (1)% (9)% (8)% (6)%
CC1 Growth (8)% (11)% 1% Flat (5)% (4)% (2)% (9)% (8)% (7)%
2013 2012
46 1Constant currency: see slide non-GAAP measures
2014
Note: 2012, 2013, Q1 2014 and Q2 2014 are revised to remove business revenues that were reclassified to discontinued operations
Note: Xerox announced on 12/18/14 that it has entered an agreement to sell its ITO business to Atos (expected close H1 2015) and plans to report
ITO in discontinued operations with the Q4 2014 earnings. The Revenue information on this page does not reflect this pending change.
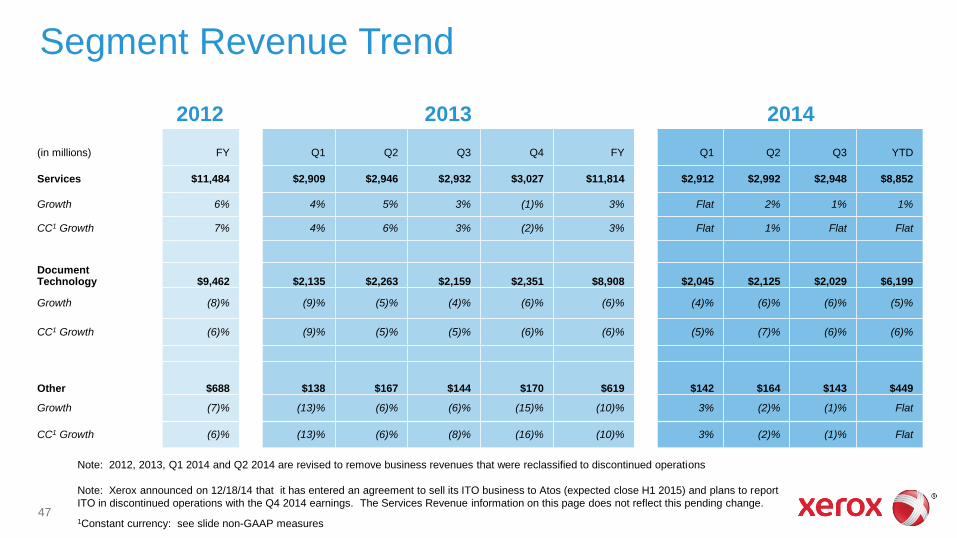
Segment Revenue Trend
(in millions) FY Q1 Q2 Q3 Q4 FY Q1 Q2 Q3 YTD
Services $11,484 $2,909 $2,946 $2,932 $3,027 $11,814 $2,912 $2,992 $2,948 $8,852
Growth 6% 4% 5% 3% (1)% 3% Flat 2% 1% 1%
CC1 Growth 7% 4% 6% 3% (2)% 3% Flat 1% Flat Flat
Document Technology $9,462 $2,135 $2,263 $2,159 $2,351 $8,908 $2,045 $2,125 $2,029 $6,199
Growth (8)% (9)% (5)% (4)% (6)% (6)% (4)% (6)% (6)% (5)%
CC1 Growth (6)% (9)% (5)% (5)% (6)% (6)% (5)% (7)% (6)% (6)%
Other $688 $138 $167 $144 $170 $619 $142 $164 $143 $449
Growth (7)% (13)% (6)% (6)% (15)% (10)% 3% (2)% (1)% Flat
CC1 Growth (6)% (13)% (6)% (8)% (16)% (10)% 3% (2)% (1)% Flat
2013 2012
47
2014
1Constant currency: see slide non-GAAP measures
Note: 2012, 2013, Q1 2014 and Q2 2014 are revised to remove business revenues that were reclassified to discontinued operations
Note: Xerox announced on 12/18/14 that it has entered an agreement to sell its ITO business to Atos (expected close H1 2015) and plans to report
ITO in discontinued operations with the Q4 2014 earnings. The Services Revenue information on this page does not reflect this pending change.

Metrics Reference – Q3 YTD
Entry Installs YTD
A4 Mono MFDs (22)%
A4 Color MFDs (7)%
Color Printers (3)%
Mid-Range Installs
Mid-Range B&W MFDs (15)%
Mid-Range Color MFDs 1%
High-End Installs
High-End B&W (10)%
High-End Color1 (14)%
YTD
Business Process Outsourcing $5.5
Document Outsourcing $2.0
Information Technology Outsourcing $0.5
Total $8.0B
Signings Growth YOY (22)%
Signings Growth TTM (17)%
YTD
Digital MIF 2%
Color MIF 12%
Digital Pages (3)%
Color Pages 5%
Color Revenue (CC2) (2)%
YTD
Renewal Rate (BPO and ITO) 75%
Signings and Renewal Rate Install, MIF and Page Growth
Installs, color revenue, pages and MIF include both the Document Technology and Services segments. Color revenue and color pages reflect
revenue and pages from color capable devices. 1High-end color install growth impacted by high digital front end (DFE) sales to Fuji Xerox, High-end up 5% YTD excluding DFE’s. 48 2Constant currency: see slide non-GAAP measures

Underlying Cash Flow
49
1Represents cash that would have been collected had we not sold finance receivables. Net of collections on beneficial interest.
2Underlying OCF is reported OCF adjusted for the impacts of Finance Receivable sales: see slide non-GAAP measures
Estimated
(in millions) Q1 2014 Q2 2014 Q3 2014 FY 2014 Q1 2013 Q2 2013 Q3 2013 FY 2013
Operating Cash Flow (OCF) $286 $325 $595 $1,206 $1.8 - $2.0B ($87) $533 $961 $1,407 $2.4B
Adjustments:
Cash From F/R Sales - - - - - - - ($384) ($384) $(0.6)B
Impact from prior F/R Sales1 $123 $112 $102 $337 $0.4B $89 $58 $68 $215 $0.3B
Underlying OCF2$409 $437 $697 $1,543 $2.2 - $2.4B $2 $591 $645 $1,238 $2.1B
YTD 2014 YTD 2013
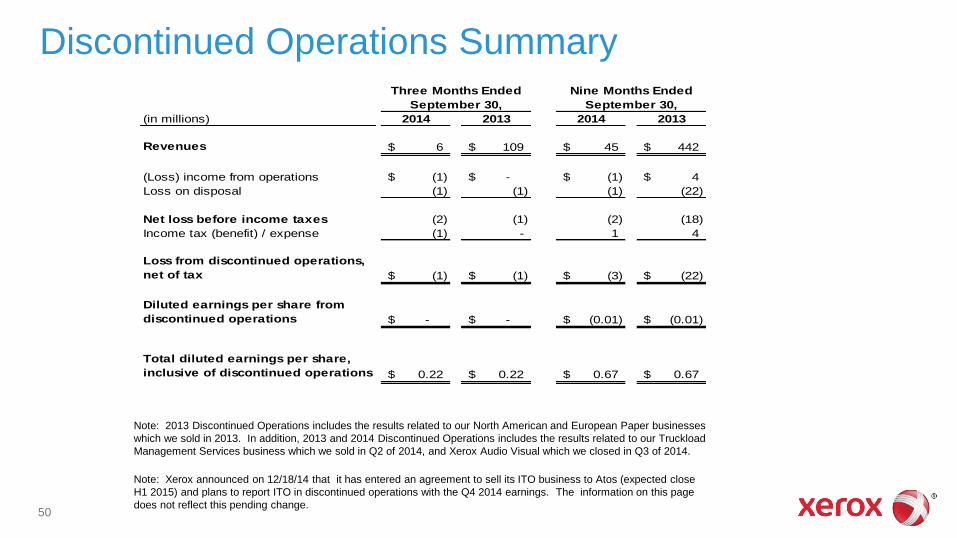
Discontinued Operations Summary
50
Note: 2013 Discontinued Operations includes the results related to our North American and European Paper businesses
which we sold in 2013. In addition, 2013 and 2014 Discontinued Operations includes the results related to our Truckload
Management Services business which we sold in Q2 of 2014, and Xerox Audio Visual which we closed in Q3 of 2014.
(in millions) 2014 2013 2014 2013
Revenues 6$ 109$ 45$ 442$
(Loss) income from operations (1)$ -$ (1)$ 4$
Loss on disposal (1) (1) (1) (22)
Net loss before income taxes (2) (1) (2) (18)
Income tax (benefit) / expense (1) - 1 4
Loss from discontinued operations,
net of tax (1)$ (1)$ (3)$ (22)$
Diluted earnings per share from
discontinued operations -$ -$ (0.01)$ (0.01)$
Total diluted earnings per share,
inclusive of discontinued operations 0.22$ 0.22$ 0.67$ 0.67$
Three Months Ended Nine Months Ended
September 30, September 30,
Note: Xerox announced on 12/18/14 that it has entered an agreement to sell its ITO business to Atos (expected close
H1 2015) and plans to report ITO in discontinued operations with the Q4 2014 earnings. The information on this page
does not reflect this pending change.
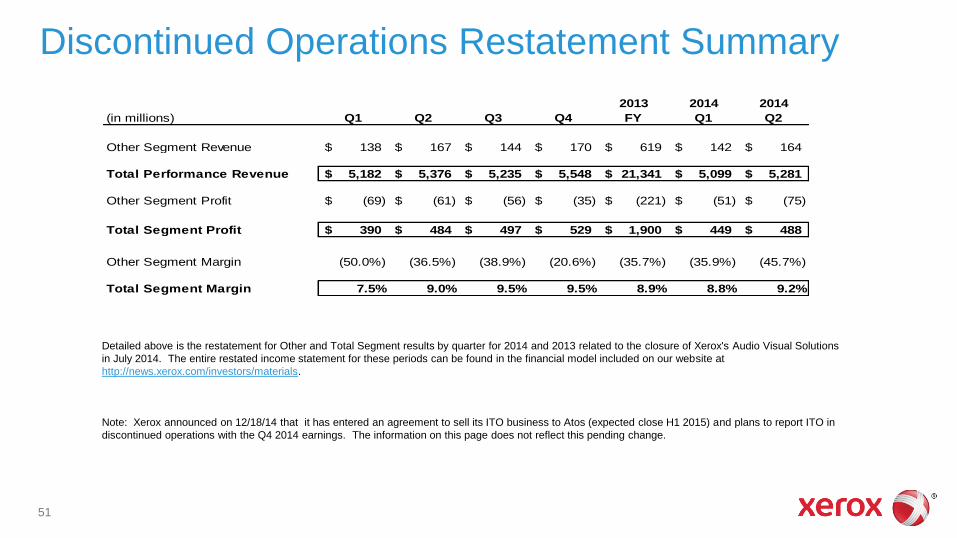
Discontinued Operations Restatement Summary
51
Detailed above is the restatement for Other and Total Segment results by quarter for 2014 and 2013 related to the closure of Xerox's Audio Visual Solutions
in July 2014. The entire restated income statement for these periods can be found in the financial model included on our website at
http://news.xerox.com/investors/materials.
2013 2014 2014
(in millions) Q1 Q2 Q3 Q4 FY Q1 Q2
Other Segment Revenue 138$ 167$ 144$ 170$ 619$ 142$ 164$
Total Performance Revenue 5,182$ 5,376$ 5,235$ 5,548$ 21,341$ 5,099$ 5,281$
Other Segment Profit (69)$ (61)$ (56)$ (35)$ (221)$ (51)$ (75)$
Total Segment Profit 390$ 484$ 497$ 529$ 1,900$ 449$ 488$
Other Segment Margin (50.0%) (36.5%) (38.9%) (20.6%) (35.7%) (35.9%) (45.7%)
Total Segment Margin 7.5% 9.0% 9.5% 9.5% 8.9% 8.8% 9.2%
Note: Xerox announced on 12/18/14 that it has entered an agreement to sell its ITO business to Atos (expected close H1 2015) and plans to report ITO in
discontinued operations with the Q4 2014 earnings. The information on this page does not reflect this pending change.
Non-GAAP Measures
53
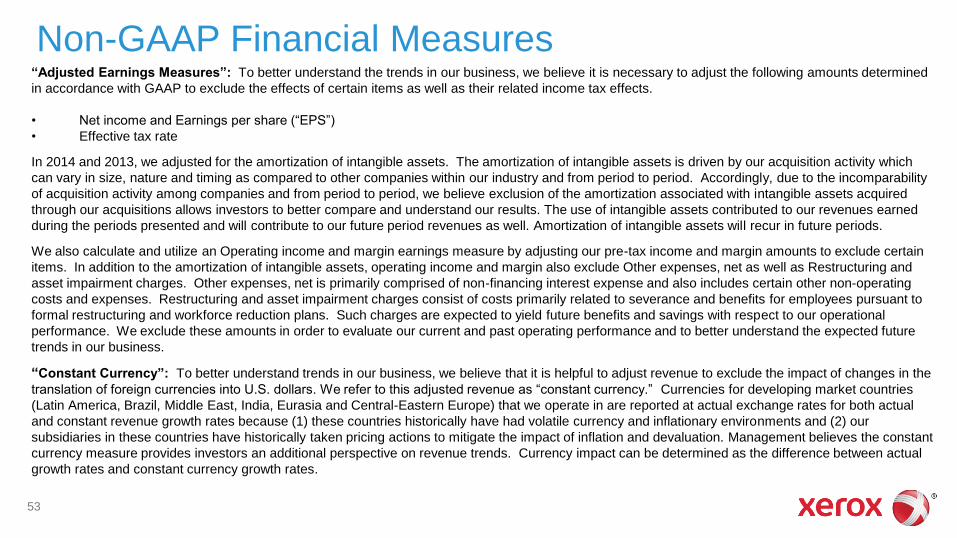
“Adjusted Earnings Measures”: To better understand the trends in our business, we believe it is necessary to adjust the following amounts determined
in accordance with GAAP to exclude the effects of certain items as well as their related income tax effects.
• Net income and Earnings per share (“EPS”)
• Effective tax rate
In 2014 and 2013, we adjusted for the amortization of intangible assets. The amortization of intangible assets is driven by our acquisition activity which
can vary in size, nature and timing as compared to other companies within our industry and from period to period. Accordingly, due to the incomparability
of acquisition activity among companies and from period to period, we believe exclusion of the amortization associated with intangible assets acquired
through our acquisitions allows investors to better compare and understand our results. The use of intangible assets contributed to our revenues earned
during the periods presented and will contribute to our future period revenues as well. Amortization of intangible assets will recur in future periods.
We also calculate and utilize an Operating income and margin earnings measure by adjusting our pre-tax income and margin amounts to exclude certain
items. In addition to the amortization of intangible assets, operating income and margin also exclude Other expenses, net as well as Restructuring and
asset impairment charges. Other expenses, net is primarily comprised of non-financing interest expense and also includes certain other non-operating
costs and expenses. Restructuring and asset impairment charges consist of costs primarily related to severance and benefits for employees pursuant to
formal restructuring and workforce reduction plans. Such charges are expected to yield future benefits and savings with respect to our operational
performance. We exclude these amounts in order to evaluate our current and past operating performance and to better understand the expected future
trends in our business.
“Constant Currency”: To better understand trends in our business, we believe that it is helpful to adjust revenue to exclude the impact of changes in the
translation of foreign currencies into U.S. dollars. We refer to this adjusted revenue as “constant currency.” Currencies for developing market countries
(Latin America, Brazil, Middle East, India, Eurasia and Central-Eastern Europe) that we operate in are reported at actual exchange rates for both actual
and constant revenue growth rates because (1) these countries historically have had volatile currency and inflationary environments and (2) our
subsidiaries in these countries have historically taken pricing actions to mitigate the impact of inflation and devaluation. Management believes the constant
currency measure provides investors an additional perspective on revenue trends. Currency impact can be determined as the difference between actual
growth rates and constant currency growth rates.
Non-GAAP Financial Measures

54
“Free Cash Flow”: To better understand the trends in our business, we believe that it is helpful to adjust cash flows from operations to exclude amounts
for capital expenditures including internal use software. Management believes this measure gives investors an additional perspective on cash flow from
operating activities in excess of amounts required for reinvestment. It provides a measure of our ability to fund acquisitions, dividends and share
repurchase. It also is used to measure our yield on market capitalization. A reconciliation of this non-GAAP financial measure and the most directly
comparable measure calculated and presented in accordance with GAAP is set forth in the slide entitled “2014 Guidance”.
“Underlying Cash Flow”: To better understand the trends in our business, we believe that it is helpful to adjust cash flows from operations for the cash
flow impacts from our sales of finance receivables. The sale of finance receivables has a significant impact on operating cash flows in the period of sale
as well as on collections in subsequent periods due to the long term nature of these receivables. In addition to providing a better understanding of the
underlying trends in cash flows from operations, management believes this measure gives investors an additional perspective on comparing and
analyzing the year-over-year changes in our cash flows as well as the impacts of these sales on cash flows in the period. A reconciliation of this non-
GAAP financial measure and the most directly comparable measure calculated and presented in accordance with GAAP is set forth in the slide entitled
“Underlying Cash Flows”.
Management believes that these non-GAAP financial measures provide an additional means of analyzing the current periods’ results against the
corresponding prior periods’ results. However, these non-GAAP financial measures should be viewed in addition to, and not as a substitute for, the
Company’s reported results prepared in accordance with GAAP. Our non-GAAP financial measures are not meant to be considered in isolation or as a
substitute for comparable GAAP measures and should be read only in conjunction with our consolidated financial statements prepared in accordance
with GAAP. Our management regularly uses our supplemental non-GAAP financial measures internally to understand, manage and evaluate our
business and make operating decisions. These non-GAAP measures are among the primary factors management uses in planning for and forecasting
future periods. Compensation of our executives is based in part on the performance of our business based on these non-GAAP measures.
Unless otherwise noted, reconciliations of these non-GAAP financial measures and the most directly comparable measures calculated and presented in
accordance with GAAP are set forth on the following slides.
Non-GAAP Financial Measures
55
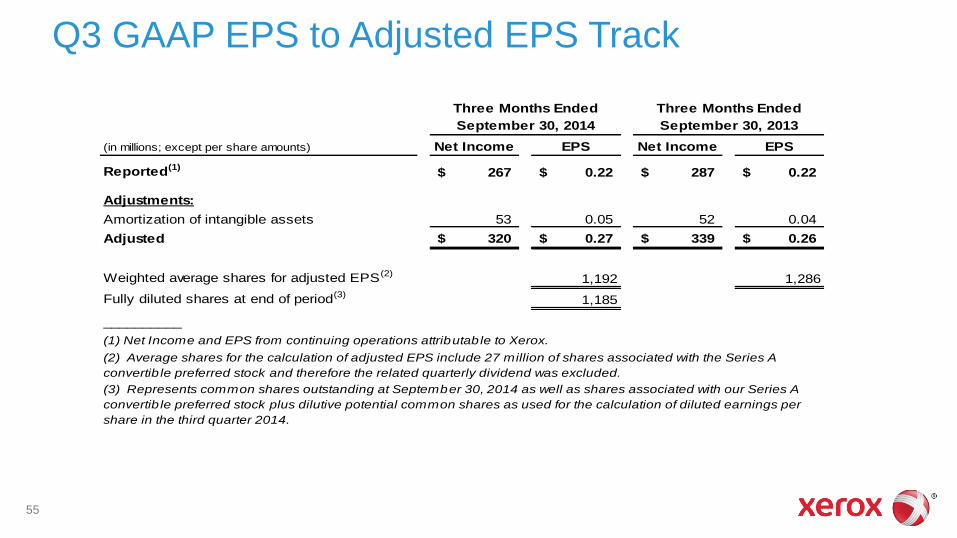
Q3 GAAP EPS to Adjusted EPS Track
(in millions; except per share amounts) Net Income EPS Net Income EPS
Reported(1)267$ 0.22$ 287$ 0.22$
Adjustments:
Amortization of intangible assets 53 0.05 52 0.04
Adjusted 320$ 0.27$ 339$ 0.26$
Weighted average shares for adjusted EPS(2)1,192 1,286
Fully diluted shares at end of period(3)1,185
__________
(1) Net Income and EPS from continuing operations attributable to Xerox.
(2) Average shares for the calculation of adjusted EPS include 27 million of shares associated with the Series A
convertib le preferred stock and therefore the related quarterly dividend was excluded.
(3) Represents common shares outstanding at September 30, 2014 as well as shares associated with our Series A
convertib le preferred stock plus dilutive potential common shares as used for the calculation of diluted earnings per
share in the third quarter 2014.
Three Months Ended Three Months Ended
September 30, 2014 September 30, 2013

56
GAAP EPS to Adjusted EPS Guidance Track
Q4 2014 FY 2014
GAAP EPS from Continuing Operations $0.26 - $0.28 $0.93 - $0.95
Adjustments:
Amortization of intangible assets 0.04 0.18
Adjusted EPS $0.30 - $0.32 $1.11 - $1.13
Note: GAAP and Adjusted EPS guidance includes anticipated restructuring
Earnings Per Share Guidance

57
Q3 Adjusted Operating Income/Margin
(in millions) Profit Revenue Margin Profit Revenue Margin
Reported pre-tax income (1)300$ 5,120$ 5.9% 334$ 5,235$ 6.4%
Adjustments:
Amortization of intangible assets 85 83
Xerox restructuring charge 28 35
Other expenses, net 73 38
Adjusted Operating Income/Margin 486$ 5,120$ 9.5% 490$ 5,235$ 9.4%
_______________
(1) Profit and Revenue from continuing operations attributable to Xerox.
September 30, 2014 September 30, 2013
Three Months Ended Three Months Ended
58
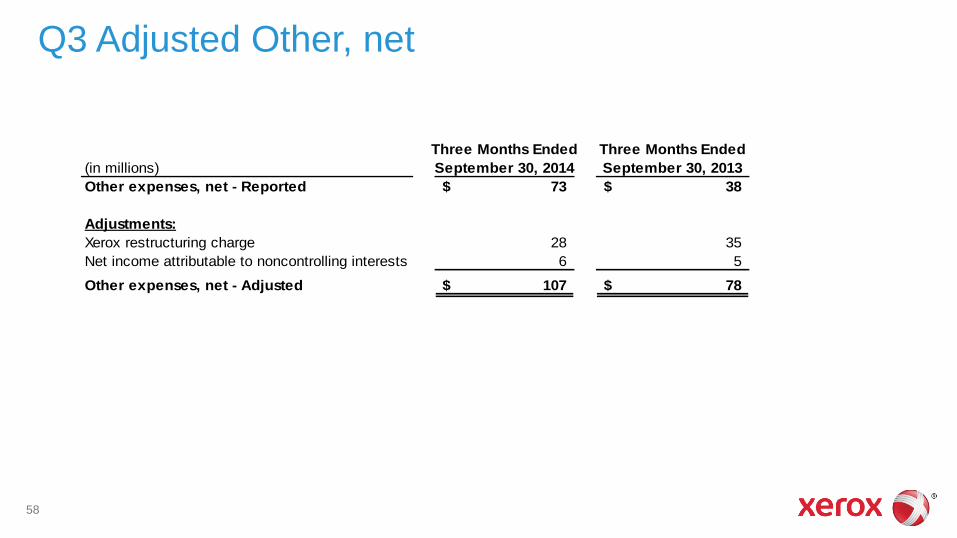
Q3 Adjusted Other, net
Three Months Ended Three Months Ended
(in millions) September 30, 2014 September 30, 2013
Other expenses, net - Reported 73$ 38$
Adjustments:
Xerox restructuring charge 28 35
Net income attributable to noncontrolling interests 6 5
Other expenses, net - Adjusted 107$ 78$
59
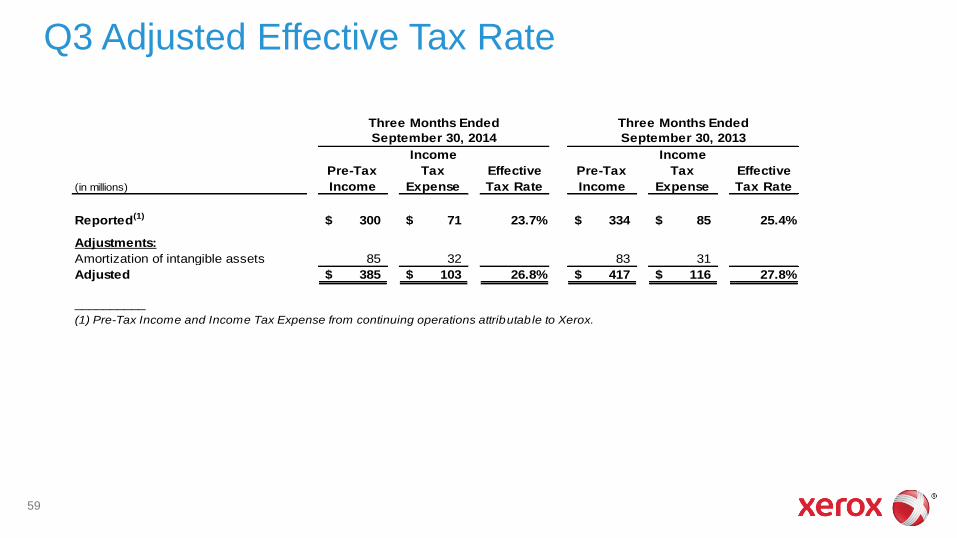
Q3 Adjusted Effective Tax Rate
(in millions)
Pre-Tax
Income
Income
Tax
Expense
Effective
Tax Rate
Pre-Tax
Income
Income
Tax
Expense
Effective
Tax Rate
Reported(1) 300$ 71$ 23.7% 334$ 85$ 25.4%
Adjustments:
Amortization of intangible assets 85 32 83 31
Adjusted 385$ 103$ 26.8% 417$ 116$ 27.8%
__________
Three Months Ended Three Months Ended
September 30, 2014 September 30, 2013
(1) Pre-Tax Income and Income Tax Expense from continuing operations attributable to Xerox.
60
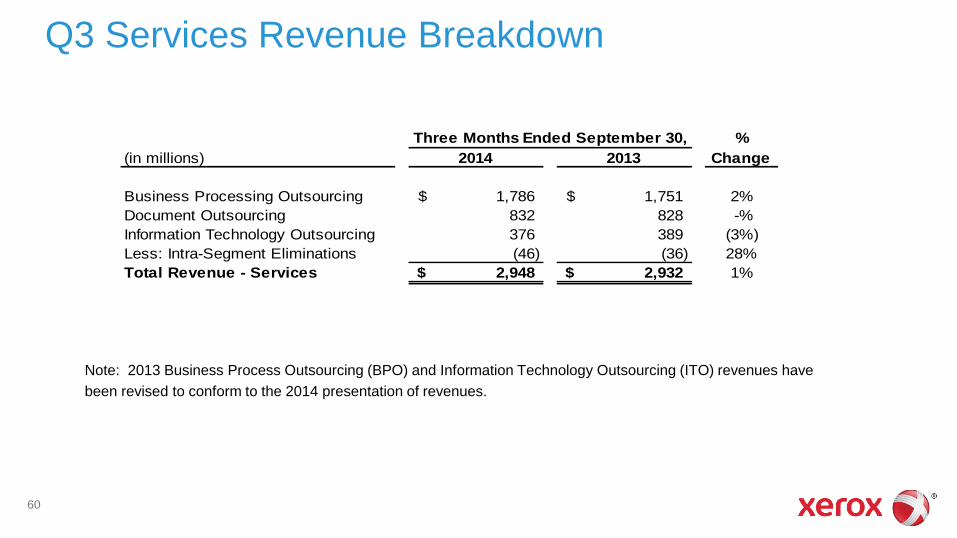
Q3 Services Revenue Breakdown
Note: 2013 Business Process Outsourcing (BPO) and Information Technology Outsourcing (ITO) revenues have
been revised to conform to the 2014 presentation of revenues.
%
(in millions) 2014 2013 Change
Business Processing Outsourcing 1,786$ 1,751$ 2%
Document Outsourcing 832 828 -%
Information Technology Outsourcing 376 389 (3%)
Less: Intra-Segment Eliminations (46) (36) 28%
Total Revenue - Services 2,948$ 2,932$ 1%
Three Months Ended September 30,
©2014 Xerox Corporation. All rights reserved. Xerox® and Xerox Design® are trademarks of Xerox Corporation in the United States and/or other countries.