wpi recreation center: construction management and ... · pdf filewpi recreation center:...
TRANSCRIPT
GFS-1101
LDA - 1102
WPI Recreation Center:
Construction Management and Alternative Design Analysis
A Major Qualifying Project
Submitted to the faculty of Worcester Polytechnic Institute
In partial fulfillment of the requirements for the
Degree of Bachelor of Science
Submitted By: Kristopher Fournier
Stephanie Munion
Joel Stella
Sponsoring Agency: Gilbane Building Company
Submitted To: Project Advisors: Guillermo Salazar
Leonard Albano
Date: March 14, 2011
i
Abstract This project provided an alternative design for the structural supports of the fourth floor
of the new WPI Recreation and Sports Center. Using the information developed, a comparative
analysis of the alternative design versus the current design was completed based on cost,
feasibility, and dynamic response. Also, with information provided by Gilbane Building Co. and
Cannon Design, two 4-D models of the project were completed. These models provided a
platform to track and compare construction progress. In addition to the models, an earned value
analysis was completed to further track construction progress and costs.
ii
Acknowledgements We would like to thank all the parties involved in the development and construction of the
new WPI Recreation Center. Without all of you, our project would not have been possible. We
would also like to thank the WPI representatives to the project for giving us insight and information
that we could not have obtained elsewhere. Special thanks go to:
Gilbane Building Co. - Provided schedules and information related to the Rec. Center
Neil Benner
Melissa Hinton
Justin Gonsalves
Cannon Design - Provided a 3-D Revit model of the completed structure
Lynne Deninger
Dominic Vecchione
Cardinal Construction - Provided insight into the construction process
Brent Arthaud
Representatives from WPI
Jeffrey Solomon
Dana Harmon
Janet Richardson
Alfredo DiMauro
Sean O’Connor
Shawn McAvey
Leonard Albano
Guillermo Salazar
iii
Authorship Page The work distribution for this project was evenly divided. Stephanie Munion was
responsible for the project management sections of the report and the Earned Value Analysis,
Chapter 2.1, portions of Chapter 3, and Chapters 5.2 and 5.4. Kristopher Fournier was
responsible for the BIM modeling and analysis, Chapter 2.2, portions of Chapter 3, and Chapter
5.1. Joel Stella was responsible for the Structural Analysis, Chapter 2.3, Chapter 4, and Chapter
5.3. The other portions of the report were developed in a collaborative fashion by all members of
the group.
iv
Capstone Design Statement The capstone design requirement was met for this project by analyzing the current
construction of the Recreation Center through the proposed schedule as well as the actual
progress and by creating an alternative design to the support system for the fourth floor
gymnasium. A 4-D model was created in order to compare and contrast the proposed
construction schedule versus the actual construction progress and to perform a cost analysis. The
alternative design explored the effects of an increased vibration frequency for both the current
support system as well as an alternative support system for the 4th
floor gymnasium. The
alternative system was incorporated into the design to replace the precast arches in the current
design. Then, a cost analysis encompassing material expenses was presented to compare and
contrast the two designs. In keeping with the requirements set forth by the ASCE, the following
six realistic constraints were addressed during completion of this project: economic,
manufacturability, ethical, health and safety, social, and sustainability.
The first constraint addressed was the economic impact that the project will have. Cost
estimates were completed during each month of construction, and proposed and actual versions
of the schedule were compared through the use of BIM. The prices of materials as well as any
delays due to scheduling were examined and used to create an Earned Value Analysis for the
project. In the alternative design, the material and labor and equipment costs for both the current
and alternative support systems were compared to determine the more cost effective strategy.
The next constraint examined was the manufacturability of the project. The dynamic
response of the current concrete arch system was determined for two different forcing
frequencies. An alternative design was then created to try and find a more cost effective
approach to supporting the 4th
floor gymnasium while still adhering to the dynamic response of
v
the two forcing frequencies. Also, the ease of construction was important to account for. There
are nine precast arches supporting the fourth floor gymnasium and to replace those with an
alternative could be difficult. Fortunately, to replace the arches with a truss system using the
same spacing and footings for the arches would be adequate and easily installed.
Ethical considerations needed to be addressed, and were during all portions of the project.
When completing the alternative design, all established standards of practice for construction
were considered based on those used by Cannon Design that were listed in the drawings.
The next constraint was the health and safety of the project. During any construction
project, health and safety for the workers, pedestrians, and future inhabitants is always a primary
concern. Occupational Safety and Health Administration (OSHA) standards, contractor safety,
and building code provisions are a few of the methods used to ensure the safety of everyone
involved in a project, from start to finish and occupancy. Gilbane Building Co., the construction
firm, accounted for these health and safety standards on the site and in our design we followed
the same Massachusetts building codes that were followed in the current design of the building.
The social impact of the project on campus life and the local environment was examined
through attendance at the Owner’s Meetings. These meetings discussed topics related to campus
operation, including student safety and events that were displaced due to construction, as well as
public relations opportunities, such as having Santa take pictures in the mock-up on the Quad.
Some important impacts that needed to be considered were how the quad would be affected and
public safety surrounding the site. Students spend much of their leisure time on the Quad and
now that there is a building overlooking a large opening that was once there, students may have
been displaced. Attendance at the Owner’s Meetings provided insight into how the parties
vi
involved coordinate their efforts and resources to create a safe and functional environment for
both the WPI and Worcester communities.
The final constraint analyzed was the sustainability of such an expensive and large-scale
project on the WPI campus. Who endorses, pays for, and approves the altering of the campus had
to be taken into account and also who would be taking care of this building’s day to day
operations. Finding out information through the Owner’s Meetings about how the financiers and
the trustees feel about the progress of the project and whether the project was worth the price that
will have to be paid were all important realistic considerations. Attendance at the Owner’s
Meetings emphasized that WPI is aware of the lasting effects that the decisions made during the
construction of this project will have on the community, especially those decisions that affect
sustainability.
vii
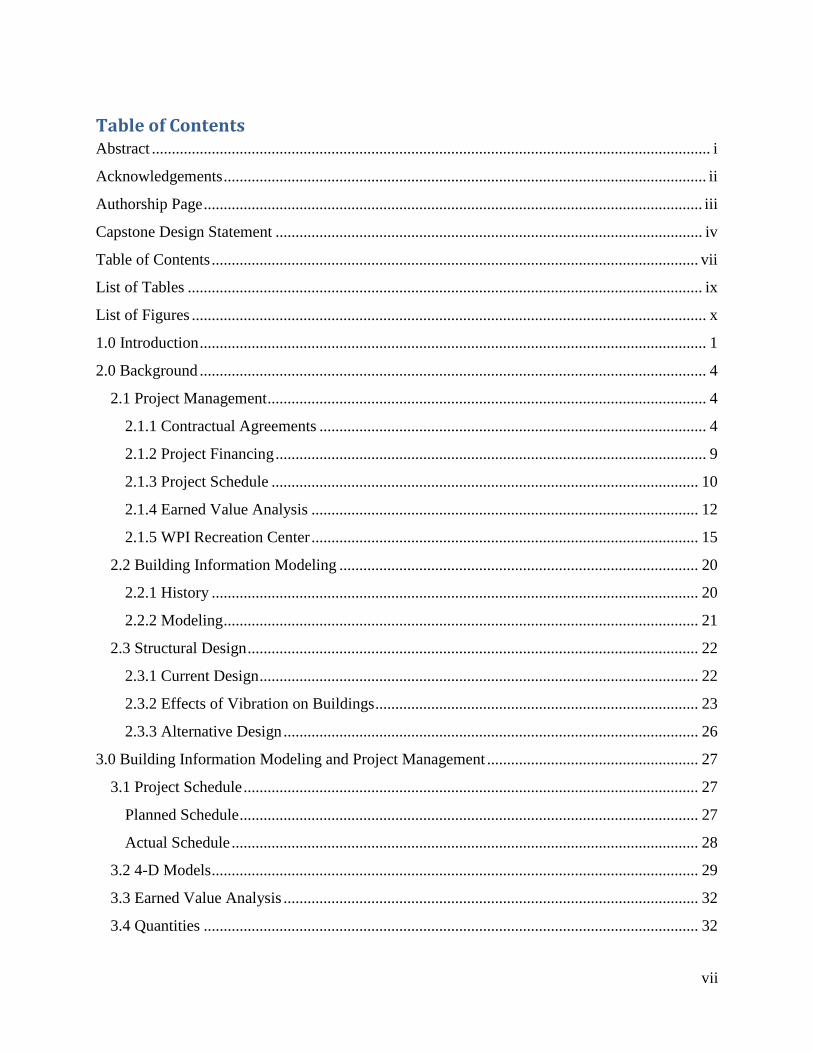
Table of Contents Abstract ............................................................................................................................................ i
Acknowledgements ......................................................................................................................... ii
Authorship Page ............................................................................................................................. iii
Capstone Design Statement ........................................................................................................... iv
Table of Contents .......................................................................................................................... vii
List of Tables ................................................................................................................................. ix
List of Figures ................................................................................................................................. x
1.0 Introduction ............................................................................................................................... 1
2.0 Background ............................................................................................................................... 4
2.1 Project Management .............................................................................................................. 4
2.1.1 Contractual Agreements ................................................................................................. 4
2.1.2 Project Financing ............................................................................................................ 9
2.1.3 Project Schedule ........................................................................................................... 10
2.1.4 Earned Value Analysis ................................................................................................. 12
2.1.5 WPI Recreation Center ................................................................................................. 15
2.2 Building Information Modeling .......................................................................................... 20
2.2.1 History .......................................................................................................................... 20
2.2.2 Modeling ....................................................................................................................... 21
2.3 Structural Design ................................................................................................................. 22
2.3.1 Current Design .............................................................................................................. 22
2.3.2 Effects of Vibration on Buildings ................................................................................. 23
2.3.3 Alternative Design ........................................................................................................ 26
3.0 Building Information Modeling and Project Management ..................................................... 27
3.1 Project Schedule .................................................................................................................. 27
Planned Schedule ................................................................................................................... 27
Actual Schedule ..................................................................................................................... 28
3.2 4-D Models .......................................................................................................................... 29
3.3 Earned Value Analysis ........................................................................................................ 32
3.4 Quantities ............................................................................................................................ 32
viii
3.5 Monitoring Project Performance ......................................................................................... 38
4.0 Structural Design and Dynamic Performance ......................................................................... 48
4.1 Examining the Current Design ............................................................................................ 48
4.2 Alternative Design............................................................................................................... 53
4.3 Cost Comparison ................................................................................................................. 57
5.0 Conclusions ............................................................................................................................. 59
5.1 Building Information Modeling and Project Management ................................................. 59
5.2 Earned Value Analysis ........................................................................................................ 60
5.3 Structural Analysis .............................................................................................................. 61
5.4 Owner’s Meetings ............................................................................................................... 62
Bibliography ................................................................................................................................. 64
Appendix A: Proposal ................................................................................................................... 65
Appendix B – Attendance at WPI Recreation Center Owner’s Meetings .................................... 66
Owner’s Meeting Agenda ......................................................................................................... 67
Appendix C – Primavera File ....................................................................................................... 72
Appendix D – EVA: Cost ............................................................................................................. 73
Projected – BCWS .................................................................................................................... 73
Concrete ................................................................................................................................. 73
Steel ....................................................................................................................................... 74
Actual – BCWP ......................................................................................................................... 75
Concrete ................................................................................................................................. 75
Steel ....................................................................................................................................... 76
Appendix E – EVA: Schedule Variance & Schedule Performance Index.................................... 77
Appendix F- Design Calculations ................................................................................................. 78
Appendix G – Phasing .................................................................................................................. 79
Developing a Phase ................................................................................................................... 79
Adding Element to a Phase ....................................................................................................... 81
Quantity Takeoffs ...................................................................................................................... 82
Proposed Phases ........................................................................................................................ 86
Actual Phases ............................................................................................................................ 91
Appendix H: Design Constants and Calculations ......................................................................... 94
ix
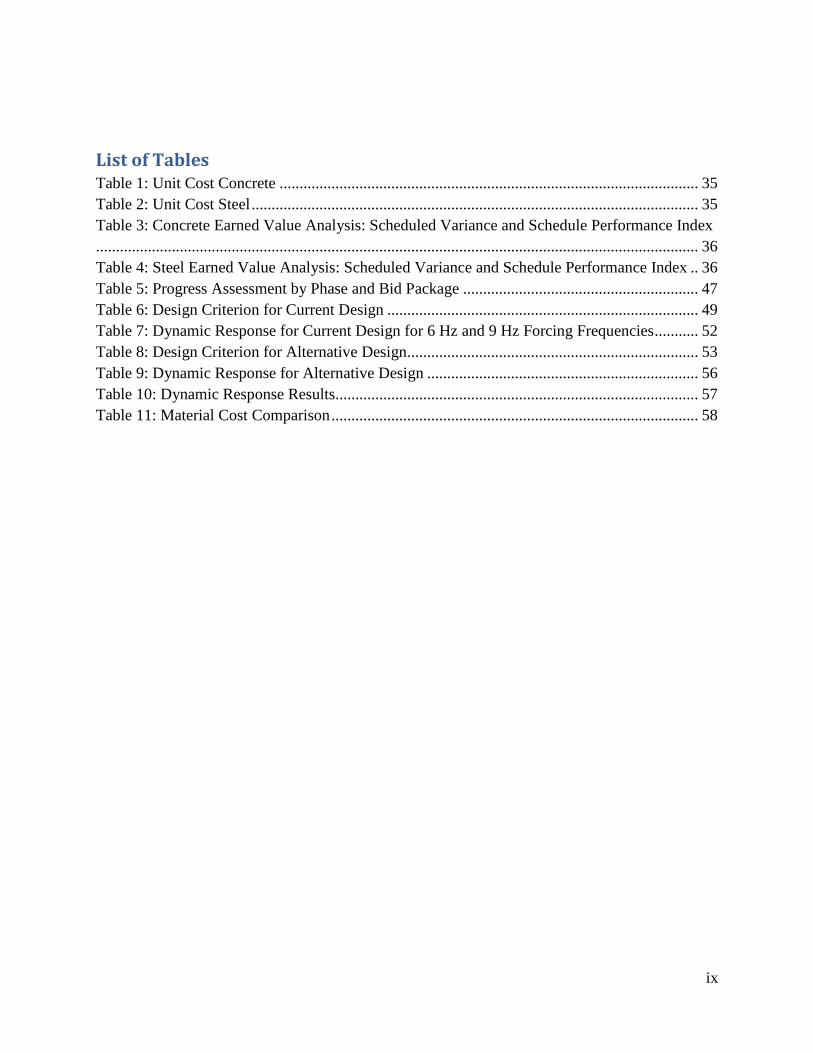
List of Tables Table 1: Unit Cost Concrete ......................................................................................................... 35
Table 2: Unit Cost Steel ................................................................................................................ 35
Table 3: Concrete Earned Value Analysis: Scheduled Variance and Schedule Performance Index
....................................................................................................................................................... 36
Table 4: Steel Earned Value Analysis: Scheduled Variance and Schedule Performance Index .. 36
Table 5: Progress Assessment by Phase and Bid Package ........................................................... 47
Table 6: Design Criterion for Current Design .............................................................................. 49
Table 7: Dynamic Response for Current Design for 6 Hz and 9 Hz Forcing Frequencies ........... 52
Table 8: Design Criterion for Alternative Design......................................................................... 53
Table 9: Dynamic Response for Alternative Design .................................................................... 56
Table 10: Dynamic Response Results........................................................................................... 57
Table 11: Material Cost Comparison ............................................................................................ 58
x
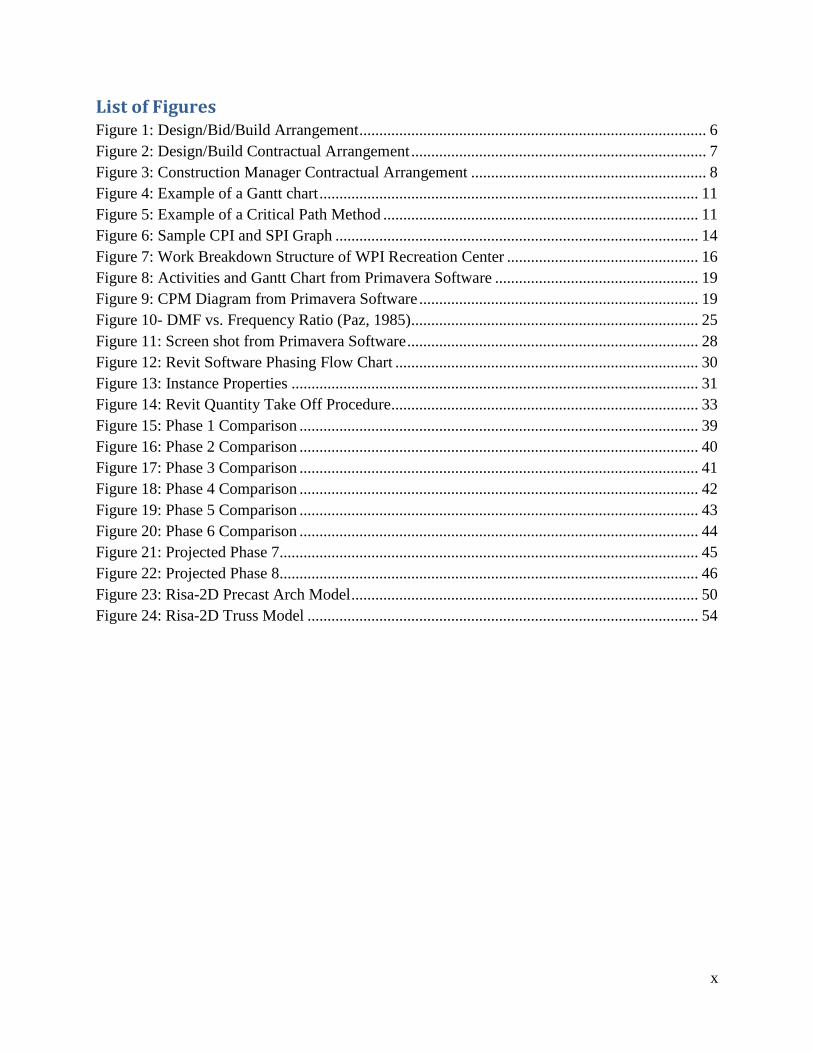
List of Figures Figure 1: Design/Bid/Build Arrangement ....................................................................................... 6
Figure 2: Design/Build Contractual Arrangement .......................................................................... 7
Figure 3: Construction Manager Contractual Arrangement ........................................................... 8
Figure 4: Example of a Gantt chart ............................................................................................... 11
Figure 5: Example of a Critical Path Method ............................................................................... 11
Figure 6: Sample CPI and SPI Graph ........................................................................................... 14
Figure 7: Work Breakdown Structure of WPI Recreation Center ................................................ 16
Figure 8: Activities and Gantt Chart from Primavera Software ................................................... 19
Figure 9: CPM Diagram from Primavera Software ...................................................................... 19
Figure 10- DMF vs. Frequency Ratio (Paz, 1985) ........................................................................ 25
Figure 11: Screen shot from Primavera Software ......................................................................... 28
Figure 12: Revit Software Phasing Flow Chart ............................................................................ 30
Figure 13: Instance Properties ...................................................................................................... 31
Figure 14: Revit Quantity Take Off Procedure............................................................................. 33
Figure 15: Phase 1 Comparison .................................................................................................... 39
Figure 16: Phase 2 Comparison .................................................................................................... 40
Figure 17: Phase 3 Comparison .................................................................................................... 41
Figure 18: Phase 4 Comparison .................................................................................................... 42
Figure 19: Phase 5 Comparison .................................................................................................... 43
Figure 20: Phase 6 Comparison .................................................................................................... 44
Figure 21: Projected Phase 7......................................................................................................... 45
Figure 22: Projected Phase 8......................................................................................................... 46
Figure 23: Risa-2D Precast Arch Model ....................................................................................... 50
Figure 24: Risa-2D Truss Model .................................................................................................. 54
1
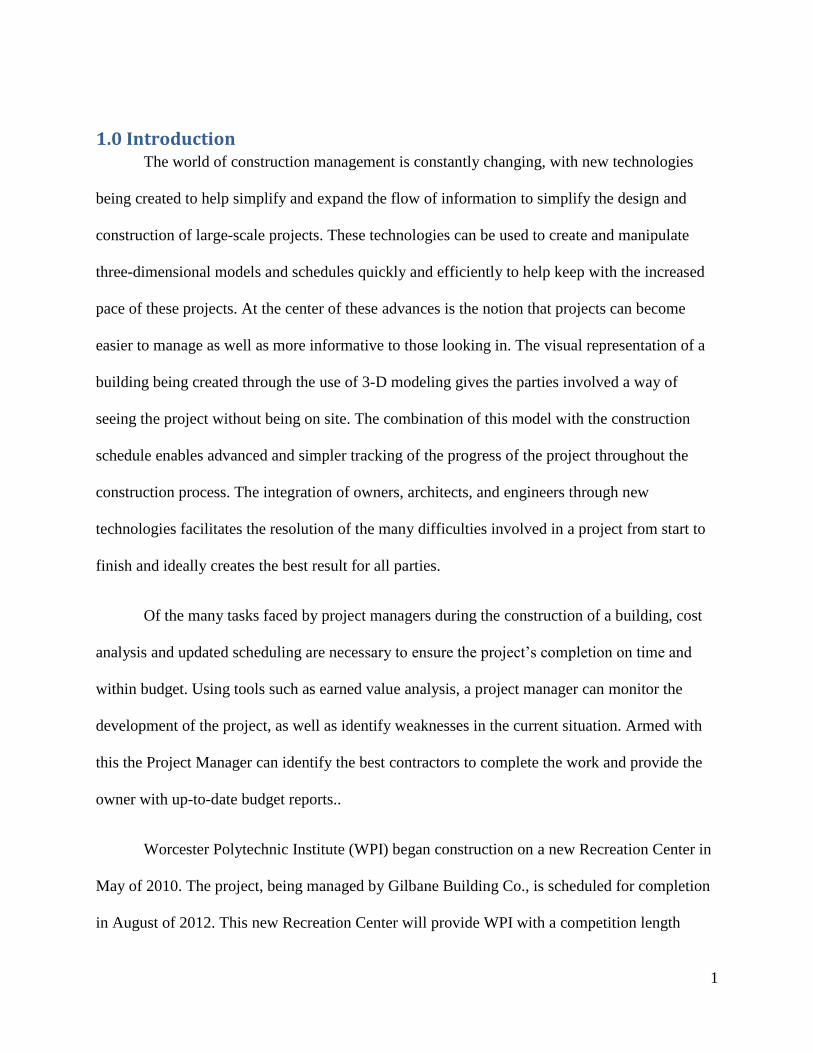
1.0 Introduction The world of construction management is constantly changing, with new technologies
being created to help simplify and expand the flow of information to simplify the design and
construction of large-scale projects. These technologies can be used to create and manipulate
three-dimensional models and schedules quickly and efficiently to help keep with the increased
pace of these projects. At the center of these advances is the notion that projects can become
easier to manage as well as more informative to those looking in. The visual representation of a
building being created through the use of 3-D modeling gives the parties involved a way of
seeing the project without being on site. The combination of this model with the construction
schedule enables advanced and simpler tracking of the progress of the project throughout the
construction process. The integration of owners, architects, and engineers through new
technologies facilitates the resolution of the many difficulties involved in a project from start to
finish and ideally creates the best result for all parties.
Of the many tasks faced by project managers during the construction of a building, cost
analysis and updated scheduling are necessary to ensure the project’s completion on time and
within budget. Using tools such as earned value analysis, a project manager can monitor the
development of the project, as well as identify weaknesses in the current situation. Armed with
this the Project Manager can identify the best contractors to complete the work and provide the
owner with up-to-date budget reports..
Worcester Polytechnic Institute (WPI) began construction on a new Recreation Center in
May of 2010. The project, being managed by Gilbane Building Co., is scheduled for completion
in August of 2012. This new Recreation Center will provide WPI with a competition length
2
swimming pool, racquet ball and squash courts, 14,000 square feet of fitness space, a four-court
gymnasium, indoor rowing tanks, and an extended three-lane track (WPI Sports and Recreation).
The new Recreation Center is the focus of this project because it provides a real world laboratory
to study the use of BIM, EVA, and scheduling coordination as the design changes.
Given a 3-D model of the completed construction, two different four-dimensional models
were developed to contrast the projected and actual progress of the project. In addition to
studying the construction schedule for the Recreation Center, an earned value analysis was
performed to compare the value of the work completed in each projected phase versus the
amount of work completed in the actual phases. An alternative design of the gymnasium, located
on the structure’s fourth floor, was created to explore the differences in frequency and provide a
better understanding of structural dynamics.
The 4th
floor of the new Recreation Center is supported by precast concrete arches
spanning the width of the building. An alternative design explored increases in the vibration
frequency accounted for in the current design to determine if the open space of the 4th
floor could
be used for more intensive activities, such as dancing or aerobics. A proposed design using a
system of steel trusses in place of the concrete arches was explored. The benefits and cons of
each design were weighed, including factors such as cost, ease of fabrication and scheduling
differences, to provide WPI with information for any future projects they may pursue.
As with any project there is an order of operations to how aspects must be completed. On
the following page there is a photo of the order of construction starting with Area A and
concluding with Area D. This project is no different; there were three main pieces that needed to
be completed. First the four-dimensional models needed to be developed and the transition from
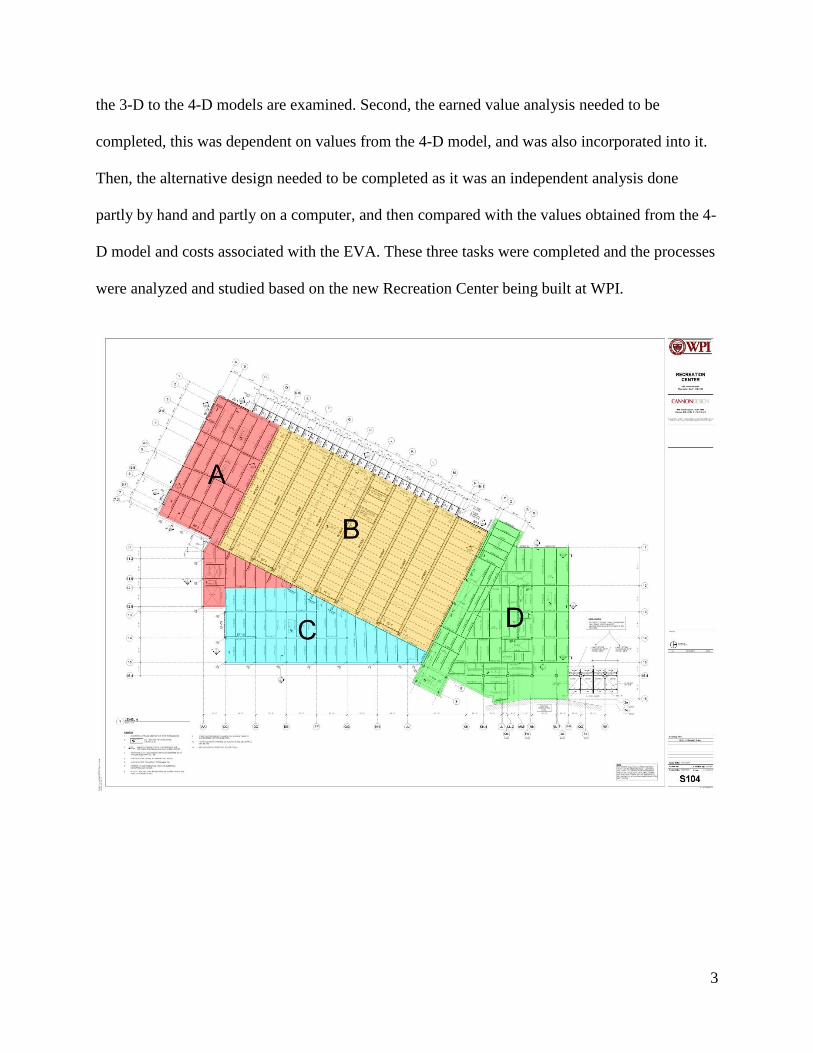
3
the 3-D to the 4-D models are examined. Second, the earned value analysis needed to be
completed, this was dependent on values from the 4-D model, and was also incorporated into it.
Then, the alternative design needed to be completed as it was an independent analysis done
partly by hand and partly on a computer, and then compared with the values obtained from the 4-
D model and costs associated with the EVA. These three tasks were completed and the processes
were analyzed and studied based on the new Recreation Center being built at WPI.
4
2.0 Background
2.1 Project Management Project management is the “the art and science of coordinating people, equipment,
materials, money, and schedules to complete a specified project on time and within approved
cost” (Oberlender, 2000). Since each construction project is different, involving a unique
location, plan, budget, and/or scope, the owner of the project may find it challenging to remain
both knowledgeable and insightful on the various aspects of the project. Project managers are
enlisted to guide the owner through the design and building phases and provide expertise from
their past experiences. Project managers work closely with people from many different areas,
providing them with resources and contacts that may otherwise be unavailable to the owner. By
involving the project manager from the beginning of the process, the owner is able to vary their
level of involvement, while also receiving the benefits of the project manager’s experience.
2.1.1 Contractual Agreements
Each construction project begins with identifying the purpose of the project, and then this
purpose becomes the owner’s scope. The owner must first determine exactly why they want the
facility and what its proposed uses are, before they begin the project. Once the owned knows
what they want out of their building, the owner would need to hire a designer. The first stage of
the design process is called the schematic design, which provides information about the building
elevations, layouts of floors, room arrangements, and other overall features of the project
(Oberlender, 2000). The owner would then be able to conduct schedule and cost estimations and
determine if they want to move forward with the project as currently proposed. If so, a team of
designers would be assembled and a more in depth design would be developed.
5
Design development includes all the uses defined by the owner, including the systems
within the project, and it enables the designer to produce contract documents. The design process
has slight variations depending on the parties involved; however, if the owner is using a project
manager as their representative, they will want to hire them prior to confirming their maximum
budget and desired schedule. By doing this, the owner expects the project manager to completely
understand the project and offer their experience in the initial phases, and offer their experience
to the design team. The relationships among all the parties involved are specifically defined in a
contractual agreement.
The three main contractual agreements for construction projects are design/bid/build
(D/B/B), design/build (D/B), and construction manager (CM) contracts. Contractual agreements
often integrate portions of a variety of these contracts in order to fit the individual needs of the
project. As long as the responsibilities of each party involved are well defined, this practice is
beneficial to the project because it provides the owner with more flexibility.
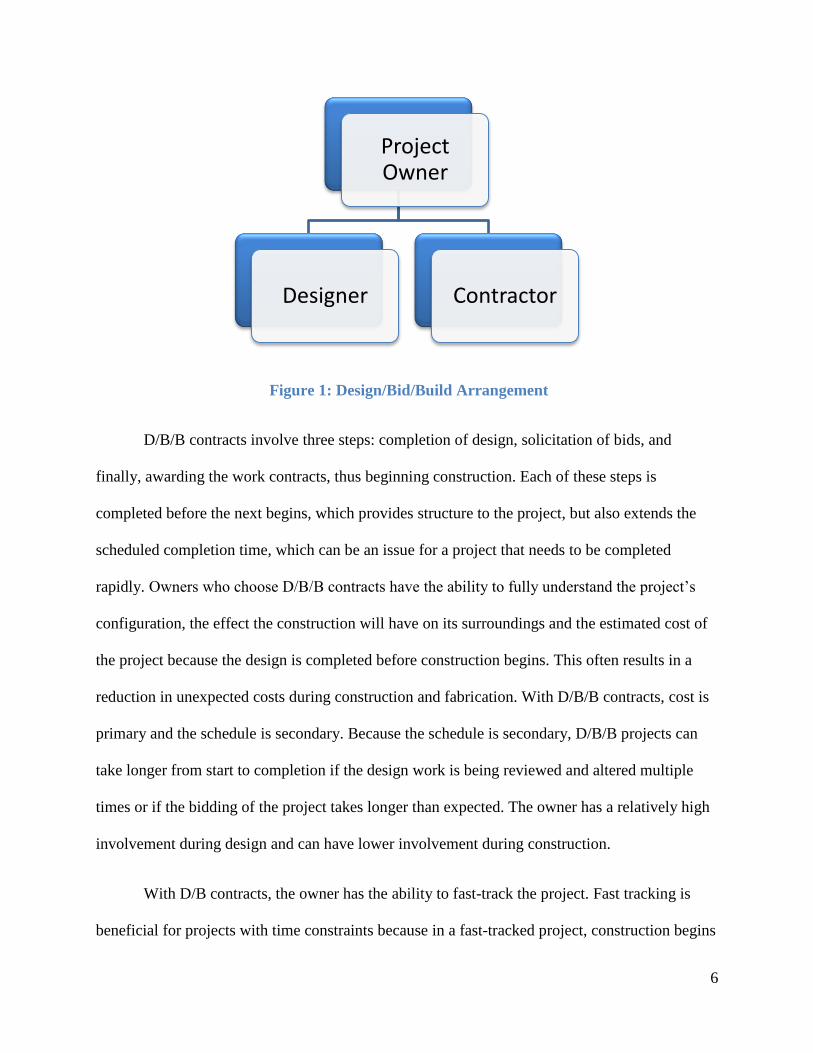
D/B/B contracts are considered the traditional delivery system and are used for buildings
with a well-defined scope (Oberlender, 2000). D/B/B contracts involve three parties: the owner,
the designer, and the builder. In D/B/B contracts, the owner has one contract with the designer
and another with the general contractors, as seen in Figure 1 below.
6
Figure 1: Design/Bid/Build Arrangement
D/B/B contracts involve three steps: completion of design, solicitation of bids, and
finally, awarding the work contracts, thus beginning construction. Each of these steps is
completed before the next begins, which provides structure to the project, but also extends the
scheduled completion time, which can be an issue for a project that needs to be completed
rapidly. Owners who choose D/B/B contracts have the ability to fully understand the project’s
configuration, the effect the construction will have on its surroundings and the estimated cost of
the project because the design is completed before construction begins. This often results in a
reduction in unexpected costs during construction and fabrication. With D/B/B contracts, cost is
primary and the schedule is secondary. Because the schedule is secondary, D/B/B projects can
take longer from start to completion if the design work is being reviewed and altered multiple
times or if the bidding of the project takes longer than expected. The owner has a relatively high
involvement during design and can have lower involvement during construction.
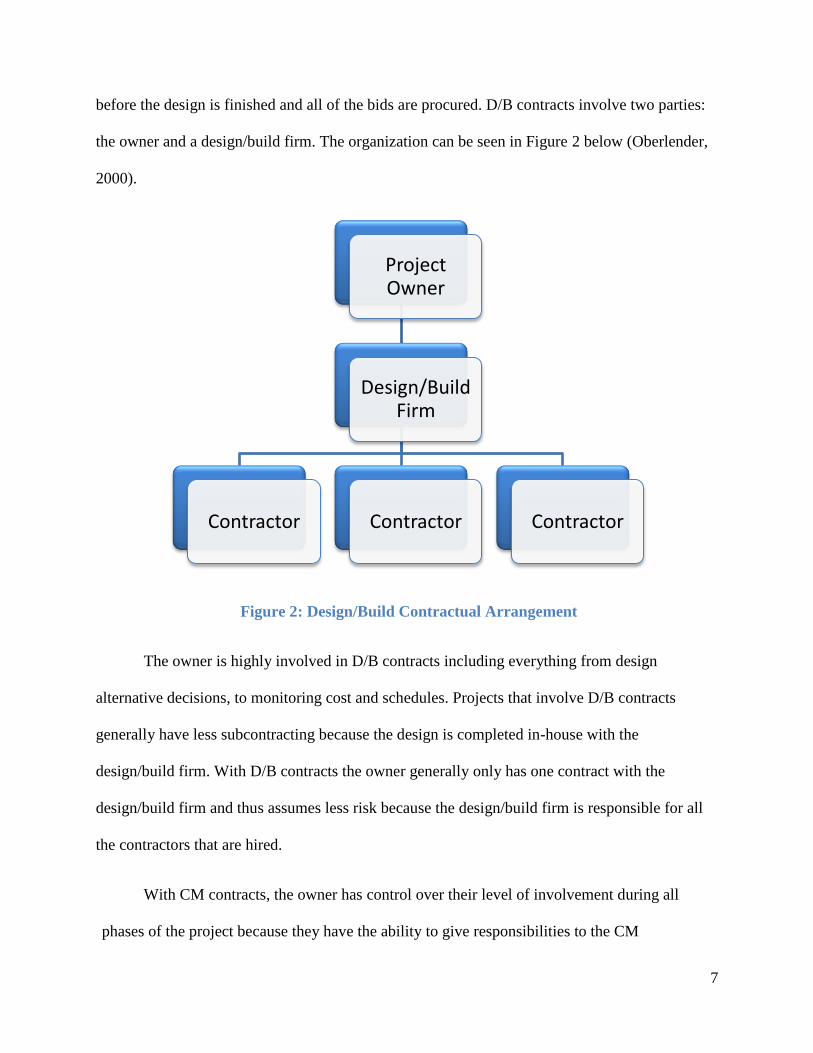
With D/B contracts, the owner has the ability to fast-track the project. Fast tracking is
beneficial for projects with time constraints because in a fast-tracked project, construction begins
Project Owner
Designer Contractor
7
before the design is finished and all of the bids are procured. D/B contracts involve two parties:
the owner and a design/build firm. The organization can be seen in Figure 2 below (Oberlender,
2000).
Figure 2: Design/Build Contractual Arrangement
The owner is highly involved in D/B contracts including everything from design
alternative decisions, to monitoring cost and schedules. Projects that involve D/B contracts
generally have less subcontracting because the design is completed in-house with the
design/build firm. With D/B contracts the owner generally only has one contract with the
design/build firm and thus assumes less risk because the design/build firm is responsible for all
the contractors that are hired.
With CM contracts, the owner has control over their level of involvement during all
phases of the project because they have the ability to give responsibilities to the CM
Project Owner
Design/Build Firm
Contractor Contractor Contractor
8
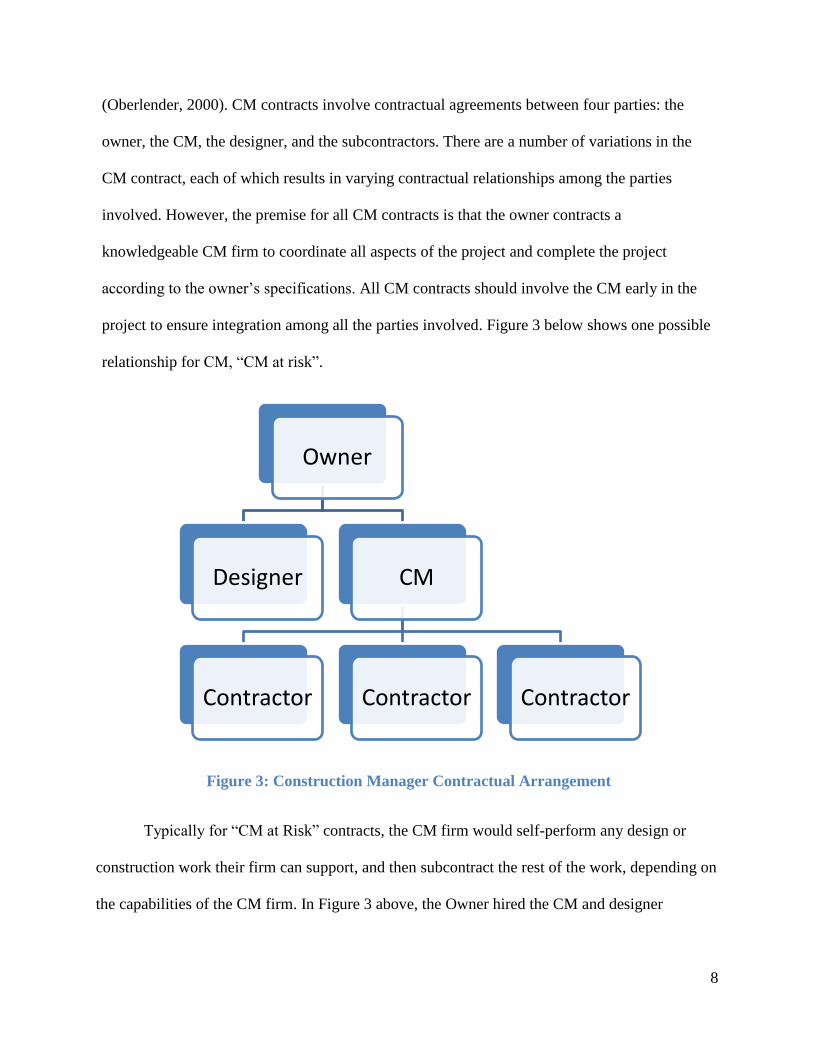
(Oberlender, 2000). CM contracts involve contractual agreements between four parties: the
owner, the CM, the designer, and the subcontractors. There are a number of variations in the
CM contract, each of which results in varying contractual relationships among the parties
involved. However, the premise for all CM contracts is that the owner contracts a
knowledgeable CM firm to coordinate all aspects of the project and complete the project
according to the owner’s specifications. All CM contracts should involve the CM early in the
project to ensure integration among all the parties involved. Figure 3 below shows one possible
relationship for CM, “CM at risk”.
Figure 3: Construction Manager Contractual Arrangement
Typically for “CM at Risk” contracts, the CM firm would self-perform any design or
construction work their firm can support, and then subcontract the rest of the work, depending on
the capabilities of the CM firm. In Figure 3 above, the Owner hired the CM and designer
Owner
Designer CM
Contractor Contractor Contractor
9
separately, and therefore the owner would assume the risk associated with the design, and the
CM would assume the risk associated with the contractors or subcontractors.
2.1.2 Project Financing
The project financing is another essential component of project management. This
includes setting the budget, which dictates the outcome of the entire project, and arranging the
appropriate terms of payment, which ensures all parties involved understand how payment will
be processed. These critical factors require open communication and are essential to the success
of the project.
When the project begins, the owner must identify the maximum amount they are willing
to spend, or are capable of spending. The early stages of estimating are not very accurate because
the materials that will be used and the complexities of the design are unknown, but early
estimates are still important because it adds limits for the project team to follow (Oberlender,
2000). By comparing these initial estimates with the final cost, the project team can determine
how successful they were and identify areas of improvement that can be applied to future
projects. Once the owner has identified their budget, the other parties involved must base their
budgets on it. For some parties, this might mean variations in material selection, while for others,
it might require a reduction in profits. For both cases, the party must consider the risk associated
with these changes (Oberlender, 2000).
Another critical factor affecting the financing of a project is the terms of payment. The
terms of payment are defined in the contractual agreements and critically affect the risk that each
party assumes in the project. Some options for the terms of payment include a lump-sum
arrangement; this is when the owner pays a fixed price for the work (Oberlender, 2000). Since
this fixed price does not vary with changes in the actual cost of the materials or labor, the CM
10
would assume the contingency risks that exceed their projected estimates. Another option is a
unit-price arrangement, where the contractors charges per unit of work rather than for the entire
project.
Unit-price arrangements are ideal for projects with excessive excavation or other areas of
work with significant uncertainty. This arrangement protects the CM from possibly exceeding
the construction contingencies and protects the owner from inflated bids that would have covered
these high risk cases. The final option is a cost-plus contract, which requires the owner to pay the
cost of materials and labor plus an additional fee (Oberlender, 2000). Cost-plus contracts may
also use a Guaranteed Maximum Price (GMP). GMP contracts ensure that the CM will be
reimbursed for all monies spent within the GMP budget, but also reduces risk to the owner by
obligating the CM to stay within a guaranteed maximum price. If the CM exceeds the GMP, they
are responsible for the additional cost, and in turn, their profits will decrease accordingly.
2.1.3 Project Schedule
The project schedule is created by; first determining the method of construction, then
determining the sequential order of the work to be completed, then identifying appropriate
durations, and finally determining the start and finish dates for the project (Oberlender, 2000).
Ensuring that all the activities that need to be completed are identified is the most important
predecessor to the project schedule. The owner is responsible for identifying the start and
completion dates for the project. Once they are established, the designer and contractor are
contracted to work in accordance with these dates.
Using the activities and schedules defined, the project manager can create a visual
representation of the schedule. This can be in the form of a Gantt Chart or a Critical Path Method
(CPM) network diagram. Gantt charts are bar charts that show each activity as a separate bar
11
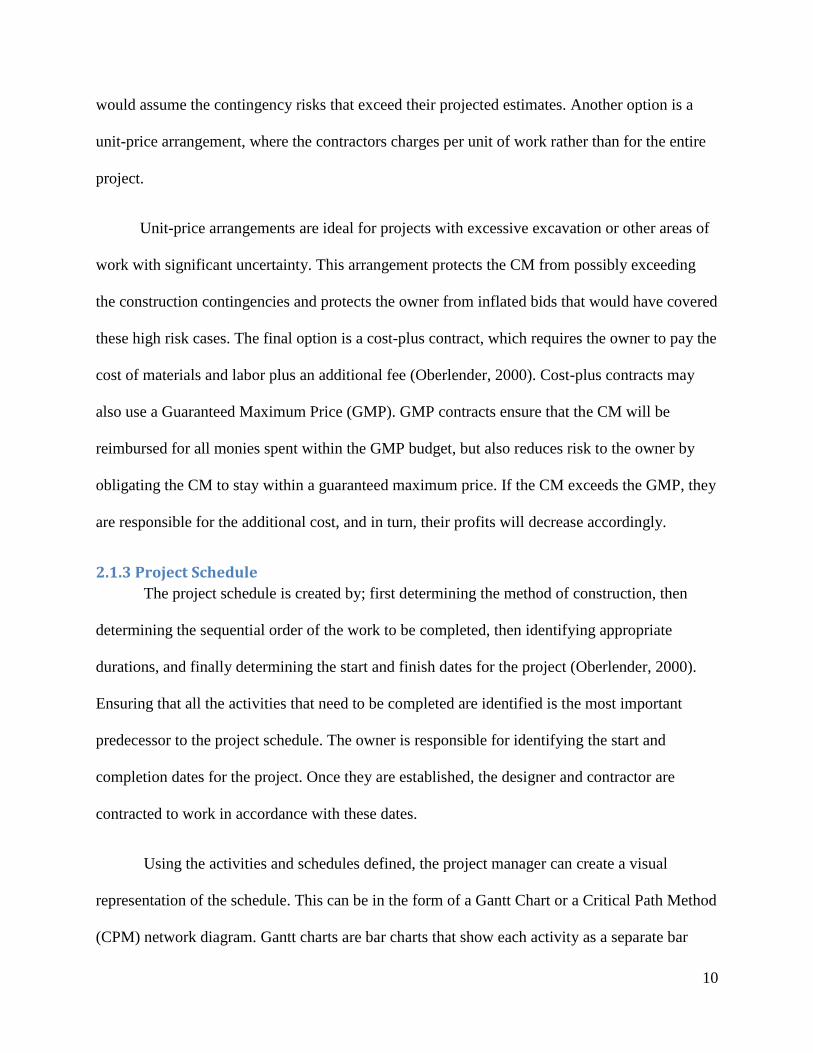
plotted against the total duration of the project. A Gantt chart is useful when looking at the
schedule day to day because it shows what activities are happening daily. In Figure 4 below, an
example of a Gantt chart, the activities that dictate the duration, or critical activities, are
identified using a red block, and the lag time for the activity is indicted by the blue arrow.
Figure 4: Example of a Gantt chart
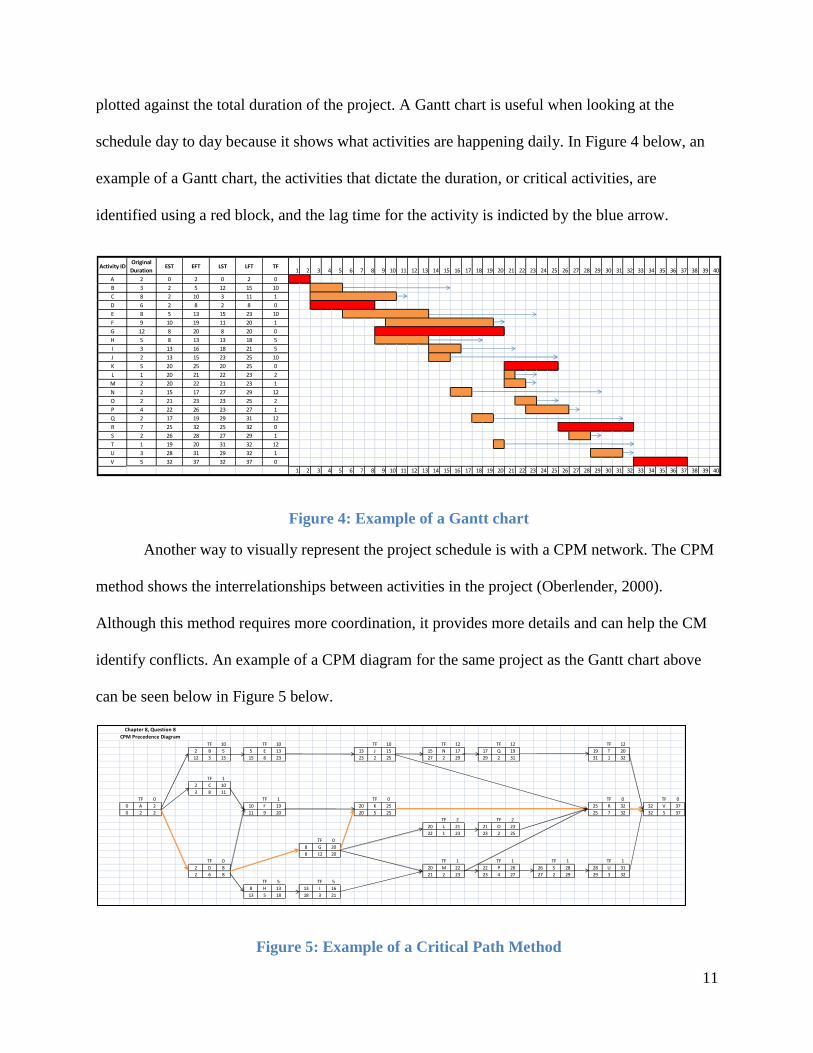
Another way to visually represent the project schedule is with a CPM network. The CPM
method shows the interrelationships between activities in the project (Oberlender, 2000).
Although this method requires more coordination, it provides more details and can help the CM
identify conflicts. An example of a CPM diagram for the same project as the Gantt chart above
can be seen below in Figure 5 below.
Figure 5: Example of a Critical Path Method
Activity IDOriginal
DurationEST EFT LST LFT TF
1 2 3 4 5 6 7 8 9 10 11 12 13 14 15 16 17 18 19 20 21 22 23 24 25 26 27 28 29 30 31 32 33 34 35 36 37 38 39 40
A 2 0 2 0 2 0
B 3 2 5 12 15 10
C 8 2 10 3 11 1
D 6 2 8 2 8 0
E 8 5 13 15 23 10
F 9 10 19 11 20 1
G 12 8 20 8 20 0
H 5 8 13 13 18 5
I 3 13 16 18 21 5
J 2 13 15 23 25 10
K 5 20 25 20 25 0
L 1 20 21 22 23 2
M 2 20 22 21 23 1
N 2 15 17 27 29 12
O 2 21 23 23 25 2
P 4 22 26 23 27 1
Q 2 17 19 29 31 12
R 7 25 32 25 32 0
S 2 26 28 27 29 1
T 1 19 20 31 32 12
U 3 28 31 29 32 1
V 5 32 37 32 37 0
1 2 3 4 5 6 7 8 9 10 11 12 13 14 15 16 17 18 19 20 21 22 23 24 25 26 27 28 29 30 31 32 33 34 35 36 37 38 39 40
TF 10 TF 10 TF 10 TF 12 TF 12 TF 12
2 B 5 5 E 13 13 J 15 15 N 17 17 Q 19 19 T 20
12 3 15 15 8 23 23 2 25 27 2 29 29 2 31 31 1 32
TF 1
2 C 10
3 8 11
TF 0 TF 1 TF 0 TF 0 TF 0
0 A 2 10 F 19 20 K 25 25 R 32 32 V 37
0 2 2 11 9 20 20 5 25 25 7 32 32 5 37
TF 2 TF 2
20 L 21 21 O 23
22 1 23 23 2 25
TF 0
8 G 20
8 12 20
TF 0 TF 1 TF 1 TF 1 TF 1
2 D 8 20 M 22 22 P 26 26 S 28 28 U 31
2 6 8 21 2 23 23 4 27 27 2 29 29 3 32
TF 5 TF 5
8 H 13 13 I 16
13 5 18 18 3 21
Chapter 8, Question 8
CPM Precedence Diagram
12
During the planning and construction of a project, the schedule is a key element used in
project management. These visual representations of the schedule can be used in coordination
meetings and can be understood by the owner. Most importantly, however, these charts visually
translate the timeline of the project, which is essential to a timely completion.
2.1.4 Earned Value Analysis
Earned value analyses are used to monitor the progress of work completed as compared
to the planned work (Oberlender, 2000). The budgeted cost of work scheduled (BCWS) is the
amount of money that was budgeted at each time period. The BCWS can be found by adding the
individual costs for each of the activities within a certain phase of the CPM diagram. The curve
generated by accumulating the sum of cost within each phase over the duration of the project is
known as the Lazy S curve. The actual amount of money spent during each phase is the actual
cost of work performed (ACWP). The ACWP is found by referencing the records of the project
and totaling the cost of work and materials actually used. The amount of money earned based on
the work that has been completed is the budgeted cost of work performed (BCWP). The BCWP
is calculated by multiplying the percentage of work completed by the total budgeted cost of the
activity. As seen in the equations below from Oberlender (2000), the cost and schedule variances
and performance indexes can be calculated using BCWS, ACWP, and BCWP.
13
The cost variance shows whether the work paid for was equivalent to the work actually
completed. Therefore, if more money was paid in a period than was budgeted to be completed
for that period, there would be a cost overrun. This overrun is signified by a negative value for
the cost variance and a cost performance index that is less than one. The schedule variance is
similar to the cost variance in that it subtracts the planned cost of work scheduled from the
earned cost of work performed. Therefore, if the budgeted work hours are less than the earned
work hours, then the project is ahead of schedule, whereas, the reverse would mean the project is
behind schedule (Oberlender, 2000).
The cost performance index (CPI) and schedule performance index (SPI) show the
magnitude of cost and schedule overrun or under run, respectively. Zero or positive variances
and an index of 1.0 is a favorable performance because this indicates that the project is on, or is
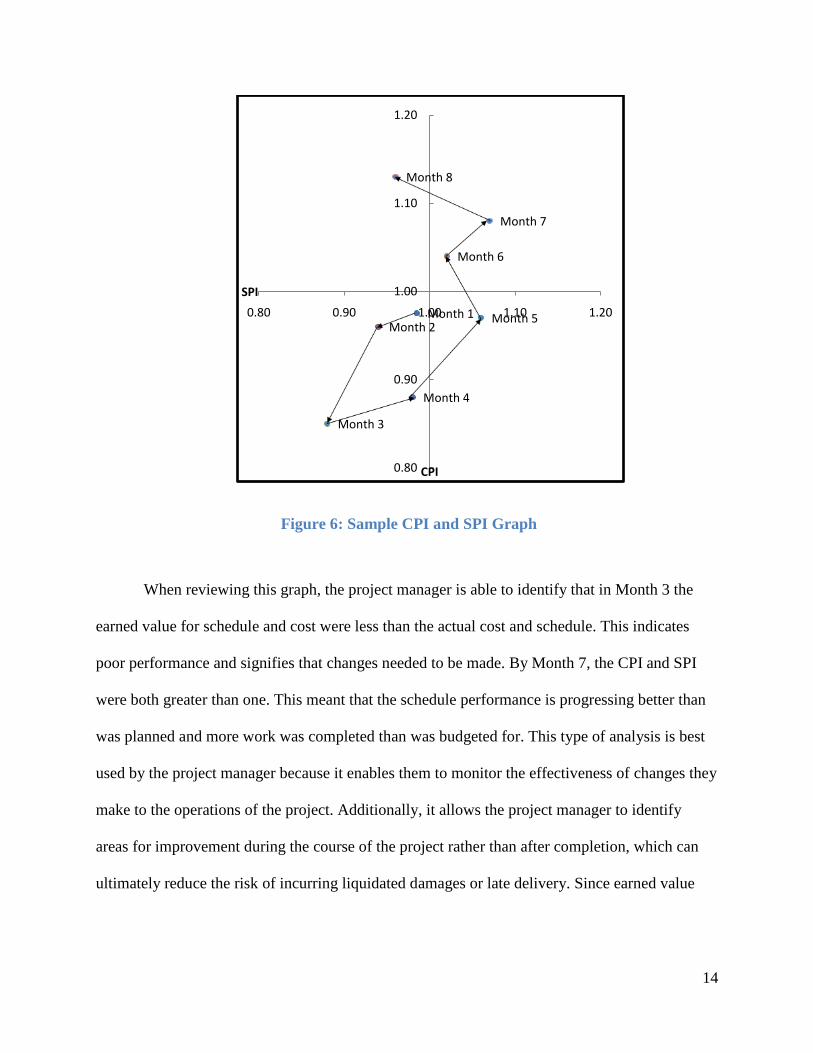
ahead of schedule and performance. By plotting the CPI and SPI on a graph as seen in Figure 6
below, the project manager can measure how well the planned cost compares to the actual costs
incurred and work completed.
14
Figure 6: Sample CPI and SPI Graph
When reviewing this graph, the project manager is able to identify that in Month 3 the
earned value for schedule and cost were less than the actual cost and schedule. This indicates
poor performance and signifies that changes needed to be made. By Month 7, the CPI and SPI
were both greater than one. This meant that the schedule performance is progressing better than
was planned and more work was completed than was budgeted for. This type of analysis is best
used by the project manager because it enables them to monitor the effectiveness of changes they
make to the operations of the project. Additionally, it allows the project manager to identify
areas for improvement during the course of the project rather than after completion, which can
ultimately reduce the risk of incurring liquidated damages or late delivery. Since earned value
Month 1Month 2
Month 3
Month 4
Month 5
Month 6
Month 7
Month 8
0.80
0.90
1.00
1.10
1.20
0.80 0.90 1.00 1.10 1.20
SPI
CPI
15
analyses require detailed information such as quantities, cost per unit or phase, and detailed
schedule tracking, the owner most likely would not be completing this analysis.
2.1.5 WPI Recreation Center
The management of the construction of the new WPI Recreation Center displays many
project management techniques. The project involves a CM @ Risk contractual agreement, a
cost plus compensation with a GMP, and extensive use of scheduling aids. The project also
utilizes weekly owner’s meetings that serve to update the owner and discuss progress and
potential changes of scope as well as a number of other planning meetings, such as coordination
meetings. Like every construction project, there are a number of components in this project that
involve details that are specific to this project; and it is because of this that project management
is essential to any project’s success.
The new WPI Recreation Center involves a CM Agent contract with Cardinal
Construction and a CM @ Risk contract with Gilbane Building Co. (Gilbane). Cardinal
Construction works as the owner’s representative on this project, which means they are
responsible for ensuring WPI’s voice is always represented. Since Cardinal has worked closely
with WPI’s campus and community on a number of other projects they are able to provide
insight from their past experiences. Gilbane was brought into the project in the pre-construction
phases as the CM @ Risk. For this project, Gilbane is not self-performing any of the work and is
providing the owner, WPI, with a GMP contract, and therefore was assuming financial risk in the
project. Additionally, Cannon Design is the designer for the project and is contracted directly to
WPI, although they work closely with Gilbane and Cardinal Construction to ensure the success
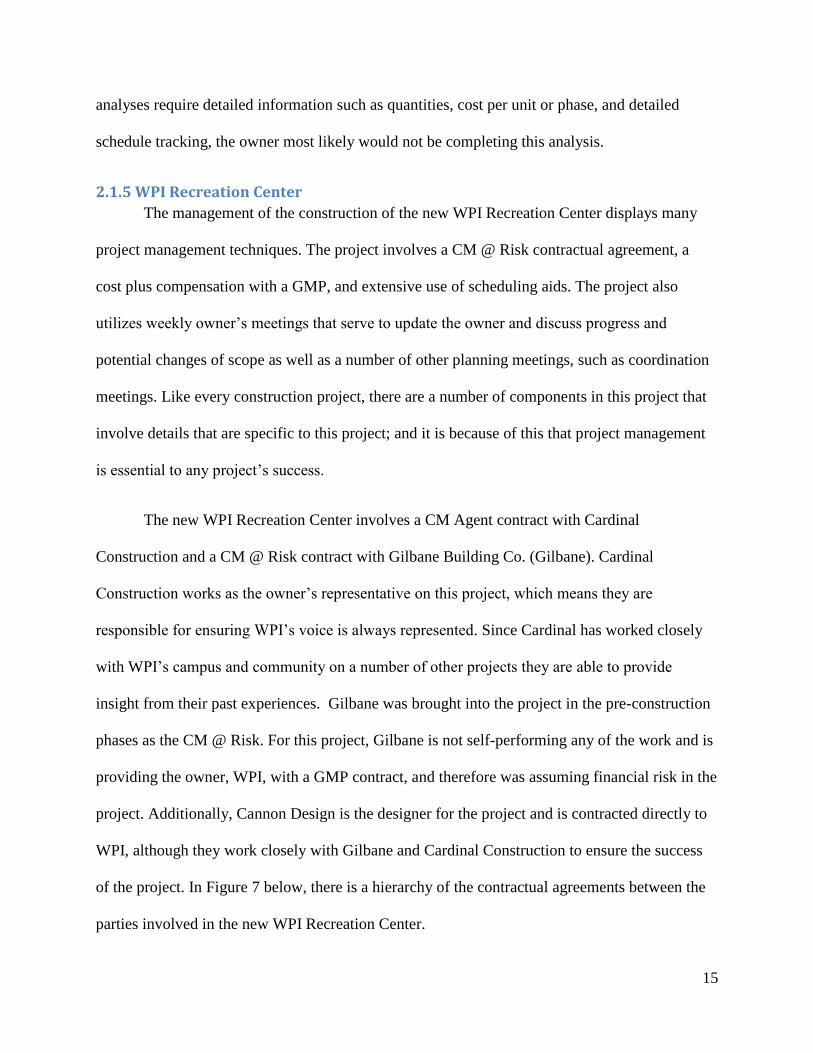
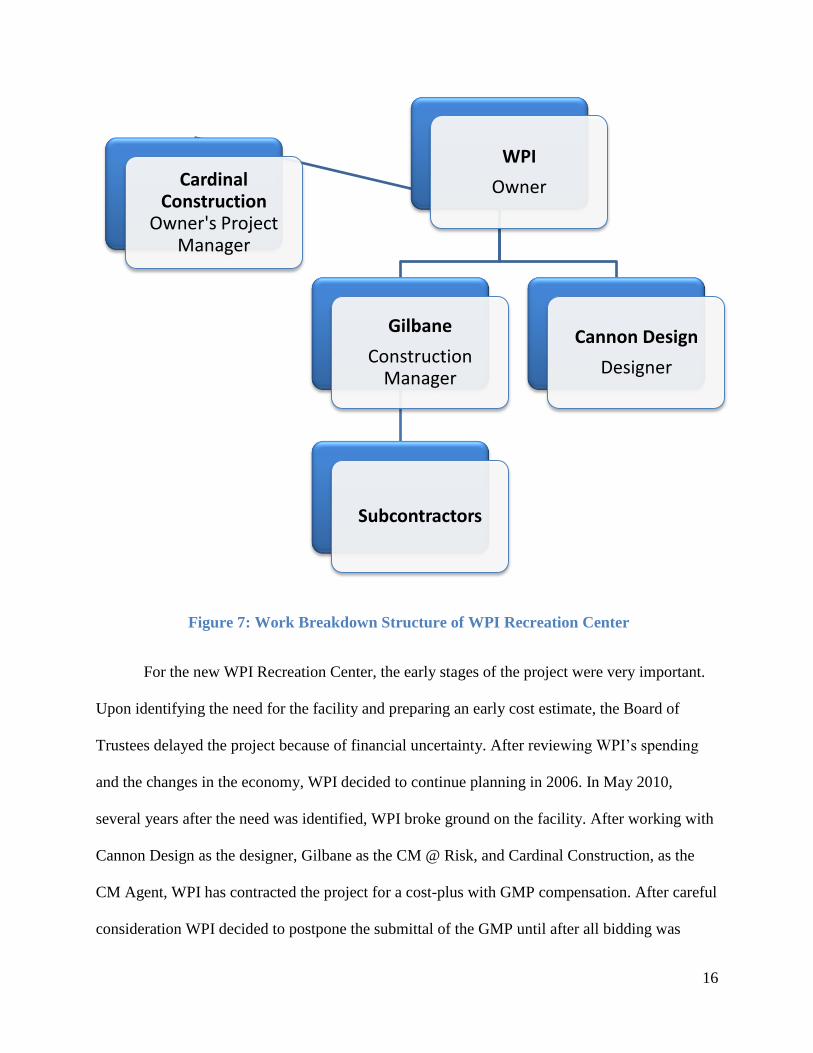
of the project. In Figure 7 below, there is a hierarchy of the contractual agreements between the
parties involved in the new WPI Recreation Center.
16
Figure 7: Work Breakdown Structure of WPI Recreation Center
For the new WPI Recreation Center, the early stages of the project were very important.
Upon identifying the need for the facility and preparing an early cost estimate, the Board of
Trustees delayed the project because of financial uncertainty. After reviewing WPI’s spending
and the changes in the economy, WPI decided to continue planning in 2006. In May 2010,
several years after the need was identified, WPI broke ground on the facility. After working with
Cannon Design as the designer, Gilbane as the CM @ Risk, and Cardinal Construction, as the
CM Agent, WPI has contracted the project for a cost-plus with GMP compensation. After careful
consideration WPI decided to postpone the submittal of the GMP until after all bidding was
WPI
OwnerCardinal Construction
Owner's Project Manager
Gilbane
Construction Manager
Subcontractors
Cannon Design
Designer
17
completed. The finalization of certain specialty items within the facility delayed the bidding and
thus the GMP was not officially submitted until late 2010. However, by waiting until after the
bidding process Gilbane was able to provide a GMP that contained fewer contingencies because
there were fewer unknown costs, which is ultimately a benefit to the owner. As of early 2011,
construction is underway and project management techniques continue to be utilized. One
essential technique that was used from the beginning of the project is weekly meetings with all
those involved in the project.
Owner’s Meetings
In many construction projects, after contractual agreements are defined, the project
begins and typically, this involves Owner’s Meetings, Design Kick-Off Meetings, Coordination
Meetings, and a number of other planning meetings. All of these meetings have the common
goal of communicating to all parties involved, the evolution of the project from scope to final
product. In the case of the new WPI Recreation Center, Owner’s Meetings began early on, first
with the designer and then with the designer and CM, and continued at weekly intervals
throughout the project.
Owner’s Meetings are held to ensure the project is remaining true to the scope and within
budget, to keep the owner notified of and involved in changes and delays, to anticipate potential
changes, to make decisions regarding subcontracts and selection of material, and to address any
other topics that the involved parties feel are necessary. WPI, as the owner, has chosen to remain
highly involved, and during the Owner’s Meetings they are able to approve change orders and
consult with Gilbane about the effects of the project on the site and the surrounding area.
Representatives from WPI, Gilbane, Cardinal Construction, and Cannon Design attend Owner’s
Meetings, and a detailed breakdown of the typical participants to these meetings and their titles
18
can be found in Appendix B. Some of those who attend the meetings regularly include Neil
Benner, senior project manager from Gilbane, Brent Arthaud, Cardinal Construction, Jeff
Solomon, Chief Financial Officer of WPI, Dana Harman, Director of Physical Education,
Recreation, and Athletics of WPI, and Alfredo DiMauro, Assistant Vice President for Facilities
of WPI. Other parties attend less frequently depending on the topics being discussed. For
example, Sean O’Connor from WPI Network Operations attended a meeting that discussed
installing a web camera in the pool Area A during construction.
Neil Benner prepares the agenda for the Owner’s Meeting, using Prolog Manager
Software (Prolog), and chairs the meetings with an agenda generated from Prolog. A sample of
these agendas can be seen in Appendix B. Mr. Benner directs the discussion along each of the
topics, and Melissa Hinton, Project Engineer, takes notes on updates and changes, and reflects
these changes in future agendas. These meetings are run as discussions based on jointly
identified issues that need to be addressed. At the meetings, various groups offer their expertise
or opinions on topics in which they are knowledgeable and act according to their contractual
roles and responsibilities. Some past topics include excess soil usage, decisions on the indoor
rowing tank, procurement, and redesigns for areas such as the robot pits. This is just a sample of
the many topics discussed in these meetings. Representatives from WPI are able to report
conflicts resulting from construction, such as fencing needed for soccer balls and field hockey
balls, emergency blue lights, and additional lighting on redirected access routes. WPI’s decision
to remain highly involved ensures that the project is true to their specific needs and that all
parties involved are on schedule and within budget.
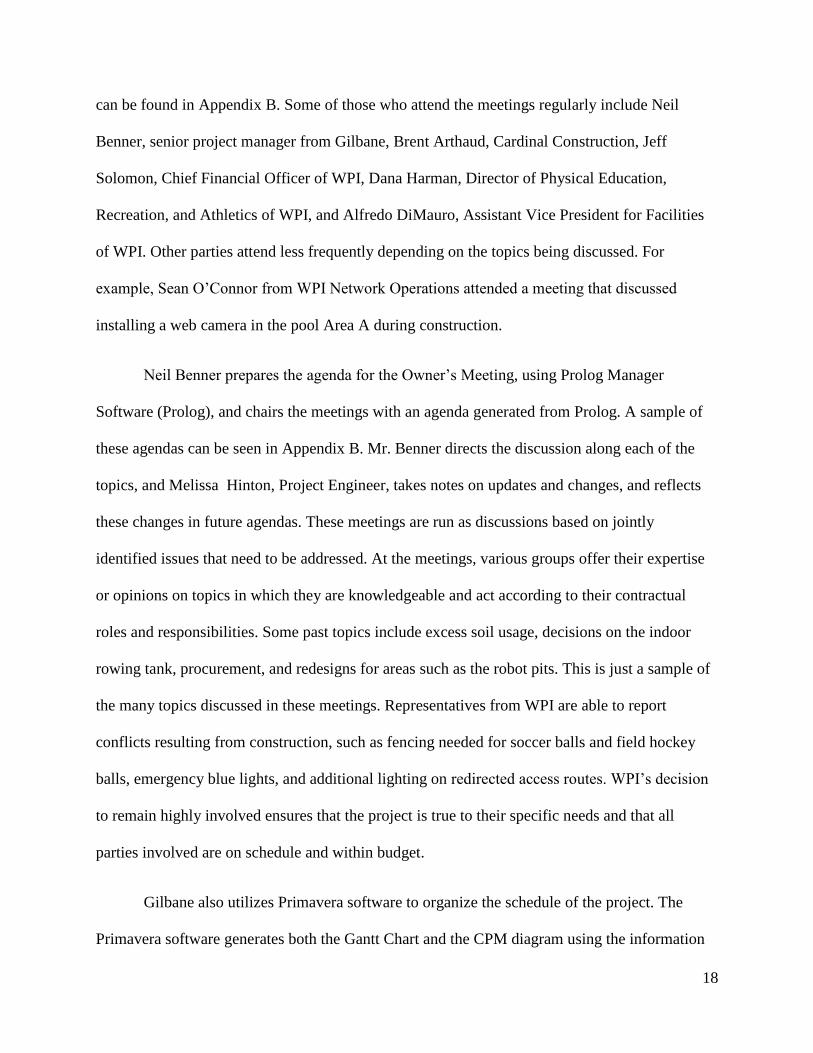
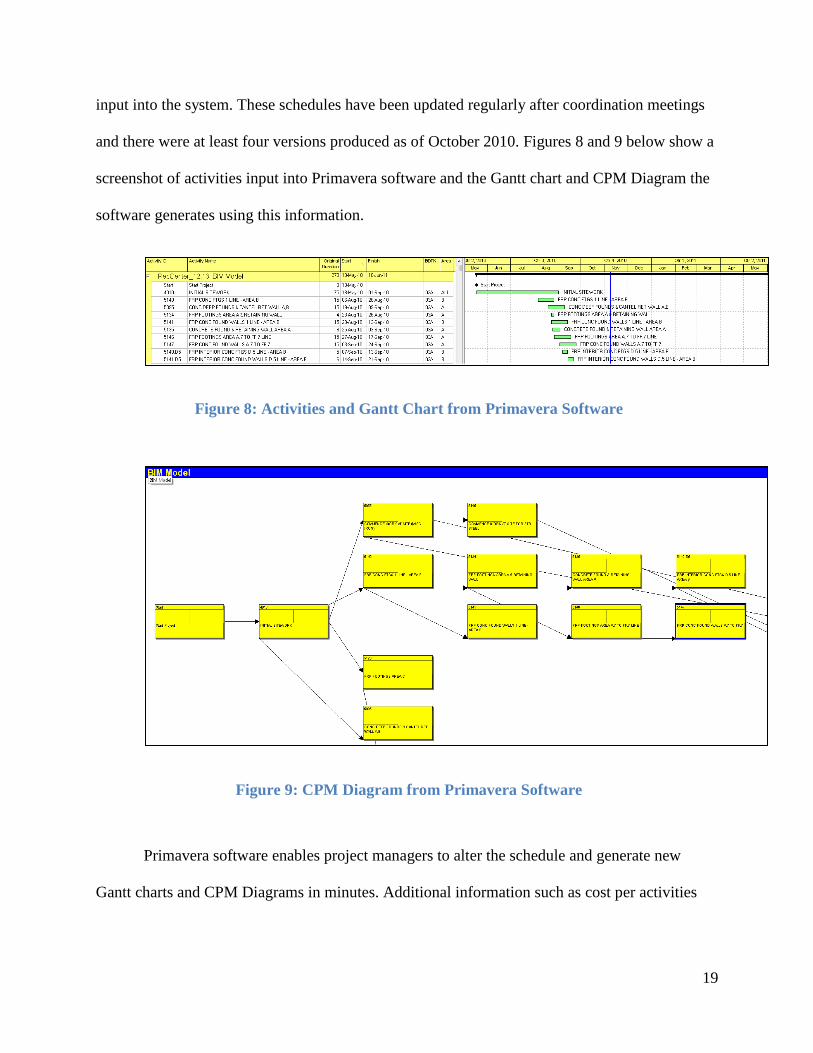
Gilbane also utilizes Primavera software to organize the schedule of the project. The
Primavera software generates both the Gantt Chart and the CPM diagram using the information
19
input into the system. These schedules have been updated regularly after coordination meetings
and there were at least four versions produced as of October 2010. Figures 8 and 9 below show a
screenshot of activities input into Primavera software and the Gantt chart and CPM Diagram the
software generates using this information.
Figure 8: Activities and Gantt Chart from Primavera Software
Figure 9: CPM Diagram from Primavera Software
Primavera software enables project managers to alter the schedule and generate new
Gantt charts and CPM Diagrams in minutes. Additional information such as cost per activities
20
and any other user-defined category may also be added to each activity, which can be used to
generate the Earned Value Analysis and the Lazy S Curve.
2.2 Building Information Modeling Building information modeling, or BIM, as it is commonly referred to by project
managers, architects, and other professionals who use it, is a process of creating and managing
building data during the construction process (Lee, 2006). BIM is a framework in which a
designer combines a three-dimensional model of a construction project with other information to
provide more than just the visual representation of the physical building. The designer as well as
the construction manager can then add in other dimensions to create a multidimensional model
that not only encompasses the physical building itself, but a variety of other important factors in
the project life cycle. Examples of higher dimension models are: a four-dimensional model that
incorporates time into the project, or a five-dimensional model incorporating time and economic
considerations. These models can help to avoid construction issues involving scheduling, cost, or
construction problems that may occur.
The common mistake people make with understanding what BIM is truly about, is that
BIM is more of an idea or a theory rather than a program in itself. BIM is the combination of
various programs to create one multidimensional model, rather than opening up software titled
“BIM”, and creating the entire model in one place. As it stands now, the three-dimensional
image of the building must be constructed in one software and then combined with other
dimensions and information from other sources.
2.2.1 History
According to the article “Are we forgetting design?”, Professor Charles M. Eastman of
Georgia Tech is credited with the term BIM; however, this is a disputed claim as Phil Bernstein
was the first person to actually use the term (Laiserin, 2002). Despite this dispute, Eastman is
21
considered to be the accepted origin because of early referencing to a building product model in
the 1970s (Eastman, 1999). The first use of BIM was in the virtual building concept by
Graphisoft in 1987 using a program called ArchiCAD (Laiserin, 2003) Graphisoft is not the only
company that has software that can be used for BIM, as the program Revit is offered by
Autodesk.
In August of 2004 the U.S. National Institute of Standards and Technology published a
report called “Cost Analysis of Inadequate Interoperability in U.S. Capital Facilities Industry”.
This report said that over ten billion dollars a year were lost by capital facilities in the United
States because of a lack of standardization (Gallaher, 2004). If there is no standard to govern the
way information within the model regarding materials, design, cost, schedule, etc. is
communicated to everyone who is a part of the construction process, information can be left out
and decisions can be made without all the necessary background. Making decisions without all
the necessary information can be a costly mistake. With this statistic being widely publicized
more and with the increased efficiency afforded by BIM, more companies are moving towards
incorporating a BIM model into their construction process.
2.2.2 Modeling
There are different types of BIM models that can be developed from three-dimensional to
greater multidimensional models. A three-dimensional model is simply a visual representation of
the building. However, this model includes an exact construction list of all the materials used.
This facility provides an easy way to quantify the materials that are used to construct the
building, and may also provide a detailed list of the items inside. Example queries would be
cubic yards of concrete, or how many beams of a certain size are used in the building. A four-
dimensional model (4-D) would be a combination of the three-dimensional model plus either
22
time, determined by the schedule, which is the typical choice for the 4-D, or the cost . A five-
dimensional model would be a combination of both the schedule and cost added to the three-
dimensional model.
The four-dimensional (4-D) model with respect to time is a useful tool in project
management. This allows the project manager to visually associate the 3-D digital representation
of the building with its actual construction progress. This model provides a visual representation
that can be used as a tool to show whether the project is on schedule, ahead of schedule, or
behind schedule easily based on the progress of the construction site. This information allows the
project manager to better communicate what is to be expected in order for construction to
progress on time. The model allows for better management of resources because it combines
them into a simpler form.
2.3 Structural Design In addition to using 4-D modeling in tracking and updating the construction of the
Recreation Center, the support system for the 4th
floor gymnasium was examined to explore
vibration loads and create an alternative design. The alternative design aimed to replace the pre-
cast concrete arches with a system of steel trusses. The two designs were analyzed for the current
frequency on the structure and also with an increase in the excitation force consistent with a
sporting event to that of a dance, thus increasing the vibration load. The current design was used
to first determine the appropriate steps in modeling and analyzing a support system for static and
dynamic response, and then how to apply this design in creating an alternative support system.
2.3.1 Current Design
The 4th floor of the WPI Recreation Center has over 29,000 square feet of open space
dedicated to four basketball courts, but this space can also be used for other functions. Events,
23
specifically Commencement, are currently held in Harrington Auditorium during inclement
weather, despite the limited capacity that Harrington possesses. The open-style gymnasium
provides a better solution to Commencement relocation and would allow for other large-scale
events, such as dances or fundraisers. When exploring a current design, the effects of vibration
on the floor system were examined and an alternative design was proposed. The new design
aimed to replace the current support system of the structure while also accounting for an increase
in loads and vibration without altering the architectural design of the building.
The current design of the Recreation Center accounts for a large standing capacity within
the 4th floor gymnasium while using a design vibration frequency of 6 hertz, according to the
structural notes given by Cannon. An increase in this vibration frequency from the 6 hertz design
to 9 hertz, a value associated with rhythmic dancing, was explored for the two different support
systems (Murray, Allen, & Ungar, 1997). The characteristic vibration frequency of an activity
such as rhythmic dancing or aerobics is 50% larger than the frequency of walking (Murray,
Allen, & Ungar, 1997). By designing for the occupancy of the building as opposed to the
dynamic characteristics of the loading and the structure, the risk of inadequate resistance to
resonance arises. Therefore, the dynamic characteristics of the use for the 29,000 square foot
gymnasium are equally as important as the maximum allowable static capacity. When assessing
the effects on the building due to higher vibrations, factors such as resonance and damping, as
well as dynamic magnification factors were addressed.
2.3.2 Effects of Vibration on Buildings
The vibrations in buildings caused by the added live load and excitation of internal
sources such as running or dancing, or external forces such as earthquakes or strong winds, can
cause resonance with the structure (Rainer, 1984). When resonance is reached, the amplitude of
24
motion becomes very large. Rhythmic activities are known to cause resonance and can be a
serious problem on floor systems (Murray, Allen, & Ungar, 1997). Resonance in a building can
affect both the strength of the structure, as well as the serviceability.
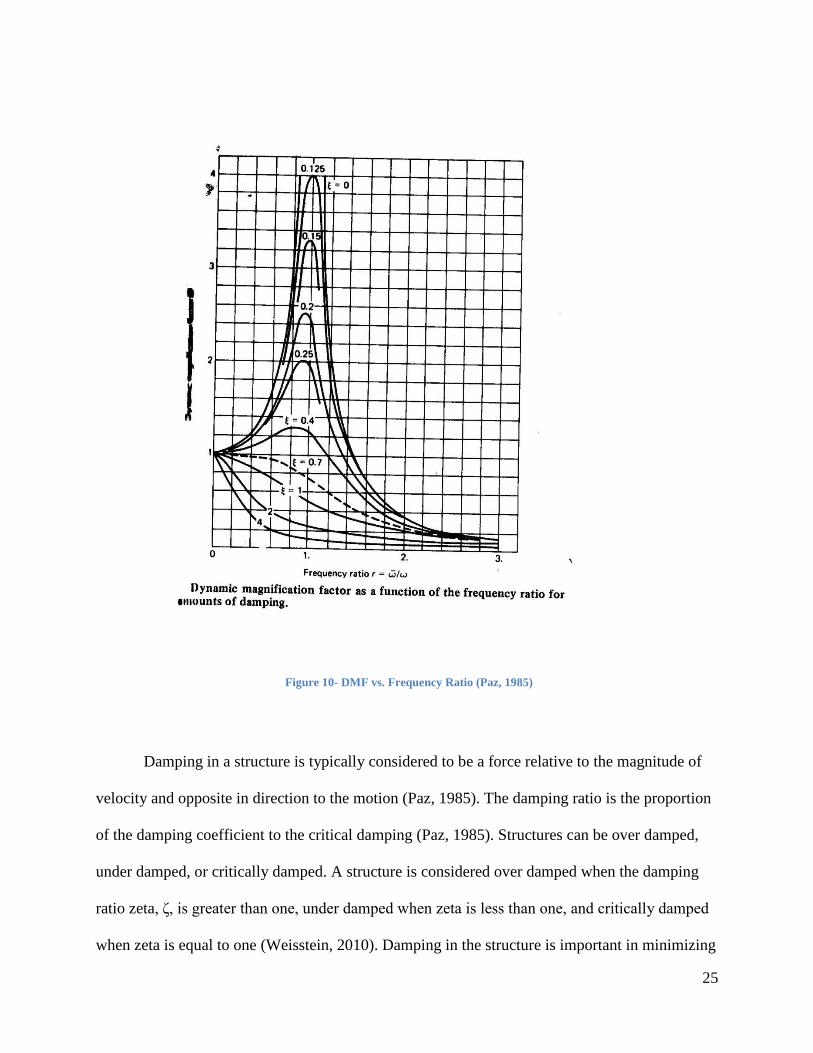
When exploring the vibration of a floor system, dynamic analysis was used to determine
the dynamic magnification factor (DMF) for the response of the structure. During cyclical forces,
such as walking or dancing activities, the continued excitation on the structure causes vibration.
If the motion of the structure reaches a steady-state, a dynamic magnification factor may be
applied to the system in order to calculate the peak response (Science Advisory Desk, 2008).
DMF involves an inverse of the activity frequency ratio to the structure’s natural frequency and
the damping coefficient. The formula for the dynamic magnification factor is,
D =
where r is the ratio of the activity frequency to the structural
frequency and is the damping ratio. Figure 10 below shows the DMF as a function of frequency
ratio and various damping ratio’s (Paz, 1985). If resonance in the structure occurs, there will be a
very large dynamic magnification factor because resonance is when the structural frequency
equals the activity frequency, making the DMF inversely proportional to the damping ratio
(Science Advisory Desk, 2008). Damping is defined as the resistance to motion caused by
vibrations in a building due to the materials used in the structure (Breyer, 2007). If the stiffness
of the structure cannot be altered to lessen the effects of vibration in the building, the materials
used will need to be strengthened. Using thicker supports or a heavier material can help to create
damping in the building (McCormac, 2008).
25
Figure 10- DMF vs. Frequency Ratio (Paz, 1985)
Damping in a structure is typically considered to be a force relative to the magnitude of
velocity and opposite in direction to the motion (Paz, 1985). The damping ratio is the proportion
of the damping coefficient to the critical damping (Paz, 1985). Structures can be over damped,
under damped, or critically damped. A structure is considered over damped when the damping
ratio zeta, , is greater than one, under damped when zeta is less than one, and critically damped
when zeta is equal to one (Weisstein, 2010). Damping in the structure is important in minimizing
26
the effects of resonance and examining DMF. The damping ratio is different depending on the
use of the structure. For example, offices, residences and churches use a Damping ratio of
between 0.02 and 0.05 (Murray, Allen, & Ungar, 1997).
2.3.3 Alternative Design
The current design of the Recreation Center has precast concrete arches supporting the
4th floor gymnasium. These supports are used exclusively for the vertical floor loads and are not
part of the lateral load resisting system. Separate structural frames are used to resist wind and
earthquake loads. If redesigning the arches or removing them was necessary, the lateral
resistance system would have been examined to ensure the new support did not add too much
weight to the building, affecting the seismic forces on the structure.
When redesigning the supports for the fourth floor, the focus of the design was on the
vibrations of the building, rather than the standing room capacity. The new design would be
compared with the current design for resistance to the increased vibration frequency as well as
for potential additional costs incurred by switching from precast concrete to structural steel.
27
3.0 Building Information Modeling and Project Management BIM is a technology-based collaborative approach to construction and project
management that includes 3-D communication of information. To develop a four-dimensional
(4-D) model of a construction project, the first thing that needed to be created was a working
schedule of the activities. After completing the planned schedule, the Revit model of the
complete construction was broken into monthly phases. Then, using Revit, the quantities of the
materials used were extracted for each phase and an earned value analysis (EVA) was
completed. After construction began, the actual progress was tracked with the project schedule
and the process was repeated.
3.1 Project Schedule The project schedule is used to show the sequence of activities and when each activity is
expected to happen. The project schedule is essential to both the EVA and BIM models because
it dictates the expectations of the project and it can be used to track the work as it is completed.
By using Primavera Software (Primavera) to complete the EVA, the project manager is able to
use one central file to assess the project. Additionally, Primavera can produce Lazy S curves and
other graphs to track the progress of the schedule. When creating the BIM model, the Primavera
file provides a complete schedule of all the activities completed along with the expected dates of
completion.
Planned Schedule
The first step in tracking the project was identifying the planned schedule for each month.
Using schedules from Gilbane Building Company (Gilbane), starting with the one developed in
June 2010 and ending with the one developed in August 2010, a Primavera file was developed.
The created schedule included only the activities within the Concrete and Steel bid packages,
28
Divisions 3 and 5 respectively, because the bulk of those divisions were completed during the
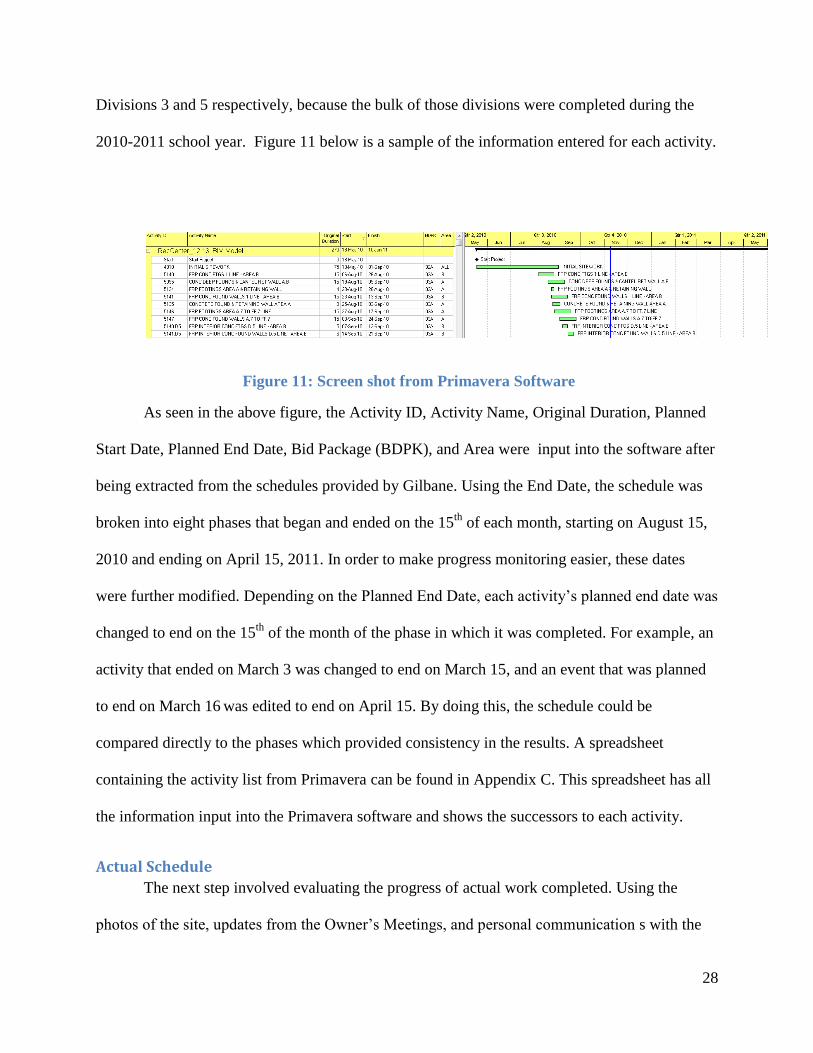
2010-2011 school year. Figure 11 below is a sample of the information entered for each activity.
Figure 11: Screen shot from Primavera Software
As seen in the above figure, the Activity ID, Activity Name, Original Duration, Planned
Start Date, Planned End Date, Bid Package (BDPK), and Area were input into the software after
being extracted from the schedules provided by Gilbane. Using the End Date, the schedule was
broken into eight phases that began and ended on the 15th
of each month, starting on August 15,
2010 and ending on April 15, 2011. In order to make progress monitoring easier, these dates
were further modified. Depending on the Planned End Date, each activity’s planned end date was
changed to end on the 15th
of the month of the phase in which it was completed. For example, an
activity that ended on March 3 was changed to end on March 15, and an event that was planned
to end on March 16 was edited to end on April 15. By doing this, the schedule could be
compared directly to the phases which provided consistency in the results. A spreadsheet
containing the activity list from Primavera can be found in Appendix C. This spreadsheet has all
the information input into the Primavera software and shows the successors to each activity.
Actual Schedule
The next step involved evaluating the progress of actual work completed. Using the
photos of the site, updates from the Owner’s Meetings, and personal communication s with the
29
Project Engineers from Gilbane, the project was monitored. After identifying which activities
were completed within each phase, the Primavera file was updated to include information about
Actual Start and End Date. For consistency with the defined phases, activities that ended on or
before the 15th
of the month were assigned an Actual Start date of the 16th
of the previous month
and an Actual End Date of the 15th
of that month.
3.2 4-D Models A four-dimensional (4-D) model of a construction project, where the fourth dimension is
time, is based on the phases of construction. The first 4-D model of the project was created based
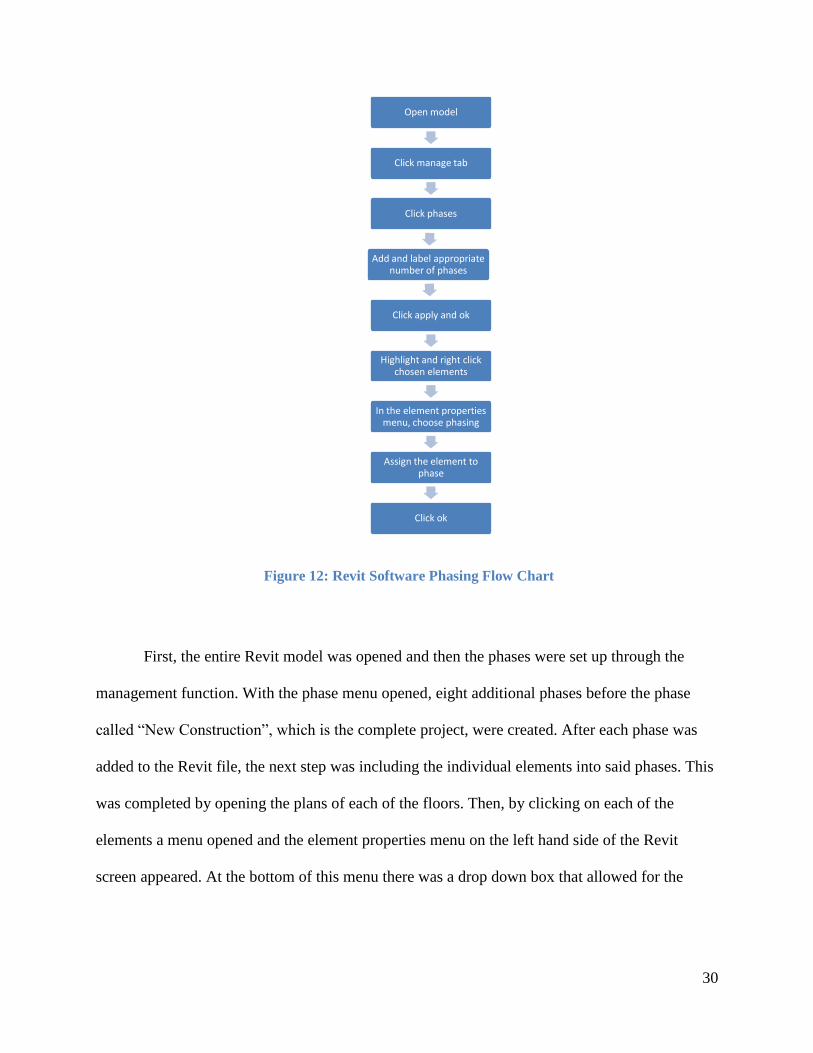
on the planned schedule of activities defined in Primavera. The flow chart below, Figure 12,
outlines the process of constructing a phase in Revit and adding an element to it, and there are
more detailed instructions in Appendix G.
30
Figure 12: Revit Software Phasing Flow Chart
First, the entire Revit model was opened and then the phases were set up through the
management function. With the phase menu opened, eight additional phases before the phase
called “New Construction”, which is the complete project, were created. After each phase was
added to the Revit file, the next step was including the individual elements into said phases. This
was completed by opening the plans of each of the floors. Then, by clicking on each of the
elements a menu opened and the element properties menu on the left hand side of the Revit
screen appeared. At the bottom of this menu there was a drop down box that allowed for the
Open model
Click manage tab
Click phases
Add and label appropriate number of phases
Click apply and ok
Highlight and right click chosen elements
In the element properties menu, choose phasing
Assign the element to phase
Click ok
31
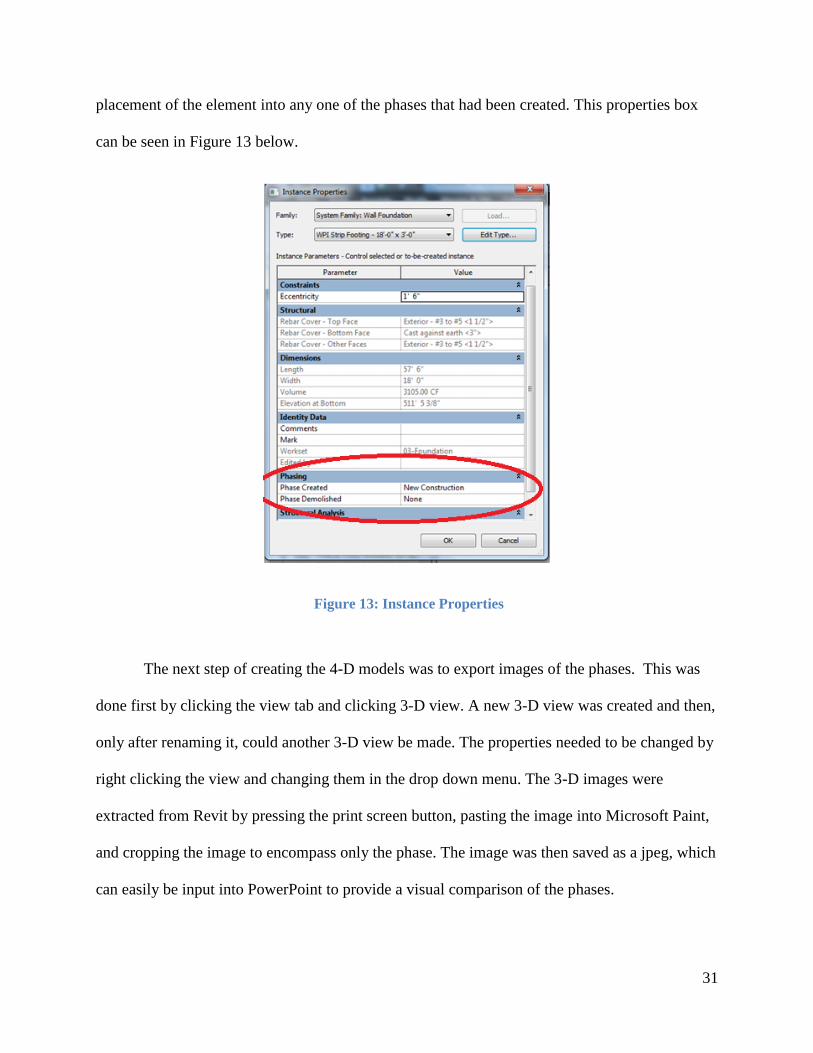
placement of the element into any one of the phases that had been created. This properties box
can be seen in Figure 13 below.
Figure 13: Instance Properties
The next step of creating the 4-D models was to export images of the phases. This was
done first by clicking the view tab and clicking 3-D view. A new 3-D view was created and then,
only after renaming it, could another 3-D view be made. The properties needed to be changed by
right clicking the view and changing them in the drop down menu. The 3-D images were
extracted from Revit by pressing the print screen button, pasting the image into Microsoft Paint,
and cropping the image to encompass only the phase. The image was then saved as a jpeg, which
can easily be input into PowerPoint to provide a visual comparison of the phases.
32
3.3 Earned Value Analysis Earned value analyses (EVA) are used to track the progress of work on a project
(Oberlender, 2000). Earned-value systems use ratios to predict cost overruns and schedule
delays, thus enabling the project managers to adjust their budgets and work productivity
accordingly. This is done by completing EVAs on a monthly basis. These EVAs involved three
aspects of the project: the project schedule, the work completed, and the cost of the concrete and
steel packages for the project. The aspect that makes this EVA different than any other is its
integration with BIM technology. By using Primavera software in conjunction with Microsoft
Excel (Excel), each task is assigned a quantity and cost. The model created in Revit was used to
derive the quantities of the project, which saved additional calculation time.
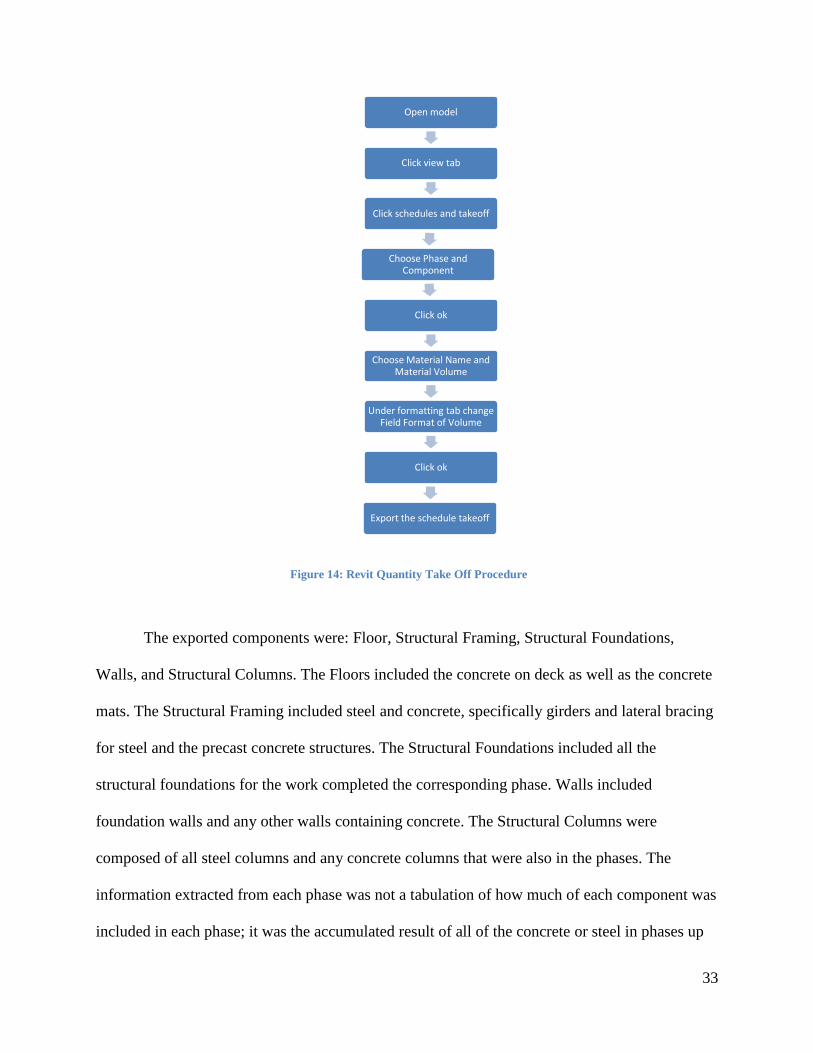
3.4 Quantities Using the Revit file of the project obtained from Cannon Design, the quantities of
concrete and steel were extracted. This was done by creating “schedule” takeoffs of the different
components of construction per each phase. The process to create a schedule takeoff is listed in
Figure 14 below and Appendix G has a more detailed walkthrough.
33
Figure 14: Revit Quantity Take Off Procedure
The exported components were: Floor, Structural Framing, Structural Foundations,
Walls, and Structural Columns. The Floors included the concrete on deck as well as the concrete
mats. The Structural Framing included steel and concrete, specifically girders and lateral bracing
for steel and the precast concrete structures. The Structural Foundations included all the
structural foundations for the work completed the corresponding phase. Walls included
foundation walls and any other walls containing concrete. The Structural Columns were
composed of all steel columns and any concrete columns that were also in the phases. The
information extracted from each phase was not a tabulation of how much of each component was
included in each phase; it was the accumulated result of all of the concrete or steel in phases up
Open model
Click view tab
Click schedules and takeoff
Choose Phase and Component
Click ok
Choose Material Name and Material Volume
Under formatting tab change Field Format of Volume
Click ok
Export the schedule takeoff
34
to the current phase. The information was then copied and pasted intoExcel and the totals for
each phase as well as the total for the entire construction project were calculated.
After quantities were extracted from the Revit file, the next step was to equate them with
monetary values. This was done by determining the average cost per cubic yard of five different
categories of concrete work and the average cost per ton of steel for a typical three to six-story
office building. These unit costs were derived from RSMeans 2007, so additional inflation was
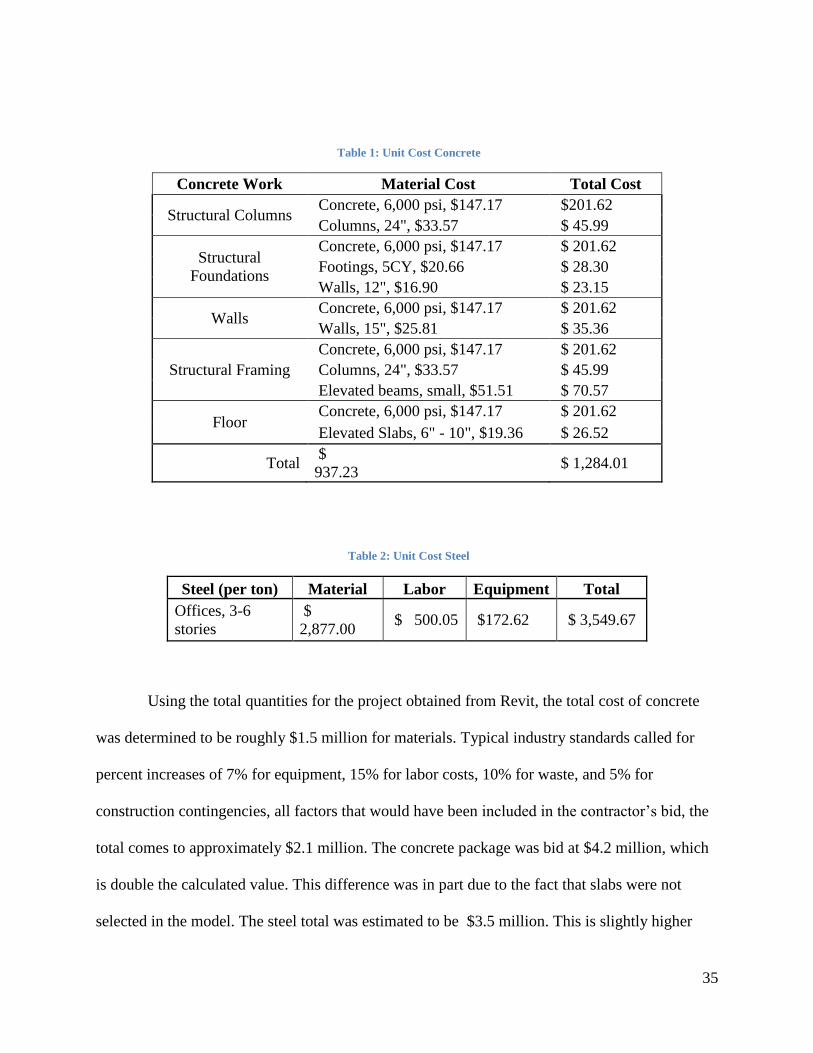
also included. Full Excel calculations can be found in Appendix E. Tables 1 and 2 below show
which numbers were used to calculate the cost of each of the different types of concrete work
and the steel in the project.
35
Table 1: Unit Cost Concrete
Concrete Work Material Cost Total Cost
Structural Columns Concrete, 6,000 psi, $147.17 $201.62
Columns, 24", $33.57 $ 45.99
Structural
Foundations
Concrete, 6,000 psi, $147.17 $ 201.62
Footings, 5CY, $20.66 $ 28.30
Walls, 12", $16.90 $ 23.15
Walls Concrete, 6,000 psi, $147.17 $ 201.62
Walls, 15", $25.81 $ 35.36
Structural Framing
Concrete, 6,000 psi, $147.17 $ 201.62
Columns, 24", $33.57 $ 45.99
Elevated beams, small, $51.51 $ 70.57
Floor Concrete, 6,000 psi, $147.17 $ 201.62
Elevated Slabs, 6" - 10", $19.36 $ 26.52
Total $
937.23 $ 1,284.01
Table 2: Unit Cost Steel
Steel (per ton) Material Labor Equipment Total
Offices, 3-6
stories
$
2,877.00 $ 500.05 $172.62 $ 3,549.67
Using the total quantities for the project obtained from Revit, the total cost of concrete
was determined to be roughly $1.5 million for materials. Typical industry standards called for
percent increases of 7% for equipment, 15% for labor costs, 10% for waste, and 5% for
construction contingencies, all factors that would have been included in the contractor’s bid, the
total comes to approximately $2.1 million. The concrete package was bid at $4.2 million, which
is double the calculated value. This difference was in part due to the fact that slabs were not
selected in the model. The steel total was estimated to be $3.5 million. This is slightly higher
36
than the $3.2 million bid and can be attributed to the inflation rate and assumed material, labor,
and equipment costs. Using the method of equal distribution among each activity in the phase,
the costs were entered into the Primavera file. Appendix C contains the Primavera files in Excel
form and shows the breakdown of the cost that was assigned to each activity.
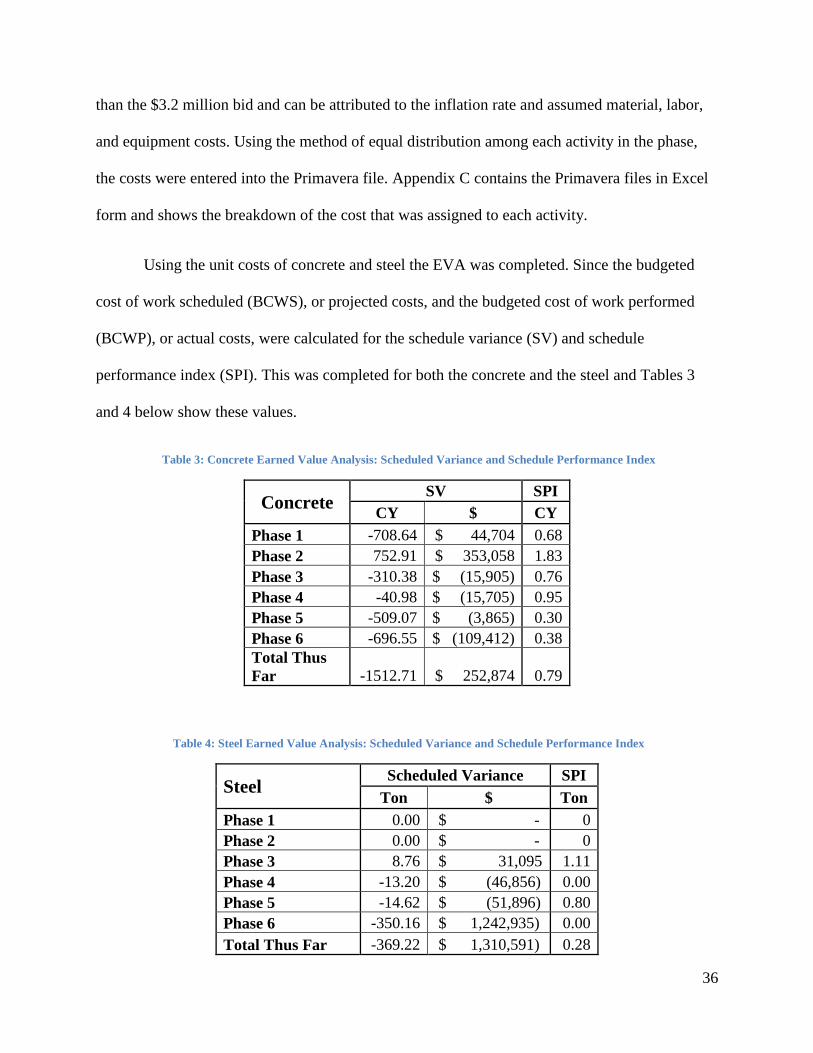
Using the unit costs of concrete and steel the EVA was completed. Since the budgeted
cost of work scheduled (BCWS), or projected costs, and the budgeted cost of work performed
(BCWP), or actual costs, were calculated for the schedule variance (SV) and schedule
performance index (SPI). This was completed for both the concrete and the steel and Tables 3
and 4 below show these values.
Table 3: Concrete Earned Value Analysis: Scheduled Variance and Schedule Performance Index
Concrete SV SPI
CY $ CY
Phase 1 -708.64 $ 44,704 0.68
Phase 2 752.91 $ 353,058 1.83
Phase 3 -310.38 $ (15,905) 0.76
Phase 4 -40.98 $ (15,705) 0.95
Phase 5 -509.07 $ (3,865) 0.30
Phase 6 -696.55 $ (109,412) 0.38
Total Thus
Far -1512.71 $ 252,874 0.79
Table 4: Steel Earned Value Analysis: Scheduled Variance and Schedule Performance Index
Steel Scheduled Variance SPI
Ton $ Ton
Phase 1 0.00 $ - 0
Phase 2 0.00 $ - 0
Phase 3 8.76 $ 31,095 1.11
Phase 4 -13.20 $ (46,856) 0.00
Phase 5 -14.62 $ (51,896) 0.80
Phase 6 -350.16 $ 1,242,935) 0.00
Total Thus Far -369.22 $ 1,310,591) 0.28
37
These tables detail the cubic yards, tons, and/or dollars that the project is ahead of or
behind schedule. For SV, a negative number means the bid package was behind schedule for that
phase. For SPI, a number greater than one means the project was ahead of schedule and a
number less than one represents that the project was behind schedule. As you can see in Phase 4
of the steel package, Table 4, the SPI is zero because there was no work completed.
38
3.5 Monitoring Project Performance Through creating the PowerPoint presentation with the corresponding phases from the
two different 4-D models side by side, the viewer can easily see distinguish the differences. This
was due to the fact that the bulk of the construction that was completed within the phase
durations was highly visible and on a large scale. This was a simple and effective way to
communicate the progress and performance; however, there are discrepancies. When there are
construction complications that slow a certain component of construction, other activities may
have increased production to cover the differences and keep the overall project on schedule for
its completion date. This was completed by taking the total amount of the materials in the phase,
and dividing it by the total amount of material for the construction project to establish a
percentage complete.
39
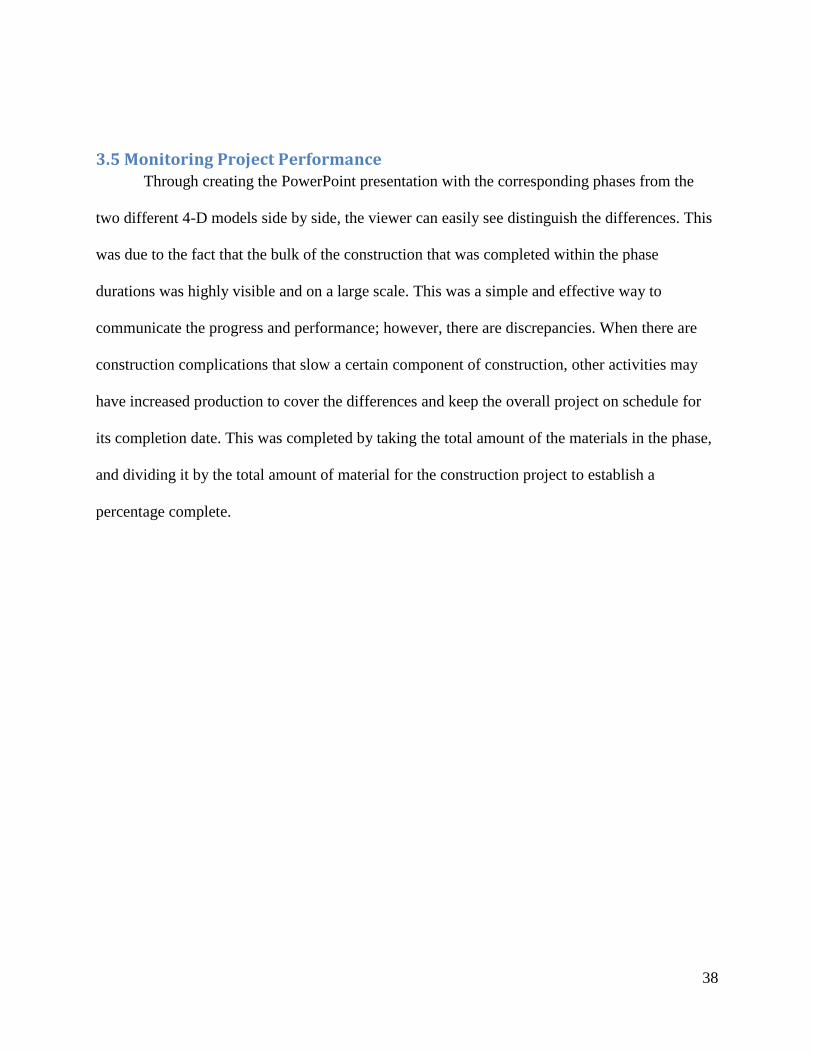
Figure 15: Phase 1 Comparison
The first set of phases ranged from August 15, 2010 until September 15, 2010 and can be
seen in Figure 15 above. The footings are completed in area A and part of area B for both the
projected and the actual, but the actual is far behind in completion of the foundation walls on top
of those footings. The planned schedule is visually much farther along than the actual phases.
Notable differences are the completed foundation walls in area A, along with the footings. The
percentages show about an eight percent difference between the amount of concrete completed
for each phase. This difference is potentially due to the change of concrete vendors in the early
stages of construction.
40
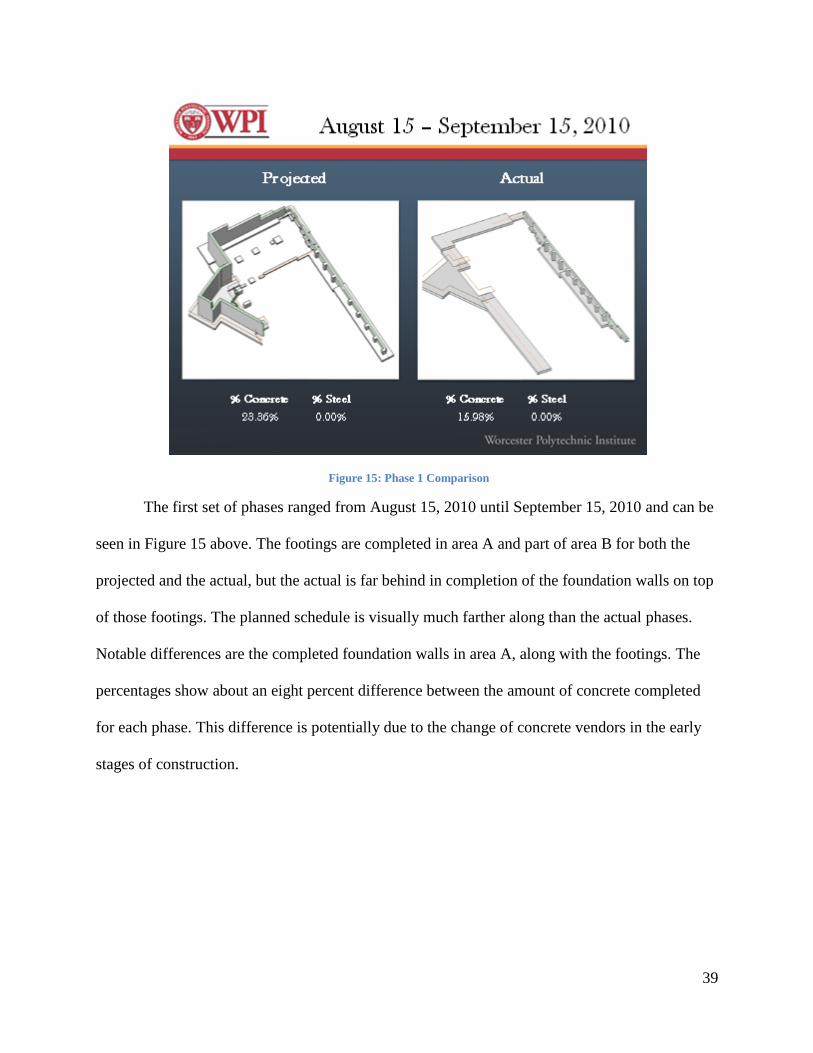
Figure 16: Phase 2 Comparison
The second set of phases ranged from September 15, 2010 until October 15, 2010 and
can be seen in Figure 16 above. The footings and foundation walls are caught up with one
another in the actual compared to the projected, along with the interior footings of area A for the
steel to begin in area A. Also all of the footings for the precast arches have been completed so
that assembly of those can begin. The percentages are within one percent of one another which
means the project completed more work than was scheduled for this phase.
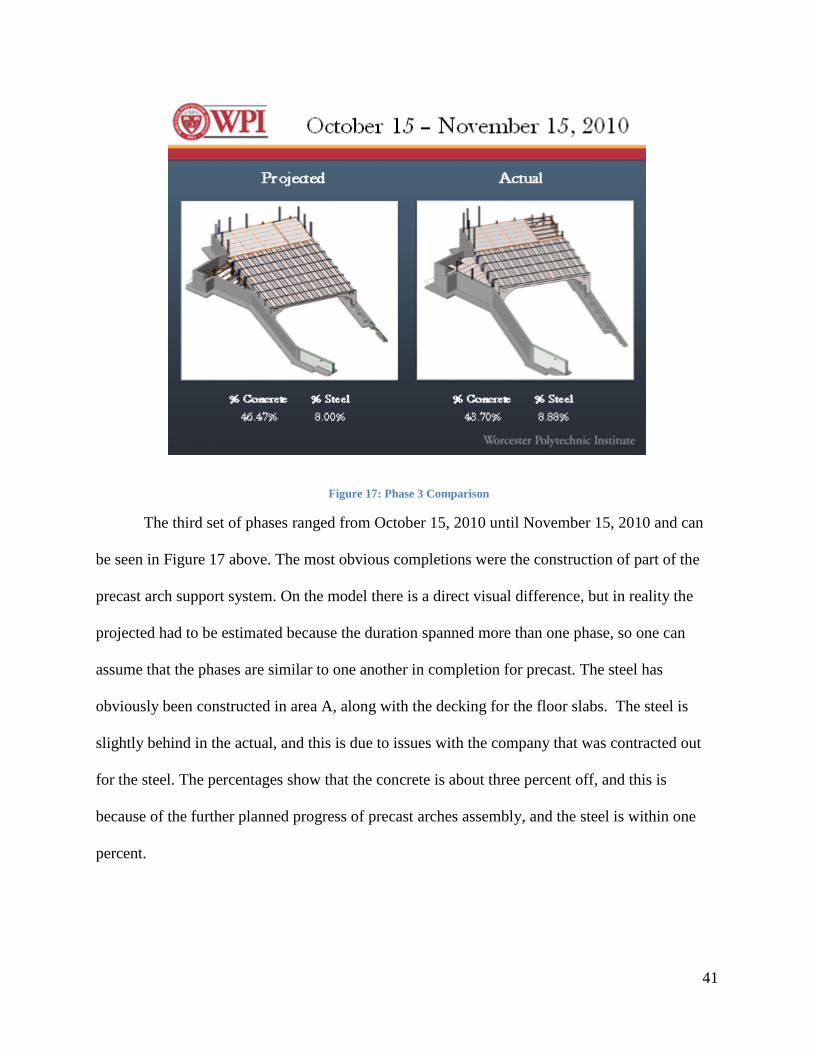
41
Figure 17: Phase 3 Comparison
The third set of phases ranged from October 15, 2010 until November 15, 2010 and can
be seen in Figure 17 above. The most obvious completions were the construction of part of the
precast arch support system. On the model there is a direct visual difference, but in reality the
projected had to be estimated because the duration spanned more than one phase, so one can
assume that the phases are similar to one another in completion for precast. The steel has
obviously been constructed in area A, along with the decking for the floor slabs. The steel is
slightly behind in the actual, and this is due to issues with the company that was contracted out
for the steel. The percentages show that the concrete is about three percent off, and this is
because of the further planned progress of precast arches assembly, and the steel is within one
percent.
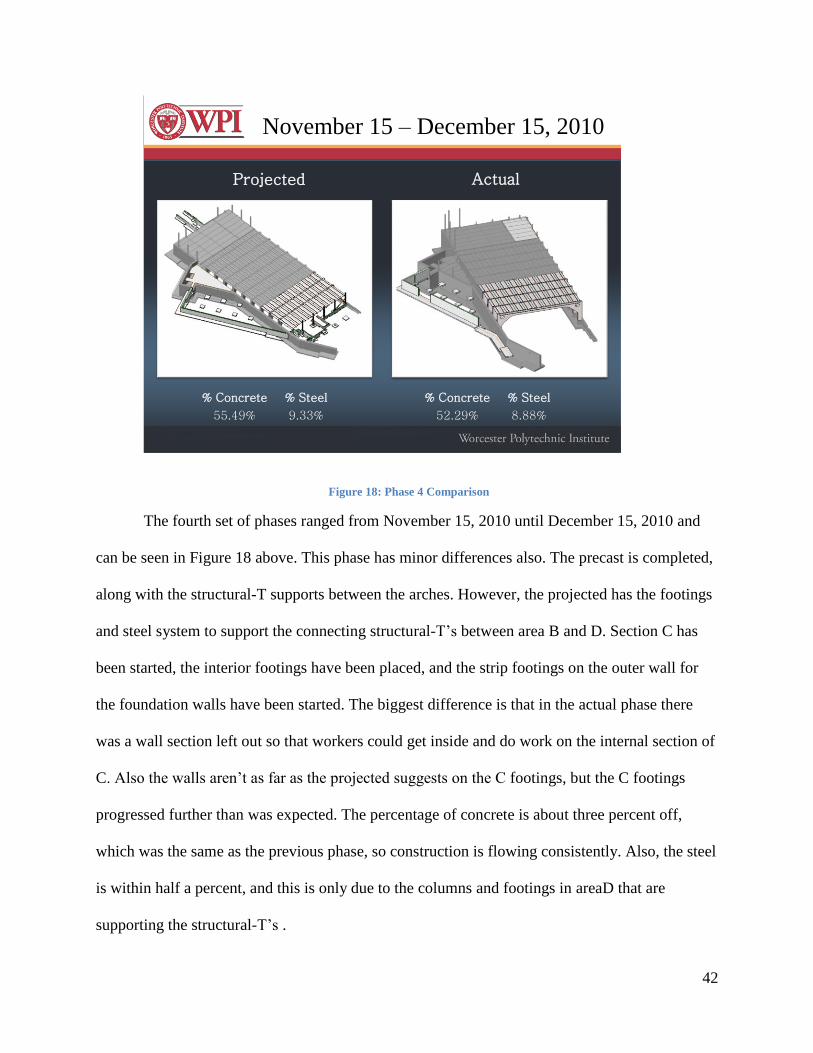
42
November 15 – December 15, 2010
Projected Actual
% Concrete % Steel
55.49% 9.33%
% Concrete % Steel
52.29% 8.88%
Figure 18: Phase 4 Comparison
The fourth set of phases ranged from November 15, 2010 until December 15, 2010 and
can be seen in Figure 18 above. This phase has minor differences also. The precast is completed,
along with the structural-T supports between the arches. However, the projected has the footings
and steel system to support the connecting structural-T’s between area B and D. Section C has
been started, the interior footings have been placed, and the strip footings on the outer wall for
the foundation walls have been started. The biggest difference is that in the actual phase there
was a wall section left out so that workers could get inside and do work on the internal section of
C. Also the walls aren’t as far as the projected suggests on the C footings, but the C footings
progressed further than was expected. The percentage of concrete is about three percent off,
which was the same as the previous phase, so construction is flowing consistently. Also, the steel
is within half a percent, and this is only due to the columns and footings in areaD that are
supporting the structural-T’s .
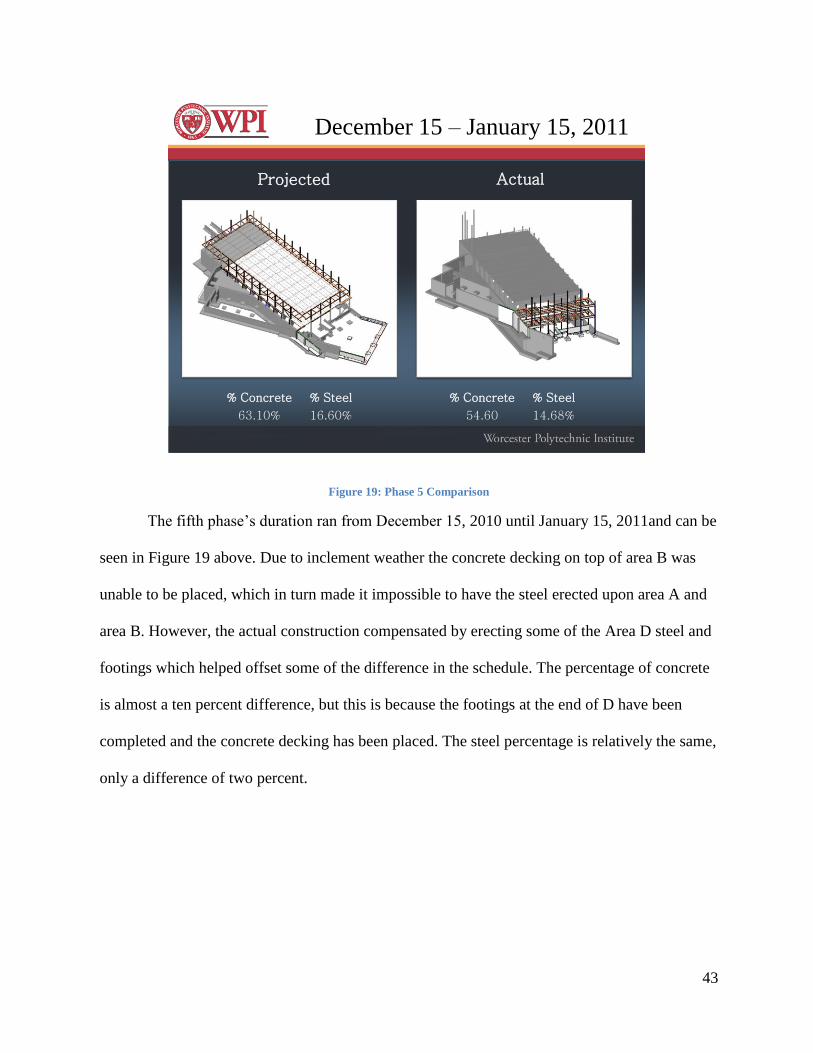
43
December 15 – January 15, 2011
Projected Actual
% Concrete % Steel
63.10% 16.60%
% Concrete % Steel
54.60 14.68%
Figure 19: Phase 5 Comparison
The fifth phase’s duration ran from December 15, 2010 until January 15, 2011and can be
seen in Figure 19 above. Due to inclement weather the concrete decking on top of area B was
unable to be placed, which in turn made it impossible to have the steel erected upon area A and
area B. However, the actual construction compensated by erecting some of the Area D steel and
footings which helped offset some of the difference in the schedule. The percentage of concrete
is almost a ten percent difference, but this is because the footings at the end of D have been
completed and the concrete decking has been placed. The steel percentage is relatively the same,
only a difference of two percent.
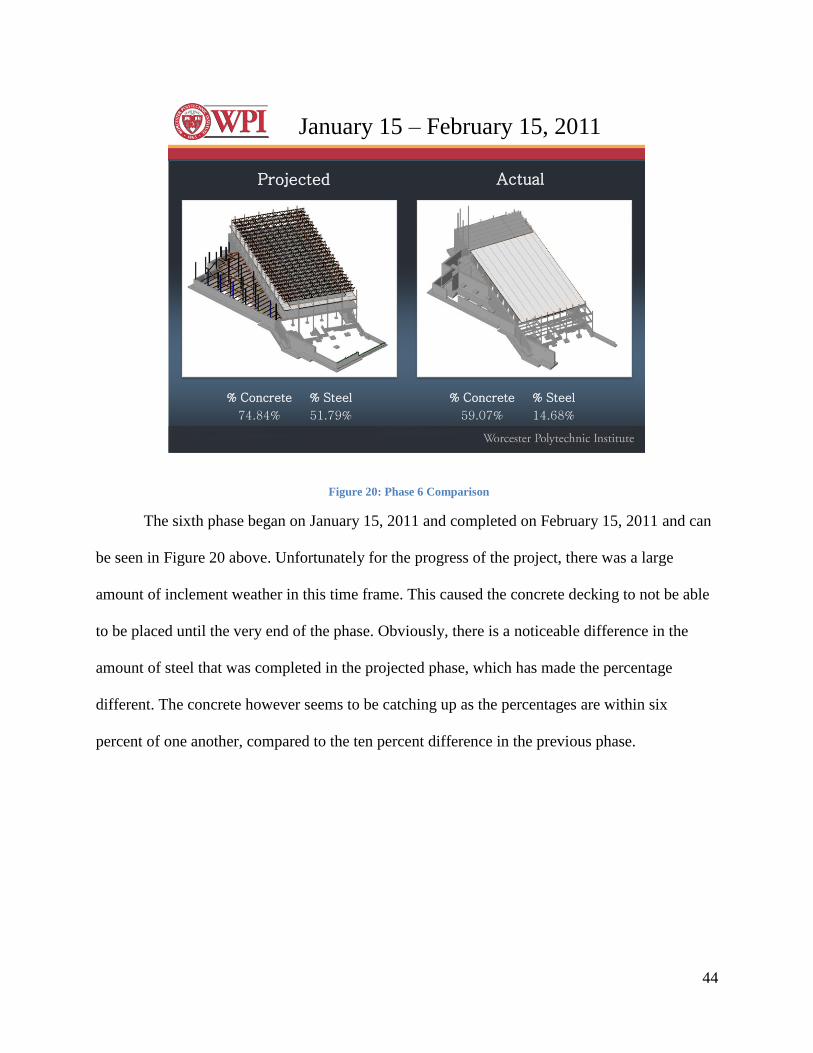
44
January 15 – February 15, 2011
Projected Actual
% Concrete % Steel
74.84% 51.79%
% Concrete % Steel
59.07% 14.68%
Figure 20: Phase 6 Comparison
The sixth phase began on January 15, 2011 and completed on February 15, 2011 and can
be seen in Figure 20 above. Unfortunately for the progress of the project, there was a large
amount of inclement weather in this time frame. This caused the concrete decking to not be able
to be placed until the very end of the phase. Obviously, there is a noticeable difference in the
amount of steel that was completed in the projected phase, which has made the percentage
different. The concrete however seems to be catching up as the percentages are within six
percent of one another, compared to the ten percent difference in the previous phase.
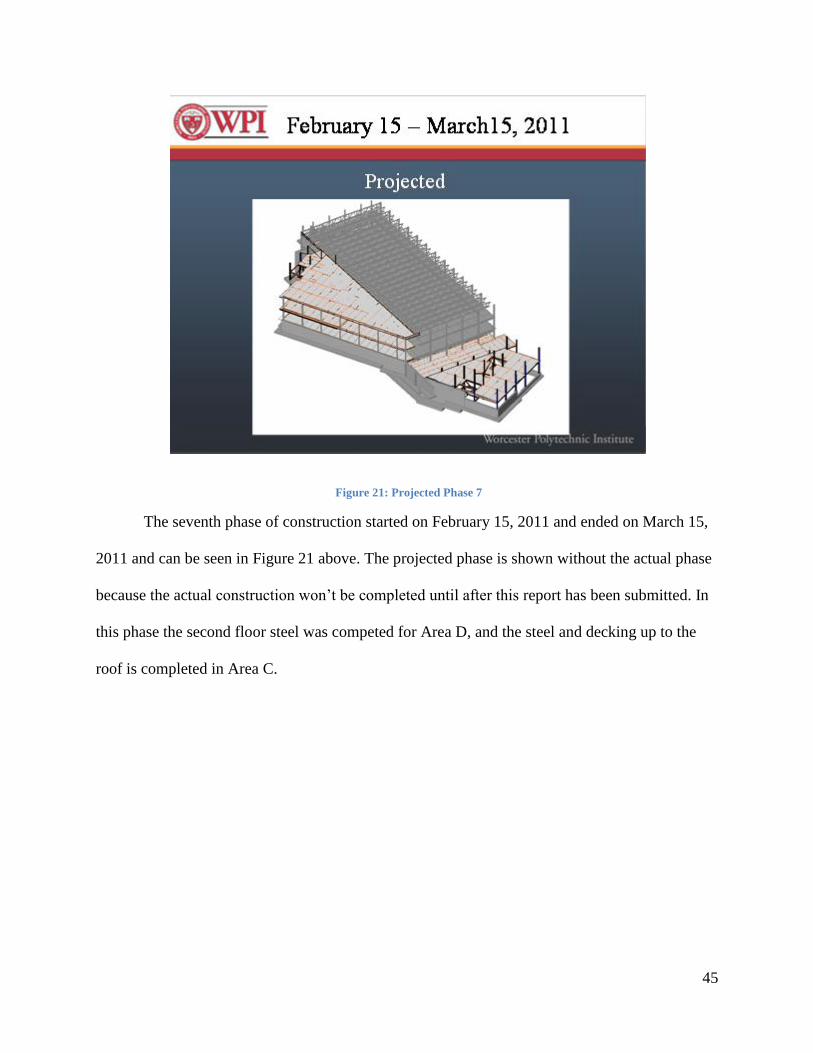
45
Figure 21: Projected Phase 7
The seventh phase of construction started on February 15, 2011 and ended on March 15,
2011 and can be seen in Figure 21 above. The projected phase is shown without the actual phase
because the actual construction won’t be completed until after this report has been submitted. In
this phase the second floor steel was competed for Area D, and the steel and decking up to the
roof is completed in Area C.
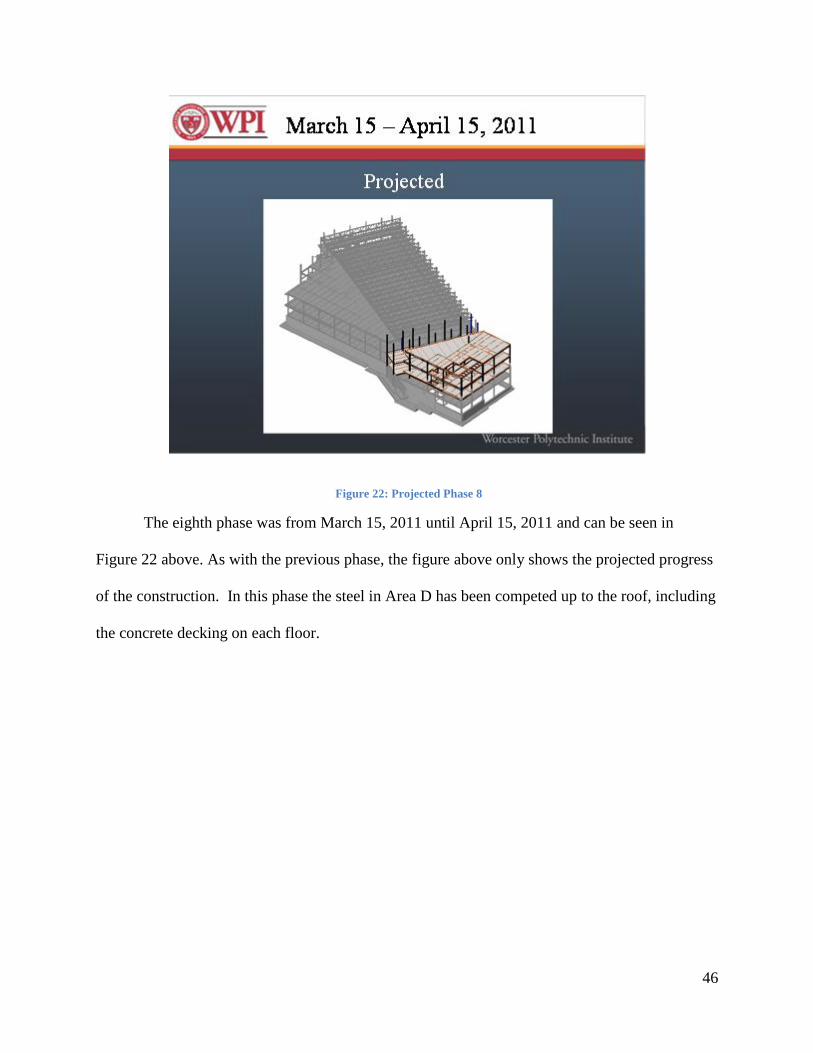
46
Figure 22: Projected Phase 8
The eighth phase was from March 15, 2011 until April 15, 2011 and can be seen in
Figure 22 above. As with the previous phase, the figure above only shows the projected progress
of the construction. In this phase the steel in Area D has been competed up to the roof, including
the concrete decking on each floor.
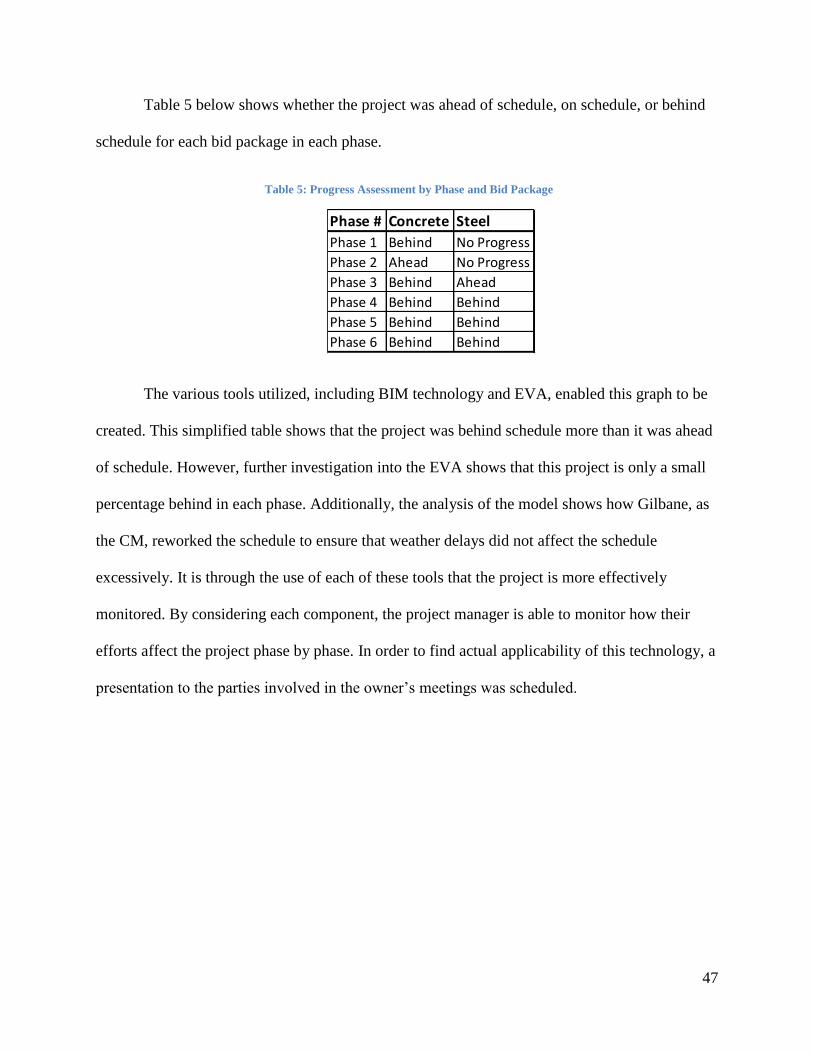
47
Table 5 below shows whether the project was ahead of schedule, on schedule, or behind
schedule for each bid package in each phase.
Table 5: Progress Assessment by Phase and Bid Package
The various tools utilized, including BIM technology and EVA, enabled this graph to be
created. This simplified table shows that the project was behind schedule more than it was ahead
of schedule. However, further investigation into the EVA shows that this project is only a small
percentage behind in each phase. Additionally, the analysis of the model shows how Gilbane, as
the CM, reworked the schedule to ensure that weather delays did not affect the schedule
excessively. It is through the use of each of these tools that the project is more effectively
monitored. By considering each component, the project manager is able to monitor how their
efforts affect the project phase by phase. In order to find actual applicability of this technology, a
presentation to the parties involved in the owner’s meetings was scheduled.
Phase # Concrete Steel
Phase 1 Behind No Progress
Phase 2 Ahead No Progress
Phase 3 Behind Ahead
Phase 4 Behind Behind
Phase 5 Behind Behind
Phase 6 Behind Behind
48
4.0 Structural Design and Dynamic Performance An alternative design of the support system for the 4
th floor gymnasium was explored to
gain understanding of design for dynamic conditions and to explore the differences that
accompany a change in the vibration frequency (forcing frequency) of the floor loads. The
current design addressed a 6 hertz forcing frequency, which is often associated with excitation
due to walking, or other low impact activities (Murray, Allen, & Ungar, 1997). The alternative
design implemented a forcing frequency of 9 hertz which is the accepted value for activities such
as rhythmic dancing or aerobics (Murray, Allen, & Ungar, 1997). The structural response of the
current design was first examined for the 6 hertz forcing frequency, and then the forcing
frequency was increased to 9 hertz to establish a comparison point with the alternative design.
By increasing the vibration frequency, a change to the structural supports was addressed in the
alternative design to ensure the design retains its resistance to the gravity loading. Also, though
the area of study is not part of the lateral load resisting system, the alternative needed to be
designed with consideration of the effect of any added weight on the seismic forces.
4.1 Examining the Current Design The current design used nine precast concrete arches starting on the first floor natatorium
and extending to the bottom of the 4th
floor gymnasium. The natural frequency of the precast
arches was examined to create a baseline for the alternative design. Determining the natural
frequency of a typical arch in the current design and its response to the 6 hertz forcing frequency
was the first step. In order to do this, the design criteria in Table 6 below were used in
conjunction with the modeling program RISA-2D. Included in the design criteria was a
distributed dead load calculated from the gymnasium floor that sits atop the arches, which was
designed to be 100 psf, combined with the self weight of the precast arch.
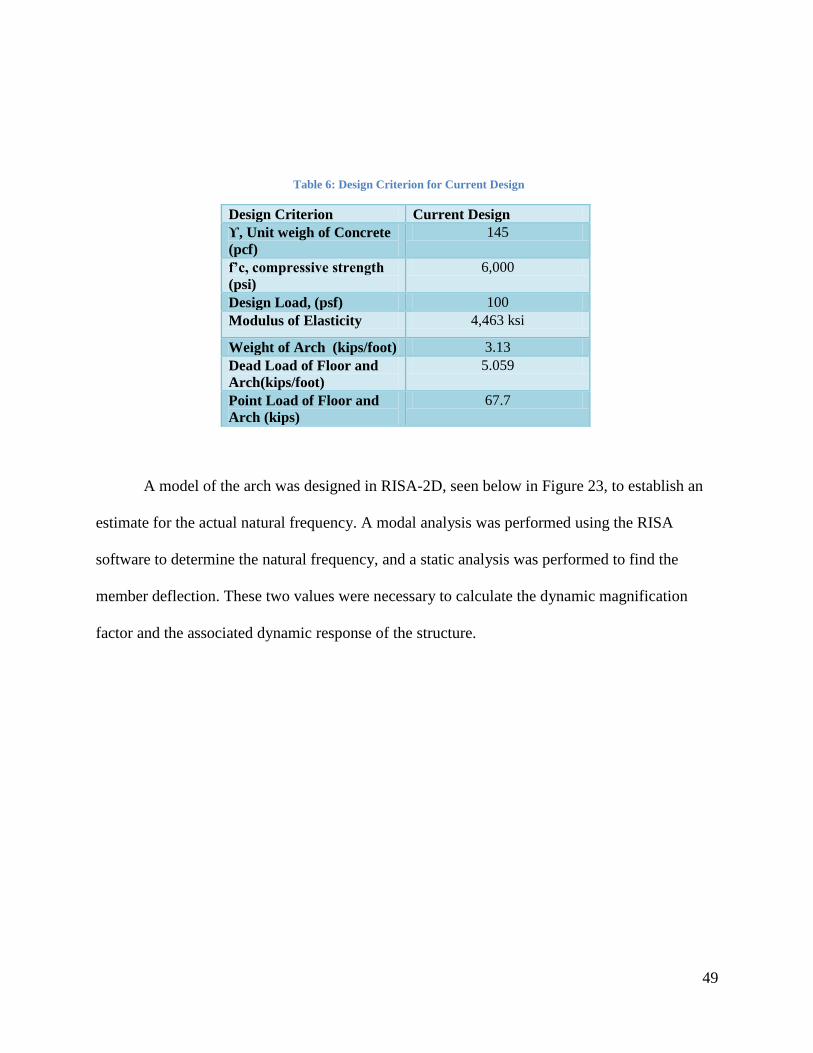
49
Table 6: Design Criterion for Current Design
Design Criterion Current Design
ϒ, Unit weigh of Concrete
(pcf)
145
f’c, compressive strength
(psi)
6,000
Design Load, (psf) 100
Modulus of Elasticity 4,463 ksi
Weight of Arch (kips/foot) 3.13
Dead Load of Floor and
Arch(kips/foot)
5.059
Point Load of Floor and
Arch (kips)
67.7
A model of the arch was designed in RISA-2D, seen below in Figure 23, to establish an
estimate for the actual natural frequency. A modal analysis was performed using the RISA
software to determine the natural frequency, and a static analysis was performed to find the
member deflection. These two values were necessary to calculate the dynamic magnification
factor and the associated dynamic response of the structure.
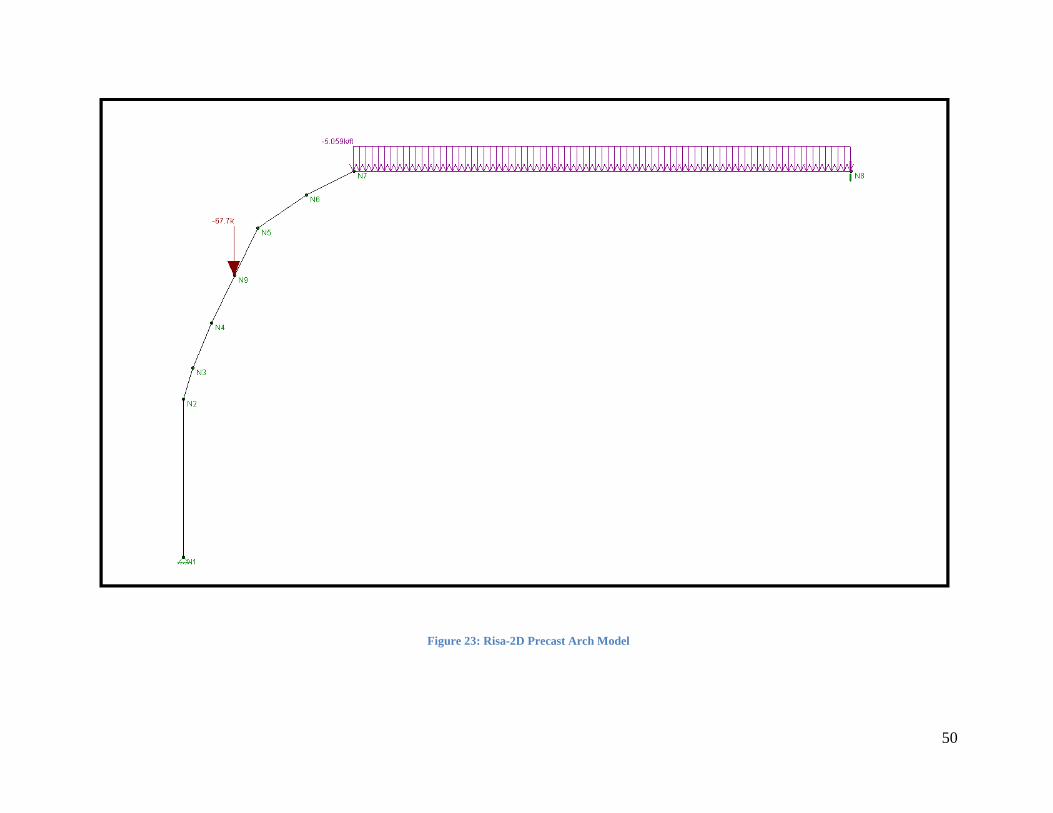
50
Figure 23: Risa-2D Precast Arch Model
51
When creating the RISA model, the centerline of the arch was used to define the
longitudinal axis of a single-layered member, allowing for a distributed load to be applied. The
combined weight of the floor and arch created the distributed load. The weight of the floor, 100
psf, was multiplied by the width of the floor area tributary to each arch, which was 19’4’’. Also,
the weight of the arch was found using the cubic yardage of concrete and multiplying it by the
unit weight of the concrete. The symmetrical shape of the arch allowed for the model to be split
half way with a fixed boundary added at the center to account for the symmetry plane. To ensure
that the arched part of the model accounted for the weight of the gymnasium floor along its
entire span, a point load was applied to the center of the haunch. The point load was calculated
by taking the distributed load and multiplying it by the tributary area of the haunch, which was
the distance between node 1 and node 7, as seen in Figure 23. Also, the material properties
needed to be accounted for when designing the model. Using Equation 2 in Appendix H, the
modulus of elasticity for the precast concrete was found to be 4,463 ksi, and was applied to all
the members. Running the modal analysis provided a natural frequency in the structure of 5.2
Hz. The static analysis produced a deflection of 1.22”, used for both the 6 and 9 hertz forcing
frequencies. These values would be necessary when examining the effects of DMF on the
structure.
The formula for calculating DMF, D = involved the variables r,
the ratio of forcing frequency to natural frequency found in the modal analysis, as well as a
damping ratio, of 0.02. The damping ratio 0.02 was chosen from Table 4.1 in Floor Vibrations
Due to Human Activity by Allen, Murray, and Ungar. This value is often associated with
shopping malls and offices (Murray, Allen, & Ungar, 1997). The reason for choosing that
damping ratio was the similarity in walking excitation between a gym and the open floor space
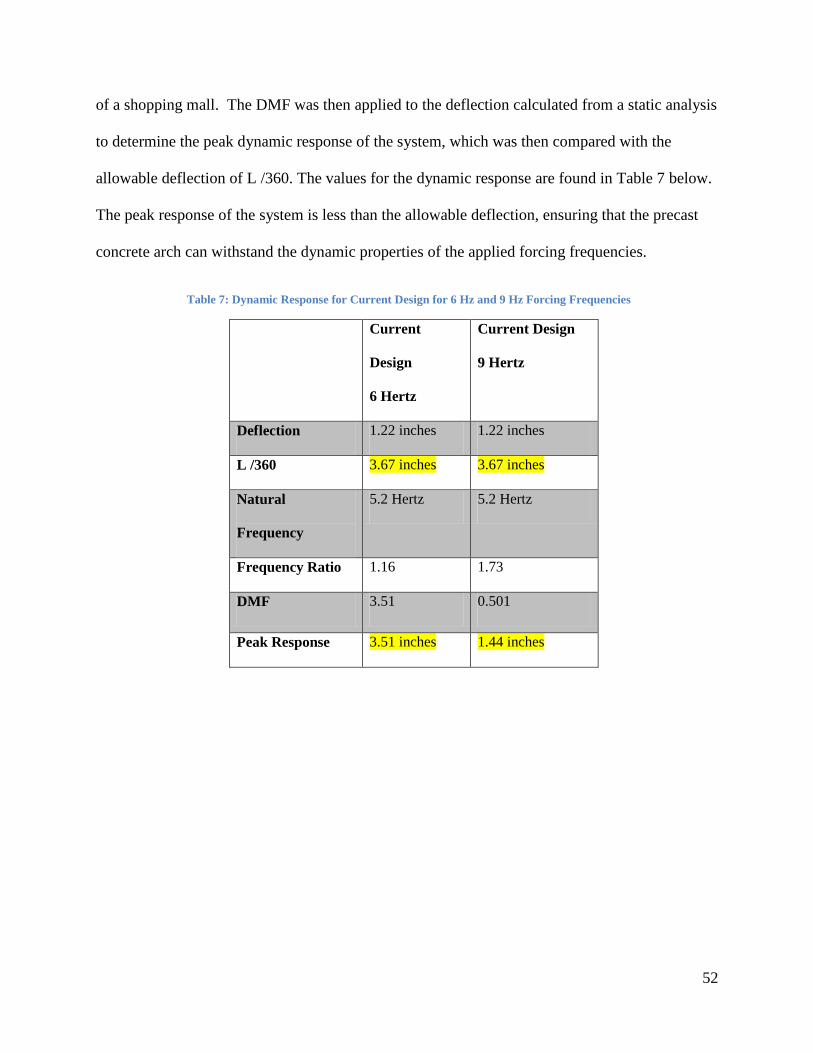
52
of a shopping mall. The DMF was then applied to the deflection calculated from a static analysis
to determine the peak dynamic response of the system, which was then compared with the
allowable deflection of L /360. The values for the dynamic response are found in Table 7 below.
The peak response of the system is less than the allowable deflection, ensuring that the precast
concrete arch can withstand the dynamic properties of the applied forcing frequencies.
Table 7: Dynamic Response for Current Design for 6 Hz and 9 Hz Forcing Frequencies
Current
Design
6 Hertz
Current Design
9 Hertz
Deflection 1.22 inches 1.22 inches
L /360 3.67 inches 3.67 inches
Natural
Frequency
5.2 Hertz 5.2 Hertz
Frequency Ratio 1.16 1.73
DMF 3.51 0.501
Peak Response 3.51 inches 1.44 inches
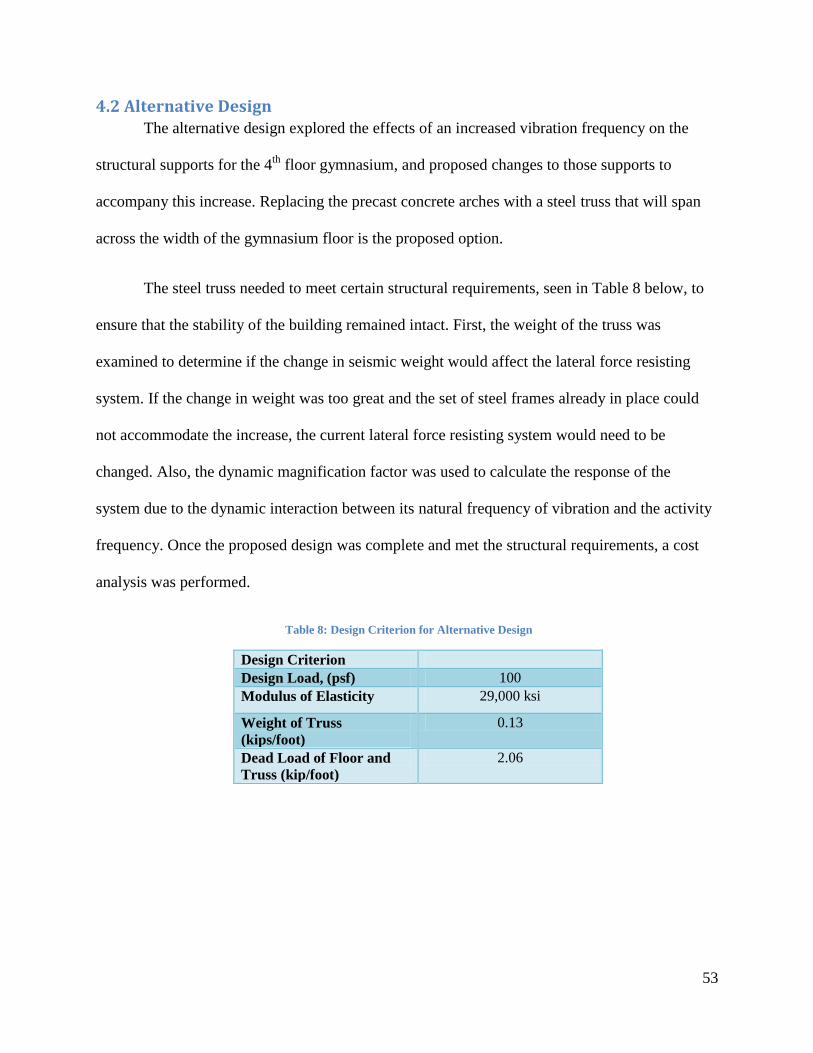
53
4.2 Alternative Design The alternative design explored the effects of an increased vibration frequency on the
structural supports for the 4th
floor gymnasium, and proposed changes to those supports to
accompany this increase. Replacing the precast concrete arches with a steel truss that will span
across the width of the gymnasium floor is the proposed option.
The steel truss needed to meet certain structural requirements, seen in Table 8 below, to
ensure that the stability of the building remained intact. First, the weight of the truss was
examined to determine if the change in seismic weight would affect the lateral force resisting
system. If the change in weight was too great and the set of steel frames already in place could
not accommodate the increase, the current lateral force resisting system would need to be
changed. Also, the dynamic magnification factor was used to calculate the response of the
system due to the dynamic interaction between its natural frequency of vibration and the activity
frequency. Once the proposed design was complete and met the structural requirements, a cost
analysis was performed.
Table 8: Design Criterion for Alternative Design
Design Criterion
Design Load, (psf) 100
Modulus of Elasticity 29,000 ksi
Weight of Truss
(kips/foot)
0.13
Dead Load of Floor and
Truss (kip/foot)
2.06
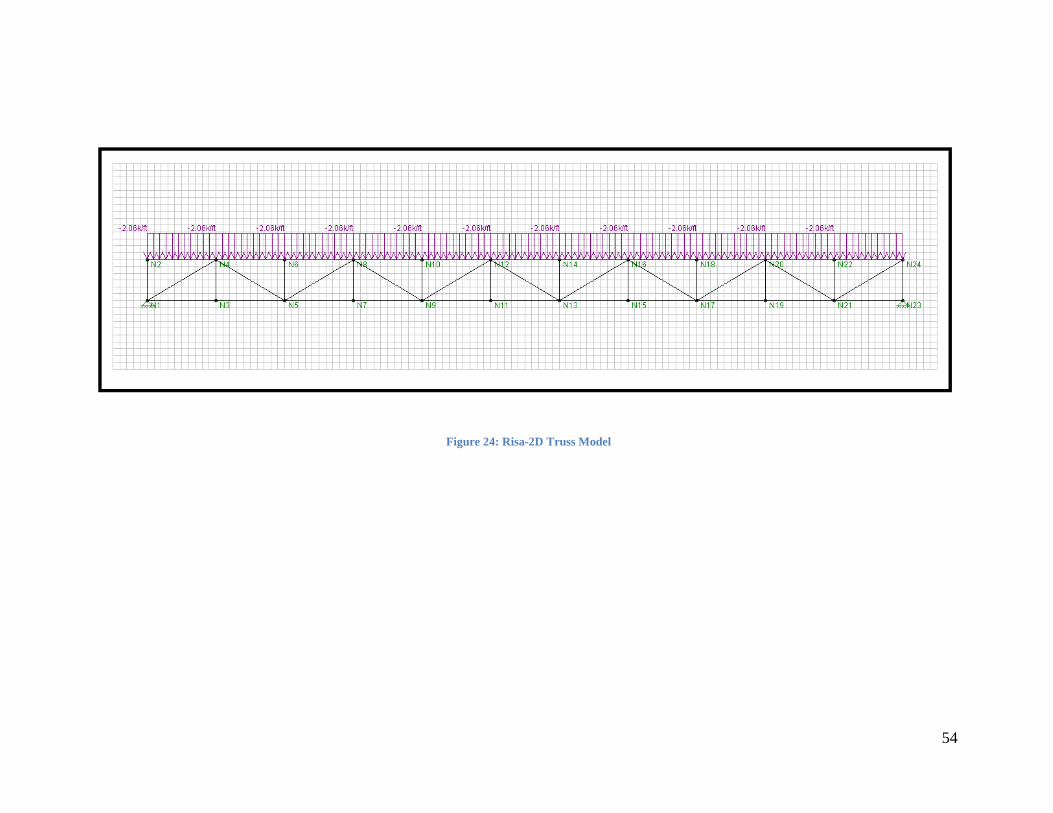
54
Figure 24: Risa-2D Truss Model
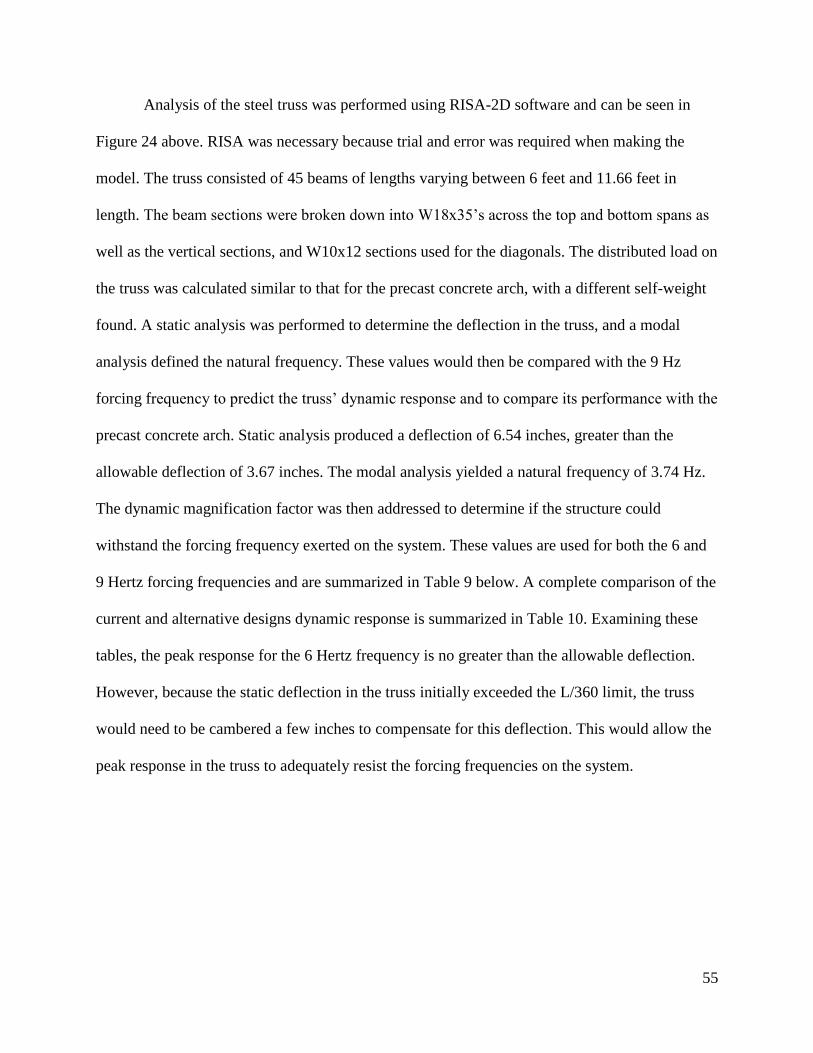
55
Analysis of the steel truss was performed using RISA-2D software and can be seen in
Figure 24 above. RISA was necessary because trial and error was required when making the
model. The truss consisted of 45 beams of lengths varying between 6 feet and 11.66 feet in
length. The beam sections were broken down into W18x35’s across the top and bottom spans as
well as the vertical sections, and W10x12 sections used for the diagonals. The distributed load on
the truss was calculated similar to that for the precast concrete arch, with a different self-weight
found. A static analysis was performed to determine the deflection in the truss, and a modal
analysis defined the natural frequency. These values would then be compared with the 9 Hz
forcing frequency to predict the truss’ dynamic response and to compare its performance with the
precast concrete arch. Static analysis produced a deflection of 6.54 inches, greater than the
allowable deflection of 3.67 inches. The modal analysis yielded a natural frequency of 3.74 Hz.
The dynamic magnification factor was then addressed to determine if the structure could
withstand the forcing frequency exerted on the system. These values are used for both the 6 and
9 Hertz forcing frequencies and are summarized in Table 9 below. A complete comparison of the
current and alternative designs dynamic response is summarized in Table 10. Examining these
tables, the peak response for the 6 Hertz frequency is no greater than the allowable deflection.
However, because the static deflection in the truss initially exceeded the L/360 limit, the truss
would need to be cambered a few inches to compensate for this deflection. This would allow the
peak response in the truss to adequately resist the forcing frequencies on the system.
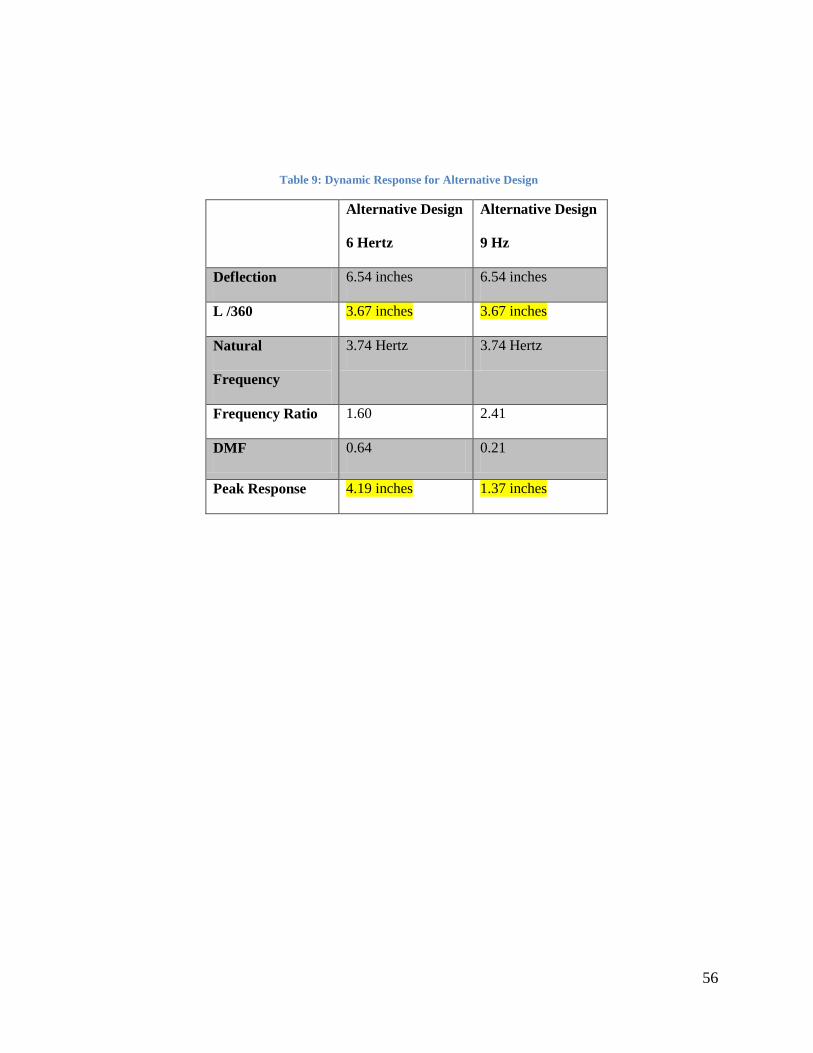
56
Table 9: Dynamic Response for Alternative Design
Alternative Design
6 Hertz
Alternative Design
9 Hz
Deflection 6.54 inches 6.54 inches
L /360 3.67 inches 3.67 inches
Natural
Frequency
3.74 Hertz 3.74 Hertz
Frequency Ratio 1.60 2.41
DMF 0.64 0.21
Peak Response 4.19 inches 1.37 inches
57
Table 10: Dynamic Response Results
Current
Design
6 Hertz
Current Design
9 Hertz
Alternative Design
6 Hertz
Alternative Design
9 Hz
Deflection 1.22 inches 1.22 inches 6.54 inches 6.54 inches
L /360 3.67 inches 3.67 inches 3.67 inches 3.67 inches
Natural
Frequency
5.2 Hertz 5.2 Hertz 3.74 Hertz 3.74 Hertz
Frequency Ratio 1.16 1.73 1.60 2.41
DMF 2.88 0.501 0.64 0.21
Peak Response 3.51 inches 1.44 inches 4.19 inches 1.37 inches
4.3 Cost Comparison Using the properties of the concrete arches, such as the weight and total area, as well as
the material properties of A992 steel, a cost analysis was determined for the two designs. The
fabrication times as well as the erection time for placement of the trusses were necessary to
compare scheduling differences with the current design.
A comparison between the precast concrete arches and the steel truss was performed to
determine the value of each method. Table 11 below displays the properties used for each design
in determining the cost per member, as well as calculations for individual costs and cost of the
entire support system. The steel truss system was approximately 2.42% less expensive than the
concrete arch system.
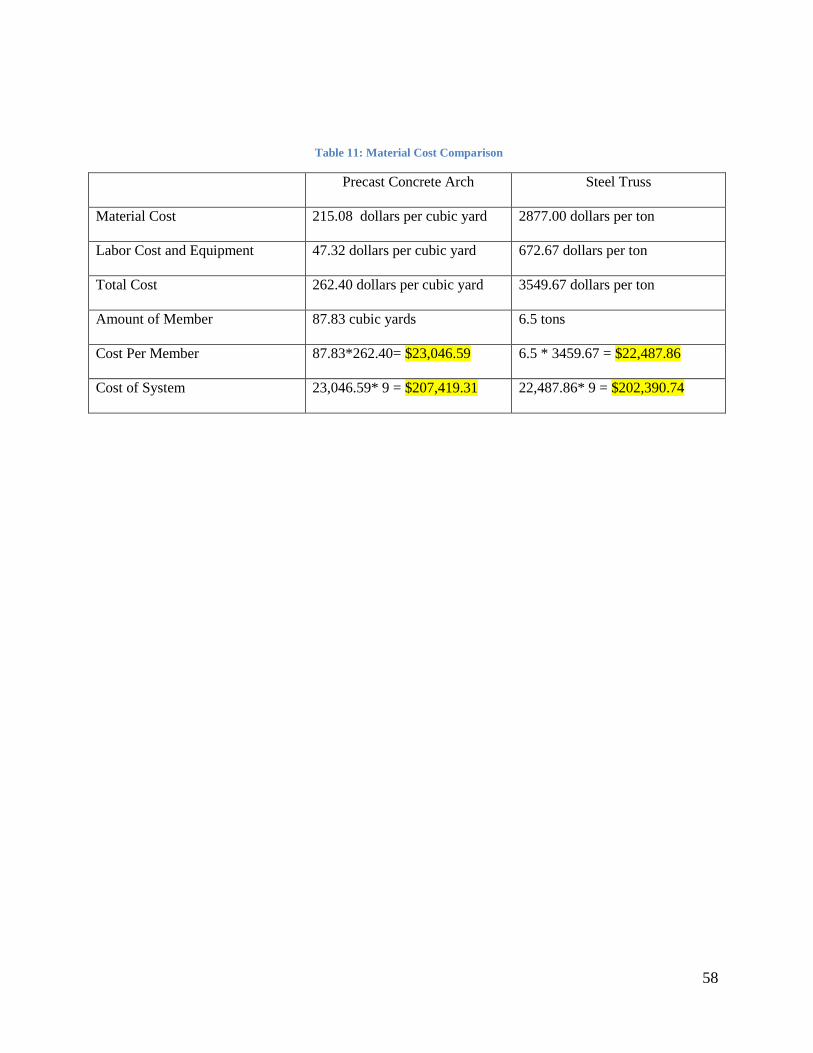
58
Table 11: Material Cost Comparison
Precast Concrete Arch Steel Truss
Material Cost 215.08 dollars per cubic yard 2877.00 dollars per ton
Labor Cost and Equipment 47.32 dollars per cubic yard 672.67 dollars per ton
Total Cost 262.40 dollars per cubic yard 3549.67 dollars per ton
Amount of Member 87.83 cubic yards 6.5 tons
Cost Per Member 87.83*262.40= $23,046.59 6.5 * 3459.67 = $22,487.86
Cost of System 23,046.59* 9 = $207,419.31 22,487.86* 9 = $202,390.74
59
5.0 Conclusions This report examined some aspects of the construction process in regards to the
Recreation Center being constructed on the WPI campus. The application of Building
Information Modeling was studied to determine possible uses of 4-D modeling and its
applicability and usability in Project Management. The findings were compiled into a
PowerPoint presentation and presented at one of the owner’s meetings held at WPI, and feedback
was recorded and incorporated into determining the conclusions about BIM. Also, the supports
to the fourth floor gymnasium were analyzed and an alternative design was created to compare
the dynamic response of the two systems as well as the cost. The results were used to determine
if an alternative design was feasible.
5.1 Building Information Modeling and Project Management Creating 3-D models with other dimensions connected to them creates a versatile
platform that can be used by a project manager. It creates a visualization that can be used as a
tool to not only track performance, but to also update the parties involved in the construction
project that may not be able to see the project in person. Previously, the only way for someone
to find out the progress of construction was with a chart or a graph showing the different values
illustrating the progress. While this way has been useful in the past, it can become very complex
and difficult to understand. BIM allows for the compilation of these charts and graphs with a
visual representation of the project that can be easily understood
This combination of separate technologies is a supplement to one another. When
something happens that prohibits the project from moving forward in bid packages that are
highly visible, for example the steel construction in a certain area of a building, it may seem that
the building is very far behind schedule. In the new Recreation Center for WPI, there was a case
60
where this happened, however, with the information extracted from the BIM model, it was easy
to show that because one area may be behind, other areas were increasing production and the
percentage of steel completed was relatively the same. Another use for BIM is to track changes.
If the same situation with the steel arises, one can easily change the phase that it is in and
establish quantity differences.
There are limitations however, that were specifically pointed out at the presentation by
the parties involved. First, Revit can be difficult software to use to create these models. If the
person who is using the software does not have a substantial background and knowledge of the
capabilities of the system, it will be difficult and frustrating. The interface of Revit lacks a way
to un-click or an “undo” button, so if a person is highlighting multiple elements to be put into a
phase and clicks on the wrong thing, example of such being a hatch mark, all the elements
cannot be input into a phase and have to be re-highlighted. Also, with the factor of ease being
based on experience and knowledge, the amount of time to create a model varies from person to
person. The need for the model must be compared to the amount of dedication required to create
the model and whether spending this time is worth it or not. When Revit updates their software
with BIM in mind, or when another software is developed that is more user-friendly and simpler,
this will become the industry standard. As was stated at the presentation by Brent Arthaud, “This
is the future of our industry”.
5.2 Earned Value Analysis Earned Value Analyses (EVA) are not a new concept to project management, but
incorporating BIM technology into the EVA brings a difference aspect into the analysis. The
ability to extract quantities from Revit enables project managers to complete a detailed analysis
and compare the progress based on any phasing deemed useful. Feedback from the group’s
61
presentation at the Owner’s Meeting of the project provided insight into the applicability of
incorporating BIM technology into meetings. One topic that the attendees found intriguing was
the ability to track the percent complete based on phasing. Additionally, from the project
manager’s point of view, tracking the full EVA would also include the actual cost of work
performed (ACWP) and would enable evaluating of the cost variance (CV) and cost performance
index (CPI). If all of this information were entered into the BIM model, using other software
available such as NAVISWORKS, the project manager would have one central location to access
progress monitoring information. These capabilities not only reemphasize the importance of
completing an EVA, but also validate the idea of linking the EVA to the BIM model.
5.3 Structural Analysis The alternative design was performed to not only determine if a steel truss could
effectively replace the concrete arches for supporting the 4th
floor gymnasium at current and
increased vibration frequencies, but to also see if the alternative would be time and cost
effective. For construction purposes, a system of steel trusses can be fabricated off site and
erected on site quickly. This can be seen from the current truss system supporting the roof at the
new Recreation Center project site.
The modal and static analyses for the alternative design showed that the proposed truss
could effectively withstand the 6 Hz forcing frequency used for the current design, as well as the
increased vibration frequency of 9 Hz. Though the deflection in the steel truss was greater than
the deflection in the concrete arch, the dynamic response of the system was still less than the
allowable deflection over the given span, if the truss was cambered. Before the truss could be
substituted for the concrete arches, a cost analysis was performed to determine the practicality of
such a transition.
62
The cost analysis to compare the two designs took into account material costs, we well as
labor and equipment costs and yielded nearly a 3% decrease in cost for the steel truss over the
concrete arch. Based on the reasons above, the system of trusses was determined to perform as
well as the precast concrete arches and is another option for supporting the 4th
floor gymnasium.
5.4 Owner’s Meetings Attendance at the Owner’s Meetings provided valuable insight into the role of the project
manager and the general operation of a project. Because every construction project has aspect
unique to that specific project, the role of the project manager often varies. WPI’s relationship
with Cardinal Construction, the Owner’s Representative, was different than their relationship
with Gilbane Building Co. (Gilbane), the CM @ Risk, and from their relationship with Cannon
Design, the designer. Using contractual agreements provided a collaborative, efficient team that
addressed important project issues and identified potential conflicts. The meetings used a number
of engineering software, including Primavera and Prolog, and the parties involved also used
Revit to create structural drawings and produce a number of drawings and rendered images of
the site. The capabilities of BIM technology can further enhance these meetings by providing a
3-D, or 4-D, visual for the less technical members of the audience, facilitating the
communication of design alternatives, and potentially enhancing the construction updates given
by Neil Benner, senior project manager.
One potential issue identified in the presentation at the Owner’s Meeting was that there
may not always be the need for the model, but in discussions where visualization is essential,
these models could be prepared by an experienced modeler and not only have a positive impact
on the discussion but could also reduce the time of the discussion by providing more views of
potential changes and special orientation within the facility. The benefits of BIM technology
63
could provide a graphic compliment to many topics discussed, especially as research into this
technology grows. There is value added by using 3-D modeling for the clients, as well as the
contractors, because it provides a simpler way to view construction. However, there is a need to
pre-plan the model prior to the owner’s meetings so that it is catered to the needs of the specific
meeting, and also because navigating the Revit model can be difficult. This problem is
disappearing with model segmentation, smaller but better coordinated models, allowing for
easier manipulation of the structure as a whole. With the progress in technology, one shouldn’t
be surprised if they come across this in the near future.
64
Bibliography Breyer, D. E. (2007). Design of Wood Structures. New York: McGraw Hill.
Eastman, C.M., Building Product Models: Computer Environments Supporting Design and
Construction. 1999, Boca Raton, FL: CRC Press
Gallaher, Michael, O’Connor, Alan, Dettbarn Jr., John, and Gilday, Linda. “Cost Analysis of
Inadequate Interoperability in the U.S. Capital Facilities Industry” 2004.
http://www.bfrl.nist.gov/oae/publications/gcrs/04867.pdf
Laiserin, Jerry. Comparing Pommes and Naranjas. December 16 2002
http://www.laiserin.com/features/issue15/feature01.php\
Laiserin, Jerry. Graphisoft on BIM. January 20, 2003
http://www.laiserin.com/features/issue19/feature01.php
Lee, G., Sacks, R., and Eastman, C. M. (2006). Specifying parametric building object behavior
(BOB) for a building information modeling system. Automation in Construction, 15(6), 758-776.
McCormac, J. C. (2008). Structural Steel Design 4th Edition. Ney Jersey: Pearson Prentice Hall.
Murray, T. M., Allen, D. E., & Ungar, E. E. (1997). Floor Vibrations due to Human Activity.
American Institute of Steel Construction.
Oberlender, G. D. (2000). Project Management for Engineering and Construction. McGraw Hill
Paz, Mario. (1985). Structural dynamics: theory and computation. NYC, NY: Van Nostrand
Reinhold Company Inc
Rainer, J. (1984, May). National Research Council Canada. Retrieved October 5, 2010, from
ww.nrc-cnrc.gc.ca: ww.nrc-cnrc.gc.ca
Science Advisory Desk. (2008, December). Design Considerations for the Vibrations of Floors.
Retrieved from scribd.com: http://www.scribd.com/doc/8660417/ad-253-design-considerations-
for-the-vibration-of-floors-part-1-amended
Weisstein, E. (2010). Damped SImple Harmonic Motion-- Critical Damping. Retrieved from
Wolfram Mathworld:
http://mathworld.wolfram.com/DampedSimpleHarmonicMotionCriticalDamping.html
Yessios, C.I. Are We Forgetting Design? AECbytes Viewpoint #10 2004,
http://www.aecbytes.com/viewpoint/2004/issue_10.html
65
Appendix A: Proposal
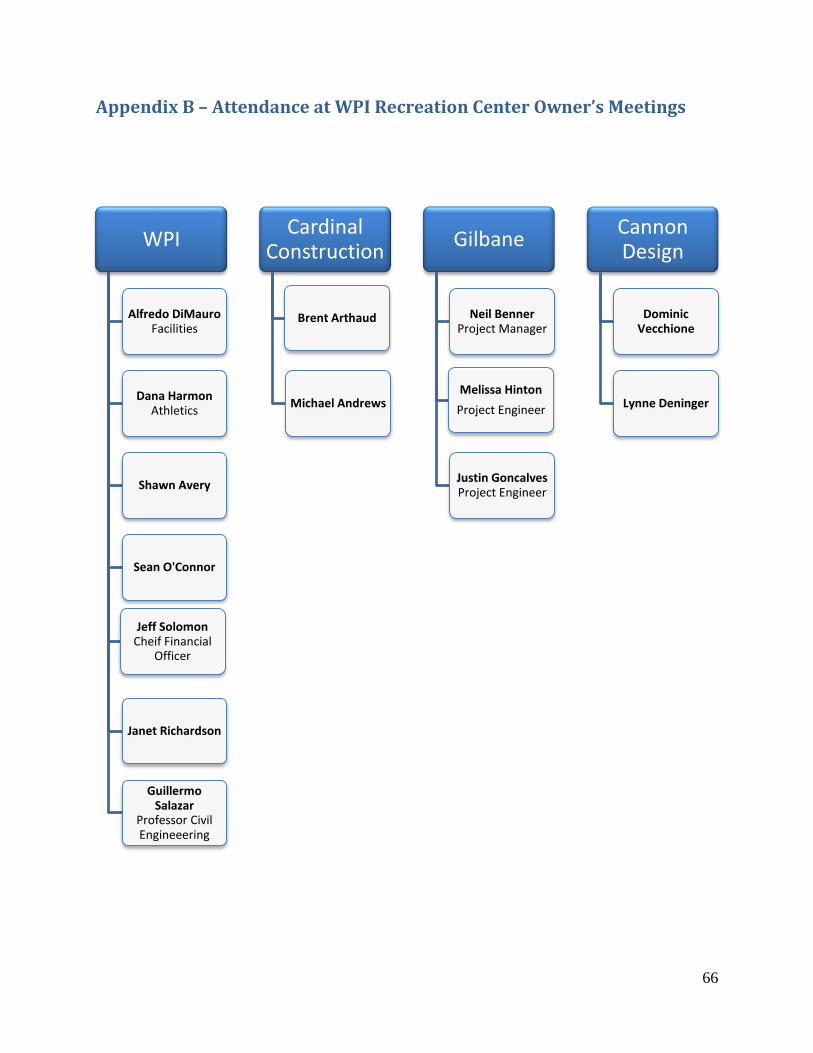
66
Appendix B – Attendance at WPI Recreation Center Owner’s Meetings
WPI
Alfredo DiMauroFacilities
Dana HarmonAthletics
Shawn Avery
Sean O'Connor
Jeff SolomonCheif Financial
Officer
Janet Richardson
Guillermo Salazar
Professor Civil Engineeering
Cardinal Construction
Brent Arthaud
Michael Andrews
Gilbane
Neil BennerProject Manager
Melissa Hinton
Project Engineer
Justin GoncalvesProject Engineer
Cannon Design
Dominic Vecchione
Lynne Deninger
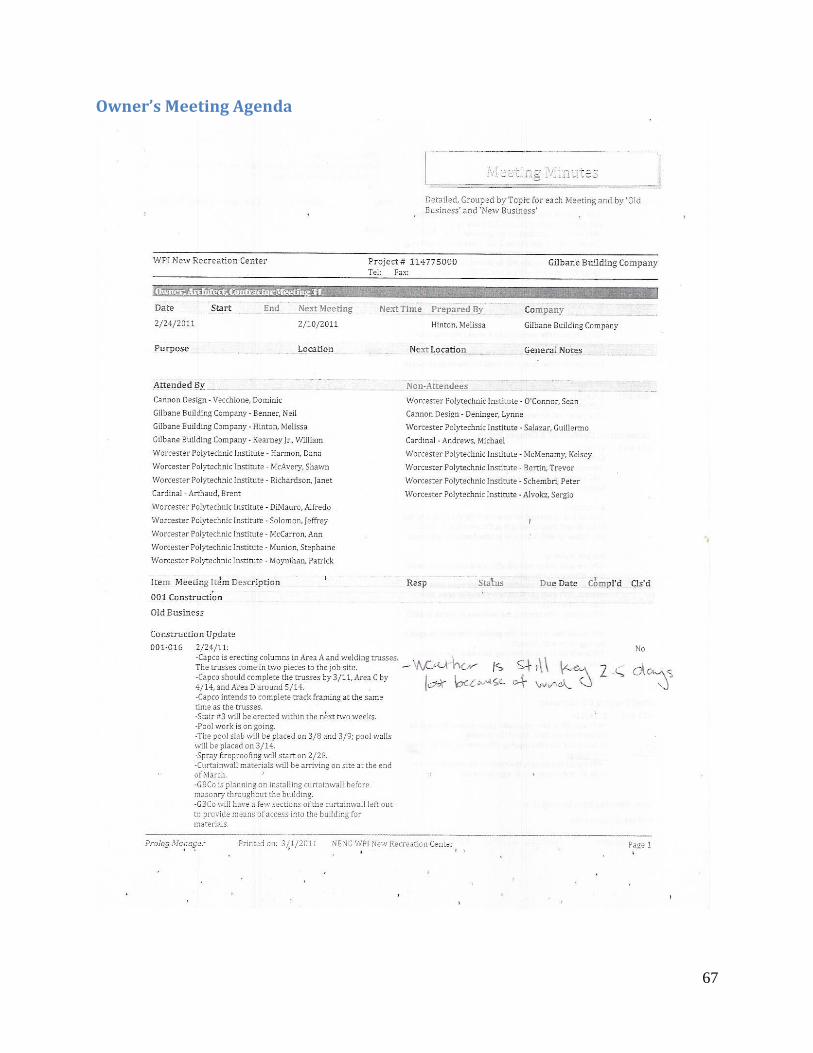
67
Owner’s Meeting Agenda
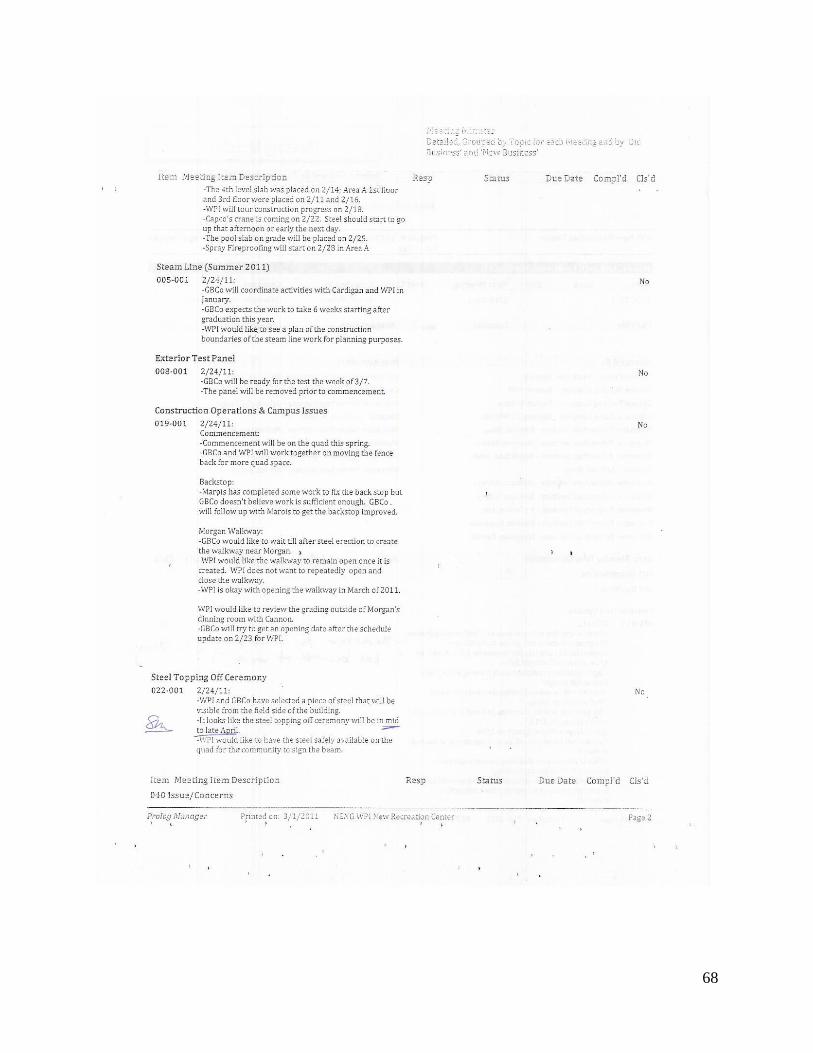
68
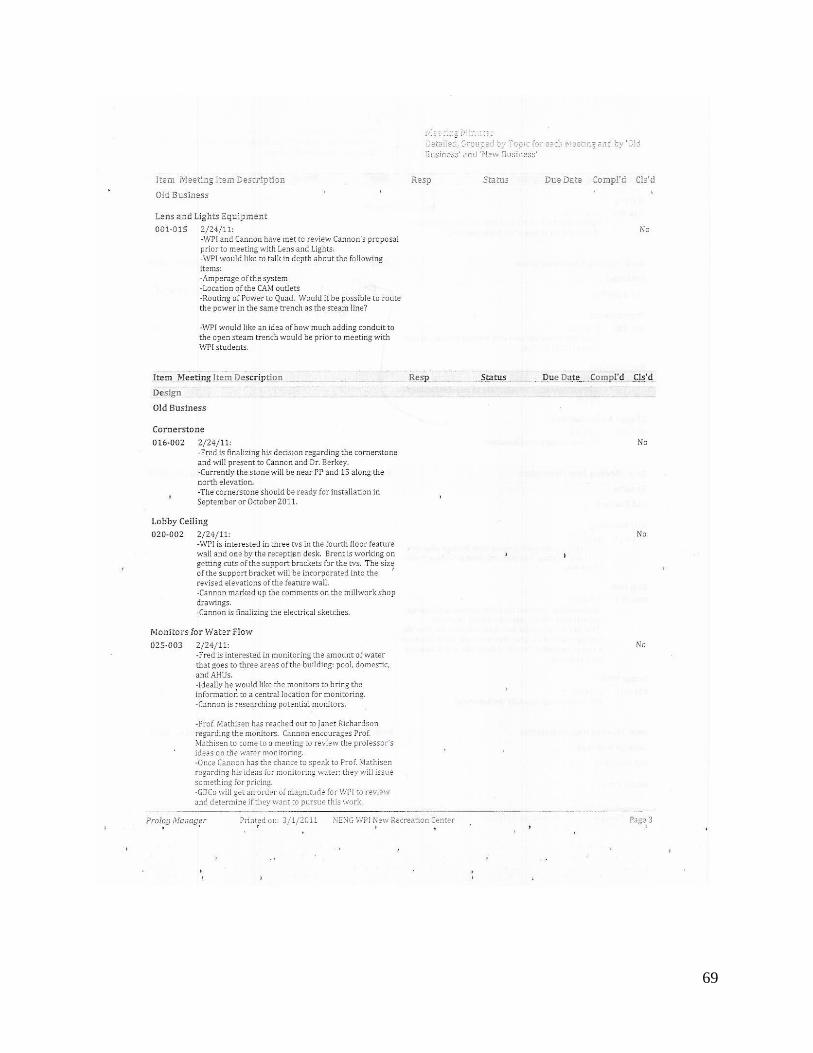
69
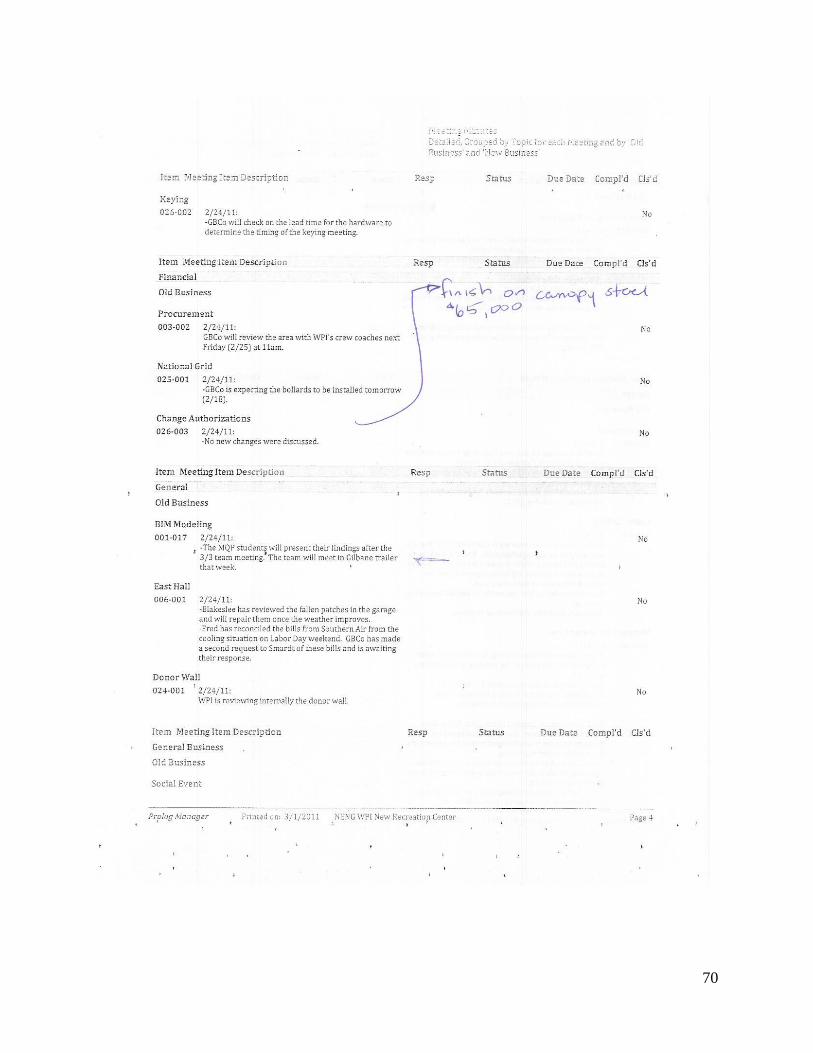
70
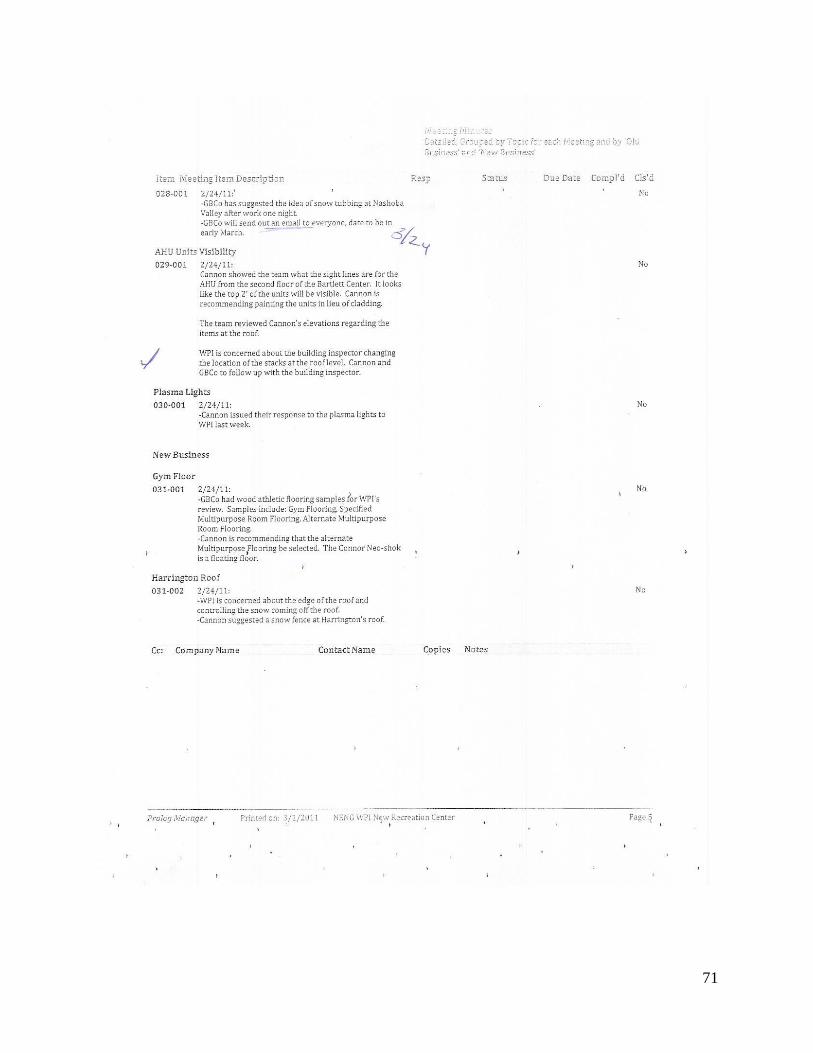
71
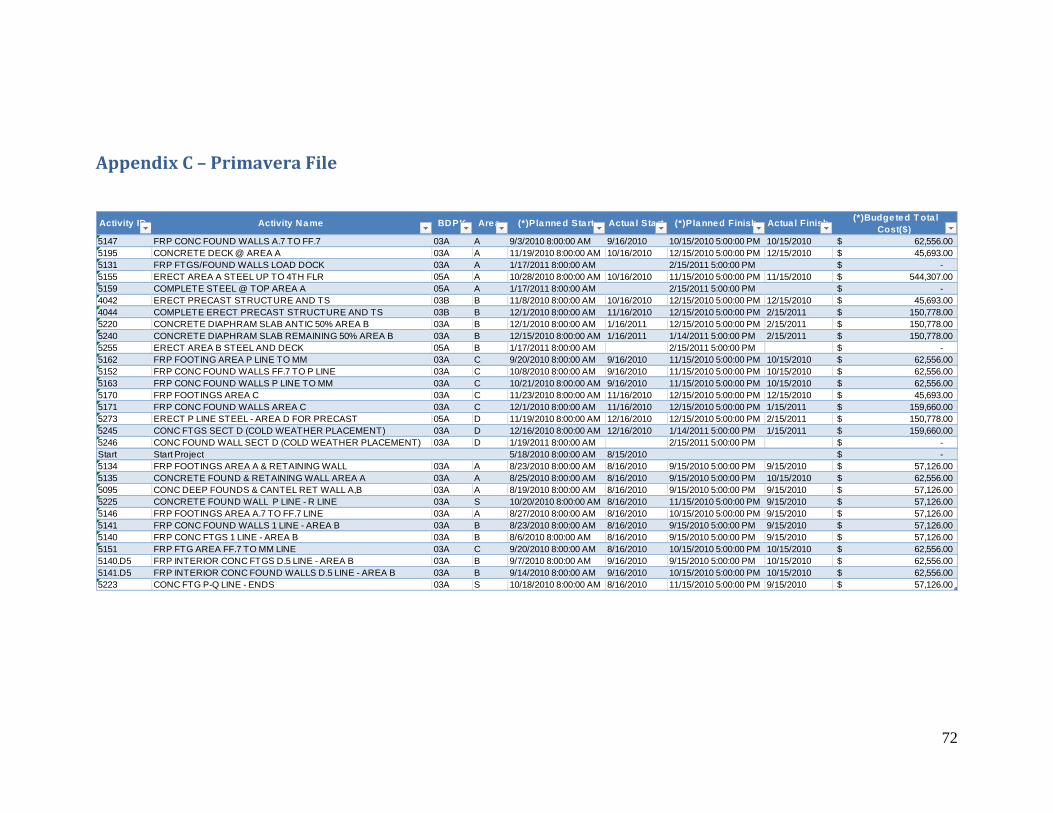
72
Appendix C – Primavera File
Activity ID Activity Name BDPK Area (*)Planned Sta rt Actua l Sta rt (*)Planned Finish Actua l Finish (*)Budgeted T ota l
Cost($)
5147 FRP CONC FOUND WALLS A.7 TO FF.7 03A A 9/3/2010 8:00:00 AM 9/16/2010 10/15/2010 5:00:00 PM 10/15/2010 62,556.00$
5195 CONCRETE DECK @ AREA A 03A A 11/19/2010 8:00:00 AM 10/16/2010 12/15/2010 5:00:00 PM 12/15/2010 45,693.00$
5131 FRP FTGS/FOUND WALLS LOAD DOCK 03A A 1/17/2011 8:00:00 AM 2/15/2011 5:00:00 PM -$
5155 ERECT AREA A STEEL UP TO 4TH FLR 05A A 10/28/2010 8:00:00 AM 10/16/2010 11/15/2010 5:00:00 PM 11/15/2010 544,307.00$
5159 COMPLETE STEEL @ TOP AREA A 05A A 1/17/2011 8:00:00 AM 2/15/2011 5:00:00 PM -$
4042 ERECT PRECAST STRUCTURE AND TS 03B B 11/8/2010 8:00:00 AM 10/16/2010 12/15/2010 5:00:00 PM 12/15/2010 45,693.00$
4044 COMPLETE ERECT PRECAST STRUCTURE AND TS 03B B 12/1/2010 8:00:00 AM 11/16/2010 12/15/2010 5:00:00 PM 2/15/2011 150,778.00$
5220 CONCRETE DIAPHRAM SLAB ANTIC 50% AREA B 03A B 12/1/2010 8:00:00 AM 1/16/2011 12/15/2010 5:00:00 PM 2/15/2011 150,778.00$
5240 CONCRETE DIAPHRAM SLAB REMAINING 50% AREA B 03A B 12/15/2010 8:00:00 AM 1/16/2011 1/14/2011 5:00:00 PM 2/15/2011 150,778.00$
5255 ERECT AREA B STEEL AND DECK 05A B 1/17/2011 8:00:00 AM 2/15/2011 5:00:00 PM -$
5162 FRP FOOTING AREA P LINE TO MM 03A C 9/20/2010 8:00:00 AM 9/16/2010 11/15/2010 5:00:00 PM 10/15/2010 62,556.00$
5152 FRP CONC FOUND WALLS FF.7 TO P LINE 03A C 10/8/2010 8:00:00 AM 9/16/2010 11/15/2010 5:00:00 PM 10/15/2010 62,556.00$
5163 FRP CONC FOUND WALLS P LINE TO MM 03A C 10/21/2010 8:00:00 AM 9/16/2010 11/15/2010 5:00:00 PM 10/15/2010 62,556.00$
5170 FRP FOOTINGS AREA C 03A C 11/23/2010 8:00:00 AM 11/16/2010 12/15/2010 5:00:00 PM 12/15/2010 45,693.00$
5171 FRP CONC FOUND WALLS AREA C 03A C 12/1/2010 8:00:00 AM 11/16/2010 12/15/2010 5:00:00 PM 1/15/2011 159,660.00$
5273 ERECT P LINE STEEL - AREA D FOR PRECAST 05A D 11/19/2010 8:00:00 AM 12/16/2010 12/15/2010 5:00:00 PM 2/15/2011 150,778.00$
5245 CONC FTGS SECT D (COLD WEATHER PLACEMENT) 03A D 12/16/2010 8:00:00 AM 12/16/2010 1/14/2011 5:00:00 PM 1/15/2011 159,660.00$
5246 CONC FOUND WALL SECT D (COLD WEATHER PLACEMENT) 03A D 1/19/2011 8:00:00 AM 2/15/2011 5:00:00 PM -$
Start Start Project 5/18/2010 8:00:00 AM 8/15/2010 -$
5134 FRP FOOTINGS AREA A & RETAINING WALL 03A A 8/23/2010 8:00:00 AM 8/16/2010 9/15/2010 5:00:00 PM 9/15/2010 57,126.00$
5135 CONCRETE FOUND & RETAINING WALL AREA A 03A A 8/25/2010 8:00:00 AM 8/16/2010 9/15/2010 5:00:00 PM 10/15/2010 62,556.00$
5095 CONC DEEP FOUNDS & CANTEL RET WALL A,B 03A A 8/19/2010 8:00:00 AM 8/16/2010 9/15/2010 5:00:00 PM 9/15/2010 57,126.00$
5225 CONCRETE FOUND WALL P LINE - R LINE 03A S 10/20/2010 8:00:00 AM 8/16/2010 11/15/2010 5:00:00 PM 9/15/2010 57,126.00$
5146 FRP FOOTINGS AREA A.7 TO FF.7 LINE 03A A 8/27/2010 8:00:00 AM 8/16/2010 10/15/2010 5:00:00 PM 9/15/2010 57,126.00$
5141 FRP CONC FOUND WALLS 1 LINE - AREA B 03A B 8/23/2010 8:00:00 AM 8/16/2010 9/15/2010 5:00:00 PM 9/15/2010 57,126.00$
5140 FRP CONC FTGS 1 LINE - AREA B 03A B 8/6/2010 8:00:00 AM 8/16/2010 9/15/2010 5:00:00 PM 9/15/2010 57,126.00$
5151 FRP FTG AREA FF.7 TO MM LINE 03A C 9/20/2010 8:00:00 AM 8/16/2010 10/15/2010 5:00:00 PM 10/15/2010 62,556.00$
5140.D5 FRP INTERIOR CONC FTGS D.5 LINE - AREA B 03A B 9/7/2010 8:00:00 AM 9/16/2010 9/15/2010 5:00:00 PM 10/15/2010 62,556.00$
5141.D5 FRP INTERIOR CONC FOUND WALLS D.5 LINE - AREA B 03A B 9/14/2010 8:00:00 AM 9/16/2010 10/15/2010 5:00:00 PM 10/15/2010 62,556.00$
5223 CONC FTG P-Q LINE - ENDS 03A S 10/18/2010 8:00:00 AM 8/16/2010 11/15/2010 5:00:00 PM 9/15/2010 57,126.00$
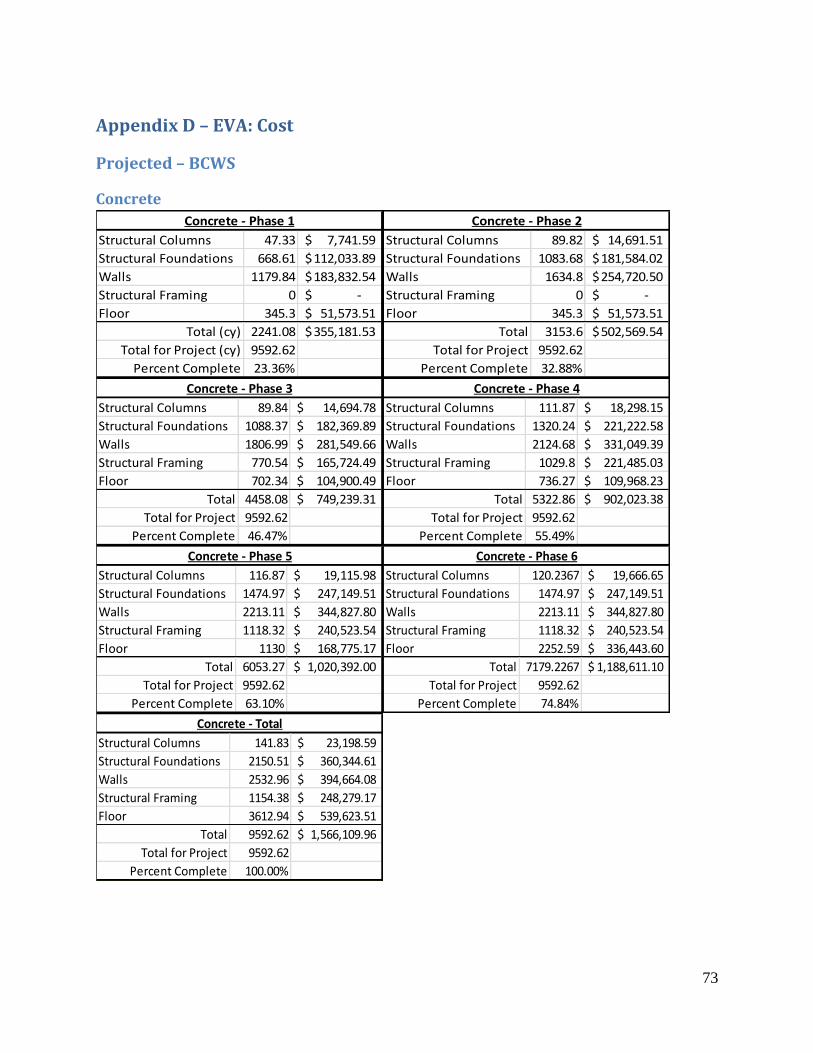
73
Appendix D – EVA: Cost
Projected – BCWS
Concrete
Structural Columns 47.33 7,741.59$
Structural Foundations 668.61 112,033.89$
Walls 1179.84 183,832.54$
Structural Framing 0 -$
Floor 345.3 51,573.51$
Total (cy) 2241.08 355,181.53$
Total for Project (cy) 9592.62
Percent Complete 23.36%
Concrete - Phase 1
Structural Columns 89.82 14,691.51$
Structural Foundations 1083.68 181,584.02$
Walls 1634.8 254,720.50$
Structural Framing 0 -$
Floor 345.3 51,573.51$
Total 3153.6 502,569.54$
Total for Project 9592.62
Percent Complete 32.88%
Concrete - Phase 2
Structural Columns 89.84 14,694.78$
Structural Foundations 1088.37 182,369.89$
Walls 1806.99 281,549.66$
Structural Framing 770.54 165,724.49$
Floor 702.34 104,900.49$
Total 4458.08 749,239.31$
Total for Project 9592.62
Percent Complete 46.47%
Concrete - Phase 3
Structural Columns 111.87 18,298.15$
Structural Foundations 1320.24 221,222.58$
Walls 2124.68 331,049.39$
Structural Framing 1029.8 221,485.03$
Floor 736.27 109,968.23$
Total 5322.86 902,023.38$
Total for Project 9592.62
Percent Complete 55.49%
Concrete - Phase 4
Structural Columns 116.87 19,115.98$
Structural Foundations 1474.97 247,149.51$
Walls 2213.11 344,827.80$
Structural Framing 1118.32 240,523.54$
Floor 1130 168,775.17$
Total 6053.27 1,020,392.00$
Total for Project 9592.62
Percent Complete 63.10%
Concrete - Phase 5
Structural Columns 120.2367 19,666.65$
Structural Foundations 1474.97 247,149.51$
Walls 2213.11 344,827.80$
Structural Framing 1118.32 240,523.54$
Floor 2252.59 336,443.60$
Total 7179.2267 1,188,611.10$
Total for Project 9592.62
Percent Complete 74.84%
Concrete - Phase 6
Structural Columns 141.83 23,198.59$
Structural Foundations 2150.51 360,344.61$
Walls 2532.96 394,664.08$
Structural Framing 1154.38 248,279.17$
Floor 3612.94 539,623.51$
Total 9592.62 1,566,109.96$
Total for Project 9592.62
Percent Complete 100.00%
Concrete - Total
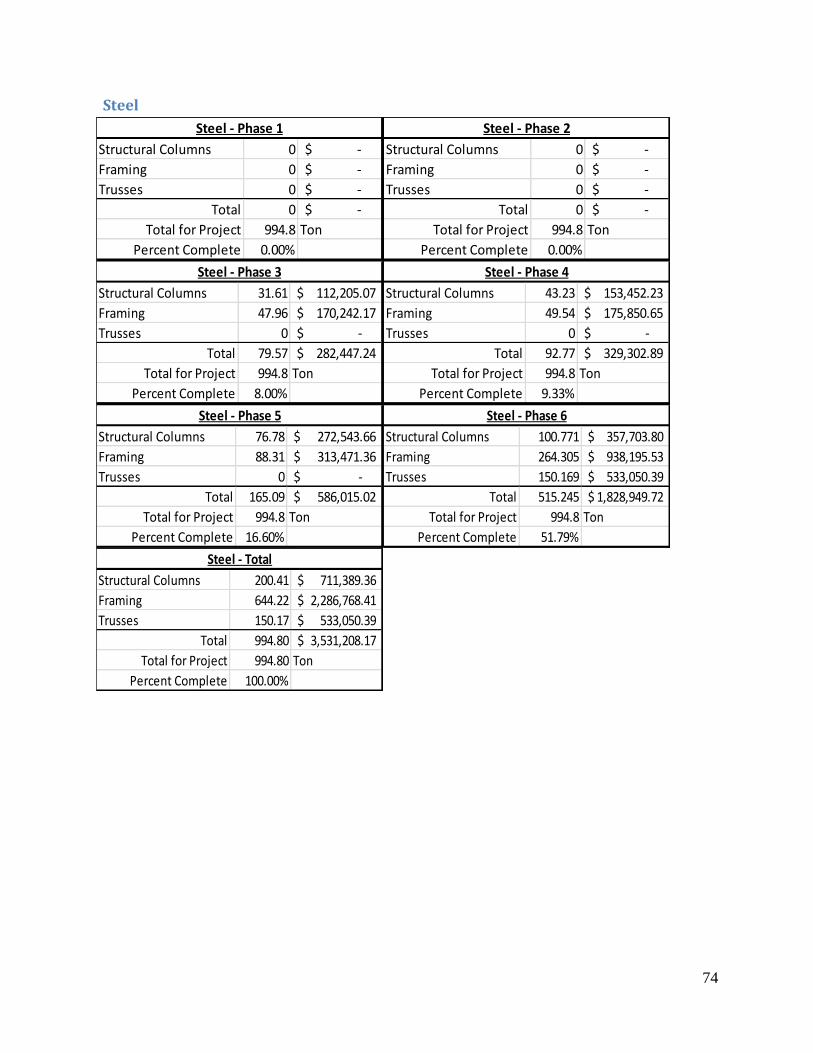
74
Steel
Structural Columns 0 -$
Framing 0 -$
Trusses 0 -$
Total 0 -$
Total for Project 994.8 Ton
Percent Complete 0.00%
Steel - Phase 1
Structural Columns 0 -$
Framing 0 -$
Trusses 0 -$
Total 0 -$
Total for Project 994.8 Ton
Percent Complete 0.00%
Steel - Phase 2
Structural Columns 31.61 112,205.07$
Framing 47.96 170,242.17$
Trusses 0 -$
Total 79.57 282,447.24$
Total for Project 994.8 Ton
Percent Complete 8.00%
Steel - Phase 3
Structural Columns 43.23 153,452.23$
Framing 49.54 175,850.65$
Trusses 0 -$
Total 92.77 329,302.89$
Total for Project 994.8 Ton
Percent Complete 9.33%
Steel - Phase 4
Structural Columns 76.78 272,543.66$
Framing 88.31 313,471.36$
Trusses 0 -$
Total 165.09 586,015.02$
Total for Project 994.8 Ton
Percent Complete 16.60%
Steel - Phase 5
Structural Columns 100.771 357,703.80$
Framing 264.305 938,195.53$
Trusses 150.169 533,050.39$
Total 515.245 1,828,949.72$
Total for Project 994.8 Ton
Percent Complete 51.79%
Steel - Phase 6
Structural Columns 200.41 711,389.36$
Framing 644.22 2,286,768.41$
Trusses 150.17 533,050.39$
Total 994.80 3,531,208.17$
Total for Project 994.80 Ton
Percent Complete 100.00%
Steel - Total
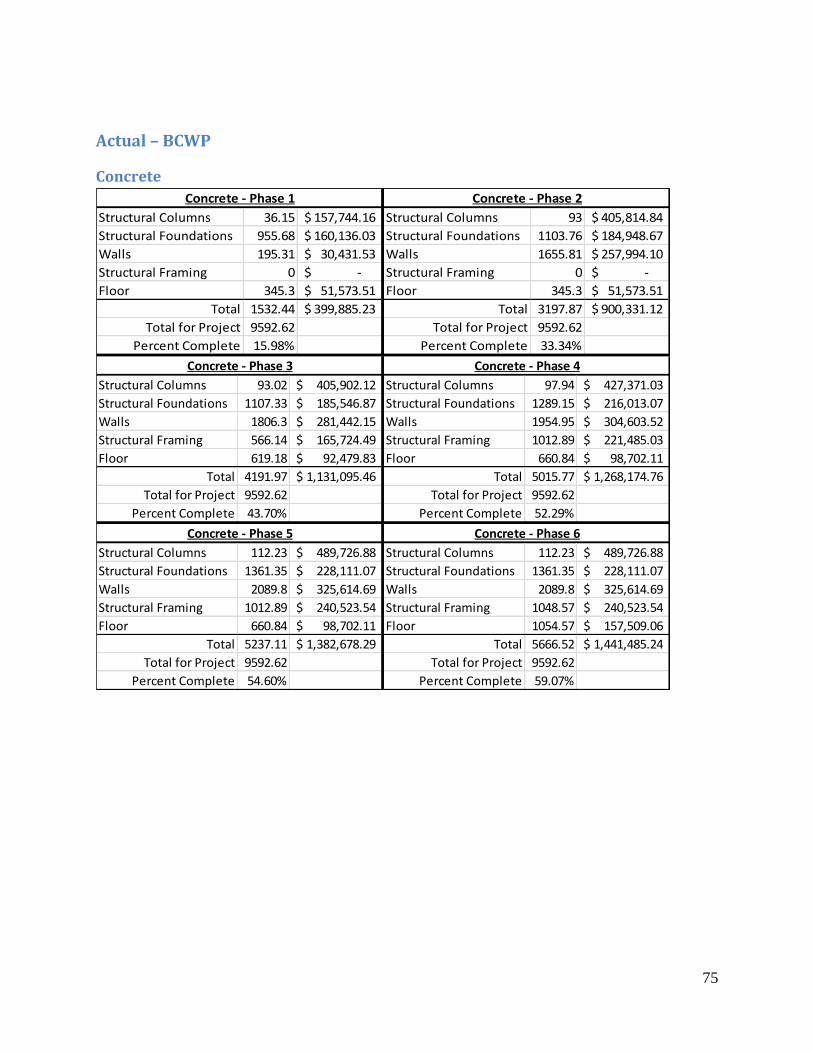
75
Actual – BCWP
Concrete
Structural Columns 36.15 157,744.16$
Structural Foundations 955.68 160,136.03$
Walls 195.31 30,431.53$
Structural Framing 0 -$
Floor 345.3 51,573.51$
Total 1532.44 399,885.23$
Total for Project 9592.62
Percent Complete 15.98%
Concrete - Phase 1
Structural Columns 93 405,814.84$
Structural Foundations 1103.76 184,948.67$
Walls 1655.81 257,994.10$
Structural Framing 0 -$
Floor 345.3 51,573.51$
Total 3197.87 900,331.12$
Total for Project 9592.62
Percent Complete 33.34%
Concrete - Phase 2
Structural Columns 93.02 405,902.12$
Structural Foundations 1107.33 185,546.87$
Walls 1806.3 281,442.15$
Structural Framing 566.14 165,724.49$
Floor 619.18 92,479.83$
Total 4191.97 1,131,095.46$
Total for Project 9592.62
Percent Complete 43.70%
Concrete - Phase 3
Structural Columns 97.94 427,371.03$
Structural Foundations 1289.15 216,013.07$
Walls 1954.95 304,603.52$
Structural Framing 1012.89 221,485.03$
Floor 660.84 98,702.11$
Total 5015.77 1,268,174.76$
Total for Project 9592.62
Percent Complete 52.29%
Concrete - Phase 4
Structural Columns 112.23 489,726.88$
Structural Foundations 1361.35 228,111.07$
Walls 2089.8 325,614.69$
Structural Framing 1012.89 240,523.54$
Floor 660.84 98,702.11$
Total 5237.11 1,382,678.29$
Total for Project 9592.62
Percent Complete 54.60%
Concrete - Phase 5
Structural Columns 112.23 489,726.88$
Structural Foundations 1361.35 228,111.07$
Walls 2089.8 325,614.69$
Structural Framing 1048.57 240,523.54$
Floor 1054.57 157,509.06$
Total 5666.52 1,441,485.24$
Total for Project 9592.62
Percent Complete 59.07%
Concrete - Phase 6
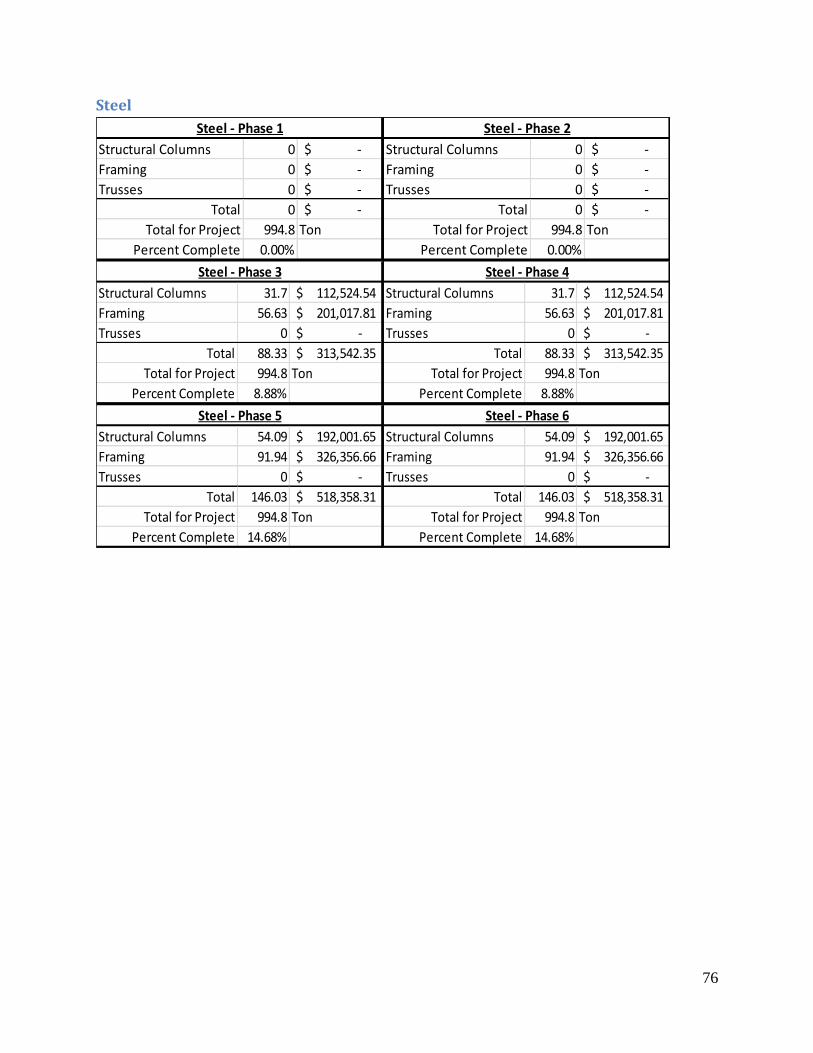
76
Steel
Structural Columns 0 -$
Framing 0 -$
Trusses 0 -$
Total 0 -$
Total for Project 994.8 Ton
Percent Complete 0.00%
Steel - Phase 1
Structural Columns 0 -$
Framing 0 -$
Trusses 0 -$
Total 0 -$
Total for Project 994.8 Ton
Percent Complete 0.00%
Steel - Phase 2
Structural Columns 31.7 112,524.54$
Framing 56.63 201,017.81$
Trusses 0 -$
Total 88.33 313,542.35$
Total for Project 994.8 Ton
Percent Complete 8.88%
Steel - Phase 3
Structural Columns 31.7 112,524.54$
Framing 56.63 201,017.81$
Trusses 0 -$
Total 88.33 313,542.35$
Total for Project 994.8 Ton
Percent Complete 8.88%
Steel - Phase 4
Structural Columns 54.09 192,001.65$
Framing 91.94 326,356.66$
Trusses 0 -$
Total 146.03 518,358.31$
Total for Project 994.8 Ton
Percent Complete 14.68%
Steel - Phase 5
Structural Columns 54.09 192,001.65$
Framing 91.94 326,356.66$
Trusses 0 -$
Total 146.03 518,358.31$
Total for Project 994.8 Ton
Percent Complete 14.68%
Steel - Phase 6
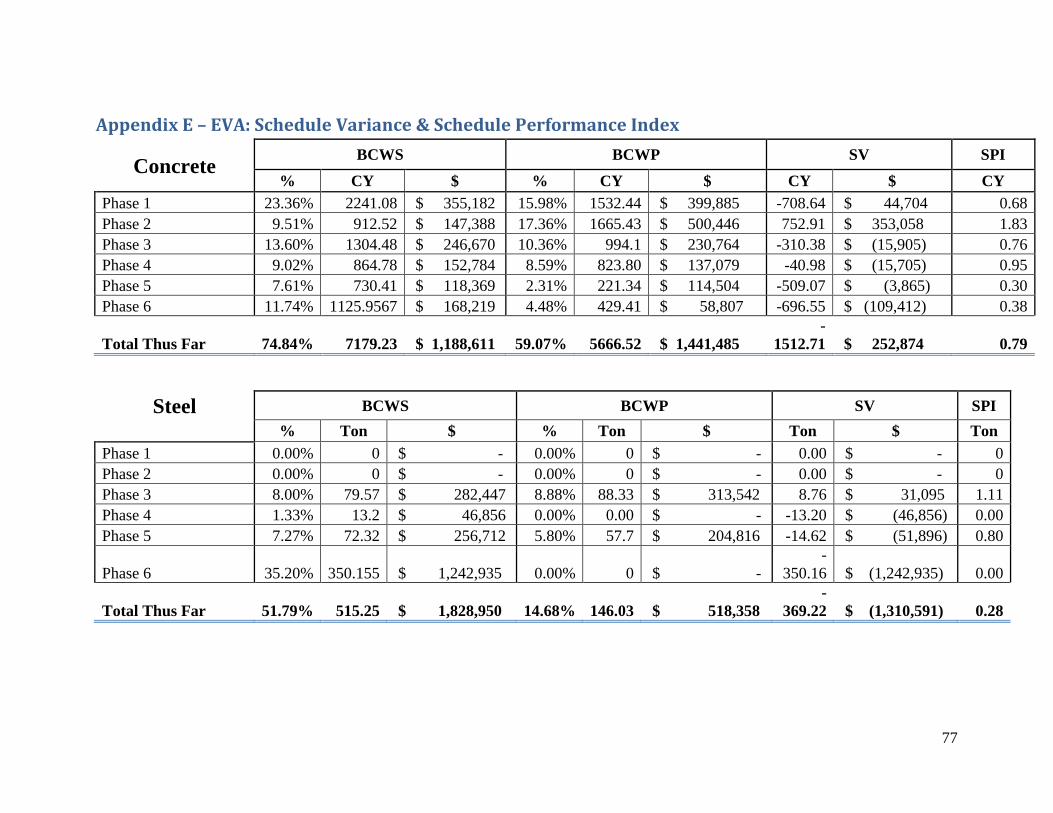
77
Appendix E – EVA: Schedule Variance & Schedule Performance Index
Concrete BCWS BCWP SV SPI
% CY $ % CY $ CY $ CY
Phase 1 23.36% 2241.08 $ 355,182 15.98% 1532.44 $ 399,885 -708.64 $ 44,704 0.68
Phase 2 9.51% 912.52 $ 147,388 17.36% 1665.43 $ 500,446 752.91 $ 353,058 1.83
Phase 3 13.60% 1304.48 $ 246,670 10.36% 994.1 $ 230,764 -310.38 $ (15,905) 0.76
Phase 4 9.02% 864.78 $ 152,784 8.59% 823.80 $ 137,079 -40.98 $ (15,705) 0.95
Phase 5 7.61% 730.41 $ 118,369 2.31% 221.34 $ 114,504 -509.07 $ (3,865) 0.30
Phase 6 11.74% 1125.9567 $ 168,219 4.48% 429.41 $ 58,807 -696.55 $ (109,412) 0.38
Total Thus Far 74.84% 7179.23 $ 1,188,611 59.07% 5666.52 $ 1,441,485
-
1512.71 $ 252,874 0.79
Steel BCWS BCWP SV SPI
% Ton $ % Ton $ Ton $ Ton
Phase 1 0.00% 0 $ - 0.00% 0 $ - 0.00 $ - 0
Phase 2 0.00% 0 $ - 0.00% 0 $ - 0.00 $ - 0
Phase 3 8.00% 79.57 $ 282,447 8.88% 88.33 $ 313,542 8.76 $ 31,095 1.11
Phase 4 1.33% 13.2 $ 46,856 0.00% 0.00 $ - -13.20 $ (46,856) 0.00
Phase 5 7.27% 72.32 $ 256,712 5.80% 57.7 $ 204,816 -14.62 $ (51,896) 0.80
Phase 6 35.20% 350.155 $ 1,242,935 0.00% 0 $ -
-
350.16 $ (1,242,935) 0.00
Total Thus Far 51.79% 515.25 $ 1,828,950 14.68% 146.03 $ 518,358
-
369.22 $ (1,310,591) 0.28
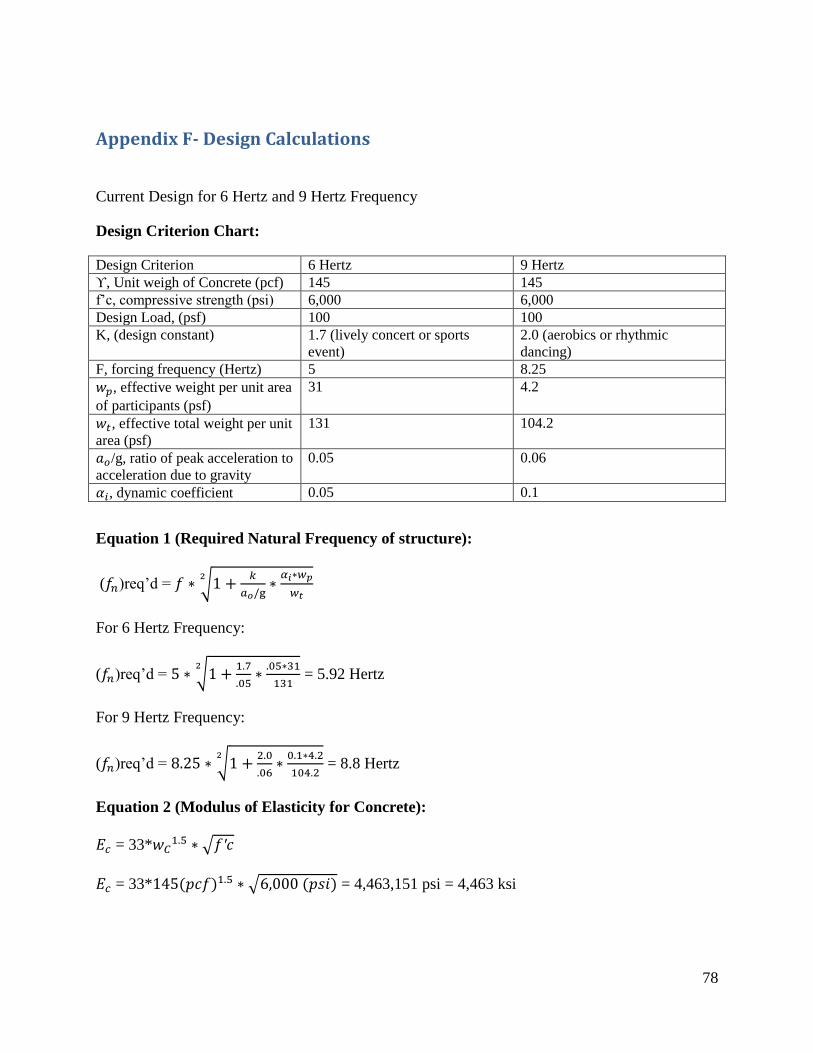
78
Appendix F- Design Calculations
Current Design for 6 Hertz and 9 Hertz Frequency
Design Criterion Chart:
Design Criterion 6 Hertz 9 Hertz
ϒ, Unit weigh of Concrete (pcf) 145 145
f’c, compressive strength (psi) 6,000 6,000
Design Load, (psf) 100 100
K, (design constant) 1.7 (lively concert or sports
event)
2.0 (aerobics or rhythmic
dancing)
F, forcing frequency (Hertz) 5 8.25
, effective weight per unit area
of participants (psf)
31 4.2
, effective total weight per unit
area (psf)
131 104.2
/g, ratio of peak acceleration to
acceleration due to gravity
0.05 0.06
, dynamic coefficient 0.05 0.1
Equation 1 (Required Natural Frequency of structure):
( )req’d =
For 6 Hertz Frequency:
( )req’d =
= 5.92 Hertz
For 9 Hertz Frequency:
( )req’d =
= 8.8 Hertz
Equation 2 (Modulus of Elasticity for Concrete):
= 33*
= 33* = 4,463,151 psi = 4,463 ksi
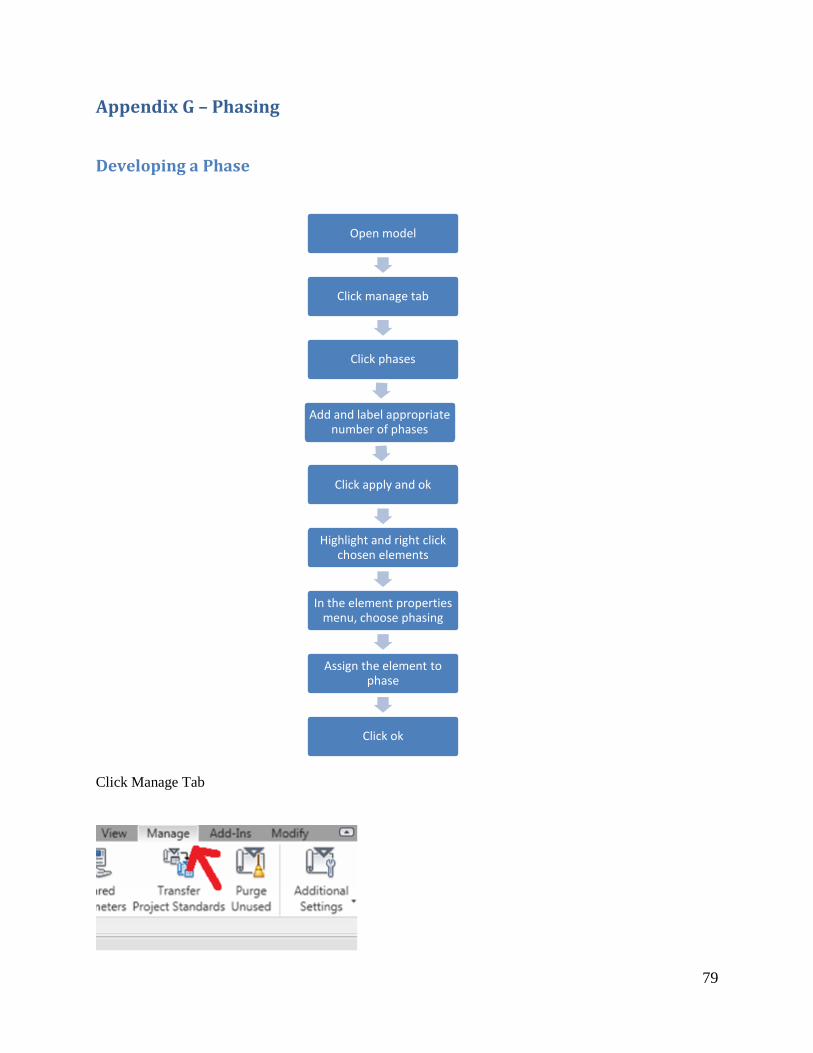
79
Appendix G – Phasing
Developing a Phase
Click Manage Tab
Open model
Click manage tab
Click phases
Add and label appropriate number of phases
Click apply and ok
Highlight and right click chosen elements
In the element properties menu, choose phasing
Assign the element to phase
Click ok
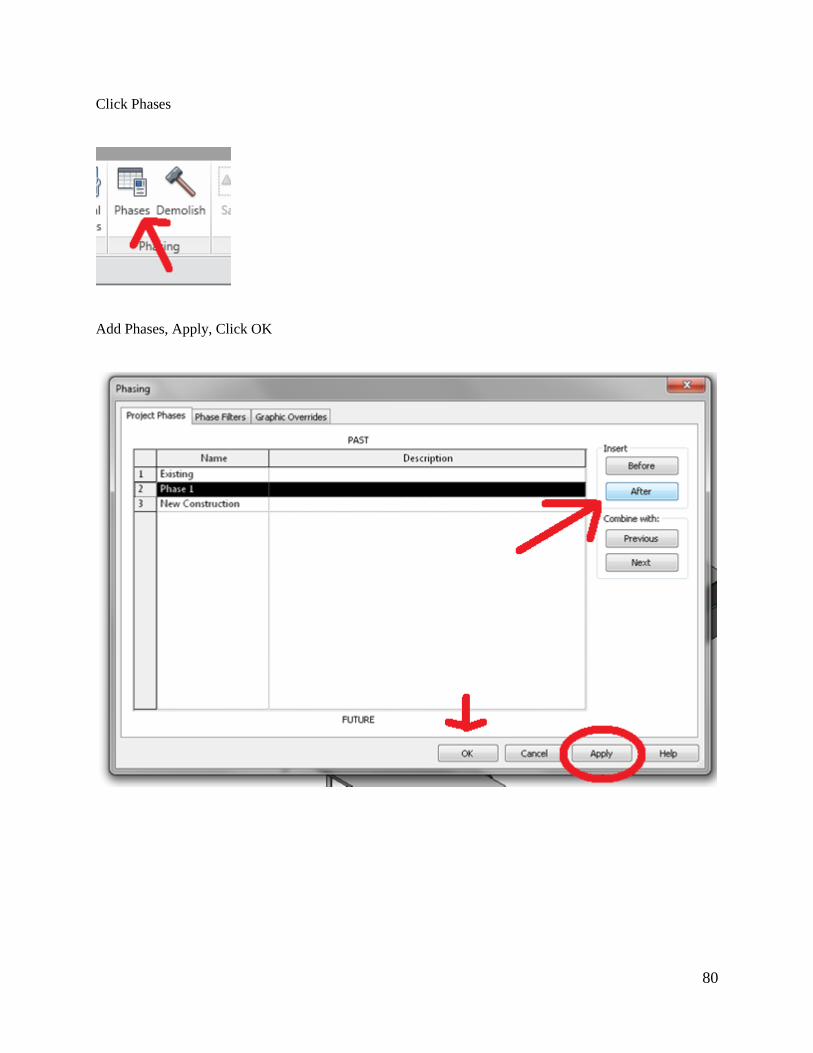
80
Click Phases
Add Phases, Apply, Click OK
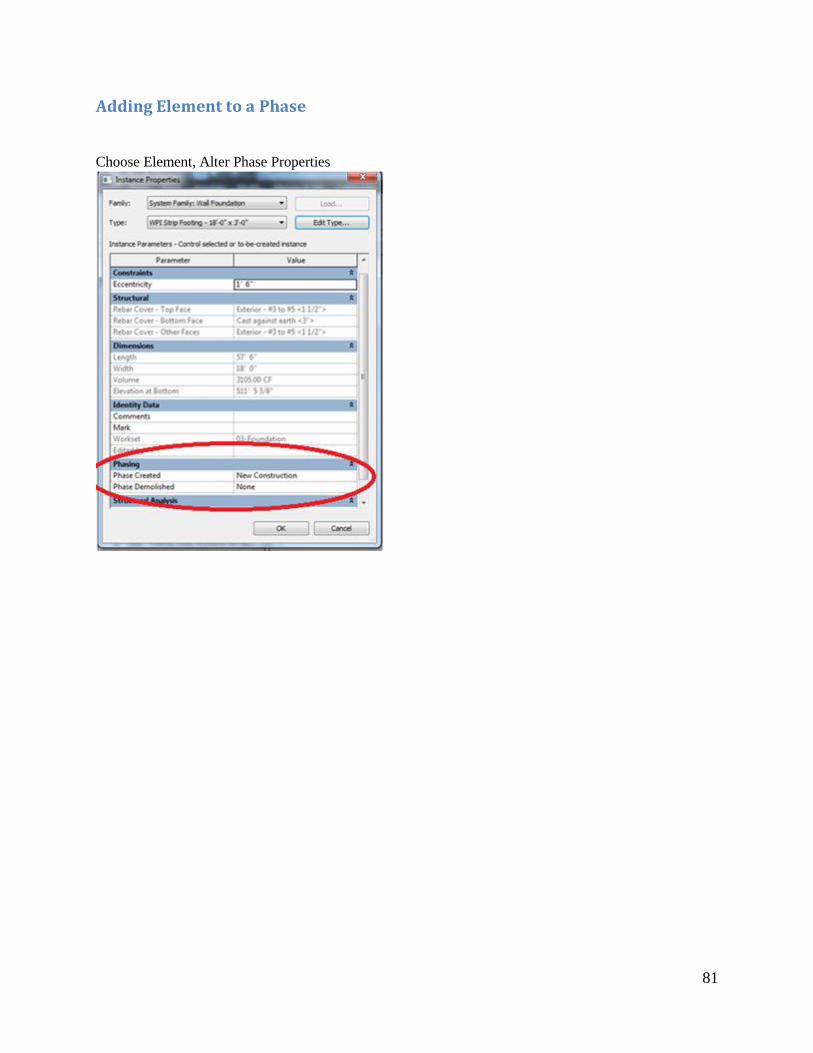
81
Adding Element to a Phase
Choose Element, Alter Phase Properties
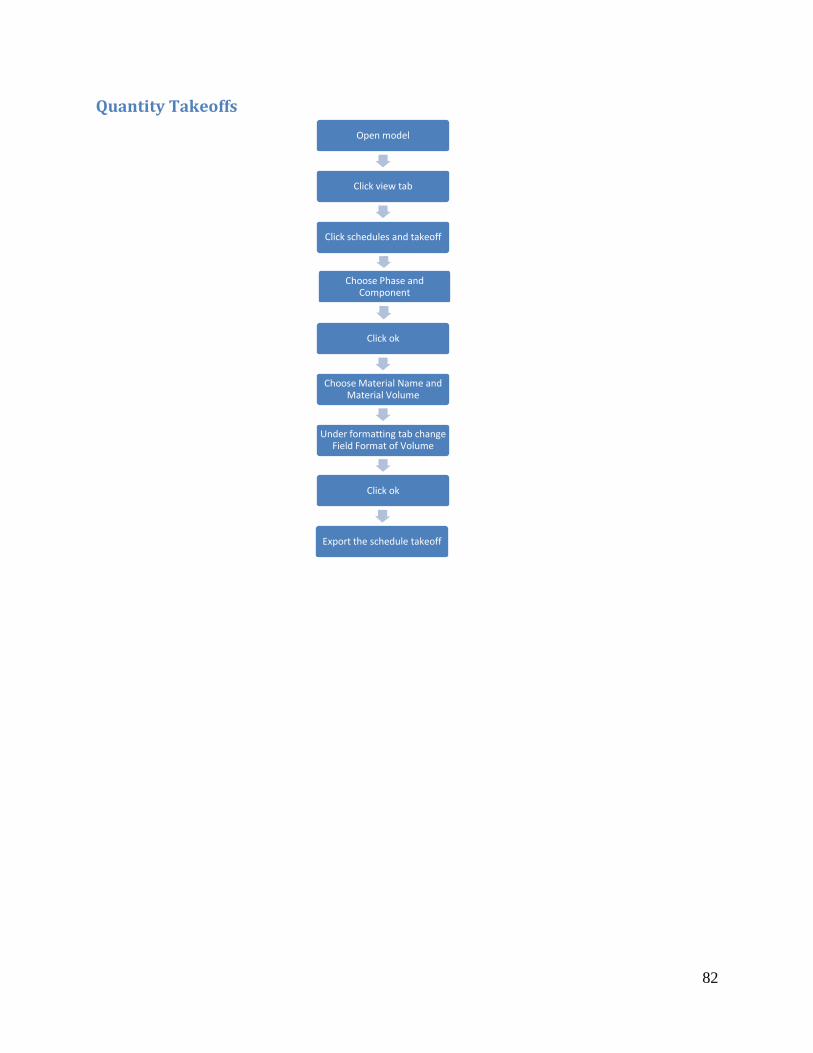
82
Quantity Takeoffs
Open model
Click view tab
Click schedules and takeoff
Choose Phase and Component
Click ok
Choose Material Name and Material Volume
Under formatting tab change Field Format of Volume
Click ok
Export the schedule takeoff
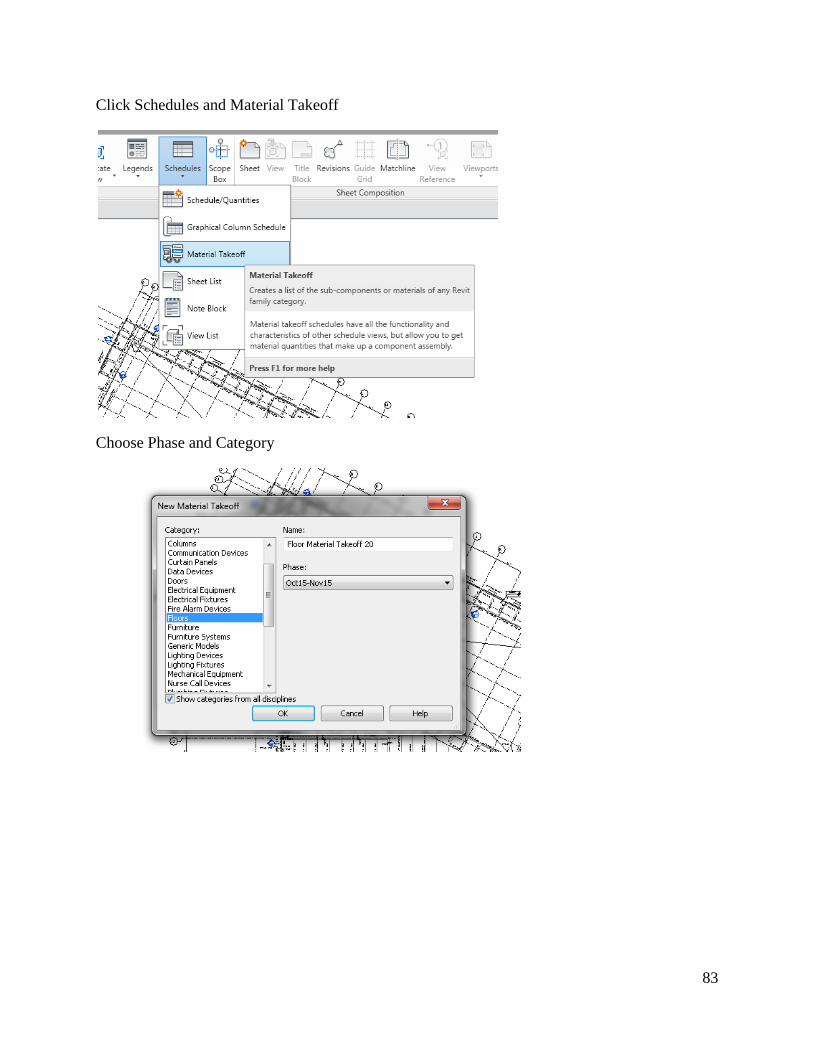
83
Click Schedules and Material Takeoff
Choose Phase and Category
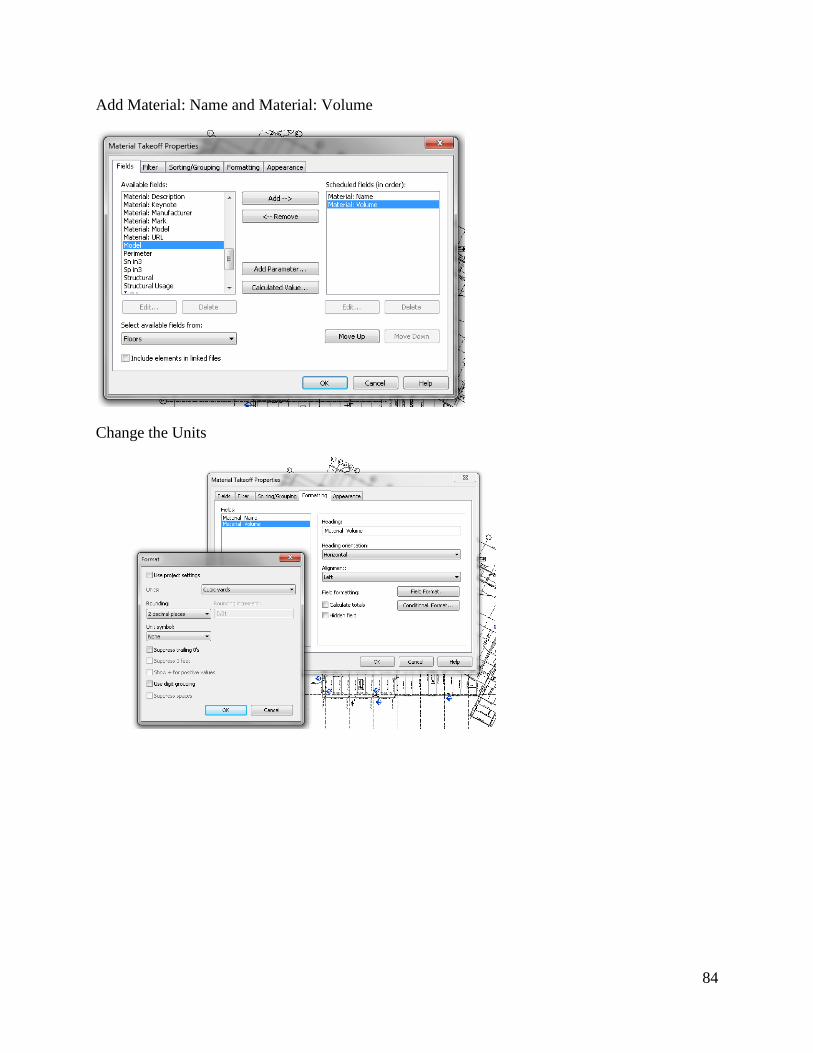
84
Add Material: Name and Material: Volume
Change the Units
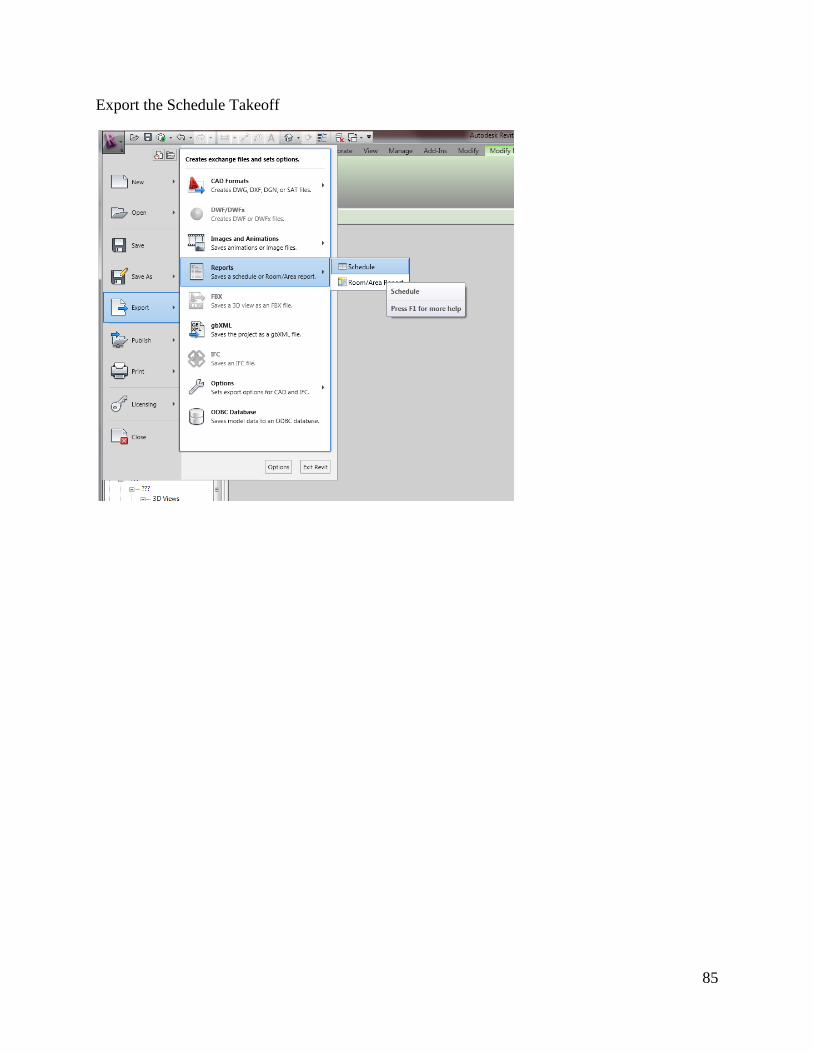
85
Export the Schedule Takeoff
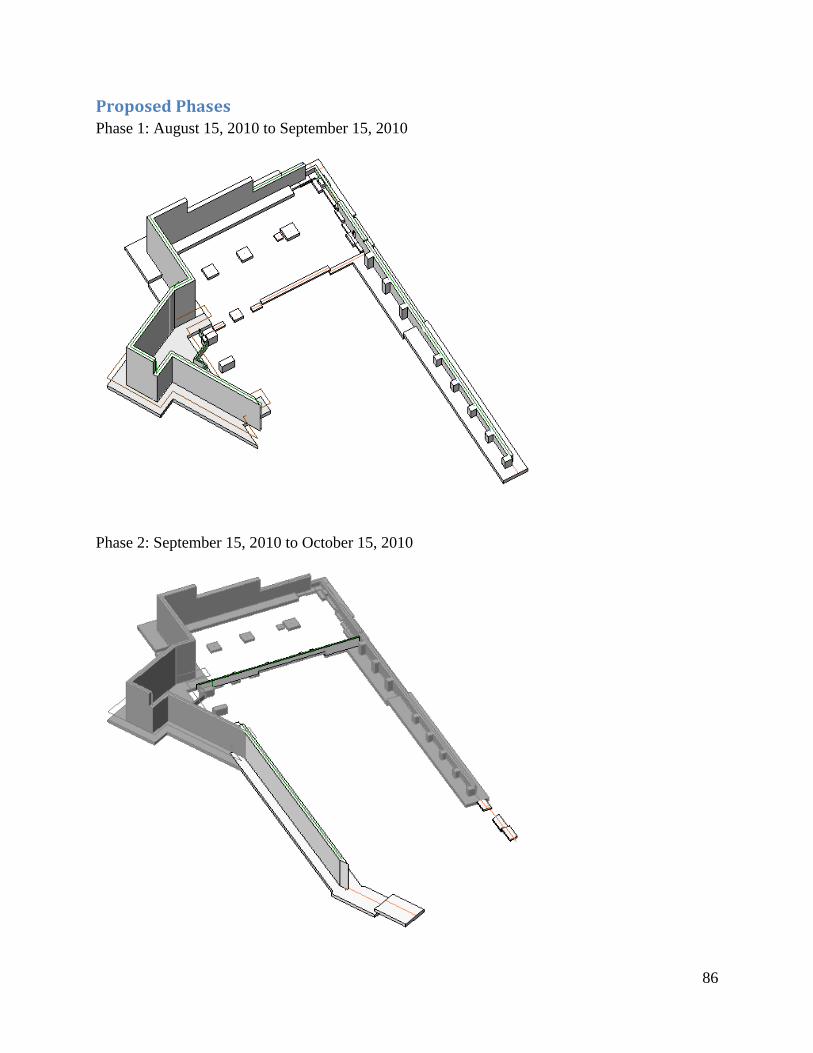
86
Proposed Phases Phase 1: August 15, 2010 to September 15, 2010
Phase 2: September 15, 2010 to October 15, 2010
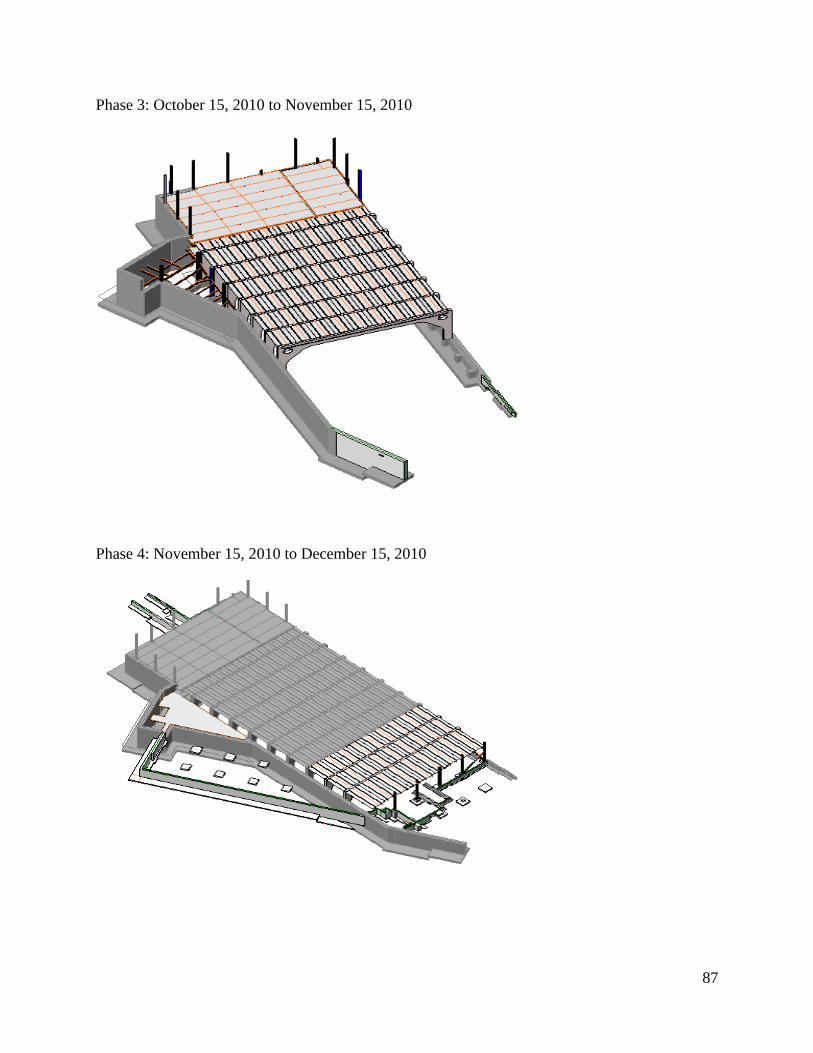
87
Phase 3: October 15, 2010 to November 15, 2010
Phase 4: November 15, 2010 to December 15, 2010
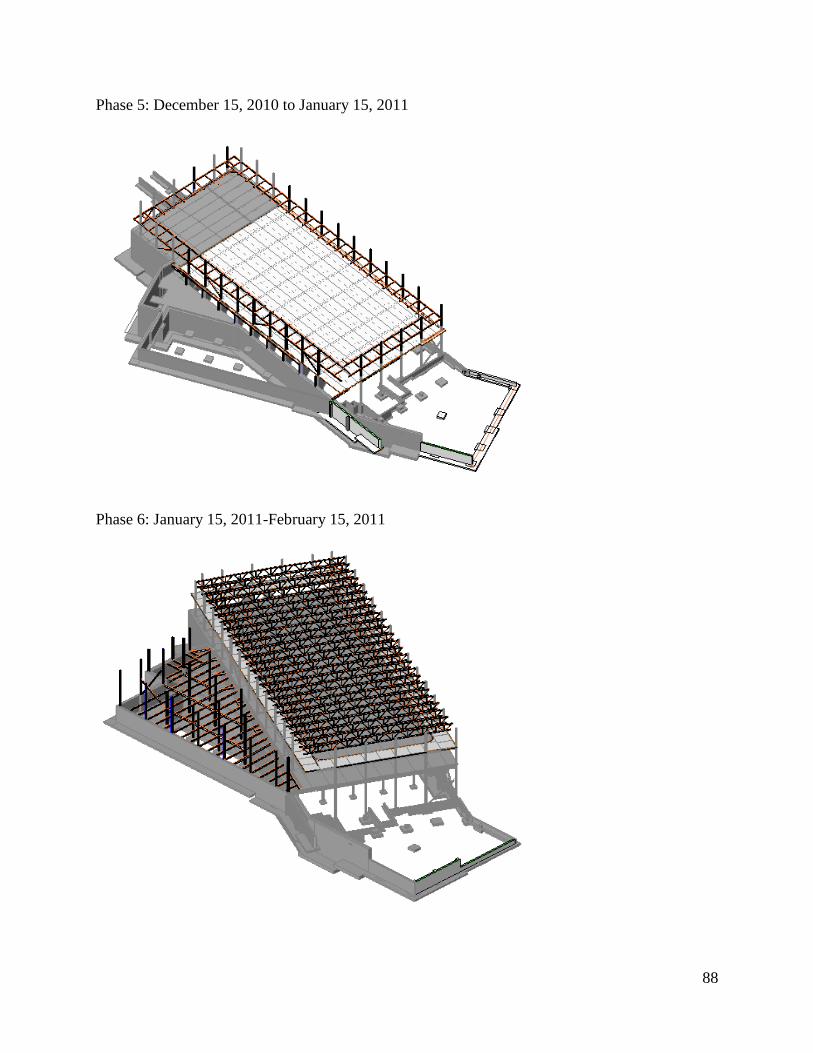
88
Phase 5: December 15, 2010 to January 15, 2011
Phase 6: January 15, 2011-February 15, 2011
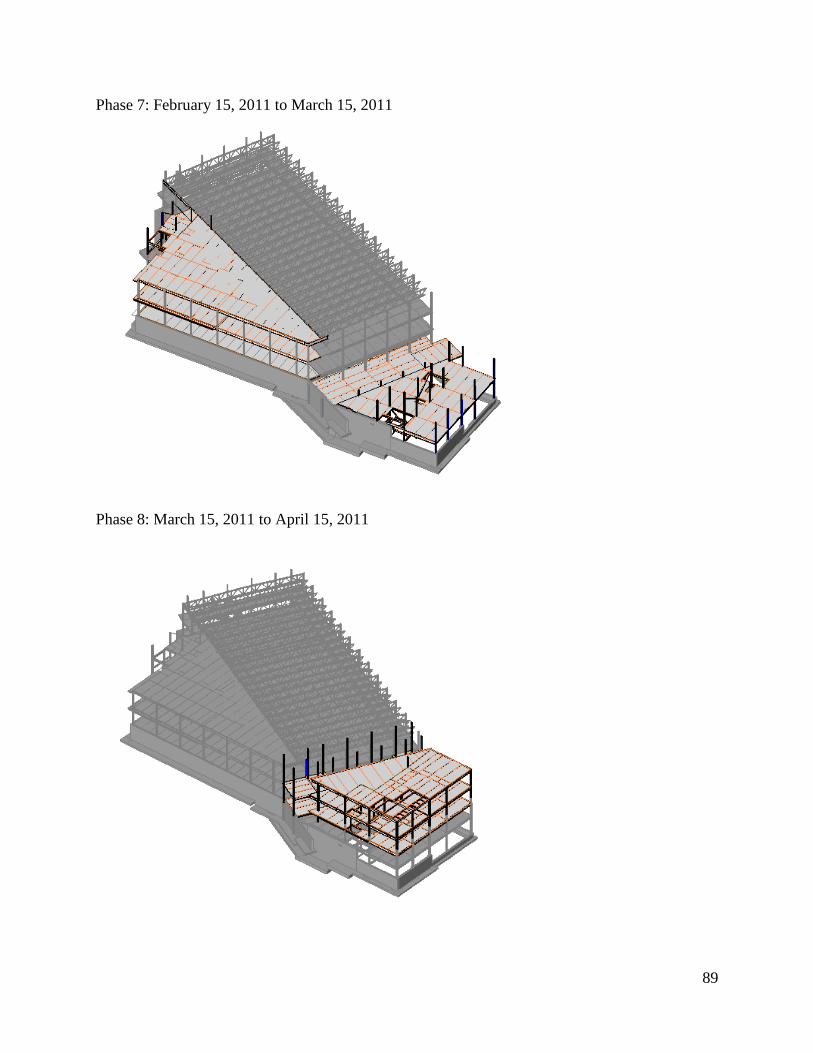
89
Phase 7: February 15, 2011 to March 15, 2011
Phase 8: March 15, 2011 to April 15, 2011
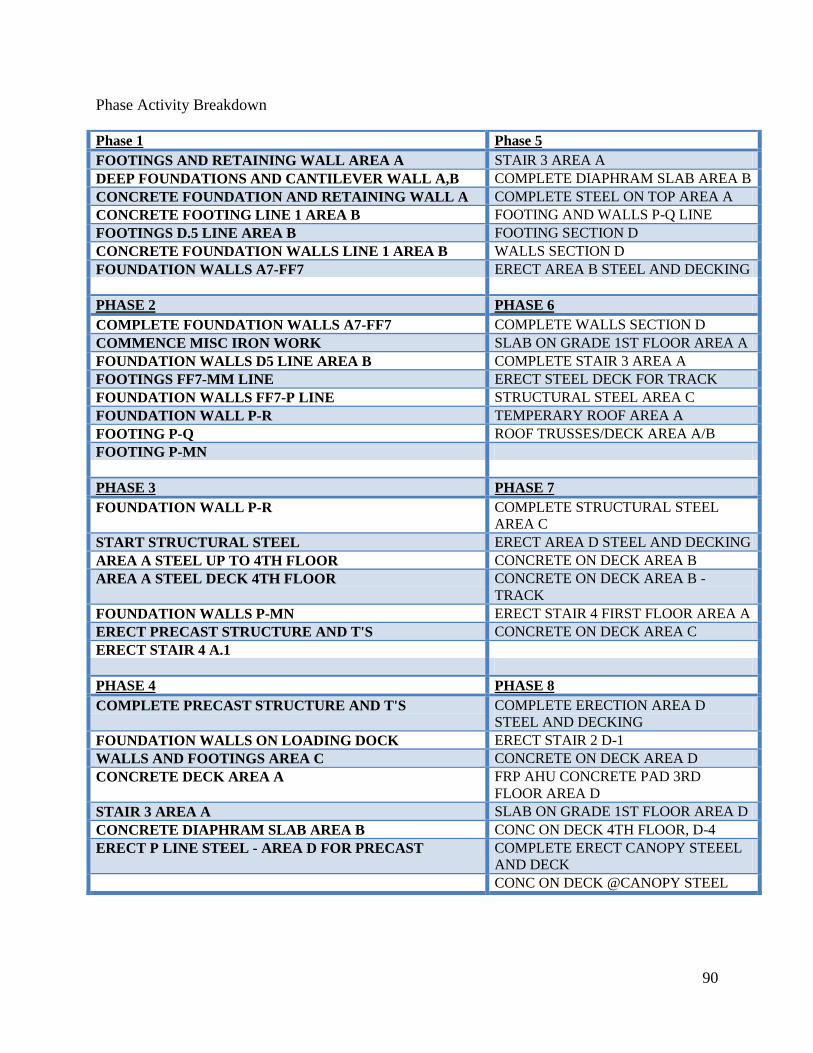
90
Phase Activity Breakdown
Phase 1 Phase 5
FOOTINGS AND RETAINING WALL AREA A STAIR 3 AREA A
DEEP FOUNDATIONS AND CANTILEVER WALL A,B COMPLETE DIAPHRAM SLAB AREA B
CONCRETE FOUNDATION AND RETAINING WALL A COMPLETE STEEL ON TOP AREA A
CONCRETE FOOTING LINE 1 AREA B FOOTING AND WALLS P-Q LINE
FOOTINGS D.5 LINE AREA B FOOTING SECTION D
CONCRETE FOUNDATION WALLS LINE 1 AREA B WALLS SECTION D
FOUNDATION WALLS A7-FF7 ERECT AREA B STEEL AND DECKING
PHASE 2 PHASE 6
COMPLETE FOUNDATION WALLS A7-FF7 COMPLETE WALLS SECTION D
COMMENCE MISC IRON WORK SLAB ON GRADE 1ST FLOOR AREA A
FOUNDATION WALLS D5 LINE AREA B COMPLETE STAIR 3 AREA A
FOOTINGS FF7-MM LINE ERECT STEEL DECK FOR TRACK
FOUNDATION WALLS FF7-P LINE STRUCTURAL STEEL AREA C
FOUNDATION WALL P-R TEMPERARY ROOF AREA A
FOOTING P-Q ROOF TRUSSES/DECK AREA A/B
FOOTING P-MN
PHASE 3 PHASE 7
FOUNDATION WALL P-R COMPLETE STRUCTURAL STEEL
AREA C
START STRUCTURAL STEEL ERECT AREA D STEEL AND DECKING
AREA A STEEL UP TO 4TH FLOOR CONCRETE ON DECK AREA B
AREA A STEEL DECK 4TH FLOOR CONCRETE ON DECK AREA B -
TRACK
FOUNDATION WALLS P-MN ERECT STAIR 4 FIRST FLOOR AREA A
ERECT PRECAST STRUCTURE AND T'S CONCRETE ON DECK AREA C
ERECT STAIR 4 A.1
PHASE 4 PHASE 8
COMPLETE PRECAST STRUCTURE AND T'S COMPLETE ERECTION AREA D
STEEL AND DECKING
FOUNDATION WALLS ON LOADING DOCK ERECT STAIR 2 D-1
WALLS AND FOOTINGS AREA C CONCRETE ON DECK AREA D
CONCRETE DECK AREA A FRP AHU CONCRETE PAD 3RD
FLOOR AREA D
STAIR 3 AREA A SLAB ON GRADE 1ST FLOOR AREA D
CONCRETE DIAPHRAM SLAB AREA B CONC ON DECK 4TH FLOOR, D-4
ERECT P LINE STEEL - AREA D FOR PRECAST COMPLETE ERECT CANOPY STEEEL
AND DECK
CONC ON DECK @CANOPY STEEL
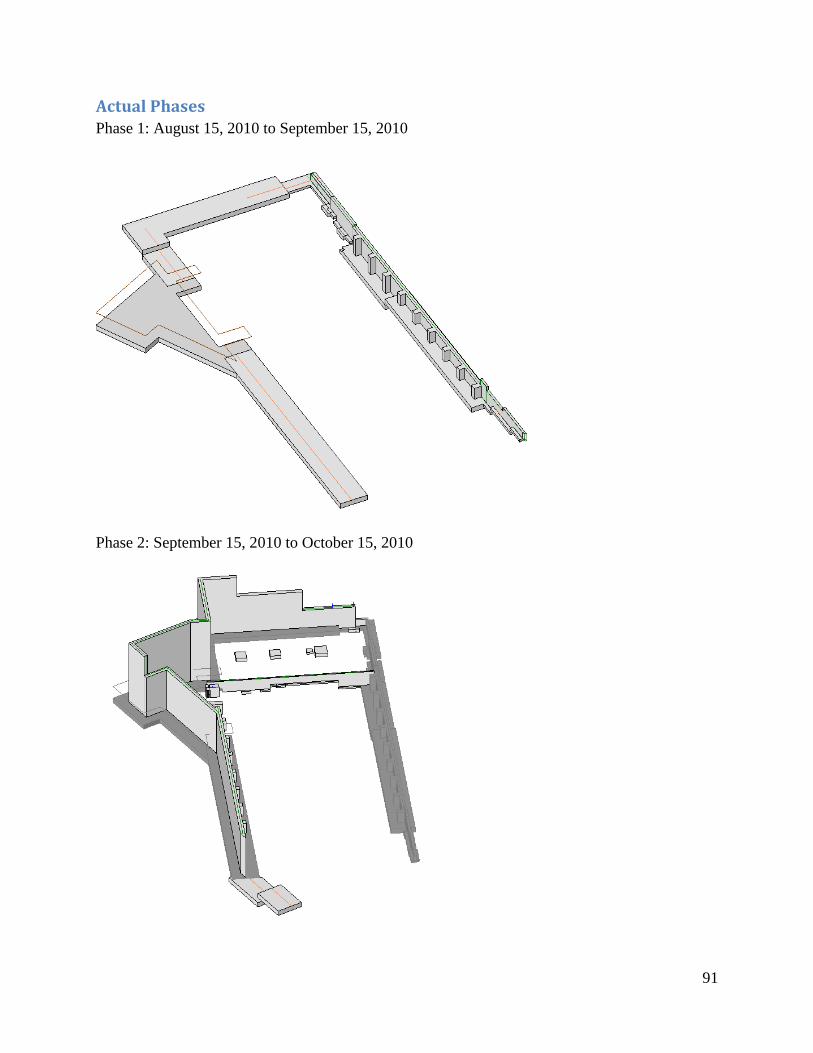
91
Actual Phases Phase 1: August 15, 2010 to September 15, 2010
Phase 2: September 15, 2010 to October 15, 2010
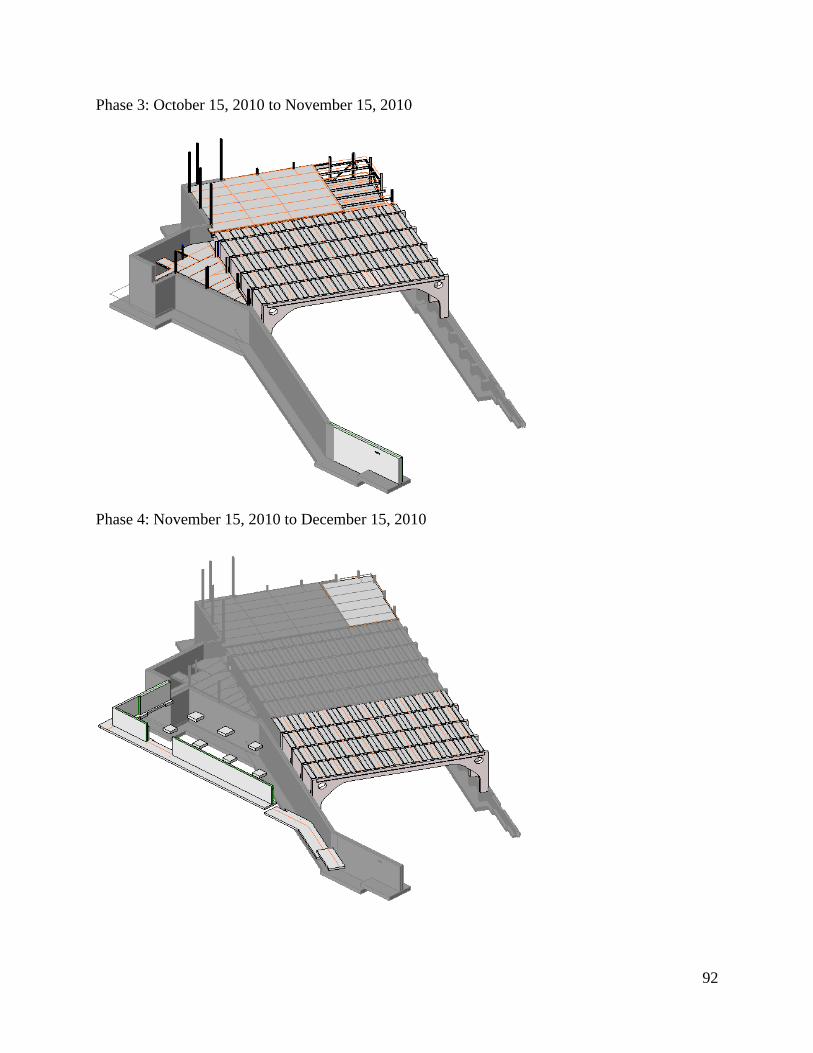
92
Phase 3: October 15, 2010 to November 15, 2010
Phase 4: November 15, 2010 to December 15, 2010
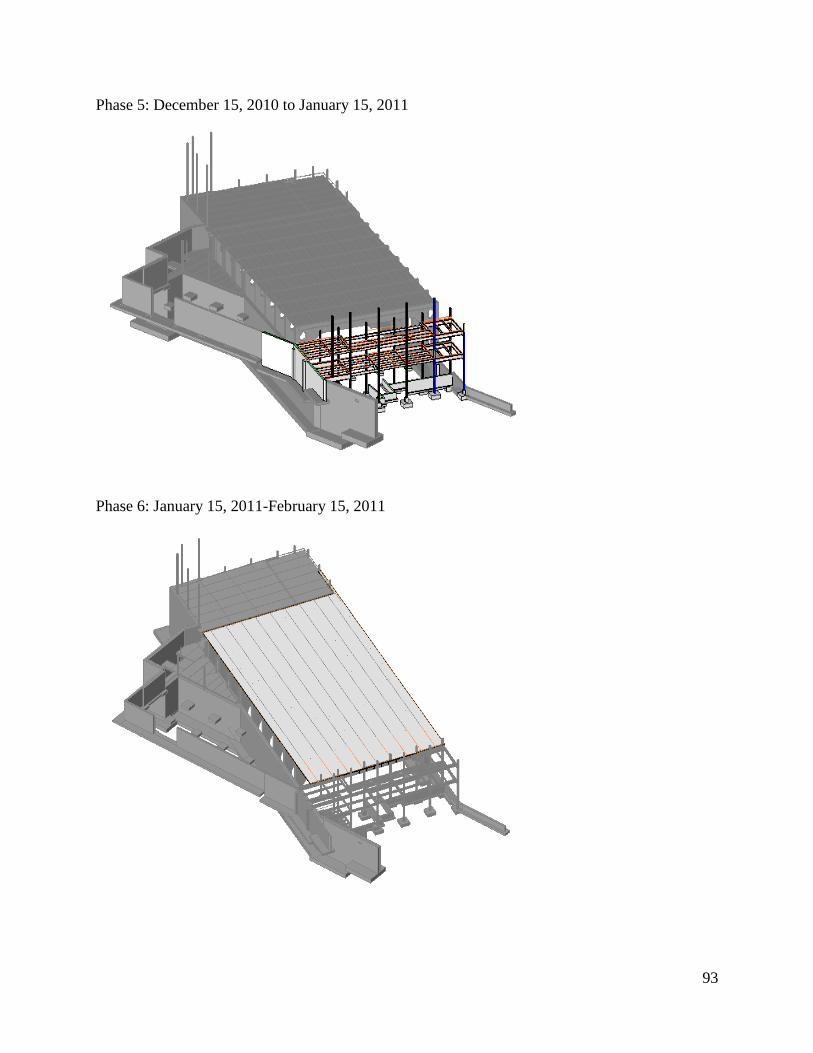
93
Phase 5: December 15, 2010 to January 15, 2011
Phase 6: January 15, 2011-February 15, 2011
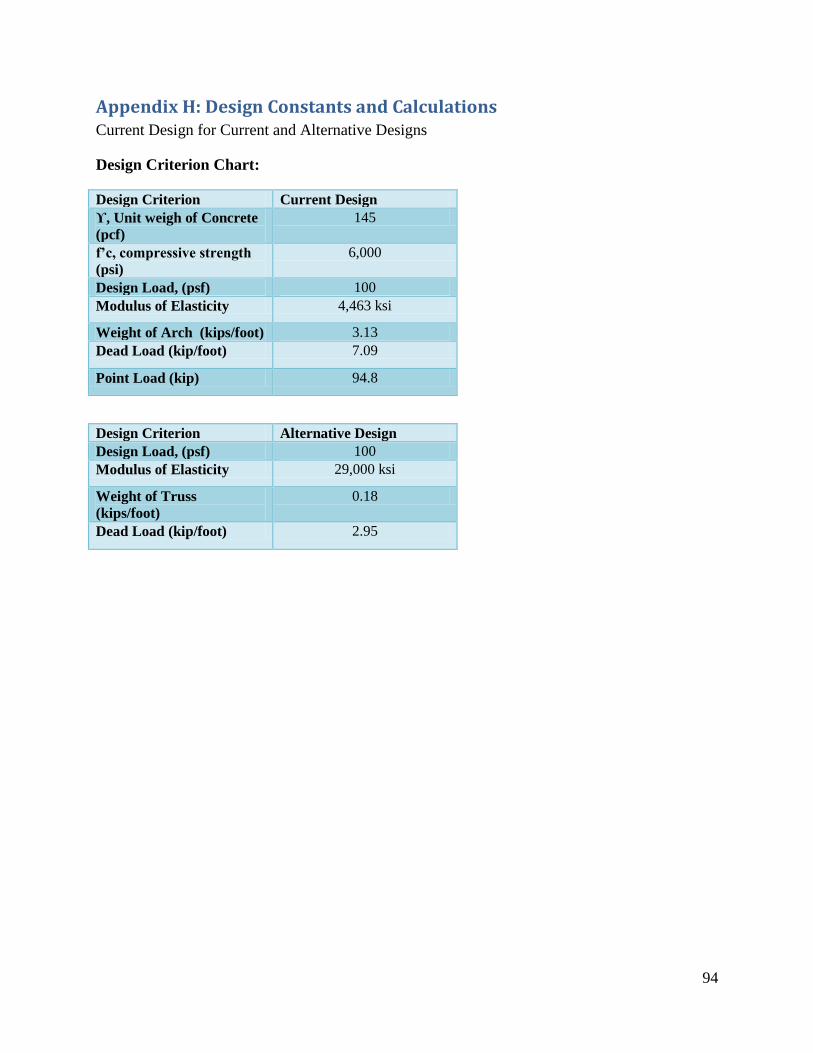
94
Appendix H: Design Constants and Calculations Current Design for Current and Alternative Designs
Design Criterion Chart:
Design Criterion Current Design
ϒ, Unit weigh of Concrete
(pcf)
145
f’c, compressive strength
(psi)
6,000
Design Load, (psf) 100
Modulus of Elasticity 4,463 ksi
Weight of Arch (kips/foot) 3.13
Dead Load (kip/foot) 7.09
Point Load (kip) 94.8
Design Criterion Alternative Design
Design Load, (psf) 100
Modulus of Elasticity 29,000 ksi
Weight of Truss
(kips/foot)
0.18
Dead Load (kip/foot) 2.95
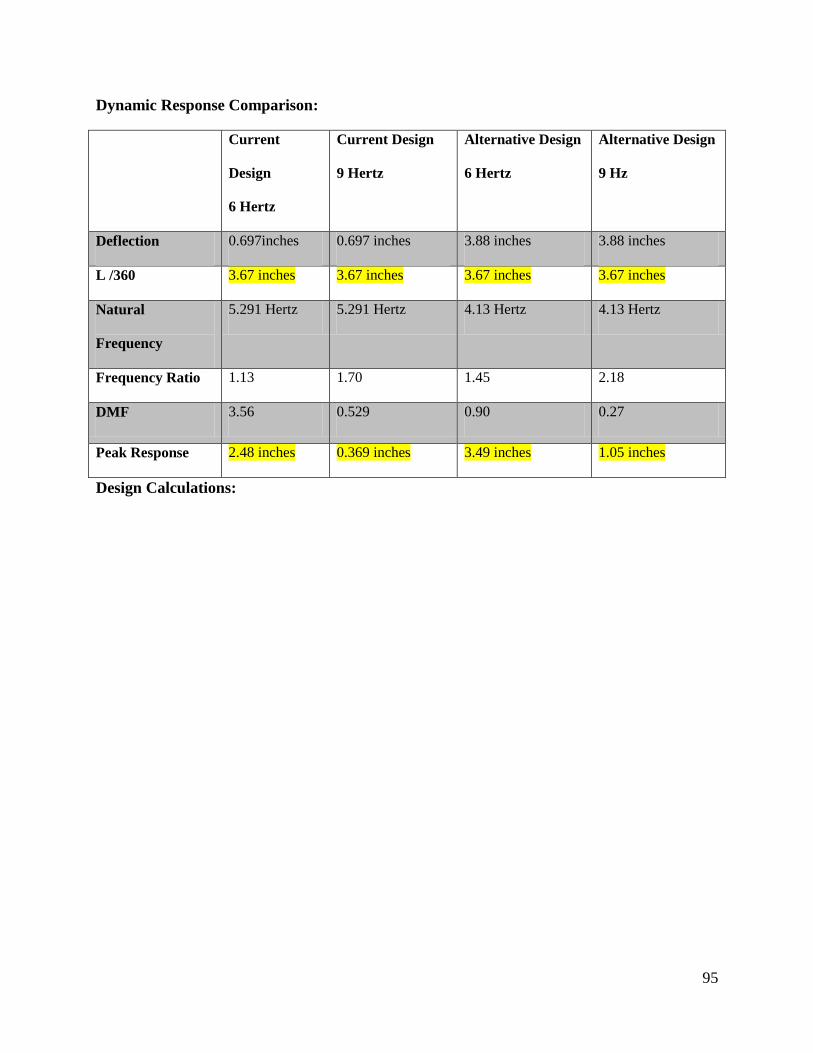
95
Dynamic Response Comparison:
Current
Design
6 Hertz
Current Design
9 Hertz
Alternative Design
6 Hertz
Alternative Design
9 Hz
Deflection 0.697inches 0.697 inches 3.88 inches 3.88 inches
L /360 3.67 inches 3.67 inches 3.67 inches 3.67 inches
Natural
Frequency
5.291 Hertz 5.291 Hertz 4.13 Hertz 4.13 Hertz
Frequency Ratio 1.13 1.70 1.45 2.18
DMF 3.56 0.529 0.90 0.27
Peak Response 2.48 inches 0.369 inches 3.49 inches 1.05 inches
Design Calculations:
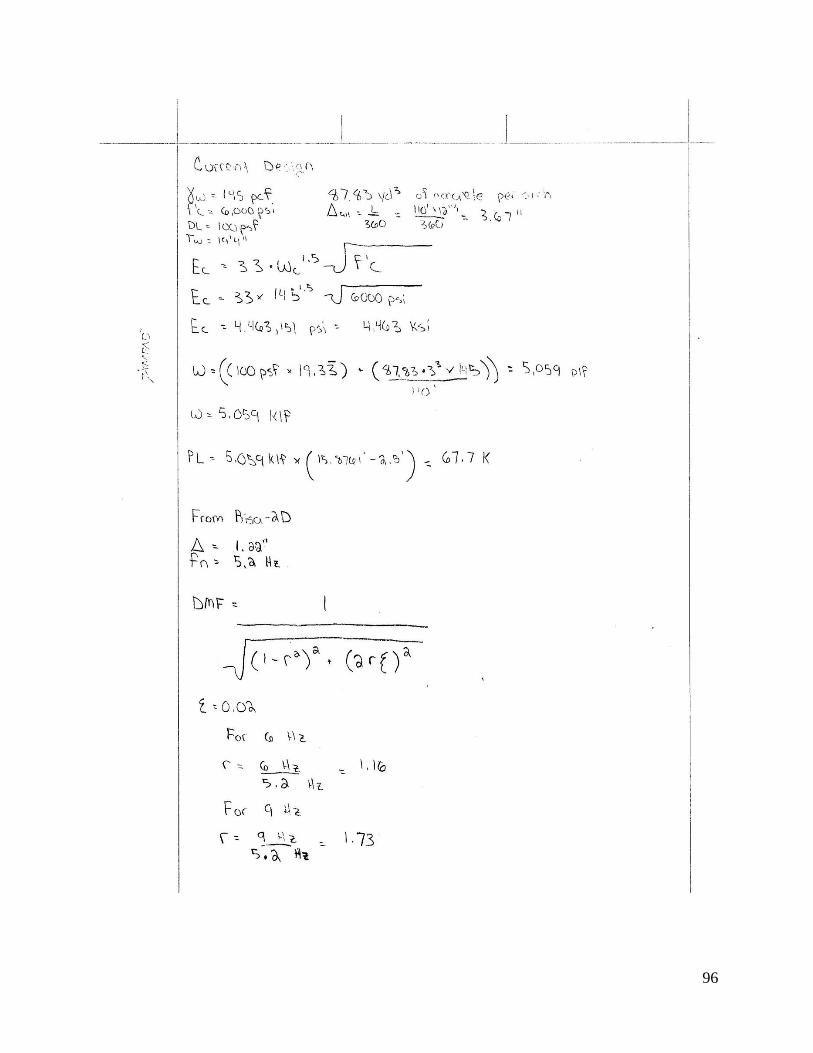
96
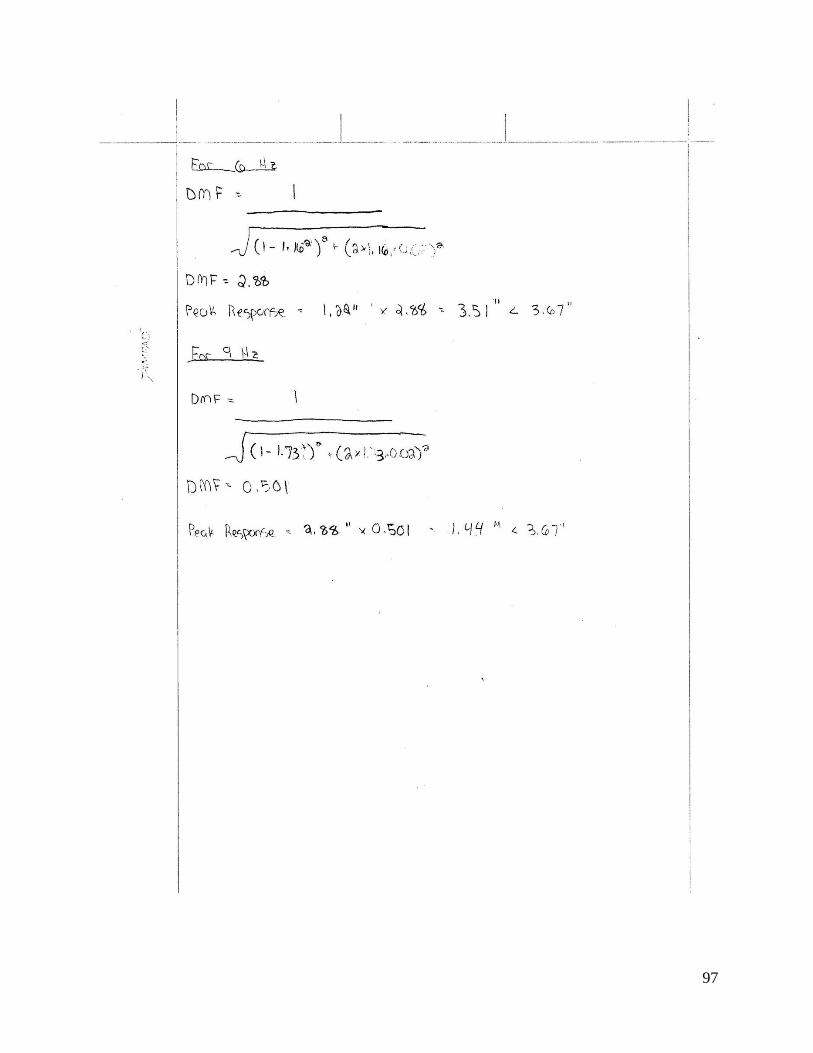
97
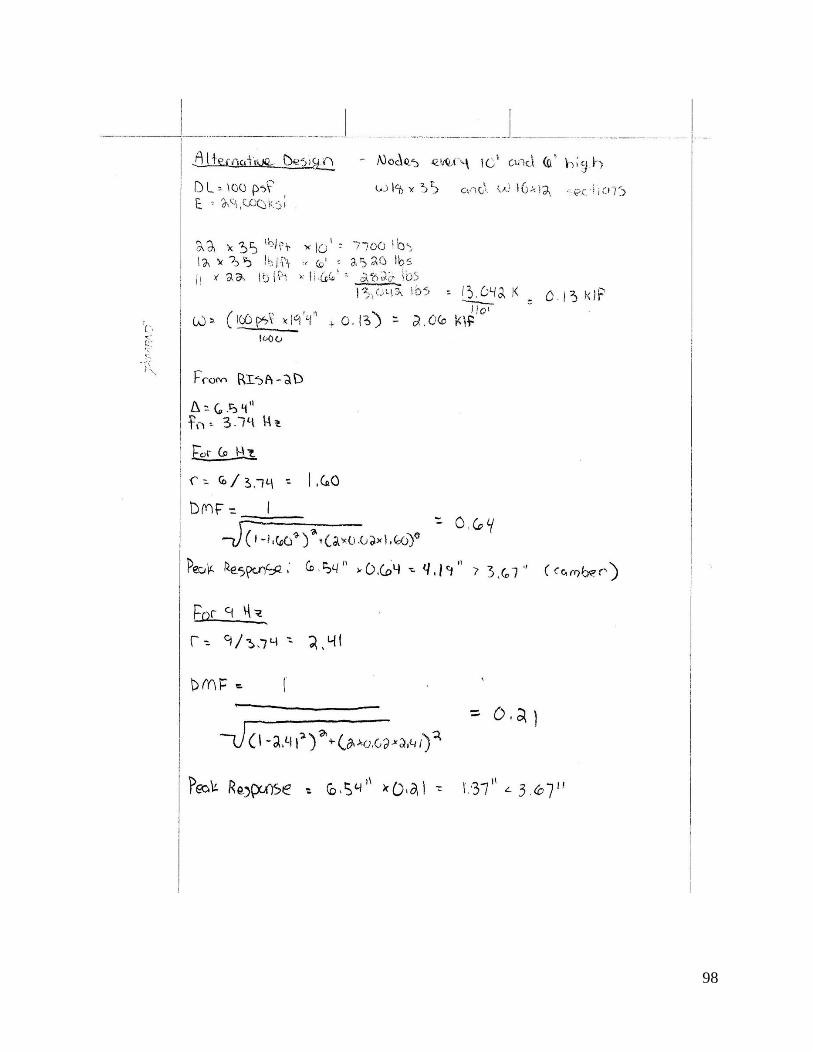
98
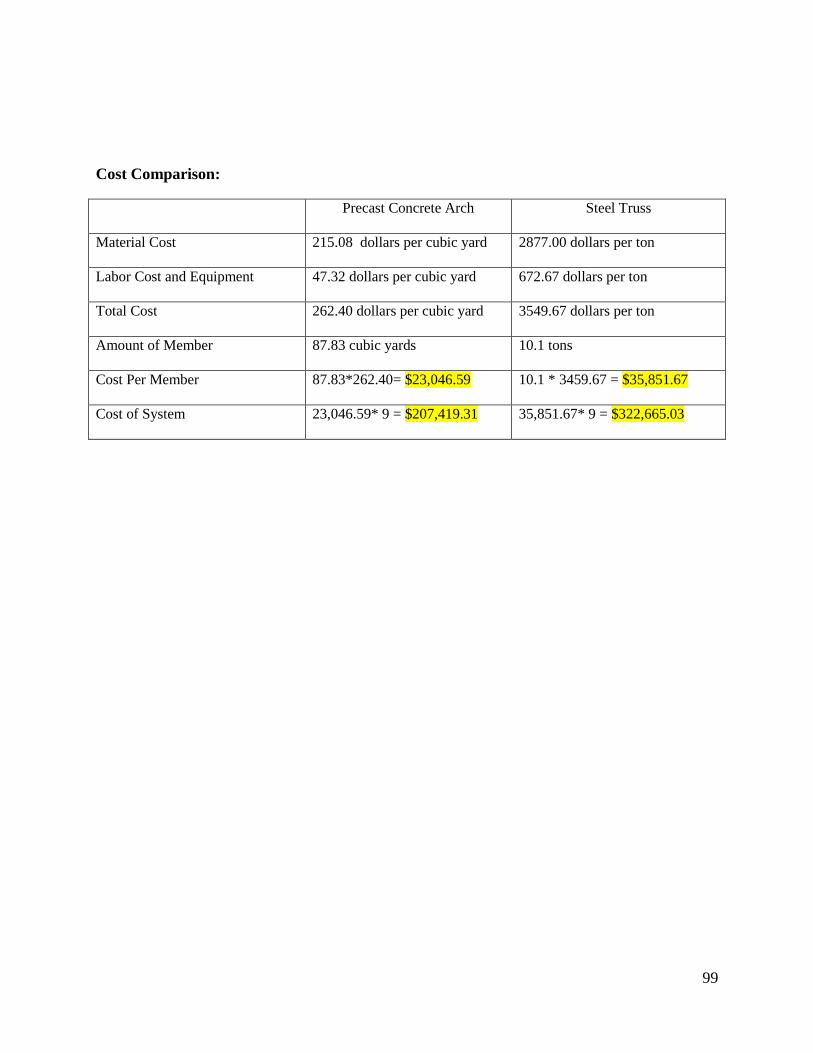
99
Cost Comparison:
Precast Concrete Arch Steel Truss
Material Cost 215.08 dollars per cubic yard 2877.00 dollars per ton
Labor Cost and Equipment 47.32 dollars per cubic yard 672.67 dollars per ton
Total Cost 262.40 dollars per cubic yard 3549.67 dollars per ton
Amount of Member 87.83 cubic yards 10.1 tons
Cost Per Member 87.83*262.40= $23,046.59 10.1 * 3459.67 = $35,851.67
Cost of System 23,046.59* 9 = $207,419.31 35,851.67* 9 = $322,665.03