wp0408 ziegler vonarx the effect of csr
TRANSCRIPT

CCRS Working Paper Series Working Paper No. 04//08
The Effect of CSR on Stock Performance: New Evidence for the USA and Europe
Urs von Arx, Andreas Ziegler
May, 2008

The Effect of CSR on Stock Performance:
New Evidence for the USA and Europe
Urs von Arx and Andreas Ziegler*
May 2008
Urs von Arx:
Swiss Federal Institute of Technology (ETH) Zurich (Center of Economic Research)
Zürichbergstrasse 18, 8032 Zurich, Switzerland
E-Mail: [email protected]
Phone: +41/44/632-5505, Fax: +41/44/632-1362
Andreas Ziegler:
Corresponding author
University of Zurich (Center for Corporate Responsibility and Sustainability)
Künstlergasse 15a, 8001 Zurich, Switzerland
E-Mail: [email protected]
Phone: +41/44/634-4020, Fax: +41/44/634-4900
(further affiliation: ETH Zurich, Kreuzplatz 5, 8032 Zurich, Switzerland)
* We would like to thank Eckhard Plinke and the bank Sarasin & Cie in Basle for providing their assessment data, Kenneth R. French, Ulrich Oberndorfer, and Michael Schröder for their helpful comments, as well as Eveline Schwegler for her untiring commitment during data analysis.

1
The Effect of CSR on Stock Performance:
New Evidence for the USA and Europe
Abstract
This paper provides new empirical evidence for the effect of corporate social responsibility
(CSR) on corporate financial performance. In contrast to former studies, we examine two
different regions, namely the USA and Europe. Our econometric analysis shows that envi-
ronmental and social activities of a firm compared with other firms within the industry are
valued by financial markets in both regions. However, the respective positive effects on av-
erage monthly stock returns between 2003 and 2006 appear to be more robust in the USA
and, in addition, to be nonlinear. Our analysis furthermore points to biased parameter esti-
mations if incorrectly specified econometric models are applied: The seemingly significantly
negative effect of environmental and social performance of the industry to which a firm be-
longs vanishes if the explanation of stock performance is based on the Fama-French three-
factor or the Carhart four-factor models instead of the simple Capital Asset Pricing Model.
Keywords:
Corporate social responsibility, Environmental performance, Financial performance, Asset
pricing models.
JEL:
Q56, M14, G12, Q01.

2
1. Introduction
Knowledge about the effect of corporate environmental performance on corporate financial
performance contributes to the debate about whether managers systematically miss profit
opportunities if they decide against the protection of the natural environment (e.g., King and
Lenox, 2002). This debate has been going on for a while in the corresponding literature
(e.g., Hart and Ahuja, 1996, King and Lenox, 2001, Guenster et al., 2006). Furthermore, an
understanding of this relationship is also interesting for environmental policy: If a positive
effect of corporate environmental performance really exists, it can be argued that traditional
mandatory command and control regulations as well as market based instruments – such as
green taxes – should be relaxed (e.g., Khanna, 2001). Instead, these regulations could be
supplemented or even substituted by information-based instruments, namely by improving
the flow of information with respect to this effect (e.g., Telle, 2006). Just like other non-
mandatory approaches in environmental policy – such as voluntary green management
measures – these regulations can be thought to be more cost-efficient because they leave
firms the flexibility to choose the cheapest pollution abatement strategy and reduce govern-
ments’ enforcement costs (e.g., Alberini and Segerson, 2002).
These conclusions do not only apply for the effect of corporate environmental, but also cor-
porate social activities on corporate financial performance. In this respect, the terms “corpo-
rate social performance” or, alternatively, “corporate social responsibility” (CSR) are often
used synonymously and comprise both social as well as environmental measures (e.g., Wad-
dock and Graves, 1997, Orlitzky, 2001, Orlitzky et al., 2003). According to the popular
definition of McWilliams and Siegel (2001), CSR are “actions that appear to further some
social good, beyond the interest of the firm and what is required by law”. Another definition
of CSR emphasizes – besides the avoidance of distributional conflicts – “actions which re-
duce the extent of externalized costs” (Heal, 2005).
3
Due to the inconclusiveness of theory, the effect of CSR on corporate financial performance
in general and on stock performance in particular is ultimately an empirical question.
Against this background, we provide new empirical evidence for this issue. As an indicator
for CSR, we use environmental and social activities of a firm compared with other firms in
the same industry. In line with only few former studies (e.g., King and Lenox, 2001, Ziegler
et al., 2007a), we additionally consider sector specific influences by incorporating environ-
mental and social performance of the industry to which a firm belongs. As an indicator for
corporate financial performance, we use stock performance which is measured by the aver-
age monthly stock returns between 2003 and 2006. Due to this specific dependent variable,
our final cross-sectional regressions have to be based on the estimation of asset pricing mod-
els since financial economics suggests the use of corresponding factors to explain average
stock returns.
Our main contribution to the literature considering the effect of CSR on corporate financial
performance is two-fold: First of all, we examine this relationship in two different regions,
namely the USA and Europe. In this respect, we are particularly able to incorporate the same
CSR indicators for both regions. Therefore, we can analyze whether potential CSR impacts
are interregional or whether regional differences arise, for example, due to different market
developments. Secondly, we apply different asset pricing models for the explanation of
stock performance, i.e., the three-factor model according to Fama and French (1993) and
particularly the four-factor model according to Carhart (1997) besides the simple Capital
Asset Pricing Model (CAPM). While the corresponding factors for these models are publicly
available for the US and some other specific stock markets, they have to be calculated for
the entire European stock market. This is obviously the reason why such multifactor models
have not often been applied for this region yet. Based on these asset pricing models, we are
4
additionally able to compare the explanatory power of the corresponding estimated corpo-
rate beta parameters alone for average stock returns over time in the USA and in Europe.
The remainder of the paper is structured as follows: Section 2 briefly provides some theo-
retical background. In the third section we review the empirical literature regarding the rela-
tionship between CSR and corporate financial performance. Section 4 discusses our differ-
ent two-stage econometric approaches. In the fifth section the used data and variables are
described. Section 6 reports the empirical results and the final section discusses our results
and concludes.
2. Theoretical background
Overall, current theory concerning the effects of CSR on corporate financial performance is
ambiguous (e.g., Waddock and Graves, 1997, Guenster et al., 2006). In other words, positive
and negative as well as neutral impacts are discussed. Arguments for a negative influence
can be based on neoclassical microeconomics. According to this, it is mainly emphasized
that the operating costs of corporate environmental (e.g., Telle, 2006) or social activities
outweigh their financial benefits (due to cost reductions through, for example, energy sav-
ings, waste reduction, or recycling) such that the underlying principle of shareholder wealth
maximization is hurt. It is argued that CSR demands significant portions of corporate finan-
cial resources, although the benefits of CSR are often in a distant future if any benefits oc-
cur. As a consequence, CSR can lead to reduced profits, decreased firm values, or competi-
tive disadvantage besides lower shareholder returns such that already Friedman (1970) ar-
gues that there is no role for CSR.
This neoclassical argumentation is supported by corporate governance theory (e.g., Shleifer
and Vishny, 1997, Tirole, 2006). According to a rather narrow definition, corporate govern-
ance comprises all measures – such as optimal incentive or control structures –

5
which assure that investors get an adequate return for their investments. Only if corporate
governance structures are properly installed, management will find and
choose the profit-maximizing path. According to this, it is argued that, for example,
the consideration of goals of other groups – such as the general public – as motivation for
corporate environmental and social activities unnecessarily enlarges the latitude of manage-
ment which is misused for maximizing the utility of managers such that the risk of counter-
productive measures with respect to shareholder wealth and competitiveness increases. In
other words, investors have to reckon with lower returns on their investments if the respec-
tive corporations deviate from the optimal path due to excessive environmental or social ac-
tivities (e.g., Wall, 1995, Heinkel et al., 2001, Beltratti, 2005). In contrast, investors in
purely profit-maximizing firms with a lower intensity of CSR can expect higher investment
returns. However, it is likely that both types of corporations, i.e., firms
with a higher and firms with a lower intensity, can coexist if costs for
CSR are not excessive and if, for example, many investors consider corpo-
rate environmental or social activities in their investments (e.g., Arx,
2007).
Unlike Friedman (1970) as discussed above, however, positive effects of CSR on corporate
financial performance can also be based on neoclassical microeconomics by emphasizing
the role of CSR in reducing the extent of externalized costs. Friedman (1970) assumes that
the government defines property rights such that no external effects exist. In this view, cor-
porate environmental and social activities that benefit shareholders are purely profit-
maximization while respective measures not benefiting investors are theft from sharehold-
ers. In contrast, Heal (2005) argues that the government does not fully resolve all problems
with external effects and that the competitive markets are not efficient. Therefore, CSR can
substitute missing markets if external effects arise from them and can reduce conflicts be-
tween firms and stakeholder groups such as the government, the general public, non-

6
governmental organizations, competitors, employees, or clients. As a consequence, it can be
argued that the reduction of these conflicts increases corporate profits or corporate financial
performance at least in the long term which also makes firms with a high intensity of CSR
more attractive to investors.
This stakeholder argument is strengthened in the strategic management literature (e.g., Wad-
dock and Graves, 1997, Barnett and Salomon, 2006, Curran and Moran, 2007). Stakeholder
theory suggests that management has to satisfy several groups who have some interest or
“stake” in a firm and can influence its outcome (e.g., McWilliams et al., 2006). Regarding
corporate financial performance, it can therefore be worthwhile to engage in CSR because
otherwise these stakeholders could withdraw the support for the firm. For example, if a firm
enjoys a good reputation due to an excellent association with its employees as an element of
CSR, it can increase its employee retention rate and additionally attract highly skilled and
thus more productive employees. Furthermore, the compliance with environmental regula-
tions can lead to good relationships with government which could be beneficial for corporate
legislative and political lobbying. Finally, a minimum of corporate environmental activities
and the avoidance of child labor in the full value-added chain of the products can reduce risk
due to, for example, aggressive campaigns of non-governmental organizations.
These arguments from stakeholder theory can be embedded in the resource-based view of
the firm (e.g., Barney, 1991) which suggests that competitive advantage evolves from inter-
nal capabilities which are valuable, rare, and difficult to imitate or substitute (e.g., Russo and
Fouts, 1997, Klassen and Whybark, 1999, King and Lenox, 2001, McWilliams et al., 2006).
In this respect, stakeholder management can be considered an important organizational ca-
pability or resource. A good reputation due to corporate environmental activities such as the
certification of environmental management according to ISO 14001 as an element of CSR is
a further example for an intangible resource. This could particularly lead to higher sales

7
among customers who are sensitive to such issues and therefore to increased corporate prof-
its or corporate financial performance. In this respect, new technologies which are installed
due to proactive corporate environmental activities are an example for a tangible or physical
resource if these technologies can be capitalized and not easily imitated by competitors.
Based on this discussion of positive and negative effects of CSR, it can also be argued that
there are many converse corporate environmental and social factors such that it is likely that
no significant effect exists (e.g., Waddock and Graves, 1997, Elsayed and Paton, 2005). For
example, McWilliams and Siegel (2001) show within a model with two firms which produce
identical products except that one firm adds an additional social attribute or feature to the
product which is valued by the market that in equilibrium the overall effect of CSR is neu-
tral (see also McWilliams et al., 2006). In this respect, MacKey et al. (2007) outline in a
theoretical decision making model comprising the supply of and demand for CSR when such
environmental or social activities improve, reduce, or have no impact on the market value.
As a consequence, the effect of CSR on corporate financial performance in general and on
stock performance in particular is ultimately an empirical question. In this respect, we argue
that the direction and strength of the impacts can depend on specific regions, for example,
due to different governmental policy. Therefore, the comparison of these effects in the USA
and Europe by applying the same CSR indicators for both regions seems to be fruitful. Re-
garding the measurement of corporate financial performance, the use of forward looking av-
erage stock returns is theoretically attractive. According to the efficient market hypothesis,
stock prices reflect all publicly available information about the future financial performance
of firms. In compliance with the well-known dividend discount model a stock price there-
fore equals the discounted expected future stream of dividends paid to the shareholders. In
contrast to the use of accounting data based indicators such as return on assets or return on
8
sales, our approach has the advantage that the focus is not on the past realized but on the fu-
ture expected financial performance (e.g., Miller and Modigliani, 1961).
3. Empirical literature review
The relationship between CSR and corporate financial performance can be empirically ana-
lyzed with three methodological approaches, namely portfolio analyses, event studies, and
longer-term (micro-) econometric approaches. Portfolio analyses in this field typically com-
pare the risk-adjusted stock returns of portfolios that consist of corporations with a higher
environmental or social performance and portfolios that consist of stock corporations with a
lower environmental or social performance. Recent studies are mostly based on the estima-
tion of alphas within multifactor models such as the Carhart four-factor model (e.g., Derwall
et al., 2005, Bauer et al., 2005, 2007, Kempf and Osthoff, 2007). Portfolio analyses consider
either existing funds or virtual funds constructed by the researcher. While portfolio analyses
are able to examine the benefits of embedding CSR into investment decisions, they have
some drawbacks: For example, the stock performance of existing funds depends strongly on
the ability of the fund management. Furthermore, one main weakness of portfolio analyses
for both existing and virtual funds is that only the average financial performance of all cor-
porations whose stock are included in the portfolios is considered (e.g., Wagner, 2001).
Consequently, the identification of isolated causal effects of CSR on corporate financial per-
formance needs more sophisticated econometric approaches.
In this respect, event studies examine the mean stock returns for corporations experiencing a
specific event (i.e., new information) and therefore aim to measure the effect on the value of
a corporation (e.g., MacKinlay, 1997, Kothari and Warner, 2006). Event studies were devel-
oped and particularly applied in financial economics and accounting, for example, to exam-
ine the effect of mergers and acquisitions. However, a growing number of CSR related event
9
studies is available in the meantime (e.g., Hamilton, 1995, Klassen and McLaughlin, 1996,
Konar and Cohen, 1997, Posnikoff, 1997, Khanna et al., 1998, Dasgupta et al., 2001, Gupta
and Goldar, 2005, Curran and Moran, 2007). The corresponding events often refer to posi-
tive or negative news about specific components of CSR such as information about toxic
emissions or the disinvestment of corporations from South Africa during the apartheid re-
gime. However, the events can also refer to news on broader CSR indicators such as infor-
mation about the inclusion in a stock index which rely on high corporate environmental and
social performance. If the main basic conditions for the application of event studies are
given, for example, that capital markets are sufficiently efficient to react to events, one sali-
ent aspect of these approaches is that the causality of the relationship between CSR and
stock performance is rather clear (e.g., Heal, 2005). However, one main weakness of event
studies – besides the common analysis of only short-run effects of CSR related events – is
that the application of such studies in general depends on unexpected events.
Indeed, CSR rather refers to long-term corporate activities and thus can seldom exclusively
be characterized by unexpected positive or negative events. As a consequence, longer-term
econometric approaches have received increasing attention for a while. These studies apply
– in the same way as portfolio analyses and event studies – very different indicators for
CSR. They additionally use different indicators for corporate financial performance. Due to
the theoretical attractiveness as discussed above, some of these studies (e.g., Filbeck and
Gorman, 2004, Ziegler et al., 2007a) also use stock returns as they are exclusively consid-
ered in portfolio analyses and event studies. In contrast, most other studies (e.g., Hart and
Ahuja, 1996, Waddock and Graves, 1997, Russo and Fouts, 1997, McWilliams and Siegel,
2000, Dowell et al., 2000, Konar and Cohen, 2001, King and Lenox, 2001, 2002, Salama,
2005, Elsayed and Paton, 2005, Telle, 2006, Guenster et al., 2006) also apply accounting

10
data based indicators for corporate financial performance such as Tobin’s Q, return on as-
sets, return on sales, or return on equity.
Concerning our broad measurement of CSR, we consider both corporate environmental and
social activities. In contrast, many former studies neglect the social dimension of CSR by
using one-dimensional and rather narrow indicators such as emissions of pollutants (e.g.,
Hart and Ahuja, 1996, Konar and Cohen, 2001, King and Lenox 2001, 2002, Telle, 2006).
However, such emission data, for example, based on the Toxics Release Inventory (TRI),
seem to be a weak indicator for CSR in general because they only give information about a
single constituent of corporate environmental performance. Other econometric analyses use
more general CSR indicators which, however, only refer to the environmental dimension
(e.g., Russo and Fouts, 1997, Dowell et al., 2000, Filbeck and Gorman, 2004, Salama, 2005,
Elsayed and Paton, 2005, Guenster et al., 2006). Studies which also incorporate both CSR
dimensions such as Waddock and Graves (1997), McWilliams and Siegel (2000), and
Ziegler et al. (2007a) are exceptions in this respect. Furthermore, our study disentangles –
such as King and Lenox (2001) and Ziegler et al. (2007a) – firm and sector specific influ-
ences and therefore additionally analyzes industry environmental and social performance.
4. Econometric approach
Our study applies cross-sectional regressions of average stock returns over time on CSR. To
explain such stock performance, we include – according to financial economics – some con-
trol variables which are received by time-series regressions of asset pricing models. The es-
timated corporate beta parameters from this first stage are then – in addition to the main in-
teresting CSR variables – incorporated in the final cross-sectional regressions.
4.1. Time-series regressions of asset pricing models

11
So far, the main asset pricing model for estimating stock returns is the one-factor model
based on the market model (e.g., Sharpe, 1963) and the CAPM (e.g., Lintner, 1965, Fama
and French, 2004, Perold, 2004). This model can be formulated for a corporation or stock i
in month t (i = 1,…,N; t = 1,…,T) as
reit = αi
CAPM + βiCAPM re
mt + εit
with the excess returns reit = rit-rft and re
mt = rmt-rft. In this approach, rit and rmt are the (con-
tinuous) stock returns for corporation i and the market at the end of month t, rft is the risk-
free interest rate at the beginning of month t, and εit is the disturbance term with E(εit) = 0
and (unknown) var(εit) = σε2. Finally, αiCAPM and βi
CAPM are further unknown parameters
which are estimated by ordinary least squares (OLS). The idea is that the estimated market-
beta parameters est(βiCAPM) capture the non-diversifiable risk of each corporation which can
be used in the final cross-sectional regressions to explain average stock returns over time.
Based on the “anomalies” discussion which questions the validity of the CAPM (e.g., Banz,
1981, DeBondt and Thaler, 1985, Fama and French, 1992), Fama and French (1993) devel-
oped a three-factor model which includes – besides the excess returns rmt-rft of the market –
two additional factors with respect to size and value to explain the excess returns rit-rft:
reit = αi
FF + βi1FF re
mt + βi2FF SMBt + βi3
FF HMLt + εit
In this model SMBt is (at the end of month t) the difference between the returns for portfo-
lios comprising stocks of “small” corporations and portfolios comprising stocks of “big”
corporations. HMLt is (at the end of month t) the difference between the returns for portfo-
lios comprising stocks of corporations with a “high” book-to-market equity and portfolios
comprising stocks of corporations with a “low” book-to-market equity. The main unknown
parameters are now αiFF, βi1
FF, βi2FF, and βi3
FF. Many studies show that this three-factor
model has more explanatory power than the one-factor model based on the CAPM, for ex-
12
ample, Fama and French (1993, 1996) for the US, Berkowitz and Qiu (2001) for the Cana-
dian, Hussain et al. (2002) for the British, and Ziegler et al. (2007b) for the German stock
market.
Almost at the same time, however, a broad discussion about another factor, namely the mo-
mentum factor, began (e.g., Jagadeesh and Titman, 1993, Rouwenhorst, 1998, Jagadeesh
and Titman, 2001). As a consequence, the following four-factor model of Carhart (1997)
which additionally includes this factor – besides the three Fama-French factors – is in the
meantime, due to the highest explanatory power, the most common asset pricing model for
applications in financial economics (e.g., L’Her et al., 2004, Bollen and Busse, 2005) and
particularly, as discussed above, for portfolio analyses on the relationship between CSR and
stock performance:
reit = αi
CAR + βi1CAR re
mt + βi2CAR SMBt + βi3
CAR HMLt + βi4CAR MOMt + εit
In this model MOMt is (at the end of month t) the difference between the returns for portfo-
lios comprising stocks of “winners” in the past and portfolios comprising stocks of “losers”
in the past. The main unknown parameters are now αiCAR, βi1
CAR, βi2CAR, βi3
CAR, and βi4CAR.
4.2. Final cross-sectional regressions
The final cross-sectional regressions with the average monthly stock returns ir between
2003 and 2006 for corporation i as dependent variables incorporate – besides the main inter-
esting CSR variables (including environmental and social performance of the industry to
which a firm belongs), subsumed in the (column) vector CSRi – the estimated beta parame-
ters from the time-series regressions of the several asset pricing models in the first stage as
explanatory variables. In other words, these regressions either comprise est(βiCAPM) or

13
est(βi1FF), est(βi2
FF), and est(βi3FF), or est(βi1
CAR), est(βi2CAR), est(βi3
CAR), and est(βi4CAR) such
that the following three estimation equations arise (ζi are the respective disturbance terms):
ir = γ + δ’ CSRi + η est(βiCAPM) + ζi
ir = γ + δ’ CSRi + η1 est(βi1FF) + η2 est(βi2
FF) + η3 est(βi3FF) + ζi
ir = γ + δ’ CSRi + η1 est(βi1CAR) + η2 est(βi2
CAR) + η3 est(βi3CAR) + η4 est(βi4
CAR) + ζi
The (robust OLS) estimation of the respective parameters (or parameter vectors) leads to
est(γ), est(δ), and est(η) in the first approach based on the CAPM, to est(γ), est(δ), est(η1),
est(η2), and est(η3) in the second approach based on the Fama-French three-factor model,
and to est(γ), est(δ), est(η1), est(η2), est(η3), and est(η4) in the third approach based on the
Carhart four-factor model. As the estimated beta parameters can be theoretically considered
as risk factors, the corresponding estimates est(η), est(η1), est(η2), est(η3), and est(η4) in the
final cross-sectional regressions are expected to be positive.
In this respect, it should be noted that the cross-sectional regressions for the European stock
market additionally include nine country dummies as further explanatory variables to control
for possible regional differences regarding the average stock returns over time, for example,
due to different governmental policy, market developments, or economic growth. The corre-
sponding variables Fini, Frai, Geri, Itai, Neti, Spai, Swe, Swii, and UKi take the value one if
corporation i stems from Finland, France, Germany, Italy, the Netherlands, Spain, Sweden,
Switzerland, and the United Kingdom, respectively. The final cross-sectional regressions
additionally comprise corporations from Austria, Belgium, Denmark, Greece, Ireland, Nor-
way, and Portugal. Due to the small number of firms from these countries, the corresponding
dummy variables are not included in the regressions, but serve as summarized omitted refer-
ence category for the other country dummies. All calculations for this paper were performed
with the software package STATA.
14
5. Data and variables
5.1. CSR data and variables
Concerning the CSR variables, we use data from the Swiss bank Sarasin & Cie in Basle. Re-
liably beginning in 2001/2002, this bank has assessed environmental and social activities for
317 corporations in the USA and 720 European corporations quoted on different stock ex-
changes over time. While most of these corporations are large, some of them have a very
low market capitalization. The latter firms were only assessed due to their sustainability pro-
file (from the perspective of Sarasin). However, the problem is that such diverse firms which
belong to very different sectors cannot be reliably compared regarding the effect of CSR on
stock performance. Therefore, we only examine those assessed firms which were member of
the Morgan Stanley Capital International (MSCI) Europe Index or the MSCI USA Index at
least once over the period between 1996 and 2006. This period was chosen because we had
only access to financial data for these 11 years (see section 5.2.). As a consequence, the
number of corporations reduces to 212 in the USA and 419 in Europe.
Indeed, the corresponding necessary financial data and the exclusively used assessments for
2002 are only available for N = 175 US and N = 281 European corporations which are fi-
nally considered in our empirical analysis. In this respect, it should be noted that only those
corporations are examined whose financial data are available for all 132 months over the
entire period between 1996 and 2006. The reason for this is that the number T of observa-
tions should be large for the time-series regressions of asset pricing models. In other words,
if we had additionally incorporated corporations whose financial data are only available for
a lower number of months, the corresponding estimations of the beta parameters would be
less reliable. Furthermore, we incorporate lagged explanatory variables by using the 2002

15
assessments and the average monthly stock returns between 2003 and 2006 as dependent
variables in the final cross-sectional regressions.
In its assessments Sarasin combines environmental and social risk indicators in a two-
dimensional rating and therefore considers both activities of a firm compared with other
firms in the same industry as well as environmental and social performance of the industry
to which a firm belongs. These two ratings are ultimately used to determine whether a cor-
poration is suitable for Sarasin's sustainable investment funds and portfolios or not. The first
rating indicates how successfully firms manage the industry specific risks. Concerning the
environmental dimension of this rating, all measures of a corporation to reduce environ-
mental risks in the full value-added chain of the products (pre-production, production, use of
products or services) are assessed. Furthermore, environmental strategies and management
systems are considered. Specifically, Sarasin uses sub-criteria which are proposed by the
World Business Council for Sustainable Development (WBCSD). These environmental sub-
criteria are energy intensity, use of renewable energies, material intensity, toxicity, revalori-
sation, durability, and service intensity.
Concerning the social dimension of the first rating, it is assessed how well a firm manages
its internal and external conflict potential, i.e., requirements of different stakeholder groups.
The following groups are considered as stakeholders: Employees, suppliers, investors, the
general public as well as – regarding the market – customers and competitors. Key elements
for the assessment are the social strategy and social management systems of firms. As social
sub-criteria Sarasin considers health risks, participation, wealth creation, and distribution
and knowledge creation regarding their effects on stakeholder groups. These single social
and environmental sub-criteria – which are assessed on a five-stage scale, respectively – are
then aggregated to the first broad rating. It should be noted that the relevance of the several
environmental sub-criteria differs between sectors with respect to the value-added chain of
16
the products whereas the relevance of the several social sub-criteria differs between sectors
with respect to the importance of the individual stakeholder groups. As a consequence, the
final aggregation is based on different weightings.
The second industry specific rating refers to the assessment of the environmental and social
impacts and risks which are particular for this sector. In this assessment, not only the direct
effects of producing the products and services, but also indirect influences along the product
chain as well as lifecycle considerations are included. Regarding the environmental dimen-
sion, two main sub-criteria are considered, namely resource consumption and emissions.
According to these criteria, for example, primary industries such as chemicals, energy, en-
ergy suppliers, metal production, mining, paper, and cement all belong to industries with
higher environmental risks with respect to the substantial direct impact of those industries on
the environment.
Regarding the social dimension, Sarasin distinguishes between internal conflict potential
(e.g., downsizing or inadequate working conditions) and external conflict potential which
comprises, for example, health risks caused by products and productions methods, concen-
tration of economic power, corruption, and ethical conflicts. While each of these single envi-
ronmental and social industry specific sub-criteria is again independently assessed on a five-
stage scale, the several sub-criteria are finally – based on different weightings – aggregated
to the second broad rating. Both aggregated broad ratings are also based on a five-stage
scale and therefore – in the same way as the single sub-criteria – coded with the integers
from one to five. In this respect, the number one designates the worst and the number five
the best assessment.
In the following, Corpi symbolizes the corresponding ordinal variable for the environmental
and social activities of a firm i compared with other firms in the same industry and Indui
symbolizes the ordinal variable for environmental and social performance of the industry to

17
which a firm i belongs. Since it is not certain that these ratings are equidistant in each case,
i.e., that the distance between two numbers is always identical, we also examine dummy
variables based on these ordinal variables. However, preliminary investigations showed that
the incorporation of overall eight single dummies lead to ambiguous estimation results, ob-
viously because the effects of these variables are not linear (the estimation results are avail-
able on request).
Therefore, we analyze two alternative aggregated dummy variables for both ratings in more
detail. The dummies Corp54i or Indu54i take the value one if Corpi or Indui take the values
five or four, respectively. Furthermore, the dummies Corp543i or Indu543i take the value
one if Corpi or Indui take the values five, four, or three, respectively. As a consequence, the
vector CSRi in the final cross-sectional regressions always comprise exactly one pair of the
variables Corpi and Indui, Corp54i and Indu54i, or Corp543i and Indu543i. Table 1 reports
the corresponding frequencies for the distribution of the values of Corpi and Indui for the N
= 175 US and the N = 281 European corporations. In this respect, the relative frequencies (in
%) for the values of Corpi refer to the respective values of Indui in the columns.
5.2. Financial variables
As aforementioned, we had access to financial data on total return indexes (which contain
both stock prices and cash flows to the investor), market values, and book values (in US $,
respectively) for the period between 1996 and 2006. These data stem from the Thomson Fi-
nancial Datastream database. All monthly stock returns rit (in %) for both the US and Euro-
pean corporations in the empirical analysis were calculated with these total return indexes.
The time-series regressions in the first stage of the econometric analysis additionally require
the inclusion of a risk-free interest rate for the calculation of excess returns. In this respect,
we used the monthly return of one-month US Treasury Bills. Furthermore, the time-series

18
regressions additionally require the inclusion of the monthly excess stock returns remt for the
market. For the USA we directly used the corresponding data (in %) from the homepage of
Kenneth R. French (http://mba.tuck.dartmouth.edu/pages/faculty/ken.french/
data_library.html). The calculation of the monthly returns rmt of a European stock market
portfolio (in %) is based on the total return indexes of the MSCI Europe (in US $).
In the same way as remt, the factors SMBt, HMLt, and MOMt for the US stock market were
directly extracted from the homepage of Kenneth R. French. In contrast, these factors are not
publicly available for the entire European stock market and thus had to be constructed. The
basis for this calculation were 917 European corporations which were member of the MSCI
Europe at least once over the complete period between 1996 and 2006. Regarding SMBt and
HMLt, corporations were ranked each year on their market capitalization in June and inde-
pendently on their ratio between the published book value for the last year and the market
value in December of the last year. Then the median of the market capitalizations as well as
the 30% and 70% percentiles of the book-to-market equity were calculated such that six
portfolios could be constructed from these three values. In each June over time the corpora-
tions were allocated anew to one of these six portfolios and stay there from July for the next
12 months.
The construction of these portfolios only comprises those corporations with corresponding
available data for June of the respective year and additionally with positive book values for
the last year. Furthermore, stock return data and market value data for the next 12 months
had to be available. The resulting times-series of the value-weighted returns of these six
stock portfolios (between July 1997 and June 2006) were the basis for the final calculations
of SMBt which is the (weighted) difference between the returns of “small” corporations and
“big” corporations as well as HMLt which is the (weighted) difference between the returns

19
for corporations with a “high” book-to-market equity and corporations with a “low” book-
to-market equity (according to the procedure of Fama and French, 1993).
Concerning MOMt, corporations were ranked in each month t-1 on their market capitaliza-
tion and independently on their average stock returns between the months t-12 and t-2. Then
the median of the market capitalizations as well as the 30% and 70% percentiles of the aver-
age stock returns were calculated leading to six portfolios based on these three values. The
firms were allocated anew in each month t-1 over time to one of these six portfolios. Their
construction only incorporates those corporations with available market values for this and
the next month and additionally with available stock returns for the next month t and for
each month between t-12 and t-2. The resulting times-series of the value-weighted returns of
four stock portfolios (between February 1997 and December 2006) with respect to the bot-
tom and top 30% of the past average returns were the basis of the final calculations of
MOMt which is the (weighted) difference between the returns of “winners” and “losers” in
the past (according to the procedure described on the homepage of Kenneth R. French). Ta-
ble 2 reports descriptive statistics (mean, standard deviation, minimum, maximum) for the
average monthly stock returns between 2003 and 2006 as well as for the estimated corporate
beta parameters from the times-series regressions of the different asset pricing models. It
shows, for example, that the mean average stock return for European corporations (2.34%)
is noticeably higher than the mean for US corporations (1.27%) in this specific period.
6. Results
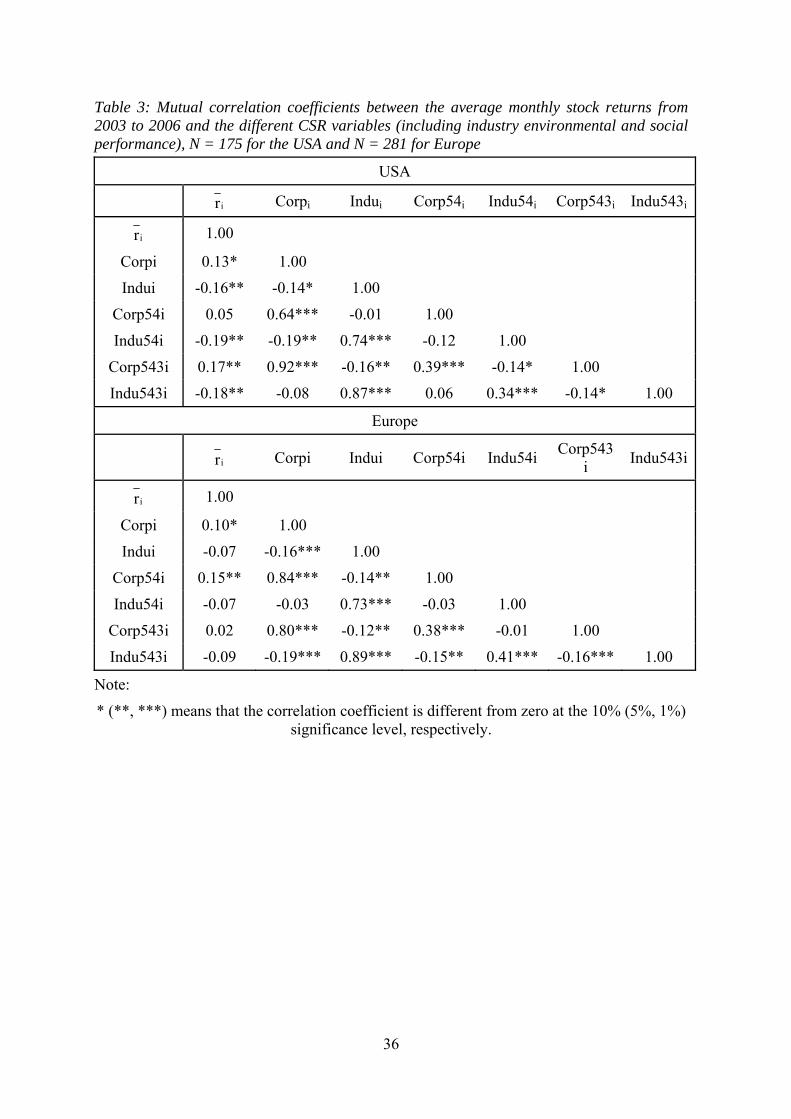
Table 3 reports the mutual correlation coefficients of ir and the CSR variables (including
industry environmental and social performance). In this respect, Spearman's rank correlation
coefficients instead of Pearson's correlation coefficients were applied when the ordinal vari-
ables Corpi and Indui are concerned. The main results in this table are the positive coeffi-

20
cients between stock performance and the different corporate activities variables as well as
the negative coefficients between the average stock returns and the industry environmental
and social performance variables. Concerning the latter, however, they are not significantly
different from zero for Europe. In contrast, the respective correlation coefficients are
strongly different from zero at the 5% significance level for the USA. Furthermore, the cor-
relation coefficients between the average stock returns and Corpi are different from zero at
the 10% significance level for both the USA and Europe as well as the coefficients between
stock performance and Corp543i for the USA and between stock performance and Corp54i
for Europe are different from zero at the 5% significance level.
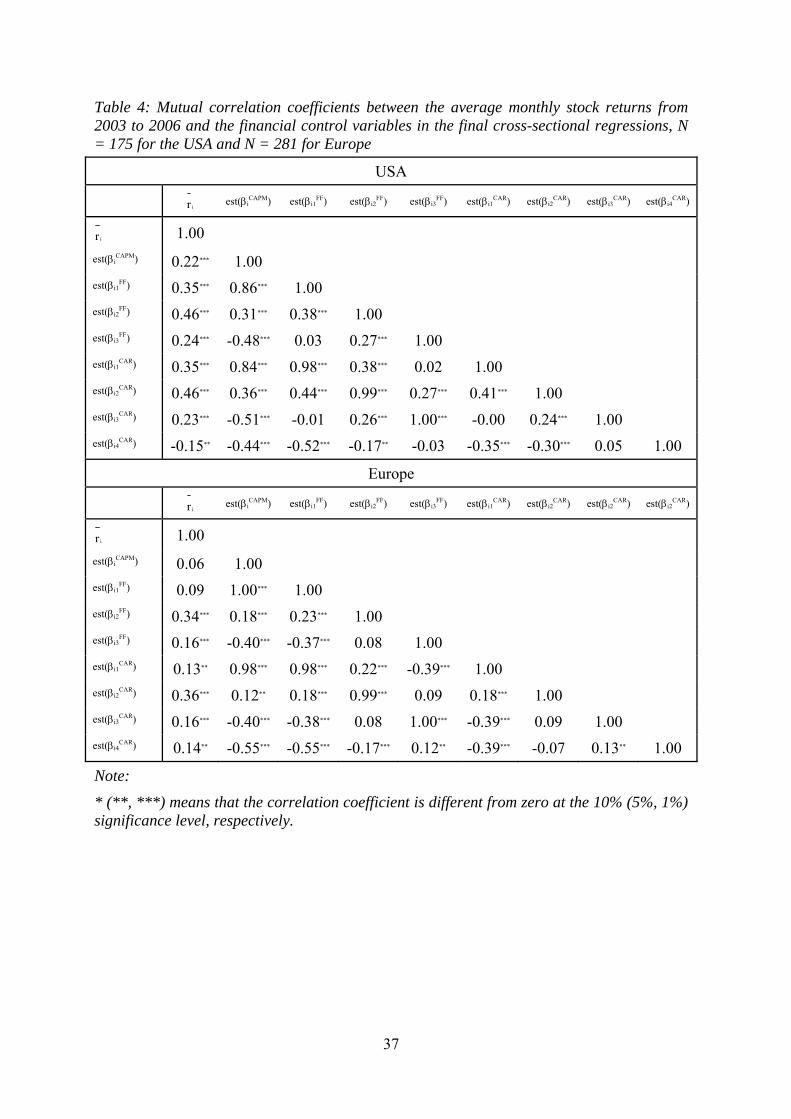
Table 4 reports the mutual Pearson's correlation coefficients of ir and the estimated corpo-
rate beta parameters from the time-series regressions of the several asset pricing models.
The main results in this table are the positive correlation coefficients between the average
stock returns and the different estimated beta parameters. The only exception is the negative
correlation coefficient between stock performance and est(βi4CAR) for the USA which is in
addition different from zero at the 5% significance level. In contrast, the correlation coeffi-
cients between the average stock returns and the other estimated beta parameters in this re-
gion are clearly positive and different from zero at the 1% significance level. Regarding
Europe, the respective correlation coefficients are without exception positive and only insig-
nificantly different from zero for est(βiCAPM) and est(βi
FF).
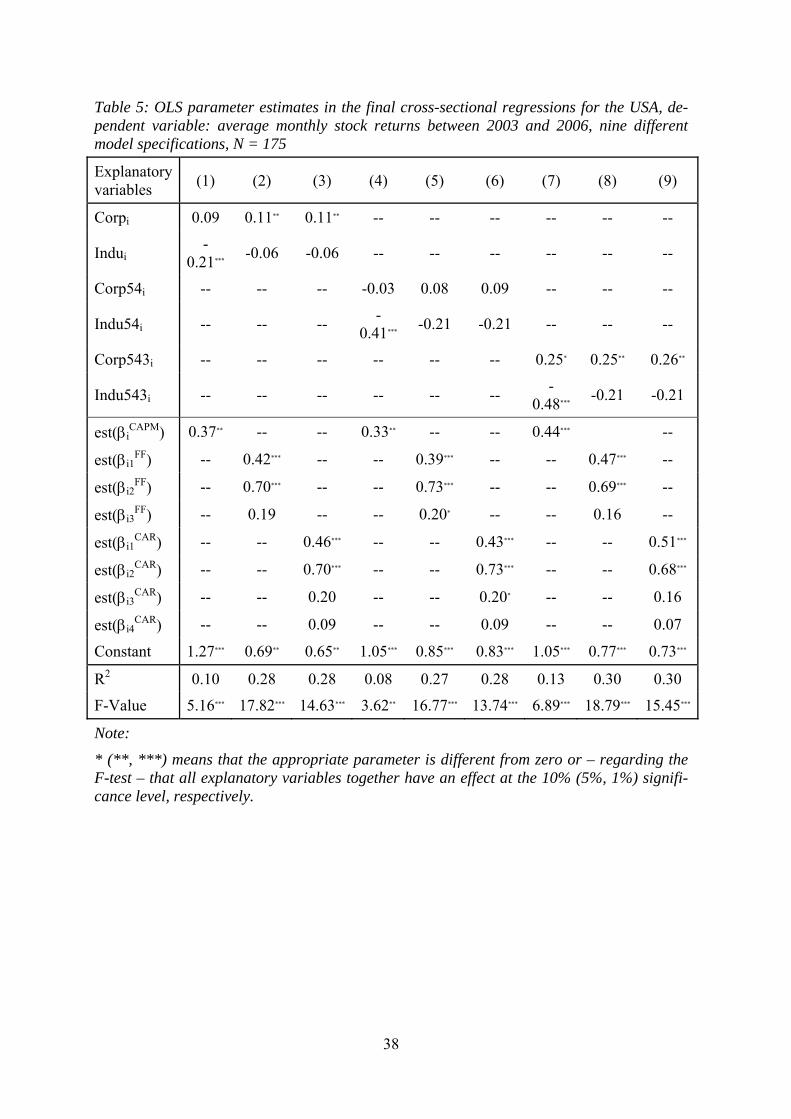
However, it should be noted that the results in Table 3 and Table 4 only indicate univariate
relationships. Therefore, Table 5 and Table 6 report the estimation results of our economet-
ric analysis. The corresponding econometric models incorporate – besides the main interest-
ing CSR variables (including industry environmental and social performance) – the esti-
mated beta parameters from the time-series regressions of the several asset pricing models as
financial control variables to explain the average monthly stock returns between 2003 and
21
2006. While Table 5 refers to the USA, Table 6 reports the estimation results for Europe. In
both cases the cross-sectional regressions according to equations (1), (4), and (7) are based
on the CAPM, according to equations (2), (5), and (8) are based on the Fama-French three-
factor model, and according to equations (3), (6), and (9) are based on the Carhart four-
factor model. Furthermore, the respective final regressions according to the first three equa-
tions (1), (2), and (3) incorporate the ordinal variables Corpi and Indui, while the remaining
regressions either include both dummies Corp54i and Indu54i or both dummies Corp543i
and Indu543i.
According to Table 5, the ordinal variable Corpi has a positive effect (at the 5% significance
level) when the estimated corporate beta parameters from the multifactor models are in-
cluded as control variables. This impact remains significantly positive for the dummy vari-
able Corp543i. In contrast, the latter effect has a higher significance level on the basis of the
CAPM and the parameter of Corpi is not even significantly different from zero in this case.
However, it appears that the estimation results based on the CAPM are less reliable because
the estimated beta parameters est(βi2FF) and est(βi2
CAR) from the multifactor models – be-
sides est(βi1CAPM), est(βi1
FF), or est(βi1CAR) – have a high explanatory power. Therefore, cor-
porate environmental and social activities obviously matter for the average monthly stock
returns between 2003 and 2006 in the USA even when the effect is insignificant for the
dummy Corp54i. This latter result points to possible non-linear effects with respect to the
intensity of these measures.
Concerning the impact of industry environmental and social performance for the US stock
market, the estimation results are different. The ordinal variable Indui as well as the corre-
sponding dummy variables Indu54i and Indu543i have a negative effect on stock perform-
ance (at the 1% significance level) when the estimated beta parameters from the CAPM are
incorporated. However, these effects become insignificant on the basis of the Fama-French
22
three-factor or the Carhart four-factor models. Due to the high explanatory power of some
estimated corporate beta parameters from the multifactor models as discussed above, the es-
timation results based on the CAPM are overall obviously not reliable, but a typical example
for biased parameter estimations due to omitted explanatory variables.
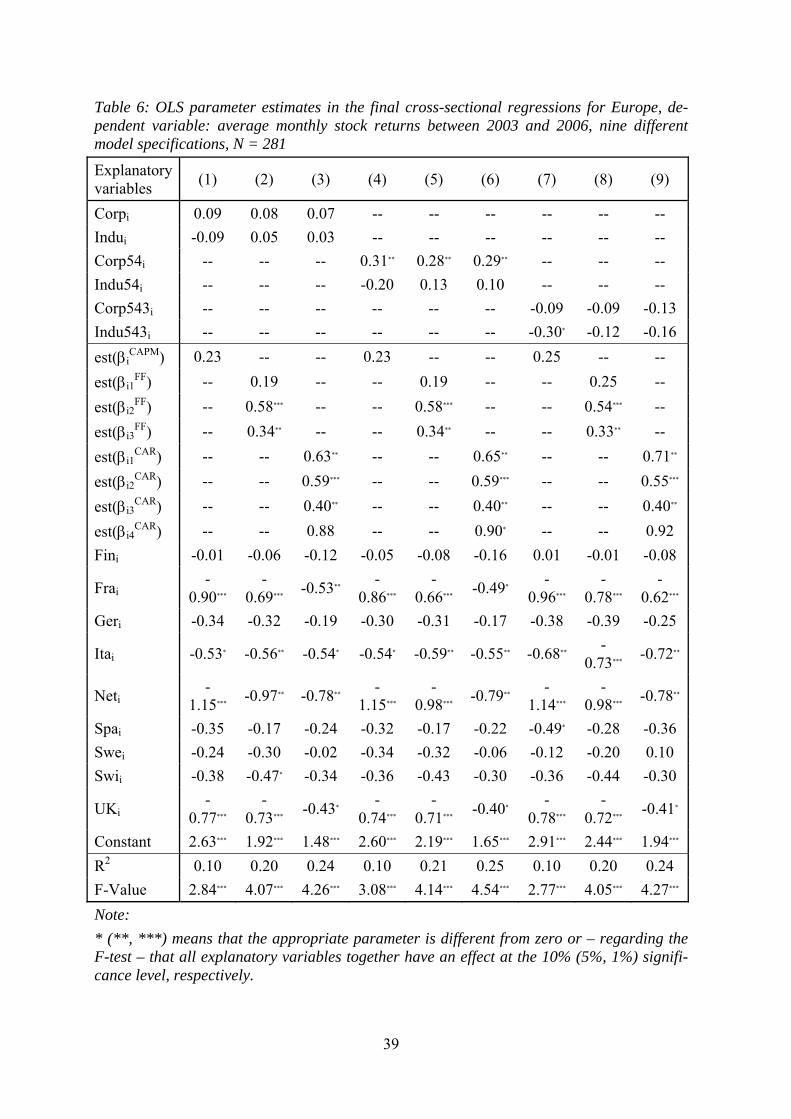
According to Table 6, this problem holds true for the effect of Indu543i in Europe, although
to a smaller extent. While this variable has a negative influence on average stock returns
(however, only at the 10% significance level) based on the CAPM, this effect again becomes
insignificant on the basis of both multifactor models. The impacts of Indui and Indu54i are
already insignificant, irrespective of the underlying asset pricing models. In the same way,
no significant effects of Corpi and Corp543i arise. In contrast, Corp54i has a positive effect
on stock performance (at the 5% significance level) based on the CAPM as well as on both
multifactor models. Therefore, only single positive effects on average monthly stock returns
between 2003 and 2006 appear to be existent in Europe, but no linear effects of an increas-
ing intensity of corporate environmental and social activities.
These estimation results are robust in different ways: For example, it should be noted that
corporations were ranked each year on their market capitalization in June and on their book-
to-market equity in December of the last year for the calculation of SMBt and HMLt in
Europe as discussed above. In this respect, we used the book values which were published in
June each year in the Thomson Financial Datastream database to ensure that the values for
the last year are actually considered. However, it is also possible that these values are influ-
enced by new developments during the current year. Therefore, we additionally considered
the book-to-market equity based on the published book and market values in December last
year in a further analysis. Finally, we also examined the published book and market values
in June from the Thomson Financial Datastream. Indeed, the estimation results based on
23
these calculations (which are available on request) are not systematically different from the
results as discussed above.
Furthermore, the estimation results in this paper are in principle based on the 2002 assess-
ments of CSR (including industry environmental and social performance). However, it
should be noted that many corporations were assessed for the first time by Sarasin after
2002. For these firms we incorporated the corresponding first assessments in our empirical
analysis. This procedure seems to be justified because the assessments have an extremely
low variability over time for the respective corporations. We nevertheless excluded in a fur-
ther analysis those firms with new assessments, i.e., with first assessments after 2004. How-
ever, we continued to include firms with first assessments in 2003 or 2004. This procedure
of extending assessments for two years is common in empirical analyses of the relationship
between CSR and corporate financial performance to avoid very small samples (e.g., Der-
wall et al., 2005). Indeed, the corresponding estimation results (which are available on re-
quest) are again qualitatively fully in line with the results as discussed above.

24
7. Discussion and conclusions
This paper provides new empirical evidence for the effect of CSR (which is measured by
environmental and social activities of a firm compared with other firms within the industry
and additionally considers environmental and social performance of the industry to which a
firm belongs) on average monthly stock returns between 2003 and 2006. In contrast to for-
mer studies, it examines two different regions, namely the USA and Europe. Our two-stage
econometric analysis shows that corporate environmental and social activities matter for the
explanation of stock performance in both regions. However, this impact is obviously not lin-
ear for an increasing intensity of these measures. Compared with Europe, the positive effect
furthermore appears to be more robust for the USA because the ordinal CSR variable Corpi
here has a positive impact. In contrast, the industry environmental and social performance
has neither a robust positive nor a robust negative influence on the average monthly stock
returns between 2003 and 2006 for any region.
According to these results, the stock markets – and particularly the US stock market – obvi-
ously rewarded investments in stocks of corporations with a high intensity of environmental
and social activities compared with other firms within the industry. In other words, investors
who applied a buy-and-hold strategy would have increased their portfolio value by investing
in such stocks. Regarding the management of a firm, these results imply that such measures
could be increased since they obviously do not lead to worse financial performance. The re-
sults furthermore support the advocates of information-based regulations by improving the
flow of the respective information. However, the question is whether the discussed positive
effect is robust for alternative measurements of CSR, for example, based on assessments
from other rating agencies or based on quantitative indicators such as emissions, and alterna-
tive measurements of corporate financial performance, for example, based on accounting
data based indicators. Such studies would be interesting in the future. Another field for fur-

25
ther research would be the econometric analysis of alternative periods to examine whether
the consideration of the period between 2003 and 2006 produces specific estimation results.
Irrespective of such future research, our study supports the incorporation of more flexible
asset pricing models: On the basis of the simple CAPM, industry environmental and social
performance has a significantly negative impact on stock performance in the USA. How-
ever, the significance of this effect disappears if estimated corporate beta parameters from
the Fama-French three-factor or the Carhart four-factor models are included as additional
control variables. This result (in line with, e.g., McWilliams and Siegel, 2000) points to the
problem of misleading conclusions regarding the effect of CSR on corporate financial per-
formance if misspecified econometric models are applied due to omitted explanatory vari-
ables such that biased parameter estimations occur.
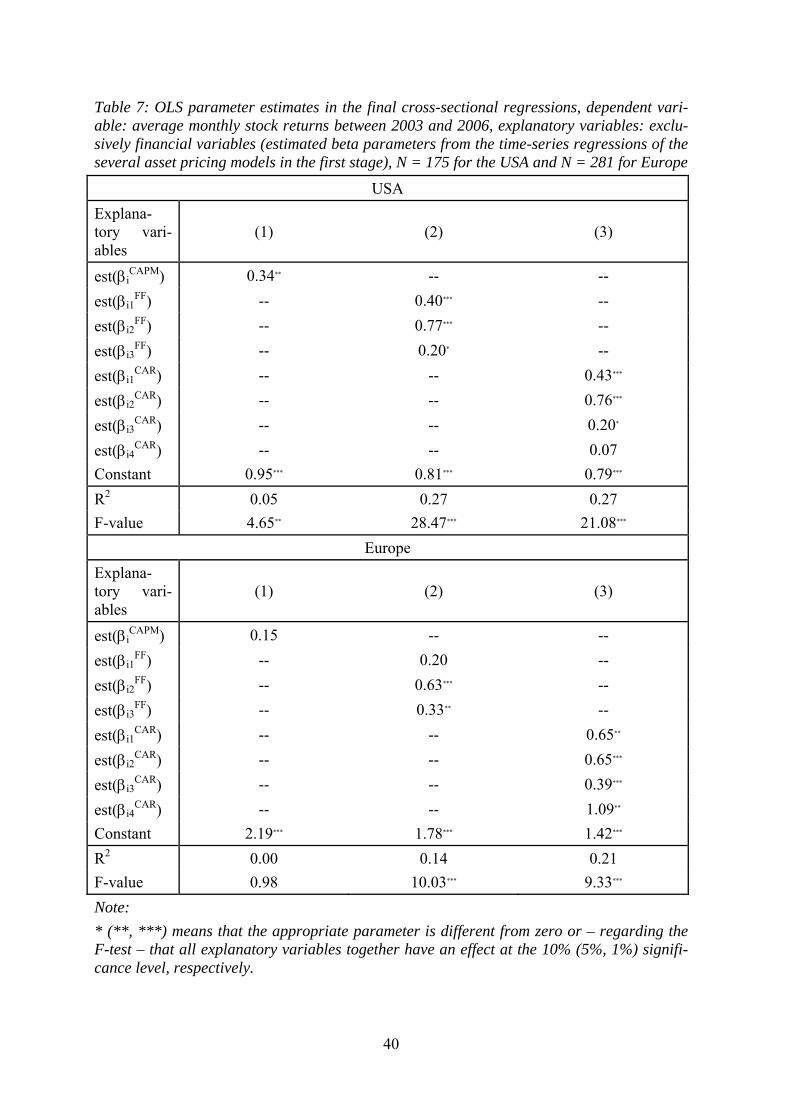
To strengthen our argument of incorporating multifactor models, we now refrain from con-
sidering the CSR variables (including industry environmental and social performance) and
instead exclusively examine the estimated corporate beta parameters from the time-series
regressions of the several asset pricing models to explain the average monthly stock returns
between 2003 and 2006. Table 7 reports the corresponding estimation results. According to
this table, the estimated beta parameter est(βi1CAPM) from the CAPM alone has only small
explanatory power on the US stock market and almost no explanatory power on the Euro-
pean stock market. Furthermore, the estimated beta parameters est(βi2FF) and est(βi2
CAR) –
and to a smaller extent est(βi3FF) and est(βi3
CAR) – in the USA as well as the estimated beta
parameters est(βi2FF), est(βi3
FF), est(βi2CAR), est(βi3
CAR), and est(βi4CAR) in Europe are signifi-
cantly different from zero. In particular, these parameter estimates are positive as it could be
expected when these variables are interpreted as risk factors. Therefore, we conclude that the
estimated beta parameters from the multifactor models alone have high explanatory power
for the average monthly stock returns between 2003 and 2006 in the USA and in Europe.

26
In the future, it would be interesting to analyze further multifactor models which have been
recently developed in financial economics, but are not widely applied, particularly with re-
spect to the European stock market. For example, Al-Horani et al. (2003) consider a research
and development factor besides the three Fama-French risk factors and Pastor and Stam-
baugh (2003) examine a liquidity factor besides the four Carhart risk factors. Most recently,
Chen and Zhang (2007) develop a neoclassical three-factor model which includes invest-
ment and productivity risk factors motivated from general equilibrium theory. Regarding
financial economics, it can be analyzed whether further factors beyond the four factors ac-
cording to Carhart (1997) have explanatory power for average stock returns over time in dif-
ferent regions. These factors can then be included as additional financial control variables in
the analysis of the effect of CSR on stock performance to check the robustness of the esti-
mation results in our study.
References
Alberini, A and K. Segerson (2002), Assessing Voluntary Programs to Improve Environ-
mental Quality, Environmental and Resource Economics 22, 157-184.
Al-Horani, A., P.F. Pope, and A.W. Stark (2003), Research and Development Activity and
Expected Returns in the United Kingdom, European Finance Review 7, 27-46.
Arx, U. (2007), Principle Guided Investing: The Use of Exclusionary Screens and Its Impli-
cations for Green Investors, Swiss Journal of Economics and Statistics 143, 3-30.
Banz, R.W. (1981), The Relationship Between Return and Market Value of Common
Stocks, Journal of Financial Economics 9, 3-18.
Barney, J. (1991), Firm Resources and Sustained Competitive Advantage, Journal of Man-
agement 17, 99-120.

27
Barnett, M.L. and R.M. Salomon (2006), Beyond Dichotomy: The Curvilinear Relationship
between Social Responsibility and Financial Performance, Strategic Management Journal
27, 1101-1122.
Bauer, R., J. Derwall, and R. Otten (2007), The Ethical Mutual Fund Performance Debate:
New Evidence from Canada, Journal of Business Ethics 70, 111-124.
Bauer, R., K. Koedijk, and R. Otten (2005), International Evidence on Ethical Mutual Fund
Performance and Investment Style, Journal of Banking and Finance 29, 1751-1767.
Beltratti, A. (2005), Capital Market Equilibrium with Externalities, Production and Hetero-
geneous Agents, Journal of Banking and Finance 29, 3061-3073.
Berkowitz, M.K. and J. Qiu (2001), Common Risk Factors in Explaining Canadian Equity
Returns, University of Toronto.
Bollen, N.P.B. and J.A. Busse (2005), Short-Term Persistence in Mutual Fund Performance,
Review of Financial Studies 18, 569-597.
Carhart, M.M. (1997), On Persistence in Mutual Fund Performance, Journal of Finance 52,
57-82.
Chen, L. and L. Zhang (2007), Neoclassical Factors, NBER Working Paper 13282, Cam-
bridge.
Curran, M.M. and D. Moran (2007), Impact of the FTSE4Good Index on Firm Price: An
Event Study, Journal of Environmental Management 82, 529-537.
Dasgupta, S., B. Laplante, and M. Nlandu (2001), Pollution and Capital Markets in Devel-
oping Countries, Journal of Environmental Economics and Management 42, 310-335.
DeBondt, W.F.M. and R. Thaler (1985), Does the Stock Market Overreact?, Journal of Fi-
nance 40, 793-805.

28
Derwall, J., N. Guenster, R. Bauer, and K. Koedijk (2005), The Eco-Efficiency Premium
Puzzle, Financial Analysts Journal 61, 51-63.
Dowell, G., S. Hart, and B. Yeung (2000), Do Corporate Global Environmental Standards
Create or Destroy Market Value?, Management Science 46, 1059-1074.
Elsayed, K. and D. Paton (2005), The Impact of Environmental Performance on Firm Per-
formance: Static and Dynamic Panel Data Evidence, Structural Change and Economic Dy-
namics 16, 395-412.
Fama, E.F. and K.R French, (1992), The Cross-Section of Expected Stock Returns, Journal
of Finance 47, 427-465.
Fama, E.F. and K.R. French (1993), Common Risk Factors in the Returns on Stocks and
Bonds, Journal of Financial Economics 33, 3-56.
Fama, E.F. and K.R. French (1996), Multifactor Explanations of Asset Pricing Anomalies,
Journal of Finance 51, 55-84.
Fama, E.F. and K.R. French (2004), The Capital Asset Pricing Model: Theory and Evidence,
Journal of Economic Perspectives 18, 25-46.
Filbeck, G. and R.F. Gorman (2004), The Relationship between the Environmental and Fi-
nancial Performance of Public Utilities, Environmental and Resource Economics 29, 137-
157.
Friedman, M. (1970), The Social Responsibility of Business is to Increase its Profits, The
New York Times Magazine, 13 September 1970.
Guenster, N., J. Derwall, R. Bauer, and K. Koedijk (2006), The Economic Value of Corpo-
rate Eco-Efficiency, RSM Erasmus University Rotterdam.

29
Gupta, S. and B. Goldar (2005), Do Stock Markets Penalize Environment-Unfriendly Be-
haviour? Evidence from India, Ecological Economics 52, 81-95.
Hamilton, J.T. (1995), Pollution as News: Media and Stock Market Reactions to the Toxics
Release Inventory Data, Journal of Environmental Economics and Management 28, 98-113.
Hart, S.L. and G. Ahuja (1996) Does it Pay to be Green? An Empirical Examination of the
Relationship between Emission Reduction and Firm Performance, Business Strategy and the
Environment 5, 30-37.
Heal, G. (2005), Corporate Social Responsibility: An Economic and Financial Framework,
Geneva Papers 30, 387-409.
Heinkel, R., A. Kraus, and J. Zechner (2001), The Effect of Green Investment on Corporate
Behavior, Journal of Financial and Quantitative Analysis 36, 431-449.
Hussain, I., S. Toms, and S. Diacon (2002), Financial Distress, Single and Multifactor Tests
and Comparisons of Asset Pricing Anomalies: New Evidence, Nottingham University Busi-
ness School.
Jagadeesh, N. and S. Titman (1993), Returns to Buying Winners and Selling Losers: Impli-
cations from Stock Market Efficiency, Journal of Finance 48, 65-91.
Jagadeesh, N. and S. Titman (2001), Profitibality of Momentum Strategies: An Evaluation
of Alternative Explanations, Journal of Finance 56, 699-720.
Kempf, A. and P. Osthoff (2007), The Effect of Socially Responsible Investing on Portfolio
Performance, European Financial Management 13, 908-922.
Khanna, M. (2001), Non-Mandatory Approaches to Environmental Protection, Journal of
Economic Surveys 15, 291-324.

30
Khanna, M., W.R. Quimo, and D. Bojilova (1998), Toxics Release Information: A Policy
Tool for Environmental Protection, Journal of Environmental Economics and Management
36, 243-266.
King, A. and M. Lenox (2001) Does it Really Pay to be Green?, Journal of Industrial Ecol-
ogy 5, 105-116.
King, A. and M. Lenox (2002), Exploring the Locus of Profitable Pollution Reduction,
Management Science 48, 289-299.
Klassen, R.D. and C.P. McLaughlin (1996), The Impact of Environmental Management on
Firm Performance, Management Science 42, 1199-1214.
Klassen, R.D. and D.C. Whybark (1999), The Impact of Environmental Technologies on
Manufacturing Performance, Academy of Management Journal 42, 599-615.
Konar, S. and M.A. Cohen (1997), Information as Regulation: The Effect of Community
Right to Know Laws on Toxic Emissions, Journal of Environmental Economics and Man-
agement 32, 109-124.
Konar, S. and M.A. Cohen (2001), Does the Market Value Environmental Performance, Re-
view of Economics and Statistics 83, 281-289.
Kothari, S.P. and J.B. Warner (2006), Econometrics of Event Studies, in: Eckbo, B.E. (ed.),
Handbook of Corporate Finance: Empirical Corporate Finance, Elsevier/North Holland,
Chapter 1, 3-36.
L’Her, J.-F., T. Masmoudi, and J.-M. Suret (2004), Evidence to Support the Four-factor
Pricing Model from the Canadian Stock Market, Journal of International Financial Markets,
Institutions, and Money 14, 313-328.
31
Lintner, J. (1965), The Valuation of Risk Assets and the Selection of Risky Investments in
Stock Portfolios and Capital Budgets, Review of Economics and Statistics 47, 13-37.
MacKey, A., T.B. MacKey, and J.B. Barney (2007), Corporate Social Responsibility and
Firm Performance: Investor Preferences and Corporate Strategies, Academy of Management
Review 32, 817-835.
MacKinlay, A.C. (1997), Event Studies in Economics and Finance, Journal of Economic
Literature 35, 13-39.
McWilliams, A. and D. Siegel (2000), Corporate Social Responsibility and Financial Per-
formance: Correlation or Misspecification?, Strategic Management Journal 21, 603-609.
McWilliams, A. and D. Siegel (2001), Corporate Social Responsibility: A Theory of the
Firm Perspective, Academy of Management Review 26, 117-127.
McWilliams, A., D. Siegel, and P.M. Wright (2006), Corporate Social Responsibility: Stra-
tegic Implications, Journal of Management Studies 43, 1-18.
Miller, M. and F. Modigliani (1961), Dividend Policy, Growth and the Valuation of Shares,
Journal of Business 34, 411-433.
Orlitzky, M. (2001), Does Firm Size Confound the Relationship between Corporate Social
Performance and Firm Performance, Journal of Business Ethics 33, 167-180.
Orlitzky, M., F.L. Schmidt, and S.L. Rynes (2003), Corporate Social and Financial Perform-
ance: A Meta-Analysis, Organization Studies 24, 403-441.
Pastor, L. and R.F. Stambaugh (2003), Liquidity Risk and Expected Stock Returns, Journal
of Political Economy 111, 642-685.
Perold, A.F. (2004), The Capital Asset Pricing Model, Journal of Economic Perspectives 18,
3-24.
32
Posnikoff, J.F. (1997), Disinvestment from South Africa: They Did Well by Doing Good,
Contemporary Economic Policy 15, 76-86.
Rouwenhorst, K.G. (1998), International Momentum Strategies, Journal of Finance 53, 267-
284.
Russo, M.V. and P.A. Fouts (1997), A Resource-Based Perspective on Corporate Environ-
mental Performance and Profitability, Academy of Management Journal 40, 534-559.
Salama, A. (2005), A Note on the Impact of Environmental Performance on Financial Per-
formance, Structural Change and Economic Dynamics 16, 413-421.
Sharpe, W.F. (1963), A Simplified Model for Portfolio Analysis, Management Science 9,
277-293.
Shleifer, A. and R.W. Vishny (1997), A Survey of Corporate Governance, Journal of Fi-
nance 52, 737-783.
Telle, K. (2006), "It Pays to be Green“ – a Premature Conclusion?, Environmental and Re-
source Economics 35, 195-220.
Tirole, J. (2006), The Theory of Corporate Finance, Princeton: Princeton University Press.
Waddock, S. and S.B. Graves (1997), The Corporate Social Performance – Financial Per-
formance Link, Strategic Management Journal 18, 303-319.
Wagner, M. (2001), A Review of Empirical Studies Concerning the Relationship between
Environmental and Economic Performance, Center for Sustainability Management, Univer-
sity of Lueneburg.
Wall, L.D. (1995), Some Lessons from Basic Finance for Effective Socially Responsible
Investing, Economic Review of the Federal Reserve Bank of Atlanta 80, 1-12.

33
Ziegler, A., M. Schröder, and K. Rennings (2007a), The Effect of Environmental and Social
Performance on the Stock Performance of European Corporations, Environmental and Re-
source Economics 37, 661-680.
Ziegler, A., M. Schröder, A. Schulz, and R. Stehle (2007b), Multifaktormodelle zur Erklä-
rung deutscher Aktienrenditen: Eine empirische Analyse, Schmalenbachs Zeitschrift für be-
triebswirtschaftliche Forschung 59, 355-389.

34
Appendix
Table 1: Absolute frequencies and relative frequencies (in % regarding the columns) for the values of the ordinal variables Corpi and Indui
USA
In-dui
Corpi
5 4 3 2 1 Total
5 1 (12.50%)
0 (0.00%)
6 (7.14%)
1 (2.17%)
0 (0.00%)
8 (4.57%)
4 0 (0.00%)
1 (3.70%)
10 (11.90%)
4 (8.70%)
1 (10.00%)
16 (9.14%)
3 4 (50.00%)
7 (25.93%)
26 (30.95%)
22 (47.83%)
6 (60.00%)
65 (37.14%)
2 3 (37.50%)
12 (44.44%)
38 (45.24%)
16 (34.78%)
2 (20.00%)
71 (40.57%)
1 0 (0.00%)
7 (25.93%)
4 (4.76%)
3 (6.52%)
1 (10.00%)
15 (8.57%)
Total 8 (100.00%)
27 (100.00%)
84 (100.00%)
46 (100.00%)
10 (100.00%)
175 (100.00%)
Europe
Indui
Corpi
5 4 3 2 1 Total
5 0 (0.00%)
2 (4.00%)
6 (5.36%)
6 (7.06%)
2 (7.41%)
16 (5.69%)
4 2 (28.57%)
11 (22.00%)
19 (16.96%)
23 (27.06%)
11 (40.74%)
66 (23.49%)
3 4 (57.14%)
23 (46.00%)
49 (43.75%)
41 (48.24%)
10 (37.04%)
127 (45.20%)
2 1 (14.29%)
10 (20.00%)
30 (26.79%)
14 (16.47%)
4 (14.81%)
59 (21.00%)
1 0 (0.00%)
4 (8.00%)
8 (7.14%)
1 (1.18%)
0 (0.00%)
13 (4.63%)
Total 7 (100.00%)
50 (100.00%)
112 (100.00%)
85 (100.00)
27 (100.00)
281 (100.00%)
Note:
The number one designates the worst and the number five the best assessment for both ordi-nal variables Corpi and Indui, respectively.

35
Table 2: Descriptive statistics for financial variables (dependent and explanatory variables in the final cross-sectional regressions), N = 175 for the USA and N = 281 for Europe
USA
Variable Mean Stand. dev. Minimum Maximum
ir 1.27 0.93 -1.96 5.28
est(βiCAPM) 0.93 0.61 -0.30 3.02
est(βi1FF) 1.09 0.50 -0.07 3.03
est(βi2FF) -0.06 0.41 -1.04 1.40
est(βi3FF) 0.31 0.70 -2.12 2.37
est(βi1CAR) 1.05 0.45 -0.09 2.87
est(βi2CAR) -0.04 0.42 -1.03 1.49
est(βi3CAR) 0.29 0.70 -2.19 2.29
est(βi4CAR) -0.09 0.24 -1.13 0.48
Europe
Variable Mean Stand. dev. Minimum Maximum
ir 2.34 1.20 -8.84 6.95
est(βiCAPM) 1.01 0.47 0.13 2.79
est(βi1FF) 1.03 0.48 0.10 2.77
est(βi2FF) 0.49 0.60 -1.82 2.77
est(βi3FF) 0.17 0.60 -2.26 1.77
est(βi1CAR) 1.00 0.43 0.18 2.59
est(βi2CAR) 0.46 0.59 -1.85 2.75
est(βi3CAR) 0.17 0.60 -2.26 1.76
est(βi4CAR) -0.09 0.25 -1.17 0.51
36
Table 3: Mutual correlation coefficients between the average monthly stock returns from 2003 to 2006 and the different CSR variables (including industry environmental and social performance), N = 175 for the USA and N = 281 for Europe
USA
ir Corpi Indui Corp54i Indu54i Corp543i Indu543i
ir 1.00
Corpi 0.13* 1.00
Indui -0.16** -0.14* 1.00
Corp54i 0.05 0.64*** -0.01 1.00
Indu54i -0.19** -0.19** 0.74*** -0.12 1.00
Corp543i 0.17** 0.92*** -0.16** 0.39*** -0.14* 1.00
Indu543i -0.18** -0.08 0.87*** 0.06 0.34*** -0.14* 1.00
Europe
ir Corpi Indui Corp54i Indu54i Corp543i Indu543i
ir 1.00
Corpi 0.10* 1.00
Indui -0.07 -0.16*** 1.00
Corp54i 0.15** 0.84*** -0.14** 1.00
Indu54i -0.07 -0.03 0.73*** -0.03 1.00
Corp543i 0.02 0.80*** -0.12** 0.38*** -0.01 1.00
Indu543i -0.09 -0.19*** 0.89*** -0.15** 0.41*** -0.16*** 1.00
Note:
* (**, ***) means that the correlation coefficient is different from zero at the 10% (5%, 1%) significance level, respectively.
37
Table 4: Mutual correlation coefficients between the average monthly stock returns from 2003 to 2006 and the financial control variables in the final cross-sectional regressions, N = 175 for the USA and N = 281 for Europe
USA
ir est(βi
CAPM) est(βi1FF) est(βi2
FF) est(βi3FF) est(βi1
CAR) est(βi2CAR) est(βi3
CAR) est(βi4CAR)
ir 1.00
est(βiCAPM) 0.22*** 1.00
est(βi1FF) 0.35*** 0.86*** 1.00
est(βi2FF) 0.46*** 0.31*** 0.38*** 1.00
est(βi3FF) 0.24*** -0.48*** 0.03 0.27*** 1.00
est(βi1CAR) 0.35*** 0.84*** 0.98*** 0.38*** 0.02 1.00
est(βi2CAR) 0.46*** 0.36*** 0.44*** 0.99*** 0.27*** 0.41*** 1.00
est(βi3CAR) 0.23*** -0.51*** -0.01 0.26*** 1.00*** -0.00 0.24*** 1.00
est(βi4CAR) -0.15** -0.44*** -0.52*** -0.17** -0.03 -0.35*** -0.30*** 0.05 1.00
Europe
ir est(βiCAPM) est(βi1
FF) est(βi2FF) est(βi3
FF) est(βi1CAR) est(βi2
CAR) est(βi2CAR) est(βi2
CAR)
ir 1.00 est(βi
CAPM) 0.06 1.00 est(βi1
FF) 0.09 1.00*** 1.00 est(βi2
FF) 0.34*** 0.18*** 0.23*** 1.00 est(βi3
FF) 0.16*** -0.40*** -0.37*** 0.08 1.00 est(βi1
CAR) 0.13** 0.98*** 0.98*** 0.22*** -0.39*** 1.00 est(βi2
CAR) 0.36*** 0.12** 0.18*** 0.99*** 0.09 0.18*** 1.00 est(βi3
CAR) 0.16*** -0.40*** -0.38*** 0.08 1.00*** -0.39*** 0.09 1.00 est(βi4
CAR) 0.14** -0.55*** -0.55*** -0.17*** 0.12** -0.39*** -0.07 0.13** 1.00
Note:
* (**, ***) means that the correlation coefficient is different from zero at the 10% (5%, 1%) significance level, respectively.
38
Table 5: OLS parameter estimates in the final cross-sectional regressions for the USA, de-pendent variable: average monthly stock returns between 2003 and 2006, nine different model specifications, N = 175
Explanatory variables (1) (2) (3) (4) (5) (6) (7) (8) (9)
Corpi 0.09 0.11** 0.11** -- -- -- -- -- --
Indui -
0.21*** -0.06 -0.06 -- -- -- -- -- --
Corp54i -- -- -- -0.03 0.08 0.09 -- -- --
Indu54i -- -- -- -0.41***
-0.21 -0.21 -- -- --
Corp543i -- -- -- -- -- -- 0.25* 0.25** 0.26**
Indu543i -- -- -- -- -- -- -0.48*** -0.21 -0.21
est(βiCAPM) 0.37** -- -- 0.33** -- -- 0.44*** --
est(βi1FF) -- 0.42*** -- -- 0.39*** -- -- 0.47*** --
est(βi2FF) -- 0.70*** -- -- 0.73*** -- -- 0.69*** --
est(βi3FF) -- 0.19 -- -- 0.20* -- -- 0.16 --
est(βi1CAR) -- -- 0.46*** -- -- 0.43*** -- -- 0.51***
est(βi2CAR) -- -- 0.70*** -- -- 0.73*** -- -- 0.68***
est(βi3CAR) -- -- 0.20 -- -- 0.20* -- -- 0.16
est(βi4CAR) -- -- 0.09 -- -- 0.09 -- -- 0.07
Constant 1.27*** 0.69** 0.65** 1.05*** 0.85*** 0.83*** 1.05*** 0.77*** 0.73***
R2 0.10 0.28 0.28 0.08 0.27 0.28 0.13 0.30 0.30
F-Value 5.16*** 17.82*** 14.63*** 3.62** 16.77*** 13.74*** 6.89*** 18.79*** 15.45***
Note:
* (**, ***) means that the appropriate parameter is different from zero or – regarding the F-test – that all explanatory variables together have an effect at the 10% (5%, 1%) signifi-cance level, respectively.
39
Table 6: OLS parameter estimates in the final cross-sectional regressions for Europe, de-pendent variable: average monthly stock returns between 2003 and 2006, nine different model specifications, N = 281
Explanatory variables (1) (2) (3) (4) (5) (6) (7) (8) (9)
Corpi 0.09 0.08 0.07 -- -- -- -- -- -- Indui -0.09 0.05 0.03 -- -- -- -- -- -- Corp54i -- -- -- 0.31** 0.28** 0.29** -- -- -- Indu54i -- -- -- -0.20 0.13 0.10 -- -- -- Corp543i -- -- -- -- -- -- -0.09 -0.09 -0.13 Indu543i -- -- -- -- -- -- -0.30* -0.12 -0.16 est(βi
CAPM) 0.23 -- -- 0.23 -- -- 0.25 -- -- est(βi1
FF) -- 0.19 -- -- 0.19 -- -- 0.25 -- est(βi2
FF) -- 0.58*** -- -- 0.58*** -- -- 0.54*** -- est(βi3
FF) -- 0.34** -- -- 0.34** -- -- 0.33** -- est(βi1
CAR) -- -- 0.63** -- -- 0.65** -- -- 0.71** est(βi2
CAR) -- -- 0.59*** -- -- 0.59*** -- -- 0.55*** est(βi3
CAR) -- -- 0.40** -- -- 0.40** -- -- 0.40** est(βi4
CAR) -- -- 0.88 -- -- 0.90* -- -- 0.92 Fini -0.01 -0.06 -0.12 -0.05 -0.08 -0.16 0.01 -0.01 -0.08
Frai -
0.90*** -
0.69*** -0.53** -0.86***
-0.66*** -0.49* -
0.96*** -
0.78*** -
0.62*** Geri -0.34 -0.32 -0.19 -0.30 -0.31 -0.17 -0.38 -0.39 -0.25
Itai -0.53* -0.56** -0.54* -0.54* -0.59** -0.55** -0.68** -0.73*** -0.72**
Neti -
1.15*** -0.97** -0.78** -1.15***
-0.98*** -0.79** -
1.14*** -
0.98*** -0.78**
Spai -0.35 -0.17 -0.24 -0.32 -0.17 -0.22 -0.49* -0.28 -0.36 Swei -0.24 -0.30 -0.02 -0.34 -0.32 -0.06 -0.12 -0.20 0.10 Swii -0.38 -0.47* -0.34 -0.36 -0.43 -0.30 -0.36 -0.44 -0.30
UKi -
0.77*** -
0.73*** -0.43* -0.74***
-0.71*** -0.40* -
0.78*** -
0.72*** -0.41*
Constant 2.63*** 1.92*** 1.48*** 2.60*** 2.19*** 1.65*** 2.91*** 2.44*** 1.94*** R2 0.10 0.20 0.24 0.10 0.21 0.25 0.10 0.20 0.24 F-Value 2.84*** 4.07*** 4.26*** 3.08*** 4.14*** 4.54*** 2.77*** 4.05*** 4.27*** Note: * (**, ***) means that the appropriate parameter is different from zero or – regarding the F-test – that all explanatory variables together have an effect at the 10% (5%, 1%) signifi-cance level, respectively.
40
Table 7: OLS parameter estimates in the final cross-sectional regressions, dependent vari-able: average monthly stock returns between 2003 and 2006, explanatory variables: exclu-sively financial variables (estimated beta parameters from the time-series regressions of the several asset pricing models in the first stage), N = 175 for the USA and N = 281 for Europe
USA Explana-tory vari-ables
(1) (2) (3)
est(βiCAPM) 0.34** -- --
est(βi1FF) -- 0.40*** --
est(βi2FF) -- 0.77*** --
est(βi3FF) -- 0.20* --
est(βi1CAR) -- -- 0.43***
est(βi2CAR) -- -- 0.76***
est(βi3CAR) -- -- 0.20*
est(βi4CAR) -- -- 0.07
Constant 0.95*** 0.81*** 0.79*** R2 0.05 0.27 0.27 F-value 4.65** 28.47*** 21.08***
Europe Explana-tory vari-ables
(1) (2) (3)
est(βiCAPM) 0.15 -- --
est(βi1FF) -- 0.20 --
est(βi2FF) -- 0.63*** --
est(βi3FF) -- 0.33** --
est(βi1CAR) -- -- 0.65**
est(βi2CAR) -- -- 0.65***
est(βi3CAR) -- -- 0.39***
est(βi4CAR) -- -- 1.09**
Constant 2.19*** 1.78*** 1.42*** R2 0.00 0.14 0.21 F-value 0.98 10.03*** 9.33*** Note: * (**, ***) means that the appropriate parameter is different from zero or – regarding the F-test – that all explanatory variables together have an effect at the 10% (5%, 1%) signifi-cance level, respectively.